M A R C H 2 0 1 3
Risk-Based Transportation Asset ManagementManaging Risks to Networks Corridors and Critical Structures
RepoRT 4 managing risks to critical assets
-
Notice
this document is disseminated under the sponsorship of the Us Department of transportation in the interest of information exchange the Us government assumes no liability for the use of the information contained in this document
the Us government does not endorse products or manufactur ers trademarks or manufacturersrsquo names appear in this report only because they are considered essential to the objective of the document
Quality Assurance Statement
the Federal Highway administration (FHWa) provides high-quality information to serve government industry and the public in a manner that promotes public understanding standards and policies are used to ensure and maximize the quality objectivity utility and integrity of its information FHWa periodically reviews quality issues and adjusts its programs and processes to ensure continuous quality improvement
Note fRoM tHe DiReCtoR
the Federal Highway administration (FHWa) continuously seeks innovative ways to improve the management of the nationrsquos highway infrastructure the office of asset manageshyment offers this series of reports on risk management as another means by which transportation agencies can better understand and manage their highway assets
the use of risk management among Us transportation agencies largely is limited to managing risk at the project level generally focused during construction risk manageshyment at the project level helps to identify threats and opporshytunities to projectsrsquo cost scope and schedule However we at the FHWa along with our partners at state and local transshyportation agencies recognize the growing need for a better understanding of risk management at program and organizational levels
today the leading international transportation banking and insurance organizations have explored the benefits of risk management at the program and enterprise level and use it as a tool to protect their investments Based on those pracshytices the office of asset management is offering this series of reports on how risk management can be scaled up to asset management programs and to the entire enterprise of a transportation agency
itrsquos important for highway agency officials to consider incorporating risk management in the decision-making process for several reasons First they have seen the benefits of risk management at the project level second they have heard from their international colleagues that risk manageshyment can pay dividends when used at the broader program and enterprise level particularly when agencies donrsquot have enough funding to address their priorities third managing risk is an integral step in following a comprehensive asset
ii Risk-Based Transportation Asset Management
management framework as described in the AASHTO Asset Management GuidemdashA Focus on Implementation Finally the Us congress has proposed that states develop ldquorisk-based transportation asset management plansrdquo these factors convinced the office of asset management to offer this series of reports
We believe you will find these reports helpful as you develop your asset management program and make investment decisions this series of reports will help the transportation agencies to meet the increasingly complex challenges involved in making decisions and communicating them effectively to the public
sincerely
Butch Wlaschin Director of the office of asset management
Risk-Based Transportation Asset Management iii
contents Introduction 1
Risk and Its Management 1
Risk Management A Common Idea A New Application 2
risk management tradeoffs transparency to Preserve critical networks 3
the Disproportionate importance of key corridors networks and Facilities 11
the economic risks to corridors and networks 14
The Steps for Risk Management of Networks and Corridors 16
establishing the context 16
identification of risks 16
analysis and evaluation of risks 18
treatment of risks 21
examples of Risk Management of Corridors 22
risk management in michigan Dot 22
risk management in Florida Dot 29
risk management in Washington Dot 36
Conclusions 42
1 Risk-Based Transportation Asset Management
introduction transportation asset management (tam) enters a new risk-based era with the enactment of the moving ahead for Progress in the 21st century act also known as maP-21 the legislation requires a risk-and-performance based asset management plan for bridges and pavements on the nationshyal Highway system (nHs) maP-21 also requires development of a national freight network that consists of critical corridors facilities and connectors
as transportation agencies develop their asset management plans it is likely that they will stratify their risks based upon the importance of the key networks corridors and facilities this report the fourth in a series of five reports on risk management examines how agencies may apply risk-based asset management practices to key networks corridors and facilities particularly ones moving freight the first three reports covered an overview of risk management multi-level management of risks and achievement of policy objectives through risk management
risk and its management as these earlier reports have defined risk is the positive or negative effect of uncertainty or variability upon agency objectives this internationally recognized definition broadshyens the consideration of risks to be more than only threats the implication of this broader definition is that risk manshyagement can be applied not only to threats but also to opportunities created by uncertainty variability or change as they relate to the achievement of all organizational objectives risks to the achievement of agency goals reaching performance targets meeting public expectations satisfying customers or achieving acceptable condition and performance on key highway networks corridors or individual assets could also be managed
2 3 Risk-Based Transportation Asset Management
Building from this broad definition of risk these reports use the definition of risk management as the cultures processes and structures that are directed towards the effective management of potential opportunities and threats interim Federal Highway administration (FHWa) guidance notes that transportation agencies should consider managing risk as part of the strategic and systematic process of operating maintaining and improving physical assets and managing their highway network with a focus on the program and agency level FHWa also encourages states to continue addressing risk at the project level
risk management a common idea a new application the formal terminology of a risk-based approach to managshying assets on networks and corridors may be new to some Us transportation agency officials However many aspects of its practice will be familiar Highway agencies have long practiced functional classification that is the classifying or stratifying of highway routes by their importance to key transportation objectives such as connecting major populashytion centers moving freight serving as evacuation routes serving key ports or linking economic generators routes of lesser criticality have lower classifications lower design standards and often receive less investment
Functional classification is a form of risk management Failures on major routes create greater risk of failure to key organizational or public objectives such as providing connectivity ensuring safe transportation moving freight or providing access to key facilities during emergencies the greater volumes on major networks such as the nHs create greater opportunities to improve travel times reduce freight costs or improve economic competitiveness Highway agencies have for decades understood and developed their
Risk-Based Transportation Asset Management
transportation programs around a hierarchical classification of key routes they just have not called it a risk-based approach to managing networks or the corridors within them
the requirements of maP-21 and risk-based asset manageshyment provide a new opportunity for Dots to explain their decisions and demonstrate to the public and policy makers that they are responsible stewards of scarce resources a risk-based approach to managing corridors and networks can allow Dots to make the case for the difficult tradeoffs so many are forced to accept because of insufficient revenue to maintain the entire system adequately When resources are limited it provides them an opportunity to convey to policy makers and to the public the logic and reasoning behind the need to accept lower levels of service on lesser used roads in return for preserving performance and minimizing risks to more important ones such strateshygies typically represent a well thought-out and methodical approach to decision-making they demonstrate the strateshygic best use of limited resources to preserve condition and performance on key routes as opposed to spreading limited funds equally across the network and accepting a statewide drop in highway condition and performance
Risk Management Tradeoffs Transparency to preserve Critical Networks
a few examples below illustrate existing practices of risk management trade-offs and the transparency in the use of these practices where an agency is able to communicate with and obtain buy-in from policy makers and the public on how it is making key decisions in the prioritization and use of public resources for the management of its assets
North Carolina DoT A Tiered Approach to Managing Risks actions by the north carolina Dot are an example of a risk-based approach to managing networks and the assets
4 5 Risk-Based Transportation Asset Management
within them the Dot is responsible for over 79000 miles of roads that include most of the public road system in the state including most local roads the Dot works closely with local officials and for many years put special emphasis upon local needs However the Dot realized that sustaining a high level of condition on local roads was coming at the expense of the more heavily travelled nHs
the demand for resources from all segments of the road network necessitated a risk-based approach to decision-making that could assist the agency in making tradeoffs While developing the statewide long-range multimodal transportation Plan the agency categorized the highway network in three tiers shown in Figure 1 are the statewide (interstatenHs) regional (nclower importance Us) and sub-regional (secondary and municipal routes) based on their function and level of importance to different constitushyencies at the state regional and sub-regional level
Just based on the vehicle miles traveled (Vmt) the failures of the higher functional classes create a greater impact on a
Figure 1 NCDOTrsquos risk-based approach to categorizing its highway network (soUrce ncDot)
Statewide Tier
Regional Tier
Subregional Tier
Increasing State
Interest
Increasing Local
Interest
Risk-Based Transportation Asset Management
larger section of the user community this categorization allows the agency to gauge the relative risk of asset degrashydation or failure upon its population and economy By communicating this categorization the agency is able to explain to the public and the stakeholders that it is acting responsibly when it gives higher priority to the higher classification roads and ensures that they are maintained so as to have a lower risk of failure it demonstrates that the agency is keeping public safety economic growth and other public concerns at the forefront of its decision-making Having the three tiers makes it easier for the agenshycy to communicate the impact of risks to the state region or sub-region to policy makers and the public this provides the appropriate perspective and helps the agency gain the needed support when it has to make difficult investment trade-offs
the north carolina Dot has set higher targets for bridges on the high-volume interstates when compared to the Primary or secondary systems table 1 shows that with limited resources achieving targets for the higher volume systems such as the interstates means accepting lower performance on the lower volume systems Using a risk management approach to making tradeoffs the agency can demonstrate responsible decision making to its stakeholders
Utah DoT Risk Management and Trade-offs an example from the Utah Dot illustrates a similar decision-making and trade-off process Figure 2 (see page 6) shows the number of miles of pavement in overall ldquogoodrdquo condishytion reducing while those with ldquoPoorrdquo and ldquoFairrdquo condition increasing over the years this trend caused by insufficient pavement budgets forced the Utah Dot to take a risk-based approach to setting higher condition targets for its major networks at the conscious expense of its lower functional classes
6 Risk-Based Transportation Asset Management Risk-Based Transportation Asset Management 7
INTERSTATE PRIMARY SECONDARY Bridge Components
Measure 2010 Target
State Average
Score
2010 Targets
State Average
Score
2010 Target
State Average
Score Decks (Concrete)
gt= 6 85 85 80 79 75 84
Superstructure (Concrete)
gt= 6 90 81 85 60 80 65
Superstructure (Steel)
gt= 6 90 89 85 82 80 81
Superstructure (Timber)
gt= 6 90 NA 85 43 80 69
Substructure (Timber)
gt= 6 90 NA 85 40 80 42
Substructure (Concrete Pile)
gt= 6 90 80 85 75 80 81
Substructure (Steel Pile)
gt= 6 90 91 85 84 80 81
Substructure (Concrete Piers)
gt= 6 90 91 85 81 80 81
NBIS Culverts gt= 6 85 86 85 86 85 89 Non-NBIS Culverts
Good 80 84 80 74 80 56
Overhead Sign Structures
Good 95 95 95 93 95 88
Table 1 NCDOT sets higher targets and sustains higher conditions on the higher functional classes (soUrce ncDot)
Figure 3 (see page 8) shows the impact of budgets (illustrated by the green bars) not increasing from 2013 to 2030 the chart also shows that ensuring the overall condition index (oci) of the nHs in Utah does not drop below 75 by 2030 will mean letting the non-nHs pavement conditions drop to below 50
the red trend line in Figure 3 represents pavement conditions on the interstate Highway system and the light blue line the conditions on the nHs through 2030 Using risk-based investments the Utah Dot is sustaining pavement conditions
Figure 2 P
avement C
ond
ition trend
in Utah (s
oU
rc
e U
taH
Do
t)
Pavemen
t Co
nd
ition
s Cen
ter Lane M
iles of G
oo
d Fair an
d Po
or
8 9 Risk-Based Transportation Asset Management
Projected Budget Versus Overall Condition Index
Figure 3 Projected budgets and Overall Condition Index of pavements in Utah (soUrce UtaH Dot)
on its higher functional classification networks However it is clearly articulating to the public and policy makers that the tradeoff to sustaining those routes with the projected funds means accepting lower conditions on the non-nHs ones the condition of the non-nHs routes shown in the purple trend line show substantial declines from 2015 through 2030 if pavement budgets remain static as predictshyed by the green bars
Minnesota DoT Risk-Based pavement Investment Strategy with public Input the minnesota Dot used an explicit risk-based analysis paired with public comment to identify a risk-based paveshyment investment strategy as seen in Figure 4 the rising red line shows that the miles of pavement in poor condition would rise significantly from 2010 to 2034 based upon current investment levels although the departmentrsquos target
Risk-Based Transportation Asset Management
was to have no more than 2 percent of its pavements in poor condition its pavement forecasts predicted that the percentage of poor condition pavements would rise to more than 40 percent by 2034 based upon its currently available investment it realized that it could not afford to achieve its targets and it engaged the public in a risk-based analysis Based on focus groups and public comment the Dot determined that the public would accept up to 10 percent of the lane miles in poor condition the department then identified a risk tolerance of having between 5 percent and 10 percent of its pavements in poor condition as illustrated by the green band then based upon higher investment levels it is now forecasting the actual poor pavement condishytions to fluctuate between 5 and 10 percent of its inventory through 2034 this analysis showed that the department was initially too conservative in attempting to maintain no more than 2 percent of its pavements in poor condition
Current Investment Level
Perc
enta
ge
of
mile
s in
po
or
con
dit
ion
50
45
40
35
30
25
20
15
10
5
0
Figure 4 Minnesota DOTrsquos use of risk-based tradeoffs to set a ldquorisk appetiterdquo acceptable to the public (soUrce minnesota Dot)
Publicrsquos risk tolerance of up to 10 for poor pavements
Risk Based Investment Level (Rate of Recovery Approach)
Flat Investment Level (Specific Performance Target)
2010 2012 2014 2016 2018 2020 2022 2024 2026 2028 2030 2032 2034
10 11 Risk-Based Transportation Asset Management
effective communication with the public indicated their willingness to accept a lower standard allowing the departshyment to set a lower target yet meet public expectation the exercise illustrated that the ldquorisk appetiterdquo for the public was for up to 10 percent of the pavements to be in poor condishytion this also allowed the agency to give the necessary focus and priority to the critical segments of corridors and higher classification roads while meeting the public expectation and tolerance for risk
VicRoads The ldquoImpaired Asset Listrdquo a Tool for Risk Management this type of risk-based asset investment decision is taken to another level in the australian state of Victoria Vicroads the statersquos highway agency has been emphasizing risk management for more than a decade the Vicroads report titled ldquostitch in time-Five years of successful maintenance in Victoriardquo notes that ldquoRoad users expect better conditions on busy roadsrdquo Vicroadsrsquo risk-based budgeting process invests more in more heavily travelled and economically important routes and accepts lower conditions on the lesser ones it is unable to keep all roads in sound condition and must accept a certain percentage of the low-volume pavements to fall below acceptable levels once a pavement deteriorates and still cannot be repaired because of budget constraints the roadway is formally added to an impaired asset list this listing allows it to be signed as an impaired road the speed limit is reduced and the drivers are informed of its impaired condition this formal designation not only notifies state budget authorities that the department has made a risk-based decision to post the pavement as impaired it also protects the department from legal liability should crashes occur due to poor pavement conditions although agency officials prefer not to post roads as being impaired the ability to do so allows them to re-direct scarce funds to higher-volume and more economically critical routes
Risk-Based Transportation Asset Management
these examples illustrate that a risk-based approach is already being practiced by several state transportation agencies nationwide Hence formalizing the approach consisshytent with maP-21 requirements does not involve embarking on an entirely new compliance program rather it involves formalizing the existing practices into a holistic approach for the state in doing so it becomes important to examine how the transportation assets or groupings of assets within a state can be prioritized to meet national and state agency objectives in an optimal manner
The Disproportionate Importance of Key Corridors Networks and Facilities
a primary objective of transportation agencies in the United states has long been to provide the infrastructure assets and operational support necessary to efficiently and safely move people and goods across the nation by providing the conshynectivity necessary for economic growth while protecting the environment for future generations
a risk-based asset management approach to moving people and goods focuses on evaluating the networks corridors and facilities that create the greatest threats to and opportunities for achieving goals of mobility and safety it also considers risks to the achievement of an agencyrsquos freight or economic-development objectives
some systems corridors and facilities illustrate the disproporshytionate economic importance of a few key high-risk assets Because of their high use any failure of assets or degradation of service along these networks or the unavailability of network segments for any length of time can cause major impacts to the safety and movement of people and goods
to illustrate the national Highway system comprises 4 percent of the public road miles but carries about
12 13 Risk-Based Transportation Asset Management
Definitions __________________________
Across countries and industries the terms used to define risk vary The following descriptions define the terms used to refer to the various kinds of risk in this report
enterprise risk ______________________
This report uses the term enterprise risk to refer to all levels of risk being managed by a state department of transportation
Agency risk __________________________
This report refers to agency risk as the highest level of risk within an organization that affects a DOTrsquos ability to accomplish its mission and achieve its strategic goals and objectives
progrAm risk ________________________
Program risks are ones that could affect the achievement of program objectives Programs generally are defined as collections of related projects or on-going efforts to ensure achieveshyment of specific organizational objectives
project risk _________________________
Project risks are those that effect the successful accomplishment of project objectives
75 percent of the nationrsquos truck freight (Figure 5) the interstate Highway system which is a subset of the nHs comprises 15 percent of all public roads but carries 47 percent of all combination trucks and 22 percent of all single-unit trucks the i-95 corridor serves 10 percent of the nationrsquos landmass but 37 percent of its population the marquette interchange in milwaukee handles an estimated 30 percent by value of all of Wisconsinrsquos truck freight the
Risk-Based Transportation Asset Management
top 10 container ports handle 78 percent of the nationrsquos container volume out of 86 container ports nationally two sister ports los angeles and long Beach handle 33 pershycent of all national container imports and exports[i] any loss of serviceability or issues within these key assets creates disproportionate economic impacts thus making them high-risk facilities effective access to and from these ports are critical to the movement of goods and have major impact on the Us economy
Besides assigning priority to assets on high priority highshyways transportation agencies often also consider other highly significant non-nHs routes that carry lower volumes of traffic segments of these routes may be critical to national security or to the regional and sub-regional needs of the state some serve the unique needs of connecting economic hubs and regions in the state that are important
Figure 5 Annual Average Daily Truck Traffic on the NHS (soUrce Us Dot FHWa oFFice oF FreigHt management anD oPerations FreigHt analysis FrameWork Version 31 2010)
NHS Highways Below Capacity Approaching Capacity Exceeding Capacity
Figure 6 Projected Peak Congestion on the National Highway System in 2020
14 15 Risk-Based Transportation Asset Management
local economic generators others serve as important evacuation routes provide connectivity to defense facilities provide non-redundant access routes to locations and serve the safety needs such as being the only bridge providing connectivity out of a community or section of the state an example of one may be the famous Highway 1 and its bridgshyes and causeways connecting the Florida keys with the mainland on a smaller scale the mauckport Bridge conshynecting mauckport indiana with Brandenburg kentucky is the only ohio river crossing in a 60-mile long section of the river any risk to that structure creates serious consequencshyes to those rural communitiesrsquo access and economy
The economic Risks to Corridors and Networks
approximately 126 billion tons of freight move across the nationrsquos roadways every year[ii] With cheaper goods comshypeting for market share minimizing the delivered cost of goods has become more important resulting in a lack of appetite to stock inventories and a move towards adoption of ldquoJust in timerdquo practices Delays are therefore costly according to FHWa the 2110 freight bottlenecks on highshyways throughout the United states cause more than 243 million hours of delay to truckers annually a conservative estimate puts the annual costs to truckers at $65 billion per year[iii] also with the continuously increasing cost of fuel the public has less appetite to be stuck in traffic for long periods the FHWa ldquoFreight storyrdquo (UsDot FHWa 2008)[iv]
notes that Just-in-time inventory is hampered by congesshytion and the resulting reduction in reliability and increase in travel times these delays have an impact on the Us econoshymy thus reliable available and well-functioning roadway networks are important to the efficient movement of freight a factor critical to keeping cost of products low
the ldquoFreight storyrdquo estimates that even with growth in air-freight maritime and rail services about 29 percent
Risk-Based Transportation Asset Management
of the urban nHs will be congested with an additional 13 percent approaching congestion during peak periods in 2020 By comparison 10 percent of the urban nHs was congested in 1998 By functional class urban interstates are and will continue to be the most traveled segments with congestion reaching 53 percent in 2020[v] these projections of the peak congestion on the nHs are shown in Figure 6
it is evident that even within the important nHs certain urban segments will continue to see higher congestion over the next decade and will become ever more critical to the nationrsquos economy Hence loss of asset availability and degrashydation of services on the nationrsquos highway network clearly presents a risk to safety mobility convenience and commerce all of which are important national goals
key transportation corridors networks and critical facilities will therefore constitute a logical priority as a transportation agency assesses where within the network of assets it manages the impacts to the economy safety and key national or regional priorities are most likely to be felt
16 17 Risk-Based Transportation Asset Management
the steps for risk management of networks and corridors
establishing the Context the first step in risk management is to establish the context for the organization and the objectives it seeks to achieve the risks to be prioritized are those most likely to create uncertainty regarding achievement of the organizationrsquos objectives
the international organization for standardization (iso) and other bodies provide the general framework for risk management as illustrated in Figure 7 For transportation asset management the national goals in maP-21 combined with state goals and targets provide the context surroundshying the management of transportation assets identified in the first step
ensuring sound asset conditions allow a network corridor or facility to achieve its intended objective that may include public safety movement of people and freight national security moving goods state or local connectivity or for achieving environmental or social objectives irrespective of the reason establishing the context helps the prioritization that will be necessary in the risk management process
Identification of Risks
the second step in the process will involve identifying and prioritizing the major assets and the risks to them some of the major assets will be readily identifiable such as the components of the interstate Highway system However others such as the most at-risk assets on nHs intermodal connectors may be less apparent as part of the corridor planning effort an inventory of key assets will be necessary
Risk-Based Transportation Asset Management
establish Context
Identify Risks
Analyze Risks
evaluate Risks
Treat Risks
Com
mun
icat
ion
and
Con
sult
atio
n
Mon
itor
ing
and
Rev
iew
Figure 7 ISOrsquos risk management framework
once those assets are inventoried the possible risks to them can be identified these risks could be possible threats such as increasing traffic loadings or climatic seismic or geologic threats they could also include organizational risks (such as weak internal management systems) or financial risks (such as increasing costs decreasing revenues and resulting budget constraints)
risk identification could be based on the probability of asset failure or degradation of performance and the resulting impact to the objectives or goals of the specific network or corridor the expected impact and the agencyrsquos risk tolerance can be factored into determining the type and immediacy of the treatment
18 19 Risk-Based Transportation Asset Management
Analysis and evaluation of Risks analysis of risks involves identifying the possible likelihood of a risk or event occurring the condition and performance of the high priority assets in the network or corridor in conjunction with the responses can be useful in evaluating the severity of the risk the following is a sample of some of the questions that may be used in the analysis
are there fracture-critical non-redundant structures
Do the road segments have bridges that are prone to scour or hydrological events
are the road segments subject to seismic events
are there slopes or retaining wall failures possible in geologically unstable areas
are the traffic control devices and intelligent transportation systems subject to regular preventive maintenance to ensure functionality
is there regular maintenance and inspection of tunnels their lighting ventilation and emergency notification systems
is the facility subject to flooding storm surges and severe winter storm events
Risks Due to Gradual Failure risks to assets may be caused by gradual failures or gradual degradation of asset performance these can be caused by a lack of sound preservation practices inadequate asset inventories a lack of management systems or weak asset management policies to ensure sound long-term performance for the lowest possible lifecycle costs examples of such risk include
Risk-Based Transportation Asset Management
loss of pavement friction caused by aggregate polishshying flushing rutting and resulting ponding of water
loss of lane delineation through degradation of lane markings
loss of functionality of key safety devices such as guardrail crash attenuators and cable barrier through deterioration such as guardrail post rotting block deterioration rust or crashes
Potholes and pavement rutting and cracking
Degradation of shoulders leading to drop offs and roadway department crashes
loss of reflectivity or visibility of regulatory and advisory signs
Failure of drainage systems to remove water from roadway surfaces
Weakening of parapets from rust or concrete spalling
structures can pose a risk of lost structural integrity if key components such as expansion joints bearings rockers and drainage devices are allowed to fail which accelerates bridge degradation
mechanically stabilized earth walls degrade if drainage erodes the internal structural fill
Failure to seal bridge decks risks loss of deck integrity
Poorly maintained components such as wing walls and riprap can risk the performance of a structure during storm events
20 21 Risk-Based Transportation Asset Management
Risks of Increased economic Cost risks to a network or corridor can also be considered from a perspective of sustaining it in fully functioning and good condition at the lowest possible life-cycle cost to preserve its long-term value a sound pavement that is properly mainshytained has more value for society than a structurally poor pavement a risk management perspective is to apply proacshytive preservation and maintenance strategies to sustain the performance and condition of the assets for the longest period economically possible
the rhode island Department of transportation struggled for more than a decade to reduce its high number of bridge deficiencies it has replaced several high-value structures and has recently adopted its first bridge preservation program for its interstate Highway system bridges While it would like to have a statewide preservation program it has taken a risk-based approach to applying limited preservation funds to ensure the long-term value and performance of its most critical structures those on its interstate highways
prioritization of environmental Considerations a network or corridorrsquos assets can be prioritized by their criticality to the successful functioning of the corridor or by additional social objectives important to the state For instance risks could be assessed by their likelihood of violating social or environmental requirements examples include
adverse noise or localized air quality impacts on minority and low-income populations in violation of environmental justice objectives
Failure of retention and detention ponds that create excessive runoff that erode streams and water ways
Risk-Based Transportation Asset Management
Failure of water quality best management practice devices that lead to increased ldquofirst flushrdquo of roadway pollutants into water ways
Failure to maintain hydrology in created wetlands that violate environmental document or water-quality permit standards
Drainage practices that violate water-quality or habitat requirements
Failure to manage salt storage or garage facilities that lead to excess salt runoff or the improper runoff of controlled materials from maintenance facilities
in the advanced risk management practices of the highway agencies in Victoria Queensland and new south Wales australia the risk of violating environmental requirements is viewed as a significant agency risk that is carefully monishytored likewise for Us highway agencies whose facilities impact sensitive resources or populations the identification of environmental or social risks can serve to highlight the agencyrsquos sensitivity to sound stewardship
Treatment of Risks
the final step in the risk-management process is the identifishycation of how to treat the identified risks the ldquofive tsrdquo of treat tolerate terminate transfer or take advantage of provide the menu of choices for each risk
the comprehensive evaluation of all risks allows the holistic mitigation of risks to the network or corridor rather than the mitigation of risks to individual assets or groups of assets within them While trade-offs may be made at the functional class level as described earlier agencies may also decide to make trade-offs between assets within a corridor so as to focus first on those assets that are most critical this approach will facilitate a holistic approach to mitigation
Source TAMC 2010 PASER Data Collection
22 23 Risk-Based Transportation Asset Management
examples of risk management of corridors agencies may choose to further prioritize networks by putting additional weight to certain especially important corridors within the networks as they prioritize their routes that serve critical industries or supply chains ones that are particularly important for emergency evacuations or which carry disproportionately large volumes they may choose to place additional weight upon certain network links or corridors
Published data illustrating holistic risk management of corridors is limited However in addition to the examples illustrated previously several more examples of risk manageshyment of corridors are available and have been included here these examples illustrate how agencies have implemented formal plans that address several of the strategies discussed in this report
Risk Management in Michigan DoT
Loss of Asset ValuemdashA Risk Analysis a very important example of using asset inventories and management systems to help analyze and prevent risks to the transportation system can be seen in the analysis and reports provided by the michigan transportation asset management council (tamc) a legislated council with representatives from agencies responsible for managing or funding roads the tamc coordinates the collection analysis and reporting of data on asset condishytions and investments to legislature and the state transportation commission
Figure 8 shows the tamc analysis of the 2010 Pavement condition on the Federal aid system it indicates that a third
2010 Pavement Condition (Federal Aid)
FAIR
47
GOOD
18
POOR
35
Figure 8 Pavement Condition on Federal Aid System (soUrce tamc 2010 Paser Data collection)
Risk-Based Transportation Asset Management
(over 20810 lane miles) of the system is in poor condition Figure 9 shows the trend of ldquopoorrdquo pavement conditions increasing over the years the tamc report[vi] discussed this trend of increase in poor pavements as having a significant economic and financial impact the report also urges action to ensure that this trend be reversed as returning poor roads to good condition costs four to five times more than mainshytaining a road in fair condition
Discussing the lane miles in poor condition the report notes that the dramatic decline is resulting in need for structural improvements From 2004 to 2010 the percent of lanes needing structural improvements has doubled to 348 pershycent the tamc discussing the transportation funding crisis notes that the michiganrsquos transportation Fundrsquos (mtF) total gross revenue levels have declined as shown in Figure 10 Because of a reduction of $200 million in reduced gas tax revenues dedicated to roads and bridges over the last seven years without additional funding the system conditions will continue to decline additionally without state match federal gas tax collected in michigan would be lost to other states
michigan Dot and the tamc are using the asset data condition and analysis information to present the case of the
Source TAMC 2004ndash2010 PASER Data Collection
Cost of Returning All Lane Miles to Good Condition
0
1000
2000
3000
4000
5000
6000
7000
8000
9000 2010
2009
2008
2007
2006
2005
2004
CO
ST (
in m
illi
on
s)
Y E A R
Figure 11 Cost of Returning All Lane Miles to Good Condition (soUrce mDot)
2004ndash2010 Pavement Condition (Federal-Aid Eligible Roads) 70
2010
2009
2008
2007
2006
2005
2004
2010
2009
2008
2007
2006
2005
2004
2010
2009
2008
2007
2006
2005
2004
GOOD FAIR POOR
Figure 9 Pavement Condition Trends (soUrce mDot)
60
50
40
30
20
10
0
O
F LA
NE
MIL
ES
24 Risk-Based Transportation Asset Management Risk-Based Transportation Asset Management 25
impending financial and economic risk that needs to be averted the analysis in Figure 11 shows the cost of deteriorashytion almost doubling from 2004 to 2010 and highlights the risk of loss in value of the road assets without immediate injection of funds to address system needs in presenting this analysis the tamc is emphasizing the impact of deteriorashytion and the need for funds and good asset management practices to help prevent the risk of such loss in value
2001ndash2011 MTF Total Gross Revenue
2100
2050
2000
1950
1900
2011
2010
2009
2008
2007
2006
2005
2004
2003
2002
2001
REV
ENU
E (in
mill
ions
)
YEAR
Figure 10 MTF-Total Gross Revenue Level (soUrce mDot)
1700
1750
1800
1850
Risk Management of I-94 Corridor over the last several years michigan Dot has been dealing with the insufficiency of funds to address degradation of aging transportation infrastructure assets the agency continuously analyzes the degree and impact of risks to assets as it makes trade-off decisions such trade-offs mean minimizing the risks to the more heavily traveled and highest priority roads one such example can be seen in the risk management of the heavily traveled i-94 corridor
26 27 Risk-Based Transportation Asset Management
in september 2010 to manage the risk of safety and reliability in travel through the i-94 corridor and to promote economic vitality of the region michigan Dot established the i-94 corridor operations partnership the partnership also had the objective of coordinating activities to provide a high quality transportation system and travel experience as part of this effort the agency is investing approximately $51 million in Wayne and macomb counties to do resurfacshying repairs and other extensive improvements to bridges overpasses pavements ramps and other roadway assets such as lighting in addition the agency is also implementshying several operational strategies
Figure 12 Michigan DOTrsquos I-94 Corridor improvement projects (soUrce mDot)
Risk-Based Transportation Asset Management
the mDot goals for this corridor include
1 to improve work zone standards implementation and coordination so that customersrsquo experiences traveling through the corridor are consistent and reliable
2 improve work zone operations and manage delays so that customersrsquo needs for reliable and realistic travel times are achieved
3 improve customer communicationmdashinformation to the motorists and feedback from them to ensure the motoring public has quality and timely information to guide their travel decisions and to ensure that mDot is accurately and consistently meeting or exceeding customersrsquo needs and expectations
managing risks to multiple assets and operations to ensure the safety and reliability of the corridor requires extensive planning it also requires coordination among multiple state and local agencies all project work on the corridor is closely coordinated and monitored to ensure safety and reliability of travel on the corridor travel delays are closely tracked and treatments are implemented to keep delays below the established corridor Delay threshold other examples of risk management of the corridor include
Detailed procedures for lane closures
Providing minimum travel width (11 feet minimum) during construction on the corridor
Providing additional flexible or other delineators when paved shoulders (2-feet minimum) cannot be obtained
the agency also has strategies for maintenance of traffic on the corridor Work zone operations incident management and messaging in the corridor are managed actively
shy
shy
28 29 Risk-Based Transportation Asset Management
enhanced mile markers are installed throughout the corridor to improve incident identification and emergency response By identifying the potential asset and operational risks the agency has been able to successfully implement strategies to minimize delays and improve the safety and reliability of travel on the corridor these strategies involve establishing allowable limits for travel time delays (ttD) through the i-94 corridor within the state and then monitoring the ttDs over segments of the corridor by ensuring that the predicted delays (in a worst case scenario) are kept below the allowshyable limits the ttDs are kept within allowable limits through a combination of revising (i) specific project implementation schedules and (ii) traffic maintenance strategies
Figure 13 shows the three segments of the i-94 corridor (each segment containing several projects) the allowable ttDs for each segment and the predicted ttDs for each segshyment it is seen that while the predicted ttDs are well below the allowable limits for the first segment the values in the
Figure 13 Predicted and allowable TTDs for various segments of the Michigan I-94 Corridor (soUrce mDot)
Risk-Based Transportation Asset Management
second and third segments exceed the allowable limits for either peak or off-peak periods necessitating an implemenshytation of one or a combination of the strategies listed previously to keep the ttDs within allowable limits
this is one example of how the Dot applied risk-based manshyagement strategies to invest and manage the performance and condition of an important corridor segments on i-94
Risk Management in Florida DoT
Risk Management of the Strategically Important I-95 Corridor in Florida the i-95 corridor is considered a critical transporshytation facility providing for the movement of people and goods along the east coast of Florida[vii] Half of the 32 Fortune 1000 companies in Florida are located along the i-95 corridor Hence managing the risks to this corridor is a high priority for the Dot the i-95 corridor is part of the strategic intermodal system that serves facilities including major airports intermodal freight-rail terminals passenger terminals seaports and a spaceport
the Florida House Bill 1021 required that the Dot in consulshytation with several other agencies within whose jurisdictionshyal areas the i-95 corridor lies work to ldquocomplete a study of transportation alternatives for the travel corridor parallel to Interstate 95 which takes into account the transportation emergency management homeland security and economshyic development needs of the staterdquo the study was to identify ldquocost-effective measures that may be implemented to alleviate congestion on interstate-95 facilitate emergenshycy and security responses and foster economic developshymentrdquo also the Florida administrative code requires the twelve i-95 corridor counties to develop a comprehensive emergency management Plan that implements a framework to deal with emergencies and disasters
30 31 Risk-Based Transportation Asset Management
the i-95 corridor is heavily used so the impact of asset failures or other risks can be significant law enforcement officers perform traffic enforcement along the entire corridor monitoring speed and movement of trucks and other vehicles to minimize crashes and incidents
risk management for the Dot includes being prepared to address hazardous materials incidents and manage large volumes of traffic during emergencies it requires that during emergencies in the event that the i-95 corridor is damaged or impassable alternate routes are available and usable this means managing the performance and condishytion of these alternate routes throughout the year the 2010 i-95 study of alternatives also illustrated that alternative transportation routes and modal choices need to be considshyered by 2035 to accommodate the growing demand it states that ldquoI-95 even at build-out will not be operating at acceptable levelsrdquo and ldquoparallel facilities may be facing a similar outlookrdquo
as part of this process Florida Dot is implementing many capacity improvements lane management developing or augmenting alternate routes and managing the current capacity innovatively multiple studies have been completed and additional studies of various segments of the i-95 are currently in process
one of the strategies being used by the Dot involves innovative lower cost options such as converting two existshying HoV lanes to two express lanes this will extend the 95 express from golden glades interchanges in miami-Dade county to Broward Boulevard in Broward county Variable priced tolling that adjusts to congestion levels and encourshyages carpooling and travel during non-peak hours is used on 95-express the construction will cost approximately $106 million and will include reconstruction of pavements work on inside and outside shoulders work at the ives Dairy
Risk-Based Transportation Asset Management
interchange widening bridges installing noise walls at specific locations and various its work
Various alternatives for approximately 135 miles of i-95 between state road 816 (oakland Park Boulevard) in Broward county and state road 808 (glades road) in Palm Beach county are currently being studied
the i-95 project along the treasure coast shown in Figure 14 includes over $160 million dollars of projects that involved adding lanes in each direction adding noise walls widening bridges milling and resurfacing existing pavements upgradshying multiple interchanges reconstructing ramps upgrading signals minor widening and adding new lights throughout the corridor segment
the Florida Dot example illustrates the strategic approach taken by the Dot to identify evaluate and develop plans to manage current and future risks to the i-95 corridor this has resulted in the understanding that long-term risk management
Figure 14 The I-95 Treasure Coast highway in Florida (soUrce google)
32 33 Risk-Based Transportation Asset Management
will have to consider not just increasing the capacity of i-95 where possible and those of parallel facilities but also ensuring that alternative routes and other modal choices become readily available
Managing Risks Due to Hurricanes risk management of corridors and other heavily used roads in Florida include both operational and non-operational strategies several risk mitigation strategies relating to roadway assets were used by the Florida Dot in 2004 when in a span of seven weeks the state was hit by four hurrishycanes the agency later studied its response to the events and refined the risk mitigation strategies used to minimize the impact of such events in the future
the risk mitigation included ensuring that the transportation assets are in good condition and do not fail during a natural event it also included planning for mobilizing other assets and implementing operational strategies to minimize safety risks to the public these strategies included suspending tolling and facilitating the exit and entry of traffic on toll roads deploying portable message signs to clearly mark detour routes having emergency contracts for repair and cleanup deploying generators to every major intersection redesigning the traffic signal control cabinets at intersections for generator connection use of stop control where generashytor power is not available use of light emitting diode signal heads and revising the wind speed criteria for critical signs and miscellaneous structures
Management Systems Aiding proactive Risk Management of High priority Assets Proactive management of risks to assets is one of the highest priorities in FDot the Florida Dot uses an in-house manshyagement system called ldquoFloridarsquos analysis system for tarshygetsrdquo to track pavement conditions the Dot uses over 35 years of historical pavement condition data to predict future
Risk-Based Transportation Asset Management
pavement performance at a system level Using available data the agency analyzed and studied the impact and relationship of several variables including truck volume average daily traffic geographic location asphalt thickness and surface type to performance Using the analysis the agency determined the variables that had the greatest correlation to pavement performance and used it to develop reliable pavement deterioration models statistical analysis revealed that the geographic district where the roadway was located along with the surface type (open vs dense) were the most reliable factors in predicting future pavement performance there are separate graphs for open and dense graded pavements the statewide performance is simply an aggregation of these graphs By knowing the performance characteristics of each district FDot can apply an expected performance curve to each individual roadway
Figure 15 (see next page) shows the pavement deterioration curves by district for cracks on dense graded surfaces similar deteriorations curves are generated for open-grade surfaces as well for other factors such as smoothness and rutting the predicted risk to the pavements based on the analysis enables the Dot to make financial decisions and to accurately allocate funds based on expected future needs For example if District 1 is projected to have 10 of the statewide deficiencies in 2016 it will be allocated 10 of the total statewide resurfacing monies for that year the agency process takes three years to get from the point where a project is initially identified as a resurfacing candidate until it is let for construction the process is detailed and all resurshyfacing greater than frac12 mile in length goes through design and construction the reason for this is that the agency views the resurfacing projects as the opportunity to systematically upgrade its corridors the resurfacing projects involve not only making improvements to the roadway surface they also upgrade the roadway geometry operational characteristics signing signals drainage and safety
2012 2013 2014 2015 2016 2017 2018 2019 2020 2021 2022 2023 2024 2025 2026 2027 2028 2029 2030 2031 2032 2033 2034 2035 60
65
70
75
80
85
90
95
100
2012 2013 2014 2015 2016 2017 2018 2019 2020 2021 2022 2023 2024 2025 2026 2027 2028 2029 2030 2031 2032 2033 2034 2035
Scenario 1 (Currentmdash475 2013 55 2014 53 2015 55 thru 2018)
Scenario 2 wadjustment (475 2013 4 2014-2015 Critical First 4 2016-2018)
Statute
Figure 16 Forecasted Scenarios of Pavement Performance (soUrce FDot)
Plot of Predicted Crack Rating versus Age by District
Figure 15 Predicted Crack Rating by District for Dense Graded Surfaces (soUrce FDot)
34 35 Risk-Based Transportation Asset Management
in general the agency uses resurfacing rehabilitation and reconstruction (3r) projects to upgrade the entire corridor these upgrades are not intended to meet new construction criteria or to give a community all of the bells and whistles the upgrades included are typically necessary to maintain what the agency considers to be the minimum level of safety and function once a 3r project has touched a particular segment of roadway there is a very good chance that FDot will not make significant improvements to that roadway again until the next 3r project comes along the driving factor in when to perform one of these projects is the condition of the pavement
the agency has invested heavily in asset management and in collecting and managing its pavement condition data the analysis of the historical data enables the agency to make funding decisions about pavement preservation activities
Risk-Based Transportation Asset Management
five years into the future Because of the amount of engishyneering work that goes into a typical resurfacing project the projects are actually identified and selected three years in advance and have a longer planning cycle than may be common in other Dots
Figure 16 shows how predicted future pavement perforshymance is used to make funding decisions the green line shows the Dots statutory requirementmdashto keep a minimum of 80 of the statersquos pavements meeting the Departmentrsquos minimum standards in may of 2012 over 90 of the statersquos pavements met FDotrsquos minimum standards the current policy (in may 2012) shown in blue was to resurface 55 of the statersquos highways annually that policy was predicted to result in performance that would exceed 93 by 2020 and remain at a level below 95 through 2035 the analysis indicated to the upper management that the Dot was over-preserving the system and the effort on resurfacing be
Strategy
3
Grind
2
Grind andor
DBR and Selective Reconst
Wait 100
Strategy Priority
Co
nd
itio
n In
dex
es Cannot do grind
or DBR after this point
MUST do reconstruction after this point
for Total Reconst
Years
1
2
3
1Total Reconst (index lt 25)
0
Figure-18 Risks of Catastrophic Failure for Concrete Pavements (soUrce WsDot)
36 37 Risk-Based Transportation Asset Management
lowered a bit this resulted in a decision to resurface 40 of the system annually through 2018 with a return to 55 in 2019 (revised policy shown in red) the agency is currently pursuing this revised policy that is projected to bring the system performance back below 85 by 2023 agency leadership reviews the risks to the performance and condishytion of the system regularly and re-evaluates strategies to make strategic decisions
Risk Management in Washington DoT
Risk ManagementmdashA Routine Tool for efficient and effective Action Washington Dot (WsDot) is another Dot that is actively implementing risk-based asset management practices With limited resources at their disposal agency personnel are focused on managing their risks ldquoefficiently and effectivelyrdquo Figure 17 shows the agencyrsquos tracking of the gas tax purshychasing power declining over time as one of the lead Dots implementing risk-based asset management WsDot has
Figure 17 Gas Tax purchasing power declines over time (soUrce WsDot)
Risk-Based Transportation Asset Management
been educating agency personnel its policy makers and the public for many years on how decisions relating to one program or subprogram can affect those in other programs With limited resources investing more in one program would mean a reduction in others this situation inherently requires the Dot to prioritize and manage risks across all programs effectively With aging infrastructure natural disasters and the need for economic growth vying for limited resources risk-based decisions have become routine for the Dot
Decision Making to Minimize Risk of Catastrophic Failures to effectively manage its infrastructure assets with the limited funds available WsDot tracks and forecasts potenshytial risks to assets Based on the classification age condishytions performance and projected risk to assets the agency develops and implements various strategies Figure 18 shows an example of the projected risk of catastrophic failure over
Risk of Catastrophic Failure
Very Low Low Med High
38 39 Risk-Based Transportation Asset Management
the years for concrete pavements and the strategies that the agency deploys for the different levels of risks the agency has also strategically used crack sealing and lower cost preservation options such as chip sealing on lower classificashytion roads without compromising on asset performance
Managing Risks to High priority Corridors an example of the WsDotrsquos approach to managing risks to high priority corridors can be seen in the creation of ldquolifeline seismic routesrdquo WsDot has programs that cost effectively address seismic risks and risks relating to scours concrete deck and other major repairs to address seismic risks WsDot in collaboration with other state and federal agenshycies is tracking ldquoPeak ground acceleration contoursrdquo associshyated with earthquakes With limited available funds and the resultant inability to address all seismic risks at one time WsDot has created a lifeline set of routes that will provide emergency response in the highest ground motion accelerashytion zone (see Figure 19) Bridges on routes have been
Figure-19 Lifeline Seismic Routes (soUrce WsDot)
Risk-Based Transportation Asset Management
categorized based on average Daily traffic WsDot has detailed plans that consider route recovery time based on whether the bridge carried state route traffic or carried traffic over the state route the plan gives higher priority to bridges that carry state route traffic as against those that carry traffic over the state route according to the WsDotrsquos seismic Prioritization Plan 2013-2015 ldquoWsDotrsquos disaster response plan includes provisions for receiving emergency suppliespersonnel at Joint Base Lewis-McChord Air Force Base near Tacoma Seattle International Airport andor Paine Air Field in Everett and transporting them throughout the region via the Lifeline Route on Interstate-5 and Interstate 405 WsDot further divided the interstate routes into segshyments between major junction points in order to determine the cost to retrofit each segment and identify the most cost effective path between mcchord air Force Base and Paine Field Thus retrofitting Interstate-5 amp Interstate 405 bridges between McChord Air Force Base and Paine Air Field is a top priority for the bridge seismic retrofit programrdquo
Risk of Financial Loss and economic Impact Due to Natural Disasters Washington Dot also understands the financial risks and economic impacts that the loss or unavailability of infrashystructure assets can have on the business in the state the state of Washington has historically been experiencing other natural disasters such as floods and avalanches these have led to closures of the i-5 and i-90 corridors within the state and caused moderate to severe impacts to businesses in the region as can be observed in Figures 20 and 21 (see next page)
to minimize future impacts from similar occurrences the agency has established detailed risk management and mitishygation strategies that are implemented during events after such closures occur the Dot studies the effectiveness of the strategies implemented with the intent to improve and refine
How severely were companies impacted Of the businesses impacted by the I-5 closure 65 percent stated that the impacts were severe to moderate while 45 percent of businesses impacted by the I-90 closures made the same statement
170
284
351
195 247
399
278
76
0
20
40
60
80
100
I-90 Winter Storm Closure (Jan 29 ndash Feb 2 2008)
I-5 Winter Storm Closure (Dec 3 ndash Dec 6 2007)
Severe Negative Moderate Negative Minor Negative No Negative Impact Impact Impact Impact
Source WSUWSDOT Economic Impact Survey of I-5 and I-90 Winter Storm Closures 2008
Figure 21 Severity of business impacts from 2007-2008 winter storm closures on 1-5 and I-90 (soUrce WsDot)
What were the business impacts Direct Indirect Induced and Total Impacts on Economic Output Due to the I-5 and I-90 Winter Storm Closures
$2487
$1475 $1223
$724 $998
$590
$4707
$2789
$0
$5
$10
$15
$20
$25
$30
$35
$40
$45
$50
I-5 Closure Dec 3 ndash 6 2007 I-90 Closure Jan 29 ndash Feb 2 2008
$Mill
ions
Direct Economic Impacts Indirect Impacts Induced Impacts Total Economic Impacts
Figure 20 Business impacts from 1-5 and I-90 winter storm closures in the 2007-2008 season (soUrce WsDot)
40 41 Risk-Based Transportation Asset Management
them one such study was done after the closure of intershystate 5 south of the Ports of seattle and tacoma near cheshyhalis Washington in December 2007 due to flooding several feet of water overtopped the interstate for five days and resulted in the stoppage of all passenger and freight moveshyment the flooding was caused by a series of significant weather systems that also closed all east-West corridors through the cascade mountains including the i-90 corridor in December 2007 due to heavy snowfall and avalanches
the agency developed a detailed detour plan that is impleshymented in the event that i-5 has to be closed because of rain snow or other reasons to address the closure of the eastern side of the state on i-90 in the vicinity of the snoqualmie Pass the Dot identified a vision for additional lanes to be added segments of the roadway to be moved away from the steep avalanche slopes and lengthening the area for vehicles to chain up
Risk-Based Transportation Asset Management
additional risk management strategies identified as a result of this study included the need to provide safe parking to truck drivers stranded due to storms and other natural events these drivers are mandatorily required to rest for 10 hours after 11 hours of driving this strategy ensures that when stranded drivers are unable to find parking they do not park along shoulders and freeway ramps causing safety risks
WsDot is working with multiple agencies to develop a long-term vision for the i-90 corridor along a 15-mile stretch between Hyak and easton the environmental impact statement that resulted from this effort outlines improveshyments needed to meet projected traffic demands improve
42 43 Risk-Based Transportation Asset Management
public safety and meet identified project needs for this stretch of the i-90 corridor
WsDot anticipates that when all improvements are completshyed travelers will experience a safer and more efficient six-lane freeway closures resulting from avalanches and rock slides will be minimized and a new pavement designed to last 50 years will provide a smoother ride Further by installshying new bridges and culverts WsDot will reconnect wildlife habitat on both sides thereby protecting both wildlife and the traveling public
While applying performance management to all its assets and operations WsDot uses risk-based management apshyproaches to identify the network locations that are below the performance goals established by the legislature considershying the risks the agency then uses lower cost preservation and maintenance strategies to improve or maintain the performance of existing assets while still addressing congesshytion and economic development issues for which all lower cost alternatives have been exhausted
the Dot has a holistic corridor risk management plan that address critical asset condition and performance needs these also address capacity and operational strategies that present risks to corridors risk management has become a routine activity for WsDot
conclusions the national experience demonstrates that the risk-based asset management of transportation corridors can be a valuable tool for transportation agencies nationwide it provides transportation agencies a mechanism to positively impact the safety condition and performance of a larger number of assets and the traveling public in a strategic and holistic manner while enabling the optimal utilization of
Risk-Based Transportation Asset Management
increasingly limited resources several conclusions can be drawn from this experience these include
networks corridors or segments of corridors primarily involve prioritized functional classes of assets such as the national Highway system or heavily used roads that serve a majority of the traveling public nationwide they also involve other critical transportation assets such as evacuation routes non-redundant access routes connectivity to defense facilities or other important assets critical to national security or connecshytions between economic hubs within a region risk management of such a grouping of assets allows transportation agencies a means to facilitate the improvement of safety condition and service level of a larger number of assets in a manner that maximizes the positive impact to users
risk management of networks and corridors provides an opportunity to implement the strategic best use of resources thus maximizing the outcome from limited resources in tough economic times in the current diffishycult global economic climate governments and Dots are reeling under the burden of ageing infrastructure and ballooning operational service level requirements these necessitate increasing amounts of investments to meet the safety needs and expectations of the traveling public and various stakeholders including businesses at the same time agencies are being challenged by declining tax revenues this imbalance has forced governments and agencies to find creative solutions to optimize the use of resources risk management at the corridor level expands the logic to apply to a larger and more critical grouping of assets and thus provides one means to receive ldquothe biggest bang for the buckrdquo
When optimizing with limited resources transportation agencies will need to make trade-offs making tradeshy
44 45 Risk-Based Transportation Asset Management
offs can result in having to accept lower performance levels on lesser-used assets However transportation agencies are keen to ensure this does not mean a universal reduction in performance standards to unacshyceptable levels instead it can represent a risk-based shifting of priorities whereby the lesser used assets still maintain an acceptable though lower level of service while the condition and performance of major networks and corridors are preserved
a formalized process for the risk management of assets at the corridor level allows transportation agenshycies to communicate to the public policy makers and other stakeholders that the strategies being impleshymented by them represent a well-thought out and methodical approach to decision-making and demonshystrate that they are responsible stewards of the regionrsquos transportation assets
Risk-Based Transportation Asset Management
e N D N o T e S
iUs army corps of engineers Us Waterborne container traffic by PortWaterway in 2007
iiFHWa Freight Facts and Figures tables 2-1 and 2-1m Weight of shipments by transportation mode 2007 2010 and 2040 accessed at httpwwwopsfhwadotgovfreightfreight_analyshysisnat_freight_statsdocs11factsfigurestable2_1htm nov 12 2012
iiiFHWa Freight operations and management the Freight story 2008 accessed at httpopsfhwadotgovfreightfreight_analyshysisfreight_storycostshtm
ivthe Freight story FHWa accessed httpopsfhwadotgov freightfreight_analysisfreight_storydemandshtm
vhttpopsfhwadotgovfreightpublicationsfhwaop03004 congesthtm
vitransportation asset management council ldquomichigan roads and Bridges 2010 annual reportrdquo
viii-95 transportation alternatives study dated June 2010
46 Risk-Based Transportation Asset Management
Additional information is available from the following
Nastaran Saadatmand asset management Program manager office of asset management Federal Highway administration 1200 new Jersey avenue se Washington Dc 20590 (202) 366-1337 nastaransaadatmanddotgov
or
Stephen Gaj leader system management amp monitoring team office of asset management Federal Highway administration 1200 new Jersey avenue se Washington Dc 20590 (202) 366-1336 stephengajdotgov
Prepared by shobna Varma starisis corporation
in association with gordon Proctor gordon Proctor amp associates inc
office of asset management Federal Highway administration 1200 new Jersey avenue se Washington Dc 20590
FHWA-HIF-13-017
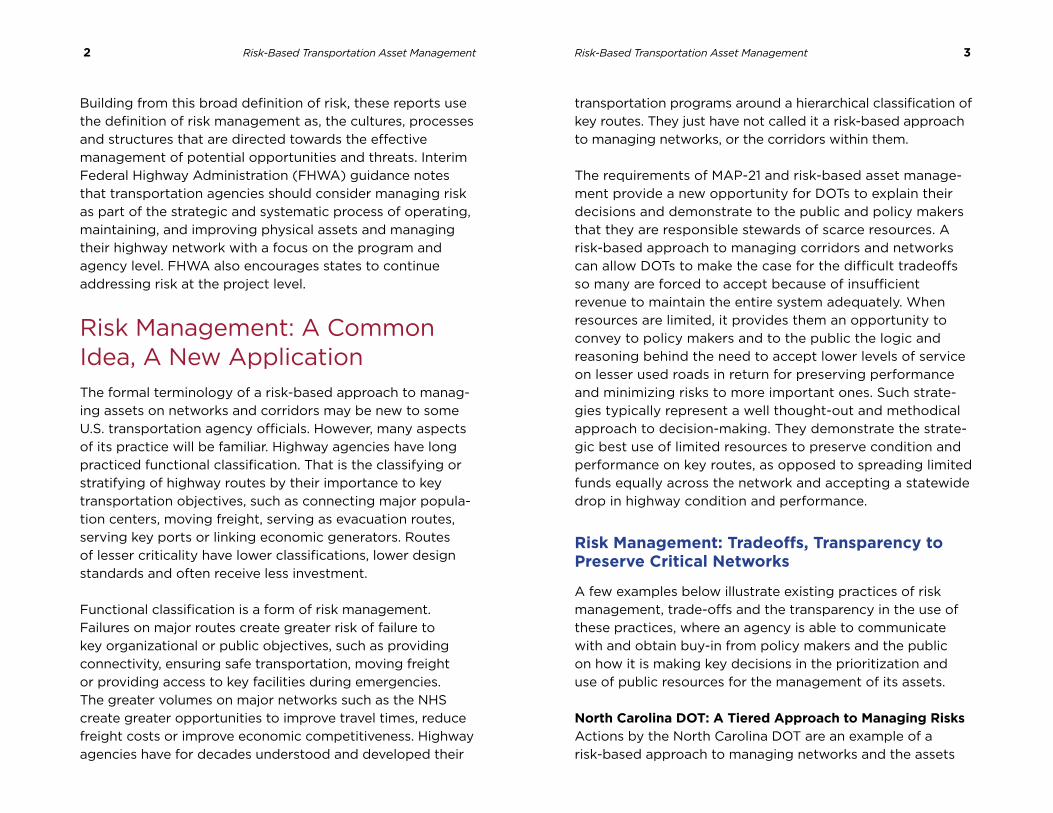
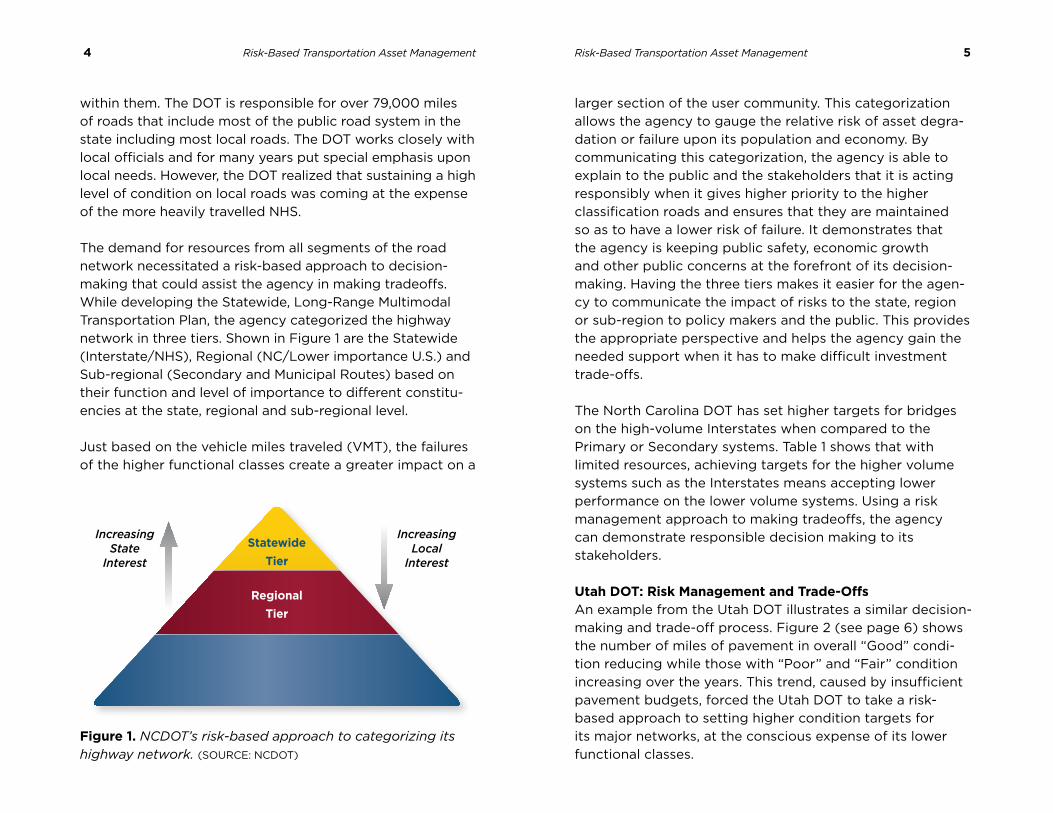
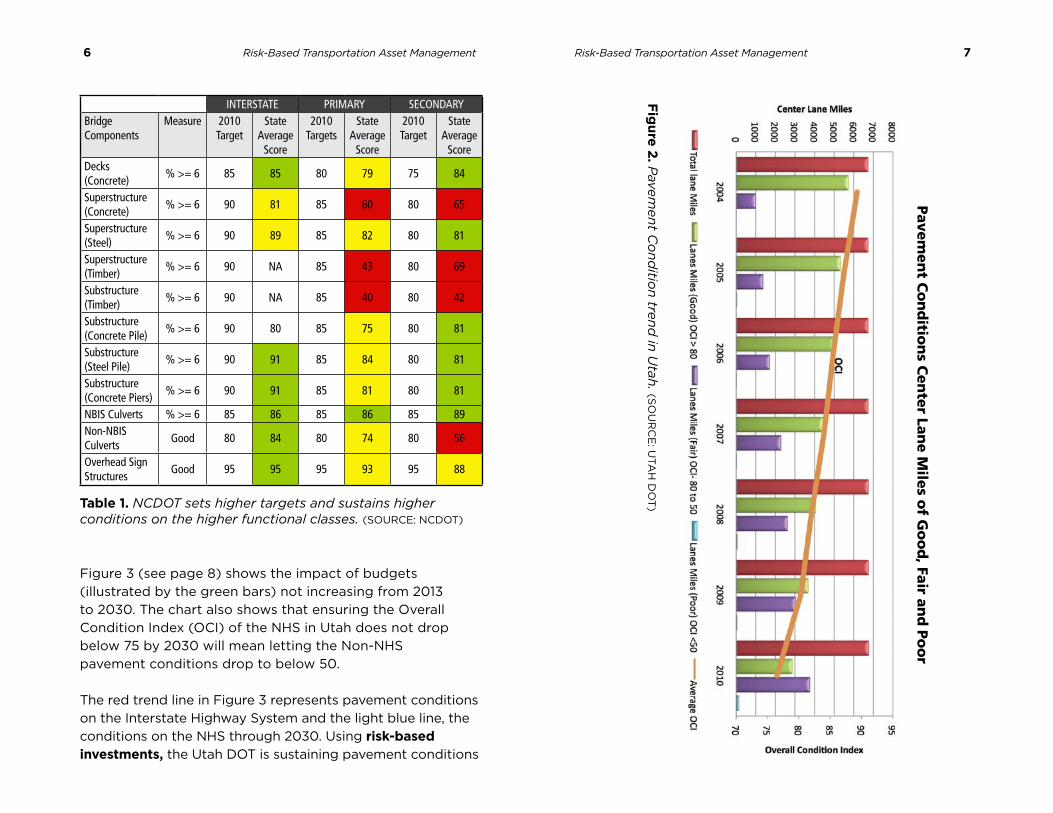
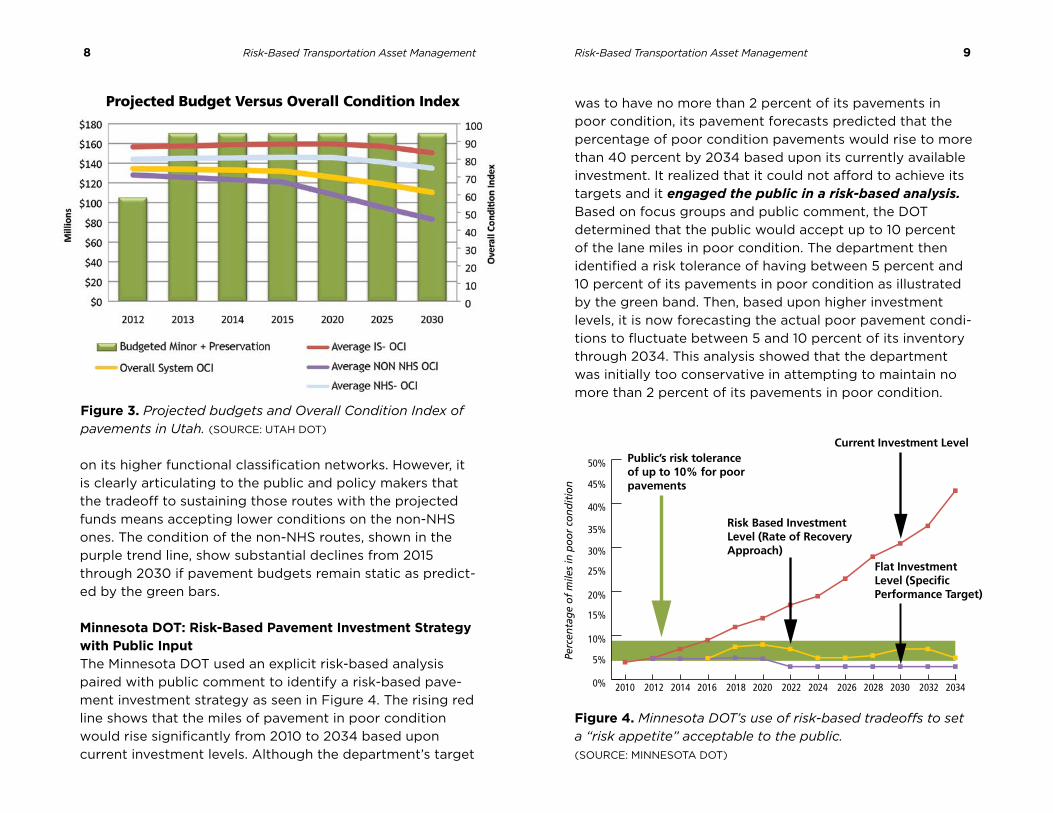
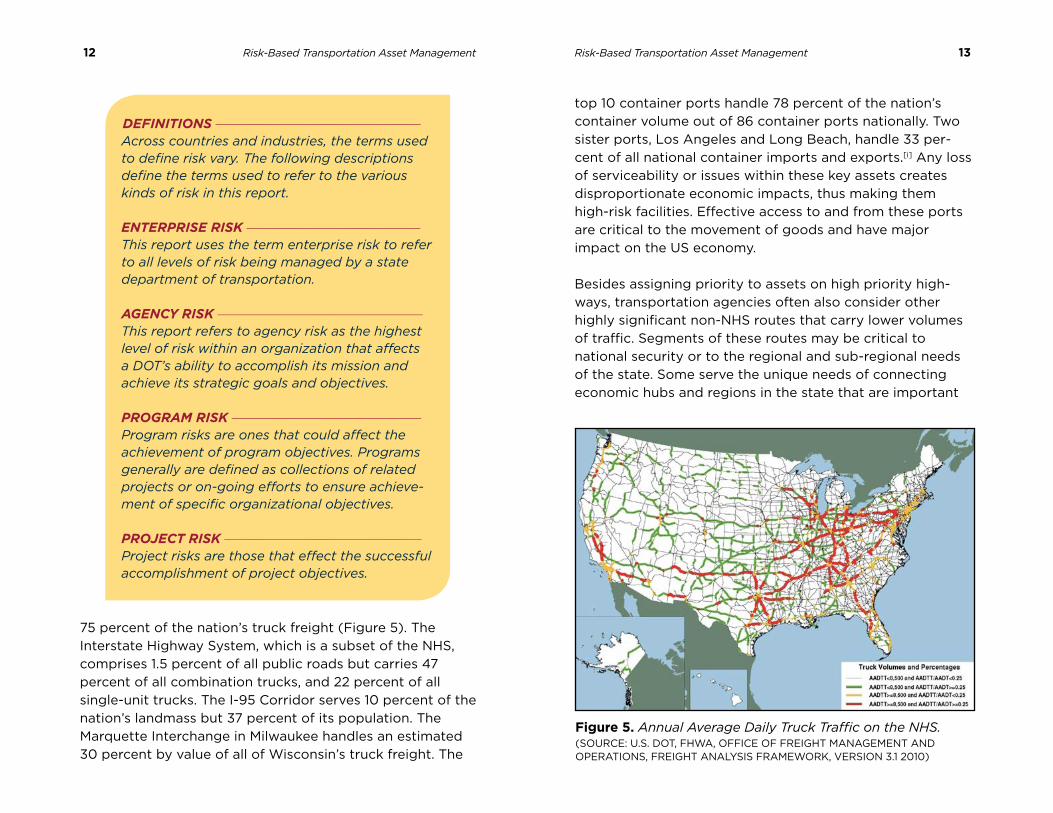
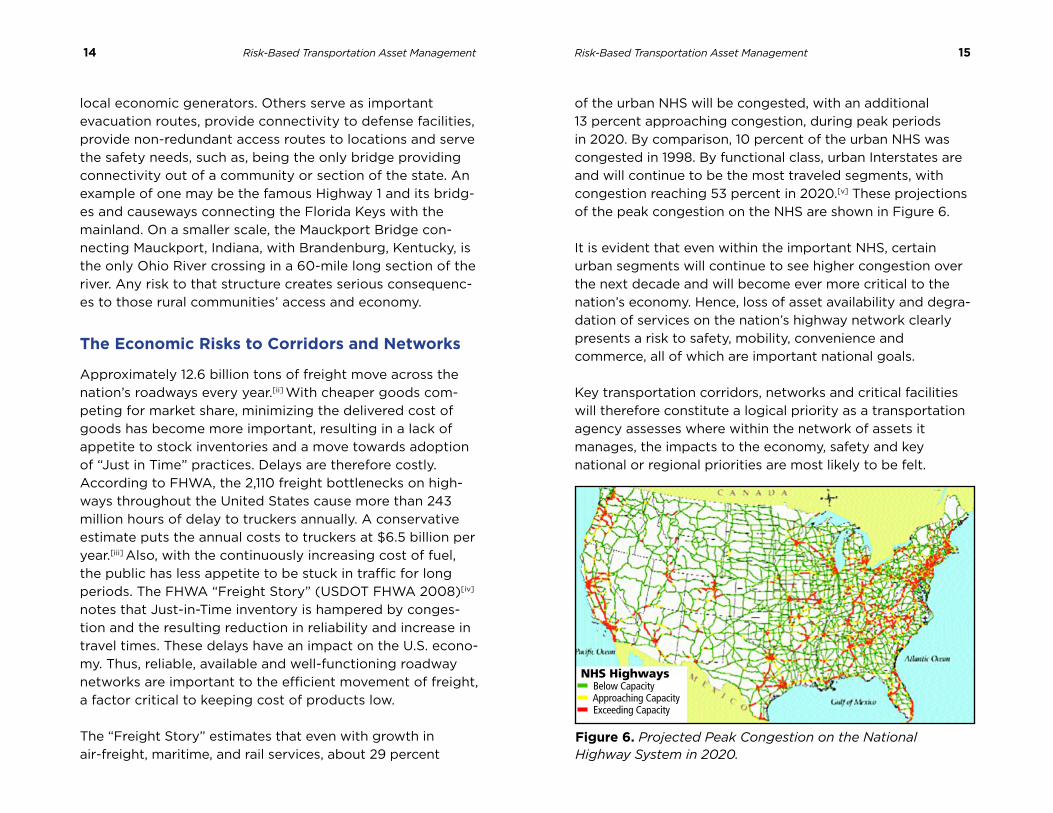
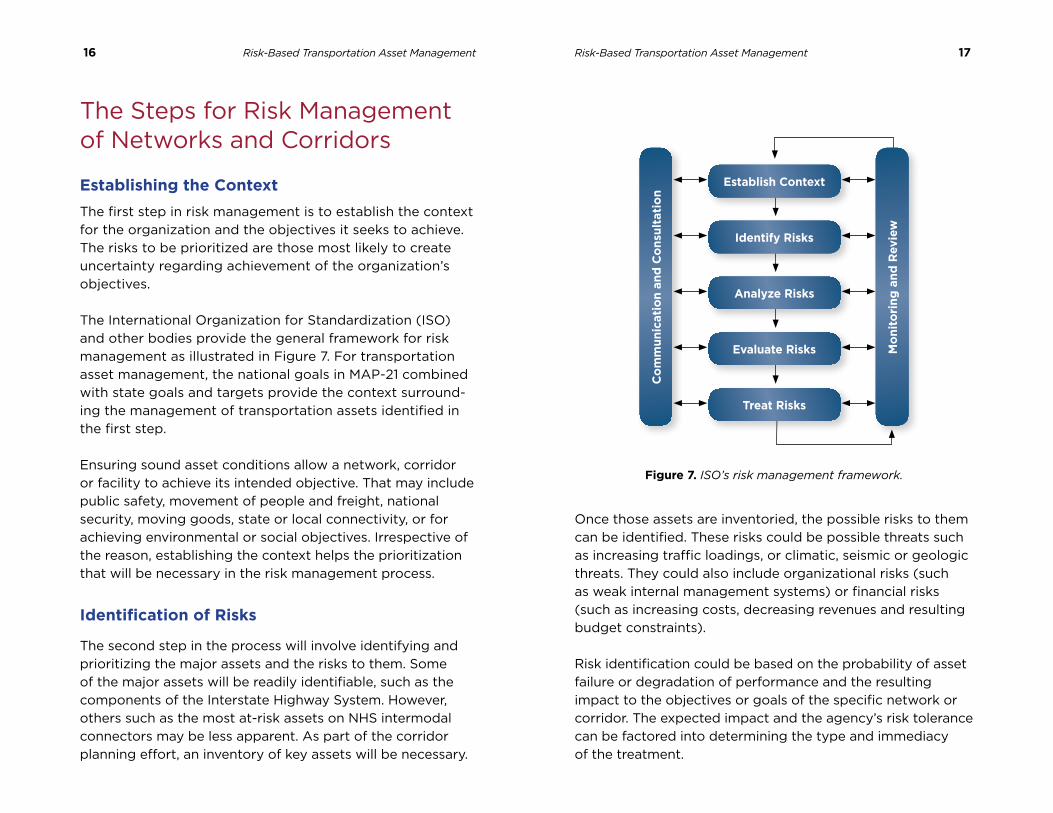
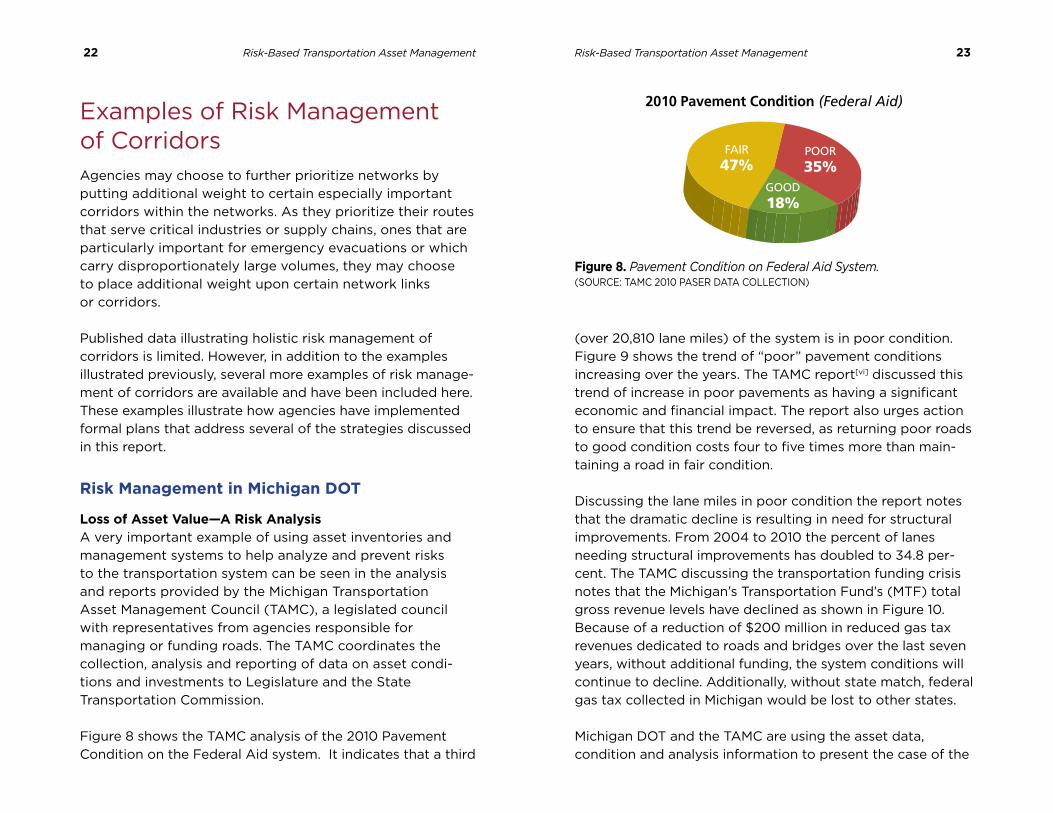
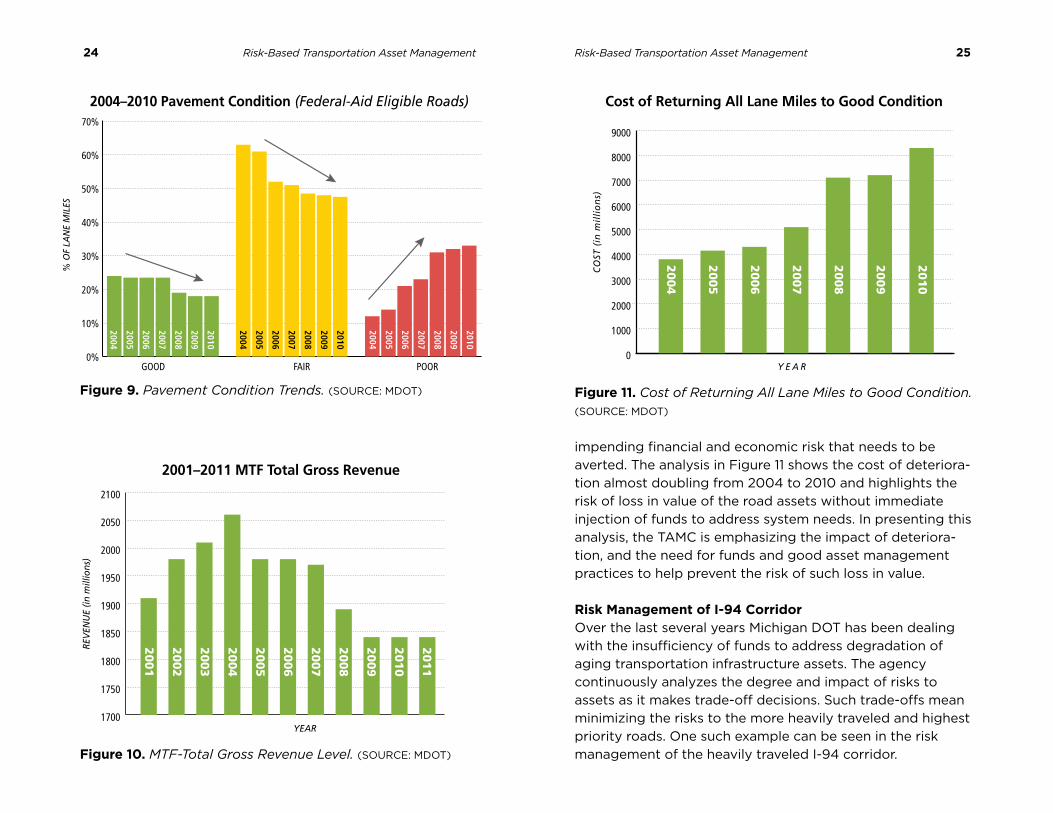
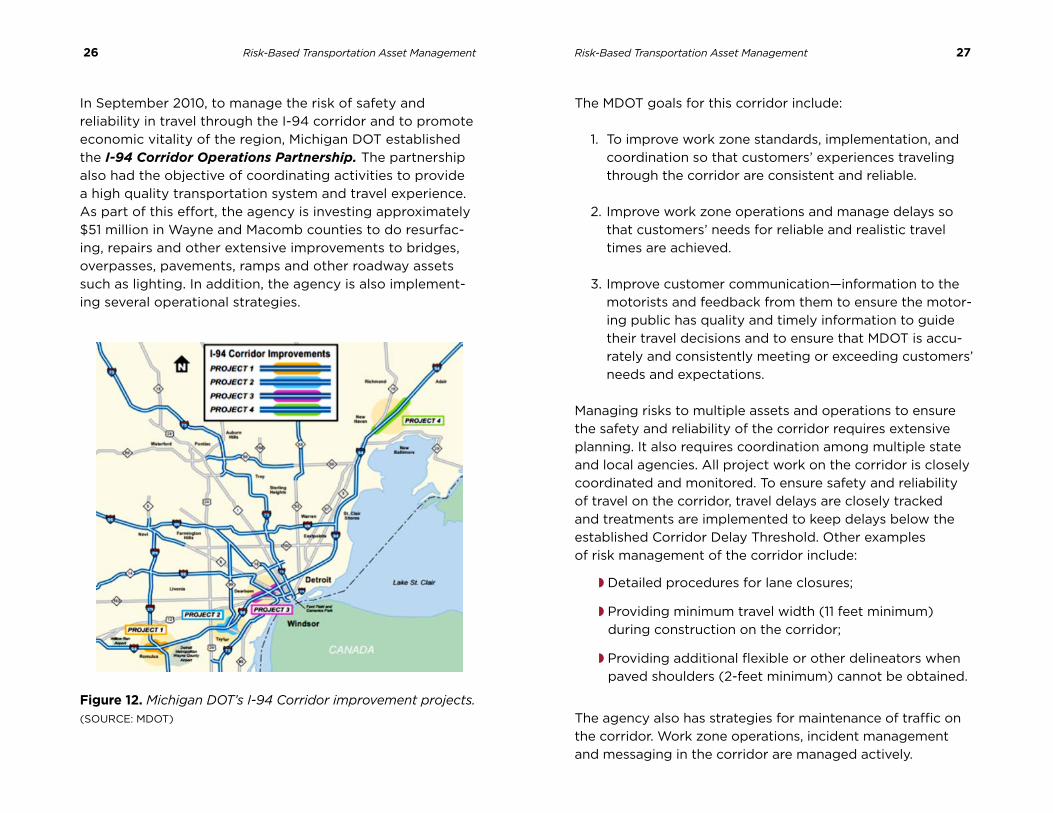
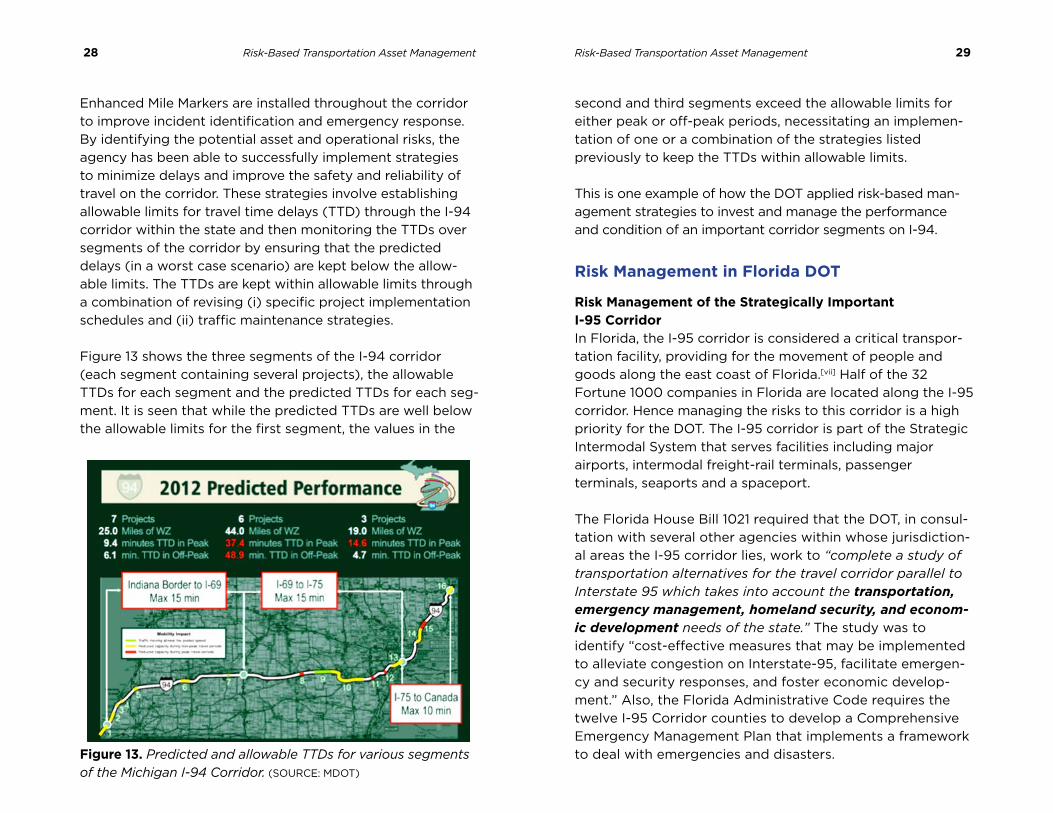
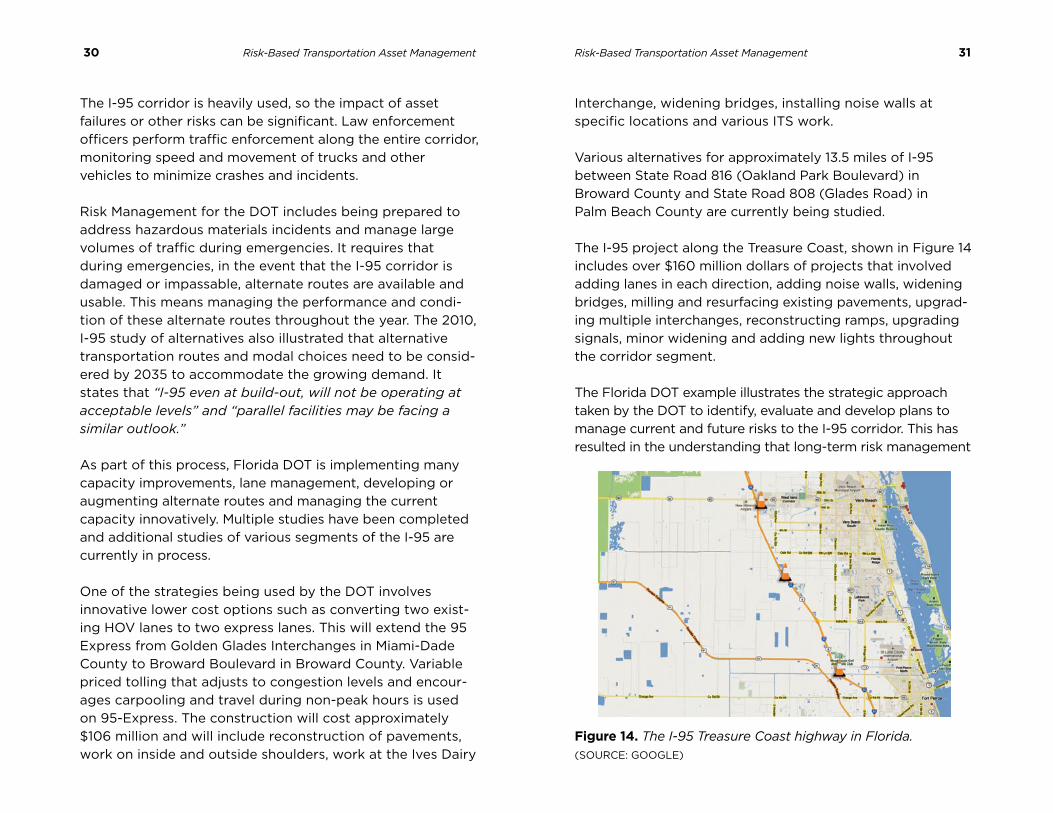
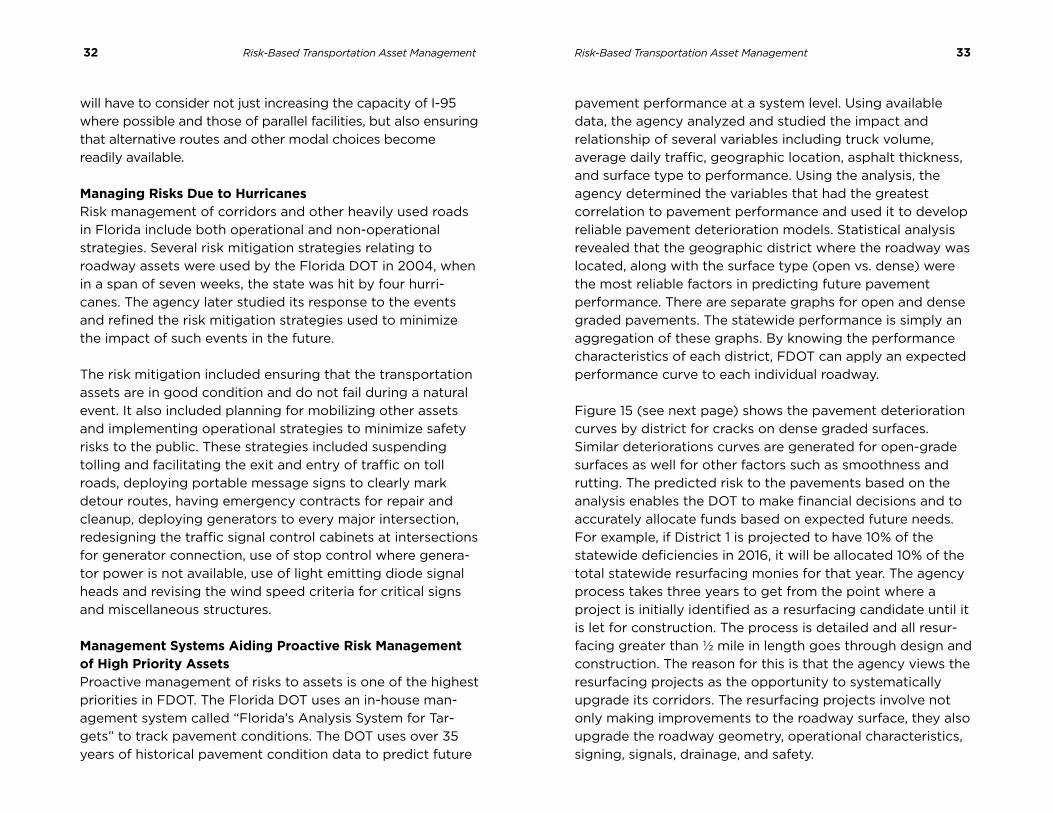
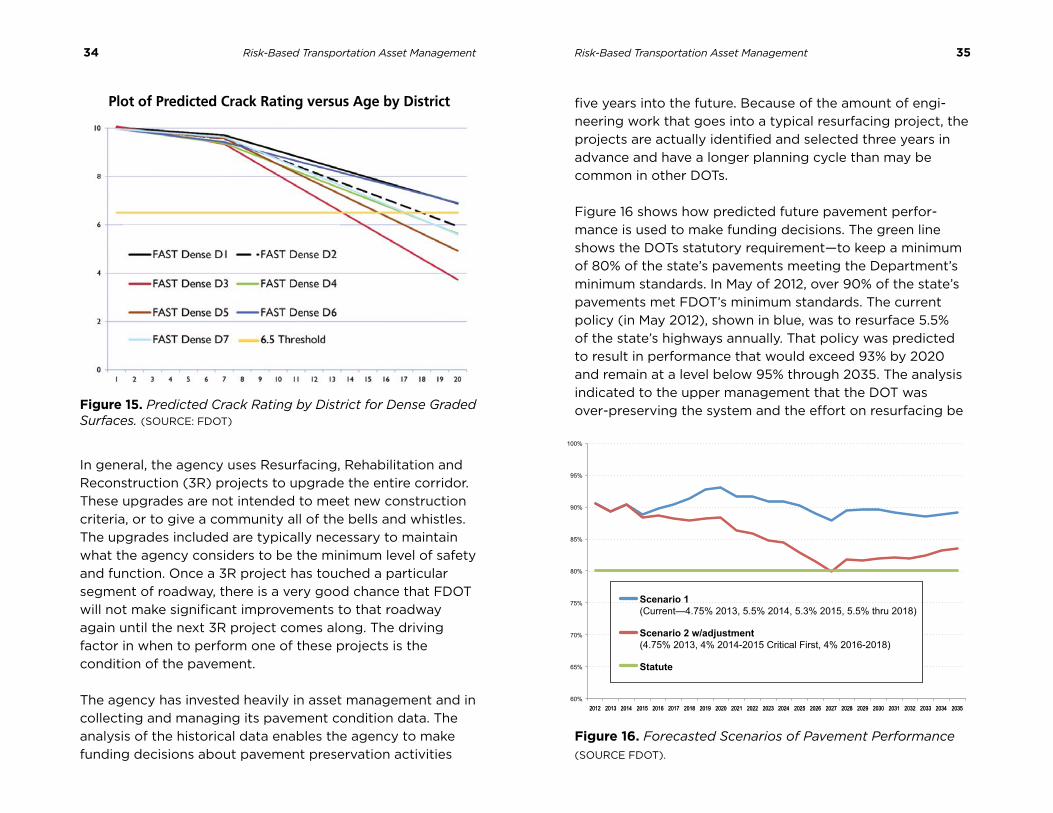
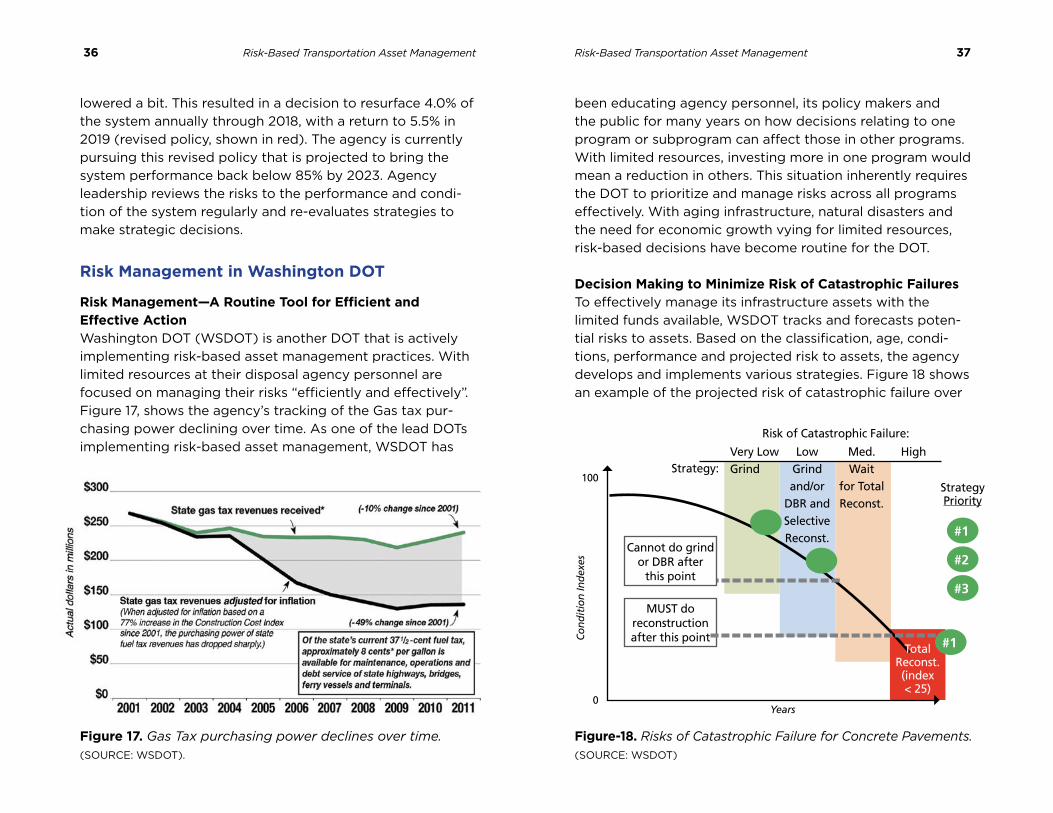
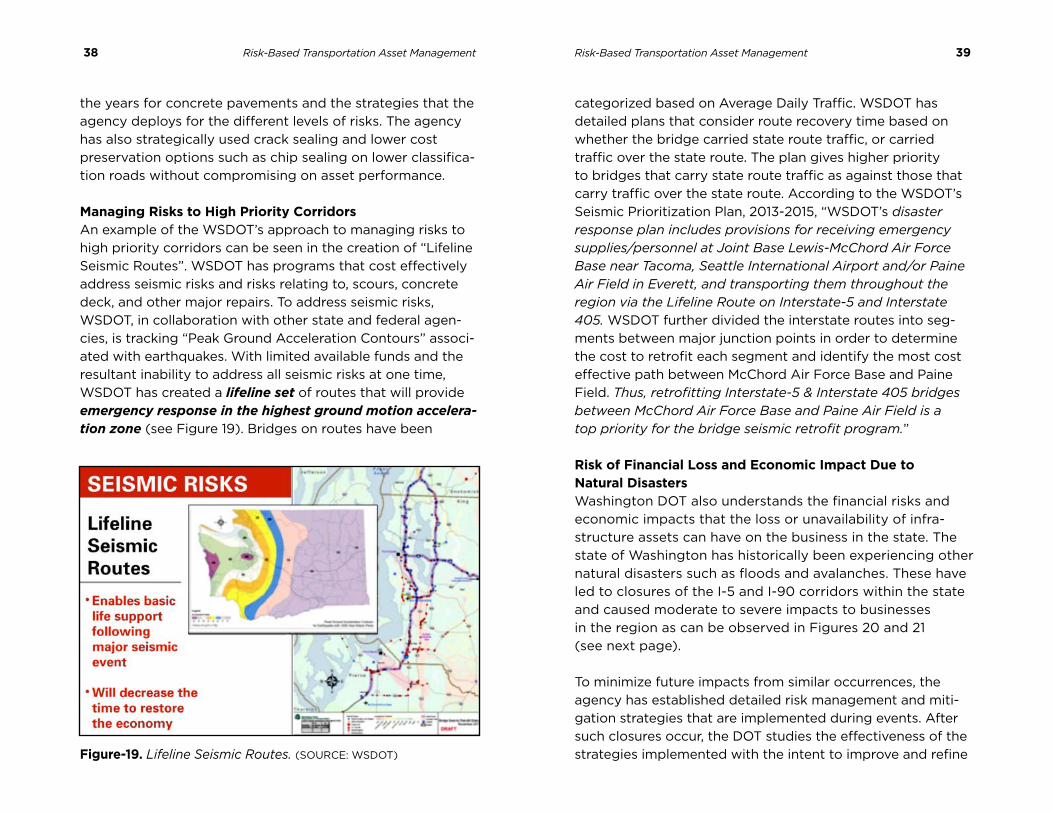
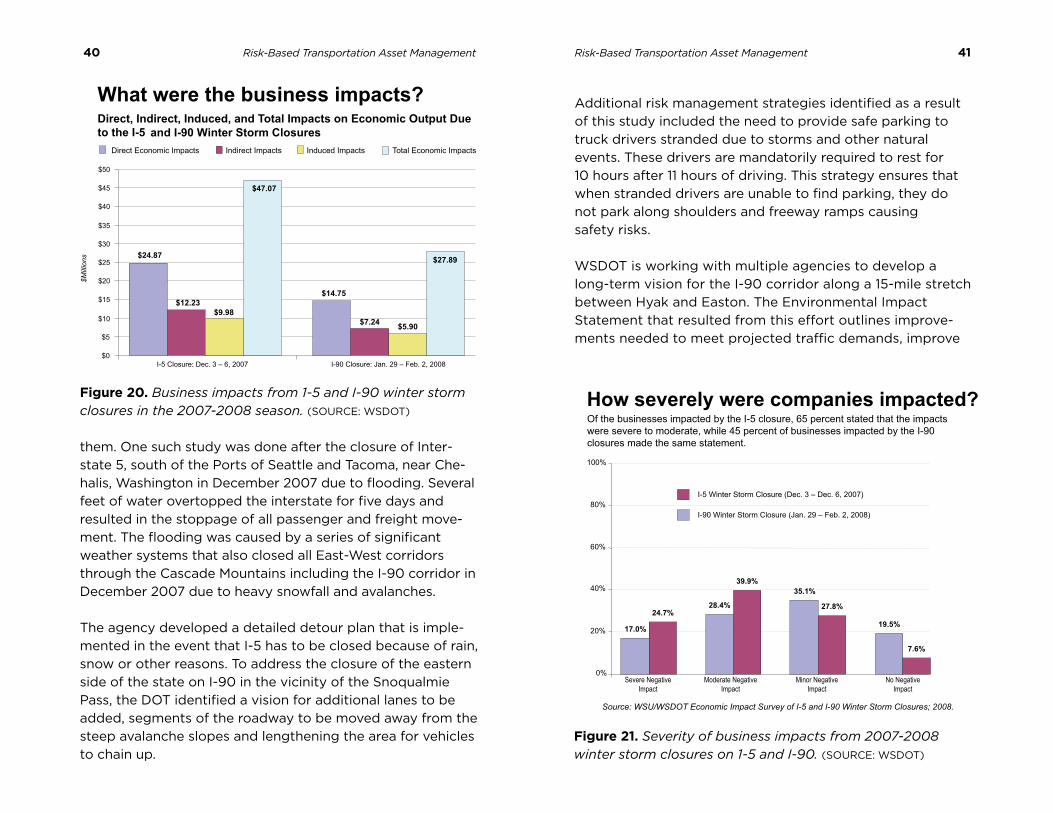

office of asset management Federal Highway administration 1200 new Jersey avenue se Washington Dc 20590
FHWA-HIF-13-017


