Download - Revolution in earth history

This article was downloaded by: [University of Western Ontario]On: 17 November 2014, At: 07:46Publisher: Taylor & FrancisInforma Ltd Registered in England and Wales Registered Number: 1072954 Registeredoffice: Mortimer House, 37-41 Mortimer Street, London W1T 3JH, UK
Journal of the Geological Society ofAustraliaPublication details, including instructions for authors andsubscription information:http://www.tandfonline.com/loi/taje19
Revolution in earth historyA. F. Trendall aa Geological Survey of Western Australia , Mineral House, 66Adelaide Terrace, Perth, Western Australia, 6000Published online: 03 Aug 2007.
To cite this article: A. F. Trendall (1972) Revolution in earth history, Journal of the GeologicalSociety of Australia, 19:3, 287-311, DOI: 10.1080/00167617208728798
To link to this article: http://dx.doi.org/10.1080/00167617208728798
PLEASE SCROLL DOWN FOR ARTICLE
Taylor & Francis makes every effort to ensure the accuracy of all the information (the“Content”) contained in the publications on our platform. However, Taylor & Francis,our agents, and our licensors make no representations or warranties whatsoever as tothe accuracy, completeness, or suitability for any purpose of the Content. Any opinionsand views expressed in this publication are the opinions and views of the authors,and are not the views of or endorsed by Taylor & Francis. The accuracy of the Contentshould not be relied upon and should be independently verified with primary sourcesof information. Taylor and Francis shall not be liable for any losses, actions, claims,proceedings, demands, costs, expenses, damages, and other liabilities whatsoever orhowsoever caused arising directly or indirectly in connection with, in relation to or arisingout of the use of the Content.
This article may be used for research, teaching, and private study purposes. Anysubstantial or systematic reproduction, redistribution, reselling, loan, sub-licensing,systematic supply, or distribution in any form to anyone is expressly forbidden. Terms &Conditions of access and use can be found at http://www.tandfonline.com/page/terms-and-conditions

REVOLUTION IN EARTH HISTORYPresidential Address delivered in Brisbane on 25 May 1971
By A. F. TRENDALL
(With 2 Tables, 9 Text-Figures and 6 Plates)
(Received 9 July 1972)ABSTRACT
The 2,400-metre thick Hamersley Group is characterised by its 900 m of bandediron formation, and is the middle of three constituent groups of the Mt BruceSupergroup, which forms the contents of the 2,300-1,800 m.y. old Hamersley Basin.The Hamersley Basin initially covered about 150,000 km2 of northwestern Australia,and in its present widespread outcrop, the Mt Bruce Supergroup is mostly littledisturbed or metamorphosed. Within one iron formation unit 142 m thick, the DalesGorge Member of the Brockman Iron Formation, within the Hamersley Group, thereare three scales of stratification, termed macrobanding, mesobanding (the normal'banding' of banded iron formation) and microbanding. Microbands are thin (0.2-2.0 mm) regular laminae, alternately rich and poor in iron, within chert mesobands.Microbands, mesobands and macrobands may all be correlated over the whole of thepresent outcrop. Microbands are believed to result from annual seasonal control ofthe primary precipitation in the basin, while alternations between microbanded chertmesobands and the adjacent non-microbanded chert-matrix are thought to reflect a25-year environment cyclicity. There is also a higher-order cyclicity. The microbandsare chemical evaporitic varves. There are many published accounts of modern non-glacial varves of a similar order of thickness whose identity as varves is establishedby direct evidence. Many of these are couplets of laminae, one half being largelyorganogenic, and similarly structured couplets have been widely accepted as varvesin descriptions of Phanerozoic rocks. Evaporitic laminae have also been so accepted,although there are no exact modern analogues. Microbands are closely similar tothese in geometry, and all varves are characteristically regular.
Secular variations in all depositional environments are likely to be related, inthe absence of major tectonic changes, to variations in the total annual receipt ofsolar radiation. The controls of insolation are well known, but their past variationis only usefully calculable back to 1 m.y. Variations of these controls, and especiallyof rotational obliquity, outside the Pleistocene limits, seems to be the most likelysource of an explanation for the various depositional cyclicities of the Dales GorgeMember. The history of Earth's revolution around the Sun (Revolution in EarthHistory) is a topic concerning which much evidence still remains to be read directlyfrom the stratigraphic record.
INTRODUCTION stantially abbreviated, and its style has beenThis Address begins with an introductory modified into a form closer to that of a con-
summary of the geological development of the ventional research paper. However, the originalHamersley area of Western Australia. It goes sequence of themes is retained, and the de-on to describe the progress and results of liberate ambiguity of the title is resolved inresearch on the Hamersley Group iron for- the final sentence,mations carried out over several years. It isthen shown how one specific problem arising GEOLOGICAL DEVELOPMENT OF THEfrom that work—the interpretation of banding HAMERSLEY AREAin banded iron formation—led into an ex- The location and regional setting of theamination of aspects of geology which would Hamersley area are shown in Figure 1. Thenot initially have been thought to be remotely oldest rocks are those of the Pilbara Block,relevant. From this examination came specu- They comprise sinuously curved synclinallations on a possible significance of the total strips of metasedimentary and metavolcanicresult for the general interpretation of Earth rocks, usually termed 'greenstone belts', whichhistory from the geological record. For its separate, and are intruded by, irregularly ovoidpresent publication this Address has been sub- domes of gneiss and granite. The granites have
Journal of the Geological Society of Australia, Vol. 19, Pt. 3, pp. 287-311, Pis. 13-18, November, 1972.
Dow
nloa
ded
by [
Uni
vers
ity o
f W
este
rn O
ntar
io]
at 0
7:46
17
Nov
embe
r 20
14

288 A. F. TRENDALLan approximate age of about 3,000 m.y.(Compston & Arriens, 1968), although thereare significant local variations from this (deLaeter & Blockley, 1972).
After the igneous and metamorphic activityrepresented by these rocks there was upliftand erosion to a surface of fairly low relief.On this surface, as it later sank, there beganto be laid down, about 2,300 m.y. ago, asequence of lavas, tuffs, and subordinateclastic sediments, which together constitute thepresent Fortescue Group. Along the southernedge of the Pilbara Block the basal uncon-formity of the Fortescue Group now dipsgently south, and reappears farther south in anumber of inlying domes (Fig. 1). The de-position of the Fortescue Group, probablyover an ovoid area at least 550 km long (east-west) and about 400 km across (north-south),marked the beginning of a regional crustal sagwhich probably persisted for some 500 m.y.(roughly equivalent to the whole of the Phane-rozoic) which we now know as the HamersleyBasin. The outcrops of the two groups thatsucceeded the Fortescue Group in the Hamers-ley Basin—the Hamersley Group and theWyloo Group—also appear in Figure 1.
The Fortescue Group attained its greatestthickness (about 4,250 m) in the central partof its total outcrop area. The details of itsstratigraphic nomenclature are confusing, andare not important in the present context. Thesignificant things are that much of it is directlyor indirectly volcanic and was laid down sub-aerially or in shallow water; it can be assumedthat the sinking associated with its depositionwas steady, that it kept pace with the infillingof the basin, and that it was centred on thearea which now has the thickest section. In thelower part of the Fortescue Group there is agood deal of minor lateral stratigraphic varia-tion, but the uppermost Jeerinah Formation, ablack shale, is laterally persistent over virtuallythe whole outcrop area, which defines theminimum extent of a quiet and extensive seawhich existed at the end of Fortescue Grouptime. The deposition of the Fortescue Groupprobably occupied about 250 m.y.
The Fortescue Group is succeeded upwardswith perfect conformity by the HamersleyGroup, which has a thickness of about 2,400m. It is characterised by the presence ofbanded iron formation, and is not further de-scribed at this point since it is the main topicof the immediately following part of thisAddress. The uppermost group of the Hamers-ley Basin, the Wyloo Group, is locally con-
formable and locally disconformable over theHamersley Group, and contains a mixture ofclastic sediments, thick and partly algal dolo-mite, and locally important basalt. It wasdeposited in a terminal phase of HamersleyBasin development in which the centre ofdeposition moved south, and we will not befurther concerned with it.
Figure 2 is a more detailed map of part ofthe area of Figure 1, and illustrates thestructure more clearly. In the north the For-tescue Group has a southerly dip of only afew degrees, and it is virtually undisturbed.This is so also for the overlying HamersleyGroup along the north face of the HamersleyRange, which is defined by a broad open syn-clinorium of the Hamersley Group in whichdips on either side rarely exceed 10°. To thesouth of the Hamersley Range, however, thesituation is different. The folding becomessteadily more intense, and in the south-eastern part there is even overturning. Ingeneral, along their southern margin, the rocksof the Hamersley Basin are either faultedagainst, or overlain unconformably by, theyounger (1,000 m.y. old) clastic sediments ofthe Bangemall Basin, but in the southwest theWyloo Group grades into metamorphic equiva-lents and is intruded by diapiric granites whoseage (1,600 m.y.) gives an upper limit to thatof the sediments which they intrude. It hasalready been noted that the lowest FortescueGroup rocks are about 2,300 m.y. old; withinthe Hamersley Group the Woongarra Vol-canics give a rather reliable age of 2,000 m.y.(Compston & Arriens, 1968).
STRATIGRAPHY OF THE HAMERSLEYGROUP
The Hamersley Group has an average thick-ness of about 2,400 m, of which some 900 mconsists of banded iron formation (BIF),750 m of acid volcanic rocks, 300 m ofdolerite sills, and the remaining 450 m ofa mixture of shale, tuff, and carbonate. Thedistribution of these lithologies, and the formalstratigraphic names, appear in Figure 3. Thedifferent formations are easily distinguishedand mapped by their contrasting topographicexpressions. The iron formations are oftenwell exposed on steep cliffy hillsides and indeeply incised gorges, and contribute to thegreat natural beauty of the area.
Two general points are worth making con-cerning the stratigraphy of the HamersleyGroup. Firstly there is a massive concentrationof igneous rocks in the upper part of the
Dow
nloa
ded
by [
Uni
vers
ity o
f W
este
rn O
ntar
io]
at 0
7:46
17
Nov
embe
r 20
14

REVOLUTION IN EARTH HISTORY 289
I N D I A N O C E A N
REFERENCE
Phanerozoic
Precambrian rock younger thanMount Bruce Supergroup
mWyloo Group
Hamersley Group
Fortescue Group
Mount BruceSupergroup
f Archaean
50 o 50 100 150 200
KILOMETRES
LOCATION MAP
Fig. 1. Generalised geological map of the northwestern part of Western Australia, showing the out-crop areas of the three component groups of the Mount Bruce Supergroup.
Journal of the Geological Society of Australia, Vol. 19, Pt. 3, pp. 287-311, Pis. 13-18, November, 1972.
Dow
nloa
ded
by [
Uni
vers
ity o
f W
este
rn O
ntar
io]
at 0
7:46
17
Nov
embe
r 20
14

290 A. F. TRENDALL
V V V V
v v v v
REFERENCE
Wyloo Group
Boolgeeda Iron Formation
Woongarra Volcanics
Brockman Iron Form.; Weeli Wolli Form.Mt McRae Shale; Mt Sylvia Formation;Wittenoom DolomiteMarra Mamba Iron FormationFortescue Group
Archaean
10 0 10 20 30
KILOMETRES
Southern edge of Mount Bruce Supergroup outcrop
Fig. 2. Generalised geological map of part of the Hamersley Range area (outlined inFig. 1) showing the regional structure.
Dow
nloa
ded
by [
Uni
vers
ity o
f W
este
rn O
ntar
io]
at 0
7:46
17
Nov
embe
r 20
14

REVOLUTION IN EARTH HISTORY 291
group. The extrusive rhyolites and dacites ofthe Woongarra Volcanics form over a quarterof the thickness of the group, while thedolerites of the Weeli Wolli Formation, whichwere later intruded below these, constituteanother eighth. Secondly, if these igneousrocks are disregarded, and only the sedimen-tary rocks taken into account, there are fivemain units of banded iron formation, eachunderlain by a thinner unit consisting mainlyof shale. These iron formation units are, frombelow upwards:—
5. Boolgeeda Iron Formation4. Iron formation of Weeli Wolli Formation3. Joffre Member of Brockman Iron For-
mation2. Dales Gorge Member of Brockman Iron
Formation1. Marra Mamba Iron Formation.
A remarkable feature about each of thesefive units of iron formation is that each ischaracteristically different from the others, ina number of subtle but quite consistent ways.This feature of the five banded iron formationunits is a major puzzle of the basin, which Ionly mention here in passing.
BLUE ASBESTOS: A STIMULUS FORRESEARCH
The brief outline that has so far been givenof the stratigraphy and regional setting of theHamersley Group is based on regional map-ping at a scale of 1:250,000 by parties of theGeological Survey of Western Australia dur-ing the years 1961-1963, especially of thefollowing Sheets:—Dampier and BarrowIsland (Kriewaldt, 1964); Roebourne (Ryan,1966); Yarraloola (Williams, 1968); Pyramid(Kriewaldt & Ryan, 1967); Wyloo (Daniels,1970); Mount Bruce (de la Hunty, 1965);Roy Hill (MacLeod & de la Hunty, 1966);and Newman (Daniels & MacLeod, 1965).The regional results, with particular referenceto iron ore, have been synthesised by MacLeod(1966). The mapping was done at that timebecause in December 1960 the CommonwealthGovernment had lifted an embargo, which hadbeen imposed in 1939, on the export of ironore; and it is interesting to reflect on what anabundance of fascinating geology had, as anindirect result, gone undiscovered for so longup to that time. Naturally, other factors wereinvolved, but there is no doubt that the em-bargo was one important reason why little wasknown about Hamersley area geology before1961.
In 1963 it was decided that the GeologicalSurvey of Western Australia should conductan investigation of blue asbestos in the Hamers-ley Range area. Blue asbestos, or crocidolite,occurs in clusters of thin conformable stringersat particular levels within the iron formation.It occurs only in small areally restricted bodiesat whose edges it dies out for no clearly evi-dent reason. A total fibre length of over 7 cmin a mineable seam represented at the timegood ore. The existing literature on it in 1963(mainly from South Africa) gave a widechoice of alternative hypotheses for its origin.Some thought that it, or at least some fairlyclose primary parent, was laid down with theiron formations at the time of deposition.Others regarded it as entirely late and secon-dary. Others again compromised with thebelief that a primary parent material had beenredistributed at a much later stage by folding.Crocidolite is the fibrous form of the sodiumamphibole, riebeckite, and an interesting com-plexity is that, both in the Hamersley Rangearea and in South Africa, crocidolite is asso-ciated closely with thick massive layers ofriebeckite, which are not only economicallyuseless but extremely tough and potentially de-structive to mill. And, as might be expected,some thought crocidolite to be derived frommassive riebeckite, while others thought thetwo to be unrelated.
Since, as I have described, the whole areahad in 1964 been recently mapped at a scaleof 1:250,000, we did not need to commit ourcrocidolite study time to that task, and werefree to build on the mapping in any way wechose. We therefore elected not to use anyexisting genetic hypothesis, but to start thewhole operation from geological fundamentals,by attempting to reconstruct the depositionalenvironment of the Dales Gorge Member, themain level at which crocidolite occurred, inas much detail as we possibly could; and by atthe same time examining the structure of theareas of crocidolite in detail we hoped to getto know the total depositional and post-depositional history of the relevant volumes ofiron formation sufficiently well for the croci-dolite problem to solve itself along the way.
During the following three years these ob-jectives were successfully achieved, in thelimited sense that we had accumulated muchdetailed information on the iron formations,and particularly on those bearing crocidolite,and that we had integrated these into a generalhypothesis which seemed to account satis-factorily for all the observed inter-relationships
Journal of the Geological Society of Australia, Vol. 19, Pt. 3, pp. 287-311, Pis. 13-18, November, 1972.
Dow
nloa
ded
by [
Uni
vers
ity o
f W
este
rn O
ntar
io]
at 0
7:46
17
Nov
embe
r 20
14

292 A. F. TRENDALLof massive riebeckite, crocidolite, and the hostiron formation, and which also gave a forecastof the likely distribution of crocidolite, re-gionally and quantitatively, in the HamersleyRange area. The results have now been pub-lished (Trendall & Blockley, 1970).
However, crocidolite proved to be of rela-tively late origin, and is not the main concernof this Address. The topic is introduced heresimply to explain how it was that the problemsdiscussed in its following parts came to ariseat all: they were left hanging when the croci-dolite study was effectively completed, becausethey were concerned with an earlier part ofthe iron formations' history. Beneath the re-maining headings the nature of these prob-lems is explained, and the extent to whichthey were solved.
MORE STRATIGRAPHY: MACROBANDS,MESOBANDS AND MICROBANDS
The problems to be discussed from here on-wards will involve a closer look at the DalesGorge Member (Fig. 3). Apart from itsspecial interest as the locus of the only sig-nificant crocidolite mineralisation in theHamersley Range area the Dales Gorge Mem-ber serves also as the host rock for the largerhematite orebodies of the Hamersley Rangearea, which have great economic importance.These bodies formed very much later eventhan the crocidolite (Porath, 1967), and theirpresence and distribution have no particularrelevance for the early history of the ironformation, so that despite their indisputablestatus as the backbone of the present WesternAustralian economy they will play no furtherpart in this Address.
The type-section of the Dales Gorge Mem-ber, which is defined in drill core from Wit-tenoom Gorge, is 142.11 m (466.25 ft) thick.It is characterised by three scales of banding:macrobanding, mesobanding and microband-ing. The macrobands are simply alternationsof shale and banded iron formation proper,and are shown in Figure 4. There are sixteenshale macrobands, numbered upwards fromSI to S16, and seventeen banded iron forma-tion macrobands, numbered upwards fromBIF 0 to BIF 16, to give a total of 33. Theirthickness varies from less than a metre (e.g.S2, S3) to over 10 m (BIF 0, BIF 16).
These macrobands have a distinctive topo-graphic expression in the field, as is shownin Plate 13. They may be traced, with a clarityequal to that with which they are displayedin the cliff illustrated, throughout the outcrop
area of the member, which involves a maxi-mum straight-line distance of 515 km. Quitecertainly their depositional extent was greater,since all the macrobands sweep northwardsout to sea at James Point, the northeasternmostextremity of the present outcrop. The macro-band sequence of the Dales Gorge Memberis identifiable in the field not only by its con-stant pattern of relative thickness, but by manylaterally constant lithological characteristics ofindividual macrobands (Trendall & Blockley,1968).
The macrobanding offers other advantagesthan simple recognition of the Dales GorgeMember. Firstly, it facilitates accurate measure-ment of the member, and allows confidencethat a measured thickness is a true thickness,not affected by partial post-depositionalerosion. An isopach map of the memberappears in Figure 5. The general ovoid formof the isopachs defines a similar thickness dis-tribution to that already described for theFortescue Group, and the assumption is thatthe depression of the Hamersley Basin floorwas fairly constant and symmetrical throughmuch of its development.
Secondly, the macrobands make it easy towork in greater detail on the finer scale strati-graphy, since they permit easy and rapid iden-tification of stratigraphic position within themember.
Within each of the BIF macrobands occurthe mesobands, which are the bands a fewmillimetres or centimetres thick that are nor-mally understood to be referred to in the term'banded iron formation'. Mesobands are illus-trated in Plate 14. Although their classificationand mineralogy is rather complex in detail(Trendall & Blockley, 1970) it does not affectmy present purpose at all to simplify thingsslightly by representing the BIF of the DalesGorge Member as consisting of three typesonly: chert, chert-matrix, and magnetite.
The chert mesobands consist mainly ofquartz in a mosaic of average diameter about20^,, together with variable quantities of oneor more iron-bearing minerals. The chert meso-bands are separated by darker, more iron-richmesobands, which were called chert-matrixsimply because chert already had a name, andthe darker material essentially formed a frame-work separating and defining the chert meso-bands. Chert-matrix is usually a fine-grainedmixture of at least two, and usually more, ofthe minerals quartz, magnetite, hematite, stilp-nomelane, ankerite and siderite; there is nor-mally a fine streaky lamination parallel to the
Dow
nloa
ded
by [
Uni
vers
ity o
f W
este
rn O
ntar
io]
at 0
7:46
17
Nov
embe
r 20
14

REVOLUTION IN EARTH HISTORY 293
VERTICALSCALE
GEEDA I
HAMERSICYGROUP
WT McRAESHALE
MT SYIVIA FORMATION
Fig. 3. Fig. 4.
1 "1 1 S14
H B BIF IS
^ ^ 9 BIF 14
IH su—
M S I
B H BIF l3
pw <„—1 1MJSH tif ioI I S"0
• • 9 BIF9
S9
hHHj BIF 8
W ""^ ^ ^ S 7
• • BIF 6
1 56
•91 ""r"*i 55
•B1 54
HH ""r™i i i—
H H 8IF:
| ^ H BIF t
15 1
4 4
7 0
5 8
1 0 1 VERTtCAlSCAtE
7 9
3 0
10-8 7
0 8-
3 80-
5 2
3 5
2 0
7 3
4 1
2 3
4 3
1-4
2 9
5-5
3 5
0 6 Z
5 7
3 9
4-4
o-ez
4-9
0-6*
6 1
i o ;
13-3
Fig. 3. Stratigraphic column of the Hamersley Group, showing lithology and nomenclature (Trendall& Blockley, 1970). Lithology is represented as follows: BIF—solid black; shale—white;dolerite—diagonal hatching; acid lava—v; tuff—stipple; dolomite—brick pattern. The verticaldivisions in the Mount McRae Shale and Dales Gorge Member indicate diagrammaticallythe approximate proportions of different components too closely interstratified for clearrepresentation at the scale used.
Fig. 4. Stratigraphic column of the Dales Gorge Member of the Brockman Iron Formation, show-ing numbering and thicknesses in metres of the 33 macrobands in the type section. Litho-logy is represented as in Figure 3.
Journal of the Geological Society of Australia, Vol. 19, Pt. 3, pp. 287-311, Pis. 13-18, November, 1972.
Dow
nloa
ded
by [
Uni
vers
ity o
f W
este
rn O
ntar
io]
at 0
7:46
17
Nov
embe
r 20
14

294 A. F. TRENDALLbanding, but no other clearly defined tex-tural characteristics. It contains about 40%total iron, and about 35% silica, in contrastwith 2-25% total iron and 50-90% silica inthe chert. Although chert and chert-matrixmesobands are sharply differentiate types thisis not so for chert-matrix and magnetite. Be-tween these latter two types there is completeintergradation; magnetite mesobands are usu-ally thinner than mesobands of chert-matrix.
between 3 and 50 microbands, although onewith 326 microbands has been recorded.
Like macrobands, both mesobands andmicrobands can be correlated over the whole ofthe basin. The lateral correlation of mesobandsis only possible, as I have already mentioned,because of the presence of the macrobands.With the advantage of confident identificationof, say, S3, in the field, it becomes possible towork upwards and downwards from its edges,
Fig. 5. Isopach pattern of the Dales Gorge Member. The isopach interval is approximately 6.1 metres.The outcrop area of the member, and locations of the measured sections on which the iso-pachs are based, are given by Trendall & Blockley (1970).
Returning now to the chert mesobands, wefind that most of them (to be exact 77.5% ina sample of 364) have an internal lamination,which we have called microbanding, and whichis illustrated in Plate 15. Microbanding is de-fined by thin layers of some iron-bearingmineral in the chert; this is most commonlyeither carbonate (ankerite or siderite), orhematite, or stilpnomelane, or a mixture ofthese minerals. Note that it is not defined byan alternation of these minerals with quartz,but by an alternation of these minerals plusquartz, with quartz alone; in other words,these iron-bearing minerals are arranged inlayers within a general matrix of quartz.
A characteristic of microbanding is theregularity of the intervals between successivemicrobands in any one chert mesoband. Indifferent mesobands the interval varies fromabout 0.2 mm to about 2.0 mm. Microbandsvery exceptionally attain a thickness of 5 mm,but wide variations of microband intervalnever appear in a single mesoband. Sincemicrobanded chert mesobands are mostlybetween 1 and 40 mm thick, most contain
mesoband by mesoband. We started this firstin a small way, on single cliff exposures, per-haps a few hundreds of metres long. Later wemoved to drill-holes around Wittenoom spacedup to a few kilometres apart, then the drillingmoved 24 km east to Yampire Gorge, andfinally 80 km east of Junction Gorge, and itbecame evident that the mesoband stratigraphywas unchanged. When drill-cores ran out wewere forced to use gorge exposures, in whichthe detailed identification can be much moretime-consuming. But, in brief, wherever meso-band correlation in the Dales Gorge Memberwas sought, it was found, and I am confidentthat similar mesoband continuity may beaccepted throughout the iron formations ofthe Hamersley Group, with the exception ofa special type of discontinuity mentionedfarther below.
Once chert mesobands are successfully iden-tified at a distance, they can be sectioned formicroband correlation. One major difficulty inestablishing exact equivalence of microbandsis the very feature which I have just empha-sised: their striking regularity. Of course, if
Dow
nloa
ded
by [
Uni
vers
ity o
f W
este
rn O
ntar
io]
at 0
7:46
17
Nov
embe
r 20
14

REVOLUTION IN EARTH HISTORY 295
two microbanded chert mesobands, which arealready believed to be the same band on theevidence of their position in the total meso-band sequence, each contain ten microbandsthere exists a strong presumption of individualmicroband equivalence, although it cannot beregarded as proven. But it is more satisfying ifsome irregularity of the microband sequencecan be found to support the presumption.
Such an example appears in Plate 16. Therethe left-hand side is a thin-section of a micro-banded chert mesoband in BIF 0 from DalesGorge; the right-hand side is a thin-section ofthe same chert mesoband from Point James.Various corresponding irregularities are pointedout in the caption. The two locations are296 km apart.
WHAT ARE MICROBANDS ANDMESOBANDS?
Mesobands and microbands have now beendescribed, but nothing has been said abouttheir sedimentational significance. How did achert mesoband containing, say, 20 microbandsform? What are the origins, firstly, of themicrobands, and secondly, of the mesobanditself; and why are they now such clearlyexpressed features of the iron formation?
It first has to be decided whether the micro-bands are primary or secondary. They may besome sort of Liesegang phenomenon whichdeveloped in gelatinous material after its de-position. If so, they lack several of the normalfeatures of such banding: they never curve,terminate or cross; their progression of thick-ness is arithmetical, rather than geometrical;and they would of course be the most exten-sive and continuous such phenomena ever de-scribed. It seems more constructive to explorethe alternative hypothesis, that they are aprimary depositional feature, in which casetwo major and inter-related questions arise:what is the depositional mechanism of each?—and why is the succession so regular?
If a microband is a primary depositionallayer then the only mechanism which can bereasonably envisaged to form it is chemicalprecipitation; I cannot see how else it can besupposed that such a thin and continuoussheet of material can be emplaced. This sup-position is entirely consistent with previouslysuggested theories of iron formation deposi-tion, and is not hard to accept, but whatabout the regularity?
Quite early in the investigation it was pro-posed that, if microbands correspond to chemi-cal depositional events, then the most likely
explanation of regularity was that each cor-responded to one year of deposition, so thateach microband pair (by a pair is meant thecomplete iron-poor and iron-rich couplet) re-presented a varve. I should note here thatneither by etymology nor original definition(De Geer, 1912) is the use of the word varveconfined to the annual deposits associatedwith glaciation, and there is no glacial impli-cation either here or in its subsequent use.
I will not dwell on this interpretation nowbecause it will be examined in detail fartheron, and the point is introduced here only soas to make sense of the immediate argument.
It is now conceived, then, that the micro-bands within a chert mesoband represent aseries of thin annual chemical skins succes-sively coating the basin floor, but the problemof the mesoband itself has not been attacked.Is it to be supposed, for a chert mesobandwith 20 microbands, that after 20 years therewas a radical and abrupt change in the depo-sitional regime that resulted in an entirelydifferent type of deposit, corresponding to thechert-matrix which now lies above? Or mightthere be a less catastrophic interpretationavailable?
The critical evidence for this problem comesfrom certain apparently discontinuous chertmesobands. Although I have so far dealt withmesobands as though they were a geometri-cally perfect sequence of layers there do occuralso instances where a mesoband is brokenup into a series of discontinuous blobs or podswhich appear on the usual vertical joint-faceexposures as strings of biconvex lenticles alongthe banding, completely enclosed by chert-matrix. Very often the discontinuity is onlyapparent, and the lenticles in fact form partof a single, highly irregular, anastomosingsheet in plan. Such bodies are called poddedcherts, while the individual lenticles are calledchert pods.
Now microbanding is also present in chertpods, and its relationship to the chert-matrixat the lateral terminations of the pod is critical.The microbands are not truncated at the edgesof the pod, but continue smoothly into theadjacent chert-matrix, where their thickness isdrastically reduced and their individual iden-tities are normally lost. An example appearsin Plate 17A, which is rather exceptional inthis respect, in that the gradation from chertto chert-matrix is gradual rather than sharp,and the microbands are discernible within theadjacent chert-matrix. The situation in prin-ciple is as shown in Figure 6. A given thick-
Journal of the Geological Society of Australia, Vol. 19, Pt. 3, pp. 287-311, Pis. 13-18, November, 1972.
Dow
nloa
ded
by [
Uni
vers
ity o
f W
este
rn O
ntar
io]
at 0
7:46
17
Nov
embe
r 20
14

296 A. F. TRENDALLness (tj) of chert, as defined by the distancebetween identifiable microbands, is equivalentto a lesser thickness (t2) of chert-matrix, asdefined by general continuity of those micro-bands. The average ratio of tx to t2, from alarge number of measured examples, is about7:1.
CHERT-MATRIX"
Fig. 6. Diagram illustrating the marginal re-lationship of microbanding within achert pod to the lamination of the en-closing chert-matrix.
A tenable hypothesis in explanation of thissituation is that the chert-matrix laterallyequivalent to the micro-banded chert podoriginated by the extreme compaction of partof an originally continuous chert mesoband.The next step in the argument follows natur-ally: if the chert-matrix at the side of the podformed by compaction of chert, they whyshould not the petrographically identical chert-matrix above and below the pod have formedin the same way?—and why could this notapply equally for a continuous chert meso-band?
If we accept this possibility, and return toour initial problems as posed by the conceptof a single extensive chert mesoband with 20microbands, our depositional reconstructionnow involves less drastic suppositions. We maysuppose that after 20 years of even and regu-lar precipitation, to give the visible microbands,some comparatively subtle change in deposi-tional chemistry was sufficient to change thelater reaction of the precipitate to burial, andto permit its gross compaction to chert-matrix. And we suppose that chert mesobandsrepresent, in effect, periodic fluctuations ofsome minor, and unknown, environmentalfactor which did not halt the year-by-yearaccumulation of a skin of precipitate over thebasin, but which was nevertheless sufficient togenerate differences in reaction to compaction.These differences were augmented during dia-genesis, to product the presently conspicuousmesobands.
This sequence of suppositions, first put for-
ward five years ago (Trendall, 1966) anddescribed as the 'basic hypothesis', was laterrefined and integrated with suggestions con-cerning the initial chemical composition anddiagenetic modification of the precipitate, andin its most recent form (Trendall & Blockley,1970), incorporates the following proposals:
1. Each year over the 150,000 km2 of thebasin about 5 mm of material was pre-cipitated.
2. Each individual layer had an iron-poorand an iron-rich part, but the bulk com-position was roughly:SiO2 8%
FeO*3 2%} 2 2 '5 m g m F e / c m 2 /y e a r
CO2 1%H2O 85%
The material was thus hydrous and gela-tinous, with a bulk density of about 1.1;to select one component of obvious in-terest, about 22.5 mgm of total Fe werelaid down each year per square centi-metre of the basin's area.
3. Periodic minor changes in the composi-tion of the precipitate led to radicaldifferences in response to compaction,so that some varve sequences compactedonly slightly, to give chert with coarsemicrobands, some sequences compactedmuch more, to give chert with finemicrobands, and some sequences com-pacted to give chert-matrix, or, ulti-mately, solid magnetite. All thesematerials represent stages in the pro-gressive expulsion of water from theprecipitate, carrying with it silica andcarbon dioxide in solution.
This basic hypothesis was developed essen-tially to account for all the observed featuresof the two most conspicuous types of stratifi-cation in the Hamersley Group iron formations:mesobanding and microbanding. Obviouslythere are many other problems in the ironformation, but they are not the main concernhere. Nevertheless, it would be useful to sum-marise briefly the general depositional situa-tion in the basin; the evidence for each pointis already fully published (Trendall & Block-ley, 1970).
The bulk of the material for the ironformations was probably volcanogenic, mostlikely from quiet marginal fumarolic activity.The basin was ovoid, and was open to theocean at what is now the western end; the
Dow
nloa
ded
by [
Uni
vers
ity o
f W
este
rn O
ntar
io]
at 0
7:46
17
Nov
embe
r 20
14

REVOLUTION IN EARTH HISTORY 297
connection was slight enough to allow evapo-rative concentration of the dissolved materialsbut sufficient to ensure that the basin nevercompletely dried out. The iron concentrationneed have been no higher than 15 ppm. Theaverage depth of water was probably about200 metres. The land surrounding the basinwas flat, with a desert climate of extremeseverity, and a very high annual evaporation.Conditions during Hamersley Group de-position had remarkable stability, and thebasin waters never had more than sluggishcirculation. Despite these rigorous conditions,there was abundant plant life in the watersof the basin, probably including algae, andthis may well have been a significant additionalcontrol over the annual chemical changeswhich induced seasonally distinct types of pre-cipitate—or, more correctly, the life was notan additional control but a buffer, modifyingand possibly intensifying the purely physicalchanges from season to season. The paleo-latitude of the basin is unknown, but it wasprobably close to one of the tropics, whateverthe latitude of these was at the time. DuringBIF deposition the basin sank at about 0.2mm each year, against a general rate of about0.05-0.1 mm a year.
The basin could not have formed an attrac-tive scene: it was a great stagnant saline pond,lying stably and monotonously in a sun-scorched plain utterly devoid of life, withspasmodic but never spectacular volcanic out-bursts at the water's edge the only feature ofinterest in the landscape.
LONG-TERM PERIODICITYIn summarising the 'basic hypothesis' im-
mediately above, the origin of mesobands wasattributed to periodic minor changes in thecomposition of the annual precipitate, con-trolled by periodic fluctuations of some minorenvironmental factor. The simple fact thatchert and chert-matrix mesobands do alter-nate indicates some sort of regular periodicity.But what was this? That is, how regular was itand what was its period? The beginning of ananswer to those questions came finally fromthe Weeli Wolli Formation, but before gettingon to that it is necessary to mention briefly afurther cyclicity in the Dales Gorge and JoffreMembers of the Brockman Iron Formation,which has not so far been touched on.
In the introductory description of micro-banding, above, it was noted that microbandedcherts may be either finely or coarsely micro-banded, and that the microbanding may be
defined by either carbonate or hematite. It isalso broadly true that finely microbandedcherts have their microbands defined by hema-tite, and have a reddish tinge; while coarselymicrobanded cherts have their microbands de-fined by carbonate, and are white.
In many of the BIF macrobands of theDales Gorge Member, and at many levelsin the Joffre Member also, there is a regularalternation between red cherts and whitecherts, often involving several mesobands ineach case, over a total thickness of between8 and 16 cm. These alternations, in these twomembers, are called the Calamina and Knoxcyclothems respectively; once recognised, itcame gradually to be appreciated that, evenwhere these cyclothems are not conspicuous,they are often expressed in some variant andconcealed form.
A fine example of the Knox cyclothem inthe Joffre Member is shown in Plate 17B.White chert mesobands are regularly spaced at8 cm intervals, each with coarse carbonate-defined microbands. In between, are groups ofred chert mesobands with fine hematite-definedmicrobands. All are separated by interveningchert-matrix. Examples of this clarity are onlyto be found in core or in gorge-bottom ex-posures; but the same regular rhythm is oftenclear in weathered exposures by the regularappearance of a more fissile part, to give aslabby appearance.
Whatever the periodicity of the mesobands,then, we have also a periodicity of a stillhigher order in these cyclothems, and fromarguments based on the annual amount ofiron precipitated it was estimated for theDales Gorge Member that the higher-orderperiodicity may have been about 600 years.
Now to return to the mesoband problem,and the bearing on it of the Weeli WolliFormation. In this formation there exists anunusual type of iron formation, which is notconspicuously mesobanded at all, but withinwhich there are close parallel stripes, about5 mm thick, which are alternately slightlydarker and slightly lighter than the general redcolour. The darker stripes are often planes ofeasy fissility, and in weathered exposures thewhole material tends to disintegrate, like ashale, into thin plates. When some parts of this'striped fades' are thin-sectioned it is revealedas an iron formation which is continuouslymicrobanded, rather than intermittently (fromchert to chert-matrix), as in the more typicalmesobanded iron formation.
Part of a thin section of striped facies
Journal of the Geological Society of Australia, Vol. 19, Pt. 3, pp. 287-311, Pis. 13-18, November, 1972.
Dow
nloa
ded
by [
Uni
vers
ity o
f W
este
rn O
ntar
io]
at 0
7:46
17
Nov
embe
r 20
14

298 A. F. TRENDALL
TABLE I
Published examples of modern accumulation of annual layers
Number(Fig. 7)
1
2
3
4
5
6
7
8
9
10
11
12
13
14*
15
16
Locality
Lake Elton, South Russia
North Baltic
Clyde sea
Zurich and Baldegg lakes,Switzerland
Sakski Lake (N. Crimea)
Pert Lake (Karelia)
Drammenfjord (Oslo)
Ontario lakes
Black Sea
Gulf of California
Santa Barbara Basin
Malo Jezero, Adriatic
Nyland Fjord, Sweden
Faulenseemoos
Saanich Inlet, BritishColumbia
Normandy
Reference
Cech, 1878
Grippenberg,1934
Moore, 1931
Nipkov, 1920 and1928
Perfiliev, 1927
Schostakowitsch,1937
Schostakowitsch,1936
Str^m, 1936
Whittaker, 1922Tippett, 1964
Wolanski, 1933(after Archangel-ski—see Bradley,1937)
Calvert, 1966
Hulseman andEmery, 1971
Seibold, 1958
Granar, L., 1956
Welten, 1944
Gross et al, 1963Buddemeier, 1970
Journaux, 1952
Thicknessin mm
4-4
3-5-6av. 475
Zurich 5-3Baldegg 3-7
1-3
0-5-2-7av. 1-5
0-2-1-0
0-2
ca.2
1-85-2-06
0-25
ca. 20
ca.9
4
c. 3-4
Evidence for annualaccumulation
Not clear
No good evidence
Measurement of sedimentationand plankton catch records
Correlation of diatom occur-rence with lake abundances;check by landslide years
spring—black = observedgrowth of organisms,summer—gypsum or sand;correlation of deduced withobserved rainfall
correlation of deduced withobserved rainfall
Correlation with run off
Correlation with seasonallyavailable pollen and diatoms
obvious correlation withenvironmental variation
measured accumulation ratesand radiocarbon ages
obvious correlation with sea-sonal environmental variationand radiocarbon average ratedetermination
Correlation of varve parts withseasonal changes in localenvironment
Correlation with river discharge
Seasonal pollen variation
Correlation with annual diatombloom is confirmed by radio-carbon dating
Known existence of lake
* This example wins marginal inclusion in this Table, since the Faulenseemoos was artificially drained in1920, and deposition ceased; however, unlike other examples noted in the text, the layers would still have beenaccumulating without human intervention.
Dow
nloa
ded
by [
Uni
vers
ity o
f W
este
rn O
ntar
io]
at 0
7:46
17
Nov
embe
r 20
14

REVOLUTION IN EARTH HISTORY 299
TABLE II
Published examples of Phanerozoic laminated sediments in which the laminae have been described as varves
Age and numberon Figure 8 or 9
Pleistocene 1
Pleistocene 2
Pleistocene 3
Pleistocene 4
Pleistocene 5
Pleistocene 6
Pleistocene 7
Tertiary 1
Tertiary 2
Tertiary 3
Tertiary 4
Tertiary 5
Tertiary 6
Tertiary 7
Tertiary 8
Tertiary 9
Cretaceous 2
Jurassic 1
Jurassic 2
Jurassic 3
Permian 2
Permian 3
Carboniferous 1
Carboniferous 2
Carboniferous 3
Carboniferous 4
Carboniferous 5
Locality
Eritrea
Kaluga, Russia
Luneberg, Germany
Texas, U.S.A.
Israel
Marks Tey, Essex
Gulf of Aden
Green River Basin
California
Oeningen
Burma
Grozny region
Majorca
Sicily
California
Colorado
Black Hills, Dakota
North Caucasus
New Mexico
Dorset, England
Germany
England
Oklahoma
Utah
Illinois
Thuringia
Ireland
Reference
Bibolini, 1925
Bogoliibov, 1905
Giesenhagen, 1925
Anderson andKoopmans, 1969
Bentor, 1968
Shackleton andTurner, 1967
Olausson andOlsson, 1969
Bradley, 1929
Bramlette, 1946
Heim, 1909
Stamp, 1925
Wolanski, 1933(after Archangelski—see Bradley, 1937)
Colom, 1967
Ogniben, 1957
Riveroll and Jones,1954
Anderson, 1961
Rubey, 1930
Kuznetsov, 1928
Anderson andKirkland, 1960
A. Wood, pers.comm.
Richter-Bernburg,1957, 1958
Stewart, 1954
Bradley, 1931
Bradley, 1931
Bradley, 1931
Korn, 1938
West, Brandon andSmith, 1968
Remarks
Alternation of clayey gypsum and silt
Interglacial deposit of laminated marl
Finely laminated interglacial diatomite
Blancan (Lake Channing)
Evaporites
Organic clay-mud with some precipitatedcarbonate
Eocene
Miocene (Monterey Fm.)
Upper Miocene lake beds; palaeontolo-gical evidence of identity as varves
May be turbidites
Miocene (Maikop Series)
Burdigalian lacustrine diatomite
Miocene evaporites
Miocene
Florrisant Lake, Oligocene
Various types of lamination in marineshale
Organic/carbonate laminae
Todilto Limestone
Lias
Zechstein
Zechstein
Hartshorne Sandstone
Paradox Formation
Hannibal Shale
Not now thought to be varves
Visean
Journal of the Geological Society of Australia, Vol. 19, Pt. 3, pp. 287-311, Pis. 13-18, November, 1972.
Dow
nloa
ded
by [
Uni
vers
ity o
f W
este
rn O
ntar
io]
at 0
7:46
17
Nov
embe
r 20
14

300 A. F. TRENDALL
TABLE II—continued
Published examples of Phanerozoic laminated sediments in which the laminae have been described as varves
Carboniferous 6
Carboniferous 7
Carboniferous 8
Devonian 1
Devonian 2
Devonian 3
Devonian 4
Silurian 1
Silurian 2
Yorkshire, England
Czechoslovakia
Devon, England
Thuringia
New York
Alberta
Caithness, Scotland
Lake District,England
Catskill, New York
Spears, 1969
Skocek, 1968
De Raff, Readingand Walker, 1965
Korn, 1938
Bradley, 1931
Anderson, 1966
Rayner, 1963
Marr, 1928
Bradley, 1937
Laminated marine shale
Stephanian
Genessee Shale
Beaverhill Lake Formation
Archanarras Limestone
Probably turbidite
Manlius Formation (probably Devonian:Laporte, 1967)
material is shown in Plate 17C. It shows thecontinuous microbands, very thin (here about0.1 mm) but clearly denned, in both the lightand dark stripes. If sufficient thin-sections aremade from different pieces of striped faciesmaterial we find an interesting gradation. Fromthe situation illustrated, where light and darkstripes are equally clearly microbanded, thereis a progression through material where thelighter stripes become steadily thicker andlighter, with coarser microbanding, and inwhich the darker stripes become steadilythinner and darker, with finer and less clearlydefined microbanding, to material which isstill by field appearance striped facies, butwhich has, in thin section, an alternation ofmicrobanded chert mesobands and structure-less intervening chert-matrix, in which themicrobands are now compressed beyond recog-nition; in effect there is a progression fromcontinuous microbanding to the typically meso-banded situation, where microbanding is notdiscernible in the chert-matrix.
The discovery of this independent evidencethat chert-matrix was once microbanded, longafter the establishment of the rather involvedchain of reasoning that had argued this to beso for the Dales Gorge Member, enormouslyincreased confidence in the 'basic hypothesis'.From data so far unpublished on the WeeliWolli Formation the period of the WeeliWolli stripes, which I believe to be also thecontrolling period of the Dales Gorge meso-bands, appears to be 25 years.
The longer-term periodicity represented inthe Dales Gorge and Joffre Members by theCalamina and Knox cyclothems respectively
is present also in the Weeli Wolli Formationas an alternation of the progressive appearanceof chert mesobands of different colours. So farI have only one estimate of its length basedindirectly on microband counts: 1,750 years.I don't know yet whether this apparent differ-ence from the 600 years of the Dales GorgeMember is real or not; I only want to make thepoint that a longer term periodicity is there.
HOW CAN VARVES BE RECOGNISED?In the seven years up to 1969 a good deal
of work had been put into the HamersleyBasin, by many people, and a reconstructionof the environment had been set up whichwas plausible by all the accepted canons ofgeological interpretation, and which accom-modated all the available information. But forall its apparent neatness, what I have calledhere the basic hypothesis was disturbinglyreliant on the varve interpretation of micro-bands; and the rest of the basin reconstructionwas so dependent, directly or indirectly, onthat hypothesis, that, if the hypothesis provedfalse, the whole reconstruction would need tobe revised. Some questions that neededanswers were:
1. How can the apparently plausible iden-tity of microbands as varves be either con-firmed or invalidated?
2. If microbands are varves, what largerperiodicities may be represented by meso-bands, and by the Calamina and Knox cyclo-thems?
3. To what extent are the year (or the day,as another obvious climatic cyclicity) ex-pressed in contemporary sedimentation?
Dow
nloa
ded
by [
Uni
vers
ity o
f W
este
rn O
ntar
io]
at 0
7:46
17
Nov
embe
r 20
14

REVOLUTION IN EARTH HISTORY 3014. To what extent are these two rhythms
expressed in other sedimentational records ofdifferent types and ages?
5. What evidence is there for the secularstability, or otherwise, of the various orbitalfactors which presently control the differingenvironmental expressions of the year on theearth's surface?
Before tackling any of these problems agree-ment should be established on a number ofpreliminary points which there is not spaceto debate fully:—
1. If we suppose that each microband isrelated to some primary depositional event,then the regularity of these events is at thesame time an important feature to be ex-plained and a vital clue to their origin.
2. Insolation, the amount of solar radiationreceived, is trie dominant local control ofEarth's surface environment, and hence in-directly of the sedimentary environment.
3. The day and the year, controlled re-spectively by the Earth's rotation and revolu-tion, are the only present variations of theinsolation as regular as microbands.
4. In spite of a good deal of buffering, bysuch factors as turbulent circulation of theatmosphere and its complex interaction withsurface irregularities, oceanic currents, andregional variations in albedo, the insolation-defined day and year are also, in general, theonly variations in surface environment asregular as microbands.
Another point to be noted here is that Ihave deliberately chosen to exclude from sub-sequent discussion microbands in other ironformations than those of the HamersleyGroup, and also glacial varvity generally. Thereasons for both these exclusions need briefexplanation. Firstly, glacial varvity cannot beadequately discussed without reference to otheraspects of glaciation, which is quite outside thescope of this Address. The exclusion of glacialvarvity effectively excludes also any referenceto Precambrian varves, apart from those ofthe Hamersley Group, since others so fardescribed (e.g. Mawson, 1949; Visser, 1971;Spencer, 1971; Jackson, 1965) are, with oneexception (Korn & Martin, 1951), eitherdirectly glacial or of glacial association. Micro-bands exist in iron formations of probablysimilar age to the Hamersley Group both insouthern Africa (Cullen, 1963) and in northAmerica (Trendall, 1968). In Archaean ironformations I have observed them in Canada,India and Western Australia (Trendall, 1970).However, I do not wish at present to impose
Hamersley Group results outside the Ham-ersley Basin, and so all these are similarlyexcluded from present consideration.
Now to return to the list of questions thatappear early in this section. I take the thirdquestion first: to what extent are the year andthe day expressed in contemporary sedimen-tation?
In Figure 7 are shown the positions of anumber of modern environments in which thinannual laminae are reported to be laid downin response to seasonal changes of environ-ment. The references, ranging from 1878 to1966, appear in Table I, and the earlier onesare largely based on previous compilations ofBradley (1931, 1937). Modern directly glacialvarves (Johnston, 1922) are, as already dis-cussed, excluded from this map, as well assome examples of very recent annual lamina-tion which has not been demonstrated to becontinuing at present (Eugster, 1969; Tara-sov, 1968).
Of the fifteen examples of Table I, ten havesome evidence that the laminae described areannual, other than their regularity and thecommonsense likelihood of this explanationof their existence. There is obviously someproblem here of just what sort of evidenceyou think is good enough. While the passageof each grain of silt, or each diatom, down tothe bottom cannot be individually observed abetter argument than the simple regularity ofthe laminae must be provided. The types ofextr. evidence presented by the authors con-cerned is various, but all of it is impressive:as shown in Table I, two of them use radio-carbon ages, either from different levels of thestudied core, or locally nearby, as a generalcheck on sedimentation rate; several determineannual local influx of material and check itagainst the thickness of the laminae; in oneinstance varve counts are checked againstknown dates on which landslides entered thelake concerned; and in two cases the planktoncontent is correlated with that actually ob-served in the water above.
Their common characteristics deserve atten-tion. All are non-glacial clastic or part-clasticvarves. All of them are accumulating in aquiet, undisturbed environment responsive toannual seasonal changes in the supply ofmaterial, which is usually of small totalamount, fine-grained, and evenly distributed.It is usual for part of the year's sedimentsupply to be mainly organic, and this is a bighelp in the definition of the deposited laminae.The thickness sequence is usually not as regu-
Journal of the Geological Society of Australia, Vol. 19, Pt. 3, pp. 287-311, Pis. 13-18, November, 1972.
Dow
nloa
ded
by [
Uni
vers
ity o
f W
este
rn O
ntar
io]
at 0
7:46
17
Nov
embe
r 20
14

302 A. F. TRENDALL
Fig. 7. Map showing the positions of 16 localities from which presently accumulating non-glacialvarves have been described. The numbers refer to Table I.
lar as that of microbands, but has the sort ofvariation that is normally expected from yearto year in modern climates. Of course, to beavailable for examination it is also necessarythat these soft and fragile laminae be notdestroyed by bottom-dwelling animals, and thereason for this is variously that the environ-ments are too cold, too sulphurous, too lowin oxygen, or too saline.
I am aware of only one example where thepresent day is being preserved in a sedimentaryrecord, and that is directly associated with aglacier. This has been described by Jayet(1959) from the deposits of a glacial lake nearthe Franco-Swiss border. I conclude thatwhereas records of diurnal sedimentation arefew, and only present in environments un-likely to be permanently preserved, records ofthe year are numerous, and several aresituated where their permanent geological pre-servation is not unlikely.
On a directly uniformitarian interpretationit is therefore more likely that, if microbandsrepresent years or days, then years are the pre-ferred choice. A further argument reinforcesthis choice. If microbands are years then the
average rate of sinking of the HamersleyBasin over an interval like that represented bythe Joffre Member is of the order of 200 mmper 1,000 years, over about 2,000,000 years. Ifmicrobands are daily deposits, and there were365 days in the Hamersley Group year* thenthe sinking rate would be about 7 cm peryear. This would be a quite exceptional ratefor crustal sinking; it would follow that thedeposition of the entire Hamersley Groupoccupied less than 50,000 years, and thereshould be stratigraphic evidence of an un-usually fast rate of subsidence. There is none,and the day can probably be excluded fromserious consideration, unless rotation was im-probably slow.
So far we have moved directly from micro-bands to presently accumulating non-glacialvarves. The next section looks at the inter-vening record.
VARVITY IN THE GEOLOGICALRECORD
Sequences of thin laminae of various ages,usually with an organic-rich layer as the maindefining component, and from both lacustrine
* It is almost certain that there were at least 500 (Lamar et al., 1970).
Dow
nloa
ded
by [
Uni
vers
ity o
f W
este
rn O
ntar
io]
at 0
7:46
17
Nov
embe
r 20
14

REVOLUTION INand marine environments, have been inter-preted as non-glacial varves by many authors.The positions of 37 Phanerozoic examples, ofwhich details appear in Table II, are shownin Figures 8 and 9. They range in age fromSilurian to Pleistocene, and many were in-cluded in Bradley's (1931, 1937) previouscompilations already referred to.
Most of the examples are closely similar tothe present demonstrably annual laminae, to
EARTH HISTORY 303
tion are present, just as in the microbanding ofthe Hamersley Group iron formations.
In the Castile Anhydrite of the DelawareBasin the alternation is usually between an-hydrite and calcite; in the Zechstein the alter-nation is either between anhydrite and organicmaterial, between gypsum and organic material,or between halite of different colours.
In both basins, the describing authors, forexample Udden (1924) and Anderson & Kirk-
Fig. 8. Map showing the positions of 20 localities from which Mesozoic and Cainozoic non-glacialvarves have been described. The numbers refer to Table II, and may be related to that Tableas follows: Pleistocene—open circle; Tertiary—solid triangle; Cretaceous—solid rectangle;Jurassic—solid circle. It is proper to explain the omission of Australia from this map aswell as from Figures 7 and 9; so far, the only Phanerozoic varved rocks described fromAustralia (e.g. Banks et ah, 1955; Ranford, 1960; Rattigan, 1967) have a glacial association.The concentration of examples in North America and Europe both here and in Figures 7and 9 may confidently be regarded as an index of relative intensity of geological study,rather than one of relative varve abundance.
the extent that it is unreasonable not to acceptthis interpretation of their origin. But a feware not, and among these attention is drawnespecially to the Permian examples. These arethe laminated anhydrites from Texas and NewMexico, and from Germany and across toBritain. In both basins, the Delaware Basin inAmerica and the Zechstein Basin in Europe,thin and regular laminae with sufficient irregu-larities to allow confident basin-wide correla-
land (1960) in America, and Richter-Bern-burg (1957, 1958) and Stewart (1954) inEurope, have accepted that these laminae areannual. But there is a difference from pre-vious arguments here in that there are noexact modern analogues, and the logic of theargument is one step farther removed thanbefore: it is that their geometry is so similarto that of varves from the stratigraphic recordwhich exactly resemble presently accumulating
Journal of the Geological Society of Australia, Vol. 19, Pt. 3, pp. 287-311, Pis. 13-18, November, 1972.
Dow
nloa
ded
by [
Uni
vers
ity o
f W
este
rn O
ntar
io]
at 0
7:46
17
Nov
embe
r 20
14

304 A. F. TRENDALL
Fig. 9. Map showing the positions of 17 localities from which Palaeozoic non-glacial varves havebeen described. The numbers refer to Table II, and may be related to that Table as follows:Permian—solid rectangle; Carboniferous—solid triangle; Devonian—open circle; Silurian—small solid circle.
ones, that their identity as such is acceptable.*And if these are accepted there is no reason,other than chemical, to exclude microbands iniron formations. Since neither has an exactmodern analogue the exclusion seems irrational.
It may be supposed that all these instancesof varves should have been mentioned before-hand, and used as an immediate argument forthe similar interpretation of microbands. Thiswas carefully avoided, since all that any of thedescribing authors was able to do to provevarvity was to draw modern comparisons. Ifthe annual deposition of microbands is arguedby modern comparison, it does not then helpthe argument at all that the same reasoninghas already been used for supposed varves inDevonian, or Jurassic, rocks. The previousacceptance by many authors of an argumentdoes not guarantee its validity, and it pays tokeep the fact in mind by asking, about anysequence of laminae, not 'How are theselaminae interpreted?', but 'What is the evidencefor the interpretation of these laminae?'.
If we do accept laminated evaporites asvarved, and look at the distribution of allvarves in the Phanerozoic, there seem to beconcentrations in the Quaternary, Miocene,Jurassic, Permian, Carboniferous and Devo-nian, and corresponding paucities in the Creta-ceous, Triassic and Lower Palaeozoic. Thisirregularity of distribution is highly speculativefrom the limited data available, and I believeit is important that varves should be morespecifically sought and studied by strati-graphers and sedimentologists. If it exists itmay be related either to a variation in timeof environments able to receive and preservean imprint of the year or to real variations intime both of the differential intensity of ex-pression of the seasons in the surface environ-ment, and of a primary differential intensity oftheir external control. So how about the fifthof my earlier questions: what evidence is therefor the secular stability, or otherwise, of thevarious orbital factors which presently control
* Since the delivery of this Address Anderson et al. (1972) have shown that the varve sequenceof the Delaware Basin persisted for some 260,000 years during which a great variety of differentcouplets define the varvity. Their work is strong linking support for the varve origin of laminatedevaporites.
Dow
nloa
ded
by [
Uni
vers
ity o
f W
este
rn O
ntar
io]
at 0
7:46
17
Nov
embe
r 20
14

REVOLUTION IN EARTH HISTORY 305
the differing environmental expressions of theyear on the Earth's surface?
THE CONTROLS OF INSOLATION?
The Earth (or more correctly the barycentreof the Earth-Moon pair) revolves annually ina Keplerian ellipse around the Sun, whichoccupies one focus. The Earth also rotatesdaily about an axis inclined at about 66i de-grees to the plane of the ellipse, and, in thecourse of a year, the direction towards whichthe axis is tilted over remains essentially con-stant and in a fixed relationship to the majorand minor axes of the ellipse. The three para-meters of this system which jointly define andcontrol the intensities of the seasons are:—
1. the eccentricity of the ellipse2. the inclination of the rotational axis,
usually called the obliquity of the eclip-tic, and
3. The direction of its inclination relativeto the axes of the ellipse, called thelongitude of the perihelion.
The simplest way to visualise the effects ofpossible variations of these on the seasons isto start with a circular orbit (as it was 525,000years ago: van Woerkom, 1953) and no obli-quity. There is then no surface expression ofthe year; the poles are permanently, evenly,and extremely cold and the equator per-manently, evenly, and extremely hot: theclimatic contrasts between latitudes would bevery much greater than they are now.
If the circular orbit is now changed to anelliptical one there arises an annual variationof insolation which occurs simultaneously inboth hemispheres as the Earth's distance fromthe sun increases and decreases. If, on theother hand, you maintain a circular orbit buttilt the rotational axis slightly you do twosimultaneous things: you spread total annualinsolation steadily more evenly between thevarious latitudes, but you spread it steadilyless evenly through the year, and the seasonsso created are now opposed in the northernand southern hemispheres. The third factor,the longitude of the perihelion, only exists ifeccentricity and obliquity both exist, and itseffect is to control which hemisphere receivesrelatively more insolation during the summer,and which relatively more during its winter.
There is nothing new in this information,nor in the fact that, by applying the principlesof celestial mechanics to the observed orbitalcharacteristics not only of the Earth-Moonpair but of all other planets, it is possible to
compute regular changes of these factors,specifically:—
1. Eccentricity varies over a periodvariously reported between 92,000 or95,000 years
2. Obliquity varies about 2H and 244 de-grees with a period of about 40,900years
3. The longitude of the perihelion variesover an average period of about 21,000years, called the precession of theequinoxes.
Nor should it be news that, although thesecomputations, with an accuracy remarkablyclose to that presently accepted, were pub-lished almost a century ago by Stockwell(1873), it was not until nearly 50 years laterthat Milankovitch (1920) adapted them forgeological application, by using them to com-pute secular variations in annual receipt ofinsolation at specific latitudes over the last600,000 years; and Koppen & Wegener (1924)were thus enabled to correlate his results withthe four classical peaks of Pleistocene glacia-tion. The battle that has raged in Pleistocenegeology since then to determine just where theMilankovitch curves fit into the Pleistocenetime-scale (e.g. Ericson et ah, 1961, 1963,1964; Emiliani, 1955, 1964, 1966), althoughone of the most interesting areas of currentgeology, is one which does not at present con-cern us.
REVOLUTION IN EARTH HISTORYWhat does concern me is that it seems to be
much less widely appreciated that the accuracyof the astronomical observations on whichthese cyclicities are based is such that theirextrapolation beyond 1,000,000 years is mean-ingless. Celestial mechanics appears to havenothing useful to say about the possible limitsof eccentricity and obliquity at a greaterdistance of time, or in other words throughmost of geological time. Two planets, Marsand Saturn, show a similar order of obliquityto that of Earth, but outside the supposedPleistocene limits, at 25° 12' and 26°45', whileone, Uranus is usually given as 98°, since it,alone among the planets, rotates clockwise.There is apparently nowhere in modern astro-nomical literature any detailed theory of thedevelopment of planetary rotational obliquity,and it seems remarkable to me that, supposingthe solar system to be about 4,500 m.y. old,after 2,500 m.y. the Earth possessed a rota-tional obliquity fixed within 3° (the Pleisto-cene limits) for the next 2,000 million; this
Journal of the Geological Society of Australia, Vol. 19, Pt 3, pp. 287-311, Pis. 13-18, November, 1972.
Dow
nloa
ded
by [
Uni
vers
ity o
f W
este
rn O
ntar
io]
at 0
7:46
17
Nov
embe
r 20
14

306 A. F. TRENDALLis the implied assumption if interpretationsof the Hamersley Basin environment are to belimited to models embodying rotational obli-quity of the Earth close to that existing now.
I suggest that a useful contribution togeology now would be a systematic programmeof computer-modelling of insolation patternsfor a range of Earth's orbital parameters farbeyond those normally accepted, particularlyin respect to obliquity, and that paleoclimato-logy should accept a less restricted range ofclimatic zonation possibilities. I make no claimthat the apparently irregular distribution ofvarvity will be explained in this way, but I doput it forward as a fruitful line of research.
This suggestion is not new. Climatic varia-tions were ascribed to varying obliquity asearly as 1686, by Robert Hooke, and duringthe nineteenth century other orbital parameterswere correlated with paleoclimatic variationsby a number of persons (Schwarzbach, 1963).It may be of particular present relevance torefer to one such, published exactly a centuryago, by W. B. Walker (1871). Walker's thesisis unusual. In brief he attempted to show thatall coal deposits of the world were formedfrom vegetation swept together by floods atintervals of 10,000 years, and integrated thisidea with one that the highest civilisationsevolved in non-carboniferous areas, while inthe coal-bearing areas, subject to these periodicinundations, mankind last emerged frombarbarism.
In case this idea be ill received in the local(Queensland) context I quote from p. 123' . . . the west coast of Australia is clothedwith an impenetrable growth of marsh vegeta-tion accompanied by a climate greatly re-sembling the most fittest for the growth ofcoal . . . yet no coal has been found hithertoin that vast island-continent, save in NewSouth Wales, if we except the unworkabledriblets possessed by the colony of Victoria onthe one hand, and Queensland on theother
His work is not least remarkable for itsfrontispiece (Plate 18), which represents onesuch deluge in a style that most currentscientific editors would find unacceptable. Butin any case, the licence allowed to Walker inpresenting his thesis didn't seem to help much,for there is no sign in later literature that heconvinced a single reader of the validity ofhis views.
There are other problems in formulating ageneral approach to questions of multi-yearcyclicity that I have not touched on at all for
lack of time, and I have deliberately avoided,several references in the literature where longcycles may credibly be attributed to externalcontrol, but with which annual laminae arenot associated (e.g. Barrell, 1917; Fischer,1966; Gilbert, 1895; Schneider, 1964). Thequestion of secular variation in the lunar orbit,as forecast by tidal friction calculations andconfirmed by the daily growth lines of fossilcorals and other organisms, is an importantone (Runcorn, 1970); and there is a wholefield of its own in what one may group assemi-historical studies of climatic variations,in dendroclimatology, glacier movements andso forth, particularly as evidence for or againstthe possible preservation in the geological re-cord of the 23-year double cycle of sunspots,which Bradley (1929) believes to be presentin the Green River varves.
At present I can only offer this concludinglist of main points which I have been able tomake.
1. There are three distinct periodicities ofstratification in Hamersley Group iron forma-tions:
(i) very regular millimetre-scale micro-banding
(ii) the normally understood banding ofthe iron formations, here calledmesobanding, and argued to reflecta 25-year periodicity,
(iii) a longer-term periodicity, of between600 and 1,750 years, expressed as analternation of chert types.
2. Microbands are believed to be primaryand to imply some regular primary control oftheir chemical deposition.
3. There are two present regular rhythmsin the local receipt of insolation on the Earth'ssurface—the day and the year—which are theexpressions of the Earth's rotation and revolu-tion respectively.
4. These two rhythms appear also in thelocal surface environment, despite variousbuffering agencies, which modify their regu-larity.
5. The year is not uncommonly expressedin current sedimentation; the day is very rarelypreserved. Expressions of the year normallyinvolve thin alternations of clastic and organicmaterial.
6. Precisely similar laminae occur in thestratigraphic record, and may reasonably beaccepted as varves.
7. Other regularly laminated deposits, inevaporites, although lacking exact modernanalogues, should not be discounted as varves
Dow
nloa
ded
by [
Uni
vers
ity o
f W
este
rn O
ntar
io]
at 0
7:46
17
Nov
embe
r 20
14

REVOLUTION IN EARTH HISTORY 307
for this reason, since their lamination is closelysimilar in geometry to other varves, and theinterpretation is a commonsense one.
8. Microbands in iron formation are soclose to these evaporite varves in everythingbut chemical composition that their commonorigin can hardly be doubted.
9. When records of all Phanerozoic varvesare assembled from the literature, there appearto be more abundant records from the Quater-nary, Miocene, Jurassic, Permian, Carboni-ferous and Devonian.
10. Different abundances of annual recordsin stratigraphy may reflect real difference inintensity of expression of the year.
11. Intensities of seasonal expression arecontrolled jointly by eccentricity of the Earth'sorbital ellipse, obliquity of the rotational axis,and by the direction of its tilt in relation tothe axes of the ellipse.
12. The secular stabilities of these controlsof insolation are not known sufficiently foruseful extrapolation to stratigraphy: on thecontrary, stratigraphy can and should supplyinformation on this to paleogeophysics.
13. No periodicities of the year are nowknown with periods and clarity of definitioncomparable with those of the HamersleyGroup iron formations.
14. Variations in obliquity of the rotationalaxis are a possible control which has both beenneglected for the last 100 years and which isamenable to modern computer modelling.
And in conclusion, continued attention tothe history of the Earth's revolution aroundthe Sun—or, as I have entitled the topic inthis Address, 'Revolution in Earth History'—since it left its mark so indelibly on theHamersley Group, is a topic to which simpleand patient observations of the rocks still hasmuch to contribute.
ACKNOWLEDGMENTSI am grateful to many geologists, spread
throughout the world and too numerous toname individually, who have helped me,directly as co-workers and in many ancillaryways, with the various topics dealt with inthis Address. Special mention must be made ofmy colleagues in the Geological Survey ofWestern Australia, and in particular to itsDirector, to whom are also due thanks for hisapproval to incorporate here the work onwhich the earlier part is based. My particularthanks go finally to the Winston ChurchillMemorial Trust of Australia for the supportwhich enabled me in 1969 to pursue the in-quiries which are traced in the latter part.
REFERENCES
ANDERSON, R. Y., 1961: Solar-terrestrial climaticpatterns in varved sediments. Ann. N.Y. Acad.Sci., 95, pp. 424-439.
, 1966: Varve calibration of stratification.Bull. Kans. Univ. geol. Surv., 169(1), pp.1-20.
, DEAN, W. E., KIRKLAND, D. W., & SNIDER,H. I., 1972: Permian Castile varved evapo-rite sequence, West Texas and New Mexico.Bull. geol. Soc. Am., 83, pp. 59-86.
, & KIRKLAND, D. W., 1960: Origin, varves,and cycles of Jurassic Todilto Formation,New Mexico. Bull. Am. Ass. Petrol. Geol.,44, pp. 37-52.
, & , 1966: Intrabasin varve cor-relation. Bull. geol. Soc. Am., 77, pp. 241-256.
, & KOOPMANS, L. H., 1969: Statisticalanalysis of the Rita Blanca varve time-series;in Paleoecology of an early Pleistocene lakeon the High Plains of Texas. Mem. geol.Soc. Am., 113, pp. 59-75.
BANKS, M. R., LOVEDAY, J. L., & SCOTT, D. L.,1955: Permian varves from Wyngard, Tas-mania. Pap. Proc. R. Soc. Tasm., 89, pp. 203-218.
BARRELL, J., 1917: Rhythms and the measure-ment of geologic time. Bull. geol. Soc. Am.,28, pp. 745-904.
BENTOR, Y. K., 1968: Salt deposits of the DeadSea region. Spec. Pap. geol. Soc. Am., 88,pp. 139-156.
BIBOLINI, A., 1925: Contributions a 1'étude de lagéologie de l'Afrique Orientale Italienne. Int.geol. Congr., 13, pp. 807-808.
BOGOLUBOW, N., 1905: Zur geologischen Ges-chichte des Gouvernments Kaluga in derGlazialperiods. Ann. geol. miner. Russ., 7(5),pp. 115-119.
BRADLEY, W. H., 1929: The varves and climateof the Green River epoch. Prof. Pap. U.S.geol. Surv., 158, pp. 87-110.
, 1931: Non-glacial marine varves. Am.J. Sci., 22, pp. 318-330.
, 1937: Non-glacial varves with selectedbibliography. Rep. nat. Res. Coun., Wash.App.A., Report of Committee on GeologicTime, pp. 32-42.
BRAMLETTE, M. N., 1946: The Monterey Forma-tion of California and the origin of its sili-ceous rocks. Prof. Pap. US. geol. Surv., 212,pp. 1-57.
Journal of the Geological Society of Australia, Vol. 19, Pt. 3, pp. 287-311, Pis. 13-18, November, 1972.
Dow
nloa
ded
by [
Uni
vers
ity o
f W
este
rn O
ntar
io]
at 0
7:46
17
Nov
embe
r 20
14

308 A. F. TRENDALL
BUDDEMEIER, R. W., 1970: A radiocarbon studyof the varved marine sediments of Saanichinlet, British Columbia (Abstract). Diss.Abstr. Int., 30(11), p. 5107B.
CALVERT, S. E., 1966: Origin of diatom-rich,varved sediments from the Gulf of Califor-nia. J. Geol., 74(5), pp. 546-565.
CECH, C. D., 1878: Die Kochsalzgewinnung inden russischen Steppenseen. Jb. K.-k. geolReichsanst. Wien, 28, p. 622 and p. 626.
COLOM, G., 1967: Les lacs du burdigalien supé-rieur de l'île de Majorque (Baleares) et lerôle des melosires (diatomees) dans la for-mation de leurs varves. C. r. Somm. Seanc.Soc. geol. Fr., 7, p. 321.
COMPSTON, W., & Arriens, P. A., 1968: ThePrecambrian geochronology of Australia.Can. J. Earth Sci., 5, pp. 561-583.
CULLEN, D. L, 1963: Tectonic implications ofbanded ironstone formations. J. sedim.Petrol., 33, pp. 387-392.
DANIELS, J. L., 1970: Wyloo, Western Australia.1:250,000 geol. Series explan. Notes, geol.Surv. West. Aust.
, & MACLEOD, W. N., 1965: Newman,Western Australia. 1:250,000 geol. Seriesexplan. Notes, geol. Surv. West. Aust.
D E GEER, G., 1912: A geochronology of the last12,000 years. Int. geol. Congr., 11, pp. 241-253.
D E LAETER, J. R., & BLOCKLEY, J. G., 1972:Granite ages within the Archaean PilbaraBlock, Western Australia. J. geol. Soc. Aust.,19, pp. 363-370.
D E LA HUNTY, L. E., 1965: Mount Bruce,Western Australia. 1:250,000 geol. Seriesexplan. Notes, geol. Surv. West. Aust.
D E RAFF, J. F. M., READING, H. G. & WALKER,R. G., 1965: Cyclic sedimentation in theLower Westphalian of north Devon, Eng-land. Sedimentology, 4, pp. 1-52.
EMILIANI, C., 1965: Pleistocene temperatures. J.Geol., 63, pp. 538-578.
, 1964: Paleotemperature analysis of Carib-bean cores. Bull. geol. Soc. Am., 75, pp.129-143.
, 1966: Paleotemperature analysis of coresand a generalised temperature curve. J. Geol.,74, pp. 100-126.
ERICSON, D. B., EWING, M., WOLLIN, G., &HEEZEN, B. C., 1961: Atlantic deep-sea sedi-ment cores. Bull. geol. Soc. Am., 72, pp.193-285.
ERICSON, D. B., EWING, M., & WOLLIN, G., 1963:Pliocene-Pleistocene boundary in deep seasediments. Science, 139, pp. 727-737.
• , , & , 1964: The Pleistoceneepoch in deep sea sediments. Science, 146,pp. 723-732.
EUGSTER, H. P., 1969: Inorganic bedded chertsfrom the Magadi area, Kenya. Contr. Miner.Petrol., 22, pp. 1-32.
FISCHER, A. G., 1966: The Lofer cyclothem of theAlpine Triassic. Bull. Kans. Univ. geol. Surv.,169, pp. 107-149.
GEISENHAGEN, M., 1925: Kieselguhr als Zeitmassfür eine Interglazialzeit. Zeitschr. Gletscher-kunde, 14, pp. 1-10.
GILBERT, G. K., 1895: Sedimentary measurementof Cretaceous time. /. Geol, 3, pp. 121-127.
GRANAR, L., 1956: Dating of recent fluvial sedi-ments from the estuary of the AngermanRiver (the period 1850-1950 A.D.). Geol.För, Stockh. Forh., 78, pp. 654-658.
GRIPPENBERG, S., 1934: A study of the sedimentsof the North Baltic and adjoining seas.Fennia, 60(3), pp. 1-231.
GROSS, M. G., GUCLUER, S. M., CREAGER, J. S.,& DAWSON, W. A., 1963: Varved marinesediments in a stagnant fjord. Science, 141,pp. 918-919.
HEIM, A., 1909: Einige Gedanken über Schich-tung. Vjsch. naturf. Ges. Zurich, 54, pp. 330-342.
HULSEMAN, J., & EMERY, K. O., 1961: Stratifica-tion in Recent sediments of Santa BarbaraBasin as controlled by organisms and watercharacter. J. Geol., 69, pp. 279-290.
JACKSON, T. A., 1965: Power spectrum analysisof two 'varved' argillites in the HuronianCobalt Series (Precambrian) of Canada. J.sedim. Petrol., 35, pp. 877-866.
JAYET, A., 1959: Les argiles feuilletees glacio-lacustres de Ferney (department de l'Ain,France). Arch. Sci. phys. nat., Geneva, 11(4),pp. 556-565.
JOHNSTON, W. A., 1922: Sedimentation in LakeLouise, Alberta, Canada. Am. J. Sci., 4, pp.376-386.
JOURNAUX, A., 1952: Depot actuel des varveslacustres en Normandie. C. r. hebd. Seanc.Acad. Sci., Paris, 235, pp. 1669-1772.
KÖPPEN, A., & WEGENER, A., 1924: Die Klimateder geologischen Vorzeit. Borntraeger, Berlin.
KORN, H., 1938: Schichtung und absolute Zeit.Neues Jb. Miner. Geol. Paläont., 74A, pp.50-188.
, & MARTIN, H., 1951: Cyclic sedimentationin varved sediments of the Nama system inSouth-West Africa. Trans. geol. Soc. S. Afr.,54, p. 65-67.
KRIEWALDT, M. J. B., 1964: Dampier and BarrrowIsland, Western Australia. 1:250,000 geolSeries explan. Notes, geol. Surv. West Aust.
, & RYAN, G. R., 1967: Pyramid, WesternAustralia. 1:250,000 geol. Series explan.Notes, geol. Surv. West Aust.
KUZNETSOV, J., 1928: Conditions of formation ofbituminous limestone in Balkarai. BullComm. geol. Leningrad, 47(8), pp. 930-931.
LAMAR, D. L., MCGANN-LAMAR, J. V., & MERI-FIELD, P. M., 1970: Age and origin of earth-moon system; Chapter 6 in Runcorn, S. K.(Ed.), Paleogeophysics. Academic Press,London & New York.
Dow
nloa
ded
by [
Uni
vers
ity o
f W
este
rn O
ntar
io]
at 0
7:46
17
Nov
embe
r 20
14

REVOLUTION IN EARTH HISTORY 309
LAPORTE, L. F., 1967: Carbonate deposition nearmean sea level and resultant facies mosaic:Manlius Formation (L. Devonian) of NewYork State. Bull. Am. Ass. Petrol. Geol., 51,pp. 73-101.
MACLEOD, W. N., 1966: The geology and irondeposits of the Hamersley Range area,Western Australia. Bull. geol. Surv. West.Aust., 117.
, & D E LA HUNTY, L. E., 1966: RoyHill, Western Australia. 1:250,000 geol.Series explan. Notes, geol. Surv. West. Aust.
MARR, J. E., 1928: A possible chronometric scalefor the graptolite-bearing strata. Palaeobio-logica, 1, pp. 161-162.
MAWSON, D., 1949: The late Precambrian ice-age and glacial record of the BibliandoDome. J. Proc. R. Soc. NS.W., 82, pp. 150-174.
MILANKOVITCH, M., 1920: Theorie mathematiquedes phénomènes thermiques produits par laradiation solaire. Gauthier-Villars, Paris.
MOORE, H. B., 1931: The muds of the Clyde seaarea—III. J. mar. biol. Assoc. U.K., 17, pp.325-358.
NIPKOW, F., 1920: Vorläufige Mitteilungen überUntersuchungen des Schlammabsatzes imZiirichsee. Schweiz. Z. Hydrol., 1, pp. 1-122.
, 1928: Uber das Verhalten der Skeletteplanktischer Kieselalgen im geschichtetenTiefenschlamm des Zurich und Baldeggersee.Rev. Hydrobiol., 4, pp. 71-120.
OGNIBEN, L., 1957: Petrografia delta serie solfi-fera siciliana e considerazioni geologicherelative. Memorie descr. Carta geol. Ital., 33.
OLAUSSON, E., & OLSSON, I. U., 1969: Varvestratigraphy in a core from the gulf of Aden.Palaeogeogr. Palaeclimatol. Palaeocol., 6, pp.87-103.
PERFILIEV, B. W., 1927: Ten Years of SovietScience. Moscow.
PORATH, H., 1967: Palaeomagnetism and the ageof Australian hematite ore bodies. Earthplanet. Sci., Lett., 2, pp. 409-414.
RANFORD, L. C., 1960: Geology of part of theWooderarrung River, Mullewa, Western Aus-tralia. Hons. Thesis, Univ. West. Aust. [un-published].
RATTIGAN, J. H., 1967: Depositional, soft sedi-ment and post-consolidation structures in aPalaeozoic aqueoglacial sequence. J. geol.Soc. Aust., 14, pp. 5-18.
RAYNER, D. H., 1963: The Achanarras Lime-stone of the Middle Old Red Sandstone,Caithness, Scotland. Proc. Yorks. geol. Soc.,34, pp. 117-138.
RICHTER-BERNBURG, G., 1957: Isochrone Warvenim Anhydrite des Zechstein 2. Geol. Jb., 74,pp. 601-610.
, 1958: Die Korrelierung isochroner War-ven im Anhydrite des Zechstein 2. (ZweiterBeitrag). Geol. Jb., 75, pp. 629-646.
RIVEROLL, D. D., & JONES, B. C., 1954: Varvesand foraminifera of a portion of the upperPuente formation (Upper Miocene), Puente,California. J. Paleont., 28, pp. 121-131.
RUBEY, W. W., 1930: Lithologic studies of fine-grained Upper Cretaceous sedimentary rocksof the Black Hills region. Prof. Pap. U.S.geol. Surv., 162, pp. 40-53.
RUNCORN, S. K., 1970: Palaeontological measure-ments of the changes in the rotation rates ofearth and moon and of the rate of retreatof the moon from the earth; Chapter 3 inRuncorn, S.K. (Ed.), Paleogeophysics. Aca-demic Press, London & New York.
RYAN, G. R., 1966: Roebourne, Western Aus-tralia. 1:250,000 geol. Series explan. Notes,geol. Surv. West Aust.
SCHNEIDER, F. K., 1964: Erscheinungsbild undEntstehung der rhythmischen Bankung deraltkretazischen Tongesteine Nordwestfalensund der Braunschweiger Bucht. Fortschr.Geol. Rheinld. Westf., 7, pp. 353-382.
SCHOSTAKOWITSCH, V. B., 1934: Mud deposits inlakes and the periodic fluctuation phenomenain nature (in Russian). Zap. ross. gidrol.Inst., 13, pp. 95-138.
, 1936: Geschichtete Bodenablgerungender Seen als Klima-annalen. Meta. Z., 53,pp. 176-182.
SCHWARZBACH, M., 1963: Climates of the Past.Van Nostrand, London.
SEIBOLD, E., 1958: Jahreslagen in Sedimenten dermittleren Adria. Geol. Rdsch., 47, pp. 100-117.
SHACKLETON, N. J., & TURNER, C., 1967: Correla-tion between marine and terrestrial Pleisto-cene successions. Nature, Lond., 216, pp.1079-1082.
SKOCEK, V., 1968: Svrchnokarbonske varvity vestredoceskych kamenouhelnych panvich. Vest.ustred. Ust. geol., Praha, 43(2), pp. 113-120.
SPEARS, D., 1969: A laminated marine shale ofCarboniferous age from Yorkshire, England.J. sedim. Petrol., 39, pp. 106-112.
SPENCER, A. M., 1971: Late pre-Cambrian glacia-tion in Scotland. Mem. geol. Soc. Lond., 6.
STAMP, L. D., 1925: Seasonal rhythm in the Ter-tiary sediments of Burma. Geol. Mag., 62,pp. 515-528.
STEWART, F. H., 1954: Permian evaporites andassociated rocks in Texas and New Mexicocompared with those of northern England.Proc. Yorks. geol. Soc., 29, pp. 185-235.
STOCKWELL, J. N., 1873: Memoir on the secularvariations of the eight principal planets.Smithson Contr. Knowl., 18.
STROM, K. M., 1936: Land-locked waters.Norske vidensk. akad. Oslo, Mat. Nat. Kl., 7,pp. 1-85.
TARASOV, G. A., 1968: Varved clay deposits ofthe Kil'din Strait, Barents Sea. Dokl. Akad.Nauk. SSSR, Earth. Sci. Sect., 179, pp. 171-172.
Journal of the Geological Society of Australia, Vol. 19, Pt. 3, pp. 287-311, Pis. 13-18, November, 1972.
Dow
nloa
ded
by [
Uni
vers
ity o
f W
este
rn O
ntar
io]
at 0
7:46
17
Nov
embe
r 20
14
310 A. F. TRENDALL
TIPPETT, R., 1964: An investigation into thenature of the layering of deep-water sedi-ments in two eastern Ontario lakes. Can. J.Bot., 42, pp. 1693-1709.
TRENDALL, A. F., 1966: Second progress reporton the Brockman Iron Formation in the Wit-tenoom-Yampire area. A. Prog. Rep. geol.Surv. West. Aust., 1965, pp. 55-65.
, 1968: Three great basins of Precambrianbanded iron formation deposition: a system-atic comparison. Bull. geol. Soc. Am., 79,pp. 1527-1544.
, 1970: Iron formations of the HamersleyGroup of Western Australia: type examplesof varved Precambrian evaporites. Paper No.SC/CONF 46/23, International Symposiumon the Geology and Genesis of PrecambrianIron/Manganese Formations and Ore De-posits, Kiev [unpublished].
, & BLOCKLEY, J. G., 1968: Stratigraphyof the Dales Gorge Member of the BrockmanIron Formation, in the Precambrian Hamers-ley Group of Western Australia. A. Prog.Rep. geol. Surv. West. Aust., 1967, pp. 48-53.
, & , 1970: The iron formationsof the Precambrian Hamersley Group,Western Australia, with special reference tothe associated crocidolite. Bull. geol. Surv.West. Aust., 119.
UDDEN, J. A., 1924: Laminated anhydrite inTexas. Bull. geol. Soc. Am., 35, pp. 347-354.
VAN WOERKOM, A. J. J., 1953: The astronomicaltheory of climatic changes; Chapter 11 inShapley, H. (Ed.), Climatic Change. Har-vard University Press, Cambridge, Massa-chusetts.
VISSER, J. N. J., 1971: The deposition of theGriquatown Glacial Member in the Trans-vaal Supergroup. Trans, geol. Soc. S. Afr.,74, pp. 187-199.
WALKER, W. B., 1871: Cyclical Deluges—anExplication of the Chief Geological Pheno-mena of the Globe, by Proofs of PeriodicalChanges of the Earth's Axis. W. J. Johnson,London.
WELTEN, M., 1944: Pollenanalytische, strati-graphische und geochronologische Unter-suchungen aus dem Faulenseemoos bei Spiez.Veroff. geobot. Inst. Zurich, 21, pp. 1-201.
WEST, I. M., BRANDON, A., & SMITH, M., 1968: Atidal flat evaporitic facies in the Visean ofIreland. J. sedim. Petrol., 38, pp. 1079-1093.
WHITTAKER, E. G., 1922: Bottom deposits ofMcKay Lake, Ottawa. Proc. Trans. R. Soc.Can., 16, pp. 141-156.
WILLIAMS, I. R., 1968: Yarraloola, Western Aus-tralia. 1:250,000 geol. Series explan. Notes,geol. Surv. West Aust.
WOLANSKI, D., 1933: Untersuchungen über dieSedimentations verhältmisse des SchwarzenMeers und ihre Anwendung auf das nord-kaukasische Erdölgebiet. Geol. Rdsch., 24(6),pp. 403-410.
A. F. Trendall,Geological Survey of Western Australia,Mineral House,66 Adelaide Terrace,Perth,Western Australia 6000.
Dow
nloa
ded
by [
Uni
vers
ity o
f W
este
rn O
ntar
io]
at 0
7:46
17
Nov
embe
r 20
14

REVOLUTION IN EARTH HISTORY 311
EXPLANATION OF PLATES
PLATE 13
View of the eastern side of Wittenoom Gorge immediately north of the old Wittenoom mine buildings,showing the macrobands of the Dales Gorge Member of the Brockman Iron Formation. The base ofthe cliff is at about the mid-point of BIF 0, and the S macroband sequence up the cliff is marked. Asmay be expected from Figure 4 the groups S6-7, S8-9, and S10-12 tend to merge into continuous grassyslopes, which are marked.
PLATE 14
Typically mesobanded iron formation of the Dales Gorge Member of the Brockman Iron Formation, asexpressed in drill core of the type section. For this Plate, in which the stratigraphy runs continuouslyupwards from lower left to upper right, part of the type section illustrated completely by Tren-dall & Blockley (1968) was rephotographed at a larger scale; the type section footages are marked andsubdivided in tenths of a foot. The general alternation between pale chert and darker chert-matrix andmagnetite is apparent. Microbanding is most clearly evident in the chert mesobands at 33.8-33.9,34.2-34.4 and 35.7-35.8 feet. Chert pods are well displayed between 33.0 and 33.1 feet.
PLATE 15
Various forms of microband expression in chert mesobands of the Dales Gorge Member. The blackscale bar represents 1 mm in all photographs. All the examples illustrated are from drill core atWittenoom Gorge. A. Hematite-defined microbands at about 77.1 feet type section equivalent.B. Hematite-defined microbands in a chert at 77.7 feet type section equivalent. Each dark part of themicroband pair consists of a cluster of discontinuous streaks of fine hematite. C. Ankerite-definedmicrobands in a chert equivalent to 80.1 feet on the type section. D. Siderite-defined microbands ina chert mesoband in the S13 macroband, equivalent to 326.0 feet on the type section. This type ofmicrobanding is typical of chert mesobands within the shale macrobands, in that it is less even andregular than that from chert within the banded iron formation.
PLATE 16
Photographs of thin sections of the same chert mesoband, at 36.65-36.85 feet on the type section(Plate 14), from two locations 296 km apart: A. Point lames (20°58' South; 116°10' East) and B.Dales Gorge (22°28' South; 118°33' East). The clear general correlation between dark discontinuitiesof the microbanding, representing compressed groups of microbands is indicated by pecked lines, andthe same discontinuities are also evident macroscopically in the type section core in Plate 14. Thesolid lines mark particular correlations of single microbands or groups that have some distinctivecharacteristic, such as greater than average thickness, or exceptional density.
PLATE 17
A. Thin section showing the lateral relationship of microbanding within a chert pod to the adjacentchert-matrix. This example, from the Weeli Wolli Formation, is typical also of chert pods of theDales Gorge Member. B. The expression of the Knox Cyclothem in the loffre Member of the Brock-man Iron Formation, at the base of the western wall of Joffre Gorge about 2.4 km north of JoffreGorge. The pencil is 11 cm long. White chert mesobands (internally microbanded) are separatedat 8 cm intervals by alternations of chert-matrix and red chert mesobands (also microbanded): aspectacular natural record of a regular astronomical cycle, whose exact nature is uncertain, possiblybetween 600 and 1,750 years in length. C. Rather irregular and thin microbands in striped facies ofthe Weeli Wolli Formation, developed equally in parts of both a light (upper) and a dark (lower)stripe.
PLATE 18
'Cyclical deluges'. Frontispiece from the monograph of that title by W. B. Walker, published byW. J. Johnson, London, 1871.
Journal of the Geological Society of Australia, Vol. 19, Pt. 3, pp. 287-311, Pis. 13-18, November, 1972.
Dow
nloa
ded
by [
Uni
vers
ity o
f W
este
rn O
ntar
io]
at 0
7:46
17
Nov
embe
r 20
14

A. F. TRENDALLPLATE 13
••fej^uvti*^S!4
Journal of the Geological Society of Australia, Vol. 19, Pt. 3, Pis. 13-18, November, 1972
Dow
nloa
ded
by [
Uni
vers
ity o
f W
este
rn O
ntar
io]
at 0
7:46
17
Nov
embe
r 20
14

A. F. TRENDALL PLATE 14
Dow
nloa
ded
by [
Uni
vers
ity o
f W
este
rn O
ntar
io]
at 0
7:46
17
Nov
embe
r 20
14

A. F. TRENDALL PLATE 15
Journal of the Geological Society of Australia, Vol. 19, Pt. 3, Pis. 13-18, November, 1972.
Dow
nloa
ded
by [
Uni
vers
ity o
f W
este
rn O
ntar
io]
at 0
7:46
17
Nov
embe
r 20
14

A. F. TRENDALL PLATE 16
Dow
nloa
ded
by [
Uni
vers
ity o
f W
este
rn O
ntar
io]
at 0
7:46
17
Nov
embe
r 20
14
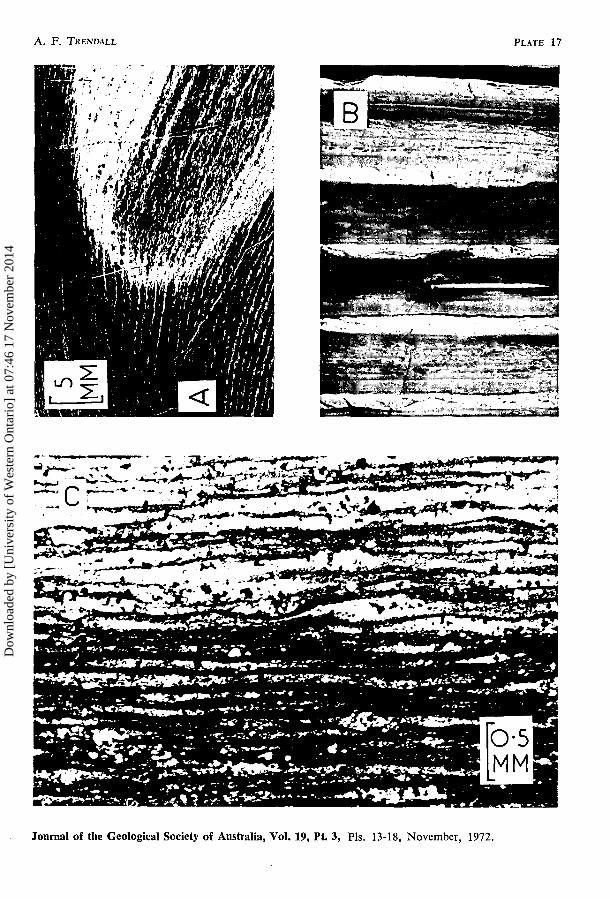
A. F. TRENDALL PLATE 17
Journal of the Geological Society of Australia, Vol. 19, Pt. 3, Pis. 13-18, November, 1972.
Dow
nloa
ded
by [
Uni
vers
ity o
f W
este
rn O
ntar
io]
at 0
7:46
17
Nov
embe
r 20
14

A. F. TRENDALL PLATE 18
IIM -/.
Dow
nloa
ded
by [
Uni
vers
ity o
f W
este
rn O
ntar
io]
at 0
7:46
17
Nov
embe
r 20
14


