Ž .Geoderma 83 1998 83–101
Response of soil solution chemistry to recentdeclines in atmospheric deposition in two forest
ecosystems in Berlin, Germany
Bernd Marschner a,), Andreas Gensior b,1, Uwe Fischer c,2
a Technical UniÕersity Berlin, Institute of Ecology and Biology, Soil Science Dep.,Salzufer 11– 12, 10587 Berlin, Germany
b Humboldt UniÕersity Berlin, Institute of Fundamentals in Plant Production, Resource EcologyDep., InÕalidenstr. 42, 12587 Berlin, Germany
c Bundesalle 89, 12161 Berlin, Germany
Received 3 June 1996; accepted 11 November 1997
Abstract
As part of a long-term monitoring program to study the effects of acid deposition on forestecosystems, throughfall and soil solutions from 50 and 200 cm depth have been collected andanalyzed from 1986 to 1995 in a young pine stand and a mixed pine–oak forest in Berlin. Before1990, atmospheric SO inputs of 1.5–2.1 kmol hay1 ay1 were among the highest reported for4
Western Europe. Between 1990 and 1992 they declined sharply to below 0.7 kmol hay1 ay1 andcontinued to decrease until 1995. Most other elements followed a similar time trend, except formineral-N compounds that decreased by only 30%. The assessment of soil solution reactions tothese changes was complicated by high temporal fluctuations of solute concentrations in responseto soil water content changes. This problem was overcome with a regression model, wheretime-trend corrected Cl concentrations were introduced to account for these fluctuations. The datathen show that in both stands soil solution composition reacts similarly to the changed inputsituation. Due to the concentration reductions of the major anion SO2y in the soil solutions,4
concentrations of most major cations decreased and alkalinity increased. Still, acidity is transferred
) Corresponding author. Tel.: q49-30-31473527; fax: q49-30-31473548; e-mail:[email protected]
1 Tel.: q49-30-6452979; fax: q49-30-6452991.2 Tel.rfax: q49-30-8594090.
0016-7061r98r$19.00 q 1998 Elsevier Science B.V. All rights reserved.Ž .PII S0016-7061 97 00139-0
( )B. Marschner et al.rGeoderma 83 1998 83–10184
to the subsoil, indicating that soil acidification is continuing despite the strongly decreased aciddeposition rates. q 1998 Elsevier Science B.V.
Keywords: deposition rates; time trends; soil water chemistry; soil acidification; forest ecosystem;Germany
1. Introduction
In most regions of Western Europe and North America acid deposition hasŽdeclined gradually since the mid 1970s Driscoll et al., 1989; Hedin et al., 1994;
.Kirchner and Lydersen, 1995; Wesselink et al., 1995 . These changes are mainlydue to reductions in SO emissions through increased use of low-S fuels and the2
installation of filter systems in power plants and industry. However, the declinein ecosystem inputs of the acid anion SO is generally accompanied by the4
Ž .reduced deposition of base cations Hedin et al., 1994 so that changes in netacidity may be small. As a consequence, the base cation status of the soilswould not be expected to improve and soil acidification could actually continue
Ž . Ž .as shown in the review of Wright and Hauhs 1991 . Wesselink et al. 1995modeled the reaction of the soil base saturation to changing deposition scenariosand showed that soils with low pools of base cations are especially sensitive tochanges in deposition rates. Small differences in declining deposition rates ofbase cations and acid anions can determine whether soil acidification continuesor recovery of base cation status occurs, as they demonstrate for two adjacentforest stands with slight differences in deposition rates.
Reduced base cation inputs were also held responsible for the failure ofstreamwater acidity at the Hubbard Brook catchment to respond to a 60%
Ž .decline in SO inputs between 1964 and 1987 Driscoll et al., 1989 . Similar4Ž .observations were made in Norway Kirchner and Lydersen, 1995 and at-
tributed to the severe base cation depletion in earlier years.In the roof experiments of the NITREX project in southwestern Sweden and
central Germany, where irrigation water was adjusted to pre-industrial levels,soil solution NO and SO concentrations declined sharply in the O and E3 4
horizons but SO only showed a gradual decrease in the Bs horizon within the4Ž .first 2–2.5 years Bredemeier et al., 1995; Giesler et al., 1996 . This was
attributed to the release of adsorbed SO in the Bs horizon where pools of4Ž .exchangeable SO apparently had accumulated. Rustad et al. 1996 also4
demonstrated that SO dynamics in the soil solution in response to an artificial4
acidification and subsequent recovery period were delayed due to reversibleadsorption processes.
In contrast to the emission reductions in Western Europe and North America,emissions in Eastern European countries continued to increase until the late
Ž1980s due to growing energy needs and lacking filter technology Umwelt-.bundesamt, 1992; Landesumweltamt Brandenburg, 1995a . In East Germany,
( )B. Marschner et al.rGeoderma 83 1998 83–101 85
the predominant combustion of brown coal also resulted in high emissions ofalkaline dusts so that acid deposition was relatively low despite high SO inputs4Ž .Hofmann and Krauss, 1988; Marschner et al., 1991 . As a consequence of thepolitical and economic changes after 1989, industrial production and energyconsumption in East Germany was greatly reduced within one year, resulting inrapid responses of improved air quality in the former industrial centers and
Ž .leeward regions Landesumweltamt Brandenburg, 1995a .In Berlin where air quality and atmospheric deposition were largely con-
Ž .trolled by these external inputs Marschner et al., 1991 , measurements of bulkdeposition, throughfall and soil solution chemistry are conducted in two forestecosystems since 1986. Based on the 9-year monitoring period until 1995, thedrastic changes in deposition rates at these sites since 1989 are presentedtogether with the respective soil solution data. This paper mainly focuses on thetime scale and magnitude of the soil solution response to these changes andevaluates differences between the two stands.
2. Materials and methods
The investigation area is located about 6 km southwest of the center of Berlinon a glacial till plain in the Grunewald, a forest area of about 3000 ha. Theclimate is continental, with mean annual precipitation of 580 mm with nodistinct seasonality and a mean annual temperature of 8.98C. One study plot is a
Ž . Ž .young Scots pine stand Pinus sylÕestris with few oaks Quercus robur ,planted about 45 years ago. The adjacent other plot is a mixed forest with pinesof about 130 years and oaks of 70–80 years. Both soils are classified as acidicCambic Arenosols with negligible clay content and less than 5% silt. The
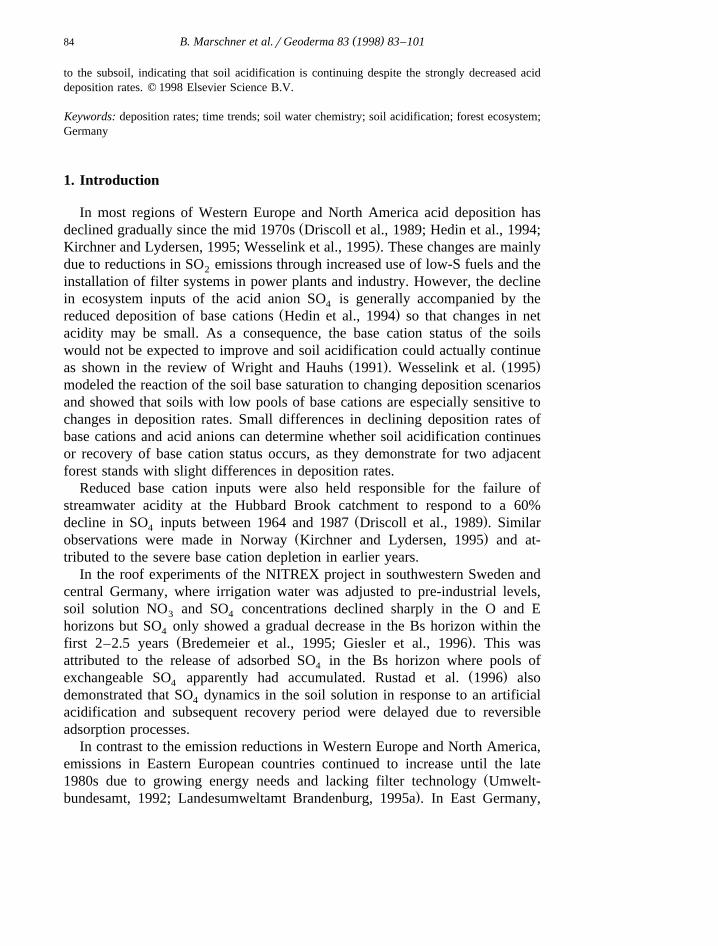
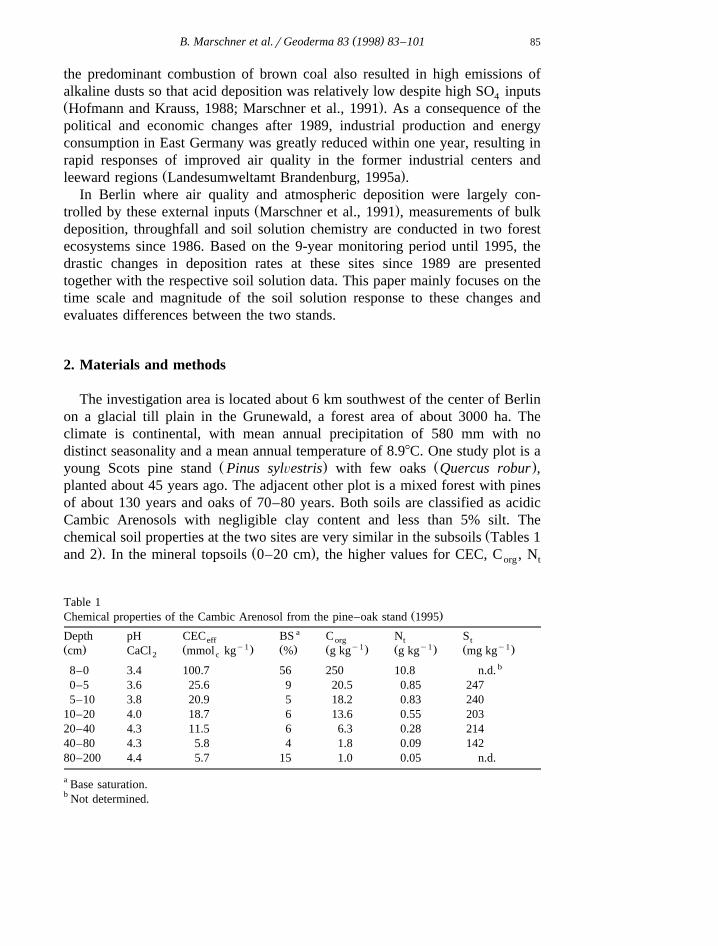
Žchemical soil properties at the two sites are very similar in the subsoils Tables 1. Ž .and 2 . In the mineral topsoils 0–20 cm , the higher values for CEC, C , Norg t
Table 1Ž .Chemical properties of the Cambic Arenosol from the pine–oak stand 1995
aDepth pH CEC BS C N Seff org t ty1 y1 y1 y1Ž . Ž . Ž . Ž . Ž . Ž .cm CaCl mmol kg % g kg g kg mg kg2 c
b8–0 3.4 100.7 56 250 10.8 n.d.0–5 3.6 25.6 9 20.5 0.85 2475–10 3.8 20.9 5 18.2 0.83 240
10–20 4.0 18.7 6 13.6 0.55 20320–40 4.3 11.5 6 6.3 0.28 21440–80 4.3 5.8 4 1.8 0.09 14280–200 4.4 5.7 15 1.0 0.05 n.d.
a Base saturation.b Not determined.
( )B. Marschner et al.rGeoderma 83 1998 83–10186
Table 2Ž .Chemical properties of the Cambic Arenosol from the young pine stand 1995
aDepth pH CEC BS C N Seff org t ty1 y1 y1 y1Ž . Ž . Ž . Ž . Ž . Ž .cm CaCl mmol kg % g kg g kg mg kg2 c
3–0 3.5 124.5 71 311.0 14.1 18000–5 3.2 46.8 19 60.0 2.35 7505–10 3.6 27.8 9 24.7 0.88 335
10–20 3.8 23.5 9 17.8 0.64 24120–40 4.2 12.5 6 7.5 0.30 16840–80 4.4 6.1 8 1.9 0.09 105
b80–200 4.5 4.2 12 1.0 0.05 n.d.
a Base saturation.b Not determined.
and S in the young pine stand are due to the incorporation of forest floort
material when the site was ploughed prior to plantation. As a result, a microre-lief of ridges and furrows exists and the forest floor is only poorly developed incomparison to the pine–oak stand, where distinct layers of different degrees of
Ž .decomposition L, Of, Oh exist.Field measurements of bulk deposition, throughfall and soil solution have
been carried out almost continuously since April 1986, with only a 6-monthinterruption in soil solution sampling between November 1992 and April 1993.Until October 1993, throughfall in the pine–oak stand was gathered with 12rectangular polyethylene collectors of 0.25 m2 surface area and led into asubterranean 10 l bottle which were sampled weekly or biweekly. In November1993 these collectors were replaced by round samplers of only 83.3 cm2 surfacearea. From April to October of that year, both sampling systems were in use andshowed no methodological effects on the measured throughfall fluxes. From1986 to 1992, throughfall was also collected and analyzed in the young pinestand. Since element fluxes were not significantly different from fluxes in the
Ž .adjacent pine–oak stand Marschner et al., 1991 , the latter data are valid forboth sites.
Soil solution was collected with ceramic suction cups in 50 and 200 cm depthwith 12 replicates for each depth and each stand. The spatial distribution of thecups in the plots was selected to represent the variability in microsites, asindicated by different distances to trees and in the young stand ridges andfurrows. Every week after sampling, vacuum was applied to each suction cupindividually and adjusted to y300 to y500 hPa depending on the amount of thesolution gathered. The collected soil solutions were combined to form fourcomposite samples for each depth and plot and stored at y308C.
Chemical analysis of all solutions was performed on monthly samples andŽ . Žincluded pH glass electrode Ca, Mg, K, Al, Mn and Na atomic absorption. Ž . Ž .spectroscopy , Fe colorimetrically and Cl, NO , SO ion chromatography .3 4
( )B. Marschner et al.rGeoderma 83 1998 83–101 87
For the determination of solution acidity and quantification of acidity transferŽ .within the ecosystems, we adapted the concept of Van Breemen et al. 1983
and extended it for the characterization of precipitation chemistry. According toŽ .Van Breemen et al. 1983 , alkalinity, also termed acid neutralization capacity
Ž . Ž Ž ..ANC is defined as Eq. 1 :
2q 2q q q 2y yANC s2 Ca q2 Mg q K q Na y2 SO y NO4 3
yy Cl 1Ž .w xwhere X are molar concentrations. ANC is positive if there is a surplus of the
basic cations over the strong acid anions, indicating the presence of HCOy or3
OHy. If organic anions are present in the solutions, as it is the case inthroughfall and soil solution from the topsoil, ANC calculated according to Eq.Ž . q1 is overestimated. However, a negative ANC indicates the presence of H , Aland Fe cations and therefore a transfer of acidity with the solution.
For the calculation of throughfall acidity, we introduced NHq in the equation4
since it contributes to the acid load of the soil by the release of Hq upon itsuptake by plants or by the production of an equimolar amount of Hq during
Ž .nitrification and therefore reduces throughfall alkalinity according to Eq. 2 .
2q 2q q q 2y yANC s2 Ca q2 Mg q K q Na y2 SO y NO4 3
y qy Cl y NH 2Ž .4
For the calculation of time trends in soil solution composition, the approachŽ .of Wesselink et al. 1995 was adapted, where they used Cl to correct for soil
water fluctuations due to evapotranspiration and dilution, assuming the conser-Ž Ž ..vative behavior of Cl in the soil solution Eq. 3 :
.X sA P tqA Cl qB 3Ž .X Cl X
w x Žwhere X is the element concentration in the soil solution, t is time months or.years and A , A and B are parameters estimated by the model. However,X Cl X
this approach fails if soil solution Cl concentrations themselves show a temporaltrend due to decreasing inputs, as it is the case at our study site where significant
Ž .negative slopes were calculated according to Eq. 4 for 1990–1995:
Cl sA P tqB 4Ž .Cl Cl
w ) xTo overcome this problem, a time-trend-corrected Cl concentration Cl wasŽ .calculated according to Eq. 5 by adding the previously determined time trend
Ž .component of Cl slope= time to the measured Cl concentration values:
)
)Cl s Cl qA P mo ymo 5Ž . Ž .Cl i iy1i i
with isnumber of months since the begin of the study.
( )B. Marschner et al.rGeoderma 83 1998 83–10188
The component that describes variations in element concentrations caused byŽ .soil water content changes was thus described with Eq. 6 :
)X sA P Cl qB 6Ž .X Xw
w xwhere X are predicted element concentrations assuming only dilution andww ) xconcentration effects. Cl is the time-trend corrected Cl concentration from
Ž .Eq. 5 . For the period 1986–1991 when no time trends for Cl were observed,Ž .the actually measured Cl concentrations were used in Eq. 6 .
Based on the above calculations, the temporal trend in soil solution concentra-Žtions after 1990 for all elements was described with the following model Eq.
Ž ..7 :
)
)X sA P tqA P Cl qB 7Ž .X XCl X
w x w ) xwhere X is the element concentration, Cl the time trend corrected ClŽ .
)concentration from Eq. 2 and A , A and B the estimated modelX XCl X
parameters.
3. Results
3.1. Element fluxes with throughfall
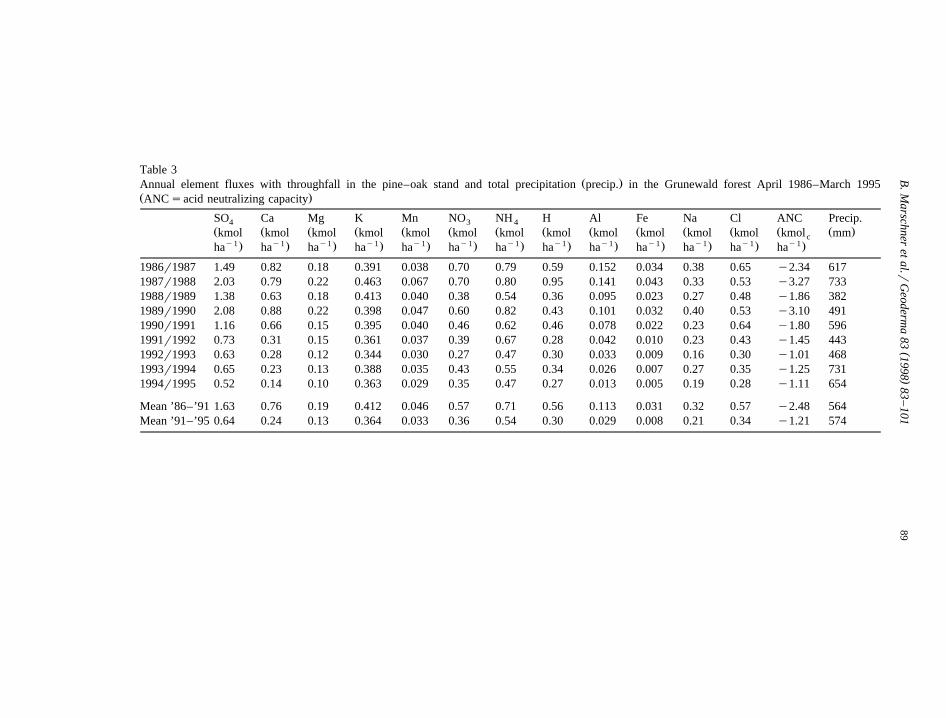
In comparison to bulk deposition outside of forest stands, throughfall fluxesof most elements are higher due to wash-off of dry deposits from the canopy andleaching from the foliage. These external and internal sources are difficult todifferentiate for most elements so that total inputs to forest ecosystems aredifficult to estimate. But the throughfall fluxes presented in Table 3 quantify thesolute inputs to the soil surface and therefore are more relevant for soil solutioncomposition.
Despite the large annual variability in throughfall fluxes, a drastic decline ofŽ .several elements is evident between 1989r1990 and 1991r1992 Table 3 .
Since these changes all occurred within one or two years and no temporal trendsin the earlier and later years are discernible for most elements, mean annualfluxes from 1986 to 1991 were compared with those from 1991 to 1995. Duringboth time periods, mean annual precipitation was around 570 mm whichcorresponds well with the long-term average of 580 mm for Berlin. With 733mm in 1987r1988 and 731 mm in 1993r1994 wet years were recorded in bothperiods. The extremely dry year 1988r1989 has no equivalent in the later timeperiod, when precipitation was always well above 400 mm. However, nocorrelations were found between precipitation and element fluxes, so that
()
B.M
arschneret
al.rG
eoderma
831998
83–
10189
Table 3Ž .Annual element fluxes with throughfall in the pine–oak stand and total precipitation precip. in the Grunewald forest April 1986–March 1995
Ž .ANCsacid neutralizing capacity
SO Ca Mg K Mn NO NH H Al Fe Na Cl ANC Precip.4 3 4Ž Ž Ž Ž Ž Ž Ž Ž Ž Ž Ž Ž Ž Ž .kmol kmol kmol kmol kmol kmol kmol kmol kmol kmol kmol kmol kmol mmc
y1 y1 y1 y1 y1 y1 y1 y1 y1 y1 y1 y1 y1. . . . . . . . . . . . .ha ha ha ha ha ha ha ha ha ha ha ha ha
1986r1987 1.49 0.82 0.18 0.391 0.038 0.70 0.79 0.59 0.152 0.034 0.38 0.65 y2.34 6171987r1988 2.03 0.79 0.22 0.463 0.067 0.70 0.80 0.95 0.141 0.043 0.33 0.53 y3.27 7331988r1989 1.38 0.63 0.18 0.413 0.040 0.38 0.54 0.36 0.095 0.023 0.27 0.48 y1.86 3821989r1990 2.08 0.88 0.22 0.398 0.047 0.60 0.82 0.43 0.101 0.032 0.40 0.53 y3.10 4911990r1991 1.16 0.66 0.15 0.395 0.040 0.46 0.62 0.46 0.078 0.022 0.23 0.64 y1.80 5961991r1992 0.73 0.31 0.15 0.361 0.037 0.39 0.67 0.28 0.042 0.010 0.23 0.43 y1.45 4431992r1993 0.63 0.28 0.12 0.344 0.030 0.27 0.47 0.30 0.033 0.009 0.16 0.30 y1.01 4681993r1994 0.65 0.23 0.13 0.388 0.035 0.43 0.55 0.34 0.026 0.007 0.27 0.35 y1.25 7311994r1995 0.52 0.14 0.10 0.363 0.029 0.35 0.47 0.27 0.013 0.005 0.19 0.28 y1.11 654
Mean ’86–’91 1.63 0.76 0.19 0.412 0.046 0.57 0.71 0.56 0.113 0.031 0.32 0.57 y2.48 564Mean ’91–’95 0.64 0.24 0.13 0.364 0.033 0.36 0.54 0.30 0.029 0.008 0.21 0.34 y1.21 574
( )B. Marschner et al.rGeoderma 83 1998 83–10190
differences between the two sampling periods are not attributed to differentweather conditions.
Comparing the two time periods, mean annual throughfall flux of the twomajor precipitation compounds SO and Ca declined by 61 and 68%, respec-4
Ž .tively Table 3 . While before 1990, SO and Ca inputs at the study site were4Žamong the highest reported in Germany and Central Europe Marschner et al.,
.1991 , these element fluxes have now reached levels comparable to forests inŽ .rural areas of Northern Germany Bredemeier, 1987 . Similar reductions oc-
Ž .curred for the fluxes of Mg, Mn, Al, Fe, Na and Cl after 1990 Table 3 .Ž .The continual decrease of SO fluxes even after 1990 Table 3 corresponds4
Žwell with the reported declines in ambient air SO concentrations Landesum-2.weltamt Brandenburg, 1995b . This is accompanied by decreasing Ca fluxes in
Ž .throughfall Table 3 . While mean annual Ca fluxes between 1991 and 1995reached only 30% of the former loads, in 1994r1995 this was even only 19%.
Ž .The flux of mineral N compounds NO qNH from the canopy decreased3 4
by roughly 30% from a mean of 1.28 kmol hay1 ay1 before 1991 to 0.90 kmoly1 y1 Ž .ha a in the following years Table 3 . This stands in contrast to other
European ecosystems where N inputs have remained stable or even increased inŽ .the last 10 years Matzner and Meiwes, 1994; De Vries et al., 1995 .
The greatest changes in throughfall fluxes were recorded for Al and Fe, withonly 25% of the mean pre-1991 amounts reaching the soil surface after
Ž . Ž .1990r1991 Table 3 . These two highly correlated metals Rs0.94 show adistinct seasonal pattern with maximum values in winter and highly significantnegative time trends throughout the whole study period. Since the seasonalfluctuations and long-term trend of Al in throughfall correlates with Hq fluxesŽ .Rs0.81 they may simply reflect the pH-dependent solubility of dry Aldeposits. Therefore, total Al and Fe fluxes would be underestimated in theanalysis of the non-acidified precipitation samples. In order to test for thispossible artefact, only samples with pH 4.0–4.5 were selected from both periodsand their mean Al and Fe concentrations were compared. In these acidicthroughfall samples, Al concentrations were 0.024"0.013 mmol ly1 before
Ž . y11991r1992 ns20 and 0.006"0.005 mmol l during the following sam-Ž . Žpling period ns15 with the difference being highly significant p-0.001,
.t-test . For Fe too, differences between the two periods were significant in thesesamples. Therefore, the observed temporal trends in Al and Fe fluxes can not beattributed to pH effects but are probably due to decreased inputs, as it already
Ž .was observed for heavy metals before 1990 Marschner et al., 1991 .The above mentioned positive trend in throughfall pH is reflected in the lower
q Ž .H fluxes of 1991–1995 Table 3 , although the difference between the twotime periods is not significant. However, if ANC for throughfall is calculated
Ž . Ž .according to Eq. 2 and then converted to fluxes Table 3 , the actual acidityinputs to the soil surface have declined by more than 50%, with the difference
Ž .being significant p-0.01, t-test .
( )B. Marschner et al.rGeoderma 83 1998 83–101 91
3.2. Soil solution composition
The chemical soil solution composition shows strong fluctuations betweenand within years, so that responses to the changing element inputs are not easilydetected. Since the short-term temporal variability is more pronounced in 50 cmdepth, longer-term time trends are more evident in 200 cm depth, as shownbelow.
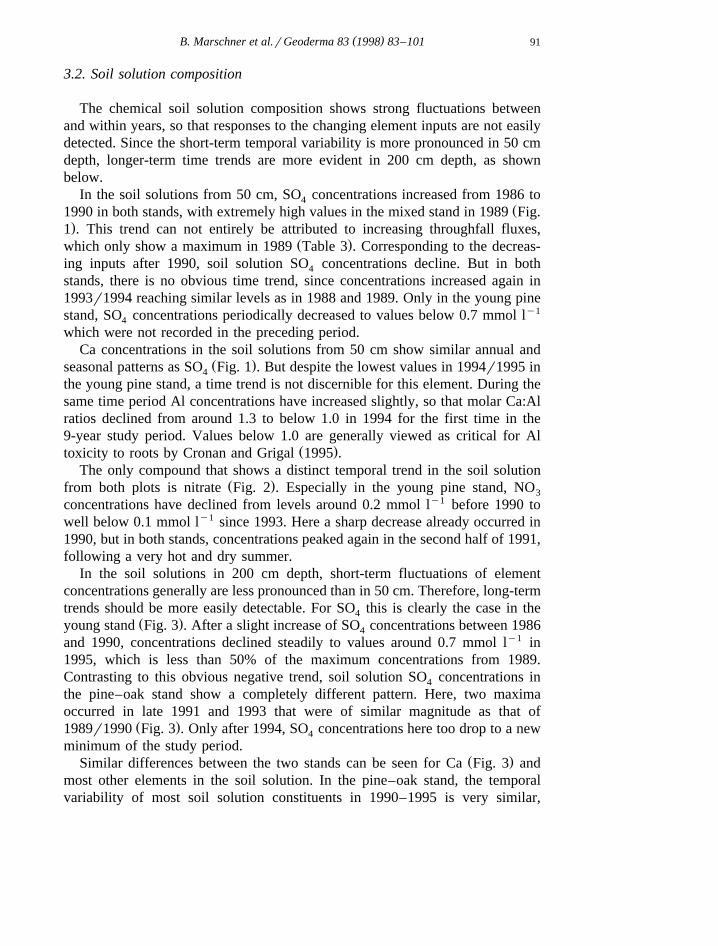
In the soil solutions from 50 cm, SO concentrations increased from 1986 to4Ž1990 in both stands, with extremely high values in the mixed stand in 1989 Fig.
.1 . This trend can not entirely be attributed to increasing throughfall fluxes,Ž .which only show a maximum in 1989 Table 3 . Corresponding to the decreas-
ing inputs after 1990, soil solution SO concentrations decline. But in both4
stands, there is no obvious time trend, since concentrations increased again in1993r1994 reaching similar levels as in 1988 and 1989. Only in the young pinestand, SO concentrations periodically decreased to values below 0.7 mmol ly1
4
which were not recorded in the preceding period.Ca concentrations in the soil solutions from 50 cm show similar annual and
Ž .seasonal patterns as SO Fig. 1 . But despite the lowest values in 1994r1995 in4
the young pine stand, a time trend is not discernible for this element. During thesame time period Al concentrations have increased slightly, so that molar Ca:Alratios declined from around 1.3 to below 1.0 in 1994 for the first time in the9-year study period. Values below 1.0 are generally viewed as critical for Al
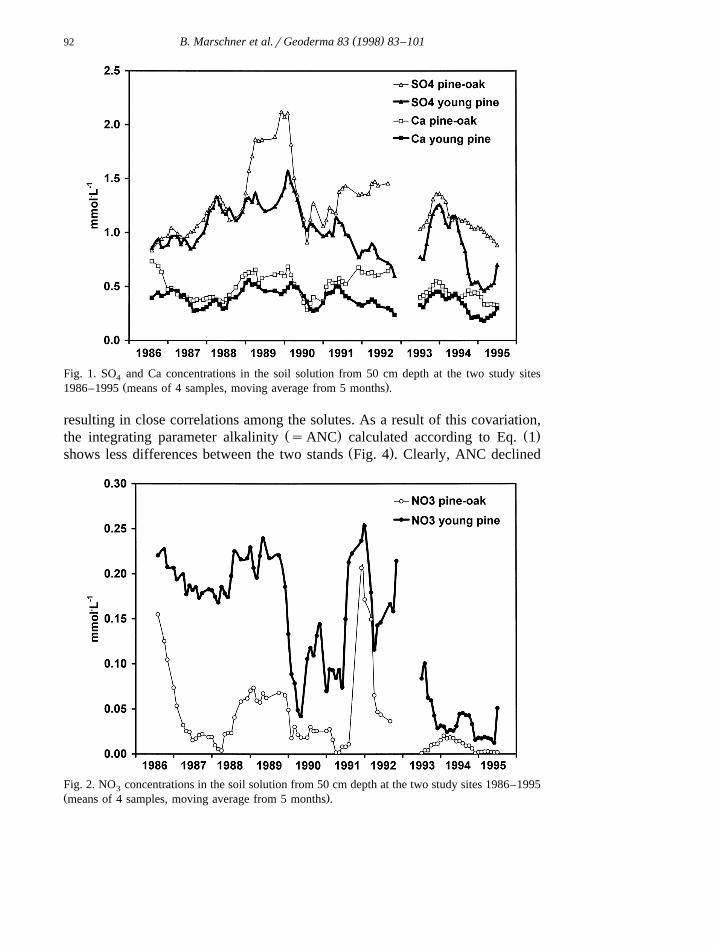
Ž .toxicity to roots by Cronan and Grigal 1995 .The only compound that shows a distinct temporal trend in the soil solution
Ž .from both plots is nitrate Fig. 2 . Especially in the young pine stand, NO3
concentrations have declined from levels around 0.2 mmol ly1 before 1990 towell below 0.1 mmol ly1 since 1993. Here a sharp decrease already occurred in1990, but in both stands, concentrations peaked again in the second half of 1991,following a very hot and dry summer.
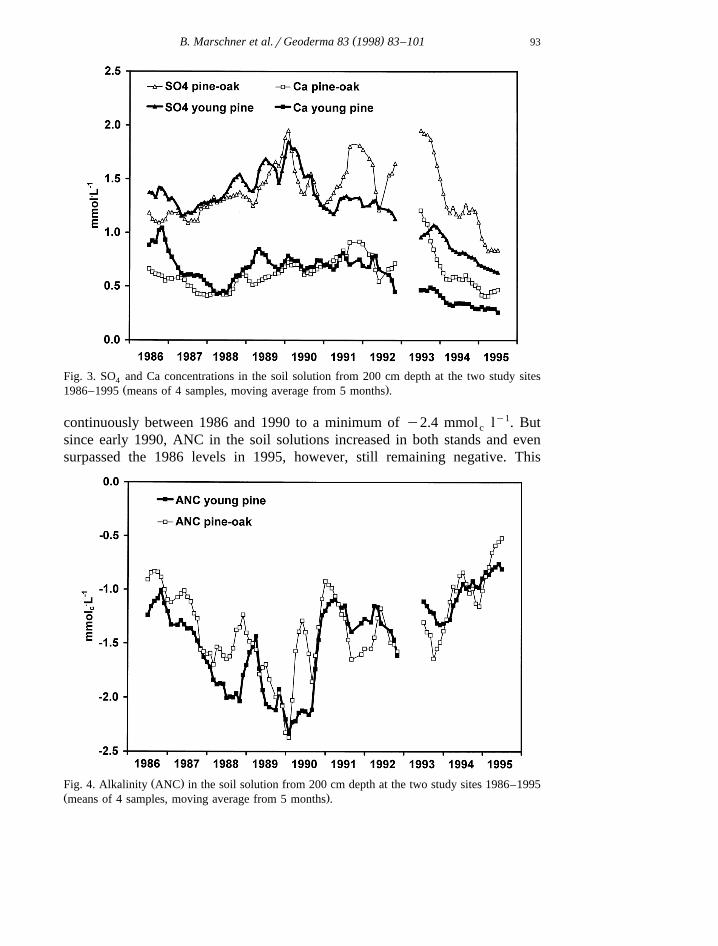
In the soil solutions in 200 cm depth, short-term fluctuations of elementconcentrations generally are less pronounced than in 50 cm. Therefore, long-termtrends should be more easily detectable. For SO this is clearly the case in the4
Ž .young stand Fig. 3 . After a slight increase of SO concentrations between 19864
and 1990, concentrations declined steadily to values around 0.7 mmol ly1 in1995, which is less than 50% of the maximum concentrations from 1989.Contrasting to this obvious negative trend, soil solution SO concentrations in4
the pine–oak stand show a completely different pattern. Here, two maximaoccurred in late 1991 and 1993 that were of similar magnitude as that of
Ž .1989r1990 Fig. 3 . Only after 1994, SO concentrations here too drop to a new4
minimum of the study period.Ž .Similar differences between the two stands can be seen for Ca Fig. 3 and
most other elements in the soil solution. In the pine–oak stand, the temporalvariability of most soil solution constituents in 1990–1995 is very similar,
( )B. Marschner et al.rGeoderma 83 1998 83–10192
Fig. 1. SO and Ca concentrations in the soil solution from 50 cm depth at the two study sites4Ž .1986–1995 means of 4 samples, moving average from 5 months .
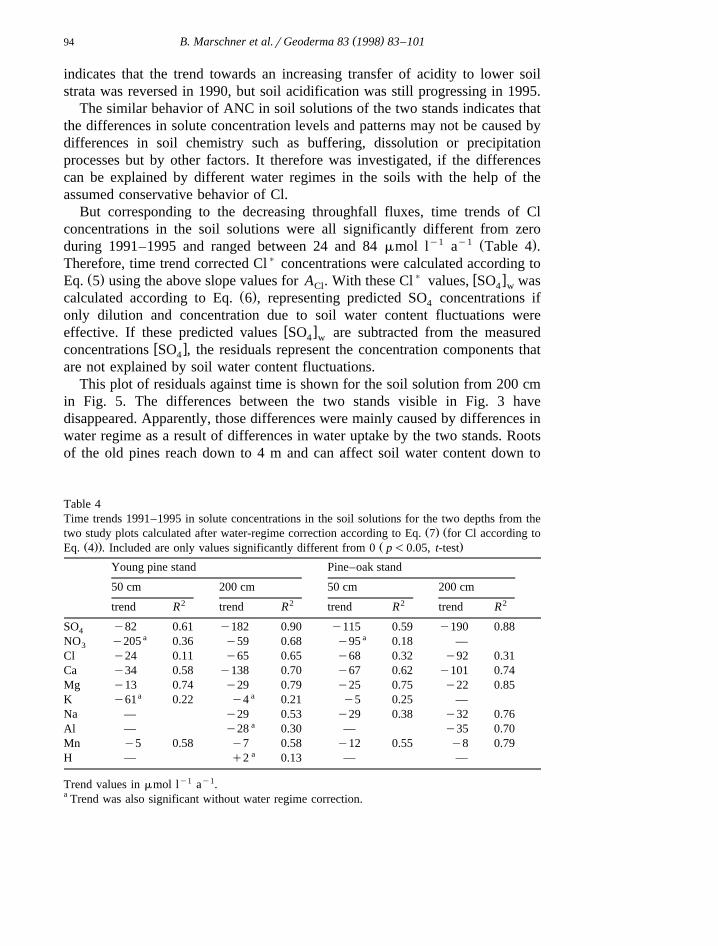
resulting in close correlations among the solutes. As a result of this covariation,Ž . Ž .the integrating parameter alkalinity sANC calculated according to Eq. 1
Ž .shows less differences between the two stands Fig. 4 . Clearly, ANC declined
Fig. 2. NO concentrations in the soil solution from 50 cm depth at the two study sites 1986–19953Ž .means of 4 samples, moving average from 5 months .
( )B. Marschner et al.rGeoderma 83 1998 83–101 93
Fig. 3. SO and Ca concentrations in the soil solution from 200 cm depth at the two study sites4Ž .1986–1995 means of 4 samples, moving average from 5 months .
continuously between 1986 and 1990 to a minimum of y2.4 mmol ly1. Butc
since early 1990, ANC in the soil solutions increased in both stands and evensurpassed the 1986 levels in 1995, however, still remaining negative. This
Ž .Fig. 4. Alkalinity ANC in the soil solution from 200 cm depth at the two study sites 1986–1995Ž .means of 4 samples, moving average from 5 months .
( )B. Marschner et al.rGeoderma 83 1998 83–10194
indicates that the trend towards an increasing transfer of acidity to lower soilstrata was reversed in 1990, but soil acidification was still progressing in 1995.
The similar behavior of ANC in soil solutions of the two stands indicates thatthe differences in solute concentration levels and patterns may not be caused bydifferences in soil chemistry such as buffering, dissolution or precipitationprocesses but by other factors. It therefore was investigated, if the differencescan be explained by different water regimes in the soils with the help of theassumed conservative behavior of Cl.
But corresponding to the decreasing throughfall fluxes, time trends of Clconcentrations in the soil solutions were all significantly different from zero
y1 y1 Ž .during 1991–1995 and ranged between 24 and 84 mmol l a Table 4 .Therefore, time trend corrected Cl) concentrations were calculated according to
Ž . ) w xEq. 5 using the above slope values for A . With these Cl values, SO wasCl 4 wŽ .calculated according to Eq. 6 , representing predicted SO concentrations if4
only dilution and concentration due to soil water content fluctuations werew xeffective. If these predicted values SO are subtracted from the measured4 w
w xconcentrations SO , the residuals represent the concentration components that4
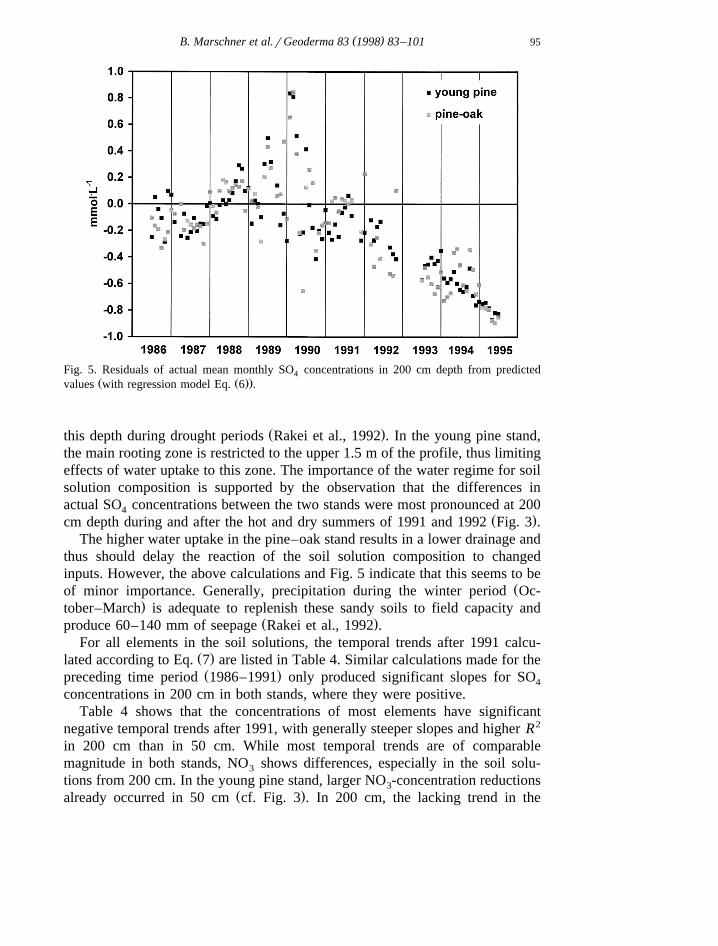
are not explained by soil water content fluctuations.This plot of residuals against time is shown for the soil solution from 200 cm
in Fig. 5. The differences between the two stands visible in Fig. 3 havedisappeared. Apparently, those differences were mainly caused by differences inwater regime as a result of differences in water uptake by the two stands. Rootsof the old pines reach down to 4 m and can affect soil water content down to
Table 4Time trends 1991–1995 in solute concentrations in the soil solutions for the two depths from the
Ž . Žtwo study plots calculated after water-regime correction according to Eq. 7 for Cl according toŽ .. Ž .Eq. 4 . Included are only values significantly different from 0 p-0.05, t-test
Young pine stand Pine–oak stand
50 cm 200 cm 50 cm 200 cm2 2 2 2trend R trend R trend R trend R
SO y82 0.61 y182 0.90 y115 0.59 y190 0.884a aNO y205 0.36 y59 0.68 y95 0.18 —3
Cl y24 0.11 y65 0.65 y68 0.32 y92 0.31Ca y34 0.58 y138 0.70 y67 0.62 y101 0.74Mg y13 0.74 y29 0.79 y25 0.75 y22 0.85
a aK y61 0.22 y4 0.21 y5 0.25 —Na — y29 0.53 y29 0.38 y32 0.76
aAl — y28 0.30 — y35 0.70Mn y5 0.58 y7 0.58 y12 0.55 y8 0.79
aH — q2 0.13 — —
Trend values in mmol ly1 ay1.a Trend was also significant without water regime correction.
( )B. Marschner et al.rGeoderma 83 1998 83–101 95
Fig. 5. Residuals of actual mean monthly SO concentrations in 200 cm depth from predicted4Ž Ž ..values with regression model Eq. 6 .
Ž .this depth during drought periods Rakei et al., 1992 . In the young pine stand,the main rooting zone is restricted to the upper 1.5 m of the profile, thus limitingeffects of water uptake to this zone. The importance of the water regime for soilsolution composition is supported by the observation that the differences inactual SO concentrations between the two stands were most pronounced at 2004
Ž .cm depth during and after the hot and dry summers of 1991 and 1992 Fig. 3 .The higher water uptake in the pine–oak stand results in a lower drainage and
thus should delay the reaction of the soil solution composition to changedinputs. However, the above calculations and Fig. 5 indicate that this seems to be
Žof minor importance. Generally, precipitation during the winter period Oc-.tober–March is adequate to replenish these sandy soils to field capacity and
Ž .produce 60–140 mm of seepage Rakei et al., 1992 .For all elements in the soil solutions, the temporal trends after 1991 calcu-
Ž .lated according to Eq. 7 are listed in Table 4. Similar calculations made for theŽ .preceding time period 1986–1991 only produced significant slopes for SO4
concentrations in 200 cm in both stands, where they were positive.Table 4 shows that the concentrations of most elements have significant
negative temporal trends after 1991, with generally steeper slopes and higher R2
in 200 cm than in 50 cm. While most temporal trends are of comparablemagnitude in both stands, NO shows differences, especially in the soil solu-3
tions from 200 cm. In the young pine stand, larger NO -concentration reductions3Ž .already occurred in 50 cm cf. Fig. 3 . In 200 cm, the lacking trend in the
( )B. Marschner et al.rGeoderma 83 1998 83–10196
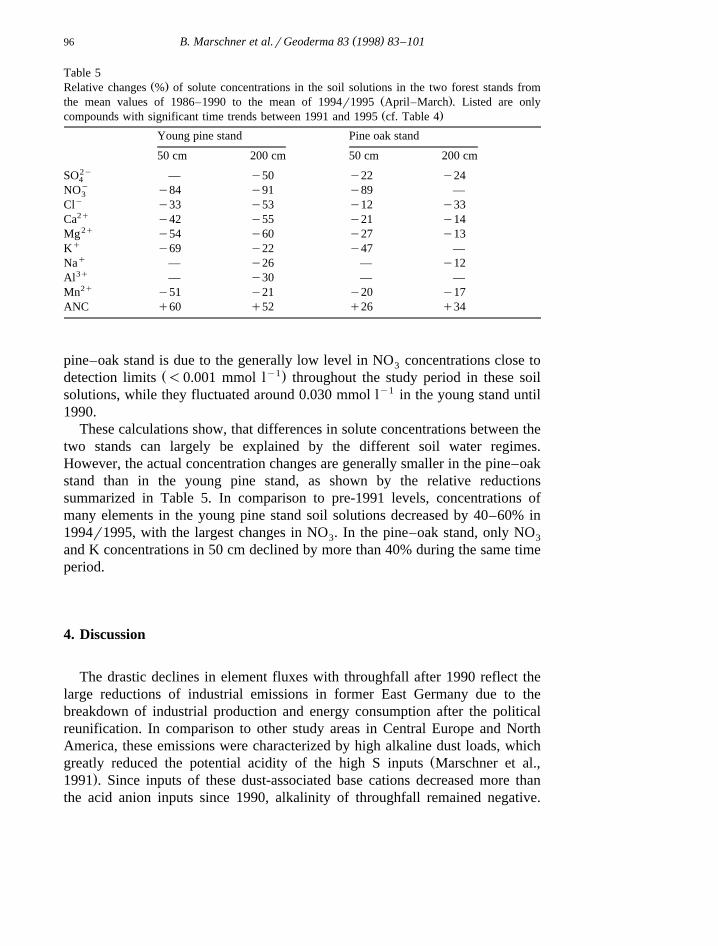
Table 5Ž .Relative changes % of solute concentrations in the soil solutions in the two forest stands from
Ž .the mean values of 1986–1990 to the mean of 1994r1995 April–March . Listed are onlyŽ .compounds with significant time trends between 1991 and 1995 cf. Table 4
Young pine stand Pine oak stand
50 cm 200 cm 50 cm 200 cm2ySO — y50 y22 y244yNO y84 y91 y89 —3
yCl y33 y53 y12 y332qCa y42 y55 y21 y142qMg y54 y60 y27 y13
qK y69 y22 y47 —qNa — y26 — y123qAl — y30 — —
2qMn y51 y21 y20 y17ANC q60 q52 q26 q34
pine–oak stand is due to the generally low level in NO concentrations close to3Ž y1.detection limits -0.001 mmol l throughout the study period in these soil
solutions, while they fluctuated around 0.030 mmol ly1 in the young stand until1990.
These calculations show, that differences in solute concentrations between thetwo stands can largely be explained by the different soil water regimes.However, the actual concentration changes are generally smaller in the pine–oakstand than in the young pine stand, as shown by the relative reductionssummarized in Table 5. In comparison to pre-1991 levels, concentrations ofmany elements in the young pine stand soil solutions decreased by 40–60% in1994r1995, with the largest changes in NO . In the pine–oak stand, only NO3 3
and K concentrations in 50 cm declined by more than 40% during the same timeperiod.
4. Discussion
The drastic declines in element fluxes with throughfall after 1990 reflect thelarge reductions of industrial emissions in former East Germany due to thebreakdown of industrial production and energy consumption after the politicalreunification. In comparison to other study areas in Central Europe and NorthAmerica, these emissions were characterized by high alkaline dust loads, which
Žgreatly reduced the potential acidity of the high S inputs Marschner et al.,.1991 . Since inputs of these dust-associated base cations decreased more than
the acid anion inputs since 1990, alkalinity of throughfall remained negative.
( )B. Marschner et al.rGeoderma 83 1998 83–101 97
This means, that more than 1 kmol hay1 ay1 of acidity were still reaching thec
soil surface in 1994r1995 which is well above the rates at which base cationsare released by weathering in these soils, estimated to be around 0.1–0.5 kmolc
y1 y1 Ž .ha a , as in Scottish Podzols and Cambisols Zulla and Billet, 1994 .A continuing soil acidification is evidenced by the negative ANC values in
the soil solutions from 200 cm depth, showing that the incoming acidity is notbuffered in the soil profiles and acidity is still transferred to greater depthsdespite the significantly increased ANC inputs and soil solution concentrations.The increasing ANC seems to indicate that base cations have not been depletedfrom the soils to the same extent as in some Norwegian catchments, where thealkalinity of streamwaters remained unaffected or even continued to decrease
Ž .despite reduced SO and NO inputs Kirchner and Lydersen, 1995 . This is4 3
discussed in more detail further below.The observed increases in soil solution alkalinity at our study sites are mainly
due to the decreasing concentrations of SO , which contributes 75–85% to the4
anion sum. The rapid response of the soil solution in 200 cm depth to the inputreductions after 1990 had not been expected, since several other studies reportdelays of soil solution SO -concentration responses of up to three years to even4
Žmore drastic experimental input changes Bredemeier et al., 1995; Giesler et al.,.1996; Rustad et al., 1996 . This is generally attributed to adsorptionrdesorption
processes of the SO anion on oxides or to the precipitationrdissolution of basic4Ž .aluminum sulfate minerals Rustad et al., 1996 . But such processes seem to be
of minor importance at both of our study sites, since even the retardedSO -concentration reductions in the soil solutions from the pine–oak stand can4
be explained by the different water regimes at the sites.The reason for this unretarded reaction of the soil solution composition may
Žbe that S pools in the soils are closely associated with organic matter Tables 1. Ž .and 2 which primarily are mobilized by microbial activity Marschner, 1993 .
According to the above mentioned studies, where SO desorption retarded the4
response of the soil solution to decreased inputs, this would be expected in theoxide-containing Bs horizon in 15–30 cm of these slightly podzolized soils. Butif such exchangeable SO pools exist in our soils, they must be small, since they4
did not prevent the rapid SO concentration declines in the soil solutions. Below4
50 cm, no other sources or sinks for SO can be detected, since SO concentra-4 4
tion levels are very similar in both sampling depths. There is also no evidencefor an earlier accumulation of SO in the soils, since the budgets calculated for4
1986–1990 showed that all SO entering the system during that time period was4Ž .quantitatively washed out with drainage waters Cornelius et al., 1997 . Similar
calculations were made for 1991–1995, but are of little use for budgeting,because outputs were extremely low in 1992 and 1993 due to low drainage rates.
Although aluminum taken as Al3q contributes 35–40% to the cation sum inŽthe soil solutions from 200 cm, the decline in the strong acid anions SO , NO ,4 3
.Cl is mainly balanced by declines in base cation concentrations and to some
( )B. Marschner et al.rGeoderma 83 1998 83–10198
Ž .extent by lower Mn concentrations Table 5 . This small or lacking reaction ofAl could indicate that not free Al3q but organic complexes of Al are dominant
Ž . Ž .in the soil solution, as found by Driscoll et al. 1989 and Giesler et al. 1996 inforest topsoils. However, both sampling depths in these soils are well below the
Ž .Bs horizon 15–30 cm where precipitation or adsorption of organic Al com-Ž .plexes is expected to occur Kaiser et al., 1997 . Further evidence for the low
contribution of organic Al complexes to Al concentrations in these soil solutionsis found in the charge balances which generally have errors -10% whencalculated with Al3q taken as the sole Al species in solution.
The alternative explanation for the differential reaction of Al and base cationsto the decreasing anion concentrations is found in the poor base cation status ofthese soils, where acidity is not buffered but only transferred through release ofsolid-phase Al. The growing relative contribution of Al to the charge balance inthe soil solution which are accompanied by declining Ca:Al and Mg:Al ratiosmay therefore indicate further decreases in base saturation at the cation ex-change sites due to the stronger decline of base cation inputs in comparison tothe decreasing acidity inputs.
The above mentioned increase in alkalinity of the soil solutions therefore ismainly the result of the overall decreased ionic strength and can not be taken asan indicator for the recovery of the soils from acidification. This can only beexpected when the alkalinity of inputs becomes positive or at least less negativethan the weathering rates.
The decreased N inputs at the study sites after 1990 indicate that they partlyoriginated from industrial emissions in East Germany and possibly from formerlarge-scale poultry and livestock production with accompanying high applica-
Ž .tions of animal manure in agriculture cf. Hofmann and Krauss, 1988 . Butrelative input reductions are smaller than those of most other elements, indicat-ing that similar to other European regions, the increasing road traffic mainly
Ž .contributes to N inputs Matzner and Meiwes, 1994; De Vries et al., 1995 .Apart from the reduced acid loads, this development may be of major
importance for ecosystem stability, since the high N inputs of the past havestimulated tree growth and increased ground cover by nitrophilous grasses whichboth increases the risk of drought stress in dry periods on these sandy soilsŽ . Ž .Hofmann and Krauss, 1988 . According to Schulze et al. 1989 , N inputs toforest ecosystems should not exceed the amount fixed in annual increment inorder to prevent N eutrophication and the associated risk of ecosystem destabi-lization or increased NO outputs. For both stands of our study, the annual3
biomass increment was estimated to fix around 0.6–0.7 kmol N hay1 ay1
Ž .Cornelius et al., 1997 . This is surpassed in throughfall even after the recentflux reductions by about 0.1–0.2 kmol N hay1 ay1.
Most of this N surplus remains in the system, as it is shown by estimates of NŽ y1.outputs with seepage water 60–140 mm a that are in the range of 0.01–0.03
kmol N hay1 ay1 in the young pine stand since 1991 and even lower in the
( )B. Marschner et al.rGeoderma 83 1998 83–101 99
pine–oak stand. In the pine–oak stand, an almost complete N retention occurredalready before the input reductions and may be due to the deeper rooting systemof the old trees, the higher proportion of hardwoods that are known to utilize
Ž .NO more effectively than conifers Schulze et al., 1989 or to N immobiliza-3
tion by the more abundant forest floor and soil organic matter. The reductions insoil solution NO concentrations therefore not necessarily mean that N inputs3
Ž .have declined to or below the ‘critical loads’ defined by Schulze et al. 1989 .
5. Conclusions
Until 1990 the study sites were subject to very high anthropogenic elementinputs, largely originating from sources in the surrounding East Germany.Despite the high loads of alkaline dry deposits which greatly reduced thepotential acid inputs, soil acidification was progressing at increasing rates asindicated by the continuous decline in alkalinity in the soil solutions between1986 and 1990.
The rapid reversal of this trend in response to the drastic input reductionssince 1990 is mainly due to decreasing SO , NO and also Cl concentrations in4 3
the soil solutions. The apparent lack of release or accumulation of exchangeableSO pools in these soils is probably due to the scarcity of binding sites in the4
poorly developed Bs horizon which analytically shows hardly any Fe and onlysome Al and Mn accumulation. The soils therefore display a low ‘chemicalelasticity’ in terms of their reactions towards changing SO or acid inputs. This4
was also shown for the pine–oak stand where the delayed response of the soilsolution composition to input reductions was only caused by a different waterregime.
Despite the reductions in acid inputs, soil acidification is continuing at thestudy sites. As a matter of fact, the present situation may actually pose a greaterrisk for tree vitality than the preceding period due to the greatly reduced basecation inputs. As a consequence, Ca:Al ratios in the soil solution as indicatorsfor the risk of Al toxicity to roots may continue to decline, unless acid inputsfall below the weathering rates.
Another long-term risk is seen in the continuing N accumulation in theecosystem, although N outputs presently have declined. Little is known aboutthe capacities of such soils to accumulate and immobilize N or about the crucialfactors controlling NO release which would enhance soil acidification and3
reduce groundwater quality.Therefore, nutrient status and acidification of these poorly buffered soils of
low chemical elasticity will greatly depend on the future developments in inputsof acidity, base cation and nitrogen. Continuous monitoring of element fluxesand soil solution composition therefore is necessary.
( )B. Marschner et al.rGeoderma 83 1998 83–101100
Acknowledgements
This study was part of the interdisciplinary research project ‘‘Forest Ecosys-tems Close to Conurbations’’ financed by the Federal Environmental AgencyŽ .UBA of Germany and the City of Berlin. Since 1992 the study sites areestablished as permanent plots of the ‘‘Nature Monitoring Program’’ of theBerlin Administration for Urban Planning and Environmental Protection. Weexpress our thanks to these institutions and to the numerous students, laboratorypersonnel and other helping hands who guaranteed the regular sampling andanalyses over the past 10 years.
References
Bredemeier, M., 1987. Quantification of ecosystem internal proton production from the ionbalance of the soil. Plant Soil 101, 273–280.
Bredemeier, M., Dohrenbusch, A., Murach, D., 1995. Response of soil water chemistry and fineroots to clean rain in a spruce forest ecosystem at Solling, FRG. Water Air Soil Poll. 85,1605–1611.
Cornelius, R., Faensen-Thiebes, A., Marschner, B., Weigmann, G., 1997. Das ForschungsprojektŽ .‘‘Ballungsraumnahe Waldokosysteme’’ Berlin. In: Franzle, Muller, Schroder Eds. , Handbuch¨ ¨ ¨ ¨
¨der Okosystemanalyse. Ecomed Verlag, LandsbergrLech, Kap. V-4.9.Cronan, C.S., Grigal, D.F., 1995. Use of calciumraluminum ratios as indicators of stress in forest
ecosystems. J. Environ. Qual. 24, 209–226.De Vries, W., van Grinsven, J.J.M., van Breemen, N., Leeters, E.E.J.M., Jansen, P.C., 1995.
Impacts of acid deposition on concentrations and fluxes of solutes in acid sandy forest soils inthe Netherlands. Geoderma 67, 17–43.
Driscoll, C.T., Likens, G.E., Hedin, L.O., Eaton, J.S., Bormann, F.H., 1989. Changes in thechemistry of surface waters. Environ. Sci. Technol. 23, 137–143.
Giesler, R., Moldan, F., Lundstrom, U., Hultberg, H., 1996. Reversing acidification in a forested¨catchment: effects on soil solution chemistry. J. Environ. Qual. 25, 110–119.
Hedin, L.O., Granat, L., Likens, G.E., Buishaud, T.A., Galloway, J.N., Butler, T.J., Rodke, H.,1994. Steep declines in atmospheric base cations in regions of Europe and North America.Nature 367, 351–354.
Hofmann, G., Krauss, H.H., 1988. Die Ausscheidung von Ernahrungsstufen fur die Baumarten¨ ¨Kiefer und Buche auf der Grundlage von Nadel- und Blattanalysen und Anwendungsmoglich-¨
¨keiten in der Uberwachung des okologischen Waldzustandes. Soz. Forstwirtsch. 38, 272–274.¨Kaiser, K., Guggenberger, G., Haumeier, L., Zech, H.W., 1997. Dissolved organic matter sorption
on subsoils and minerals studied by 13C-NMR and DRIFT spectroscopy. Eur. J. Soil Sci. 48,301–310.
Kirchner, J.W., Lydersen, E., 1995. Base cation depletion and potential long-term acidification ofNorwegian catchments. Environ. Sci. Technol. 29, 1953–1960.
Landesumweltamt Brandenburg, 1995a. Luftqualitat 1975–1990.¨Landesumweltamt Brandenburg, 1995b. Luftqualitat in Brandenburg—Jahresbericht 1994.¨Marschner, B., 1993. Microbial contribution to sulphate mobilization after liming an acid forest
soil. J. Soil Sci. 44, 459–466.Marschner, B., Stahr, K., Renger, M., 1991. Element inputs and canopy interactions in two pine
forest ecosystems in Berlin, Germany. Z. Pflanzenernahr. Bodenkd. 154, 151–157.¨
( )B. Marschner et al.rGeoderma 83 1998 83–101 101
Matzner, E., Meiwes, K.J., 1994. Long-term development of element fluxes with bulk precipita-tion and throughfall in two German forests. J. Environ. Qual. 23, 162–166.
Rakei, A.K., Renger, M., Wessolek, G., 1992. Wasserhaushalt eines Alt- und Jungkiefernbe-Ž .standes im Grunewald Berlin . Allg. Forst Z. 9, 169–172.
Rustad, L.E., Fernandez, I.J., David, M.B., Mitchell, M.J., Nadelhoffer, K.J., Fuller, R.B., 1996.Experimental soil acidification and recovery at the Bear Brook watershed in Maine. Soil Sci.Soc. Am. J. 60, 1933–1943.
Schulze, E.-D., Vries, W.d., Hauhs, M., Rosen, K., Rasmussen, L., Tamm, C.-O., Nilsson, J.,´1989. Critical loads for nitrogen on forest ecosystems. Water Air Soil Poll. 48, 451–456.
Umweltbundesamt, 1992. Daten zur Umwelt 1991r92. Schmidt, Berlin.Van Breemen, N., Mulder, J., Driscoll, C.T., 1983. Acidification and alkalinisation of soils. Plant
Soil 75, 283–308.Wesselink, L.G., Meiwes, K.-J., Matzner, E., Stein, A., 1995. Long-term changes in water and
soil chemistry in spruce and beech forests, Solling, Germany. Environ. Sci. Technol. 29,51–58.
Wright, R.F., Hauhs, M., 1991. Reversibility of acidification: soils and surface waters. Proc. R.Soc. Edinburgh 97B, 169–191.
Zulla, Y., Billet, M.F., 1994. Long-term changes in chemical weathering rates between 1949–50and 1987 in forest soils from north-east Scotland. Eur. J. Soil Sci. 45, 327–335.


