Download - Research Approaches to Sustainable Biomass Systems || Soil Fertility and Soil Microorganisms
Chapter 5
Soil Fertility and SoilMicroorganisms
Haruo Tanaka, Akane Katsuta, Koki Toyota and Kozue Sawada
Res
Cop
Chapter Outline
5.1. Soil Fertility 10 85.1.1. Definition of Soil
Fertility
1085.1.2. Soil Potential
Productivity
Classification
1085.1.3. Factors Affecting the
Capability
Classification
1095.1.4. Expression of
Productive Capability
Class
1175.1.5. Improvement of
Potential Productivity
Classification
1175.2. Soil Management and Soil
Organic Matter 118
5.2.1. Carbon Dynamics on
the Earth Scale
1185.2.2. Factors in the Increase
and Decrease of SOC
1185.2.3. Principle of
Rothamsted Carbon
Model
119earch Approaches to Sustainable Biomass Systems. http://
yright � 2014 Elsevier Inc. All rights reserved.
5.2.4. Modification of
RothC for Andosols
and Paddy Soils 1
205.2.5. Application of
Modified RothC 1
205.3. Soil Microorganisms 122
5.3.1. Abundance and
Biomass 1
225.3.2. Habitats 1
235.3.3. Taxonomy 1
245.3.4. Microbial Functions 1
255.3.5. Soil Sickness due to
Continuous Cropping 1
295.4. Microbially Mediated Soil
Fertility 131
5.4.1. Productivity and
Environmental
Impacts 1
315.4.2. Nitrogen Cycles
Through Microbial
Biomass in Soils 1
325.4.3. Nitrogen Cycle
Through Microbial
Biomass in Japanese
Agricultural Soils 1
33dx.doi.org/10.1016/B978-0-12-404609-2.00005-2
107
108 Research Approaches to Sustainable Biomass Systems
5.4.4. Management of
Microbial Biomass
Nitrogen During
a Crop Growth Period
1365.4.5. Future Prospects
139References 140
5.1. SOIL FERTILITY
Haruo Tanaka
5.1.1. Definition of Soil Fertility
Soil fertility is defined as “the quality of a soil that enables it to provide nu-trients in adequate amounts and in proper balance for the growth of specifiedplants or crops” (Soil Science Glossary Terms Committee, 2008). It is not onlybased on the natural conditions or peculiar property that the soil has but also thehuman activities such as growing various crops by applying different cultiva-tion methods. Soil fertility is the most important factor to affect the productionof biomass in a field. Usually, sustainable high yields of biomass can beexpected from fertilized soil. For land that is not fertile, application of a largequantity of natural or chemical fertilizer with high labor demand is necessary tomaintain high biomass production.
An agro-ecosystem is viewed as a subset of a natural ecosystem. Tradi-tionally, the agro-ecosystem is characterized as having a simpler speciescomposition and simpler energy and nutrient flows than a natural ecosystem.The soil has the function as the decomposer in the agro-ecosystem to decom-pose the organic matter such as composts or plant residues applied to the soilinto inorganic matters biologically by animals and microorganisms inhabitingthe soil. However, excessive application of organic matter causes environ-mental pollution such as the groundwater contamination with ammonium. Inaddition, as a producer, the soil supports the growth of plants that absorbnutrients and water from the soil to grow under solar irradiation. Hence, “soilproductivity” is a synonym of “soil fertility”.
5.1.2. Soil Potential Productivity Classification
In Japan, “Soil Potential Productivity Classification” (National Conference ofSoil Conservation and Survey Project, 1979) is used to evaluate soil fertility;the soil potential productivity classification is presented based on the report byHamazaki and Micosa (1991).
Classification of soil potential productivity is a form of interpreting theresults of soil surveys. It is a practical method to grade or group soils basedupon their limitations or hazards for crop production and/or risk of soil damage
109Chapter j 5 Soil Fertility and Soil Microorganisms
to jeopardize crop production; all these concerns are closely related to soil’sphysical and chemical properties. The objective of land capability classificationis to eliminate limitations for increasing crop productivity. There are four soilcapacity classifications, i.e. I, II, III, and IV, defined as follows:
l Class I – Land has almost no limitations or hazards for crop productionand/or risks of soil damage.
l Class II – Land has some limitations or hazards and/or risks of soil damage,and some improvement practices are required for normal crop production.
l Class III – Land has many limitations or hazards and/or risks of soildamage, and fairly intensive improvement practices are required.
l Class IV – Land has great natural limitations, so it is difficult to use asarable land.
5.1.3. Factors Affecting the Capability Classification
The classification standard varies according to types of crops, such as paddy,upland, orchard, and grassland. In Japan, the Soil Potential ProductivityClassification is carried out by evaluating each of the standard factors, or theinherent soil characteristics; some of these factors are determined by a com-bination of dependent factors, or supplementary soil characteristics. Thestandard and dependent factors are described in sections (a)–(m) that follow.
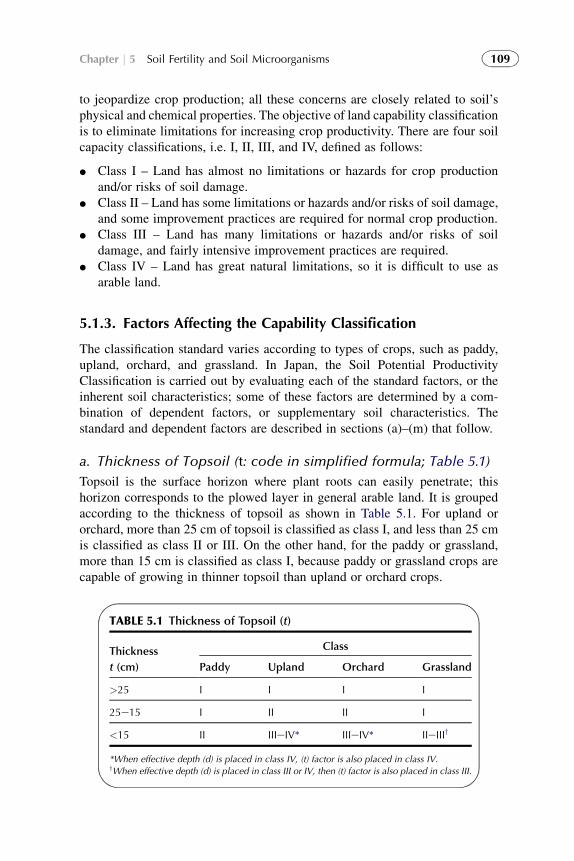
a. Thickness of Topsoil (t: code in simplified formula; Table 5.1)
Topsoil is the surface horizon where plant roots can easily penetrate; thishorizon corresponds to the plowed layer in general arable land. It is groupedaccording to the thickness of topsoil as shown in Table 5.1. For upland ororchard, more than 25 cm of topsoil is classified as class I, and less than 25 cmis classified as class II or III. On the other hand, for the paddy or grassland,more than 15 cm is classified as class I, because paddy or grassland crops arecapable of growing in thinner topsoil than upland or orchard crops.
TABLE 5.1 Thickness of Topsoil (t)
Thickness
t (cm)
Class
Paddy Upland Orchard Grassland
>25 I I I I
25e15 I II II I
<15 II IIIeIV* IIIeIV* IIeIIIy
*When effective depth (d) is placed in class IV, (t) factor is also placed in class IV.yWhen effective depth (d) is placed in class III or IV, then (t) factor is also placed in class III.
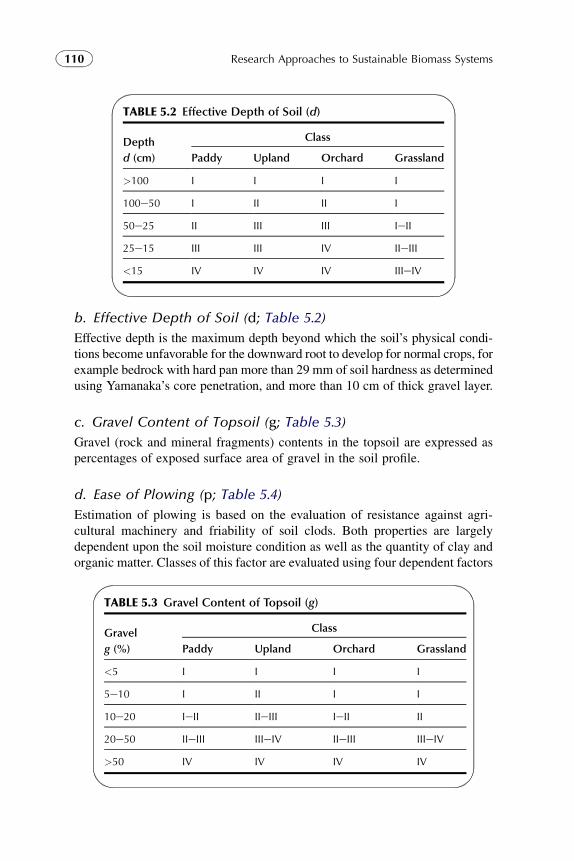
TABLE 5.2 Effective Depth of Soil (d)
Depth
d (cm)
Class
Paddy Upland Orchard Grassland
>100 I I I I
100e50 I II II I
50e25 II III III IeII
25e15 III III IV IIeIII
<15 IV IV IV IIIeIV
110 Research Approaches to Sustainable Biomass Systems
b. Effective Depth of Soil (d; Table 5.2)
Effective depth is the maximum depth beyond which the soil’s physical condi-tions become unfavorable for the downward root to develop for normal crops, forexample bedrock with hard pan more than 29 mm of soil hardness as determinedusing Yamanaka’s core penetration, and more than 10 cm of thick gravel layer.
c. Gravel Content of Topsoil (g; Table 5.3)
Gravel (rock and mineral fragments) contents in the topsoil are expressed aspercentages of exposed surface area of gravel in the soil profile.
d. Ease of Plowing (p; Table 5.4)
Estimation of plowing is based on the evaluation of resistance against agri-cultural machinery and friability of soil clods. Both properties are largelydependent upon the soil moisture condition as well as the quantity of clay andorganic matter. Classes of this factor are evaluated using four dependent factors
TABLE 5.3 Gravel Content of Topsoil (g)
Gravel
g (%)
Class
Paddy Upland Orchard Grassland
<5 I I I I
5e10 I II I I
10e20 IeII IIeIII IeII II
20e50 IIeIII IIIeIV IIeIII IIIeIV
>50 IV IV IV IV
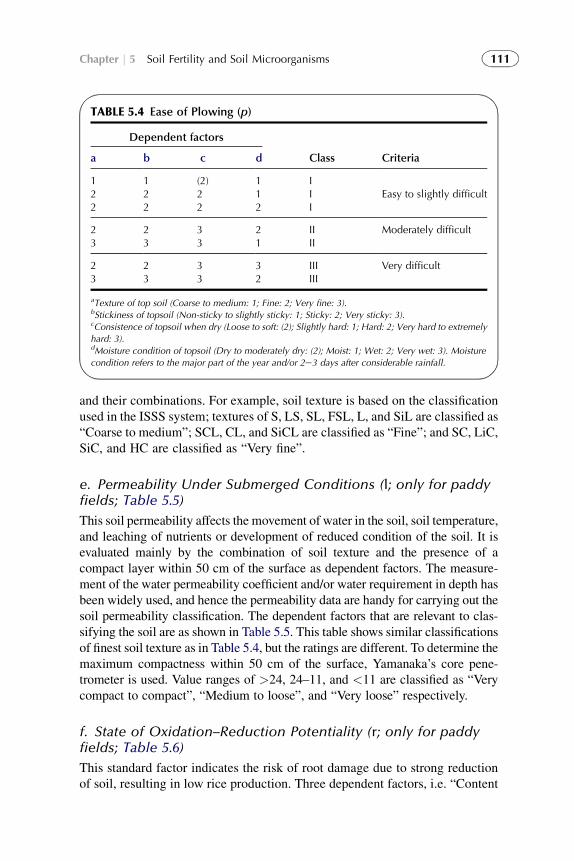
TABLE 5.4 Ease of Plowing (p)
Dependent factors
Class Criteriaa b c d
122
122
(2)22
112
III
Easy to slightly difficult
23
23
33
21
IIII
Moderately difficult
23
23
33
32
IIIIII
Very difficult
aTexture of top soil (Coarse to medium: 1; Fine: 2; Very fine: 3).bStickiness of topsoil (Non-sticky to slightly sticky: 1; Sticky: 2; Very sticky: 3).cConsistence of topsoil when dry (Loose to soft: (2); Slightly hard: 1; Hard: 2; Very hard to extremely
hard: 3).dMoisture condition of topsoil (Dry to moderately dry: (2); Moist: 1; Wet: 2; Very wet: 3). Moisture
condition refers to the major part of the year and/or 2e3 days after considerable rainfall.
111Chapter j 5 Soil Fertility and Soil Microorganisms
and their combinations. For example, soil texture is based on the classificationused in the ISSS system; textures of S, LS, SL, FSL, L, and SiL are classified as“Coarse to medium”; SCL, CL, and SiCL are classified as “Fine”; and SC, LiC,SiC, and HC are classified as “Very fine”.
e. Permeability Under Submerged Conditions (l; only for paddyfields; Table 5.5)
This soil permeability affects the movement of water in the soil, soil temperature,and leaching of nutrients or development of reduced condition of the soil. It isevaluated mainly by the combination of soil texture and the presence of acompact layer within 50 cm of the surface as dependent factors. The measure-ment of the water permeability coefficient and/or water requirement in depth hasbeen widely used, and hence the permeability data are handy for carrying out thesoil permeability classification. The dependent factors that are relevant to clas-sifying the soil are as shown in Table 5.5. This table shows similar classificationsof finest soil texture as in Table 5.4, but the ratings are different. To determine themaximum compactness within 50 cm of the surface, Yamanaka’s core pene-trometer is used. Value ranges of >24, 24–11, and <11 are classified as “Verycompact to compact”, “Medium to loose”, and “Very loose” respectively.
f. State of Oxidation–Reduction Potentiality (r; only for paddyfields; Table 5.6)
This standard factor indicates the risk of root damage due to strong reductionof soil, resulting in low rice production. Three dependent factors, i.e. “Content
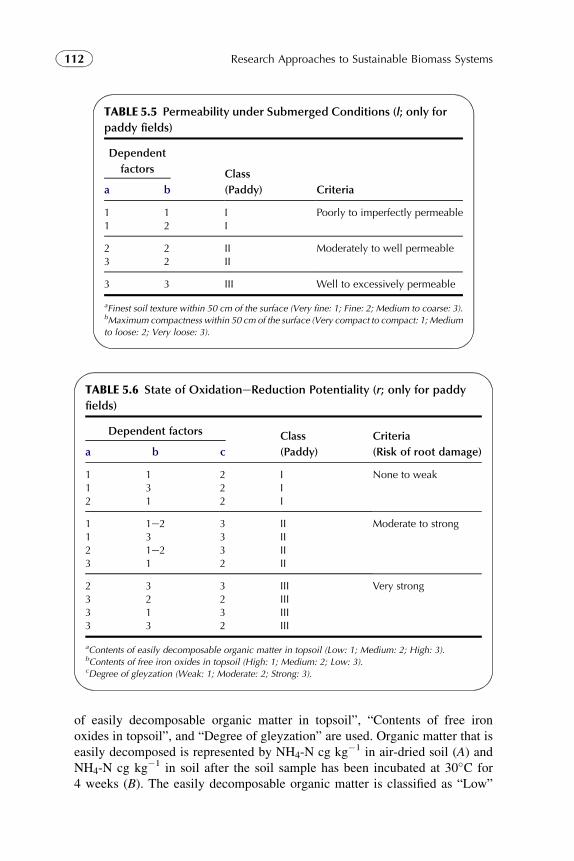
TABLE 5.5 Permeability under Submerged Conditions (l; only for
paddy fields)
Dependent
factors Class
(Paddy) Criteriaa b
1 1 I Poorly to imperfectly permeable1 2 I
2 2 II Moderately to well permeable3 2 II
3 3 III Well to excessively permeable
aFinest soil texture within 50 cm of the surface (Very fine: 1; Fine: 2; Medium to coarse: 3).bMaximum compactness within 50 cm of the surface (Very compact to compact: 1; Medium
to loose: 2; Very loose: 3).
TABLE 5.6 State of OxidationeReduction Potentiality (r; only for paddy
fields)
Dependent factors Class
(Paddy)
Criteria
(Risk of root damage)a b c
1 1 2 I None to weak1 3 2 I2 1 2 I
1 1e2 3 II Moderate to strong1 3 3 II2 1e2 3 II3 1 2 II
2 3 3 III Very strong3 2 2 III3 1 3 III3 3 2 III
aContents of easily decomposable organic matter in topsoil (Low: 1; Medium: 2; High: 3).bContents of free iron oxides in topsoil (High: 1; Medium: 2; Low: 3).cDegree of gleyzation (Weak: 1; Moderate: 2; Strong: 3).
112 Research Approaches to Sustainable Biomass Systems
of easily decomposable organic matter in topsoil”, “Contents of free ironoxides in topsoil”, and “Degree of gleyzation” are used. Organic matter that iseasily decomposed is represented by NH4-N cg kg�1 in air-dried soil (A) andNH4-N cg kg�1 in soil after the soil sample has been incubated at 30�C for4 weeks (B). The easily decomposable organic matter is classified as “Low”
113Chapter j 5 Soil Fertility and Soil Microorganisms
(A < 10, B < 10), “Medium” (A: 10–20; B: 10–15), and “High” (A: >20; B:>15). If based on the content of free iron oxides (cg kg�1), the topsoil can beclassified as “High” (>1.5), “Medium” (1.5–0.8), and “Low” (<0.8). For thedegree of gleyzation, the depth of the top gley horizon is used, and the soil isclassified as “Weak” (�50 cm), “Moderate” (50 cm to bottom of plow layer),and “Strong” (above the bottom of plow layer). Peat and muck are regarded asthe gley horizon.
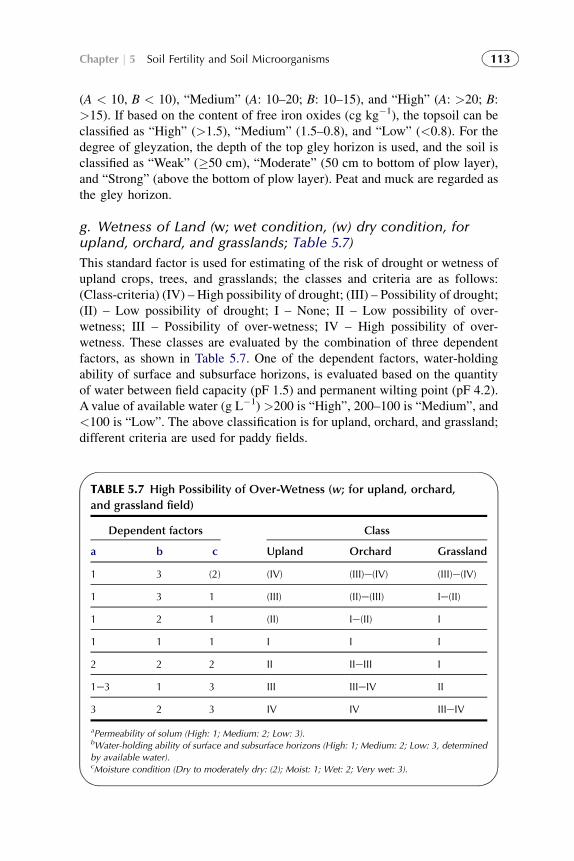
g. Wetness of Land (w; wet condition, (w) dry condition, forupland, orchard, and grasslands; Table 5.7)
This standard factor is used for estimating of the risk of drought or wetness ofupland crops, trees, and grasslands; the classes and criteria are as follows:(Class-criteria) (IV) – High possibility of drought; (III) – Possibility of drought;(II) – Low possibility of drought; I – None; II – Low possibility of over-wetness; III – Possibility of over-wetness; IV – High possibility of over-wetness. These classes are evaluated by the combination of three dependentfactors, as shown in Table 5.7. One of the dependent factors, water-holdingability of surface and subsurface horizons, is evaluated based on the quantityof water between field capacity (pF 1.5) and permanent wilting point (pF 4.2).A value of available water (g L�1) >200 is “High”, 200–100 is “Medium”, and<100 is “Low”. The above classification is for upland, orchard, and grassland;different criteria are used for paddy fields.
TABLE 5.7 High Possibility of Over-Wetness (w; for upland, orchard,
and grassland field)
Dependent factors Class
a b c Upland Orchard Grassland
1 3 (2) (IV) (III)e(IV) (III)e(IV)
1 3 1 (III) (II)e(III) Ie(II)
1 2 1 (II) Ie(II) I
1 1 1 I I I
2 2 2 II IIeIII I
1e3 1 3 III IIIeIV II
3 2 3 IV IV IIIeIV
aPermeability of solum (High: 1; Medium: 2; Low: 3).bWater-holding ability of surface and subsurface horizons (High: 1; Medium: 2; Low: 3, determined
by available water).cMoisture condition (Dry to moderately dry: (2); Moist: 1; Wet: 2; Very wet: 3).
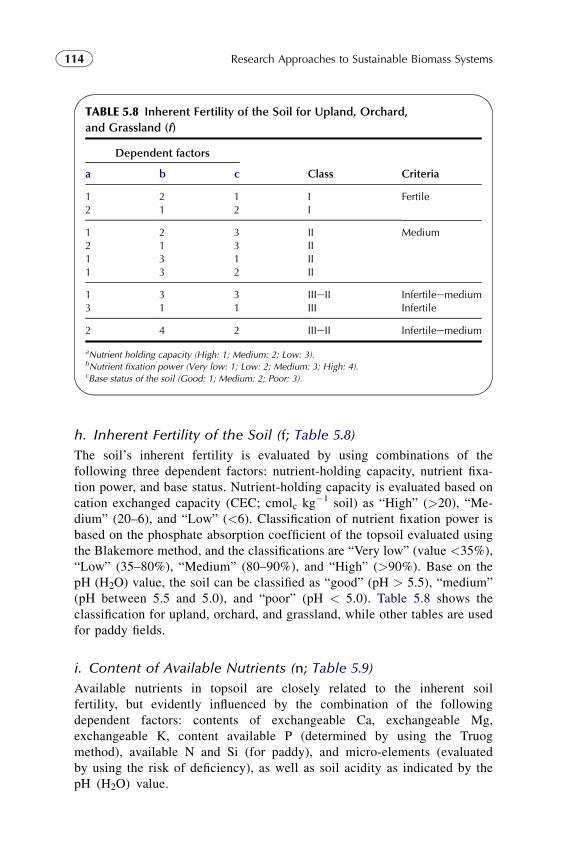
TABLE 5.8 Inherent Fertility of the Soil for Upland, Orchard,
and Grassland (f)
Dependent factors
Class Criteriaa b c
1 2 1 I Fertile2 1 2 I
1 2 3 II Medium2 1 3 II1 3 1 II1 3 2 II
1 3 3 IIIeII Infertileemedium3 1 1 III Infertile
2 4 2 IIIeII Infertileemedium
aNutrient holding capacity (High: 1; Medium: 2; Low: 3).bNutrient fixation power (Very low: 1; Low: 2; Medium: 3; High: 4).cBase status of the soil (Good: 1; Medium: 2; Poor: 3).
114 Research Approaches to Sustainable Biomass Systems
h. Inherent Fertility of the Soil (f; Table 5.8)
The soil’s inherent fertility is evaluated by using combinations of thefollowing three dependent factors: nutrient-holding capacity, nutrient fixa-tion power, and base status. Nutrient-holding capacity is evaluated based oncation exchanged capacity (CEC; cmolc kg�1 soil) as “High” (>20), “Me-dium” (20–6), and “Low” (<6). Classification of nutrient fixation power isbased on the phosphate absorption coefficient of the topsoil evaluated usingthe Blakemore method, and the classifications are “Very low” (value <35%),“Low” (35–80%), “Medium” (80–90%), and “High” (>90%). Base on thepH (H2O) value, the soil can be classified as “good” (pH > 5.5), “medium”(pH between 5.5 and 5.0), and “poor” (pH < 5.0). Table 5.8 shows theclassification for upland, orchard, and grassland, while other tables are usedfor paddy fields.
i. Content of Available Nutrients (n; Table 5.9)
Available nutrients in topsoil are closely related to the inherent soilfertility, but evidently influenced by the combination of the followingdependent factors: contents of exchangeable Ca, exchangeable Mg,exchangeable K, content available P (determined by using the Truogmethod), available N and Si (for paddy), and micro-elements (evaluatedby using the risk of deficiency), as well as soil acidity as indicated by thepH (H2O) value.
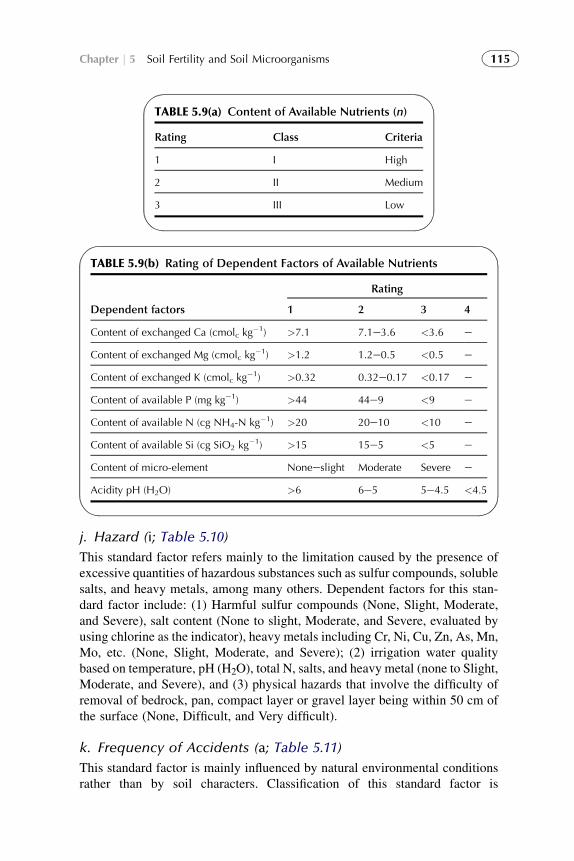
TABLE 5.9(b) Rating of Dependent Factors of Available Nutrients
Dependent factors
Rating
1 2 3 4
Content of exchanged Ca (cmolc kg�1) >7.1 7.1e3.6 <3.6 e
Content of exchanged Mg (cmolc kg�1) >1.2 1.2e0.5 <0.5 e
Content of exchanged K (cmolc kg�1) >0.32 0.32e0.17 <0.17 e
Content of available P (mg kg�1) >44 44e9 <9 e
Content of available N (cg NH4-N kg�1) >20 20e10 <10 e
Content of available Si (cg SiO2 kg�1) >15 15e5 <5 e
Content of micro-element Noneeslight Moderate Severe e
Acidity pH (H2O) >6 6e5 5e4.5 <4.5
TABLE 5.9(a) Content of Available Nutrients (n)
Rating Class Criteria
1 I High
2 II Medium
3 III Low
115Chapter j 5 Soil Fertility and Soil Microorganisms
j. Hazard (i; Table 5.10)
This standard factor refers mainly to the limitation caused by the presence ofexcessive quantities of hazardous substances such as sulfur compounds, solublesalts, and heavy metals, among many others. Dependent factors for this stan-dard factor include: (1) Harmful sulfur compounds (None, Slight, Moderate,and Severe), salt content (None to slight, Moderate, and Severe, evaluated byusing chlorine as the indicator), heavy metals including Cr, Ni, Cu, Zn, As, Mn,Mo, etc. (None, Slight, Moderate, and Severe); (2) irrigation water qualitybased on temperature, pH (H2O), total N, salts, and heavy metal (none to Slight,Moderate, and Severe), and (3) physical hazards that involve the difficulty ofremoval of bedrock, pan, compact layer or gravel layer being within 50 cm ofthe surface (None, Difficult, and Very difficult).
k. Frequency of Accidents (a; Table 5.11)
This standard factor is mainly influenced by natural environmental conditionsrather than by soil characters. Classification of this standard factor is
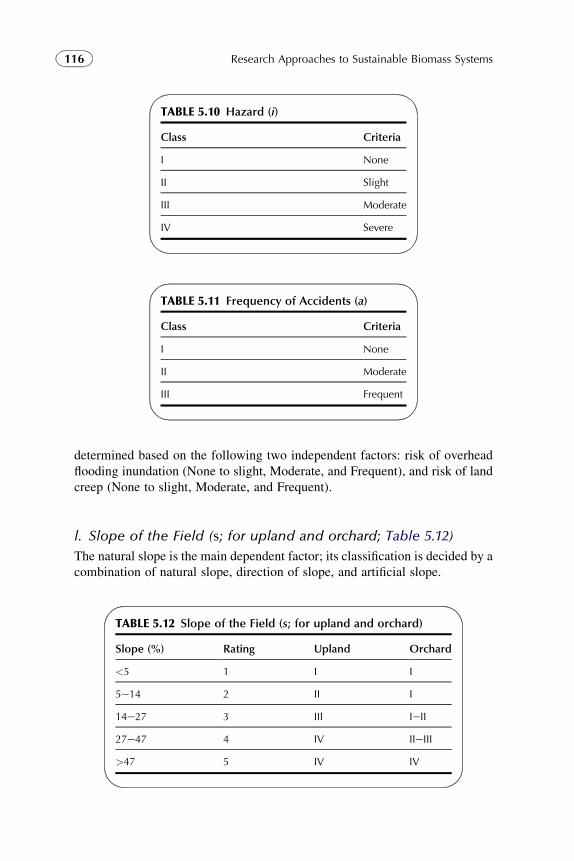
TABLE 5.10 Hazard (i)
Class Criteria
I None
II Slight
III Moderate
IV Severe
TABLE 5.11 Frequency of Accidents (a)
Class Criteria
I None
II Moderate
III Frequent
116 Research Approaches to Sustainable Biomass Systems
determined based on the following two independent factors: risk of overheadflooding inundation (None to slight, Moderate, and Frequent), and risk of landcreep (None to slight, Moderate, and Frequent).
l. Slope of the Field (s; for upland and orchard; Table 5.12)
The natural slope is the main dependent factor; its classification is decided by acombination of natural slope, direction of slope, and artificial slope.
TABLE 5.12 Slope of the Field (s; for upland and orchard)
Slope (%) Rating Upland Orchard
<5 1 I I
5e14 2 II I
14e27 3 III IeII
27e47 4 IV IIeIII
>47 5 IV IV
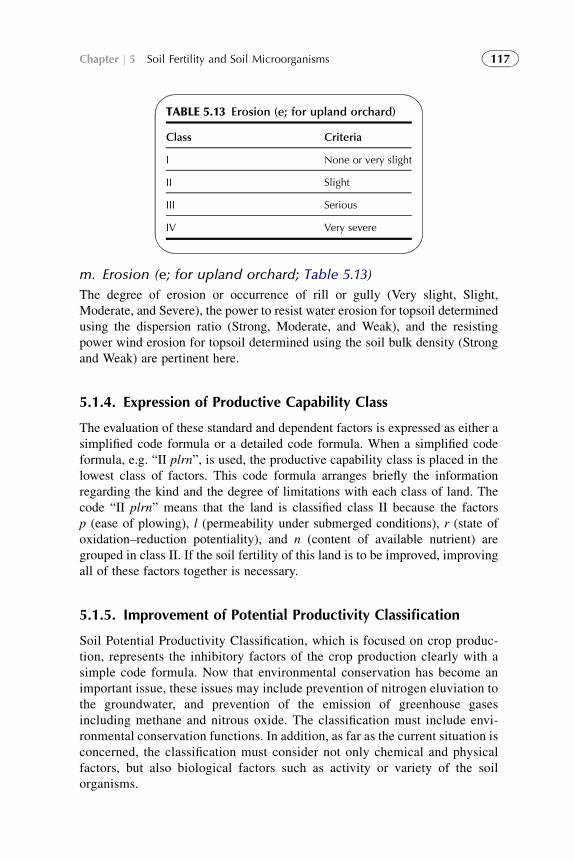
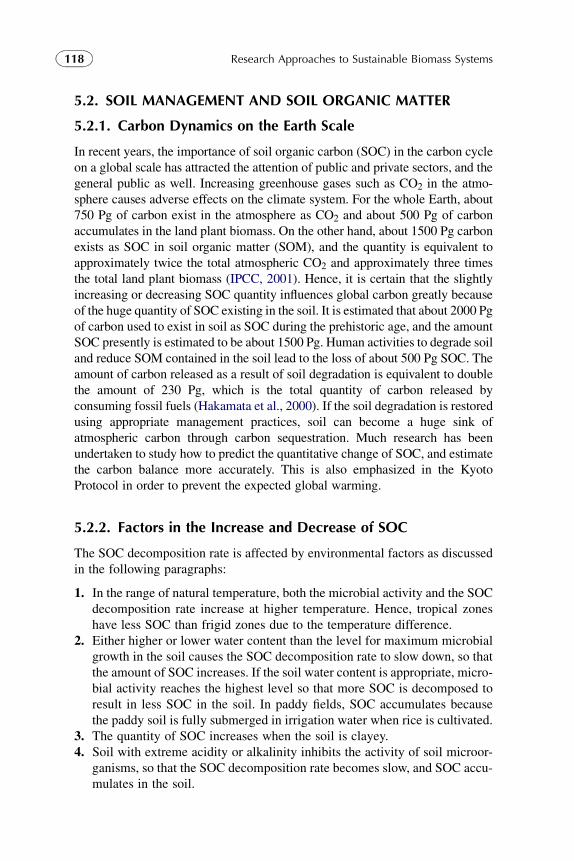
TABLE 5.13 Erosion (e; for upland orchard)
Class Criteria
I None or very slight
II Slight
III Serious
IV Very severe
117Chapter j 5 Soil Fertility and Soil Microorganisms
m. Erosion (e; for upland orchard; Table 5.13)
The degree of erosion or occurrence of rill or gully (Very slight, Slight,Moderate, and Severe), the power to resist water erosion for topsoil determinedusing the dispersion ratio (Strong, Moderate, and Weak), and the resistingpower wind erosion for topsoil determined using the soil bulk density (Strongand Weak) are pertinent here.
5.1.4. Expression of Productive Capability Class
The evaluation of these standard and dependent factors is expressed as either asimplified code formula or a detailed code formula. When a simplified codeformula, e.g. “II plrn”, is used, the productive capability class is placed in thelowest class of factors. This code formula arranges briefly the informationregarding the kind and the degree of limitations with each class of land. Thecode “II plrn” means that the land is classified class II because the factorsp (ease of plowing), l (permeability under submerged conditions), r (state ofoxidation–reduction potentiality), and n (content of available nutrient) aregrouped in class II. If the soil fertility of this land is to be improved, improvingall of these factors together is necessary.
5.1.5. Improvement of Potential Productivity Classification
Soil Potential Productivity Classification, which is focused on crop produc-tion, represents the inhibitory factors of the crop production clearly with asimple code formula. Now that environmental conservation has become animportant issue, these issues may include prevention of nitrogen eluviation tothe groundwater, and prevention of the emission of greenhouse gasesincluding methane and nitrous oxide. The classification must include envi-ronmental conservation functions. In addition, as far as the current situation isconcerned, the classification must consider not only chemical and physicalfactors, but also biological factors such as activity or variety of the soilorganisms.
118 Research Approaches to Sustainable Biomass Systems
5.2. SOIL MANAGEMENT AND SOIL ORGANIC MATTER
5.2.1. Carbon Dynamics on the Earth Scale
In recent years, the importance of soil organic carbon (SOC) in the carbon cycleon a global scale has attracted the attention of public and private sectors, and thegeneral public as well. Increasing greenhouse gases such as CO2 in the atmo-sphere causes adverse effects on the climate system. For the whole Earth, about750 Pg of carbon exist in the atmosphere as CO2 and about 500 Pg of carbonaccumulates in the land plant biomass. On the other hand, about 1500 Pg carbonexists as SOC in soil organic matter (SOM), and the quantity is equivalent toapproximately twice the total atmospheric CO2 and approximately three timesthe total land plant biomass (IPCC, 2001). Hence, it is certain that the slightlyincreasing or decreasing SOC quantity influences global carbon greatly becauseof the huge quantity of SOC existing in the soil. It is estimated that about 2000 Pgof carbon used to exist in soil as SOC during the prehistoric age, and the amountSOC presently is estimated to be about 1500 Pg. Human activities to degrade soiland reduce SOM contained in the soil lead to the loss of about 500 Pg SOC. Theamount of carbon released as a result of soil degradation is equivalent to doublethe amount of 230 Pg, which is the total quantity of carbon released byconsuming fossil fuels (Hakamata et al., 2000). If the soil degradation is restoredusing appropriate management practices, soil can become a huge sink ofatmospheric carbon through carbon sequestration. Much research has beenundertaken to study how to predict the quantitative change of SOC, and estimatethe carbon balance more accurately. This is also emphasized in the KyotoProtocol in order to prevent the expected global warming.
5.2.2. Factors in the Increase and Decrease of SOC
The SOC decomposition rate is affected by environmental factors as discussedin the following paragraphs:
1. In the range of natural temperature, both the microbial activity and the SOCdecomposition rate increase at higher temperature. Hence, tropical zoneshave less SOC than frigid zones due to the temperature difference.
2. Either higher or lower water content than the level for maximum microbialgrowth in the soil causes the SOC decomposition rate to slow down, so thatthe amount of SOC increases. If the soil water content is appropriate, micro-bial activity reaches the highest level so that more SOC is decomposed toresult in less SOC in the soil. In paddy fields, SOC accumulates becausethe paddy soil is fully submerged in irrigation water when rice is cultivated.
3. The quantity of SOC increases when the soil is clayey.4. Soil with extreme acidity or alkalinity inhibits the activity of soil microor-
ganisms, so that the SOC decomposition rate becomes slow, and SOC accu-mulates in the soil.
119Chapter j 5 Soil Fertility and Soil Microorganisms
5. The amount of SOC increases in soil that is not tilled for growing crops.6. The amount of SOC increases if more organic matter such as plant residues
or composts is applied.7. The amount of SOC increases when the organic matter applied to the soil
contains a higher C/N ratio.8. If the ratio of organic matter that is refractory to microbial decomposition,
e.g. lignin, is applied, the quantity of SOC increases.
5.2.3. Principle of Rothamsted Carbon Model
Among the many SOM turnover models proposed by international researchers,the Rothamsted Carbon model (RothC) developed for non-waterlogged soilwill be reviewed. RothC was developed by Jenkinson and Rayner (1977) basedon data from long-term experiments on soils at the Rothamsted ExperimentalStation (currently known as Rothamsted Research) in the UK. The model hasbeen improved several times, and the current version is known as RothC-26(Coleman and Jenkinson, 1996).
RothC is one of themulticompartmentalmodels inwhich SOC is split into onenon-active compartment and four active compartments with different decompo-sition rates. The calculation is carried out on a monthly basis. Incoming plantcarbon is split between decomposable plant material (DPM) and resistant plantmaterial (RPM) depending on the DPM/RPM ratio of the carbon. Both DPM andRPM decompose to form microbial biomass (BIO), humified organic matter(HUM), and partly CO2 that is lost from the system. The proportion that goes toCO2 and to BIOþHUM is determined by the clay content of the soil; clayey soilhas a slower SOC decomposition rate than sandy soil. Both BIO and HUM un-dergo further decomposition repeatedly to produce more CO2 as well as otherspecies ofBIO andHUM.Themodel also includes inert organicmatter (IOM) thatdoes not decompose so that it remains in the soil with the quantity unchanged.DecompositionofSOCs in the four active compartments except IOMfollowsfirst-order kineticswith different characteristic decomposition rate constants. Both soiltemperature and/or water content influence the magnitude of this rate constant; afast decomposition rate is expected at high temperature and slow decompositionrate constant with dry soil.When the soil experiences temperature changes to alterthe SOC decomposition rate, the decomposition rate constants are modified bymultiplying by one or more “rate modifiers”.
The input data required to run the model include:
1. Monthly rainfall (mm)2. Monthly open pan evaporation (mm)3. Average monthly air temperature (�C)4. Clay content of the top soil (as a percentage)5. An estimate of the decomposability of the incoming plant material – DPM/
RPM ratio
120 Research Approaches to Sustainable Biomass Systems
6. Soil cover – Is the soil bare or vegetated in a particular month?7. Monthly input of plant residues (Mg-C ha�1)8. Monthly input of farmyard manure (FYM, in Mg-C ha�1), if any.
The PC software to run RothC can be downloaded free from the website http://www.rothamsted.ac.uk/aen/carbon/rothc.htm.
5.2.4. Modification of RothC for Andosols and Paddy Soils
RothC has been used to adequately simulate changes in the SOC content for avariety of upland soil types, including arable land and grassland in Europe andthe USA. In Japan, Andosols and paddy soils are major arable soils in Japan,and they have slow organic matter decomposition rates. However, this modeldoes not simulate SOC changes in Andosols and paddy soils in Japan withsatisfactory results. Modifications of the RothC model have been performedin recent years for a better application to Japanese characteristic fields(Shirato et al., 2004; Shirato and Yokozawa, 2005).
The main reason that RothC does not work properly for Andosols is thatactive aluminum formed in the weathering process of the volcanic ash holdsorganic matter strongly. The presence of Al–humus complexes in Andosolsmakes the HUM pool extremely stable. This has not been considered in theoriginal RothC model. In the modified RothC model for Andosols, a factor H(f)is incorporated, and the value of H(f) is calculated based on the quantity ofpyrophosphate extractable aluminum (Alp), i.e. H(f) ¼ 1.20 þ 2.50 � Alp (%).The decomposition rate of the HUM compartment is modified by dividing theoriginal HUM by H(f). The IOM pool is set to “zero” because the soil did notcontain carbon when it was formed from fresh volcanic ash. The modifiedmodel has been evaluated with satisfactory results by using sets of long-termexperimental data collected on Andosols under various climate conditions.
The main reason for the slow decomposition rate of organic matter during therice-growing season in flooded paddy fields is that the submerged soils arewaterlogged and subjected to anaerobic conditions to hamper the activities of soilmicroorganisms. On the other hand, the decomposition of organic matter isinhibited in paddy soils not only during the submergence period but alsothroughout the whole year because of the difference in the composition ofmicroorganisms between upland and paddy soils. The decomposition rate in themodifiedRothCmodel for paddyfields is set to 0.2-fold in the submergence period(summer) and 0.6-fold in the period without submergence (winter) as comparedwith the original model. These modifications have been found to be satisfactoryfor the long-term experimental data sets collected from paddy soils.
5.2.5. Application of Modified RothC
Box 5.1 shows examples of utilizing the modified RothC. It becomes clear thatcultivation of the forage rice for high crop yield will assist in alleviating global
BOX 5.1 Prediction of Soil Organic Carbon Sequestration Change usingModified Rothamsted Carbon Model
The method of predicting changes of soil organic carbon (SOC) using the modified
Rothamsted Carbon model (RothC) is explained here.
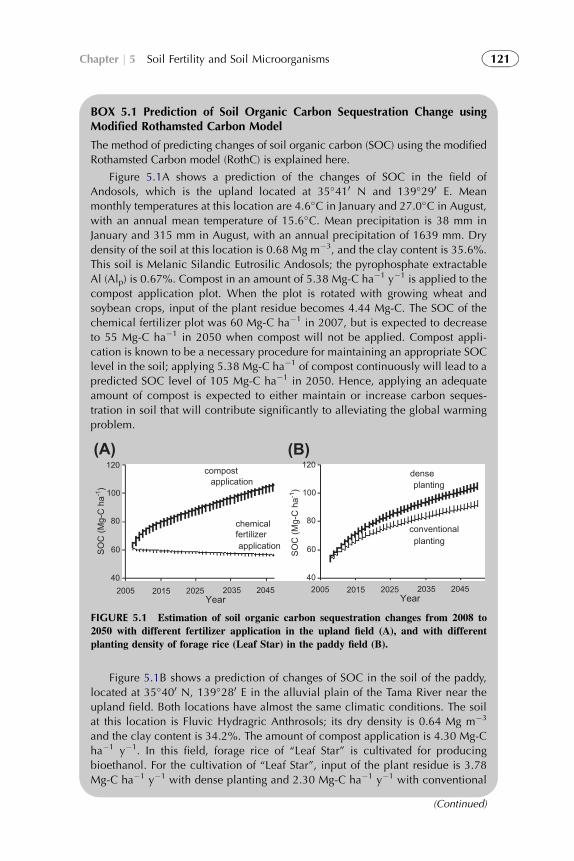
Figure 5.1A shows a prediction of the changes of SOC in the field of
Andosols, which is the upland located at 35�410 N and 139�290 E. Mean
monthly temperatures at this location are 4.6�C in January and 27.0�C in August,
with an annual mean temperature of 15.6�C. Mean precipitation is 38 mm in
January and 315 mm in August, with an annual precipitation of 1639 mm. Dry
density of the soil at this location is 0.68 Mg m�3, and the clay content is 35.6%.
This soil is Melanic Silandic Eutrosilic Andosols; the pyrophosphate extractable
Al (Alp) is 0.67%. Compost in an amount of 5.38 Mg-C ha�1 y�1 is applied to the
compost application plot. When the plot is rotated with growing wheat and
soybean crops, input of the plant residue becomes 4.44 Mg-C. The SOC of the
chemical fertilizer plot was 60 Mg-C ha�1 in 2007, but is expected to decrease
to 55 Mg-C ha�1 in 2050 when compost will not be applied. Compost appli-
cation is known to be a necessary procedure for maintaining an appropriate SOC
level in the soil; applying 5.38 Mg-C ha�1 of compost continuously will lead to a
predicted SOC level of 105 Mg-C ha�1 in 2050. Hence, applying an adequate
amount of compost is expected to either maintain or increase carbon seques-
tration in soil that will contribute significantly to alleviating the global warming
problem.
Figure 5.1B shows a prediction of changes of SOC in the soil of the paddy,
located at 35�400 N, 139�280 E in the alluvial plain of the Tama River near the
upland field. Both locations have almost the same climatic conditions. The soil
at this location is Fluvic Hydragric Anthrosols; its dry density is 0.64 Mg m�3
and the clay content is 34.2%. The amount of compost application is 4.30 Mg-C
ha�1 y�1. In this field, forage rice of “Leaf Star” is cultivated for producing
bioethanol. For the cultivation of “Leaf Star”, input of the plant residue is 3.78
Mg-C ha�1 y�1 with dense planting and 2.30 Mg-C ha�1 y�1 with conventional
(Continued)
120
100
80
60
40
120
100
80
60
402005 2015 2025 2035 2045
Year2005 2015 2025 2035 2045
Year
compostapplication
application
chemicalfertilizer
denseplanting
plantingconventional
SOC
(Mg-
C h
a-1)
SOC
(Mg-
C h
a-1)
(A) (B)
FIGURE 5.1 Estimation of soil organic carbon sequestration changes from 2008 to
2050 with different fertilizer application in the upland field (A), and with different
planting density of forage rice (Leaf Star) in the paddy field (B).
121Chapter j 5 Soil Fertility and Soil Microorganisms
BOX 5.1 Prediction of Soil Organic Carbon Sequestration Change usingModified Rothamsted Carbon ModeleCont’d
planting. The cultivation of forage rice requires more plant residue to be plowed
into the soil, and as a result SOC is predicted to increase to 92 Mg-C ha�1 for
conventional planting and 106 Mg-C ha�1 for dense planting in 2050. Cultiva-
tion of the forage rice in high yield will contribute to alleviating the global
warming problem through bioethanol production and by increasing soil carbon
sequestration.
122 Research Approaches to Sustainable Biomass Systems
warming through not only bioethanol production but also increased soil carbonsequestration. Hence, a turnover of SOC varies according to the difference incropping system so that changes of SOC sequestration can be predicted usingan appropriate model such as RothC. Additionally, choosing an appropriatecropping system that does not alter the SOC sequestration process needs to beconsidered for future agricultural activities.
5.3. SOIL MICROORGANISMS
Akane Katsuta and Koki Toyota
Soil microbes are mainly composed of bacteria, fungi, protozoa, algae, archaeasuch as methanogens and halobacteria, and viruses. They play crucial roles insoil function, especially in nutrient cycling, and thus contribute to sustainablecrop production. In agricultural systems, the contribution of synthetic nitrogenfertilizers to crop production is unequivocal. Surprisingly, the largest amount ofnitrogen uptake by a crop is derived from the mineralization of soil organicmatter in general. Soil microbes are essential to this mineralization process, andsoils with higher nitrogen-supplying capacity are considered to have higher soilfertility. In this section, general aspects of soil microbes are presented byemphasizing the role of soil microbes involved in crop production. In the nextsection, microbial mediation of soil fertility is discussed.
5.3.1. Abundance and Biomass
In general, hundreds of millions to billions of bacteria and hundreds of thousandsto millions of fungi exist in 1 g of soil, although the number of microorganismsdiffers depending on soil properties and environmental conditions (Table 5.14).The total amount of microbial biomass ranges from 0.1 to 1 mg g�1 of soil.Bacteria and fungi are the two predominant soil microbes in number and mass.The third most dominant category of microbes are protozoa consisting of ciliate,flagellate and ameba, and their numbers range from tens to hundreds of thou-sands per gram of soil, and their biomass varies from 1 to 10 mg g�1 of soil.
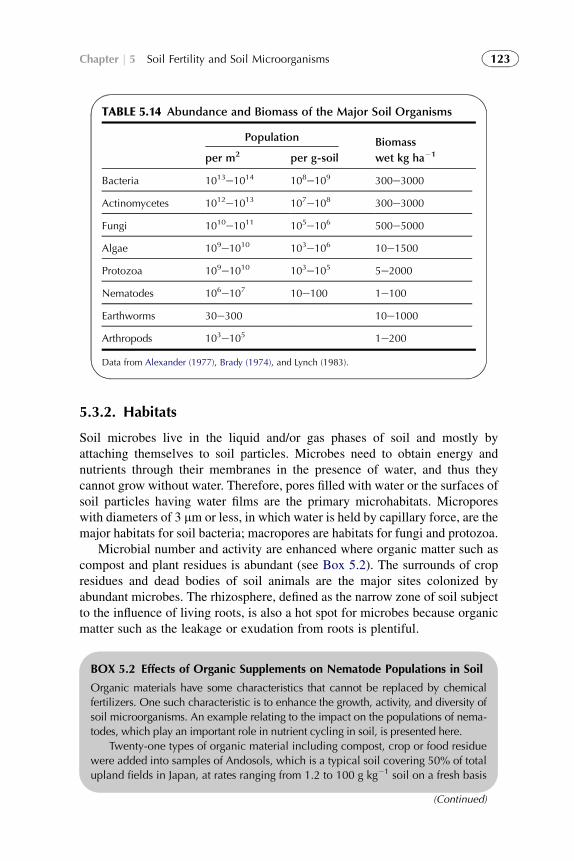
TABLE 5.14 Abundance and Biomass of the Major Soil Organisms
Population Biomass
wet kg ha�1per m2 per g-soil
Bacteria 1013e1014 108e109 300e3000
Actinomycetes 1012e1013 107e108 300e3000
Fungi 1010e1011 105e106 500e5000
Algae 109e1010 103e106 10e1500
Protozoa 109e1010 103e105 5e2000
Nematodes 106e107 10e100 1e100
Earthworms 30e300 10e1000
Arthropods 103e105 1e200
Data from Alexander (1977), Brady (1974), and Lynch (1983).
123Chapter j 5 Soil Fertility and Soil Microorganisms
5.3.2. Habitats
Soil microbes live in the liquid and/or gas phases of soil and mostly byattaching themselves to soil particles. Microbes need to obtain energy andnutrients through their membranes in the presence of water, and thus theycannot grow without water. Therefore, pores filled with water or the surfaces ofsoil particles having water films are the primary microhabitats. Microporeswith diameters of 3 mm or less, in which water is held by capillary force, are themajor habitats for soil bacteria; macropores are habitats for fungi and protozoa.
Microbial number and activity are enhanced where organic matter such ascompost and plant residues is abundant (see Box 5.2). The surrounds of cropresidues and dead bodies of soil animals are the major sites colonized byabundant microbes. The rhizosphere, defined as the narrow zone of soil subjectto the influence of living roots, is also a hot spot for microbes because organicmatter such as the leakage or exudation from roots is plentiful.
BOX 5.2 Effects of Organic Supplements on Nematode Populations in Soil
Organic materials have some characteristics that cannot be replaced by chemical
fertilizers. One such characteristic is to enhance the growth, activity, and diversity of
soil microorganisms. An example relating to the impact on the populations of nema-
todes, which play an important role in nutrient cycling in soil, is presented here.
Twenty-one types of organic material including compost, crop or food residue
were added into samples of Andosols, which is a typical soil covering 50% of total
upland fields in Japan, at rates ranging from 1.2 to 100 g kg�1 soil on a fresh basis
(Continued)
BOX 5.2 Effects of Organic Supplements on Nematode Populations inSoileCont’d
and 0.9e45 g kg�1 soil on a dry basis. After incubation for 3 weeks at 25�C,nematodes were extracted from the soils by using the Baermann funnel method to
be counted under a microscope.
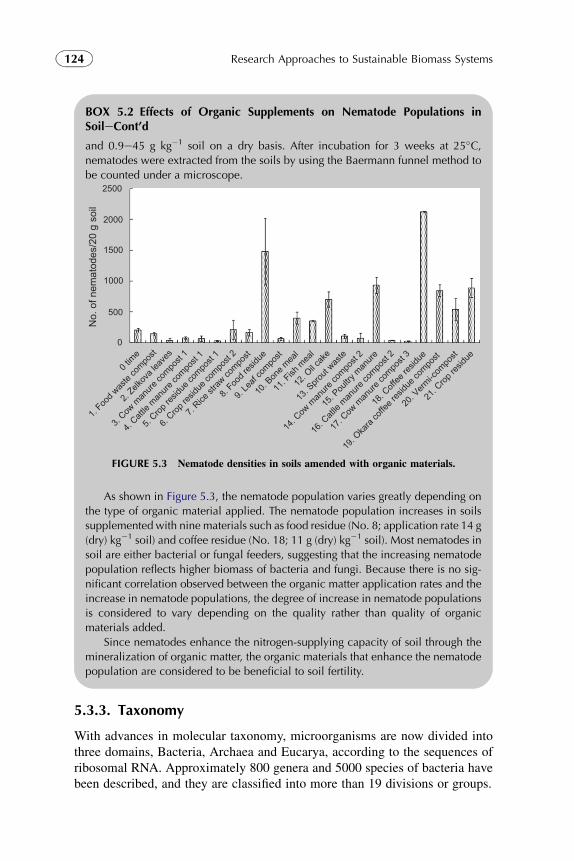
As shown in Figure 5.3, the nematode population varies greatly depending on
the type of organic material applied. The nematode population increases in soils
supplemented with nine materials such as food residue (No. 8; application rate 14 g
(dry) kg�1 soil) and coffee residue (No. 18; 11 g (dry) kg�1 soil). Most nematodes in
soil are either bacterial or fungal feeders, suggesting that the increasing nematode
population reflects higher biomass of bacteria and fungi. Because there is no sig-
nificant correlation observed between the organic matter application rates and the
increase in nematode populations, the degree of increase in nematode populations
is considered to vary depending on the quality rather than quality of organic
materials added.
Since nematodes enhance the nitrogen-supplying capacity of soil through the
mineralization of organic matter, the organic materials that enhance the nematode
population are considered to be beneficial to soil fertility.
2500
2000
1500
1000
500
0
0 tim
e
1. Foo
d was
te co
mpost
2. Zelk
ova l
eave
s
3. Cow
man
ure co
mpost
1
4. Catt
le man
ure co
mpost
1
5. Crop
resid
ue co
mpost
1
6. Crop
resid
ue co
mpost
2
7. Rice
straw
compo
st
8. Foo
d res
idue
9. Le
af co
mpost
10. B
one m
eal
11. F
ish m
eal
12. O
il cak
e
13. S
prout
waste
14. C
ow m
anure
compo
st 2
15. P
oultry
man
ure
16. C
atlle
manure
compo
st 2
17. C
ow m
anure
compo
st 3
18. C
offee
resid
ue
19. O
kara
coffe
e res
idue c
ompo
st
20. V
ermi-c
ompo
st
21. C
rop re
sidue
No.
of n
emat
odes
/20
g so
il
FIGURE 5.3 Nematode densities in soils amended with organic materials.
124 Research Approaches to Sustainable Biomass Systems
5.3.3. Taxonomy
With advances in molecular taxonomy, microorganisms are now divided intothree domains, Bacteria, Archaea and Eucarya, according to the sequences ofribosomal RNA. Approximately 800 genera and 5000 species of bacteria havebeen described, and they are classified into more than 19 divisions or groups.
125Chapter j 5 Soil Fertility and Soil Microorganisms
A bacterial group that used to be called Gram-negative bacteria mainly cor-responds to Proteobacteria and Bacteroides/Chlorobi. Proteobacteria consist offive subdivisions, a, b, g, d, and ε. Symbiotic nitrogen-fixing bacteria Rhizobiumand free-living nitrogen fixing bacteria Azospirillum are included in a-proteo-bacteria. Burkholderia, Ralstonia, and nitrifying bacteria (Nitrosomonas) aremembers of b-proteobacteria. Pseudomonas and Enterobacteriaceae such asEscherichia coli and Salmonera spp. are g-proteobacteria, and sulfate-reducingbacteria (Desulfovibrio) are d-proteobacteria. Cytophagales, as well as Fla-vobacterium and Sphingobacterium, are included in Bacteroides/Chlorobi.Bacteria that used to be called Gram-positive bacteria are divided into two di-visions: Actinobacteria and Firmicutes; Actinobacteria contain filamentous bac-teria such as Streptomyces and coryneform bacteria such asArthrobacter,whereasFirmicutes include spore-forming bacteria such as Bacillus and Clostridium.
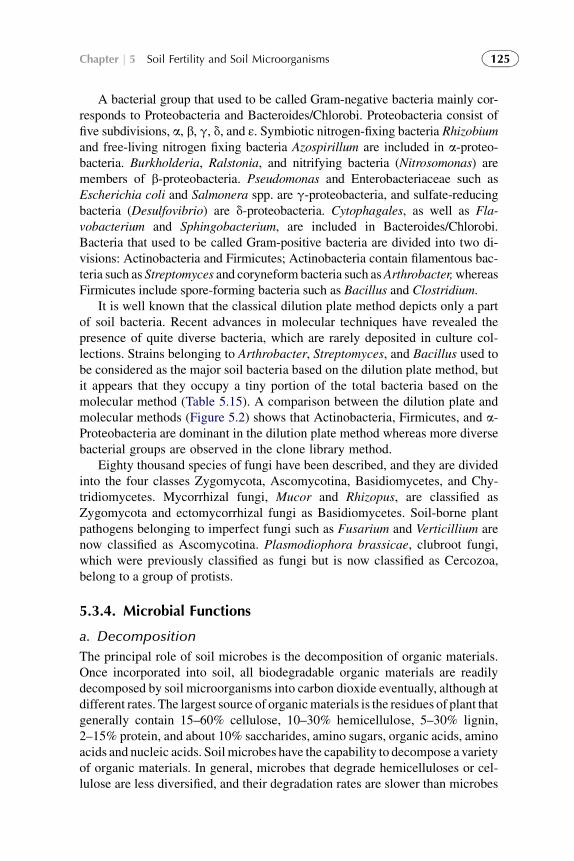
It is well known that the classical dilution plate method depicts only a partof soil bacteria. Recent advances in molecular techniques have revealed thepresence of quite diverse bacteria, which are rarely deposited in culture col-lections. Strains belonging to Arthrobacter, Streptomyces, and Bacillus used tobe considered as the major soil bacteria based on the dilution plate method, butit appears that they occupy a tiny portion of the total bacteria based on themolecular method (Table 5.15). A comparison between the dilution plate andmolecular methods (Figure 5.2) shows that Actinobacteria, Firmicutes, and a-Proteobacteria are dominant in the dilution plate method whereas more diversebacterial groups are observed in the clone library method.
Eighty thousand species of fungi have been described, and they are dividedinto the four classes Zygomycota, Ascomycotina, Basidiomycetes, and Chy-tridiomycetes. Mycorrhizal fungi, Mucor and Rhizopus, are classified asZygomycota and ectomycorrhizal fungi as Basidiomycetes. Soil-borne plantpathogens belonging to imperfect fungi such as Fusarium and Verticillium arenow classified as Ascomycotina. Plasmodiophora brassicae, clubroot fungi,which were previously classified as fungi but is now classified as Cercozoa,belong to a group of protists.
5.3.4. Microbial Functions
a. Decomposition
The principal role of soil microbes is the decomposition of organic materials.Once incorporated into soil, all biodegradable organic materials are readilydecomposed by soil microorganisms into carbon dioxide eventually, although atdifferent rates. The largest source of organicmaterials is the residues of plant thatgenerally contain 15–60% cellulose, 10–30% hemicellulose, 5–30% lignin,2–15% protein, and about 10% saccharides, amino sugars, organic acids, aminoacids and nucleic acids. Soilmicrobes have the capability to decompose a varietyof organic materials. In general, microbes that degrade hemicelluloses or cel-lulose are less diversified, and their degradation rates are slower than microbes
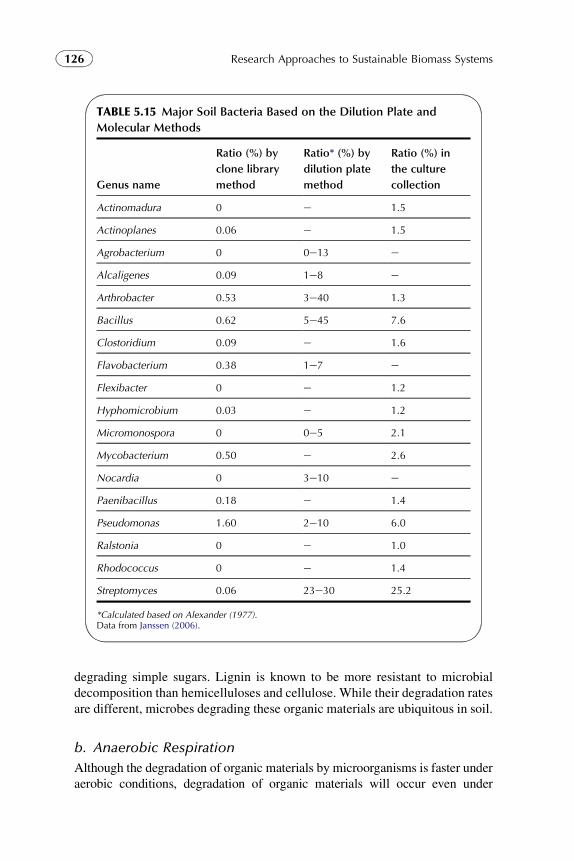
TABLE 5.15 Major Soil Bacteria Based on the Dilution Plate and
Molecular Methods
Genus name
Ratio (%) by
clone library
method
Ratio* (%) by
dilution plate
method
Ratio (%) in
the culture
collection
Actinomadura 0 e 1.5
Actinoplanes 0.06 e 1.5
Agrobacterium 0 0e13 e
Alcaligenes 0.09 1e8 e
Arthrobacter 0.53 3e40 1.3
Bacillus 0.62 5e45 7.6
Clostoridium 0.09 e 1.6
Flavobacterium 0.38 1e7 e
Flexibacter 0 e 1.2
Hyphomicrobium 0.03 e 1.2
Micromonospora 0 0e5 2.1
Mycobacterium 0.50 e 2.6
Nocardia 0 3e10 e
Paenibacillus 0.18 e 1.4
Pseudomonas 1.60 2e10 6.0
Ralstonia 0 e 1.0
Rhodococcus 0 e 1.4
Streptomyces 0.06 23e30 25.2
*Calculated based on Alexander (1977).Data from Janssen (2006).
126 Research Approaches to Sustainable Biomass Systems
degrading simple sugars. Lignin is known to be more resistant to microbialdecomposition than hemicelluloses and cellulose. While their degradation ratesare different, microbes degrading these organic materials are ubiquitous in soil.
b. Anaerobic Respiration
Although the degradation of organic materials by microorganisms is faster underaerobic conditions, degradation of organic materials will occur even under
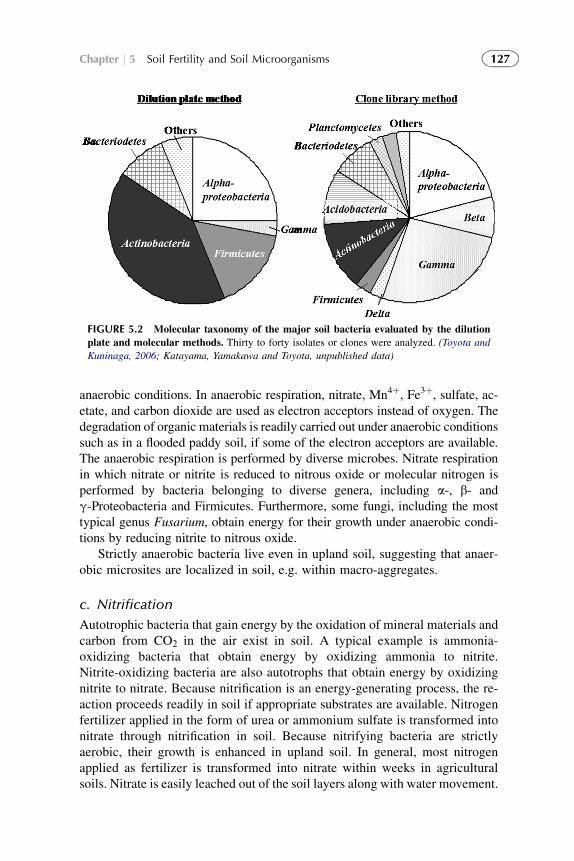
FIGURE 5.2 Molecular taxonomy of the major soil bacteria evaluated by the dilution
plate and molecular methods. Thirty to forty isolates or clones were analyzed. (Toyota and
Kuninaga, 2006; Katayama, Yamakawa and Toyota, unpublished data)
127Chapter j 5 Soil Fertility and Soil Microorganisms
anaerobic conditions. In anaerobic respiration, nitrate, Mn4þ, Fe3þ, sulfate, ac-etate, and carbon dioxide are used as electron acceptors instead of oxygen. Thedegradation of organic materials is readily carried out under anaerobic conditionssuch as in a flooded paddy soil, if some of the electron acceptors are available.The anaerobic respiration is performed by diverse microbes. Nitrate respirationin which nitrate or nitrite is reduced to nitrous oxide or molecular nitrogen isperformed by bacteria belonging to diverse genera, including a-, b- andg-Proteobacteria and Firmicutes. Furthermore, some fungi, including the mosttypical genus Fusarium, obtain energy for their growth under anaerobic condi-tions by reducing nitrite to nitrous oxide.
Strictly anaerobic bacteria live even in upland soil, suggesting that anaer-obic microsites are localized in soil, e.g. within macro-aggregates.
c. Nitrification
Autotrophic bacteria that gain energy by the oxidation of mineral materials andcarbon from CO2 in the air exist in soil. A typical example is ammonia-oxidizing bacteria that obtain energy by oxidizing ammonia to nitrite.Nitrite-oxidizing bacteria are also autotrophs that obtain energy by oxidizingnitrite to nitrate. Because nitrification is an energy-generating process, the re-action proceeds readily in soil if appropriate substrates are available. Nitrogenfertilizer applied in the form of urea or ammonium sulfate is transformed intonitrate through nitrification in soil. Because nitrifying bacteria are strictlyaerobic, their growth is enhanced in upland soil. In general, most nitrogenapplied as fertilizer is transformed into nitrate within weeks in agriculturalsoils. Nitrate is easily leached out of the soil layers along with water movement.
128 Research Approaches to Sustainable Biomass Systems
The leached nitrate that is a loss of the applied nitrogen fertilizer can lead tonitrate pollution of groundwater and surface water bodies such as lakes andrivers. Thus, the nitrification process is not always beneficial to agriculture. Forthis reason, nitrification inhibitors have been developed in order to mitigate theloss of nitrate in agricultural soils. Furthermore, it is known that a small butsignificant portion of nitrogen fertilizer applied to agricultural soil is trans-formed into nitrous oxide, a potent greenhouse gas, through the nitrificationprocesses.
Paddy field soil is generally under anaerobic conditions but there are aer-obic pockets in the soil, e.g. the oxidation layer (a few mm) at the upper part ofthe plow layer and the rhizosphere of rice plants, where aerobic nitrificationoccurs.
d. Nitrogen Fixation
The most beneficial microorganisms in agriculture are nitrogen-fixing bac-teria, including prokaryotes, bacteria, and archaea of diverse groups. Somecyanobacteria have functions of both photosynthesis and nitrogen fixation,and therefore are expected to play a role in the restoration of infertile soil.Nitrogen-fixing bacteria are extremely diverse in terms not only of taxonomybut also physiology and ecology. Some nitrogen-fixing bacteria, such asRhizobium and Bradyrhizobium, are symbiotic to leguminous plants, whereasother diverse bacteria have been reported as free-living nitrogen fixers.Filamentous bacteria such as Frankia are known to live in symbiosis with non-leguminous plants such as alder (Alnus sp.) and Comptonia sp. Amongfree-living nitrogen fixers, some are plant associated and others not. Nitrogen-fixing bacteria are also known in archaea, such as methanogens andHalobacterium. Some nitrogen fixers are strict aerobes, whereas some othersare strict anaerobes such as Clostridium, or photosynthetic and facultativesuch as Enterobacter and Klebisiella. In any type of nitrogen-fixing bacteria,the major nitrogen-fixing enzyme nitrogenase functions only in the absence ofoxygen and therefore anaerobic bacteria must have some mechanisms toavoid oxygen near the cells.
The total amount of nitrogen fixed biologically in terrestrial regions of139 million ton N per year exceeds that fixed artificially (100 million ton N peryear) (Brady and Weil, 2008). A plant’s nitrogen-fixing potential differsdepending on the type of land use (Table 5.16), with the highest in leguminouscrops and relatively high nitrogen fixation in paddy fields. Cyanobacteria andphotosynthetic bacteria play important roles in the nitrogen fixation of paddysoil. Many studies have revealed the presence of endophytic and/or plant-associated nitrogen-fixing bacteria, such as Herbaspirillum, Azoarcus, andBurkholderia, in non-leguminous plants.
Nitrogen-fixing activity is affected by different parameters. Firstly, inor-ganic nitrogen suppresses nitrogen-fixing activity significantly. Therefore, the
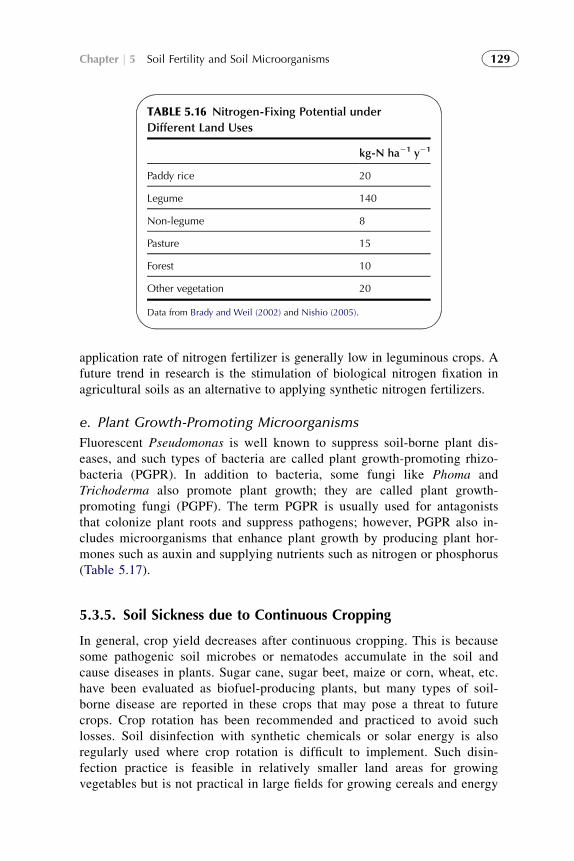
TABLE 5.16 Nitrogen-Fixing Potential under
Different Land Uses
kg-N ha�1 y�1
Paddy rice 20
Legume 140
Non-legume 8
Pasture 15
Forest 10
Other vegetation 20
Data from Brady and Weil (2002) and Nishio (2005).
129Chapter j 5 Soil Fertility and Soil Microorganisms
application rate of nitrogen fertilizer is generally low in leguminous crops. Afuture trend in research is the stimulation of biological nitrogen fixation inagricultural soils as an alternative to applying synthetic nitrogen fertilizers.
e. Plant Growth-Promoting Microorganisms
Fluorescent Pseudomonas is well known to suppress soil-borne plant dis-eases, and such types of bacteria are called plant growth-promoting rhizo-bacteria (PGPR). In addition to bacteria, some fungi like Phoma andTrichoderma also promote plant growth; they are called plant growth-promoting fungi (PGPF). The term PGPR is usually used for antagoniststhat colonize plant roots and suppress pathogens; however, PGPR also in-cludes microorganisms that enhance plant growth by producing plant hor-mones such as auxin and supplying nutrients such as nitrogen or phosphorus(Table 5.17).
5.3.5. Soil Sickness due to Continuous Cropping
In general, crop yield decreases after continuous cropping. This is becausesome pathogenic soil microbes or nematodes accumulate in the soil andcause diseases in plants. Sugar cane, sugar beet, maize or corn, wheat, etc.have been evaluated as biofuel-producing plants, but many types of soil-borne disease are reported in these crops that may pose a threat to futurecrops. Crop rotation has been recommended and practiced to avoid suchlosses. Soil disinfection with synthetic chemicals or solar energy is alsoregularly used where crop rotation is difficult to implement. Such disin-fection practice is feasible in relatively smaller land areas for growingvegetables but is not practical in large fields for growing cereals and energy
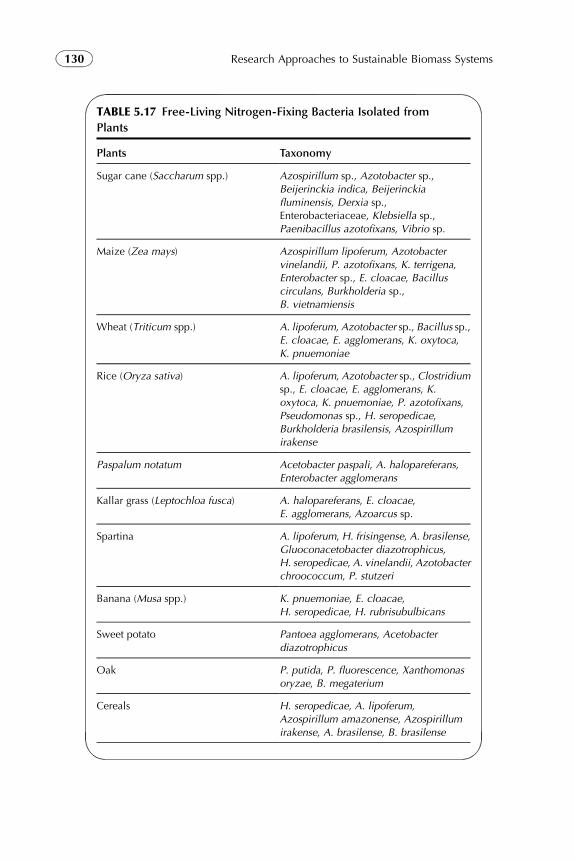
TABLE 5.17 Free-Living Nitrogen-Fixing Bacteria Isolated from
Plants
Plants Taxonomy
Sugar cane (Saccharum spp.) Azospirillum sp., Azotobacter sp.,Beijerinckia indica, Beijerinckiafluminensis, Derxia sp.,Enterobacteriaceae, Klebsiella sp.,Paenibacillus azotofixans, Vibrio sp.
Maize (Zea mays) Azospirillum lipoferum, Azotobactervinelandii, P. azotofixans, K. terrigena,Enterobacter sp., E. cloacae, Bacilluscirculans, Burkholderia sp.,B. vietnamiensis
Wheat (Triticum spp.) A. lipoferum, Azotobacter sp., Bacillus sp.,E. cloacae, E. agglomerans, K. oxytoca,K. pnuemoniae
Rice (Oryza sativa) A. lipoferum, Azotobacter sp., Clostridiumsp., E. cloacae, E. agglomerans, K.oxytoca, K. pnuemoniae, P. azotofixans,Pseudomonas sp., H. seropedicae,Burkholderia brasilensis, Azospirillumirakense
Paspalum notatum Acetobacter paspali, A. halopareferans,Enterobacter agglomerans
Kallar grass (Leptochloa fusca) A. halopareferans, E. cloacae,E. agglomerans, Azoarcus sp.
Spartina A. lipoferum, H. frisingense, A. brasilense,Gluoconacetobacter diazotrophicus,H. seropedicae, A. vinelandii, Azotobacterchroococcum, P. stutzeri
Banana (Musa spp.) K. pnuemoniae, E. cloacae,H. seropedicae, H. rubrisubulbicans
Sweet potato Pantoea agglomerans, Acetobacterdiazotrophicus
Oak P. putida, P. fluorescence, Xanthomonasoryzae, B. megaterium
Cereals H. seropedicae, A. lipoferum,Azospirillum amazonense, Azospirillumirakense, A. brasilense, B. brasilense
130 Research Approaches to Sustainable Biomass Systems
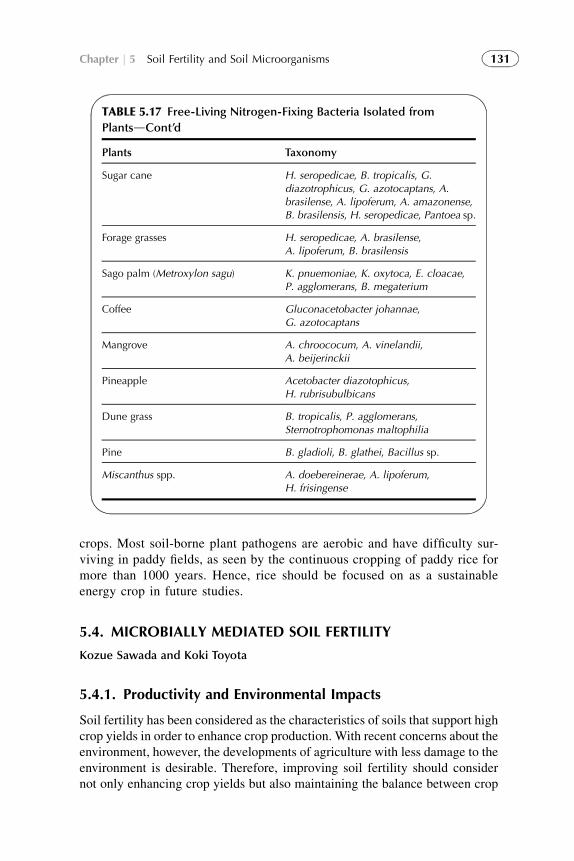
TABLE 5.17 Free-Living Nitrogen-Fixing Bacteria Isolated from
PlantsdCont’d
Plants Taxonomy
Sugar cane H. seropedicae, B. tropicalis, G.diazotrophicus, G. azotocaptans, A.brasilense, A. lipoferum, A. amazonense,B. brasilensis, H. seropedicae, Pantoea sp.
Forage grasses H. seropedicae, A. brasilense,A. lipoferum, B. brasilensis
Sago palm (Metroxylon sagu) K. pnuemoniae, K. oxytoca, E. cloacae,P. agglomerans, B. megaterium
Coffee Gluconacetobacter johannae,G. azotocaptans
Mangrove A. chroococum, A. vinelandii,A. beijerinckii
Pineapple Acetobacter diazotophicus,H. rubrisubulbicans
Dune grass B. tropicalis, P. agglomerans,Sternotrophomonas maltophilia
Pine B. gladioli, B. glathei, Bacillus sp.
Miscanthus spp. A. doebereinerae, A. lipoferum,H. frisingense
131Chapter j 5 Soil Fertility and Soil Microorganisms
crops. Most soil-borne plant pathogens are aerobic and have difficulty sur-viving in paddy fields, as seen by the continuous cropping of paddy rice formore than 1000 years. Hence, rice should be focused on as a sustainableenergy crop in future studies.
5.4. MICROBIALLY MEDIATED SOIL FERTILITY
Kozue Sawada and Koki Toyota
5.4.1. Productivity and Environmental Impacts
Soil fertility has been considered as the characteristics of soils that support highcrop yields in order to enhance crop production. With recent concerns about theenvironment, however, the developments of agriculture with less damage to theenvironment is desirable. Therefore, improving soil fertility should considernot only enhancing crop yields but also maintaining the balance between crop
132 Research Approaches to Sustainable Biomass Systems
nutrient requirements and nutrient supplies because either excessive or defi-cient nutrients have major adverse impacts on the productivity and theenvironment.
Soil microbes govern the numerous reactions of nutrient cycles in soils.Transformations between organic and inorganic nutrients by microbes (i.e.biological mineralization and immobilization) contribute significantly to sup-plying nutrients to crops, especially nitrogen (N) and sulfur, and to some extentphosphorus. The availability of potassium, which is mostly fixed in mineralssuch as micas and feldspars, is not affected by microbial activities. In theagricultural field, nitrogen is one of the major limiting elements for crop yields.In addition, excessive nitrogen causes nitrate leaching, ammonia volatilization,and nitrous oxide emissions that often lead to adverse environmental effects,including air and water pollution, soil acidification, ozone destruction andglobal warming, as well as human health problems. This section focuses on thebiological mineralization and immobilization of nitrogen, which contributesignificantly to soil fertility in agricultural ecosystems.
5.4.2. Nitrogen Cycles Through Microbial Biomass in Soils
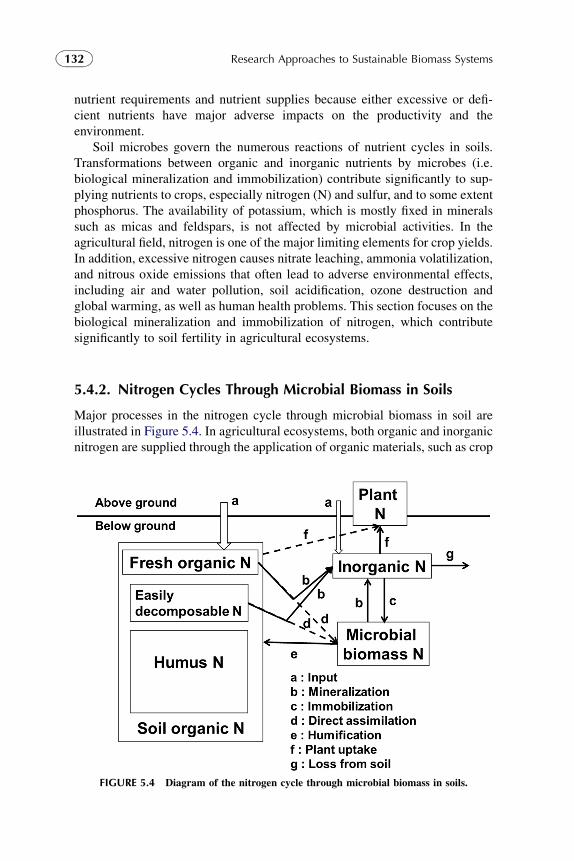
Major processes in the nitrogen cycle through microbial biomass in soil areillustrated in Figure 5.4. In agricultural ecosystems, both organic and inorganicnitrogen are supplied through the application of organic materials, such as crop
FIGURE 5.4 Diagram of the nitrogen cycle through microbial biomass in soils.
133Chapter j 5 Soil Fertility and Soil Microorganisms
residues and manure, and mineral fertilizer (Figure 5.4a). The organic nitrogen,whether freshly added or already existing in soil, is continuously decomposedby soil microbes via two routes: (1) mineralization of organic nitrogen toinorganic forms (Figure 5.4b), and (2) immobilization of inorganic nitrogen toorganic forms through microbial assimilations (Figure 5.4c). Although theorganic nitrogen forms a large pool of nitrogen in soil, only a small fraction ofsoil organic nitrogen, i.e. easily decomposable nitrogen, can be decomposedbiologically during the crop growing period. Recent studies show that microbescan assimilate significant amounts of organic molecules (e.g. amino acids)directly in their tissues (Figure 5.4d) (Geisseler et al., 2010). Turnover ofmicrobial biomass nitrogen releases inorganic nitrogen (mineralization(Figure 5.4b)) and organic nitrogen (humification (Figure 5.4e)). Uptake ofinorganic nitrogen and some organic nitrogen by plants occurs in the vegetatedarea (Figure 5.4f), and the excess inorganic nitrogen is lost from soil togroundwater (nitrate leaching), to surface runoff, or to the atmosphere as N2,N2O (dinitrification), and NH3 (volatilization) (Figure 5.4g). Soil microbes playimportant roles in regulating the nitrogen cycles, especially the highly labilenitrogen pool.
The nitrogen cycles in soils and ecosystems are more complicated thanthose shown in Figure 5.4. For example, nitrification of ammonium to nitrateoccurs continuously in the inorganic nitrogen pool. Ammonium in soil isstrongly and almost irreversibly fixed by several 2:1-type clay minerals such asvermiculites, fine-grained micas and some smectites in soils. The conversion ofatmospheric N2 into soil inorganic nitrogen (nitrogen fixation) or the atmo-spheric input of inorganic nitrogen to soil also occur. In the soil environment,nitrification, denitrification, and nitrogen fixation are carried out respectivelyby some specific microbial groups (see reviews by Hayatsu et al., 2008). Thedecomposer system in soil is a diverse food web that involves numerous typesof organisms; the most important groups are bacteria, archaea, fungi, andprotozoa, collectively known as soil microbes, which account for about 80% ofthe decomposition activities (Brady and Weil, 2008). Soil fauna (e.g. nema-todes, mites, earthworms) act as regulators of decomposition through feedingon microbes, and also alter the soil’s physical environment through movementand burrowing of the soil.
5.4.3. Nitrogen Cycle Through Microbial Biomass in JapaneseAgricultural Soils
a. Nitrogen-Supplying Capacity in Japanese Agricultural Soils
Mishima et al. (2006) evaluated recent trends in nitrogen application and cropproduction for Japanese agricultural land. Chemical nitrogen fertilizer appli-cation peaked in 1985 (near 130 kg-N ha�1) and then decreased (less than100 kg N ha�1) whereas the total amount of livestock excreta applied to
134 Research Approaches to Sustainable Biomass Systems
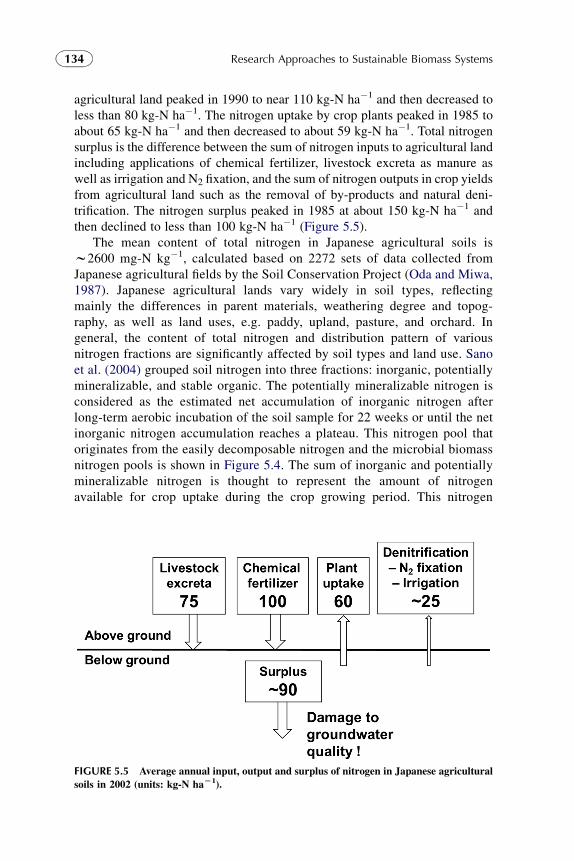
agricultural land peaked in 1990 to near 110 kg-N ha�1 and then decreased toless than 80 kg-N ha�1. The nitrogen uptake by crop plants peaked in 1985 toabout 65 kg-N ha�1 and then decreased to about 59 kg-N ha�1. Total nitrogensurplus is the difference between the sum of nitrogen inputs to agricultural landincluding applications of chemical fertilizer, livestock excreta as manure aswell as irrigation and N2 fixation, and the sum of nitrogen outputs in crop yieldsfrom agricultural land such as the removal of by-products and natural deni-trification. The nitrogen surplus peaked in 1985 at about 150 kg-N ha�1 andthen declined to less than 100 kg-N ha�1 (Figure 5.5).
The mean content of total nitrogen in Japanese agricultural soils isw2600 mg-N kg�1, calculated based on 2272 sets of data collected fromJapanese agricultural fields by the Soil Conservation Project (Oda and Miwa,1987). Japanese agricultural lands vary widely in soil types, reflectingmainly the differences in parent materials, weathering degree and topog-raphy, as well as land uses, e.g. paddy, upland, pasture, and orchard. Ingeneral, the content of total nitrogen and distribution pattern of variousnitrogen fractions are significantly affected by soil types and land use. Sanoet al. (2004) grouped soil nitrogen into three fractions: inorganic, potentiallymineralizable, and stable organic. The potentially mineralizable nitrogen isconsidered as the estimated net accumulation of inorganic nitrogen afterlong-term aerobic incubation of the soil sample for 22 weeks or until the netinorganic nitrogen accumulation reaches a plateau. This nitrogen pool thatoriginates from the easily decomposable nitrogen and the microbial biomassnitrogen pools is shown in Figure 5.4. The sum of inorganic and potentiallymineralizable nitrogen is thought to represent the amount of nitrogenavailable for crop uptake during the crop growing period. This nitrogen
FIGURE 5.5 Average annual input, output and surplus of nitrogen in Japanese agricultural
soils in 2002 (units: kg-N haL1).
135Chapter j 5 Soil Fertility and Soil Microorganisms
available for plant growth amounts to 196 mg kg�1 (295 kg-N ha�1) or 7.6%of total nitrogen assuming that the plow layer depth is 15 cm and the bulkdensity is 1.0 Mg m�3. The potentially mineralizable nitrogen is higher inpaddy soils (200 mg-N kg�1) than in upland soils (108 mg-N kg�1), prob-ably because relatively abundant fresh organic matter is added through theapplication of rice straw, the natural depositions by algae, and N2 fixation inpaddy soils. Another possibility is that the organic matter in paddy soils isless degraded than that in uplands under anaerobic conditions. Stable organicnitrogen, which is unavailable for plant growth, is higher in volcanic soilsthan in non-volcanic soils because the presence of Al–humus complexes involcanic soils gives humus strong stability. Volcanic soils cover more than50% of the total upland fields in Japan, hence, Japan has higher total ni-trogen in agricultural soil (w2600 mg-N kg�1) than the average value in theworld (w1600 mg kg�1) (Batjes, 1996). However, the high total nitrogen inJapanese agricultural soil does not necessarily imply that the soil has highnitrogen-supplying capacity for crop production, although the nitrogen-supplying capacity in various soils is closely related to the total nitrogencontent in the soil.
b. Microbial Biomass Nitrogen in Japanese Agricultural Soils
Soil microbial biomass nitrogen is usually determined by using the chloroformfumigation extraction method (Brookes et al., 1985). This method is based onthe extraction of cell components immediately after chloroform fumigation.Although microbial biomass nitrogen occupies only 1–6% of the total nitrogenin soils, the biomass nitrogen pool has the potential to supply available nitrogenfor crop growth because of rapid turnover rate of the biomass nitrogen. Themicrobial biomass nitrogen is reported to be highly correlated with the quantityof available nitrogen for crops to uptake in Japanese upland soils (e.g.Sakamoto and Oba, 1993). Inubushi and Watanabe (1986) also observed thatmicrobial biomass nitrogen is highly correlated with nitrogen uptake by riceunder conditions of nitrogen deficiency in flooded paddy fields, although bio-logical processes in paddy soils are complicated (see review by Inubushi andAcquaye, 2004). Nira (2000) estimated both turnover rates of microbialbiomass nitrogen and amounts of mineralized nitrogen for 1 year by applying15N-labeled crop residues to different types of upland soils. His results showthat the flux of nitrogen through microbial biomass enhances the amounts ofmineralized nitrogen by 39–138% (average 67%). Sakamoto et al. (1997)observed that the flux of nitrogen through microbial biomass is a major sourceof nitrogen uptake for upland rice in the vegetative growth stage (until6 weeks). These results support that managing microbial biomass nitrogen isessential for the maintenance and improvement of soil fertility.
Guan et al. (1997) observed that fractions of microbial biomass nitrogento total nitrogen in nine volcanic soils of 0.76% average are about one-
136 Research Approaches to Sustainable Biomass Systems
fourth lower than those in seven non-volcanic soils (3.2% average) in Japan.This result further supports that total organic nitrogen is not a good indi-cator of the nitrogen-supplying capacity to crop uptake, especially in vol-canic soils.
It is known that long-term applications of organic materials (e.g. cropresidue or manure, etc.) to soils usually increase the total soil organic nitrogen,including microbial biomass nitrogen (e.g. Sakamoto and Oba, 1991), andimprove the soil fertility profoundly. The present status of long-term fieldstudies using chemical fertilizers and organic materials conducted at nationaland prefectural agricultural research stations in Japan is summarized byKanamori (2000). Shirato et al. (2004) used a model approach and showed thatsoil organic matter can be more easily accumulated after long-term applicationof organic materials in Japanese volcanic soils than in non-volcanic soils due tothe presence of active aluminum and iron in the latter. However, the informa-tion on the effect of long-term application of organic materials on microbialbiomass nitrogen is relatively scarce, especially in volcanic soils (Sakamotoand Oba, 1991). This is because microbial biomass nitrogen must be measuredusing soil samples freshly collected from the field, whereas soils stored in air-dried conditions is acceptable for measuring total nitrogen.
5.4.4. Management of Microbial Biomass Nitrogen Duringa Crop Growth Period
a. The Effect of Drying–Rewetting on Microbial BiomassNitrogen
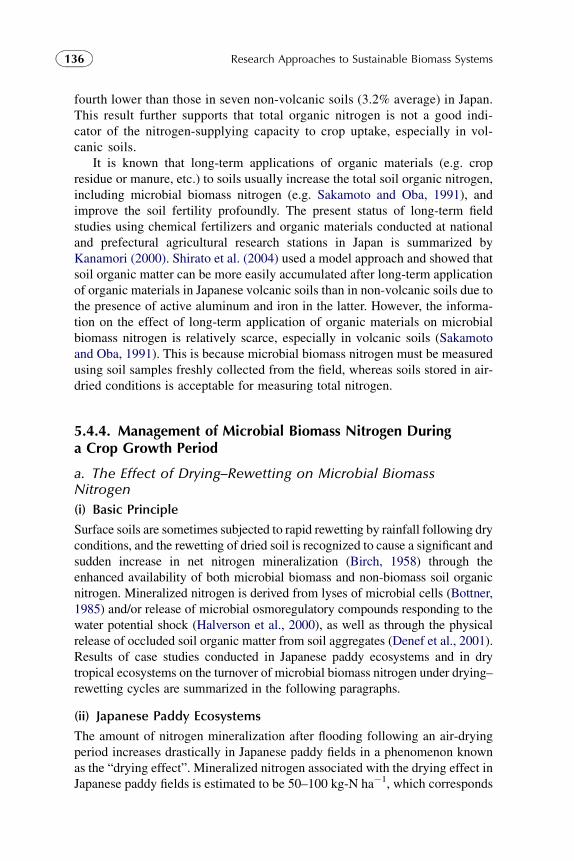
(i) Basic Principle
Surface soils are sometimes subjected to rapid rewetting by rainfall following dryconditions, and the rewetting of dried soil is recognized to cause a significant andsudden increase in net nitrogen mineralization (Birch, 1958) through theenhanced availability of both microbial biomass and non-biomass soil organicnitrogen. Mineralized nitrogen is derived from lyses of microbial cells (Bottner,1985) and/or release of microbial osmoregulatory compounds responding to thewater potential shock (Halverson et al., 2000), as well as through the physicalrelease of occluded soil organic matter from soil aggregates (Denef et al., 2001).Results of case studies conducted in Japanese paddy ecosystems and in drytropical ecosystems on the turnover of microbial biomass nitrogen under drying–rewetting cycles are summarized in the following paragraphs.
(ii) Japanese Paddy Ecosystems
The amount of nitrogen mineralization after flooding following an air-dryingperiod increases drastically in Japanese paddy fields in a phenomenon knownas the “drying effect”. Mineralized nitrogen associated with the drying effect inJapanese paddy fields is estimated to be 50–100 kg-N ha�1, which corresponds
137Chapter j 5 Soil Fertility and Soil Microorganisms
approximately to the amount of chemical nitrogen fertilizer applied to paddysoils annually. Toriyama et al. (1988) evaluated the effect of soil water contentsbefore flooding on the measured mineralized nitrogen after flooding, and foundthat the mineralized nitrogen increases linearly with decreasing soil watercontents before flooding when the soil has been dried below pF 4. Ando et al.(1995) also observed that the amount of nitrogen taken up by rice plants in-creases with decreasing soil water contents before flooding. These results provethat the soil water content before flooding affects significantly the amount ofnitrogen mineralized caused by the drying effect. According to Marumoto et al.(1997), the contribution of microbial biomass nitrogen to total nitrogenmineralized due to the drying effect is 20–48% in Japanese paddy soil. Thisresult clearly shows that microbial biomass nitrogen in Japanese paddy soil actsas an available nitrogen pool for rice crops. Therefore, the management ofmicrobial biomass nitrogen is essential for maintaining and improving riceproduction. Practicing long-term application of organic materials is usuallyrecommended for enhancing the soil biomass nitrogen, especially for soils thathave been subject to sufficient drying before flooding.
(iii) Dry Tropical Ecosystems
The availability of nitrogen limits crop production in dry tropical cropland withnutrient-poor soils. Soil microbes in this region act as an important nitrogenpool for crop nitrogen uptake. Singh et al. (1989) observed in dry tropicalnatural ecosystems in India that microbial biomass nitrogen is accumulated,probably due to accumulation of intracellular solutes during the dry seasonsand the later depletion of these solutes during the early rainy seasons. Sugiharaet al. (2010a) also observed that microbial biomass nitrogen in dry tropicalcropland in Tanzania tends to decrease during rainy seasons but will increaseand remain at high levels during dry seasons. These results suggest that themineralization of biomass nitrogen stimulates plant growth during rainy sea-sons in nutrient-poor dry tropical ecosystems. However, if crops are unable touptake the nitrogen mineralized during early rainy season because of their slowgrowth, the mineralized nitrogen would be potentially lost from soil throughleaching.
b. Effect of Application of Organic Materials on MicrobialBiomass Nitrogen
(i) Basic Principle
Application of organic materials (e.g. crop residue or manure, etc.) to soilsimmediately and significantly alters several fractions in nitrogen pools andenhances the turnover rates by increasing the soil microbial activities (Jensenand Magid, 2002). The rates of gross mineralization and immobilization differdepending on the type of organic materials applied to soil. When no organicmaterial is applied to soil, gross mineralization is usually slightly higher than
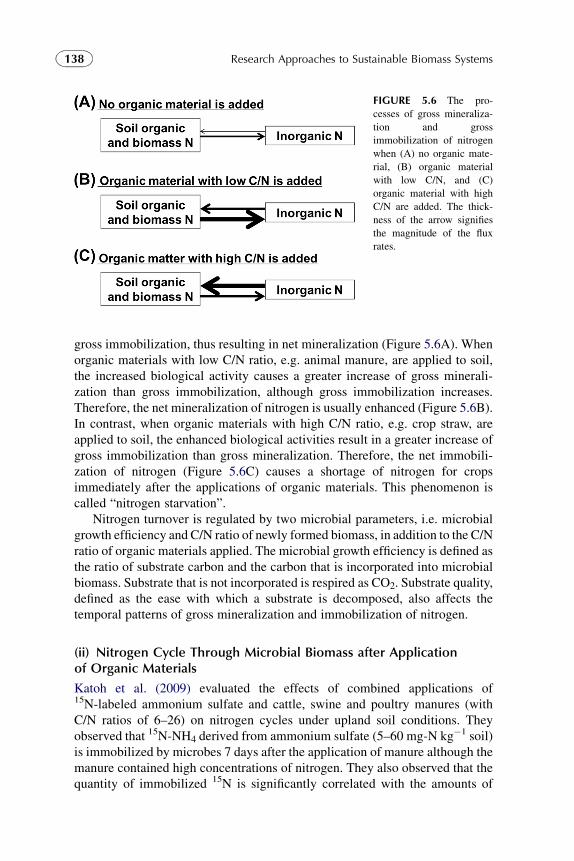
FIGURE 5.6 The pro-
cesses of gross mineraliza-
tion and gross
immobilization of nitrogen
when (A) no organic mate-
rial, (B) organic material
with low C/N, and (C)
organic material with high
C/N are added. The thick-
ness of the arrow signifies
the magnitude of the flux
rates.
138 Research Approaches to Sustainable Biomass Systems
gross immobilization, thus resulting in net mineralization (Figure 5.6A). Whenorganic materials with low C/N ratio, e.g. animal manure, are applied to soil,the increased biological activity causes a greater increase of gross minerali-zation than gross immobilization, although gross immobilization increases.Therefore, the net mineralization of nitrogen is usually enhanced (Figure 5.6B).In contrast, when organic materials with high C/N ratio, e.g. crop straw, areapplied to soil, the enhanced biological activities result in a greater increase ofgross immobilization than gross mineralization. Therefore, the net immobili-zation of nitrogen (Figure 5.6C) causes a shortage of nitrogen for cropsimmediately after the applications of organic materials. This phenomenon iscalled “nitrogen starvation”.
Nitrogen turnover is regulated by two microbial parameters, i.e. microbialgrowth efficiency and C/N ratio of newly formed biomass, in addition to the C/Nratio of organic materials applied. The microbial growth efficiency is defined asthe ratio of substrate carbon and the carbon that is incorporated into microbialbiomass. Substrate that is not incorporated is respired as CO2. Substrate quality,defined as the ease with which a substrate is decomposed, also affects thetemporal patterns of gross mineralization and immobilization of nitrogen.
(ii) Nitrogen Cycle Through Microbial Biomass after Applicationof Organic Materials
Katoh et al. (2009) evaluated the effects of combined applications of15N-labeled ammonium sulfate and cattle, swine and poultry manures (withC/N ratios of 6–26) on nitrogen cycles under upland soil conditions. Theyobserved that 15N-NH4 derived from ammonium sulfate (5–60 mg-N kg�1 soil)is immobilized by microbes 7 days after the application of manure although themanure contained high concentrations of nitrogen. They also observed that thequantity of immobilized 15N is significantly correlated with the amounts of
139Chapter j 5 Soil Fertility and Soil Microorganisms
easily decomposable carbon. This suggests that the quality of substrate carbonis an important factor to influence the gross immobilization of nitrogenimmediately after the application of organic materials.
Herai et al. (2006) measured microbial biomass nitrogen, NO3-N leachingand nitrogen uptake by corn over 4 months after application of sawdustcompost (with C/N ratio ofw30) to a sandy soil in Japan. Their results clearlyshowed that the assimilation of nitrogen to microbial biomass decreases NO3-Nleaching without negative impact on nitrogen uptake by corn. This method iseffective in reducing NO3-N leaching.
Sugihara et al. (2010b) observed that a significant amount of inorganicnitrogen (w50 kg-N ha�1) is lost from the surface soil through leaching duringearly rainy seasons, and that inorganic nitrogen remains low thereafter(w20 kg-N ha�1) in dry tropical cropland in Tanzania. Therefore, Sugiharaet al. (2012) evaluated the effect of the application of plant residue (with C/Nratio of w70) on nitrogen leaching and crop productivity. They observed thatmicrobial biomass nitrogen clearly increases (14.6–29.6 kg-N ha�1) with theapplication of plant residue during the early crop growth period, and thatpotentially leachable nitrogen is also immobilized. They also reported that thecrop nitrogen uptake is improved by applying the plant residue with theconclusion that the re-mineralization of immobilized nitrogen stimulates cropgrowth during the later period. Therefore, plant residue application is apromising option to improve crop production and reduce the leaching ofnutrients.
5.4.5. Future Prospects
In developing countries, especially in low-input traditional systems, nitrogenavailability limits crop production because of low soil fertility and the inability offarmers to afford chemical fertilizers. In these regions, soil microbes act as animportant nitrogen pool for crop nitrogen uptake, and therefore the managementof microbial biomass nitrogen has the potential to improve crop production(Sugihara et al., 2012). However, to date, little quantitative information con-cerning the effect of the management of microbial biomass nitrogen on cropproduction, especially the flux of nitrogen through microbial biomass, is avail-able in literature. Therefore, further research needs to be initiated to carry outquantitative analyses on soil nitrogen, such as with the 15N-labeled nitrogen.
In contrast, in developed countries such as Japan, intensive agriculturalpractice that has already increased crop production causes severe environ-mental problems. In Japanese agricultural ecosystems, surplus nitrogenadversely affects environment quality (Figure 5.5). To reduce the nitrogensurplus effectively, various types of organic materials need to be applied as analternative to chemical fertilizers. When organic materials are applied toagricultural fields, synchronizing nitrogen supply with crop demand is neededin order to maintain crop production while minimizing the nitrogen surplus.
140 Research Approaches to Sustainable Biomass Systems
With recent concerns about environmental quality, further studies are needed tounderstand the biological mineralization and immobilization over differenttime scales, even though high agricultural productivity has already been ach-ieved in Japan. Additional studies should be initiated to address solvingproblems for volcanic soils and paddy soils that are unique to Japan.
REFERENCES
Alexander, M. (1977). Introduction to soil microbiology. Wiley.
Ando, H., Marumoto, T., Wada, G., & Nakamura, T. (1995). Mineralization of soil organic
nitrogen and nitrogen absorption by rice (Oryza sativa) plant as affected by drying duration.
Japanese Journal of Soil Science and Plant Nutrition, 66, 499–505 [in Japanese].
Batjes, N. H. (1996). Total carbon and nitrogen in the soils of the world. European Journal of Soil
Science, 47, 151–163.
Birch, H. (1958). The effect of soil drying on humus decomposition and nitrogen availability. Plant
and Soil, 10, 9–31.
Bottner, P. (1985). Response of microbial biomass to alternate moist and dry conditions in a soil
incubated with 14C and 15N labelled plant material. Soil Biology and Biochemistry, 17,
329–337.
Brady, N. C. (1974). The nature and properties of soils (8th ed.) MacMillan.
Brady, N. C., & Weil, R. R. (2002). The nature and properties of soils (13th ed.) Prentice Hall.
Brady, N. C., & Weil, R. R. (2008). Organisms and ecology of the soil. In The nature and
properties of soils (14th ed.) (pp. 443–494). Upper Saddle River, NJ: Prentice Hall.
Brookes, P. C., Landman, A., Pruden, G., & Jenkinson, D. S. (1985). Chloroform fumigation and
the release of soil nitrogen: A rapid direct extraction method to measure microbial biomass
nitrogen in soil. Soil Biology and Biochemistry, 17, 837–842.
Coleman, K., & Jenkinson, D. S. (1996). RothC-26.3 – A model for the turnover of carbon in soil.
In D. S. Powlson, P. Smith, & J. U. Smith (Eds.), Evaluation of soil organic matter models:
Using existing long-term datasets (pp. 237–246). Berlin: Springer.
Denef, K., Six, J., Bossuyt, H., Frey, S. D., Elliott, E. T., Merckx, R., & Paustian, K. (2001).
Influence of dry–wet cycles on the interrelationship between aggregate, particulate organic
matter, and microbial community dynamics. Soil Biology and Biochemistry, 33, 1599–1611.
Geisseler, D., Horwath, W. R., Joergensen, R. G., & Ludwig, B. (2010). Pathways of nitrogen
utilization by soil microorganisms – A review. Soil Biology and Biochemistry, 42, 2058–2067.
Guan, G., Marumoto, T., Shindo, H., & Nishiyama, M. (1997). Relationship between the amount
of microbial biomass and physicochemical properties of soil – Comparison between volcanic
and non-volcanic ash soils. Japanese Journal of Soil Science and Plant Nutrition, 68, 614–621
[in Japanese].
Hakamata, T., Hatano, R., Kimura, M., Takahashi, M., & Sakamoto, K. (2000). Interaction
between greenhouse gases and soil ecosystem: 1. Carbon dioxide and terrestrial ecosystem.
Japanese Journal of Soil Science and Plant Nutrition, 71, 263–274 [in Japanese].
Halverson, L. J., Jones, T. M., & Firestone, M. K. (2000). Release of intracellular solutes by four
soil bacteria exposed to dilution stress. Soil Science Society of America Journal, 64,
1630–1637.
Hamazaki, T.,&Micosa,A.G. (1991). Land capability classification in Japan – Productive capability
classification of land based on soil survey. Collected papers on environmental planning/Division
of Environmental Assessment. National Institute of Agro-Environmental Sciences,No. 7, 1–20.
141Chapter j 5 Soil Fertility and Soil Microorganisms
Hayatsu, M., Tago, K., & Saito, M. (2008). Various players in the nitrogen cycle: Diversity and
functions of the microorganisms involved in nitrification and denitrification. Soil Science and
Plant Nutrition, 54, 33–45.
Herai, Y., Kouno, K., Hashimoto, M., & Nagaoka, T. (2006). Relationships between microbial
biomass nitrogen, nitrate leaching and nitrogen uptake by corn in a compost and chemical
fertilizer-amended regosol. Soil Science and Plant Nutrition, 52, 186–194.
Inubushi, K., & Acquaye, S. (2004). Role of microbial biomass in biogeochemical processes in
paddy soil environments. Soil Science and Plant Nutrition, 50, 793–805.
Inubushi, K., & Watanabe, I. (1986). Dynamics of available nitrogen in paddy soils: II. Miner-
alized N of chloroform-fumigated soil as a nutrient source for rice. Soil Science and Plant
Nutrition, 32, 561–577.
IPCC. (2001). Climate change 2001: The scientific basis. Cambridge: Cambridge University Press.
Janssen, P. H. (2006). Identifying the dominant soil bacterial taxa in libraries of 16S rRNA and 16S
rRNA genes. Applied and Environmental Microbiology, 72, 1719–1728.
Jenkinson, D. S., & Rayner, J. H. (1977). The turnover of soil organic matter in some of the
Rothamsted classical experiments. Soil Science, 123, 298–305.
Jensen, L. S., & Magid, J. (2002). Nutrient turnover in soil after the addition of organic
matter. In L. S. Jensen (Ed.), Plant nutrition, soil fertility, fertilizers and fertilization
(4th ed.) (pp. 15.1–15.20). Samfundslitteratur.
Kanamori, T. (2000). Present state of long-term field experiments on successive application of
chemical fertilizers and composts as organic matters in national and prefectural agricultural
research stations. Japanese Journal of Soil Science and Plant Nutrition, 71, 286–293
[in Japanese].
Katoh, M., Hayashi, Y., & Morikuni, H. (2009). Effect of combined application with 15N-labeled
ammonium sulfate and swine or poultry manure compost on mineralization of compost
nitrogen. Japanese Journal of Soil Science and Plant Nutrition, 80, 152–156 [in Japanese].
Lynch, J. M. (1986). Soil biotechnology. Blackwell.
Marumoto, T., Andoh, H., & Wada, G. (1997). Air-drying treatment and mineralization of biomass
nitrogen in paddy soils. Japanese Journal of Soil Science and Plant Nutrition, 68, 376–380
[in Japanese].
Mishima, S., Taniguchi, S., & Komada, M. (2006). Recent trends in nitrogen and phosphate use
and balance on Japanese farmland. Soil Science and Plant Nutrition, 52, 556–563.
National Conference of Soil Conservation and Survey Project. (1979). Actual condition and
improvement of cultivated soils in Japan, National Conference of Soil Conservation and
Survey Project. Tokyo [in Japanese].
Nira, R. (2000). Comparison between flux of nitrogen through microbial biomass and estimated
amount of nitrogen mineralization by kinetic method in upland soil. Japanese Journal of Soil
Science and Plant Nutrition, 71, 388–390 [in Japanese].
Nishio, M. (2005). Agriculture and environmental pollution. Rural Culture Association of Japan
[in Japanese].
Oda, K., & Miwa, E. (1987). Compact data base for soil analysis data in Japan. Japanese Journal
of Soil Science and Plant Nutrition, 58, 112–131 [in Japanese].
Sakamoto, K., & Oba, Y. (1991). Relationship between the amount of organic material applied and
soil biomass content. Soil Science and Plant Nutrition, 37, 387–397.
Sakamoto, K., & Oba, Y. (1993). Relationship between available N and soil biomass in
upland field soils. Japanese Journal of Soil Science and Plant Nutrition, 64, 42–48
[in Japanese].
142 Research Approaches to Sustainable Biomass Systems
Sakamoto, K., Guan, G., & Yoshida, T. (1997). The contribution of nitrogen through microbial
biomass to plant nitrogen uptake in upland soils with different physicochemical properties.
Japanese Journal of Soil Science and Plant Nutrition, 68, 402–408 [in Japanese].
Sano, S., Yanai, J., & Kosaki, T. (2004). Evaluation of soil nitrogen status in Japanese agricultural
lands with reference to land use and soil types. Soil Science and Plant Nutrition, 50, 501–510.
Shirato, Y., & Yokozawa, M. (2005). Applying the Rothamsted carbon model for long-term
experiments on Japanese paddy soils and modifying it by simple turning of the decomposi-
tion rate. Soil Science and Plant Nutrition, 51, 405–415.
Shirato, Y., Hakamata, T., & Taniyama, I. (2004). Modified Rothamsted carbon model for
Andosols and its validation: changing humus decomposition rate constant with
pyrophosphate-extractable Al. Soil Science and Plant Nutrition, 50, 149–158.
Singh, J. S., Raghubanshi, A. S., Singh, R. S., & Srivastava, S. C. (1989). Microbial biomass
acts as a source of plant nutrients in dry tropical forest and savanna. Nature, 338,
499–500.
Soil Science Glossary Terms Committee. (2008). Glossary of soil science terms. Soil Science
Society of America.
Sugihara, S., Funakawa, S., Kilasara, M., & Kosaki, T. (2010a). Effect of land management and
soil texture on seasonal variations in soil microbial biomass in dry tropical agroecosystems in
Tanzania. Applied Soil Ecology, 44, 80–88.
Sugihara, S., Funakawa, S., Kilasara, M., & Kosaki, T. (2010b). Dynamics of microbial biomass
nitrogen in relation to plant nitrogen uptake during the crop growth period in a dry tropical
cropland in Tanzania. Soil Science and Plant Nutrition, 56, 105–114.
Sugihara, S., Funakawa, S., Kilasara, M., & Kosaki, T. (2012). Effect of land management on soil
microbial N supply to crop N uptake in a dry tropical cropland in Tanzania. Agriculture
Ecosystems and Environment, 146, 209–219.
Toriyama, K., Sekiya, S., & Miyamori, Y. (1988). Quantification of effect of air-drying of paddy
soil before submergence on amount of nitrogen mineralization. Japanese Journal of Soil
Science and Plant Nutrition, 59, 531–537 [in Japanese].
Toyota, K., & Kuninaga, S. (2006). Comparison of soil microbial community between soils
amended with or without farmyard manure. Applied Soil Ecology, 33, 39–48.


