Energy Efficiency and Co-Benefits Assessment of Large Industrial Sources
Cement Sector Public Report
California Air Resources Board Stationary Source Division
Issued August 26, 2013

This page intentionally left blank
IS-1
Introduction and Summary
This report summarizes the data provided to the Air Resources Board (ARB or Board) by cement manufacturing facilities subject to the Energy Efficiency and Co-Benefits Assessment of Large Industrial Facilities Regulation (EEA Regulation).1 In this section, we provide background information on the EEA Regulation and a short summary of the data provided by the cement manufacturing facilities. Following the “Introduction and Summary,” are two sections which provide a compilation of the information submitted by cement manufacturers. This information is aggregated in a manner consistent with ARB regulations. The first section “Part I” is a sector-wide summary of all of the energy efficiency improvement projects identified by all of the cement plants, along with estimated emission reductions and costs. The second section “Part II” summarizes cement plant-specific information consistent with the public disclosure requirements under California Code of Regulations (CCR) §95610. Emission inventories, both on a sector and facility specific basis, are also provided for the 2009 base reporting year. This “Public Report” satisfies the public disclosure requirements of subsection 95608(b) in the EEA Regulation. The information contained in this report will serve as a starting point in identifying opportunities for on-site energy efficiency improvements at cement manufacturing facilities and assist in identifying actions needed to ensure that these improvements occur as expeditiously as possible. Based on the information provided to ARB, we have the following preliminary observations:
The 8 cement-manufacturing facilities subject to the EEA Regulation identified 79 energy efficiency improvement projects specified as either completed/on-going, scheduled, or under investigation.
The total greenhouse gas (GHG) reductions associated with these projects is estimated to be approximately 0.68 million metric tonnes carbon dioxide equivalent (MMTCO2e) per year.2
Approximately 93.3 percent of the estimated GHG reductions (0.632 MMTCO2e per year) are from completed and ongoing projects, with 92.8 percent (0.629 MMTCO2e per year) of the reductions from projects completed and ongoing before 2010 (and therefore already accounted for in the 2009 emissions inventories) and 0.5 percent (0.0035 MMTCO2e per year) of those reductions from projects completed during or after 2010.
Approximately 6.7 percent of the estimated GHG reductions (0.046 MMTCO2e per year) are from projects that are scheduled (0.5 percent) or under investigation (6.2 percent).
Corresponding reductions of oxides of nitrogen (NOx) are 4.88 tons per day (tpd), with approximately 96.8 percent for the reductions from projects completed and
1 California Code of Regulations, title 17, sections 95600 to 95612. 2 Over 90 percent of the estimated reductions are from completed projects and already accounted for in the 2009 GHG Mandatory Reporting emissions inventory. The total does not included estimated emission reductions from projects identified as “Not Implementing.”
IS-2
ongoing before 2010 and 3.2 percent of the reductions from projects completed during or after 2010, scheduled, or under investigation.
EEA Regulation Background
On July 22, 2010, the Board approved the EEA Regulation. The regulation requires operators of California’s largest industrial facilities to conduct a one-time energy efficiency assessment. The regulation was approved by the Office of Administrative Law and became effective on July 16, 2011. All California facilities with 2009 GHG emissions equal to or greater than 0.5 MMTCO2e are subject to the regulation. Also subject to the requirements are cement plants and transportation-fuel refineries that emitted at least 0.25 MMTCO2e in 2009.
The regulation requires facility managers to conduct a one-time assessment of fuel and energy consumption, and provide estimates of GHG, criteria pollutants, and toxic air contaminant (TAC or toxics) emissions. Facilities are further required to identify potential energy efficiency improvements for equipment, processes, and systems that cumulatively account for at least 95 percent of the facility's total GHG emissions. Energy Efficiency Assessment Reports (EEA Reports) were to be filed with the ARB by December 15, 2011. A total of 43 facilities were required to provide an EEA Report. 3
To fulfill ARB’s public disclosure requirements in the EEA Regulation, ARB staff developed five separate “Public Reports” for the following sectors: Refinery, Oil and Gas Production/Mineral Processing, Cement Manufacturing, Power Generation, and Hydrogen Production. The Public Reports summarize, by sector, the information provided in the EEA Reports submitted by the facilities. The reports strike a balance between full public disclosure of the information provided to ARB and the responsibility to protect confidential business information pursuant to CCR §95610. This report is the “Public Report” for the Cement Sector.
Summary of EEA Report Data for the Cement Manufacturing Sector
Eight cement manufacturing facilities submitted EEA Reports to the ARB. Below staff provides a summary of the 2009 GHG emissions from the Cement Manufacturing Sector, followed by a summary of the potential GHG, criteria pollutant, and TAC emission reductions from Completed/Ongoing, Scheduled, and Under Investigation energy efficiency improvement projects identified in the EEA Reports. Also presented are the estimated total one-time capital costs, annual costs, and annual savings associated with the projects. As indicated earlier, additional details are provided in Parts I and II which follow this summary.
3 Staff of the San Francisco State University Industrial Assessment Center is also under contract to provide a third-party review of a subset of the EEA Reports. Nine reports were provided to them to evaluate. Information from the third-party review will be provided in the following ARB report providing ARB’s analysis of the data.
IS-3
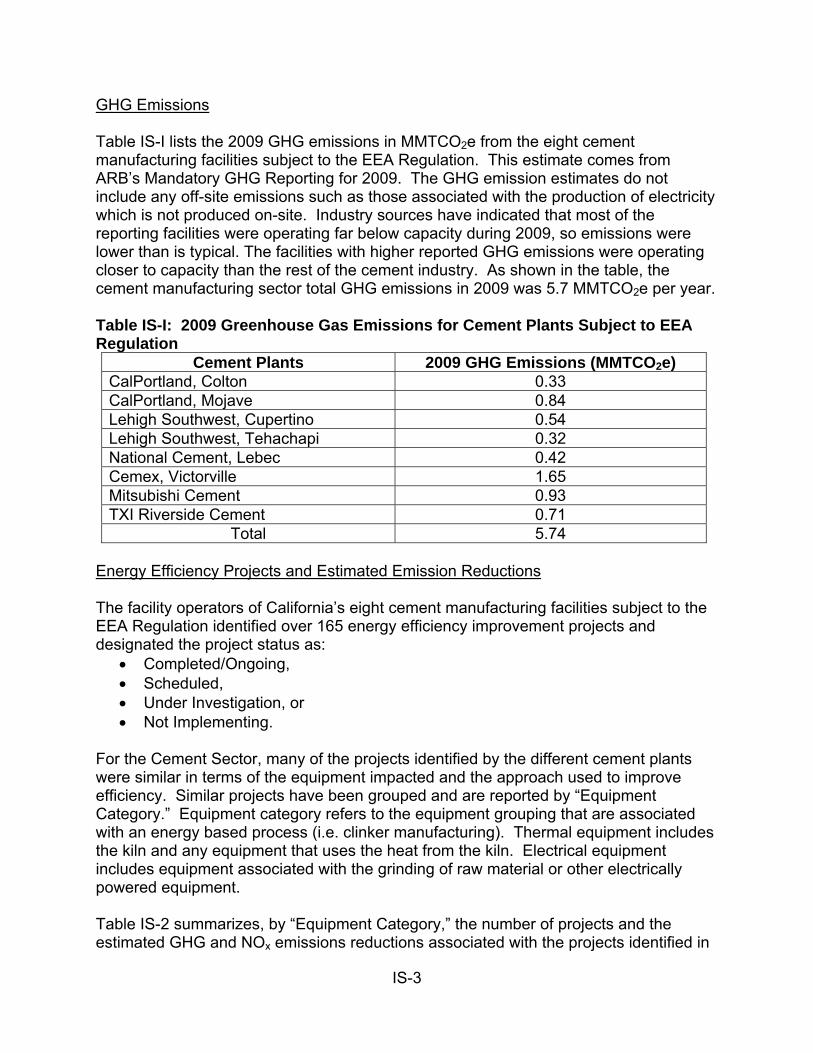
GHG Emissions Table IS-I lists the 2009 GHG emissions in MMTCO2e from the eight cement manufacturing facilities subject to the EEA Regulation. This estimate comes from ARB’s Mandatory GHG Reporting for 2009. The GHG emission estimates do not include any off-site emissions such as those associated with the production of electricity which is not produced on-site. Industry sources have indicated that most of the reporting facilities were operating far below capacity during 2009, so emissions were lower than is typical. The facilities with higher reported GHG emissions were operating closer to capacity than the rest of the cement industry. As shown in the table, the cement manufacturing sector total GHG emissions in 2009 was 5.7 MMTCO2e per year. Table IS-I: 2009 Greenhouse Gas Emissions for Cement Plants Subject to EEA Regulation
Cement Plants 2009 GHG Emissions (MMTCO2e) CalPortland, Colton 0.33 CalPortland, Mojave 0.84 Lehigh Southwest, Cupertino 0.54 Lehigh Southwest, Tehachapi 0.32 National Cement, Lebec 0.42 Cemex, Victorville 1.65 Mitsubishi Cement 0.93 TXI Riverside Cement 0.71
Total 5.74 Energy Efficiency Projects and Estimated Emission Reductions The facility operators of California’s eight cement manufacturing facilities subject to the EEA Regulation identified over 165 energy efficiency improvement projects and designated the project status as:
Completed/Ongoing, Scheduled, Under Investigation, or Not Implementing.
For the Cement Sector, many of the projects identified by the different cement plants were similar in terms of the equipment impacted and the approach used to improve efficiency. Similar projects have been grouped and are reported by “Equipment Category.” Equipment category refers to the equipment grouping that are associated with an energy based process (i.e. clinker manufacturing). Thermal equipment includes the kiln and any equipment that uses the heat from the kiln. Electrical equipment includes equipment associated with the grinding of raw material or other electrically powered equipment. Table IS-2 summarizes, by “Equipment Category,” the number of projects and the estimated GHG and NOx emissions reductions associated with the projects identified in
IS-4
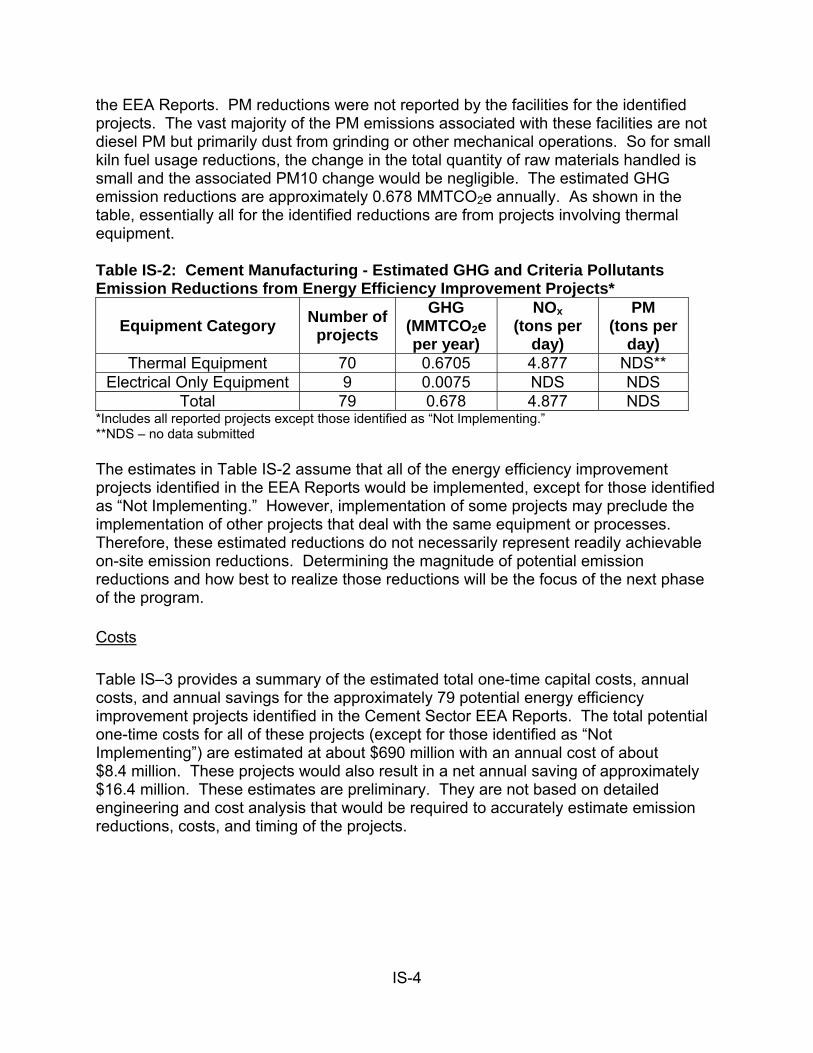
the EEA Reports. PM reductions were not reported by the facilities for the identified projects. The vast majority of the PM emissions associated with these facilities are not diesel PM but primarily dust from grinding or other mechanical operations. So for small kiln fuel usage reductions, the change in the total quantity of raw materials handled is small and the associated PM10 change would be negligible. The estimated GHG emission reductions are approximately 0.678 MMTCO2e annually. As shown in the table, essentially all for the identified reductions are from projects involving thermal equipment. Table IS-2: Cement Manufacturing - Estimated GHG and Criteria Pollutants Emission Reductions from Energy Efficiency Improvement Projects*
Equipment Category Number of projects
GHG (MMTCO2e per year)
NOx (tons per
day)
PM (tons per
day) Thermal Equipment 70 0.6705 4.877 NDS**
Electrical Only Equipment 9 0.0075 NDS NDS Total 79 0.678 4.877 NDS
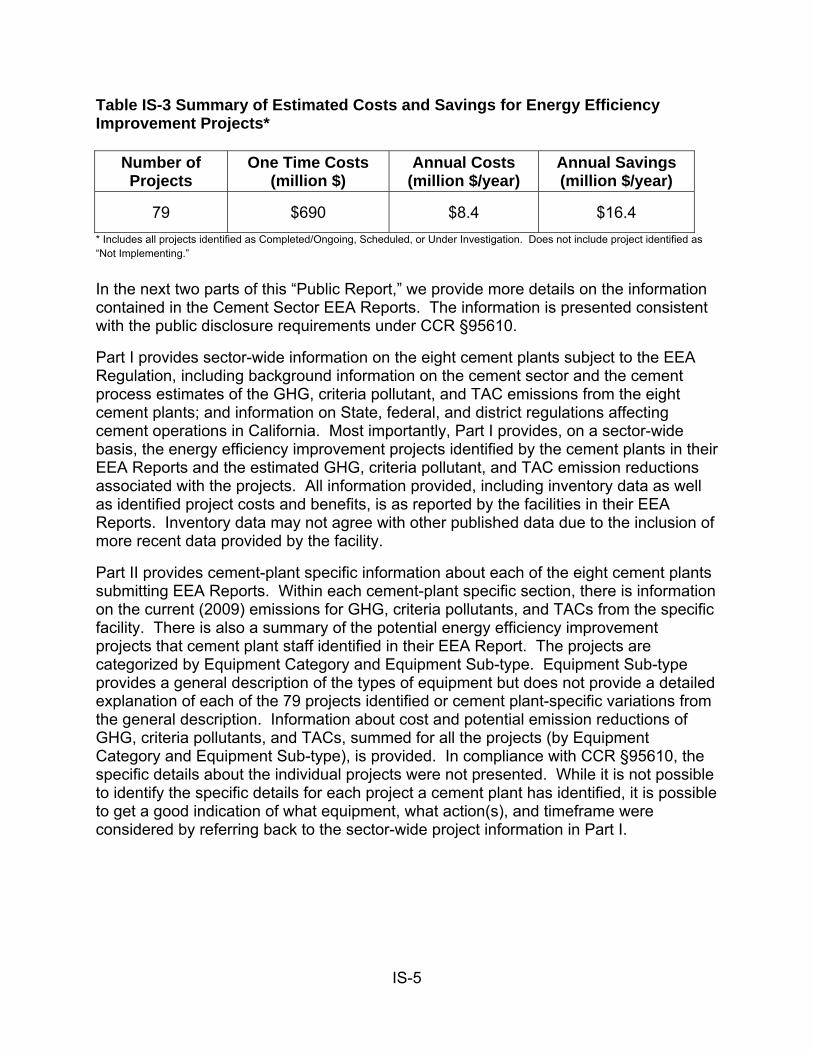
*Includes all reported projects except those identified as “Not Implementing.” **NDS – no data submitted The estimates in Table IS-2 assume that all of the energy efficiency improvement projects identified in the EEA Reports would be implemented, except for those identified as “Not Implementing.” However, implementation of some projects may preclude the implementation of other projects that deal with the same equipment or processes. Therefore, these estimated reductions do not necessarily represent readily achievable on-site emission reductions. Determining the magnitude of potential emission reductions and how best to realize those reductions will be the focus of the next phase of the program. Costs Table IS–3 provides a summary of the estimated total one-time capital costs, annual costs, and annual savings for the approximately 79 potential energy efficiency improvement projects identified in the Cement Sector EEA Reports. The total potential one-time costs for all of these projects (except for those identified as “Not Implementing”) are estimated at about $690 million with an annual cost of about $8.4 million. These projects would also result in a net annual saving of approximately $16.4 million. These estimates are preliminary. They are not based on detailed engineering and cost analysis that would be required to accurately estimate emission reductions, costs, and timing of the projects.
IS-5
Table IS-3 Summary of Estimated Costs and Savings for Energy Efficiency Improvement Projects*
Number of Projects
One Time Costs (million $)
Annual Costs (million $/year)
Annual Savings (million $/year)
79 $690 $8.4 $16.4
* Includes all projects identified as Completed/Ongoing, Scheduled, or Under Investigation. Does not include project identified as “Not Implementing.”
In the next two parts of this “Public Report,” we provide more details on the information contained in the Cement Sector EEA Reports. The information is presented consistent with the public disclosure requirements under CCR §95610.
Part I provides sector-wide information on the eight cement plants subject to the EEA Regulation, including background information on the cement sector and the cement process estimates of the GHG, criteria pollutant, and TAC emissions from the eight cement plants; and information on State, federal, and district regulations affecting cement operations in California. Most importantly, Part I provides, on a sector-wide basis, the energy efficiency improvement projects identified by the cement plants in their EEA Reports and the estimated GHG, criteria pollutant, and TAC emission reductions associated with the projects. All information provided, including inventory data as well as identified project costs and benefits, is as reported by the facilities in their EEA Reports. Inventory data may not agree with other published data due to the inclusion of more recent data provided by the facility.
Part II provides cement-plant specific information about each of the eight cement plants submitting EEA Reports. Within each cement-plant specific section, there is information on the current (2009) emissions for GHG, criteria pollutants, and TACs from the specific facility. There is also a summary of the potential energy efficiency improvement projects that cement plant staff identified in their EEA Report. The projects are categorized by Equipment Category and Equipment Sub-type. Equipment Sub-type provides a general description of the types of equipment but does not provide a detailed explanation of each of the 79 projects identified or cement plant-specific variations from the general description. Information about cost and potential emission reductions of GHG, criteria pollutants, and TACs, summed for all the projects (by Equipment Category and Equipment Sub-type), is provided. In compliance with CCR §95610, the specific details about the individual projects were not presented. While it is not possible to identify the specific details for each project a cement plant has identified, it is possible to get a good indication of what equipment, what action(s), and timeframe were considered by referring back to the sector-wide project information in Part I.
I-1
Part I – Cement Sector Summary I.0 Introduction The information presented in this sector-wide summary is based on EEA Reports submitted by the eight cement manufacturing facilities subject to the EEA Regulation. All information provided, including inventory data as well as identified project costs and benefits, is as reported by the facilities in their EEA Reports. Inventory data may not agree with other published data due to the inclusion of more recent data provided by the facility. The format and level of detail of the information presented strikes a balance between full public disclosure of the information provided to ARB and our responsibility to protect confidential business information in a manner consistent with ARB regulations. This report does not present ARB staff’s findings, conclusions, or recommendations. These will be presented in a subsequent report that will include all sectors. We intend to release this subsequent report once we have completed our review and analysis of the information provided in the EEA Reports, the reports from the third party reviewer, and other applicable information.4 We anticipate releasing this subsequent report in 2013. The California cement industry focused their EEA reporting on projects related to the cement facility kiln which emits the vast majority (over 95 percent) of its onsite GHG emissions. The cement-facility operators used the United States Environmental Protection Agency (U.S. EPA) GHG Best Available Control Technologies (BACT) document as the basis for evaluating energy efficiency improvement opportunities at their facility (USEPA 2010). The U.S. EPA BACT document identifies 15 energy efficiency improvement projects that apply to kilns or that impact overall thermal efficiency of the cement manufacturing process. Cement manufacturing facilities in California have already implemented or are in the process of implementing some of the projects on U.S. EPA’s list. This section of the report (Part I) provides a description of the sector, its GHG emission sources, and provides a summary of the energy efficiency improvement projects identified for the sector. I.1 Cement Sector Description Eight of the California cement plants operating in 2009 were required to submit EEA Reports. These are listed in Table I-1 along with the air district in which it is located. The ninth cement plant, Lehigh Southwest Cement in Redding, was not required to submit a report because the 2009 plant emissions were below the 0.25 MMTCO2e threshold.
4 EEA Reports submitted by three of the refineries were provided to staff of the Industrial Assessment Center of San Francisco State University. This group was contracted by ARB to provide a third-party review of a subset of the EEA reports. We anticipate that these third party reviewer reports will be completed later this year.
I-2
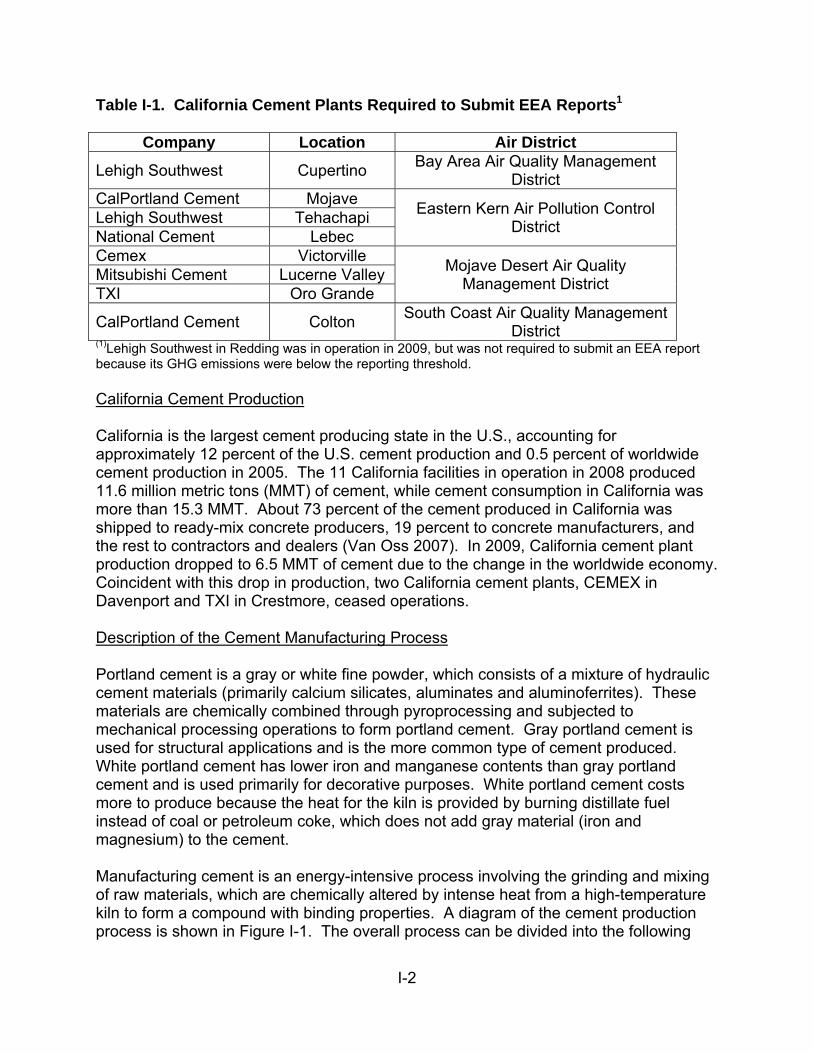
Table I-1. California Cement Plants Required to Submit EEA Reports1
Company Location Air District
Lehigh Southwest Cupertino Bay Area Air Quality Management
District CalPortland Cement Mojave
Eastern Kern Air Pollution Control District
Lehigh Southwest Tehachapi National Cement Lebec Cemex Victorville
Mojave Desert Air Quality Management District
Mitsubishi Cement Lucerne Valley TXI Oro Grande
CalPortland Cement Colton South Coast Air Quality Management
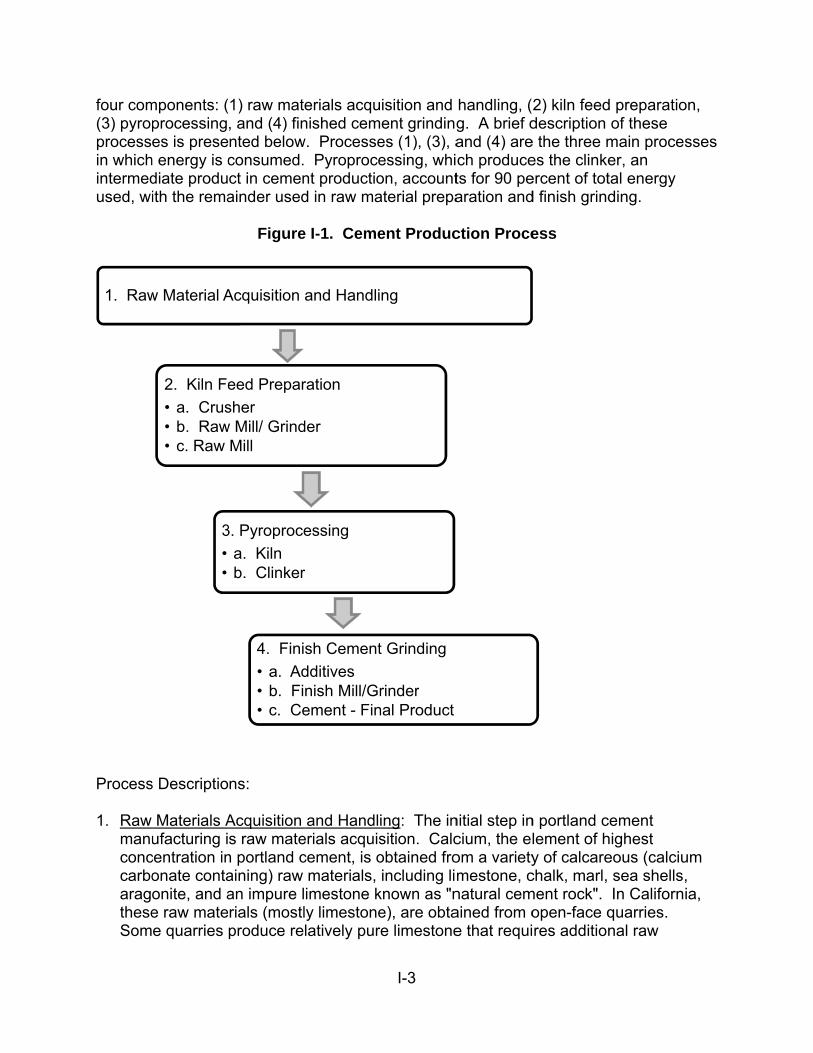
District (1)Lehigh Southwest in Redding was in operation in 2009, but was not required to submit an EEA report because its GHG emissions were below the reporting threshold. California Cement Production California is the largest cement producing state in the U.S., accounting for approximately 12 percent of the U.S. cement production and 0.5 percent of worldwide cement production in 2005. The 11 California facilities in operation in 2008 produced 11.6 million metric tons (MMT) of cement, while cement consumption in California was more than 15.3 MMT. About 73 percent of the cement produced in California was shipped to ready-mix concrete producers, 19 percent to concrete manufacturers, and the rest to contractors and dealers (Van Oss 2007). In 2009, California cement plant production dropped to 6.5 MMT of cement due to the change in the worldwide economy. Coincident with this drop in production, two California cement plants, CEMEX in Davenport and TXI in Crestmore, ceased operations. Description of the Cement Manufacturing Process Portland cement is a gray or white fine powder, which consists of a mixture of hydraulic cement materials (primarily calcium silicates, aluminates and aluminoferrites). These materials are chemically combined through pyroprocessing and subjected to mechanical processing operations to form portland cement. Gray portland cement is used for structural applications and is the more common type of cement produced. White portland cement has lower iron and manganese contents than gray portland cement and is used primarily for decorative purposes. White portland cement costs more to produce because the heat for the kiln is provided by burning distillate fuel instead of coal or petroleum coke, which does not add gray material (iron and magnesium) to the cement. Manufacturing cement is an energy-intensive process involving the grinding and mixing of raw materials, which are chemically altered by intense heat from a high-temperature kiln to form a compound with binding properties. A diagram of the cement production process is shown in Figure I-1. The overall process can be divided into the following
four com(3) pyropprocessin whichintermedused, wi
Process 1. Raw
manuconccarboaragtheseSom
1. Raw
mponents: (processinges is prese
h energy is cdiate produith the rema
s Descriptio
Materials Aufacturing i
centration inonate contaonite, and ae raw matee quarries
w Material A
2. Kiln Fe
• a. Crus• b. Raw• c. Raw
3
••
1) raw mat, and (4) finnted belowconsumed.ct in cemenainder used
Figure
ns:
Acquisition s raw mate
n portland caining) raw an impure lrials (mostlproduce re
Acquisition
eed Prepar
sherw Mill/ Grind
Mill
3. Pyroproce
a. Kilnb. Clinker
4. Fini
• a. Ad• b. Fi• c. Ce
erials acqunished cem
w. Processe Pyroprocent productiod in raw ma
e I-1. Ceme
and Handlerials acquiscement, is o
materials, imestone kly limestonelatively pur
and Handli
ration
der
essing
r
sh Cement
dditives nish Mill/Grement - Fin
I-3
isition and ent grinding
es (1), (3), aessing, whion, accountaterial prepa
ent Produc
ing: The insition. Calcobtained froincluding li
known as "ne), are obtare limestone
ng
t Grinding
rindernal Product
handling, (g. A brief dand (4) arech producets for 90 pearation and
ction Proce
nitial step incium, the elom a varietymestone, cnatural cemained from oe that requi
2) kiln feeddescription
e the three mes the clinkeercent of totd finish grind
ess
n portland clement of hy of calcarechalk, marl, ment rock". open-face qres addition
d preparatioof these
main proceer, an tal energy ding.
cement highest eous (calciu
sea shellsIn Californ
quarries. nal raw
on,
sses
um , ia,
I-4
materials to achieve the correct chemical blend in the raw mix. In other quarries, the required non-calcareous constituents are found naturally in the limestone. Generally, limestone makes up the largest percentage (71 percent) of the raw material used in cement production. Therefore, cement plants are often located near limestone quarries where it can be easily extracted and transported to the plant. Other important raw material components include shale, clay, sand, and/or iron ore which make up about 16 percent of the raw material mixture. These components may be quarried near the plant and/or purchased and shipped from a supplier.
2. Kiln Feed Preparation:
Crusher: Quarried stones are crushed to smaller pieces between 0.375 and 0.75 inches (in). This insures a proper feed to the raw mill/fine grinding machines. Cement raw materials are received with an initial moisture content ranging from 1 to more than 50 percent. Since California facilities use dry process kilns, this moisture is usually reduced to less than 1 percent before or during grinding (USEPA 1995). Drying alone can be accomplished in dryers or during the grinding process. Thermal energy for drying can be supplied by exhaust gases from separate, direct-fired coal, oil, or gas burners, but the most efficient and widely used source of heat for drying is the hot exit gases from the pyroprocessing system.
Raw Mill/Grinder: The raw material mixture is ground fine enough to have 70 to 85 percent of the mixture pass through a 200 mesh screen (0.0027-in openings). The finely ground raw material mixture is referred to as raw meal.
Raw Meal: The quality and flowability of the raw meal has a significant effect on pyroprocessing and final clinker quality. The fineness, amount and nature of oversized particles, kiln circulating and separation patterns, and conductive energy transfer of the raw meal play important roles in creating clinker.
3. Pyroprocessing:
Kiln: Rotary kilns are long, cylindrical, slightly inclined furnaces that are lined with refractory to protect the steel shell and retain heat within the kiln. The raw material mix enters the kiln at the elevated end, and combustion fuels are generally introduced into the lower end of the kiln in a countercurrent manner. Raw materials are continuously and slowly moved to the lower end by rotation of the kiln. As they move down the kiln, the raw materials are chemically changed as a result of the increasing temperature within the kiln. The most commonly used kiln fuels are coal, natural gas, and occasionally oil. The use of supplemental fuels such as waste solvents, scrap rubber, and petroleum coke has expanded in recent years. This step requires the greatest amount of energy and produces the majority of GHG emissions.
I-5
The raw meal passes through a rotary kiln where it is gradually heated to 1480°C (2700°F), becomes partially molten, and binds together into lumps called clinker. The intense heat and rotation of the kiln allow chemical and physical reactions to occur which are necessary for the formation of clinker. This is called the pyroprocessing system. The pyroprocessing system may be divided into four stages, as a function of location and temperature of the materials in the rotary kiln (USEPA 1995):
Evaporation of uncombined water from raw materials, as material temperature
increases to 100°C (212°F); Dehydration, as the material temperature increases from 100°C to approximately
430°C (800°F) to form oxides of silicon, aluminum, and iron; Calcination, during which carbon dioxide (CO2) is evolved, between 900°C
(1650°F) and 982°C (1800°F), to form calcium oxide (CaO); and Reaction, of the oxides in the burning zone of the rotary kiln, to form cement
clinker at temperatures of approximately 1510°C (2750°F).
Clinker: As the raw meal is heated up, calcium carbonate (CaCO3) is broken down to form CaO and CO2. CaO further reacts with silica, aluminum, and iron to form clinker. Clinkers are gray, glass-hard, spherically shaped nodules that generally range from 0.32 to 5.1 centimeters (cm) (0.125 to 2.0 in) in diameter.
4. Finished Cement Grinding:
Additives: To control the setting time of concrete, 3 to 6 percent gypsum is mixed with the cooled clinker. Gypsum, also excavated from quarries or mines, is generally purchased from an external source rather than obtained directly from a captive operation by the cement plant. Finish Mill/Grinder: The final step in Portland cement manufacturing involves a sequence of blending and grinding operations that transforms clinker to finished Portland cement. The clinker and gypsum mix are ground to a fine powder where nearly all of it is able to pass through the 200 mesh screen. Up to 5 percent gypsum is added to the clinker during grinding to control the cement setting time, and other specialty chemicals are added, as needed, to impart specific product properties. This finish milling is accomplished almost exclusively in ball or tube mills. Typically, finishing is conducted in a closed circuit system, with product sizing by air separation. Cement: The ground mixture of clinker and gypsum is referred to as cement. Portland cement is categorized into five different types depending on the chemical composition as well as fineness of the milled cement. For example, Type III is ground more finely for a high early strength ratio (provides more reaction surfaces for hydration to occur) compared to the more general purpose Type I.
I-6
Energy Saving Processes Currently Used in California Two different processes are used to manufacture portland cement, wet and dry. The two processes are basically the same with the exception that water is added to raw materials in the wet process to make a slurry while the water is omitted in the dry process. The dry process is more energy efficient since it does not require the energy to evaporate the water. All California cement plants use dry process kilns to produce clinker and so are more energy efficient than plants that use the wet process. California cement plants have incorporated three primary energy efficiency modifications that are a subset of the 15 projects proposed in the U.S. EPA GHG reduction report. Some plants have retrofitted existing kilns with these modifications and others have replaced their kilns and included these modifications in the plant rebuild. These three modifications are: (1) adding cyclone-type preheaters that use the hot kiln exhaust gases to heat the raw
material prior to being introduced to the kiln; (2) adding a precalciner burner at the base of the preheater tower; and (3) using the waste heat from the clinker to preheat the kiln combustion air. These processes are discussed below: Dry-process pyroprocessing systems have been improved in thermal efficiency and productive capacity through the addition of one or more cyclone-type preheater vessels in the gas stream exiting the rotary kiln (Figure I-2). This system is called the preheater process. The vessels are arranged vertically, in series, and are supported by a structure known as the preheater tower. Hot exhaust gases from the rotary kiln pass counter-currently through the downward-moving raw materials in the preheater vessels. Compared to the simple rotary kiln, the heat transfer rate is significantly increased, the degree of heat utilization is greater, and the process time is markedly reduced by the intimate contact of the solid particles with the hot gases. The improved heat transfer allows the length of the rotary kiln to be reduced. The hot gases from the preheater tower are often used as a source of heat for drying raw materials in the raw mill. Because the catch from the mechanical collectors, fabric filters, and/or electrostatic precipitators (ESP) that follow the raw mill is returned to the process, these devices are considered to be production machines as well as pollution control devices. Additional thermal efficiencies and productivity gains have been achieved by diverting some fuel to a calciner vessel at the base of the preheater tower (Figure I-2). This system is called the preheater/precalciner (PH/PC) process. While a substantial amount of fuel is used in the precalciner (combusted in the precalciner burner), at least 40 percent of the thermal energy is required in the rotary kiln (USEPA 1995). The amount of fuel that is introduced to the calciner is determined by the availability and source of oxygen for combustion in the calciner. Calciner systems sometimes use lower-quality fuels (e. g., less-volatile matter) as a means of improving process economics.
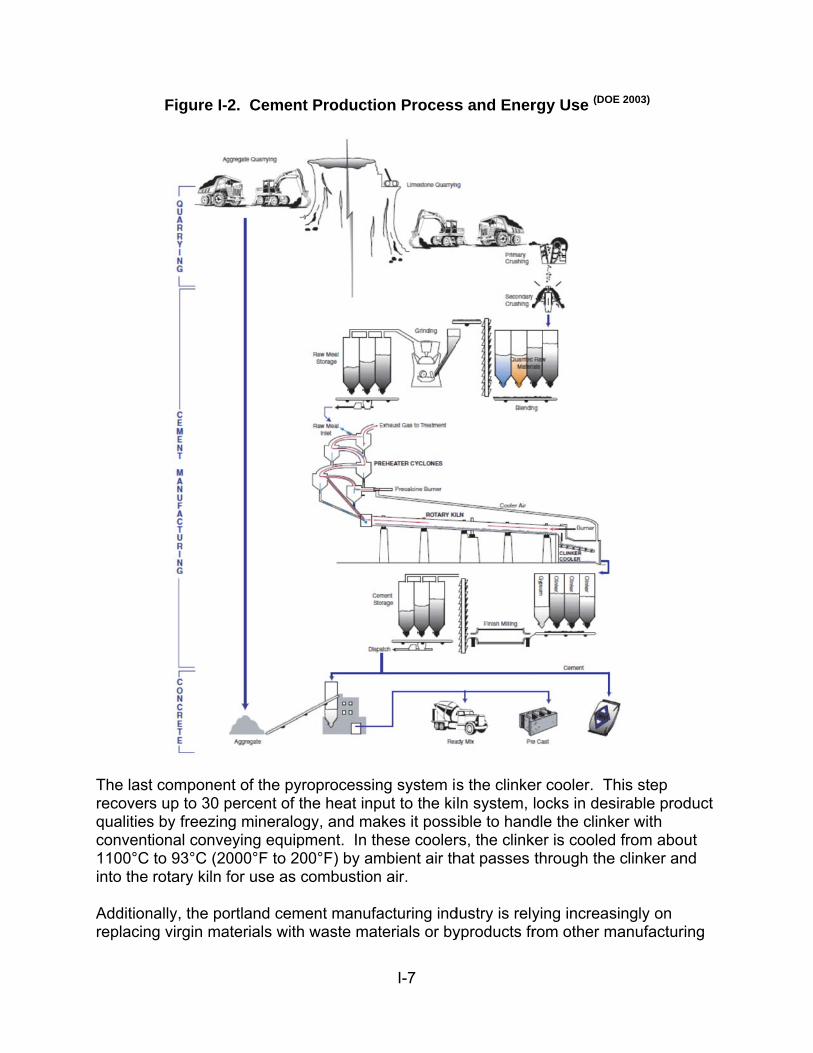
The lastrecoversqualitiesconvent1100°C into the Additionreplacin
Figure I-2
t componens up to 30 ps by freezinional conveto 93°C (20rotary kiln f
nally, the pog virgin ma
2. Cement
nt of the pyrpercent of tg mineralog
eying equip000°F to 20for use as c
ortland cematerials with
t Productio
roprocessinhe heat inpgy, and ma
pment. In th00°F) by amcombustion
ent manufa waste mat
I-7
on Process
ng system isput to the kiakes it posshese coolermbient air thn air.
acturing indterials or by
s and Ener
s the clinkeln system,
sible to handrs, the clinkhat passes
dustry is relyyproducts fr
rgy Use (DO
er cooler. Tlocks in dedle the clink
ker is cooledthrough the
ying increarom other m
OE 2003)
This step sirable prodker with d from aboe clinker an
singly on manufactur
duct
ut nd
ing
I-8
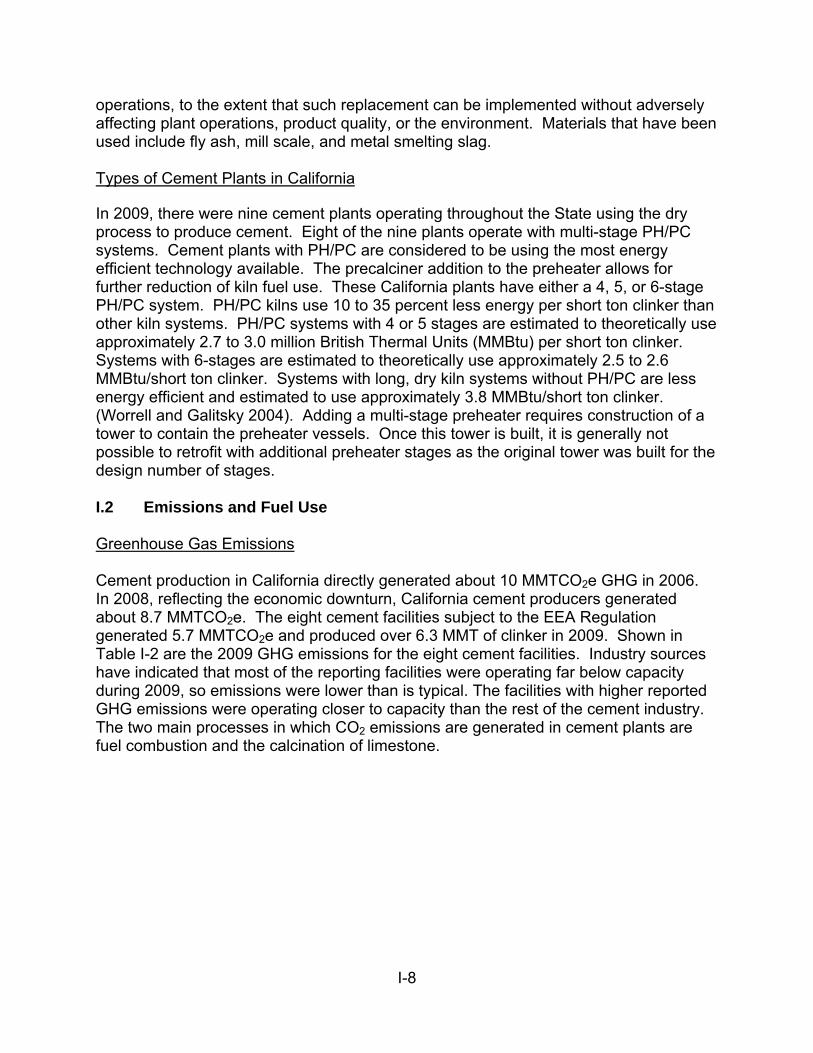
operations, to the extent that such replacement can be implemented without adversely affecting plant operations, product quality, or the environment. Materials that have been used include fly ash, mill scale, and metal smelting slag. Types of Cement Plants in California In 2009, there were nine cement plants operating throughout the State using the dry process to produce cement. Eight of the nine plants operate with multi-stage PH/PC systems. Cement plants with PH/PC are considered to be using the most energy efficient technology available. The precalciner addition to the preheater allows for further reduction of kiln fuel use. These California plants have either a 4, 5, or 6-stage PH/PC system. PH/PC kilns use 10 to 35 percent less energy per short ton clinker than other kiln systems. PH/PC systems with 4 or 5 stages are estimated to theoretically use approximately 2.7 to 3.0 million British Thermal Units (MMBtu) per short ton clinker. Systems with 6-stages are estimated to theoretically use approximately 2.5 to 2.6 MMBtu/short ton clinker. Systems with long, dry kiln systems without PH/PC are less energy efficient and estimated to use approximately 3.8 MMBtu/short ton clinker. (Worrell and Galitsky 2004). Adding a multi-stage preheater requires construction of a tower to contain the preheater vessels. Once this tower is built, it is generally not possible to retrofit with additional preheater stages as the original tower was built for the design number of stages. I.2 Emissions and Fuel Use Greenhouse Gas Emissions Cement production in California directly generated about 10 MMTCO2e GHG in 2006. In 2008, reflecting the economic downturn, California cement producers generated about 8.7 MMTCO2e. The eight cement facilities subject to the EEA Regulation generated 5.7 MMTCO2e and produced over 6.3 MMT of clinker in 2009. Shown in Table I-2 are the 2009 GHG emissions for the eight cement facilities. Industry sources have indicated that most of the reporting facilities were operating far below capacity during 2009, so emissions were lower than is typical. The facilities with higher reported GHG emissions were operating closer to capacity than the rest of the cement industry. The two main processes in which CO2 emissions are generated in cement plants are fuel combustion and the calcination of limestone.
I-9
Table I-2. 2009 GHG Emissions from Eight Cement Plants Required to Report
Facility 2009 GHG Emissions (MMTCO2e) CalPortland, Colton 0.33 CalPortland, Mojave 0.84 Lehigh Southwest, Cupertino 0.54 Lehigh Southwest, Tehachapi 0.32 National Cement, Lebec 0.42 Cemex, Victorville 1.65 Mitsubishi Cement 0.93 TXI Riverside Cement 0.71
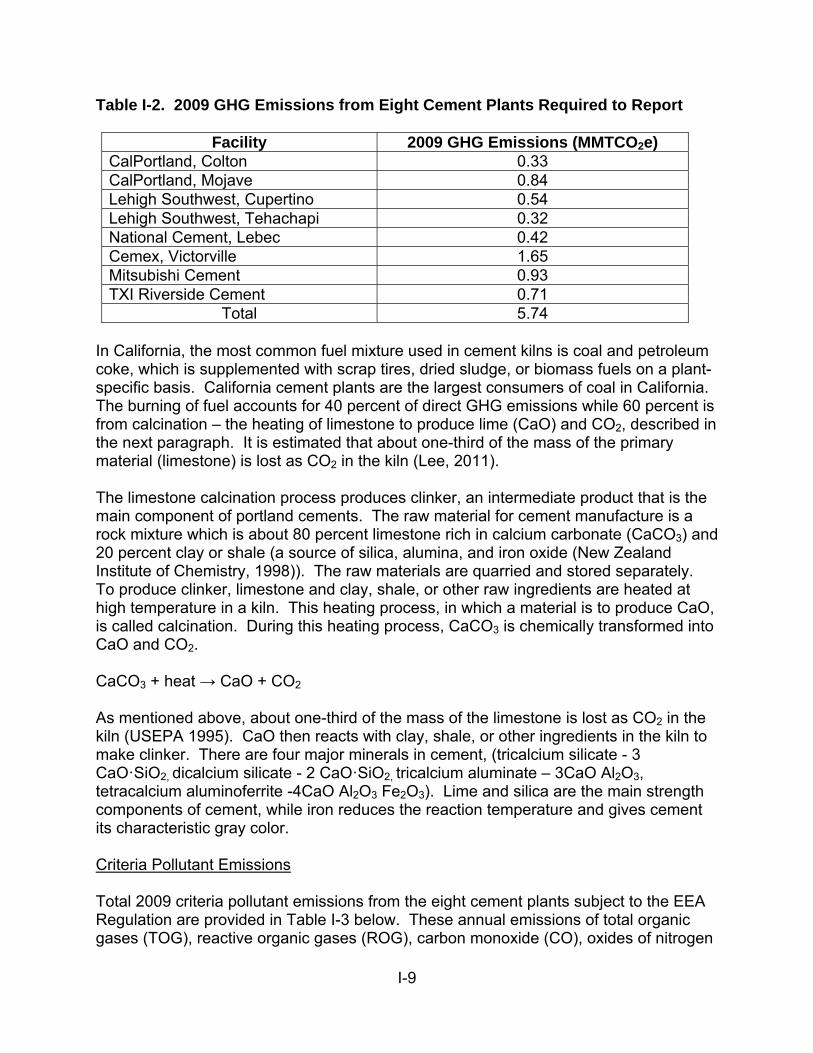
Total 5.74 In California, the most common fuel mixture used in cement kilns is coal and petroleum coke, which is supplemented with scrap tires, dried sludge, or biomass fuels on a plant-specific basis. California cement plants are the largest consumers of coal in California. The burning of fuel accounts for 40 percent of direct GHG emissions while 60 percent is from calcination – the heating of limestone to produce lime (CaO) and CO2, described in the next paragraph. It is estimated that about one-third of the mass of the primary material (limestone) is lost as CO2 in the kiln (Lee, 2011). The limestone calcination process produces clinker, an intermediate product that is the main component of portland cements. The raw material for cement manufacture is a rock mixture which is about 80 percent limestone rich in calcium carbonate (CaCO3) and 20 percent clay or shale (a source of silica, alumina, and iron oxide (New Zealand Institute of Chemistry, 1998)). The raw materials are quarried and stored separately. To produce clinker, limestone and clay, shale, or other raw ingredients are heated at high temperature in a kiln. This heating process, in which a material is to produce CaO, is called calcination. During this heating process, CaCO3 is chemically transformed into CaO and CO2. CaCO3 + heat → CaO + CO2 As mentioned above, about one-third of the mass of the limestone is lost as CO2 in the kiln (USEPA 1995). CaO then reacts with clay, shale, or other ingredients in the kiln to make clinker. There are four major minerals in cement, (tricalcium silicate - 3 CaO·SiO2, dicalcium silicate - 2 CaO·SiO2, tricalcium aluminate – 3CaO Al2O3, tetracalcium aluminoferrite -4CaO Al2O3 Fe2O3). Lime and silica are the main strength components of cement, while iron reduces the reaction temperature and gives cement its characteristic gray color. Criteria Pollutant Emissions Total 2009 criteria pollutant emissions from the eight cement plants subject to the EEA Regulation are provided in Table I-3 below. These annual emissions of total organic gases (TOG), reactive organic gases (ROG), carbon monoxide (CO), oxides of nitrogen
I-10
(NOx), and particulate matter (with aerodynamic diameters less than 2.5 or 10 μm) were all less than 1 percent of statewide emissions. Sulfur oxide (SOx) emissions from cement plants accounted for slightly more than 1.5 percent of statewide SOx emissions. Table I-3. Aggregate Statewide Criteria Pollutant Emissions from Cement Plants Subject to EEA Regulation1
Criteria Pollutant Total mass emissions
(tons/day) Total Organic Gases <1 Reactive Organic Gases <1 Carbon Monoxide 13 Oxides of Nitrogen 28 Sulfur Oxides 4.4 Particulate Matter, aerodynamic diameter < 2.5 μm <1 Particulate Matter, aerodynamic diameter < 10 μm 4.4 (1)Criteria pollutant emissions are values reported by the facility to the local air district or calculated by the air district for CY 2009 or the most recent 12-month period. Toxic Air Contaminant (TAC) Emissions The TAC emissions data submitted by the eight cement plants subject to the EEA Regulation contained 91 compounds. The TACs reported may vary by local air district such that not all TACs were reported by all the facilities. The TACs are ranked according to potential public health impact based on the combination of mass emissions and cancer potency. The cancer potency factors (CPF) used are approved by California’s Office of Environmental Health Hazard Assessment and can be found on the web at http://www.oehha.ca.gov/air/hot_spots/tsd052909.html (OEHHA, 2009)
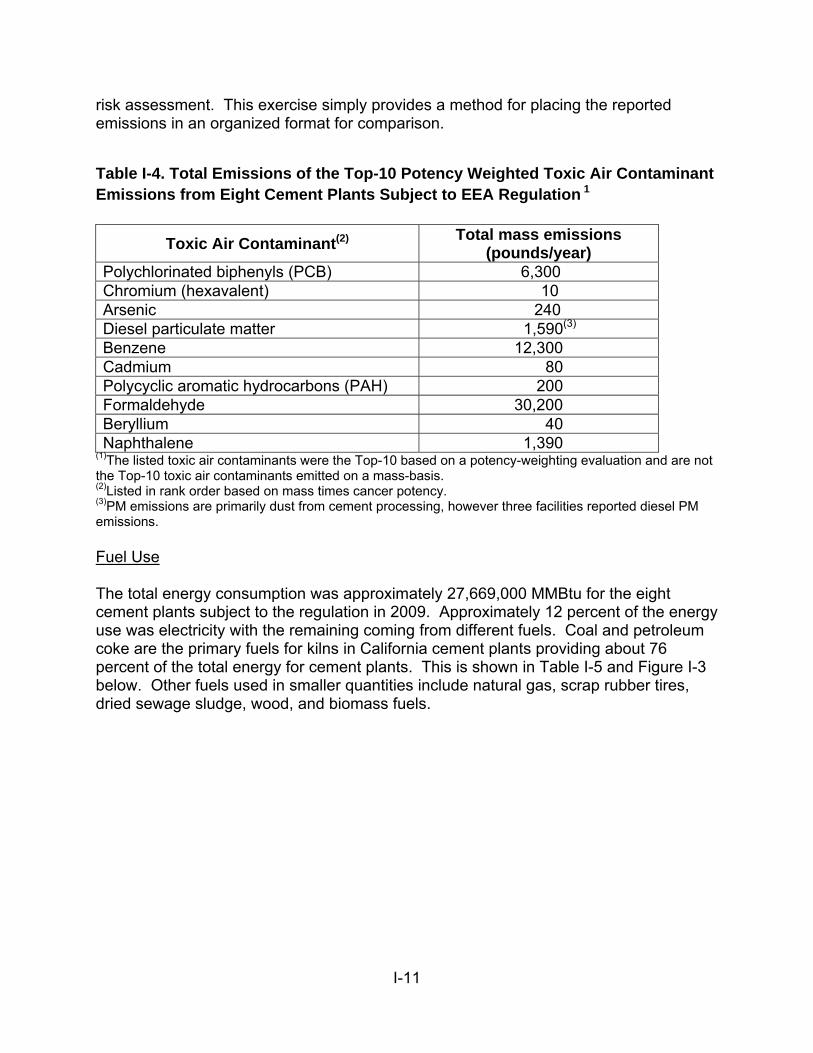
Total emissions of the top-10 cancer potency weighted TACs are shown in Table I-4 and include particles, fibers, aromatic compounds, metals, and oxygenated hydrocarbons.
To identify the toxics pollutants of potential concern, the pollutants for each facility and their sector were ranked using the reported emissions for each pollutant and their cancer potency factor (CPF). Pound for pound, not all pollutants are equal in terms of potential health impacts to the public. Specifically, the ranking (R) for each pollutant is determined by multiplying the reported emissions (E) and the pollutant-specific inhalation CPF. The equation for ranking each pollutant is: R = E x CPF. This method for ranking pollutants is a simplistic tool used to rank the reported emissions according to potential health impacts. All of the pollutants reported for the sector were ranked using the equation above. The ten pollutants with the highest ranking are listed in the table. The location of a pollutant on the list in the table is a combination of the reported emissions and the presence and/or relative magnitude of the CPF. The pollutant with the highest ranking is listed first. While the CPF is typically used in health risk assessments to estimate potential cancer risk, this exercise is not a
I-11
risk assessment. This exercise simply provides a method for placing the reported emissions in an organized format for comparison.
Table I-4. Total Emissions of the Top-10 Potency Weighted Toxic Air Contaminant Emissions from Eight Cement Plants Subject to EEA Regulation 1
Toxic Air Contaminant(2) Total mass emissions
(pounds/year) Polychlorinated biphenyls (PCB) 6,300 Chromium (hexavalent) 10 Arsenic 240 Diesel particulate matter 1,590(3) Benzene 12,300 Cadmium 80 Polycyclic aromatic hydrocarbons (PAH) 200 Formaldehyde 30,200 Beryllium 40 Naphthalene 1,390
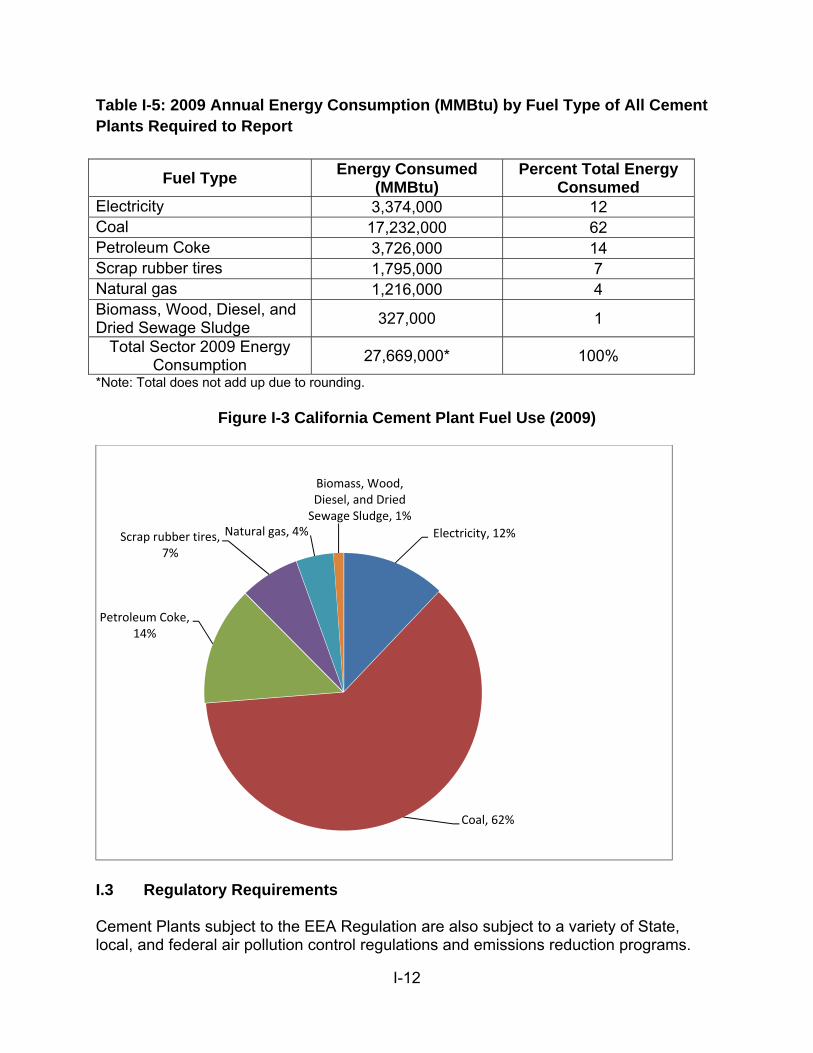
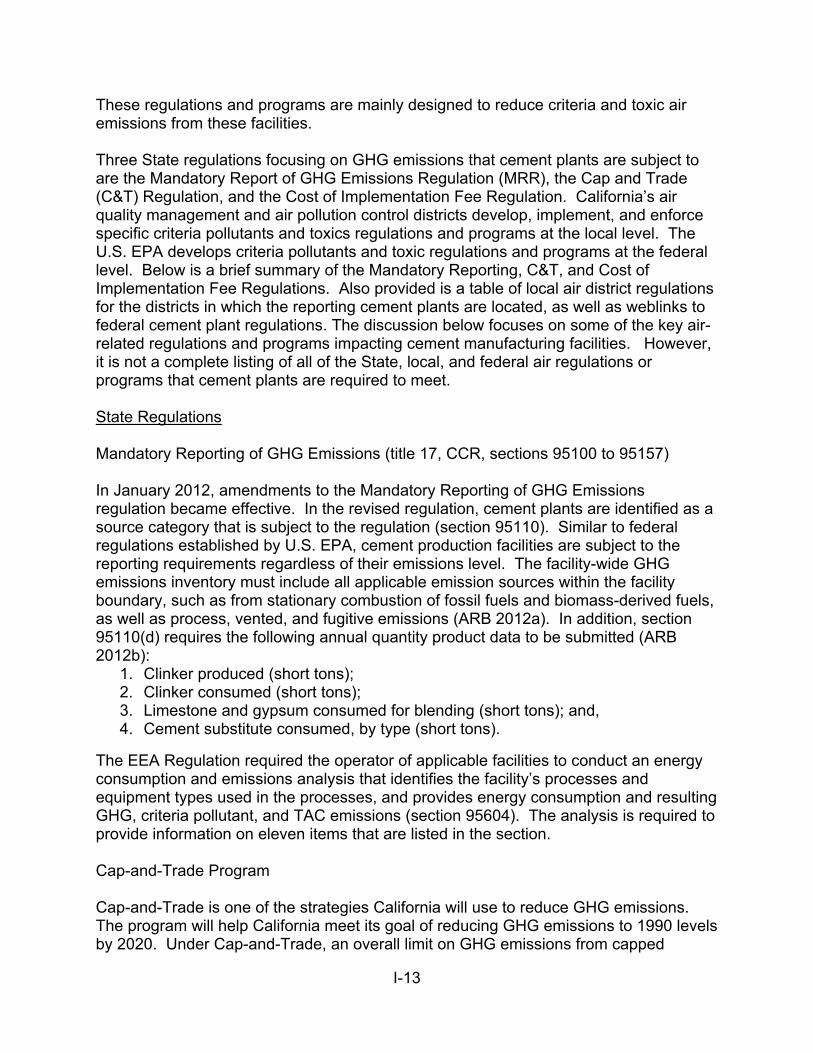
(1)The listed toxic air contaminants were the Top-10 based on a potency-weighting evaluation and are not the Top-10 toxic air contaminants emitted on a mass-basis. (2)Listed in rank order based on mass times cancer potency. (3)PM emissions are primarily dust from cement processing, however three facilities reported diesel PM emissions. Fuel Use The total energy consumption was approximately 27,669,000 MMBtu for the eight cement plants subject to the regulation in 2009. Approximately 12 percent of the energy use was electricity with the remaining coming from different fuels. Coal and petroleum coke are the primary fuels for kilns in California cement plants providing about 76 percent of the total energy for cement plants. This is shown in Table I-5 and Figure I-3 below. Other fuels used in smaller quantities include natural gas, scrap rubber tires, dried sewage sludge, wood, and biomass fuels.
I-12
Table I-5: 2009 Annual Energy Consumption (MMBtu) by Fuel Type of All Cement Plants Required to Report
Fuel Type Energy Consumed
(MMBtu) Percent Total Energy
Consumed Electricity 3,374,000 12 Coal 17,232,000 62 Petroleum Coke 3,726,000 14 Scrap rubber tires 1,795,000 7 Natural gas 1,216,000 4 Biomass, Wood, Diesel, and Dried Sewage Sludge
327,000 1
Total Sector 2009 Energy Consumption
27,669,000* 100%
*Note: Total does not add up due to rounding.
Figure I-3 California Cement Plant Fuel Use (2009)
I.3 Regulatory Requirements Cement Plants subject to the EEA Regulation are also subject to a variety of State, local, and federal air pollution control regulations and emissions reduction programs.
Electricity, 12%
Coal, 62%
Petroleum Coke, 14%
Scrap rubber tires, 7%
Natural gas, 4%
Biomass, Wood, Diesel, and Dried Sewage Sludge, 1%
I-13
These regulations and programs are mainly designed to reduce criteria and toxic air emissions from these facilities. Three State regulations focusing on GHG emissions that cement plants are subject to are the Mandatory Report of GHG Emissions Regulation (MRR), the Cap and Trade (C&T) Regulation, and the Cost of Implementation Fee Regulation. California’s air quality management and air pollution control districts develop, implement, and enforce specific criteria pollutants and toxics regulations and programs at the local level. The U.S. EPA develops criteria pollutants and toxic regulations and programs at the federal level. Below is a brief summary of the Mandatory Reporting, C&T, and Cost of Implementation Fee Regulations. Also provided is a table of local air district regulations for the districts in which the reporting cement plants are located, as well as weblinks to federal cement plant regulations. The discussion below focuses on some of the key air-related regulations and programs impacting cement manufacturing facilities. However, it is not a complete listing of all of the State, local, and federal air regulations or programs that cement plants are required to meet. State Regulations Mandatory Reporting of GHG Emissions (title 17, CCR, sections 95100 to 95157) In January 2012, amendments to the Mandatory Reporting of GHG Emissions regulation became effective. In the revised regulation, cement plants are identified as a source category that is subject to the regulation (section 95110). Similar to federal regulations established by U.S. EPA, cement production facilities are subject to the reporting requirements regardless of their emissions level. The facility-wide GHG emissions inventory must include all applicable emission sources within the facility boundary, such as from stationary combustion of fossil fuels and biomass-derived fuels, as well as process, vented, and fugitive emissions (ARB 2012a). In addition, section 95110(d) requires the following annual quantity product data to be submitted (ARB 2012b):
1. Clinker produced (short tons); 2. Clinker consumed (short tons); 3. Limestone and gypsum consumed for blending (short tons); and, 4. Cement substitute consumed, by type (short tons).
The EEA Regulation required the operator of applicable facilities to conduct an energy consumption and emissions analysis that identifies the facility’s processes and equipment types used in the processes, and provides energy consumption and resulting GHG, criteria pollutant, and TAC emissions (section 95604). The analysis is required to provide information on eleven items that are listed in the section. Cap-and-Trade Program Cap-and-Trade is one of the strategies California will use to reduce GHG emissions. The program will help California meet its goal of reducing GHG emissions to 1990 levels by 2020. Under Cap-and-Trade, an overall limit on GHG emissions from capped
I-14
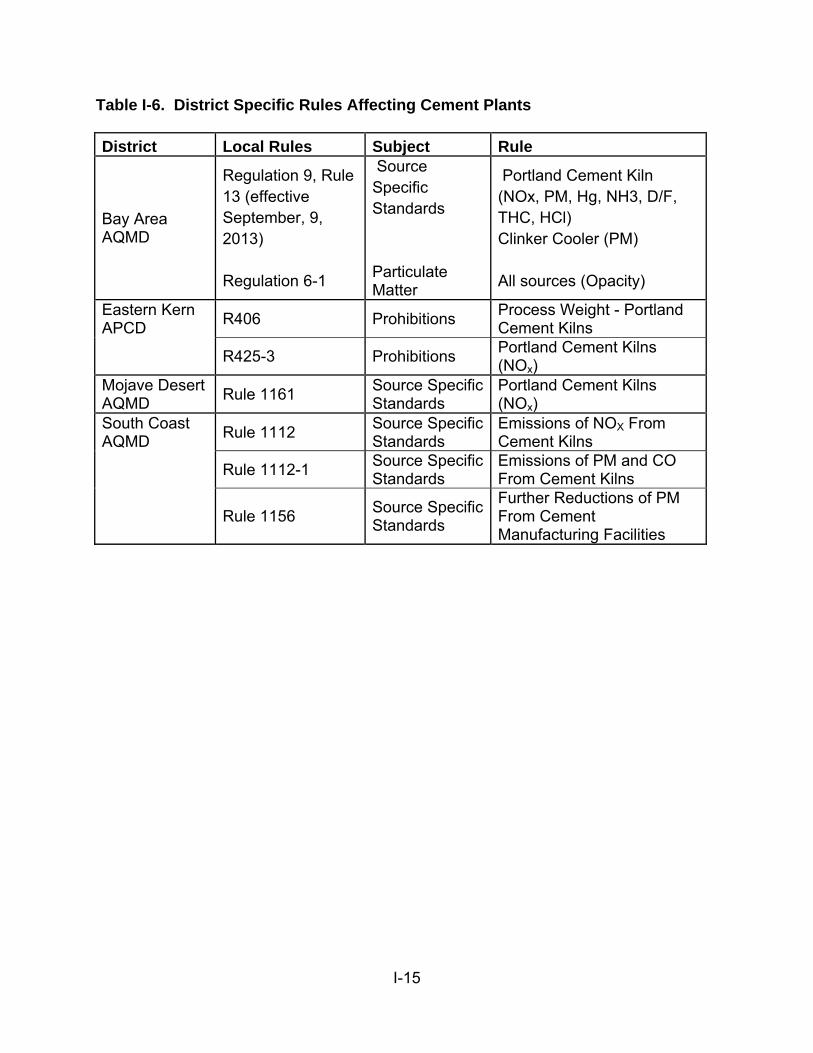
sectors has been established and facilities subject to the cap will be able to trade compliance instruments (allowances and offsets). Cement plants are subject to the Cap-and-Trade Regulation and will have to either reduce on-site GHG emissions or obtain GHG compliance instruments equal to their compliance obligation. For more information about the Cap-and-Trade Program, please go to http://www.arb.ca.gov/cc/capandtrade/capandtrade.htm Cost of Implementation Fee Regulation (title 17, CCR, sections 95200 to 95207) The AB 32 Cost of Implementation Fee Regulation was finalized on June 17, 2010 and became effective on July 17, 2010. Amendments were adopted on October 20, 2011 and became effective on October 3, 2012. AB 32 authorized ARB to adopt a schedule of fees to be paid by sources of GHG emissions. Money collected from these fees will be used to fund the State’s costs of implementing AB 32. Entities subject to these fees include large natural gas distributors and large users of natural gas including refineries, suppliers and importers of gasoline and diesel fuel, electricity importers and in-state generating facilities, facilities that combust coal and petroleum coke, and cement manufacturers. There are approximately 300 facilities subject to this fee. Fees are determined based on the annual budget for the program and the cost to repay start-up loans. The regulation is designed so that invoices are sent after the budget is approved ensuring that each year ARB collects only the amount authorized to run the program and repay the startup loans. The fees are based on a uniform cost for each metric ton of carbon dioxide subject to the regulation. This uniform cost is referred to as the Common Carbon Cost (CCC) and is calculated as the total amount of funding to be collected divided by the total number of emissions subject to the regulation. For more information about the Cost of Implementation Fee Regulation, please go to: http://www.arb.ca.gov/cc/adminfee/adminfee.htm. District Regulations The following provides a summary of the Bay Area, Eastern Kern, Mojave Desert, and South Coast districts’ Criteria and Toxics Emission Reductions Regulations and Programs. Table I-6 below lists the key district criteria regulations affecting cement plants. In addition, cement plants are subject to district permitting regulations and air toxics reporting programs.
I-15
Table I-6. District Specific Rules Affecting Cement Plants
District Local Rules Subject Rule
Bay Area AQMD
Regulation 9, Rule 13 (effective September, 9, 2013) Regulation 6-1
Source Specific Standards Particulate Matter
Portland Cement Kiln (NOx, PM, Hg, NH3, D/F, THC, HCl) Clinker Cooler (PM) All sources (Opacity)
Eastern Kern APCD
R406 Prohibitions Process Weight - Portland Cement Kilns
R425-3 Prohibitions Portland Cement Kilns (NOx)
Mojave Desert AQMD
Rule 1161 Source Specific Standards
Portland Cement Kilns (NOx)
South Coast AQMD
Rule 1112 Source Specific Standards
Emissions of NOX From Cement Kilns
Rule 1112-1 Source Specific Standards
Emissions of PM and CO From Cement Kilns
Rule 1156 Source Specific Standards
Further Reductions of PM From Cement Manufacturing Facilities
I-16
Federal Regulations Federal regulations affecting cement plants can be accessed via the following links:
1) Title 40, CFR Part 60, Subpart F—Standards of Performance for Portland Cement Plants http://www.epa.gov/ttn/atw/pcem/fr18ja11.pdf
2) Title 40, CFR Part 63
I.4 Energy Efficiency Improvement Opportunities All eight cement plants identified improvement opportunities that were primarily based on the 15 projects identified by U.S. EPA in their report, “Available and Emerging Technologies for Reducing Greenhouse Gas Emissions from the Portland Cement Industry” (USEPA 2010). The majority of the identified projects were completed during comprehensive facility upgrades to the PH/PC kiln systems. Whole-facility modifications/upgrades to a PH/PC kiln system entail the implementation of a suite of individual projects that must be aligned with the overall scope of the project. When a facility installs a PH/PC kiln system, modifications will be made to the kiln combustion system, clinker cooler, and related systems to maximize cost savings. As such, it is difficult to separate the benefits stemming from individual projects contained within the overall kiln system modification. The data submitted by the facilities establishes broad cost and benefit ranges that may need to be verified with additional data. Estimating the costs and benefits of the individual components that comprise an upgrade to a PH/PC system is difficult; however, broad generalizations can be made about project-specific costs and benefits. The cost and emission benefits reported by the facilities are provided later in this section in Tables I-8 and I-9. Seven of the eight plants subject to the EEA Regulation are equipped with multiple-stage PH/PC technology kilns (described in section I.1 above). A PH/PC system is the most energy efficient cement production technology available. These seven facilities completed major plant modifications to a PH/PC kiln system between 1998 and 2008. California’s cement plants are more energy efficient than others throughout the United States that do not have a PH/PC system. As such, many of the thermal energy efficiency measures for the cement industry contained in U.S. EPA’s 2010 report on technologies for reducing GHG emissions from cement plants were implemented when each facility performed its kiln system upgrade (e.g., addition of multistage PH systems and cyclone stages). Estimated NOx Reductions For NOx formation in cement kilns, EPA and others have published references that document that two NOx formation mechanisms, thermal NOx and fuel NOx, are present in cement kilns. Thermal NOx is formed by nitrogen in the air reacting at high temperatures and fuel NOx is formed by nitrogen in the fuel being converted to NOx.
I-17
Only fuel NOx can be potentially measurably reduced by altering/reducing fuel use, however, based on published references by U.S. EPA and others, thermal NOx formation is the dominant NOx formation mechanism for cement kilns. An estimate of potential fuel NOx emissions reductions was developed by the facilities for many of the projects identified. The NOx emissions reductions are estimates only and subject to changes should actual NOx data becomes available. There are significant variations in NOx emissions due to many other factors. Additionally, hourly NOx emissions can vary by more than 10 percent during operations. Consequently, since estimated NOx reductions are generally less than 0.5 percent, the estimated reductions are within the bounds of the process variability. Particulate Matter Reductions Particulate matter reductions were not provided by the facilities for the identified projects. This is because the bulk of particulate matter, or PM10, in cement plants are from raw materials processing rather than fuels. So for small kiln fuel usage reductions, the change in the total quantity of raw materials handled is small and the associated PM10 change would be negligible. U.S. EPA Cement Energy Efficiency Improvement Projects The energy efficiency improvement analysis conducted by the cement facilities focused on available and emerging technologies contained in the U.S. EPA’s 2010 report mentioned above. Below is a brief description of the U.S. EPA-identified projects and the status of implementation of these projects at California cement plants. These projects are also listed in Table I-8. The six U.S. EPA projects being implemented by multiple plants are as follows:
Process control improvements: Involves the use of an automated process control system to maintain kiln operating conditions at optimum levels. Such systems are used to manage cement production to avoid excess energy use, generation of off-specification or rejected products, and optimize recycling opportunities.
Kiln seal replacement: Kiln seals are used at the inlet and outlet of the kiln to reduce heat loss and air penetration. When seals are compromised, leaks can occur, that may increase the energy requirements for cement production.
Kiln combustion system upgrades: Involves kiln system upgrades to optimize fuel combustion (e.g., shape of the flame), and the mixing of combustion air and fuel.
Kiln refractory upgrade: Kiln refractory is the brick lining that insulates the steel walls of the kiln from corrosion by the cement production process. Refractory is also used to limit kiln heat losses and to achieve desired heat transfer properties. Optimization involves balancing heat retention performance, durability, and other factors (e.g., down time) in the selection of refractory materials.
I-18
Clinker cooler upgrade: Clinker coolers decrease the temperature of clinker output for intermediate clinker storage. In addition, the cooler may also heat secondary air for kiln combustion processes and tertiary air for the precalciner.
Add multistage preheater: Adding more preheater stages allows for higher energy transfer efficiency and lower fuel requirements in the kiln.
In addition, there are six other U.S. EPA thermal efficiency improvement projects that were not as universally implemented, but may be beneficial to some California cement plants. These projects may not be applicable to all cement plants because of previous modernizations that already included these projects or do not apply due to various design constraints. Brief descriptions of these six other thermal energy efficiency projects are provided below:
Preheater insulation: Refers to insulation of the preheater tower versus the kiln. Mid-kiln firing: The practice of adding fuel (e.g., tires) at a point near the middle of
the kiln, which can result in reduced overall fuel usage and CO2 emissions. Air mixing in kiln: This involves injecting a high pressure air stream into a kiln to
break up and mix stratified layers of gases in the kiln. Mixing the air improves combustion efficiency, and less fuel is required leading to lower CO2 emissions.
Waste heat recovery for raw material drying: Involves adding a dryer to use waste heat from the kiln to dry raw materials.
Oxygen enrichment: Involves injecting oxygen (in place of air) directly into the zone of combustion to increase combustion efficiency, reduce exhaust gas volume, and reduce NOx formation. It also has been shown to increase production capacity.
Riser duct firing: This project is a NOx control technology in which a portion of the fuel in the riser duct, the duct that carries exhaust from the kiln to the precalciner, is fired to increase the degree of calcination in the preheater. Riser duct firing can only be used in preheater kilns, and not in PH/PC kilns.
The remaining three U.S. EPA projects not being implemented at California cement plants are as follows:
Fluxes and mineralizers: Fluxes and mineralizers are typically inorganic elements, added in small amounts, which can reduce the temperature at which clinker melt begins to form in the kiln and promote formation of desired clinker compounds. Their use can reduce fuel energy demand in the kiln. Industry chose not to pursue this project due to the possible risk of plugging in the tower, causing a kiln shutdown, which would result in reducing overall efficiency due to the additional energy needed for kiln startup.
Preheater cyclone stage addition: A preheater cyclone is a conical vessel into which a gas-stream containing raw material dust is passed prior to entering the kiln. The vortex in the cyclone allows for efficient collection of the dust, which collects on the walls of cyclone. This measure consists of adding more cyclone stages to the preheater tower to recover additional heat from the exhaust gas –
I-19
this is something that is done at the time of preheater tower installation and is not feasible as a retrofit installation due to structural limitations of the existing tower.
Raw material substitution: Involves the introduction of materials like slag and fly ash into the raw material feed to reduce the amount of raw material needed to produce a given amount of clinker. This results in less energy being needed for clinker production. The industry explained that raw material substitution is necessarily a site specific evaluation since the raw materials are not of homogenous quality and can have adverse impacts on product quality and criteria emissions which is further complicated by new U.S. EPA regulations (National Emission Standards for Hazardous Air Pollutants (NESHAPS) and Commercial/Industrial Solid Waste Incinerators (CISWI)).
There are other projects that have been identified that were not included in the 15 U.S. EPA projects. These projects may not be universally applicable because of previous modernizations completed at the facility or certain design constraints. Brief descriptions of the other projects are provided below:
High efficiency fans (raw mill, clinker cooler, kiln, coal mill, and others): Install high efficiency fans on largest-size, highest-use fans throughout the plant.
Add variable frequency drives (VFD) to blowers: Add variable frequency drives on blowers to increase blower efficiency.
Finish mill high efficiency separator: Install high efficiency separator on finish mill to reduce the recirculated solids and increase mill efficiency.
Compressed air system optimization: Modifications to the compressed air system to increase system efficiency, including installing new air dryers, replacing the condensate traps, adding controls, installing new, more efficient compressors, and modified linking.
Lighting replacement: Lighting replaced over time with more efficient lighting.
Energy Efficiency Improvement Projects The EEA Regulation required facilities to provide project-specific cost and benefit data. Industry responded with broad estimates of the cost and benefits of individual projects that were installed as components of a comprehensive system upgrade. The information on potential energy efficiency improvement projects, provided in Tables I-7 through I-9, was compiled by ARB staff using information provided in the EEA Reports prepared by the eight cement plants subject to the EEA Regulation. All projects that were identified as Completed/Ongoing, Scheduled, or Under Investigation are included in Tables I-8 and I-9. Projects that were identified as Not Implementing were not included. Each table covers a broad category of equipment or processes identified by the table title and referred to as “Equipment Category”. The “Equipment Category” for each table is listed in Table I-7 along with a brief description of the type of projects in the specific category.
I-20
Table I-7: Listing of Equipment Categories and Projects Descriptions
Table Number
Equipment Category
Description of Types of Projects
Table I-8 Thermal
Equipment Projects dealing with the kiln and waste heat recovery
Table I-9 Electrical
Equipment
Projects dealing with electric motors powering air compressors, pumps, fans, drives, lighting and other types of electrical equipment
Within each table, the projects are assigned to an “Efficiency Improvement Method” group (column 1). The Efficiency Improvement Method is the approach, action or mechanism that would result in energy efficiency improvements, and are as follows:
Equipment modification Equipment upgrade Investment in new technologies Improve controls Maintenance practice
The information associated with each “Efficiency Improvement Method” represents numerous potential projects. The specific projects associated with the “Efficiency Improvement Method” are provided in Tables I-8 and I-9 under the column entitled “Project Description.” A more detailed description of these projects is provided in the paragraphs above. The emissions and cost data provided are a summation of the data provided for all the projects under the specific “Efficiency Improvement Method” grouping. The estimated GHG emission reductions associated with the projects, capital costs, annual costs, and annual savings estimated by the facilities are also provided. These estimated benefits were usually based on the fuel savings realized. Where projects have been grouped, the reported values are a summation of all the projects represented by the listing. No estimates of PM co-benefits were provided by these facilities. As mentioned above, total PM emissions from a cement facility are composed primarily of dust from cement processing with a minimal proportion from the combustion process. The information is arranged so as to provide the maximum transparency of the information reported and at the same time protect the confidential business information the facilities provided in a manner consistent with ARB regulations. The information provided in Table I-8 and I-9 is preliminary and not based on detailed engineering and economic analyses for all the potential projects. Additional data and analysis would be needed to develop emissions, costs, benefits, and timing information sufficient to support implementation of these projects by regulation.
I-21
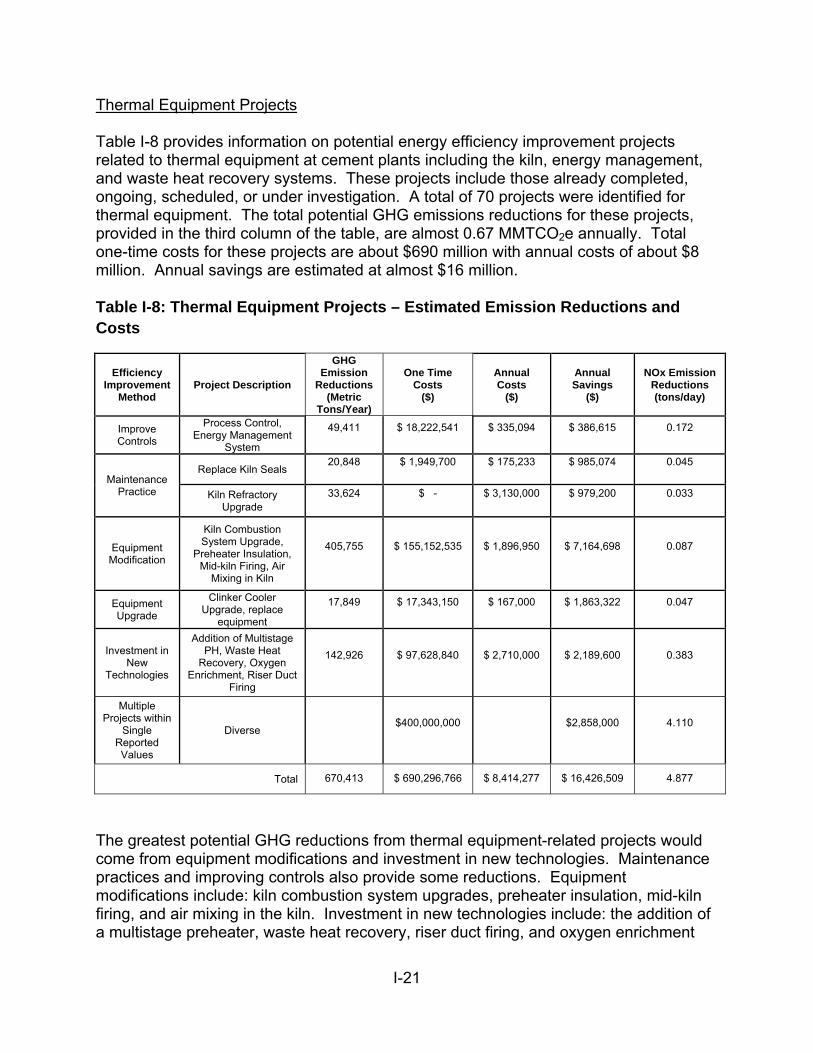
Thermal Equipment Projects Table I-8 provides information on potential energy efficiency improvement projects related to thermal equipment at cement plants including the kiln, energy management, and waste heat recovery systems. These projects include those already completed, ongoing, scheduled, or under investigation. A total of 70 projects were identified for thermal equipment. The total potential GHG emissions reductions for these projects, provided in the third column of the table, are almost 0.67 MMTCO2e annually. Total one-time costs for these projects are about $690 million with annual costs of about $8 million. Annual savings are estimated at almost $16 million. Table I-8: Thermal Equipment Projects – Estimated Emission Reductions and Costs
Efficiency Improvement
Method Project Description
GHG Emission
Reductions (Metric
Tons/Year)
One Time Costs
($)
Annual Costs
($)
Annual Savings
($)
NOx Emission Reductions (tons/day)
Improve Controls
Process Control, Energy Management
System
49,411 $ 18,222,541 $ 335,094 $ 386,615 0.172
Maintenance Practice
Replace Kiln Seals 20,848 $ 1,949,700 $ 175,233 $ 985,074 0.045
Kiln Refractory Upgrade
33,624 $ - $ 3,130,000 $ 979,200 0.033
Equipment Modification
Kiln Combustion System Upgrade,
Preheater Insulation, Mid-kiln Firing, Air
Mixing in Kiln
405,755 $ 155,152,535 $ 1,896,950 $ 7,164,698 0.087
Equipment Upgrade
Clinker Cooler Upgrade, replace
equipment
17,849 $ 17,343,150 $ 167,000 $ 1,863,322 0.047
Investment in New
Technologies
Addition of Multistage PH, Waste Heat
Recovery, Oxygen Enrichment, Riser Duct
Firing
142,926 $ 97,628,840 $ 2,710,000 $ 2,189,600 0.383
Multiple Projects within
Single Reported Values
Diverse $400,000,000 $2,858,000 4.110
Total 670,413 $ 690,296,766 $ 8,414,277 $ 16,426,509 4.877
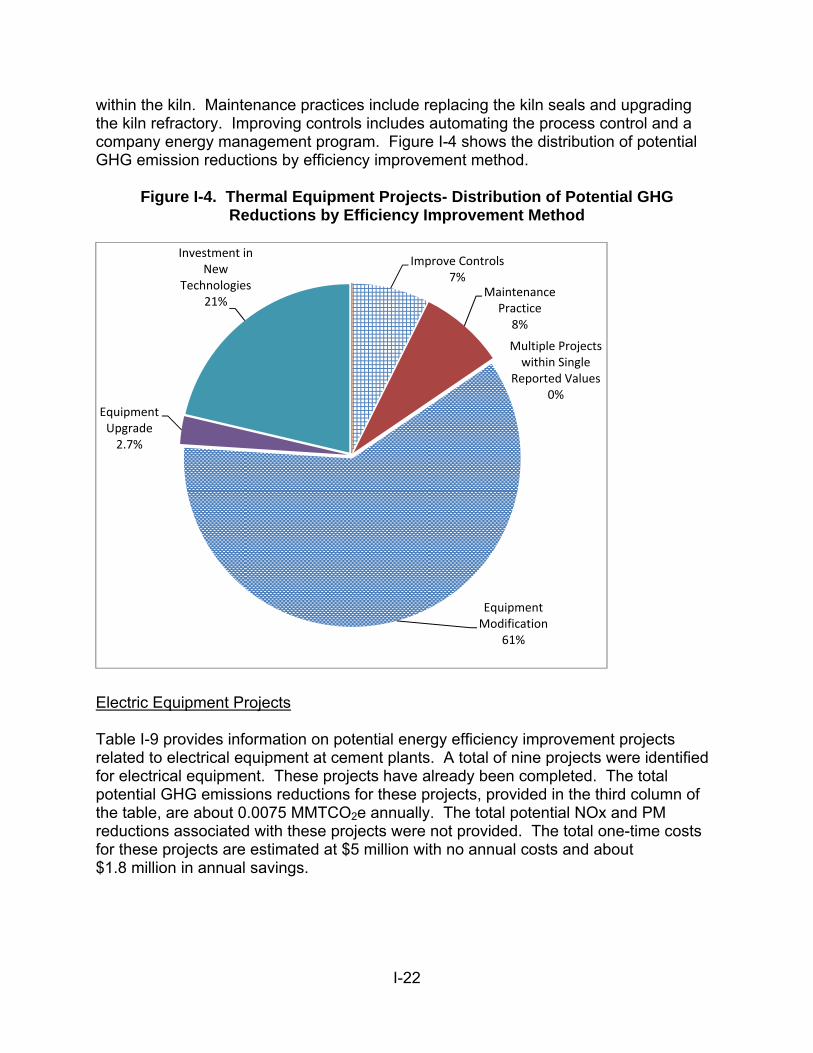
The greatest potential GHG reductions from thermal equipment-related projects would come from equipment modifications and investment in new technologies. Maintenance practices and improving controls also provide some reductions. Equipment modifications include: kiln combustion system upgrades, preheater insulation, mid-kiln firing, and air mixing in the kiln. Investment in new technologies include: the addition of a multistage preheater, waste heat recovery, riser duct firing, and oxygen enrichment
I-22
within the kiln. Maintenance practices include replacing the kiln seals and upgrading the kiln refractory. Improving controls includes automating the process control and a company energy management program. Figure I-4 shows the distribution of potential GHG emission reductions by efficiency improvement method.
Figure I-4. Thermal Equipment Projects- Distribution of Potential GHG Reductions by Efficiency Improvement Method
Electric Equipment Projects Table I-9 provides information on potential energy efficiency improvement projects related to electrical equipment at cement plants. A total of nine projects were identified for electrical equipment. These projects have already been completed. The total potential GHG emissions reductions for these projects, provided in the third column of the table, are about 0.0075 MMTCO2e annually. The total potential NOx and PM reductions associated with these projects were not provided. The total one-time costs for these projects are estimated at $5 million with no annual costs and about $1.8 million in annual savings.
Improve Controls7%
Maintenance Practice8%
Equipment Modification
61%
Equipment Upgrade2.7%
Investment in New
Technologies21%
Multiple Projects within Single
Reported Values0%
I-23
Table I-9: Electrical Equipment Projects - Estimated Emission Reductions and Costs
Efficiency Improvement Method
Project Description
GHG Emission Reductions
(Metric Tons/Year)
One Time Costs ($)
Annual Costs ($)
Annual Savings
($)
NOx Emission
Reductions (pounds/day)
Equipment Upgrade
Investment in the same, but more
efficient technology
and compressor system
optimization. Lighting
replacement
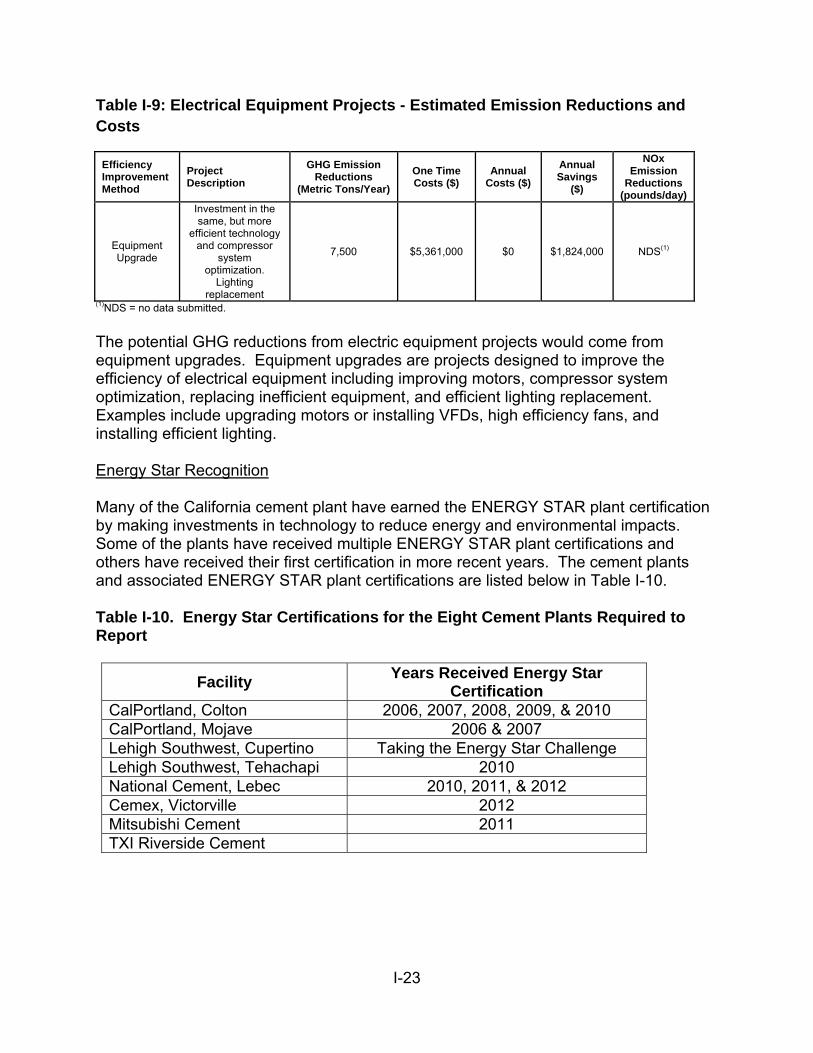
7,500 $5,361,000 $0 $1,824,000 NDS(1)
(1)NDS = no data submitted. The potential GHG reductions from electric equipment projects would come from equipment upgrades. Equipment upgrades are projects designed to improve the efficiency of electrical equipment including improving motors, compressor system optimization, replacing inefficient equipment, and efficient lighting replacement. Examples include upgrading motors or installing VFDs, high efficiency fans, and installing efficient lighting. Energy Star Recognition Many of the California cement plant have earned the ENERGY STAR plant certification by making investments in technology to reduce energy and environmental impacts. Some of the plants have received multiple ENERGY STAR plant certifications and others have received their first certification in more recent years. The cement plants and associated ENERGY STAR plant certifications are listed below in Table I-10. Table I-10. Energy Star Certifications for the Eight Cement Plants Required to Report
Facility Years Received Energy Star
Certification CalPortland, Colton 2006, 2007, 2008, 2009, & 2010 CalPortland, Mojave 2006 & 2007 Lehigh Southwest, Cupertino Taking the Energy Star Challenge Lehigh Southwest, Tehachapi 2010 National Cement, Lebec 2010, 2011, & 2012 Cemex, Victorville 2012 Mitsubishi Cement 2011 TXI Riverside Cement
I-24
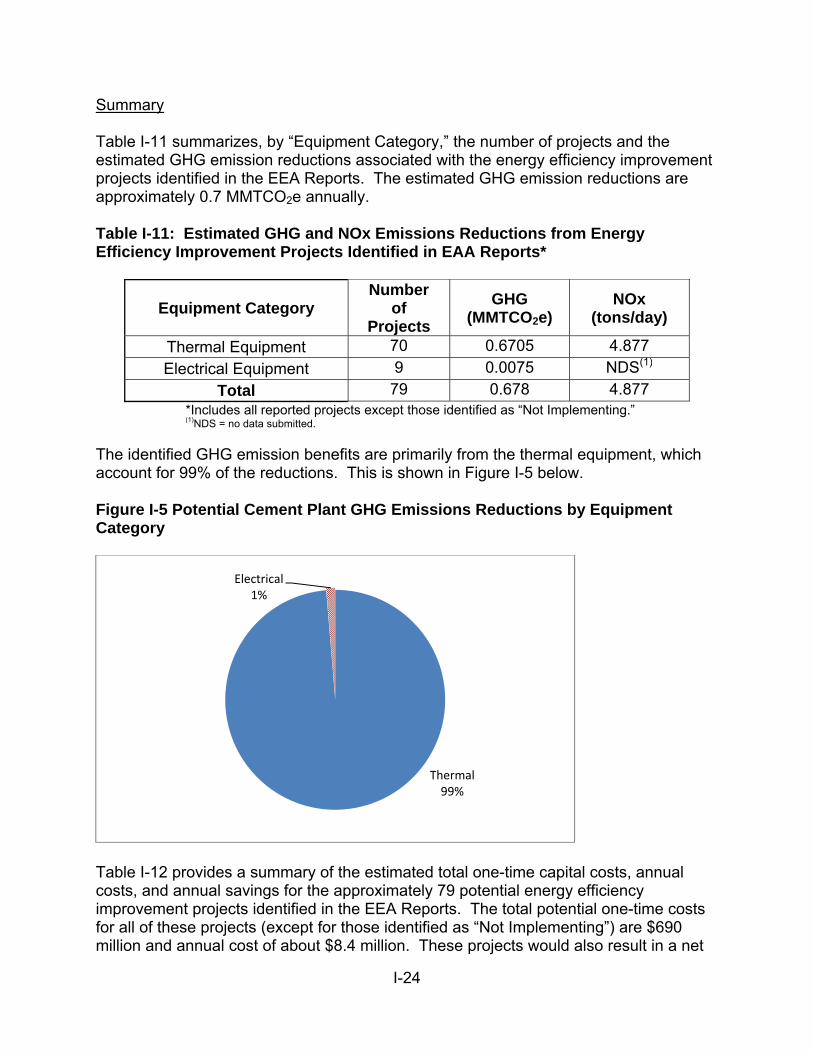
Summary Table I-11 summarizes, by “Equipment Category,” the number of projects and the estimated GHG emission reductions associated with the energy efficiency improvement projects identified in the EEA Reports. The estimated GHG emission reductions are approximately 0.7 MMTCO2e annually. Table I-11: Estimated GHG and NOx Emissions Reductions from Energy Efficiency Improvement Projects Identified in EAA Reports*
Equipment Category Number
of Projects
GHG (MMTCO2e)
NOx (tons/day)
Thermal Equipment 70 0.6705 4.877
Electrical Equipment 9 0.0075 NDS(1)
Total 79 0.678 4.877 *Includes all reported projects except those identified as “Not Implementing.” (1)NDS = no data submitted.
The identified GHG emission benefits are primarily from the thermal equipment, which account for 99% of the reductions. This is shown in Figure I-5 below. Figure I-5 Potential Cement Plant GHG Emissions Reductions by Equipment Category
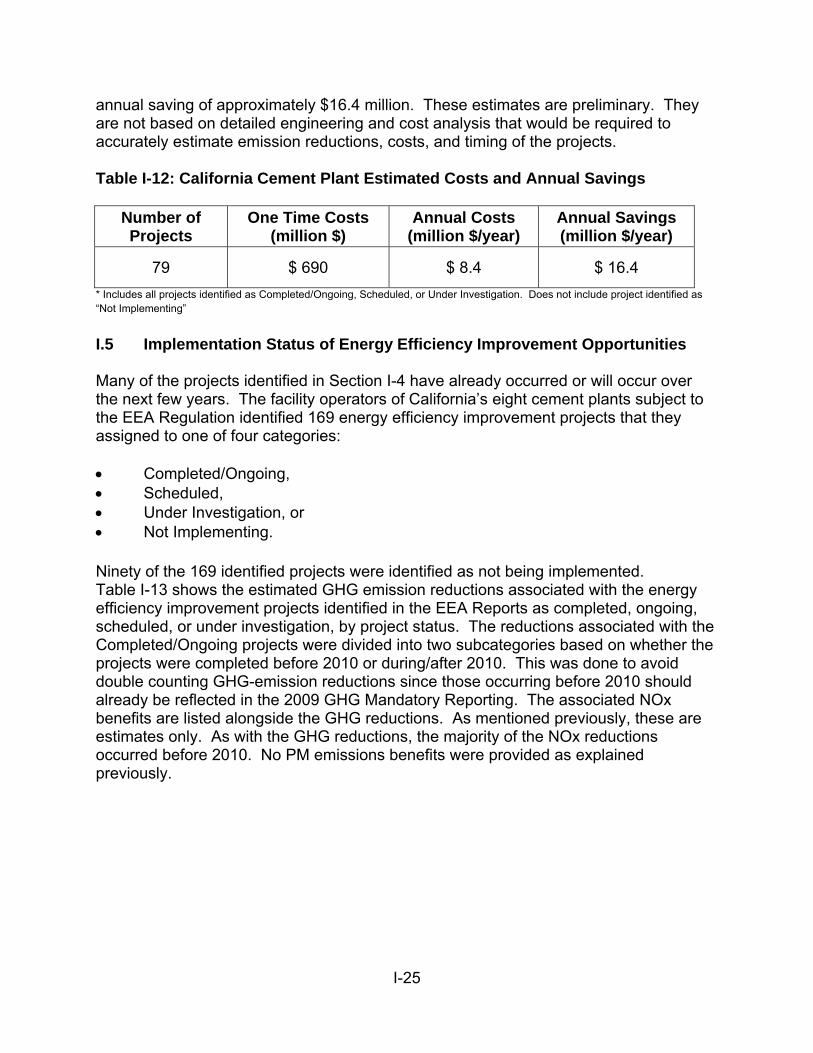
Table I-12 provides a summary of the estimated total one-time capital costs, annual costs, and annual savings for the approximately 79 potential energy efficiency improvement projects identified in the EEA Reports. The total potential one-time costs for all of these projects (except for those identified as “Not Implementing”) are $690 million and annual cost of about $8.4 million. These projects would also result in a net
Thermal99%
Electrical1%
I-25
annual saving of approximately $16.4 million. These estimates are preliminary. They are not based on detailed engineering and cost analysis that would be required to accurately estimate emission reductions, costs, and timing of the projects. Table I-12: California Cement Plant Estimated Costs and Annual Savings
Number of Projects
One Time Costs (million $)
Annual Costs (million $/year)
Annual Savings (million $/year)
79 $ 690 $ 8.4 $ 16.4
* Includes all projects identified as Completed/Ongoing, Scheduled, or Under Investigation. Does not include project identified as “Not Implementing”
I.5 Implementation Status of Energy Efficiency Improvement Opportunities Many of the projects identified in Section I-4 have already occurred or will occur over the next few years. The facility operators of California’s eight cement plants subject to the EEA Regulation identified 169 energy efficiency improvement projects that they assigned to one of four categories: Completed/Ongoing, Scheduled, Under Investigation, or Not Implementing. Ninety of the 169 identified projects were identified as not being implemented. Table I-13 shows the estimated GHG emission reductions associated with the energy efficiency improvement projects identified in the EEA Reports as completed, ongoing, scheduled, or under investigation, by project status. The reductions associated with the Completed/Ongoing projects were divided into two subcategories based on whether the projects were completed before 2010 or during/after 2010. This was done to avoid double counting GHG-emission reductions since those occurring before 2010 should already be reflected in the 2009 GHG Mandatory Reporting. The associated NOx benefits are listed alongside the GHG reductions. As mentioned previously, these are estimates only. As with the GHG reductions, the majority of the NOx reductions occurred before 2010. No PM emissions benefits were provided as explained previously.

I-26
Table I-13: Estimated GHG and NOx Emissions Reductions by Project Status Project Status GHG Reductions
(MMTCO2e per year) (% of total)
NOx Benefits (tons per day)
(% of total) Completed/Ongoing Pre-2010 0.6290 (92.8%) 4.720 (96.8%) Completed 2010+ 0.0035 (0.5 %) 0.005 (0.11 %) Subtotal C/O 0.6325 (93.3%) 4.725 (96.9%) Scheduled 0.0036 (0.5%) 0.007 (0.15 %) Under Investigation 0.0420 (6.2%) 0.145 (3.0%) Subtotal Pre-2010 0.6290 (92.8%) 4.720 (96.8%) Subtotal 2010+ 0.0491 (7.2%) 0.157 (3.2%) Total 0.678 4.88 Two things of note in Table I-13 are that approximately 93.3 percent of the estimated GHG reductions come from Completed/Ongoing projects and that 92.8 percent of all estimated GHG reductions occurred before 2010. This is shown pictorially in Figure I-6. Figure I-6. Estimated GHG Reduction by Project Status
It should be noted, that the estimated reductions assume that all of the energy efficiency improvement projects identified in the EEA Reports will be implemented, except for those identified as “Not Implementing.” This assumption is accurate for projects that were reported as Completed/Ongoing, which make up about 93 percent of the estimated GHG reductions. However, implementation of some projects reported as Scheduled or Under Investigation may preclude the implementation of other projects
C/O Pre‐2010
C/O 2010+
Scheduled
Under Investigation

I-27
that deal with the same equipment or processes. Therefore, these estimated reductions do not necessarily represent readily achievable on-site emission reductions. As stated in the Introduction and Summary, ARB staff will be developing a subsequent report that will include all sectors. We intend to release this subsequent report once we have completed our review and analysis of the information provided in the EEA Reports, the reports from the third party reviewer, and other applicable information. We anticipate releasing this subsequent report in the latter part of 2013.
I-28
References (ARB 2012a) Determining Rule Applicability for California’s 2010 Mandatory Greenhouse Gas Reporting Regulation. Posted March 5, 2012, 4 pp. URL: http://www.arb.ca.gov/cc/reporting/ghg-rep/guidance/ghg_applicability.pdf (ARB 2012b) Subarticle 2. Requirements for the Mandatory Reporting of Greenhouse Gas Emissions from Specific Types of Facilities, Suppliers, and Entities. §95110. Cement Production. Posted February 6, 2012. URL: http://www.arb.ca.gov/cc/reporting/ghg-rep/regulation/mrr_2010_clean.pdf (Lee 2011) Lee, John. 2011. Energy Assessment Training, Cement Sector Kiln Briefing. 4 pp. (New Zealand Institute of Chemistry, 1998) The Manufacture of Portland Cement. In: Chemical Processes in New Zealand, Second Edition. 8 pp. URL: http://nzic.org.nz/ChemProcesses/inorganic/9B.pdf (DOE 2003) U.S. Department of Energy: Energy Efficiency and Renewable Energy, Energy and Emission Reduction Opportunities for the Cement Industry, William T. Choate, December 29, 2003. (USEPA 1995)U.S. Environmental Protection Agency (U.S. EPA). 1995. Compilation of Air Pollutant Emission Factors. Volume I: Stationary Point and Area Sources. (AP-42); Fifth Edition, Chapter 11: Mineral Products Industry. URL: http://www.epa.gov/ttn/chief/ap42/ch11/index.html (USEPA 2010) Available and Emerging Technologies for Reducing Greenhouse Gas Emissions from the Portland Cement Industry. Office of Air Quality Planning and Standards, Research Triangle Park, North Carolina. 45 pp. (Van Oss 2007) Van Oss HG. 2007. Cement. In: 2005 Mineral Year Book, Tables 3, 9, 14, and 18. U.S. Geological Survey. 39 pp. URL: http://minerals.usgs.gov/minerals/pubs/commodity/cement/cemenmyb05.pdf
(Worrell and Galitsky 2004) Worrell E and C Galitsky. 2004. Energy Efficiency Improvement Opportunities for Cement Making. An Energy Star ® Guide for Energy and Plant Managers. Ernest Orlando Lawrence Berkeley National Laboratory, Report No. LBNL-54036 for U.S. EPA Contract No. DE AC03-76SF00098, 62 pp.
II-1
Part II – Facility Specific Information for Cement Plants II.0 Introduction Part II of this report provides cement manufacturing specific information about each of the eight cement plants submitting EEA Reports. Each cement plant has a separate section that provides information on the current (2009) emissions for GHG, criteria pollutants, and TACs from the specific facility and a summary of the potential energy efficiency improvement projects that cement plant staff identified in their EEA Report. The projects are grouped by timing (whether they are Completed/Ongoing, Scheduled, or Under Investigation). The projects are then listed by equipment type, and the equipment sub-types. All information provided, including inventory data as well as identified project costs and benefits, is as reported by the facilities in their EEA Reports. Inventory data may not agree with other published data due to the inclusion of more recent data provided by the facility. Equipment Sub-type provides a general description of the types of equipment affected by the improvement project but do not provide a detailed explanation of each project identified. Information about potential emission reductions of GHG and NOx, costs, and savings, summed for all the projects (by Equipment Category and Equipment Sub-type), is provided. No estimates of PM co-benefits were provided for the different projects. Total PM emissions from a cement facility are composed primarily of dust from cement processing with a minimal proportion from the combustion process. In compliance with the confidentiality requirement under CCR §95610, the specific details about the individual projects identified at the facility were not presented. While it is not possible to release the specific details for each project a cement plant has identified, it is possible to get a good indication of what equipment, what action(s), and timeframe were considered by referring back to the sector-wide project information in Part I and specifically Tables I-8 and I-9. In addition, information regarding the U.S. EPA Energy Star label for the cement plants is provided. The Energy Star label involves establishing that a particular cement plant has an energy performance at or above the level of the top 25 percent of all the cement plants in the U.S., based on a third party audit of energy performance data. Several of the California cement plants have received Energy Star labels. There are other forms of recognition through the Energy Star process. Cement companies can receive an Energy Star "Partner of the Year" award and/or an Energy Star "Sustained Excellence" award in energy management that may cover several cement plants that a particular cement company owns. Identification of Potential Projects Following the adoption of the EEA Regulation in July 2010, the six cement companies in California formed an alliance titled the “Coalition for Sustainable Cement Manufacturing and Environment” or CSCME. CSCME enlisted technical assistance from an engineering consulting firm to develop a technical support document (TSD) to provide
II-2
CSCME members with general, industry-wide guidance on meeting the requirements of the EEA Regulation, and to document the compliance process for ARB (CSCME, 2011). The projects that CSMCE decided were reportable under the EEA Regulation were identified in the TSD. The TSD states that facility-specific characteristics are not accounted for, and advises CSCME members to interpret and apply the guidance in the TSD “in the context of their unique plant characteristics and circumstances.” The following paragraphs describe the project evaluation process recommended by CSMCE in their TSD. The TSD advised CSCME members to follow a 4-step process when developing their reports to ARB. Step 1 involved making a determination as to whether a potential measure affects thermal energy efficiency and if the measure has been demonstrated to have a beneficial impact. The TSD advised that if a potential measure did not satisfy both conditions, then they deemed it to be outside the scope of the regulation, and they recommended that it be excluded from the facility’s report. In Step 2 of the TSD process, potential measures deemed by CSCME to be within the scope of the regulation were subjected to an evaluation of technical feasibility, which involved determining if the potential measure had already been applied, was applicable, had demonstrated energy efficiency benefits, and could be implemented. If a potential measure did not satisfy all four conditions, CSCME recommended that it be deemed technically infeasible, and they advised that it should be excluded from the facility’s report. However, based on additional discussions with ARB staff some projects that they believed to be experimental were also included. In the TSD’s Step 3, potential measures deemed by CSCME to be technically feasible were to be subjected to a cost effectiveness evaluation, which involved calculating capital costs, fuel costs, and other operations and maintenance costs on an annual GHG emissions reduction basis. In Part 5 of the TSD, it was recommended that a cost effectiveness threshold of $10 per metric ton of CO2 avoided be used by CSCME members to determine the status of the improvement with respect to possible implementation. Facility representatives have indicated that most projects that were rejected as not cost effective had significantly higher costs than this threshold. Additionally, many completed projects had costs much higher than this threshold. In Step 4, it was recommended in the TSD that an implementation schedule be included for potential measures deemed to be within the scope of the regulation, technically feasible, and cost-effective. As a result of the organization of CSCME and their TSD, the EEA reporting was primarily confined to specific potential projects defined in the TSD with some additional projects included based on discussion with ARB staff. Consequently, a more organized response was provided by this sector as compared to other sectors. The general information about the eight cement manufacturing facilities subject to the EEA Regulation, their 2009 GHG emissions, criteria and TAC emissions, and the energy improvement options identified by each facility are provided below.

II-3
Reference
(CSCME, 2011) Coalition for Sustainable Cement Manufacturing and Environment (CSCME). 2011. Cement Technical Support Document: AB32 Energy Efficiency Assessment Compliance.
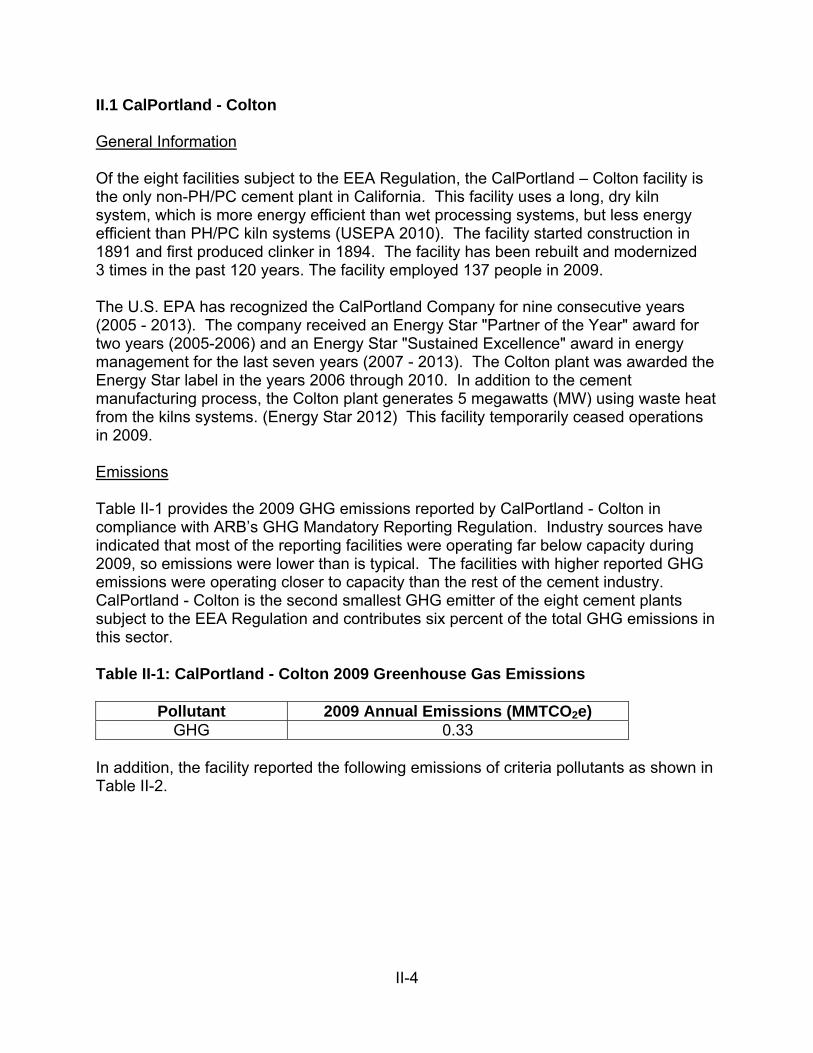
II-4
II.1 CalPortland - Colton General Information Of the eight facilities subject to the EEA Regulation, the CalPortland – Colton facility is the only non-PH/PC cement plant in California. This facility uses a long, dry kiln system, which is more energy efficient than wet processing systems, but less energy efficient than PH/PC kiln systems (USEPA 2010). The facility started construction in 1891 and first produced clinker in 1894. The facility has been rebuilt and modernized 3 times in the past 120 years. The facility employed 137 people in 2009. The U.S. EPA has recognized the CalPortland Company for nine consecutive years (2005 - 2013). The company received an Energy Star "Partner of the Year" award for two years (2005-2006) and an Energy Star "Sustained Excellence" award in energy management for the last seven years (2007 - 2013). The Colton plant was awarded the Energy Star label in the years 2006 through 2010. In addition to the cement manufacturing process, the Colton plant generates 5 megawatts (MW) using waste heat from the kilns systems. (Energy Star 2012) This facility temporarily ceased operations in 2009. Emissions Table II-1 provides the 2009 GHG emissions reported by CalPortland - Colton in compliance with ARB’s GHG Mandatory Reporting Regulation. Industry sources have indicated that most of the reporting facilities were operating far below capacity during 2009, so emissions were lower than is typical. The facilities with higher reported GHG emissions were operating closer to capacity than the rest of the cement industry. CalPortland - Colton is the second smallest GHG emitter of the eight cement plants subject to the EEA Regulation and contributes six percent of the total GHG emissions in this sector. Table II-1: CalPortland - Colton 2009 Greenhouse Gas Emissions
Pollutant 2009 Annual Emissions (MMTCO2e) GHG 0.33
In addition, the facility reported the following emissions of criteria pollutants as shown in Table II-2.
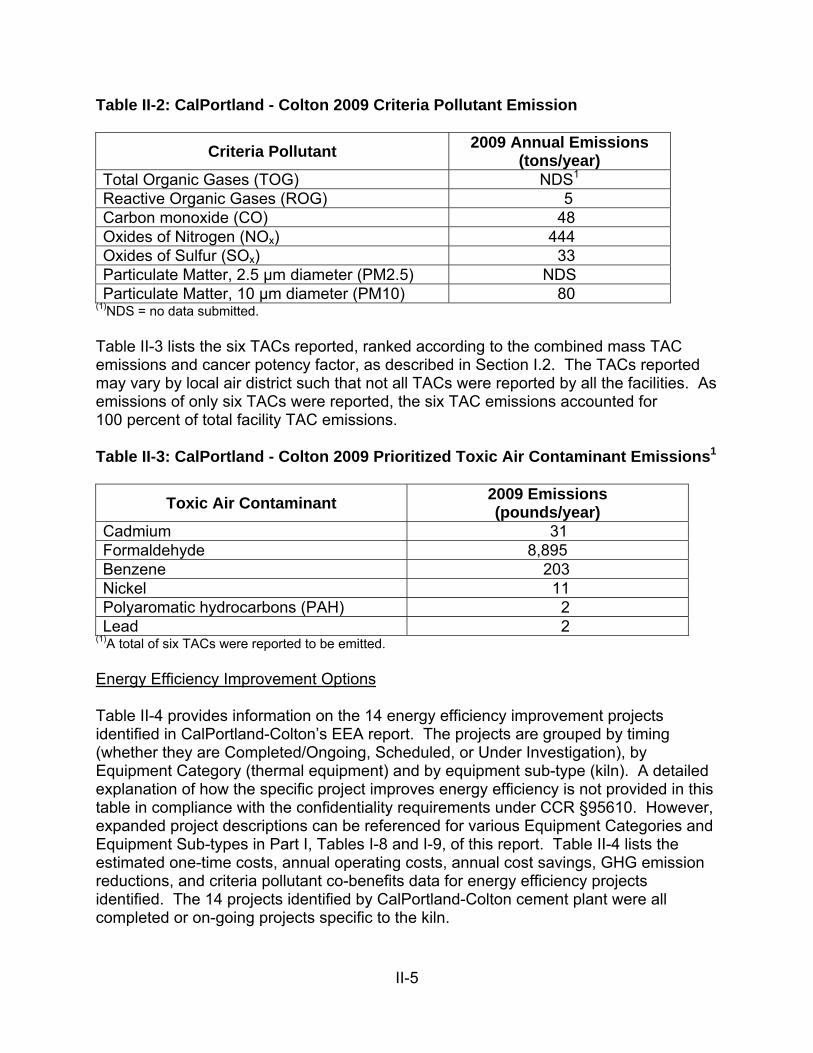
II-5
Table II-2: CalPortland - Colton 2009 Criteria Pollutant Emission
Criteria Pollutant 2009 Annual Emissions
(tons/year) Total Organic Gases (TOG) NDS1 Reactive Organic Gases (ROG) 5 Carbon monoxide (CO) 48 Oxides of Nitrogen (NOx) 444 Oxides of Sulfur (SOx) 33 Particulate Matter, 2.5 µm diameter (PM2.5) NDS Particulate Matter, 10 µm diameter (PM10) 80
(1)NDS = no data submitted. Table II-3 lists the six TACs reported, ranked according to the combined mass TAC emissions and cancer potency factor, as described in Section I.2. The TACs reported may vary by local air district such that not all TACs were reported by all the facilities. As emissions of only six TACs were reported, the six TAC emissions accounted for 100 percent of total facility TAC emissions. Table II-3: CalPortland - Colton 2009 Prioritized Toxic Air Contaminant Emissions1
Toxic Air Contaminant 2009 Emissions (pounds/year)
Cadmium 31 Formaldehyde 8,895 Benzene 203 Nickel 11 Polyaromatic hydrocarbons (PAH) 2 Lead 2
(1)A total of six TACs were reported to be emitted. Energy Efficiency Improvement Options Table II-4 provides information on the 14 energy efficiency improvement projects identified in CalPortland-Colton’s EEA report. The projects are grouped by timing (whether they are Completed/Ongoing, Scheduled, or Under Investigation), by Equipment Category (thermal equipment) and by equipment sub-type (kiln). A detailed explanation of how the specific project improves energy efficiency is not provided in this table in compliance with the confidentiality requirements under CCR §95610. However, expanded project descriptions can be referenced for various Equipment Categories and Equipment Sub-types in Part I, Tables I-8 and I-9, of this report. Table II-4 lists the estimated one-time costs, annual operating costs, annual cost savings, GHG emission reductions, and criteria pollutant co-benefits data for energy efficiency projects identified. The 14 projects identified by CalPortland-Colton cement plant were all completed or on-going projects specific to the kiln.
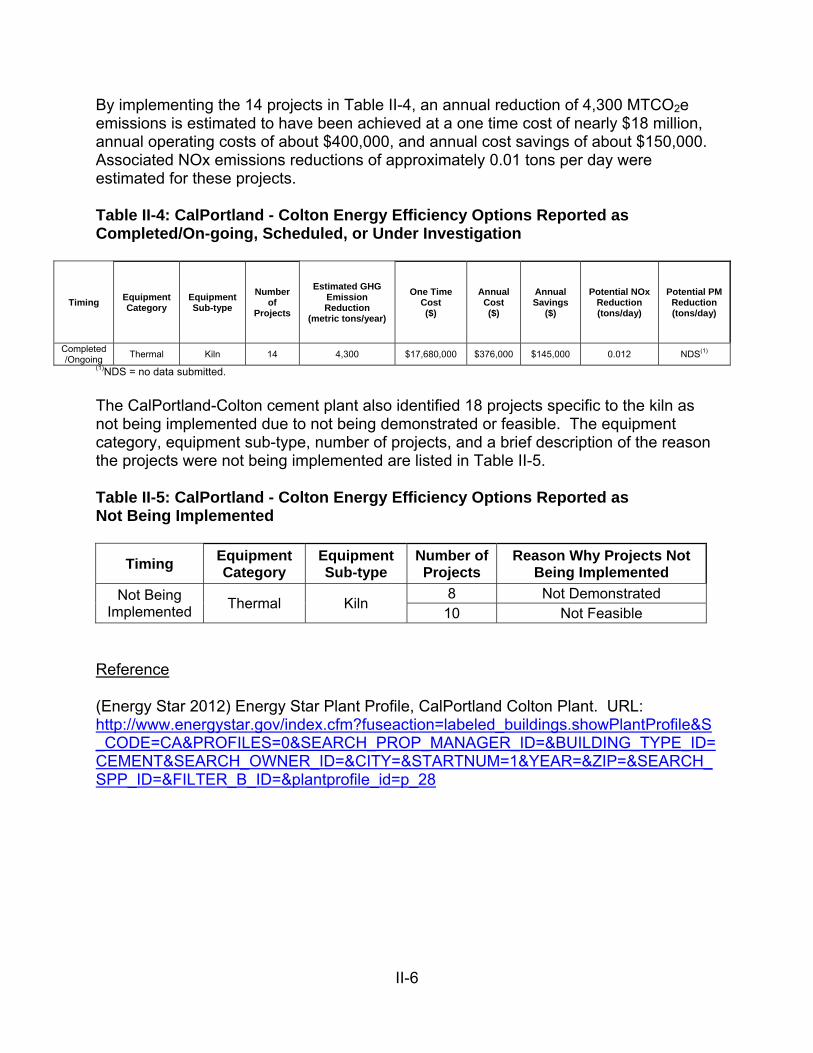
II-6
By implementing the 14 projects in Table II-4, an annual reduction of 4,300 MTCO2e emissions is estimated to have been achieved at a one time cost of nearly $18 million, annual operating costs of about $400,000, and annual cost savings of about $150,000. Associated NOx emissions reductions of approximately 0.01 tons per day were estimated for these projects. Table II-4: CalPortland - Colton Energy Efficiency Options Reported as Completed/On-going, Scheduled, or Under Investigation
Timing Equipment Category
Equipment Sub-type
Number of
Projects
Estimated GHG Emission Reduction
(metric tons/year)
One Time Cost ($)
Annual Cost ($)
Annual Savings
($)
Potential NOx Reduction (tons/day)
Potential PM Reduction (tons/day)
Completed/Ongoing
Thermal Kiln 14 4,300 $17,680,000 $376,000 $145,000 0.012 NDS(1) (1)NDS = no data submitted. The CalPortland-Colton cement plant also identified 18 projects specific to the kiln as not being implemented due to not being demonstrated or feasible. The equipment category, equipment sub-type, number of projects, and a brief description of the reason the projects were not being implemented are listed in Table II-5. Table II-5: CalPortland - Colton Energy Efficiency Options Reported as Not Being Implemented
Timing Equipment Category
Equipment Sub-type
Number of Projects
Reason Why Projects Not Being Implemented
Not Being Implemented
Thermal Kiln 8 Not Demonstrated
10 Not Feasible Reference (Energy Star 2012) Energy Star Plant Profile, CalPortland Colton Plant. URL: http://www.energystar.gov/index.cfm?fuseaction=labeled_buildings.showPlantProfile&S_CODE=CA&PROFILES=0&SEARCH_PROP_MANAGER_ID=&BUILDING_TYPE_ID=CEMENT&SEARCH_OWNER_ID=&CITY=&STARTNUM=1&YEAR=&ZIP=&SEARCH_SPP_ID=&FILTER_B_ID=&plantprofile_id=p_28
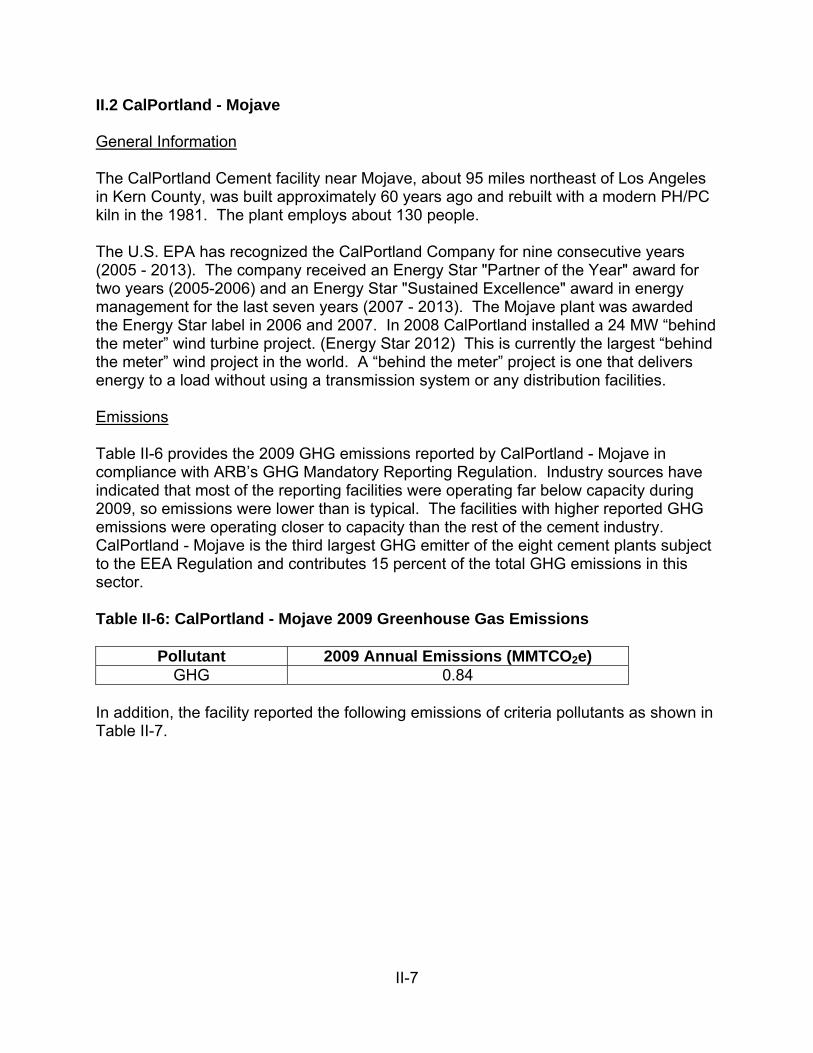
II-7
II.2 CalPortland - Mojave General Information The CalPortland Cement facility near Mojave, about 95 miles northeast of Los Angeles in Kern County, was built approximately 60 years ago and rebuilt with a modern PH/PC kiln in the 1981. The plant employs about 130 people. The U.S. EPA has recognized the CalPortland Company for nine consecutive years (2005 - 2013). The company received an Energy Star "Partner of the Year" award for two years (2005-2006) and an Energy Star "Sustained Excellence" award in energy management for the last seven years (2007 - 2013). The Mojave plant was awarded the Energy Star label in 2006 and 2007. In 2008 CalPortland installed a 24 MW “behind the meter” wind turbine project. (Energy Star 2012) This is currently the largest “behind the meter” wind project in the world. A “behind the meter” project is one that delivers energy to a load without using a transmission system or any distribution facilities. Emissions Table II-6 provides the 2009 GHG emissions reported by CalPortland - Mojave in compliance with ARB’s GHG Mandatory Reporting Regulation. Industry sources have indicated that most of the reporting facilities were operating far below capacity during 2009, so emissions were lower than is typical. The facilities with higher reported GHG emissions were operating closer to capacity than the rest of the cement industry. CalPortland - Mojave is the third largest GHG emitter of the eight cement plants subject to the EEA Regulation and contributes 15 percent of the total GHG emissions in this sector. Table II-6: CalPortland - Mojave 2009 Greenhouse Gas Emissions
Pollutant 2009 Annual Emissions (MMTCO2e) GHG 0.84
In addition, the facility reported the following emissions of criteria pollutants as shown in Table II-7.
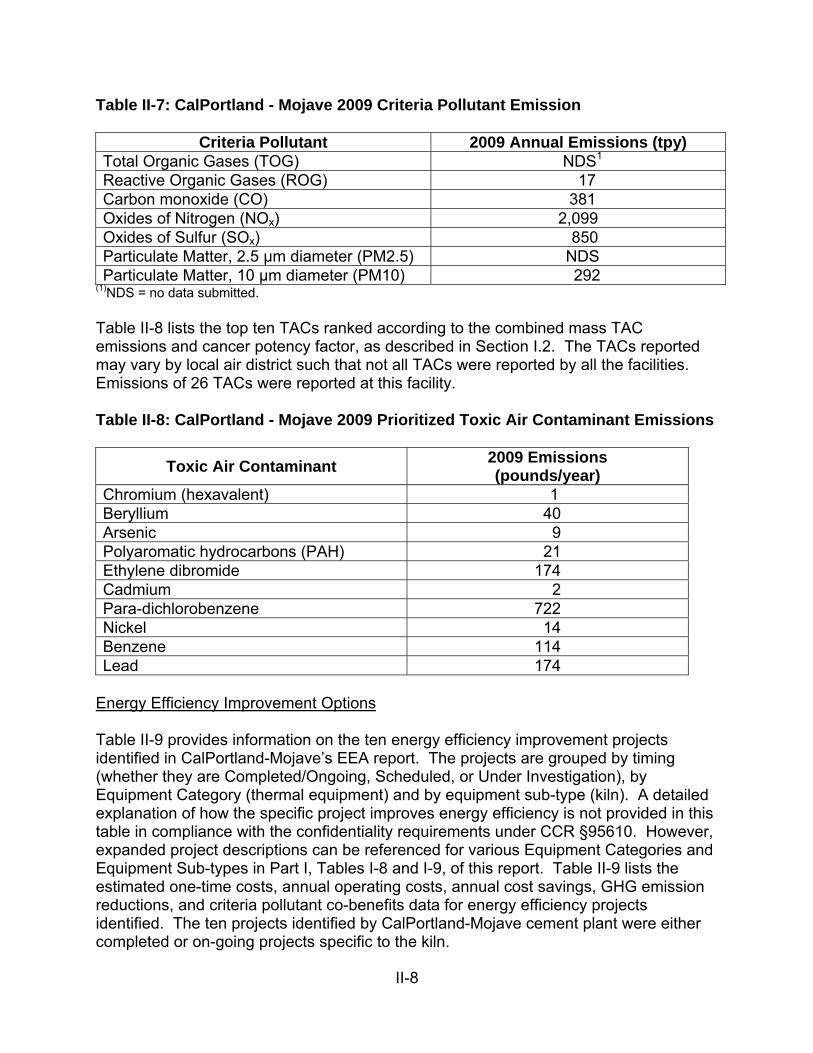
II-8
Table II-7: CalPortland - Mojave 2009 Criteria Pollutant Emission
Criteria Pollutant 2009 Annual Emissions (tpy) Total Organic Gases (TOG) NDS1 Reactive Organic Gases (ROG) 17 Carbon monoxide (CO) 381 Oxides of Nitrogen (NOx) 2,099 Oxides of Sulfur (SOx) 850 Particulate Matter, 2.5 µm diameter (PM2.5) NDS Particulate Matter, 10 µm diameter (PM10) 292
(1)NDS = no data submitted. Table II-8 lists the top ten TACs ranked according to the combined mass TAC emissions and cancer potency factor, as described in Section I.2. The TACs reported may vary by local air district such that not all TACs were reported by all the facilities. Emissions of 26 TACs were reported at this facility. Table II-8: CalPortland - Mojave 2009 Prioritized Toxic Air Contaminant Emissions
Toxic Air Contaminant 2009 Emissions (pounds/year)
Chromium (hexavalent) 1 Beryllium 40 Arsenic 9 Polyaromatic hydrocarbons (PAH) 21 Ethylene dibromide 174 Cadmium 2 Para-dichlorobenzene 722 Nickel 14 Benzene 114 Lead 174
Energy Efficiency Improvement Options Table II-9 provides information on the ten energy efficiency improvement projects identified in CalPortland-Mojave’s EEA report. The projects are grouped by timing (whether they are Completed/Ongoing, Scheduled, or Under Investigation), by Equipment Category (thermal equipment) and by equipment sub-type (kiln). A detailed explanation of how the specific project improves energy efficiency is not provided in this table in compliance with the confidentiality requirements under CCR §95610. However, expanded project descriptions can be referenced for various Equipment Categories and Equipment Sub-types in Part I, Tables I-8 and I-9, of this report. Table II-9 lists the estimated one-time costs, annual operating costs, annual cost savings, GHG emission reductions, and criteria pollutant co-benefits data for energy efficiency projects identified. The ten projects identified by CalPortland-Mojave cement plant were either completed or on-going projects specific to the kiln.
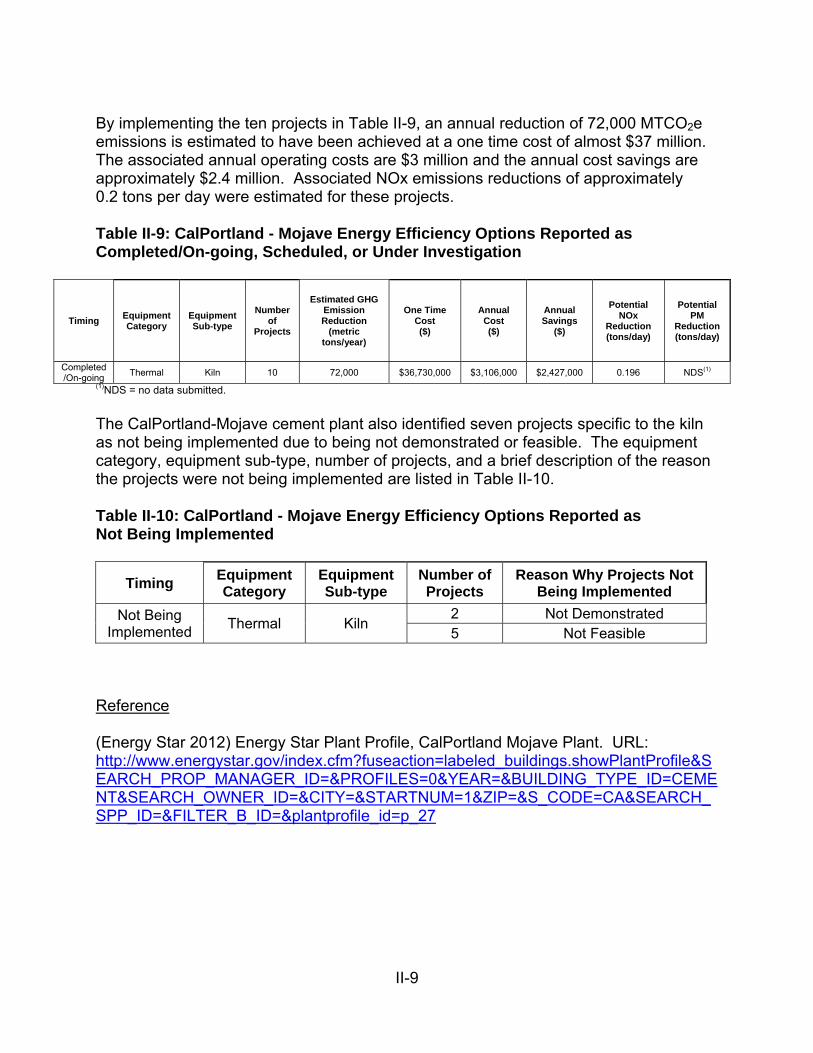
II-9
By implementing the ten projects in Table II-9, an annual reduction of 72,000 MTCO2e emissions is estimated to have been achieved at a one time cost of almost $37 million. The associated annual operating costs are $3 million and the annual cost savings are approximately $2.4 million. Associated NOx emissions reductions of approximately 0.2 tons per day were estimated for these projects. Table II-9: CalPortland - Mojave Energy Efficiency Options Reported as Completed/On-going, Scheduled, or Under Investigation
Timing Equipment Category
Equipment Sub-type
Number of
Projects
Estimated GHG Emission Reduction
(metric tons/year)
One Time Cost ($)
Annual Cost ($)
Annual Savings
($)
Potential NOx
Reduction (tons/day)
Potential PM
Reduction (tons/day)
Completed/On-going
Thermal Kiln 10 72,000 $36,730,000 $3,106,000 $2,427,000 0.196 NDS(1) (1)NDS = no data submitted. The CalPortland-Mojave cement plant also identified seven projects specific to the kiln as not being implemented due to being not demonstrated or feasible. The equipment category, equipment sub-type, number of projects, and a brief description of the reason the projects were not being implemented are listed in Table II-10. Table II-10: CalPortland - Mojave Energy Efficiency Options Reported as Not Being Implemented
Timing Equipment Category
Equipment Sub-type
Number of Projects
Reason Why Projects Not Being Implemented
Not Being Implemented
Thermal Kiln 2 Not Demonstrated 5 Not Feasible
Reference (Energy Star 2012) Energy Star Plant Profile, CalPortland Mojave Plant. URL: http://www.energystar.gov/index.cfm?fuseaction=labeled_buildings.showPlantProfile&SEARCH_PROP_MANAGER_ID=&PROFILES=0&YEAR=&BUILDING_TYPE_ID=CEMENT&SEARCH_OWNER_ID=&CITY=&STARTNUM=1&ZIP=&S_CODE=CA&SEARCH_SPP_ID=&FILTER_B_ID=&plantprofile_id=p_27
II-10
II.3 Lehigh Southwest - Cupertino General Information Lehigh Southwest - Cupertino facility, in the San Francisco Bay Area, was originally built in 1939 to help provide cement for construction of the Shasta Dam. At that time, it was owned by Henry Kaiser and called the Permanente Cement Company as it is located along Permanente Creek near San Jose. In 1981, a modernization program virtually rebuilt the original Permanente plant. It now supplies over 50 percent of the cement used in the Bay Area. The new plant was completed by March 1981 and the six old kilns were shut down in September 1981. At that time, it was cited as the largest single preheater kiln in the United States with an annual capacity of 1.6 million tons. This project allowed fuel consumption per ton of cement manufactured to be cut 35 percent, with significant associated emissions reductions. (Lehigh Permanente 2012) Emissions Table II-11 provides the 2009 GHG emissions reported by Lehigh Southwest - Cupertino in compliance with ARB’s GHG Mandatory Reporting Regulation. Industry sources have indicated that most of the reporting facilities were operating far below capacity during 2009, so emissions were lower than is typical. The facilities with higher reported GHG emissions were operating closer to capacity than the rest of the cement industry. Lehigh Southwest - Cupertino contributes nine percent of the total GHG emissions in this sector. Table II-11: Lehigh Southwest - Cupertino 2009 Greenhouse Gas Emissions
Pollutant 2009 Annual Emissions (MMTCO2e) GHG 0.54
In addition, the facility reported the following emissions of criteria pollutants as shown in Table II-12.
II-11
Table II-12: Lehigh Southwest - Cupertino 2009 Criteria Pollutant Emission
Criteria Pollutant 2009 Annual Emissions (tpy) Total Organic Gases (TOG) 31 Reactive Organic Gases (ROG) NDS1 Carbon monoxide (CO) 995 Oxides of Nitrogen (NOx) 1,236 Oxides of Sulfur (SOx) 240 Particulate Matter, 2.5 µm diameter (PM2.5) NDS Particulate Matter, 10 µm diameter (PM10) 38
(1)NDS = no data submitted. Table II-13 lists the top ten TACs ranked according to the combined mass TAC emissions and cancer potency factor, as described in Section I.2. The TACs reported may vary by local air district such that not all TACs were reported by all the facilities. Emissions of 14 TACs were reported at this facility. Table II-13: Lehigh Southwest - Cupertino 2009 Prioritized Toxic Air Contaminant Emissions
Toxic Air Contaminant 2009 Emissions (pounds/year)
Benzene 6,245 Naphthalene 1,138 Diesel particulate matter 45 Formaldehyde 1,112 Acetaldehyde 2,331 1,3-Butadiene 32 Nickel 3 Polychlorinated biphenyls (PCB) 1 Hydrochloric acid 1,486 Mercury 461
Energy Efficiency Improvement Options Table II-14 provides information on the four energy efficiency improvement projects identified in Lehigh Southwest-Cupertino’s EEA report. The projects are grouped by timing (whether they are Completed/Ongoing, Scheduled, or Under Investigation), by Equipment Category (thermal equipment) and by equipment sub-type (kiln). A detailed explanation of how the specific project improves energy efficiency is not provided in this table in compliance with the confidentiality requirements under CCR §95610. However, expanded project descriptions can be referenced for various Equipment Categories and Equipment Sub-types in Part I, Tables I-8 and I-9, of this report. Table II-14 lists the estimated one-time costs, annual operating costs, annual cost savings, GHG emission reductions, and criteria pollutant co-benefits data for energy efficiency projects
II-12
identified. The four projects identified by Lehigh Southwest-Cupertino cement plant were all on-going projects specific to the kiln. . By implementing the four projects in Table II-14, an annual reduction of nearly 90,000 MT CO2e emissions was achieved. There were no one-time costs associated with these reductions. The associated annual operating costs are $1.7 million with annual cost savings of $2.6 million. NOx emissions reductions of approximately 0.1 tons per day were estimated for these projects with negligible PM emissions reductions. Table II-14: Lehigh Southwest - Cupertino Energy Efficiency Options Reported as Completed/On-going, Scheduled, or Under Investigation
Timing Equipment Equipment Sub-type
Number of
Projects
Estimated GHG
Emission Reduction
(metric tons/year)
One Time Cost ($)
Annual Cost ($)
Annual Savings
($)
Potential NOx
Reduction (tons/day)
Potential PM
Reduction (tons/day)
On-going Thermal Kiln 4 90,000 $0.00 $1,735,000 $2,611,000 0.098 0.0
The Lehigh Southwest-Cupertino cement plant also identified nine projects specific to the kiln as not being implemented due to not being demonstrated or feasible. The equipment category, equipment sub-type, number of projects, and a brief description of the reason the projects were not being implemented are listed in Table II-15. Table II-15: Lehigh Southwest - Cupertino Energy Efficiency Options Reported as Not Being Implemented
Timing Equipment Category
Equipment Sub-type
Number of Projects
Reason Why Projects Not Being Implemented
Not Being Implemented
Thermal Kiln 2 Not Demonstrated 7 Not Feasible
Reference (Lehigh Permanente 2012) Lehigh Permanente company website URL: http://www.lehighpermanente.com/#
II-13
II.4 Lehigh Southwest - Tehachapi General Information Lehigh Southwest-Tehachapi facility was originally the Calaveras Cement Company founded in 1908 to provide cement for construction of the California aqueduct. This plant was acquired by Lehigh Cement in 1986. (CarrTracks 2012) The Tehachapi plant, located in Kern County, 100 miles north of Los Angeles, employs 120 people. This facility supplies cement to central and southern California, southern Nevada, and Arizona. The Tehachapi plant uses a staged combustion process to control NOx emissions. The plant includes a Technip-CLE ‘MINOX’ precalciner, which further reduces NOx. (Lehigh Tehachapi 2012) The Lehigh Southwest-Tehachapi facility was awarded the Energy Star label in 2010. (Energy Star 2012) Emissions Table II-16 provides the 2009 GHG emissions reported by Lehigh Southwest - Tehachapi in compliance with ARB’s GHG Mandatory Reporting Regulation. Industry sources have indicated that most of the reporting facilities were operating far below capacity during 2009, so emissions were lower than is typical. The facilities with higher reported GHG emissions were operating closer to capacity than the rest of the cement industry. Lehigh Southwest - Tehachapi contributes about six percent of the total GHG emissions in this sector. Table II-16: Lehigh Southwest - Tehachapi 2009 Greenhouse Gas Emissions
Pollutant 2009 Annual Emissions (MMTCO2e) GHG 0.32
In addition, the facility reported the following emissions of criteria pollutants as shown in Table II-17. The NOx emissions for this plant, relative to the GHG emissions, are significantly lower (15 to 55 percent lower) than those of any of the other seven cement plants required to report for the EEA Regulation due to the staged combustion process and ‘MINOX’ precalciner employed in their system. Table II-17: Lehigh Southwest - Tehachapi 2009 Criteria Pollutant Emission
Criteria Pollutant 2009 Annual Emissions (tpy) Total Organic Gases (TOG) 1 Reactive Organic Gases (ROG) NDS1 Carbon monoxide (CO) 1,029 Oxides of Nitrogen (NOx) 363 Oxides of Sulfur (SOx) 8 Particulate Matter, 2.5 µm diameter (PM2.5) NDS Particulate Matter, 10 µm diameter (PM10) 166
(1)NDS = no data submitted.
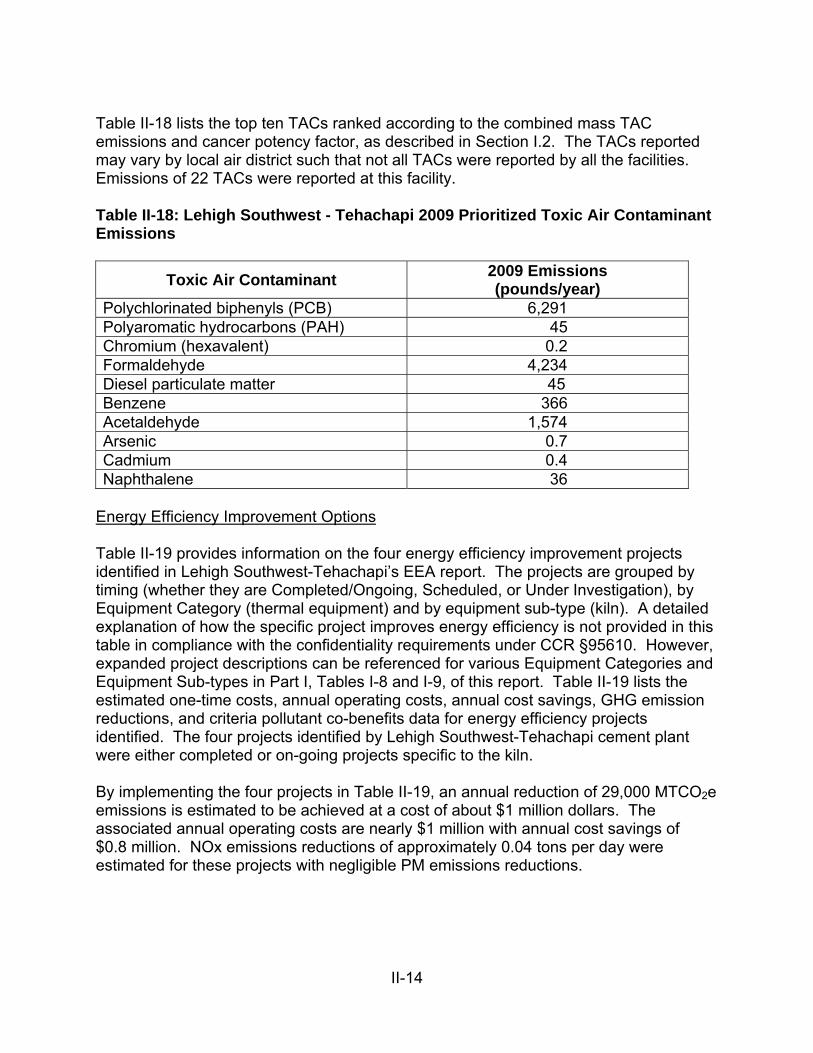
II-14
Table II-18 lists the top ten TACs ranked according to the combined mass TAC emissions and cancer potency factor, as described in Section I.2. The TACs reported may vary by local air district such that not all TACs were reported by all the facilities. Emissions of 22 TACs were reported at this facility. Table II-18: Lehigh Southwest - Tehachapi 2009 Prioritized Toxic Air Contaminant Emissions
Toxic Air Contaminant 2009 Emissions (pounds/year)
Polychlorinated biphenyls (PCB) 6,291 Polyaromatic hydrocarbons (PAH) 45 Chromium (hexavalent) 0.2 Formaldehyde 4,234 Diesel particulate matter 45 Benzene 366 Acetaldehyde 1,574 Arsenic 0.7 Cadmium 0.4 Naphthalene 36
Energy Efficiency Improvement Options Table II-19 provides information on the four energy efficiency improvement projects identified in Lehigh Southwest-Tehachapi’s EEA report. The projects are grouped by timing (whether they are Completed/Ongoing, Scheduled, or Under Investigation), by Equipment Category (thermal equipment) and by equipment sub-type (kiln). A detailed explanation of how the specific project improves energy efficiency is not provided in this table in compliance with the confidentiality requirements under CCR §95610. However, expanded project descriptions can be referenced for various Equipment Categories and Equipment Sub-types in Part I, Tables I-8 and I-9, of this report. Table II-19 lists the estimated one-time costs, annual operating costs, annual cost savings, GHG emission reductions, and criteria pollutant co-benefits data for energy efficiency projects identified. The four projects identified by Lehigh Southwest-Tehachapi cement plant were either completed or on-going projects specific to the kiln. By implementing the four projects in Table II-19, an annual reduction of 29,000 MTCO2e emissions is estimated to be achieved at a cost of about $1 million dollars. The associated annual operating costs are nearly $1 million with annual cost savings of $0.8 million. NOx emissions reductions of approximately 0.04 tons per day were estimated for these projects with negligible PM emissions reductions.
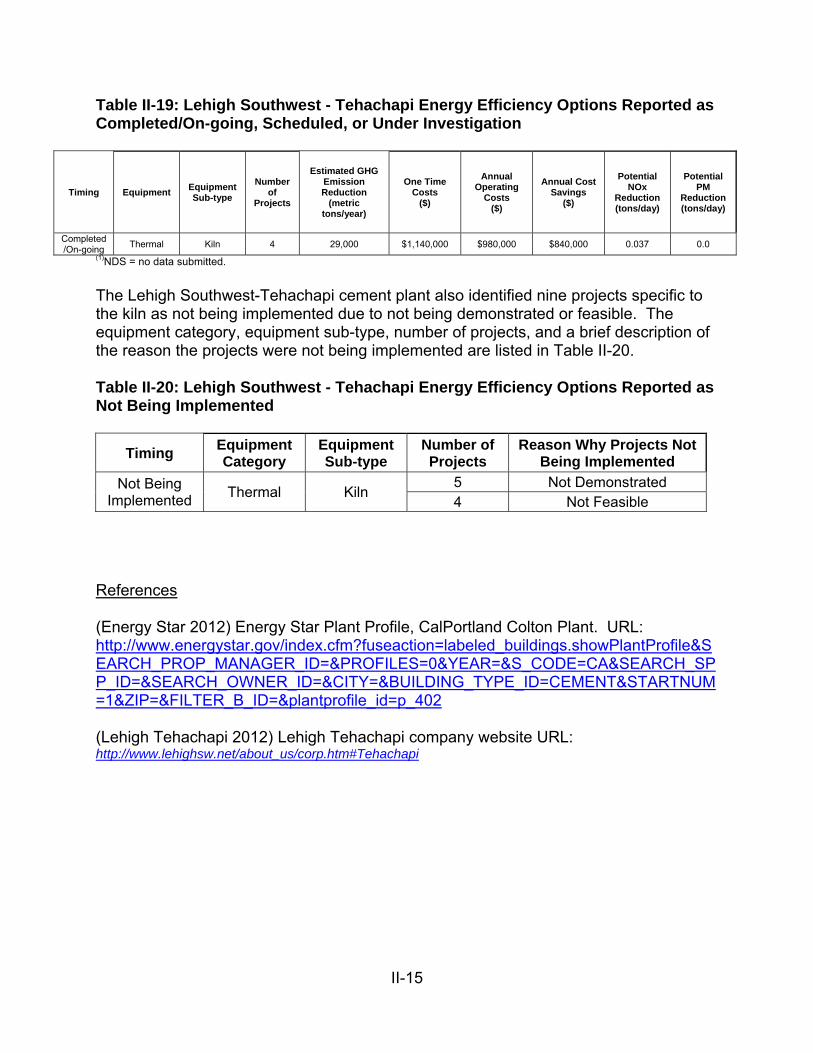
II-15
Table II-19: Lehigh Southwest - Tehachapi Energy Efficiency Options Reported as Completed/On-going, Scheduled, or Under Investigation
Timing Equipment Equipment Sub-type
Number of
Projects
Estimated GHG Emission Reduction
(metric tons/year)
One Time Costs
($)
Annual Operating
Costs ($)
Annual Cost Savings
($)
Potential NOx
Reduction (tons/day)
Potential PM
Reduction (tons/day)
Completed/On-going
Thermal Kiln 4 29,000 $1,140,000 $980,000 $840,000 0.037 0.0 (1)NDS = no data submitted. The Lehigh Southwest-Tehachapi cement plant also identified nine projects specific to the kiln as not being implemented due to not being demonstrated or feasible. The equipment category, equipment sub-type, number of projects, and a brief description of the reason the projects were not being implemented are listed in Table II-20. Table II-20: Lehigh Southwest - Tehachapi Energy Efficiency Options Reported as Not Being Implemented
Timing Equipment Category
Equipment Sub-type
Number of Projects
Reason Why Projects Not Being Implemented
Not Being Implemented
Thermal Kiln 5 Not Demonstrated 4 Not Feasible
References (Energy Star 2012) Energy Star Plant Profile, CalPortland Colton Plant. URL: http://www.energystar.gov/index.cfm?fuseaction=labeled_buildings.showPlantProfile&SEARCH_PROP_MANAGER_ID=&PROFILES=0&YEAR=&S_CODE=CA&SEARCH_SPP_ID=&SEARCH_OWNER_ID=&CITY=&BUILDING_TYPE_ID=CEMENT&STARTNUM=1&ZIP=&FILTER_B_ID=&plantprofile_id=p_402 (Lehigh Tehachapi 2012) Lehigh Tehachapi company website URL: http://www.lehighsw.net/about_us/corp.htm#Tehachapi
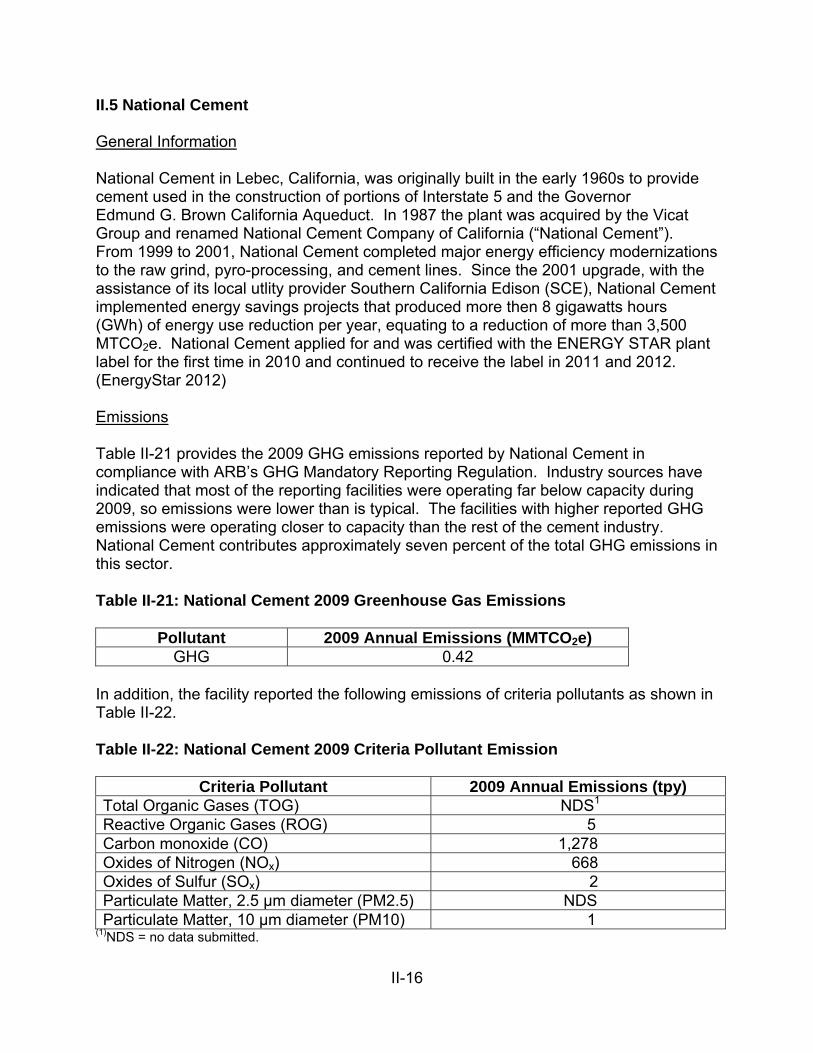
II-16
II.5 National Cement General Information National Cement in Lebec, California, was originally built in the early 1960s to provide cement used in the construction of portions of Interstate 5 and the Governor Edmund G. Brown California Aqueduct. In 1987 the plant was acquired by the Vicat Group and renamed National Cement Company of California (“National Cement”). From 1999 to 2001, National Cement completed major energy efficiency modernizations to the raw grind, pyro-processing, and cement lines. Since the 2001 upgrade, with the assistance of its local utlity provider Southern California Edison (SCE), National Cement implemented energy savings projects that produced more then 8 gigawatts hours (GWh) of energy use reduction per year, equating to a reduction of more than 3,500 MTCO2e. National Cement applied for and was certified with the ENERGY STAR plant label for the first time in 2010 and continued to receive the label in 2011 and 2012. (EnergyStar 2012) Emissions Table II-21 provides the 2009 GHG emissions reported by National Cement in compliance with ARB’s GHG Mandatory Reporting Regulation. Industry sources have indicated that most of the reporting facilities were operating far below capacity during 2009, so emissions were lower than is typical. The facilities with higher reported GHG emissions were operating closer to capacity than the rest of the cement industry. National Cement contributes approximately seven percent of the total GHG emissions in this sector. Table II-21: National Cement 2009 Greenhouse Gas Emissions
Pollutant 2009 Annual Emissions (MMTCO2e) GHG 0.42
In addition, the facility reported the following emissions of criteria pollutants as shown in Table II-22. Table II-22: National Cement 2009 Criteria Pollutant Emission
Criteria Pollutant 2009 Annual Emissions (tpy) Total Organic Gases (TOG) NDS1 Reactive Organic Gases (ROG) 5 Carbon monoxide (CO) 1,278 Oxides of Nitrogen (NOx) 668 Oxides of Sulfur (SOx) 2 Particulate Matter, 2.5 µm diameter (PM2.5) NDS Particulate Matter, 10 µm diameter (PM10) 1
(1)NDS = no data submitted.
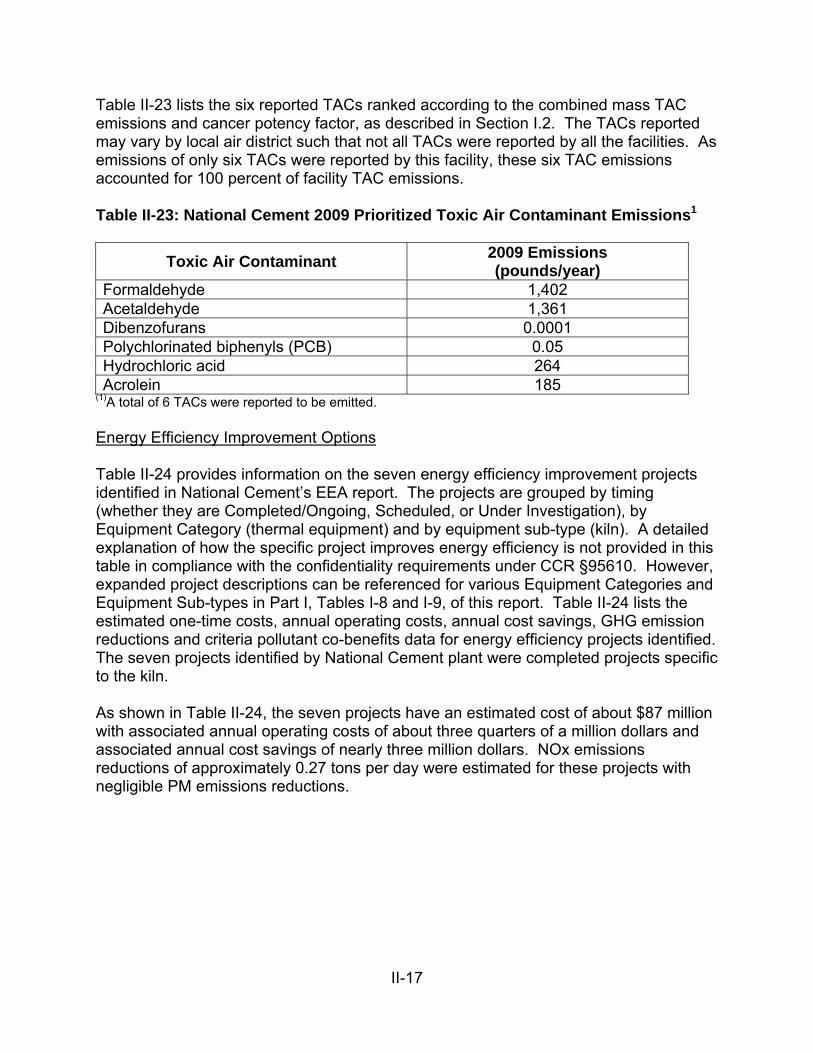
II-17
Table II-23 lists the six reported TACs ranked according to the combined mass TAC emissions and cancer potency factor, as described in Section I.2. The TACs reported may vary by local air district such that not all TACs were reported by all the facilities. As emissions of only six TACs were reported by this facility, these six TAC emissions accounted for 100 percent of facility TAC emissions. Table II-23: National Cement 2009 Prioritized Toxic Air Contaminant Emissions1
Toxic Air Contaminant 2009 Emissions (pounds/year)
Formaldehyde 1,402 Acetaldehyde 1,361 Dibenzofurans 0.0001 Polychlorinated biphenyls (PCB) 0.05 Hydrochloric acid 264 Acrolein 185
(1)A total of 6 TACs were reported to be emitted. Energy Efficiency Improvement Options Table II-24 provides information on the seven energy efficiency improvement projects identified in National Cement’s EEA report. The projects are grouped by timing (whether they are Completed/Ongoing, Scheduled, or Under Investigation), by Equipment Category (thermal equipment) and by equipment sub-type (kiln). A detailed explanation of how the specific project improves energy efficiency is not provided in this table in compliance with the confidentiality requirements under CCR §95610. However, expanded project descriptions can be referenced for various Equipment Categories and Equipment Sub-types in Part I, Tables I-8 and I-9, of this report. Table II-24 lists the estimated one-time costs, annual operating costs, annual cost savings, GHG emission reductions and criteria pollutant co-benefits data for energy efficiency projects identified. The seven projects identified by National Cement plant were completed projects specific to the kiln. As shown in Table II-24, the seven projects have an estimated cost of about $87 million with associated annual operating costs of about three quarters of a million dollars and associated annual cost savings of nearly three million dollars. NOx emissions reductions of approximately 0.27 tons per day were estimated for these projects with negligible PM emissions reductions.
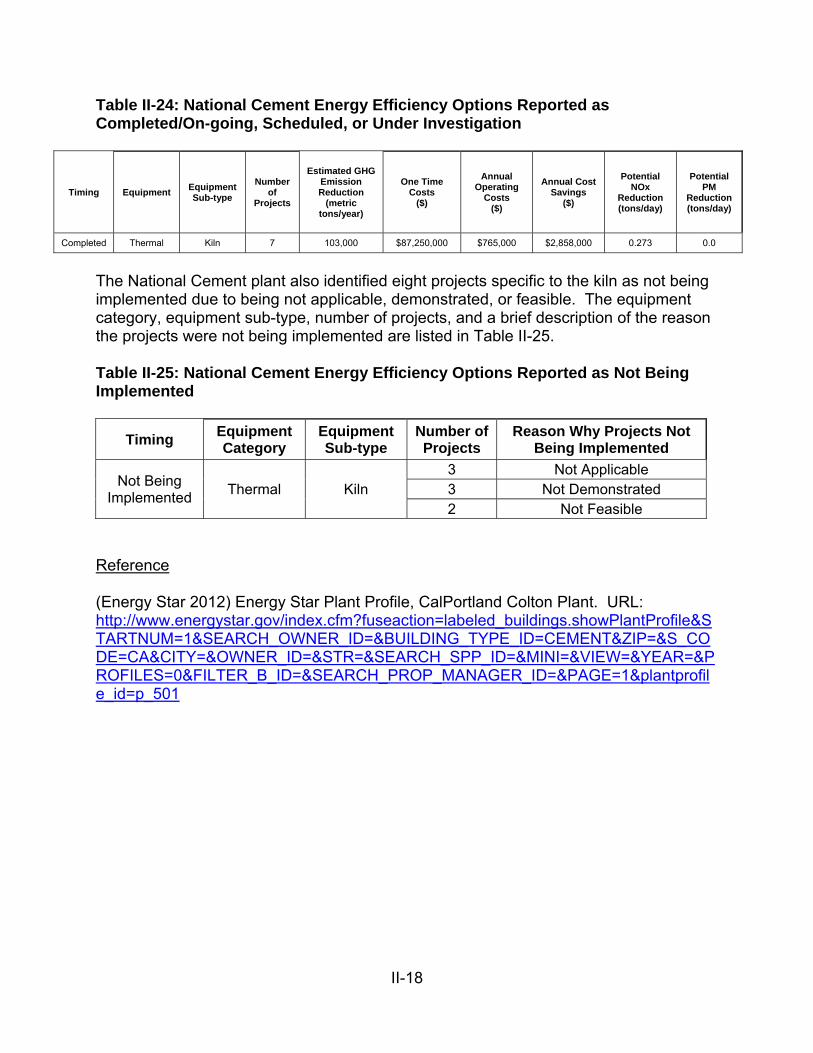
II-18
Table II-24: National Cement Energy Efficiency Options Reported as Completed/On-going, Scheduled, or Under Investigation
Timing Equipment Equipment Sub-type
Number of
Projects
Estimated GHG Emission Reduction
(metric tons/year)
One Time Costs
($)
Annual Operating
Costs ($)
Annual Cost Savings
($)
Potential NOx
Reduction (tons/day)
Potential PM
Reduction (tons/day)
Completed Thermal Kiln 7 103,000 $87,250,000 $765,000 $2,858,000 0.273 0.0
The National Cement plant also identified eight projects specific to the kiln as not being implemented due to being not applicable, demonstrated, or feasible. The equipment category, equipment sub-type, number of projects, and a brief description of the reason the projects were not being implemented are listed in Table II-25. Table II-25: National Cement Energy Efficiency Options Reported as Not Being Implemented
Timing Equipment Category
Equipment Sub-type
Number of Projects
Reason Why Projects Not Being Implemented
Not Being Implemented Thermal Kiln
3 Not Applicable 3 Not Demonstrated 2 Not Feasible
Reference (Energy Star 2012) Energy Star Plant Profile, CalPortland Colton Plant. URL: http://www.energystar.gov/index.cfm?fuseaction=labeled_buildings.showPlantProfile&STARTNUM=1&SEARCH_OWNER_ID=&BUILDING_TYPE_ID=CEMENT&ZIP=&S_CODE=CA&CITY=&OWNER_ID=&STR=&SEARCH_SPP_ID=&MINI=&VIEW=&YEAR=&PROFILES=0&FILTER_B_ID=&SEARCH_PROP_MANAGER_ID=&PAGE=1&plantprofile_id=p_501
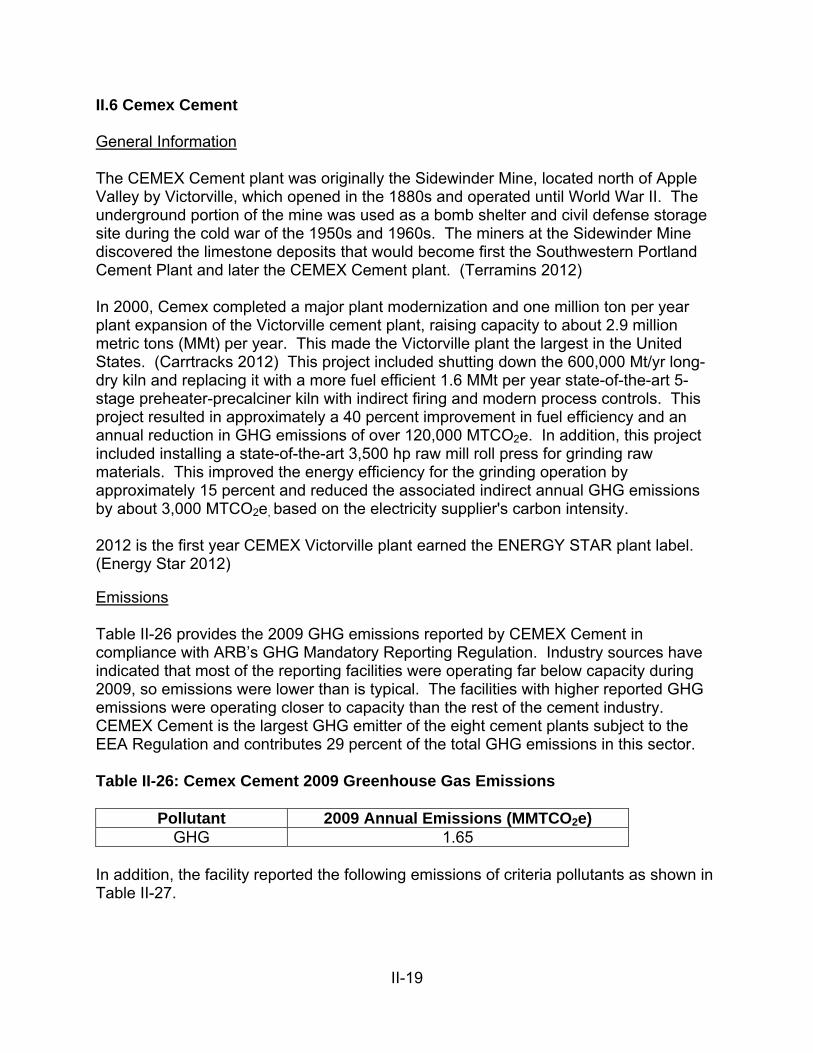
II-19
II.6 Cemex Cement General Information The CEMEX Cement plant was originally the Sidewinder Mine, located north of Apple Valley by Victorville, which opened in the 1880s and operated until World War II. The underground portion of the mine was used as a bomb shelter and civil defense storage site during the cold war of the 1950s and 1960s. The miners at the Sidewinder Mine discovered the limestone deposits that would become first the Southwestern Portland Cement Plant and later the CEMEX Cement plant. (Terramins 2012) In 2000, Cemex completed a major plant modernization and one million ton per year plant expansion of the Victorville cement plant, raising capacity to about 2.9 million metric tons (MMt) per year. This made the Victorville plant the largest in the United States. (Carrtracks 2012) This project included shutting down the 600,000 Mt/yr long-dry kiln and replacing it with a more fuel efficient 1.6 MMt per year state-of-the-art 5-stage preheater-precalciner kiln with indirect firing and modern process controls. This project resulted in approximately a 40 percent improvement in fuel efficiency and an annual reduction in GHG emissions of over 120,000 MTCO2e. In addition, this project included installing a state-of-the-art 3,500 hp raw mill roll press for grinding raw materials. This improved the energy efficiency for the grinding operation by approximately 15 percent and reduced the associated indirect annual GHG emissions by about 3,000 MTCO2e, based on the electricity supplier's carbon intensity. 2012 is the first year CEMEX Victorville plant earned the ENERGY STAR plant label. (Energy Star 2012) Emissions Table II-26 provides the 2009 GHG emissions reported by CEMEX Cement in compliance with ARB’s GHG Mandatory Reporting Regulation. Industry sources have indicated that most of the reporting facilities were operating far below capacity during 2009, so emissions were lower than is typical. The facilities with higher reported GHG emissions were operating closer to capacity than the rest of the cement industry. CEMEX Cement is the largest GHG emitter of the eight cement plants subject to the EEA Regulation and contributes 29 percent of the total GHG emissions in this sector. Table II-26: Cemex Cement 2009 Greenhouse Gas Emissions
Pollutant 2009 Annual Emissions (MMTCO2e) GHG 1.65
In addition, the facility reported the following emissions of criteria pollutants as shown in Table II-27.
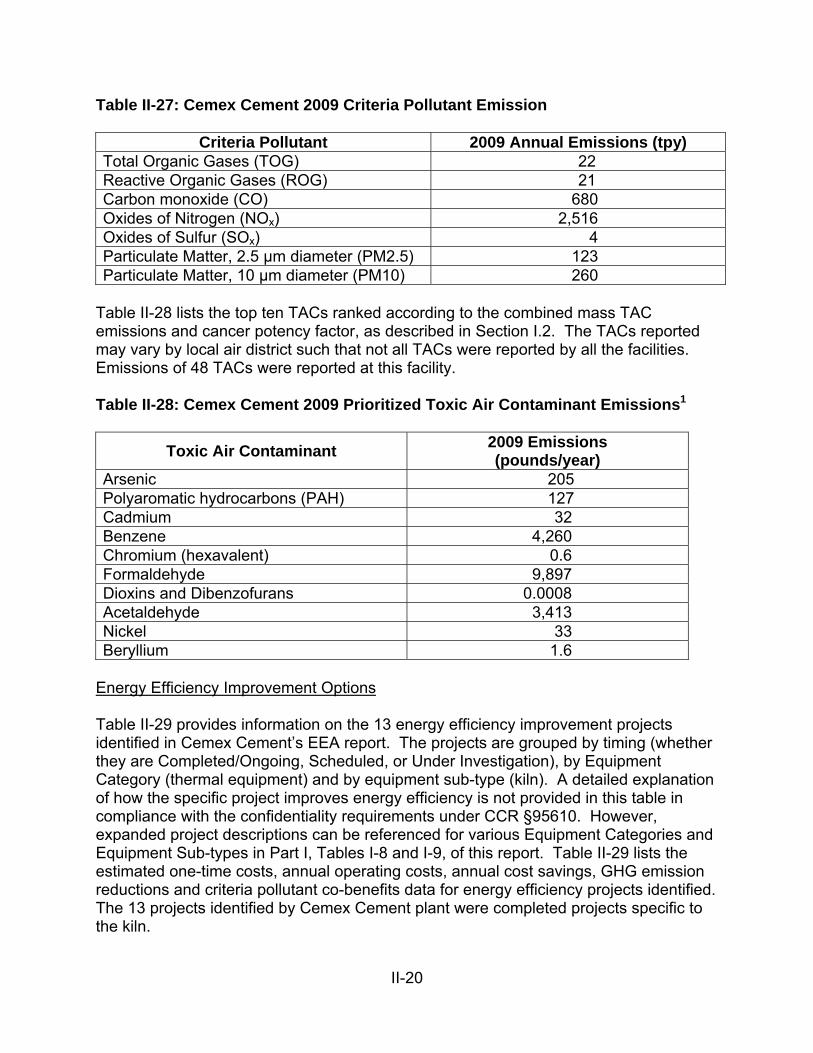
II-20
Table II-27: Cemex Cement 2009 Criteria Pollutant Emission
Criteria Pollutant 2009 Annual Emissions (tpy) Total Organic Gases (TOG) 22 Reactive Organic Gases (ROG) 21 Carbon monoxide (CO) 680 Oxides of Nitrogen (NOx) 2,516 Oxides of Sulfur (SOx) 4 Particulate Matter, 2.5 µm diameter (PM2.5) 123 Particulate Matter, 10 µm diameter (PM10) 260
Table II-28 lists the top ten TACs ranked according to the combined mass TAC emissions and cancer potency factor, as described in Section I.2. The TACs reported may vary by local air district such that not all TACs were reported by all the facilities. Emissions of 48 TACs were reported at this facility. Table II-28: Cemex Cement 2009 Prioritized Toxic Air Contaminant Emissions1
Toxic Air Contaminant 2009 Emissions (pounds/year)
Arsenic 205 Polyaromatic hydrocarbons (PAH) 127 Cadmium 32 Benzene 4,260 Chromium (hexavalent) 0.6 Formaldehyde 9,897 Dioxins and Dibenzofurans 0.0008 Acetaldehyde 3,413 Nickel 33 Beryllium 1.6
Energy Efficiency Improvement Options Table II-29 provides information on the 13 energy efficiency improvement projects identified in Cemex Cement’s EEA report. The projects are grouped by timing (whether they are Completed/Ongoing, Scheduled, or Under Investigation), by Equipment Category (thermal equipment) and by equipment sub-type (kiln). A detailed explanation of how the specific project improves energy efficiency is not provided in this table in compliance with the confidentiality requirements under CCR §95610. However, expanded project descriptions can be referenced for various Equipment Categories and Equipment Sub-types in Part I, Tables I-8 and I-9, of this report. Table II-29 lists the estimated one-time costs, annual operating costs, annual cost savings, GHG emission reductions and criteria pollutant co-benefits data for energy efficiency projects identified. The 13 projects identified by Cemex Cement plant were completed projects specific to the kiln.
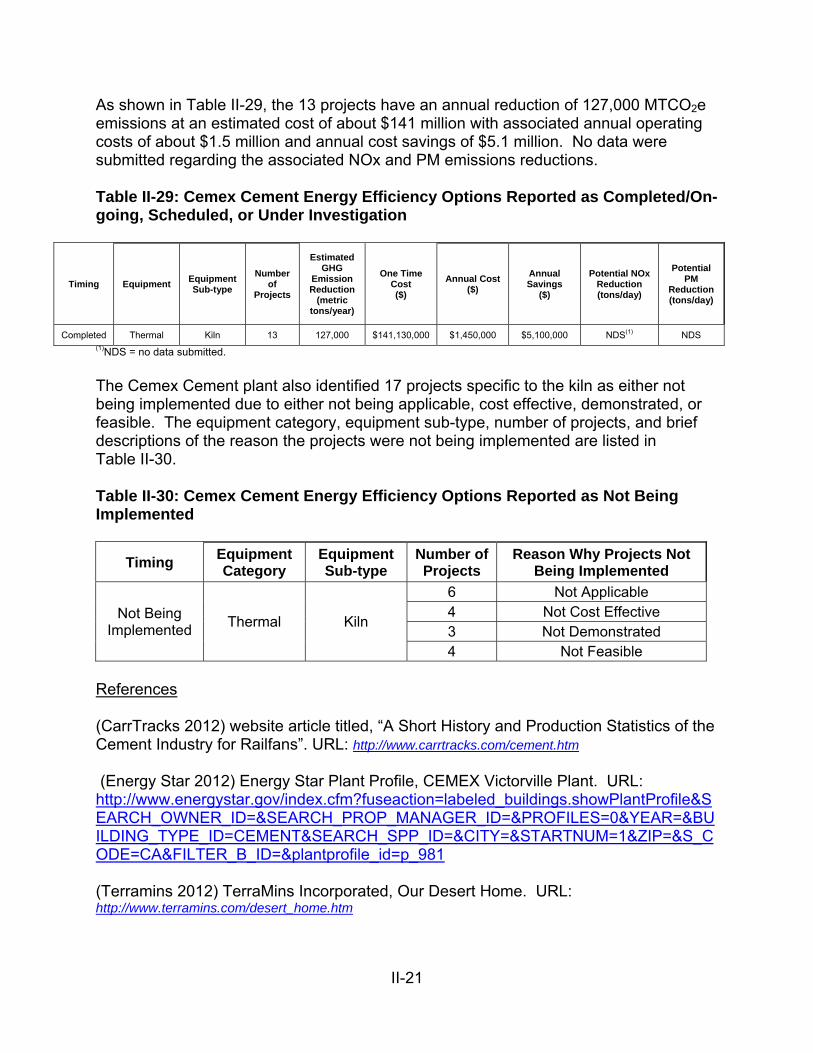
II-21
As shown in Table II-29, the 13 projects have an annual reduction of 127,000 MTCO2e emissions at an estimated cost of about $141 million with associated annual operating costs of about $1.5 million and annual cost savings of $5.1 million. No data were submitted regarding the associated NOx and PM emissions reductions. Table II-29: Cemex Cement Energy Efficiency Options Reported as Completed/On-going, Scheduled, or Under Investigation
Timing Equipment Equipment Sub-type
Number of
Projects
Estimated GHG
Emission Reduction
(metric tons/year)
One Time Cost ($)
Annual Cost ($)
Annual Savings
($)
Potential NOx Reduction (tons/day)
Potential PM
Reduction (tons/day)
Completed Thermal Kiln 13 127,000 $141,130,000 $1,450,000 $5,100,000 NDS(1) NDS (1)NDS = no data submitted. The Cemex Cement plant also identified 17 projects specific to the kiln as either not being implemented due to either not being applicable, cost effective, demonstrated, or feasible. The equipment category, equipment sub-type, number of projects, and brief descriptions of the reason the projects were not being implemented are listed in Table II-30. Table II-30: Cemex Cement Energy Efficiency Options Reported as Not Being Implemented
Timing Equipment Category
Equipment Sub-type
Number of Projects
Reason Why Projects Not Being Implemented
Not Being Implemented
Thermal Kiln
6 Not Applicable 4 Not Cost Effective 3 Not Demonstrated 4 Not Feasible
References (CarrTracks 2012) website article titled, “A Short History and Production Statistics of the Cement Industry for Railfans”. URL: http://www.carrtracks.com/cement.htm (Energy Star 2012) Energy Star Plant Profile, CEMEX Victorville Plant. URL: http://www.energystar.gov/index.cfm?fuseaction=labeled_buildings.showPlantProfile&SEARCH_OWNER_ID=&SEARCH_PROP_MANAGER_ID=&PROFILES=0&YEAR=&BUILDING_TYPE_ID=CEMENT&SEARCH_SPP_ID=&CITY=&STARTNUM=1&ZIP=&S_CODE=CA&FILTER_B_ID=&plantprofile_id=p_981 (Terramins 2012) TerraMins Incorporated, Our Desert Home. URL: http://www.terramins.com/desert_home.htm
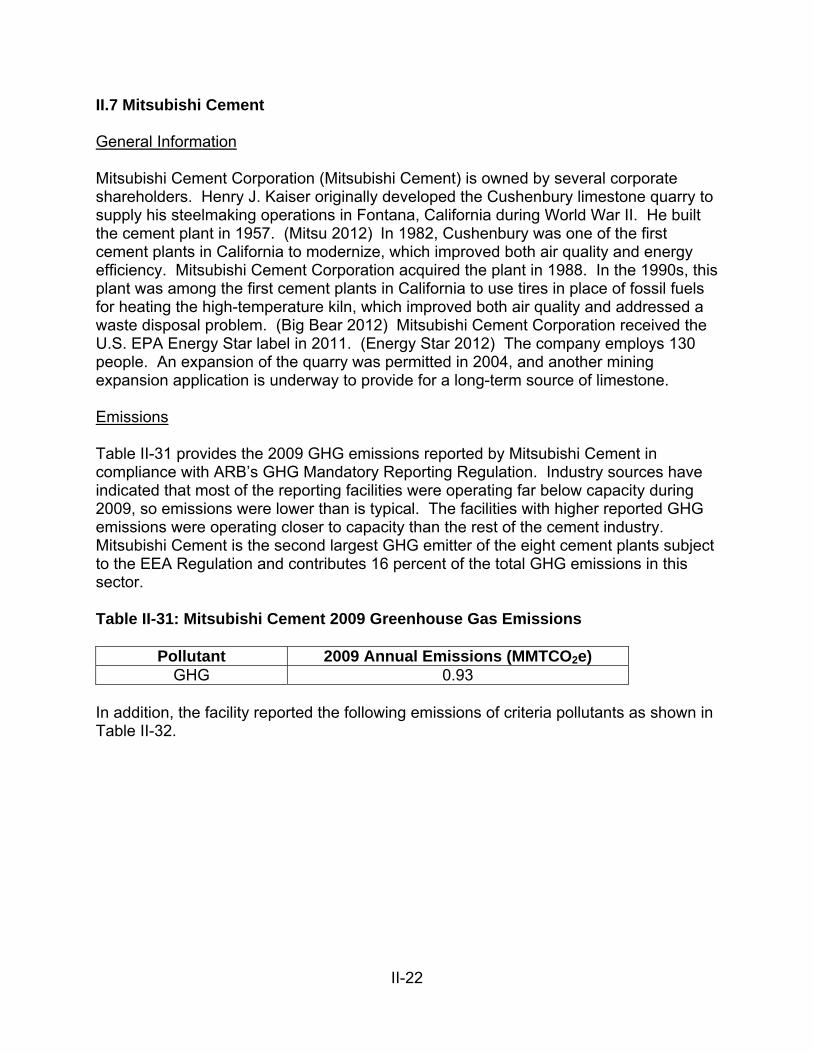
II-22
II.7 Mitsubishi Cement General Information Mitsubishi Cement Corporation (Mitsubishi Cement) is owned by several corporate shareholders. Henry J. Kaiser originally developed the Cushenbury limestone quarry to supply his steelmaking operations in Fontana, California during World War II. He built the cement plant in 1957. (Mitsu 2012) In 1982, Cushenbury was one of the first cement plants in California to modernize, which improved both air quality and energy efficiency. Mitsubishi Cement Corporation acquired the plant in 1988. In the 1990s, this plant was among the first cement plants in California to use tires in place of fossil fuels for heating the high-temperature kiln, which improved both air quality and addressed a waste disposal problem. (Big Bear 2012) Mitsubishi Cement Corporation received the U.S. EPA Energy Star label in 2011. (Energy Star 2012) The company employs 130 people. An expansion of the quarry was permitted in 2004, and another mining expansion application is underway to provide for a long-term source of limestone. Emissions Table II-31 provides the 2009 GHG emissions reported by Mitsubishi Cement in compliance with ARB’s GHG Mandatory Reporting Regulation. Industry sources have indicated that most of the reporting facilities were operating far below capacity during 2009, so emissions were lower than is typical. The facilities with higher reported GHG emissions were operating closer to capacity than the rest of the cement industry. Mitsubishi Cement is the second largest GHG emitter of the eight cement plants subject to the EEA Regulation and contributes 16 percent of the total GHG emissions in this sector. Table II-31: Mitsubishi Cement 2009 Greenhouse Gas Emissions
Pollutant 2009 Annual Emissions (MMTCO2e) GHG 0.93
In addition, the facility reported the following emissions of criteria pollutants as shown in Table II-32.
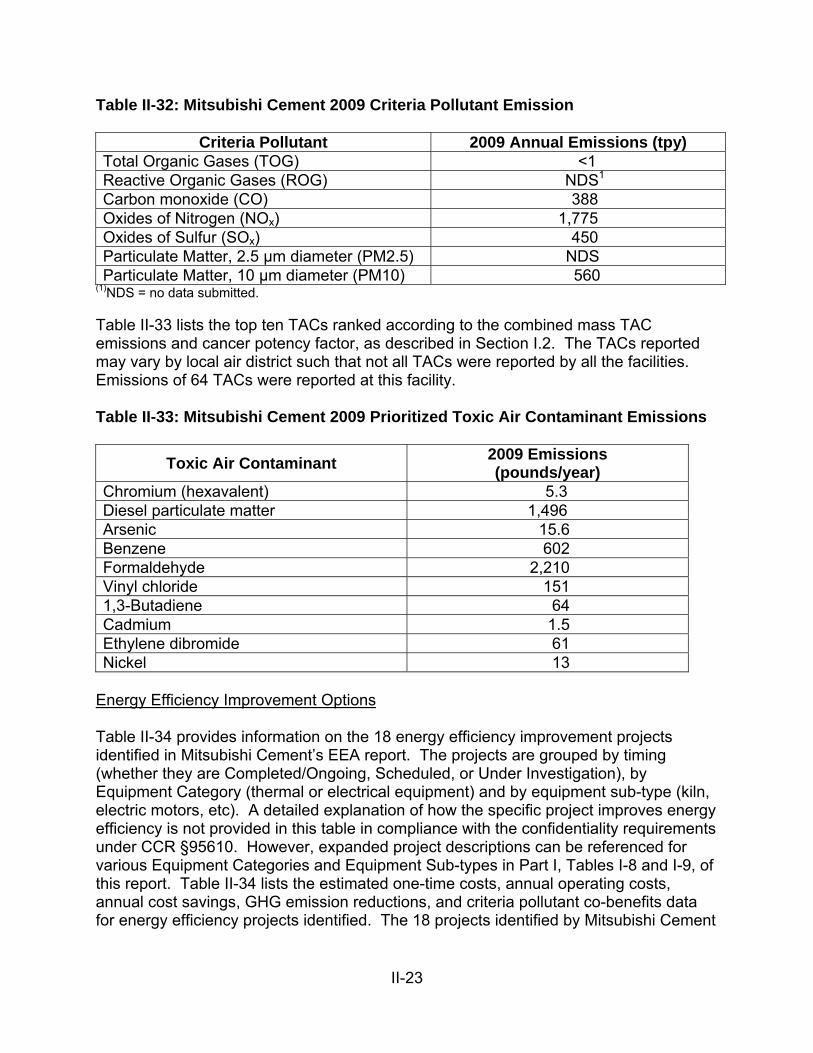
II-23
Table II-32: Mitsubishi Cement 2009 Criteria Pollutant Emission
Criteria Pollutant 2009 Annual Emissions (tpy) Total Organic Gases (TOG) <1 Reactive Organic Gases (ROG) NDS1 Carbon monoxide (CO) 388 Oxides of Nitrogen (NOx) 1,775 Oxides of Sulfur (SOx) 450 Particulate Matter, 2.5 µm diameter (PM2.5) NDS Particulate Matter, 10 µm diameter (PM10) 560
(1)NDS = no data submitted. Table II-33 lists the top ten TACs ranked according to the combined mass TAC emissions and cancer potency factor, as described in Section I.2. The TACs reported may vary by local air district such that not all TACs were reported by all the facilities. Emissions of 64 TACs were reported at this facility. Table II-33: Mitsubishi Cement 2009 Prioritized Toxic Air Contaminant Emissions
Toxic Air Contaminant 2009 Emissions (pounds/year)
Chromium (hexavalent) 5.3 Diesel particulate matter 1,496 Arsenic 15.6 Benzene 602 Formaldehyde 2,210 Vinyl chloride 151 1,3-Butadiene 64 Cadmium 1.5 Ethylene dibromide 61 Nickel 13
Energy Efficiency Improvement Options Table II-34 provides information on the 18 energy efficiency improvement projects identified in Mitsubishi Cement’s EEA report. The projects are grouped by timing (whether they are Completed/Ongoing, Scheduled, or Under Investigation), by Equipment Category (thermal or electrical equipment) and by equipment sub-type (kiln, electric motors, etc). A detailed explanation of how the specific project improves energy efficiency is not provided in this table in compliance with the confidentiality requirements under CCR §95610. However, expanded project descriptions can be referenced for various Equipment Categories and Equipment Sub-types in Part I, Tables I-8 and I-9, of this report. Table II-34 lists the estimated one-time costs, annual operating costs, annual cost savings, GHG emission reductions, and criteria pollutant co-benefits data for energy efficiency projects identified. The 18 projects identified by Mitsubishi Cement
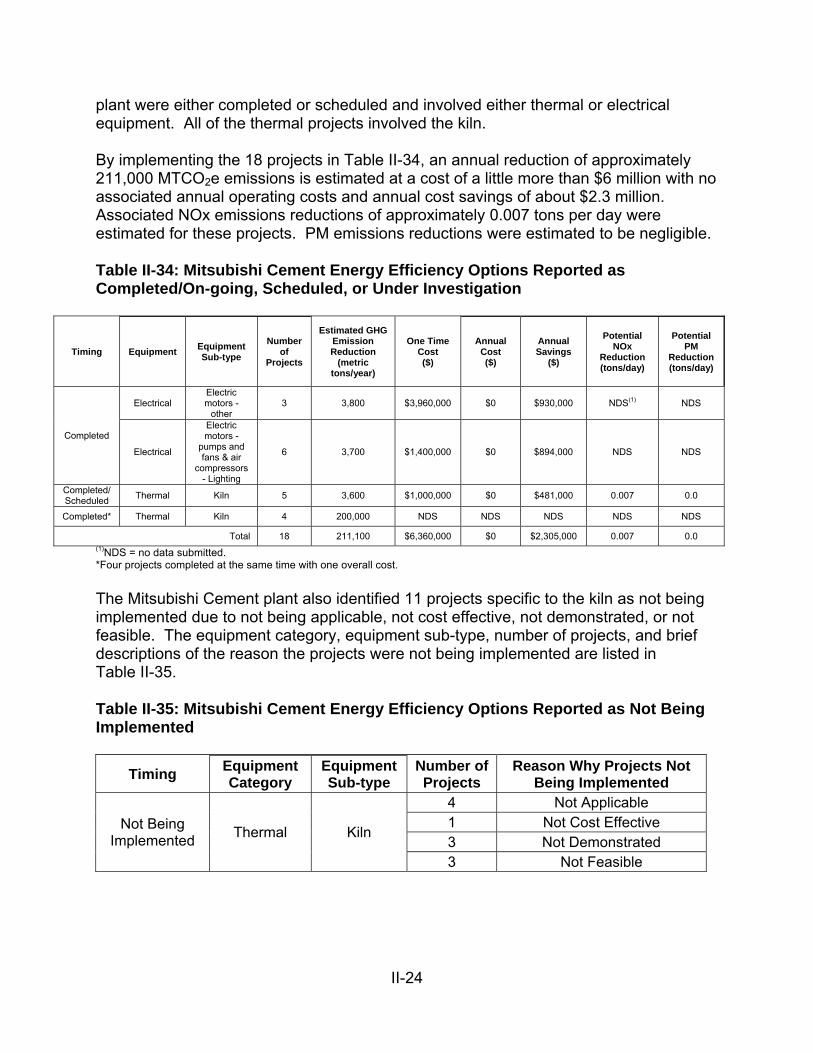
II-24
plant were either completed or scheduled and involved either thermal or electrical equipment. All of the thermal projects involved the kiln. By implementing the 18 projects in Table II-34, an annual reduction of approximately 211,000 MTCO2e emissions is estimated at a cost of a little more than $6 million with no associated annual operating costs and annual cost savings of about $2.3 million. Associated NOx emissions reductions of approximately 0.007 tons per day were estimated for these projects. PM emissions reductions were estimated to be negligible. Table II-34: Mitsubishi Cement Energy Efficiency Options Reported as Completed/On-going, Scheduled, or Under Investigation
Timing Equipment Equipment Sub-type
Number of
Projects
Estimated GHG Emission Reduction
(metric tons/year)
One Time Cost ($)
Annual Cost ($)
Annual Savings
($)
Potential NOx
Reduction (tons/day)
Potential PM
Reduction (tons/day)
Completed
Electrical Electric motors -
other 3 3,800 $3,960,000 $0 $930,000 NDS(1) NDS
Electrical
Electric motors -
pumps and fans & air
compressors - Lighting
6 3,700 $1,400,000 $0 $894,000 NDS NDS
Completed/Scheduled
Thermal Kiln 5 3,600 $1,000,000 $0 $481,000 0.007 0.0
Completed* Thermal Kiln 4 200,000 NDS NDS NDS NDS NDS
Total 18 211,100 $6,360,000 $0 $2,305,000 0.007 0.0 (1)NDS = no data submitted. *Four projects completed at the same time with one overall cost. The Mitsubishi Cement plant also identified 11 projects specific to the kiln as not being implemented due to not being applicable, not cost effective, not demonstrated, or not feasible. The equipment category, equipment sub-type, number of projects, and brief descriptions of the reason the projects were not being implemented are listed in Table II-35. Table II-35: Mitsubishi Cement Energy Efficiency Options Reported as Not Being Implemented
Timing Equipment Category
Equipment Sub-type
Number of Projects
Reason Why Projects Not Being Implemented
Not Being Implemented
Thermal Kiln
4 Not Applicable 1 Not Cost Effective 3 Not Demonstrated 3 Not Feasible
II-25
References (Big Bear 2012) Big Bear Chamber of Commerce Business News, January 2012. URL: www.bigbearchamber.com/External/.../WebContentPage.aspx (Energy Star 2012) Energy Star Plant Profile, CalPortland Colton Plant. URL: http://www.energystar.gov/index.cfm?fuseaction=labeled_buildings.showPlantProfile&STARTNUM=1&SEARCH_OWNER_ID=&ZIP=&S_CODE=CA&CITY=&OWNER_ID=&STR=&SEARCH_SPP_ID=&MINI=&VIEW=&YEAR=&PROFILES=0&FILTER_B_ID=&SEARCH_PROP_MANAGER_ID=&PAGE=1&BUILDING_TYPE_ID=CEMENT&plantprofile_id=p_801 (Mitsu 2012) Mitsubishi Cement 2012, Cushenbury History. URL: http://www.mitsubishicement.com/history/ancient-history
II-26
II.8 TXI Riverside Cement General Information TXI Riverside Cement Company (TXI Riverside) has been operating since 1906. In 2008, TXI Riverside completed a modernization project at the facility. The seven fifty-year old long dry kilns were replaced with a single new kiln and other modernizations were made. These changes resulted in NOx reductions of 1,500 tons per year, or approximately 4 tpd. (ENS 2008) The addition of a PH/PC was included at the time of kiln replacement, as well as a modern clinker cooler, and other improvements considered to be BACT by U.S. EPA for GHG reductions. These projects were not individual but were part of an overall plant modernization project that also included many other improvements. Costs for the overall modernization project ($400,000,000) are available but costs for the individual GHG BACT technologies, which were implemented within the framework of the overall modernization project, were not separated out. These costs are unique to the overall modernization’s site-specific design and are not representative of multiple individual stand-alone projects. Since the modernization was completed prior to 2009, the results are represented in the 2009 GHG emissions reported in the Energy Efficiency Assessment Report for this facility. Emissions Table II-36 provides the 2009 GHG emissions reported by TXI Riverside in compliance with ARB’s GHG Mandatory Reporting Regulation. Industry sources have indicated that most of the reporting facilities were operating far below capacity during 2009, so emissions were lower than is typical. The facilities with higher reported GHG emissions were operating closer to capacity than the rest of the cement industry. The TXI Riverside facility is the fourth largest GHG emitter of the eight cement plants subject to the EEA Regulation and contributes 13 percent of the total GHG emissions in this sector. Table II-36: TXI Riverside 2009 Greenhouse Gas Emissions
Pollutant 2009 Annual Emissions (MMTCO2e) GHG 0.71
In addition, the facility reported the following emissions of criteria pollutants, with the annual emission inventory numbers for the entire facility finalized in coordination with the Mojave Desert Air Quality Management District (MDAQMD) shown in Table II-37. These site wide emissions include fugitive as well as multiple point source emissions. The kiln, one point source, produces a significant portion of the GHG emissions.
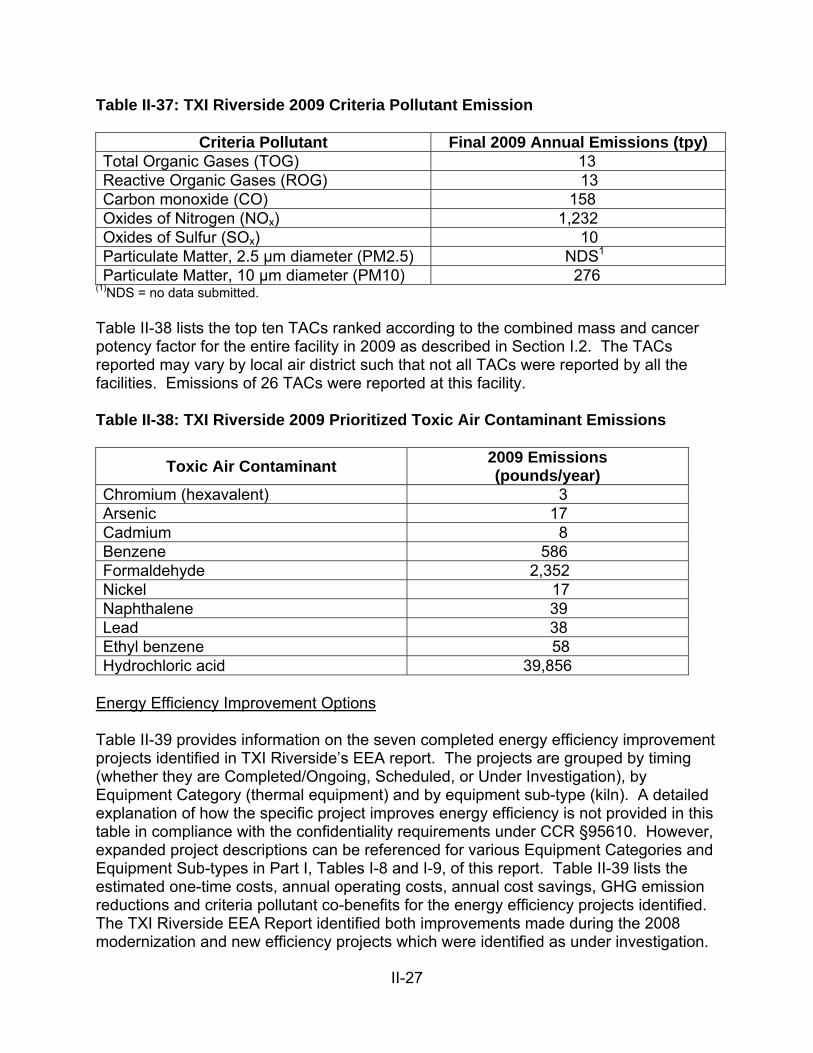
II-27
Table II-37: TXI Riverside 2009 Criteria Pollutant Emission
Criteria Pollutant Final 2009 Annual Emissions (tpy) Total Organic Gases (TOG) 13 Reactive Organic Gases (ROG) 13 Carbon monoxide (CO) 158 Oxides of Nitrogen (NOx) 1,232 Oxides of Sulfur (SOx) 10 Particulate Matter, 2.5 µm diameter (PM2.5) NDS1 Particulate Matter, 10 µm diameter (PM10) 276
(1)NDS = no data submitted. Table II-38 lists the top ten TACs ranked according to the combined mass and cancer potency factor for the entire facility in 2009 as described in Section I.2. The TACs reported may vary by local air district such that not all TACs were reported by all the facilities. Emissions of 26 TACs were reported at this facility. Table II-38: TXI Riverside 2009 Prioritized Toxic Air Contaminant Emissions
Toxic Air Contaminant 2009 Emissions (pounds/year)
Chromium (hexavalent) 3 Arsenic 17 Cadmium 8 Benzene 586 Formaldehyde 2,352 Nickel 17 Naphthalene 39 Lead 38 Ethyl benzene 58 Hydrochloric acid 39,856
Energy Efficiency Improvement Options Table II-39 provides information on the seven completed energy efficiency improvement projects identified in TXI Riverside’s EEA report. The projects are grouped by timing (whether they are Completed/Ongoing, Scheduled, or Under Investigation), by Equipment Category (thermal equipment) and by equipment sub-type (kiln). A detailed explanation of how the specific project improves energy efficiency is not provided in this table in compliance with the confidentiality requirements under CCR §95610. However, expanded project descriptions can be referenced for various Equipment Categories and Equipment Sub-types in Part I, Tables I-8 and I-9, of this report. Table II-39 lists the estimated one-time costs, annual operating costs, annual cost savings, GHG emission reductions and criteria pollutant co-benefits for the energy efficiency projects identified. The TXI Riverside EEA Report identified both improvements made during the 2008 modernization and new efficiency projects which were identified as under investigation.
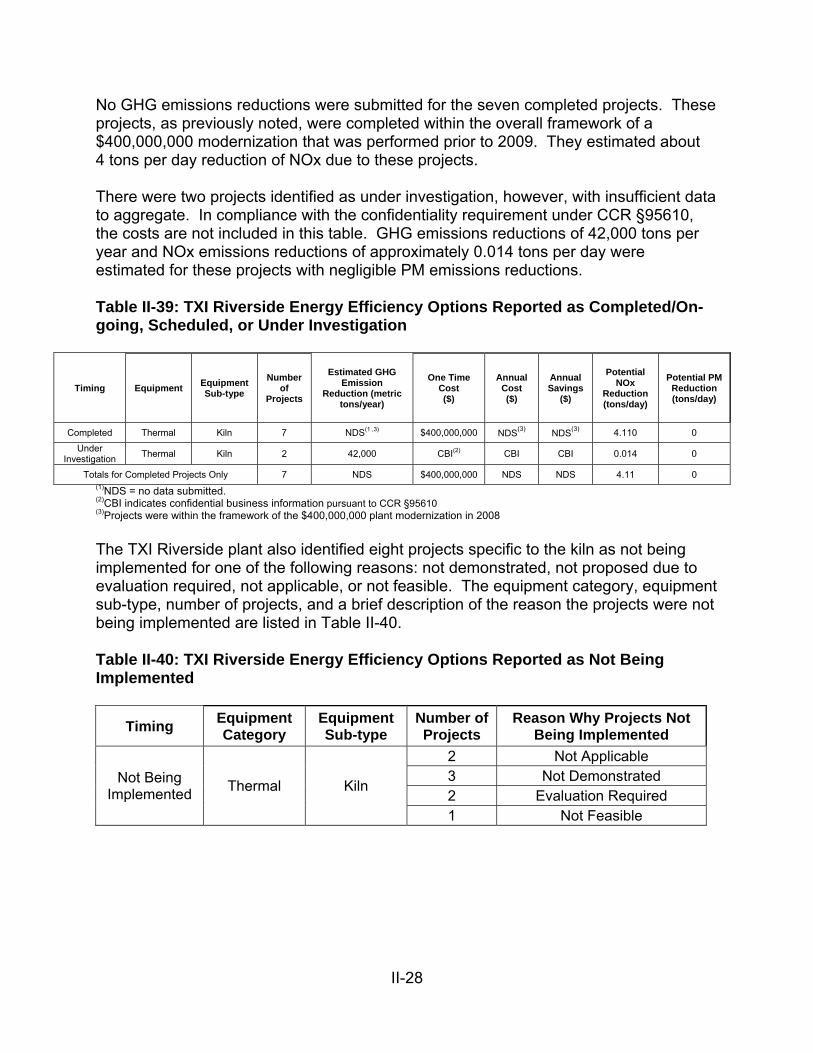
II-28
No GHG emissions reductions were submitted for the seven completed projects. These projects, as previously noted, were completed within the overall framework of a $400,000,000 modernization that was performed prior to 2009. They estimated about 4 tons per day reduction of NOx due to these projects. There were two projects identified as under investigation, however, with insufficient data to aggregate. In compliance with the confidentiality requirement under CCR §95610, the costs are not included in this table. GHG emissions reductions of 42,000 tons per year and NOx emissions reductions of approximately 0.014 tons per day were estimated for these projects with negligible PM emissions reductions. Table II-39: TXI Riverside Energy Efficiency Options Reported as Completed/On-going, Scheduled, or Under Investigation
Timing Equipment Equipment Sub-type
Number of
Projects
Estimated GHG Emission
Reduction (metric tons/year)
One Time Cost ($)
Annual Cost ($)
Annual Savings
($)
Potential NOx
Reduction (tons/day)
Potential PM Reduction (tons/day)
Completed Thermal Kiln 7 NDS(1 ,3) $400,000,000 NDS(3)
NDS(3)
4.110 0
Under Investigation
Thermal Kiln 2 42,000 CBI(2) CBI CBI 0.014 0
Totals for Completed Projects Only 7 NDS $400,000,000 NDS NDS 4.11 0 (1)NDS = no data submitted. (2)CBI indicates confidential business information pursuant to CCR §95610 (3)Projects were within the framework of the $400,000,000 plant modernization in 2008
The TXI Riverside plant also identified eight projects specific to the kiln as not being implemented for one of the following reasons: not demonstrated, not proposed due to evaluation required, not applicable, or not feasible. The equipment category, equipment sub-type, number of projects, and a brief description of the reason the projects were not being implemented are listed in Table II-40. Table II-40: TXI Riverside Energy Efficiency Options Reported as Not Being Implemented
Timing Equipment Category
Equipment Sub-type
Number of Projects
Reason Why Projects Not Being Implemented
Not Being Implemented
Thermal Kiln
2 Not Applicable 3 Not Demonstrated 2 Evaluation Required 1 Not Feasible

II-29
Reference (ENS 2008) Environmental News Service (ENS), 2008, March 6. Polluting California Cement Plant Installs Cleaner Kiln. URL: http://www.ens-newswire.com/ens/mar2008/2008-03-06-092.html


