Renewable Energy Sources
D. Elango
Assistant Professor in Civil Engg. Hindustan College of Engg.
Chennai – 603 103
IntroductionThe increase in energy consumption particularly in the past several decades has raised fears of exhausting the globe’s reserves of natural resources in the future
Due to industrializations and population growth our economy and technologies today largely depend upon natural resources, which are not replaceable
Approximately 90% of our energy consumption comes from fossil fuels
Introduction (cont’d)World Energy Conservation predicted estimation about the rate of utilization of energy resources shows that the coal deposits will deplete within the next 200 to 300 years and petroleum deposits will deplete in next few decades
So, encourage the research and development activities covering a broad spectrum of possible renewable resources, as their contributions are substantial
Introduction (cont’d)Power sector is one of the key sectors contributing significantly to the growth of country’s economy
A Country largely depends on the thermal power generation and a right fuel mix, based on well-diversified portfolios of indigenous and imported fuel would be required
Introduction (cont’d)
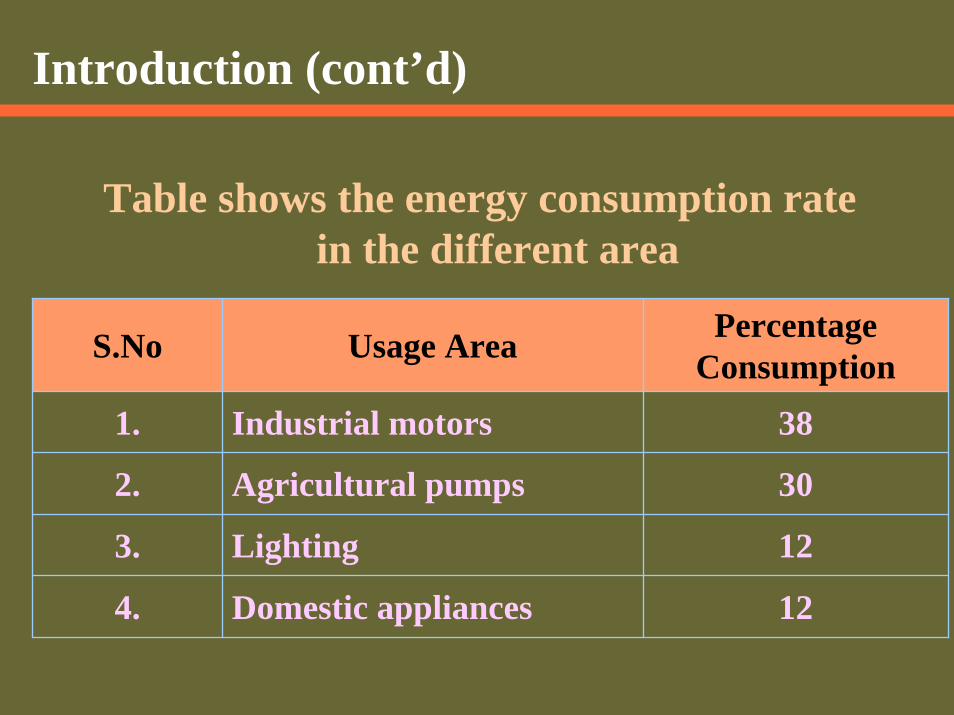
Table shows the energy consumption rate in the different area
S.No Usage Area Percentage Consumption
1. Industrial motors 38
2. Agricultural pumps 30
3. Lighting 12
4. Domestic appliances 12
Introduction (cont’d)The another advantage using renewable resources is that they are distributed over a wide geographical area, ensuring that developing regions have access to electricity generation at a stable cost for the long-term future
Many experts now believe that renewable sources are poised to achieve a major break through in the world’s energy market
The huge consumption of fossil fuels has caused visible damage to the environment in various forms
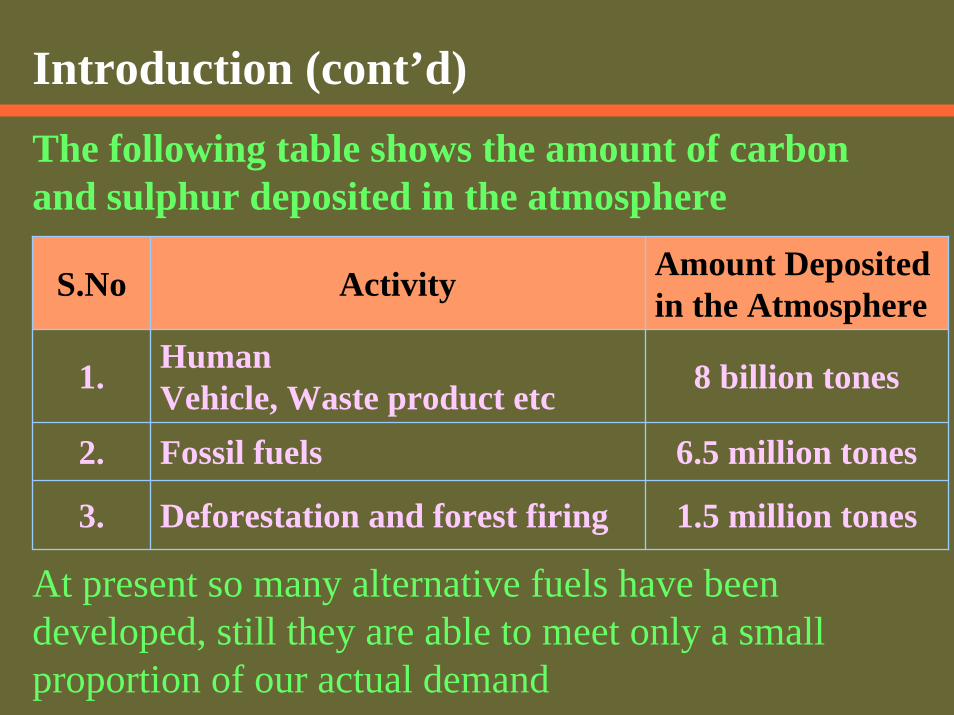
Introduction (cont’d)The following table shows the amount of carbon and sulphur deposited in the atmosphere
S.No Activity Amount Deposited in the Atmosphere
1. HumanVehicle, Waste product etc 8 billion tones
2. Fossil fuels 6.5 million tones
3. Deforestation and forest firing 1.5 million tones
At present so many alternative fuels have been developed, still they are able to meet only a small proportion of our actual demand
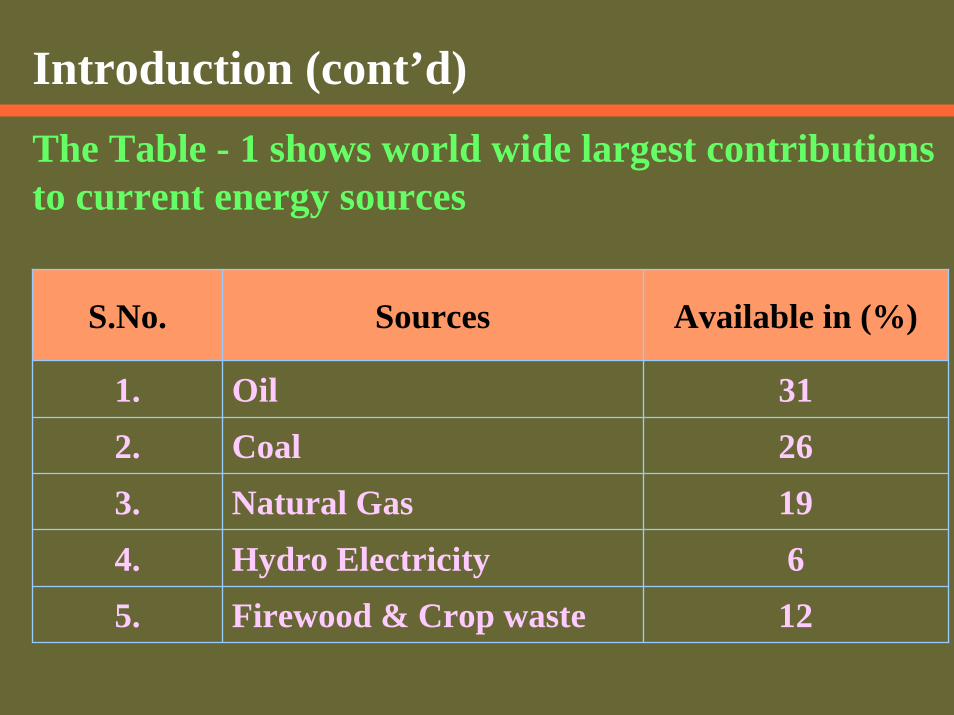
Introduction (cont’d)The Table - 1 shows world wide largest contributions to current energy sources
S.No. Sources Available in (%)
1. Oil 312. Coal 263. Natural Gas 194. Hydro Electricity 65. Firewood & Crop waste 12
Availability of Renewable Energy Resources
Renewable Energy sources are not depleted
It won’t create any environmental pollution problems
By an one time investment we can drew energy for many decades without affecting the environment
Solar EnergyThe solar energy falling on the Earths continents is more than 200 times the total annual commercial energy currently being used by humans
The government started solar power adoption with subsidies
Solar Energy can be classified as two types
1. Passive solar and 2. Active solar

Passive Solar EnergyPassive solar energy is making direct and indirect use of thermal energies from the sun
A southern exposure of a building guarantees the maximum exposure of the sun’s rays
Special metal leaf covering over windows and roofs can block out the sun during the summer months

Passive Solar Energy
Active Solar Energy Active Solar Energy is the use of the sun’s Electro magnetic radiation in generating Electrical Energy
Generally semi-conductor silicon Boron solar chips are used
The problem of these chips one that they have low Efficiency ratio and can only be used in supplying Energy needs of small devices (i.e. calculators, watches, radio etc.)
Hydropower Energy Hydro electric power plants convert the kinetic energy contained in falling water into electricity
India ranks in the world
The country’s total hydropower potential has been assessed as 84,044 MW, which is more than the oil potential of the Arab countries
About 78% of the total hydropower potential is in the Himalayan region
Based on head it is classified as 1. High head and 2. Low head
FIFTH

Wind EnergyTamilNadu, Andhra and Gujarat are considered suitable for wind power generation
The location of wind turbines is a very important factor, which influences the performance of the machine
The Wind power potential of the country is estimated as 20,000 MW, and India now ranks in the world
FOURTH
Wind EnergyWind mills are operated at wind speed normally not less than 3 mph
To avoid turbulence from one turbine affecting the wind flow at others it is located at 5-15 times blades diameter
Wind turbines will not work in winds below 13 km an hour
Biomass EnergyBiomass is the most important source for energy productions supplied by agricultureThis energy is also available in the form of biodegradable waste, which is the rejected component of available biomassorganic matter in which the energy of sunlight is stored in chemical bonds When the bonds between carbon, hydrogen and oxygen molecules are broken by digestion, combustion (or) decomposition these substances release stored energy
Biomass EnergyAnaerobic digestion converts biomass, especially waste product such as municipal solid waste and market waste. By using this method we can derive 70% of the energy
In Chennai the government set up a power plant using vegetable waste as fuel
Daily 40 tones of market waste is going to be used for the power plant
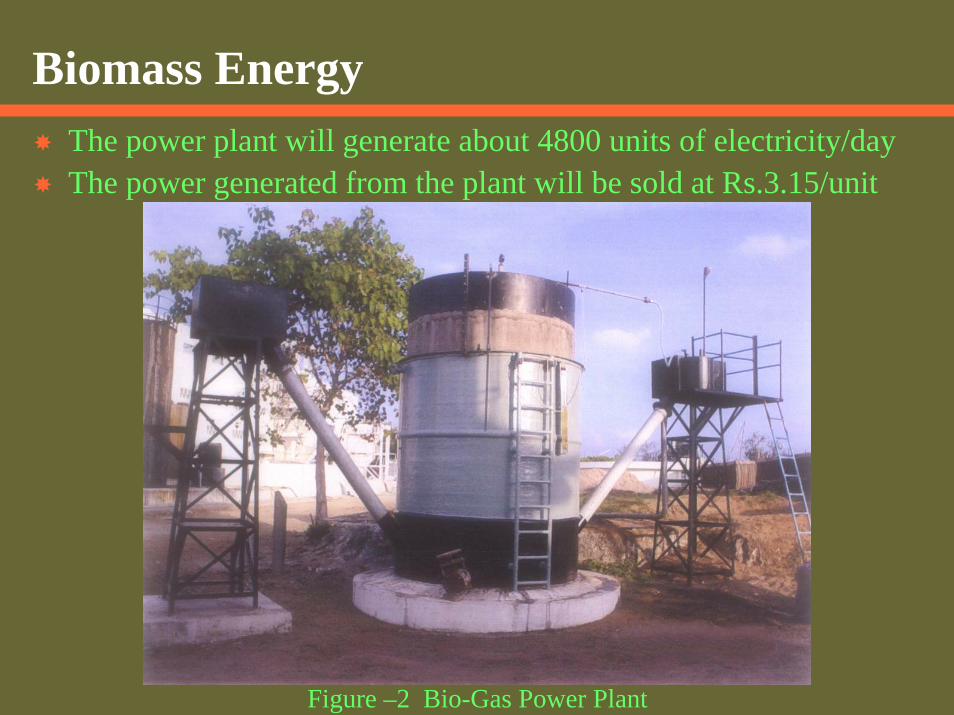
Biomass EnergyThe power plant will generate about 4800 units of electricity/dayThe power generated from the plant will be sold at Rs.3.15/unit
Figure –2 Bio-Gas Power Plant
Environmental Problems in Non-renewable Energy Resources
Fossil fuels are coal; oil and natural gas, have originated from the decomposition of organic matter in or on the Earth
Industrialized countries generate 20% to 30% of their energy from coal. Petroleum is derived from rich organic molecules in the sediments form
It emits sulphur contents and carbon monoxide and finally leads Acid rain
Carbon DioxideCarbon Dioxide is responsible for 55% of global warming
The main sources are fossil fuel burning (77%) and deforestation (23%)
The Table – 2 shows the National (India) Ambient Air quality standards in Different Places
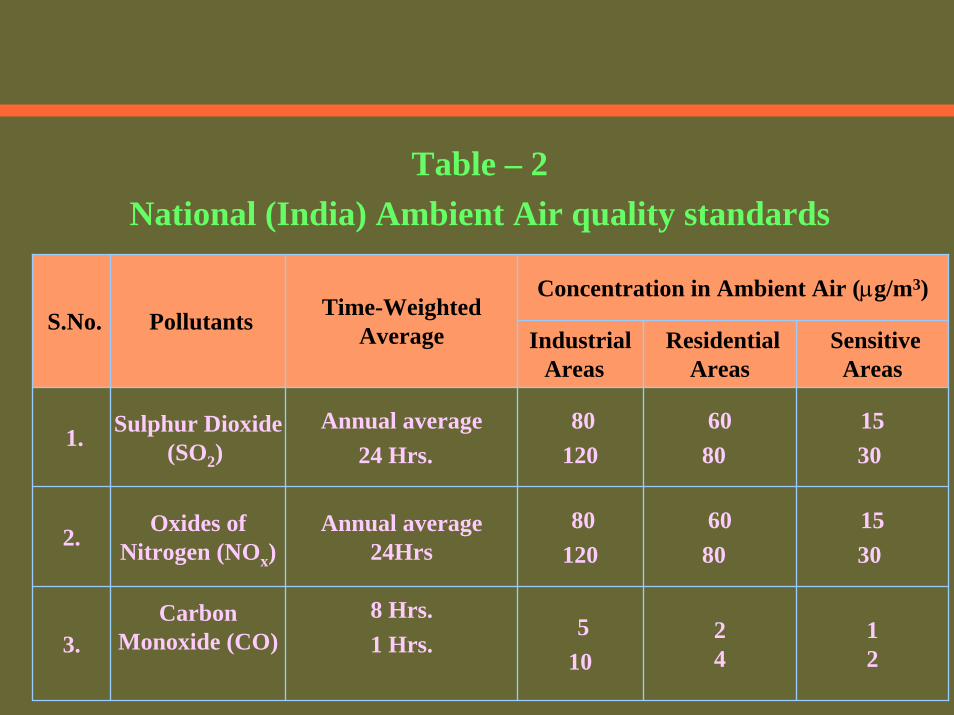
Table – 2National (India) Ambient Air quality standards
Concentration in Ambient Air (µg/m3)Time-Weighted
Average S.No. PollutantsIndustrial
Areas Residential
Areas Sensitive
Areas
1. Sulphur Dioxide (SO2)
Annual average24 Hrs.
80 120
60 80
1530
2. Oxides of Nitrogen (NOx)
Annual average24Hrs
80 120
60 80
1530
3.Carbon
Monoxide (CO)8 Hrs.1 Hrs.
5 10
24
12
Environmental Problems in Non-renewable Energy Resources
Due to industrialization and population growth the increase in atmospheric Carbon di-oxide already presents nearly a 30% change in the world
This could increase the average global temperature by about 1°-5° C
Every year the average global surface temperature rises approximately 0.3°-0.6°C
The Nitrogen and sulphur oxides are responsible for about 35% of acid rain
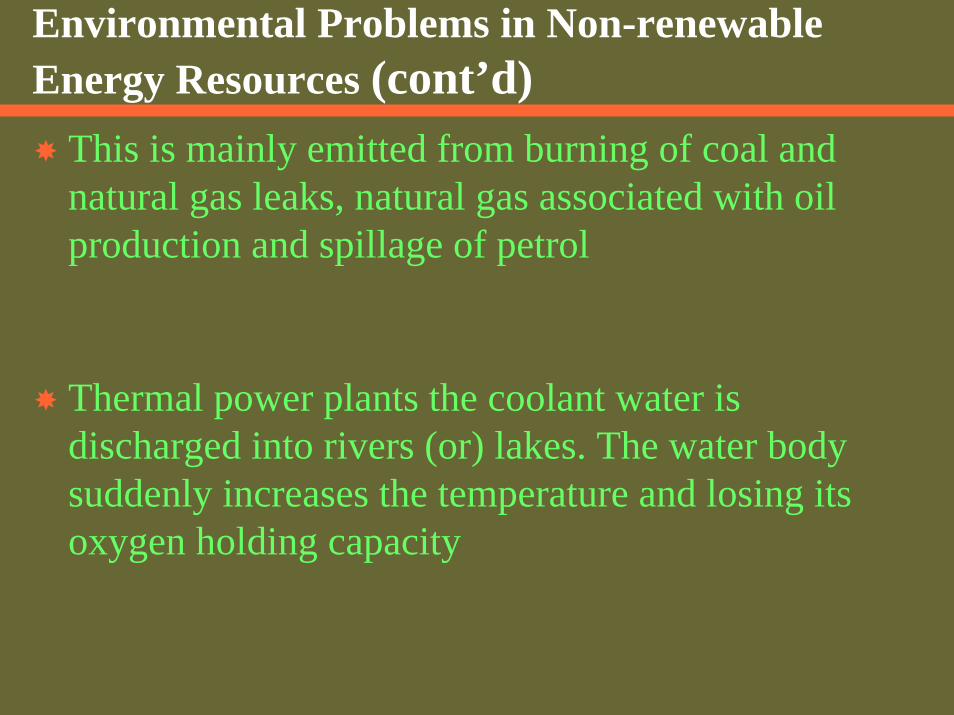
Environmental Problems in Non-renewable Energy Resources (cont’d)
This is mainly emitted from burning of coal and natural gas leaks, natural gas associated with oil production and spillage of petrol
Thermal power plants the coolant water is discharged into rivers (or) lakes. The water body suddenly increases the temperature and losing its oxygen holding capacity
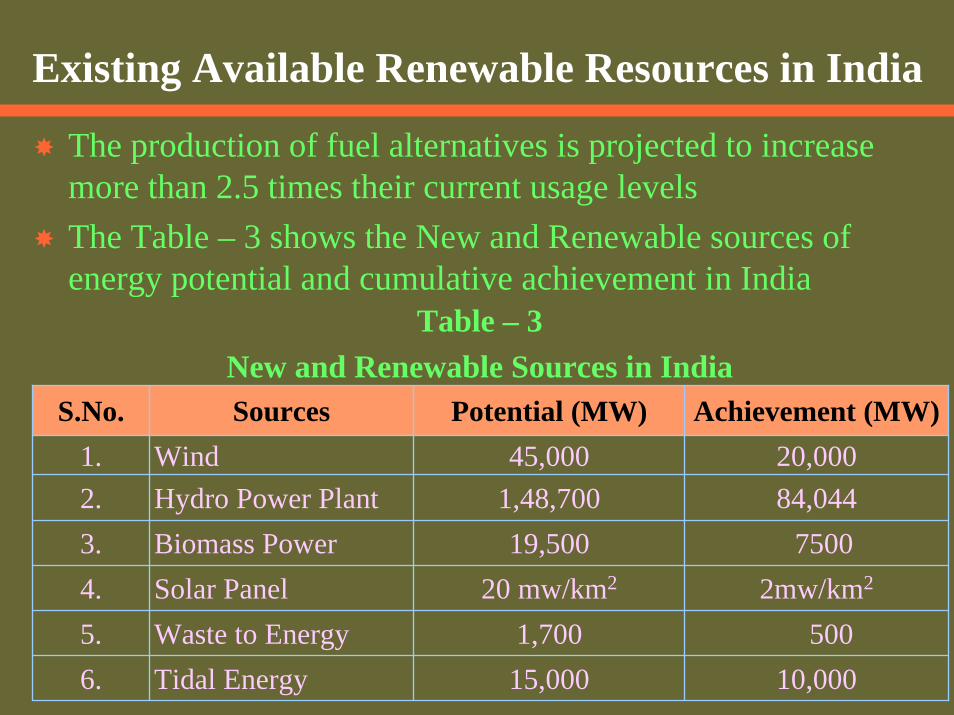
Existing Available Renewable Resources in India
The production of fuel alternatives is projected to increase more than 2.5 times their current usage levelsThe Table – 3 shows the New and Renewable sources of energy potential and cumulative achievement in India
Table – 3New and Renewable Sources in India
S.No. Sources Potential (MW) Achievement (MW)1. Wind 45,000 20,0002. Hydro Power Plant 1,48,700 84,0443. Biomass Power 19,500 75004. Solar Panel 20 mw/km2 2mw/km2
5. Waste to Energy 1,700 5006. Tidal Energy 15,000 10,000
Economical BenefitsProblems with renewable energy sources are non-availability at a reasonable cost, limited supplies and lack of cost Effective means for capturing and concentrating the renewable Energy
The production cost of renewable source is reduced by subsidies
The government by introducing subsidies in the form of relaxing duties, taxes and installation charges, the prices can be drastically reduced and it will came equal to fossil fuel rates
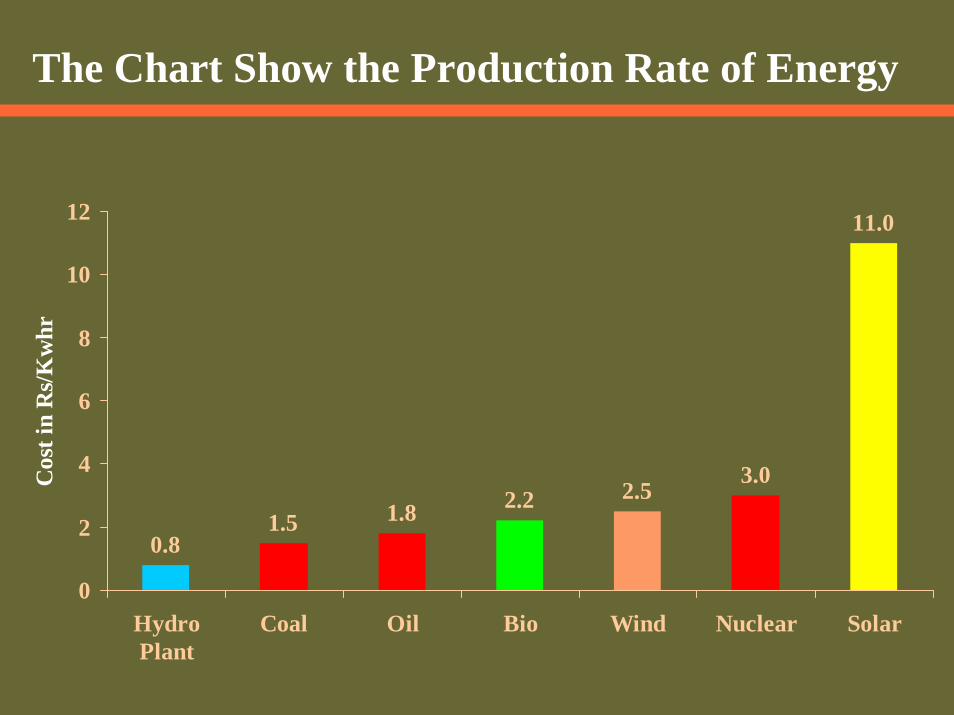
The Chart Show the Production Rate of Energy
0.81.5 1.8 2.2 2.5
3.0
11.0
0
2
4
6
8
10
12
HydroPlant
Coal Oil Bio Wind Nuclear Solar
Cos
t in
Rs/
Kw
hr
ConclusionThe renewable sources are cost effective, user-friendly, so that they can easily beat the fossil fuels By promoting renewable energy sources we can avoid, Air pollution, soil pollution and water pollution Country’s Economy will increase Due to technological advancement vehicles are made with improved fuel efficiency and also perfect hybrid vehicle are madeThroughout the year these sources are available without affecting the Environment
References1. Malkivia – pyh I.G and Pyh Y.A, 2002,
Sustainable energy Resources, Technology and Planning, WIT Press, Boston
2. Booth, D.E, 1998, The environmental consequences of Growth, London and New York,
3. Cline, W.R., 1992, The Economics of global warming, Washington D.C
4. Gibbons, J.H, et.al, 1989, Strategies for energy use, vol. 261, PP 136-143
5. Time Magazine, August 2005, PP 32-33
References6. Journal of Innovations in Renewable Energy, June
2005Vol. 2, PP 24-25
7. National geographic magazine, August 2005
8. Popular Mechanics Magazine, September 2005
9. The Executive Engineer, Tamil Nadu Pollution Control Board, India
10. Renewable energy magazine, Ministry of Non-conventional Energy Sources, Government Of India, Vol.1, Auguest 2005, PP 17-18

Thank You


