
Promoting inclusive growth in Bangladesh through special economic zones
A research paper on
Economic Dialogue on Inclusive Growth in Bangladesh
Mohammad A. Razzaque, Bazlul H. Khondker and Abu Eusuf
March 2018

Acknowledgements
This research paper is an output of the DFID-funded project on Economic Dialogue on Inclusive Growth in Bangladesh.
The views presented in this paper are those of the authors and do
not necessarily represent the views of ODI, The Asia Foundation,
DFID or the UK Government. The authors take full responsibility
for any errors or omissions contained in this report.
Authors
Mohammad A. Razzaque
Economist and consultant for the Overseas Development Institute, London.
Email: [email protected]
Bazlul Haque Khondker
Professor in the Department of Economics of the University of Dhaka, Bangladesh.
Abu Eusuf Farazi
Professor of Development Studies, University of Dhaka, and Centre for Budget and Policy, University of
Dhaka.
Cover Image Roy Upam

Promoting inclusive growth in Bangladesh through special economic zones
CONTENTS
Executive summary _________________________________________________________________ ii
1. Introduction ____________________________________________________________________ 1
2. SEZs and regional disparities: a brief review of the literature ______________________________ 3
3. Regional disparities in Bangladesh ___________________________________________________ 6
3.1. Spatial variation in poverty incidence: The east–west divide ___________________________ 6
3.2. Distribution of economic activities by regions ______________________________________ 7
4. Bangladesh SEZs and inclusive development __________________________________________ 12
4.1. SEZs: development in progress _________________________________________________________ 12
4.2. The issue of regional inclusivity ________________________________________________________ 12
4.3. Experimental policy simulations ________________________________________________________ 15
4.4. Lessons from Bangladesh’s EPZs _______________________________________________________ 21
5. SEZs for regional inclusivity: Policy recommendations __________________________________ 23
5.1. Developing a clear SEZ development strategy to address regional inclusivity ____________________ 23
5.2. An adequate and effective incentive mechanism __________________________________________ 24
5.3. Coordination between different support regimes and national policy objectives _________________ 25
5.4. Using agglomeration economies and developing a few SEZ-based growth centres focusing on
regional inclusivity ______________________________________________________________________ 26
5.5. Developing lagging region SEZs as part of economic corridors ________________________________ 27
5.6. Infrastructure (including energy) ______________________________________________________ 28
5.7. Ensuring fair access to SEZs ___________________________________________________________ 29
5.8. Maximising synergies between EPZ and SEZ models ________________________________________ 30
5.9. Skilled manpower ___________________________________________________________________ 30
5.10. Assessing costs and benefits _________________________________________________________ 31
5.11. General factors affecting SEZ success ___________________________________________________ 31
5.12. Need for suitable data ______________________________________________________________ 31
6. Conclusion _____________________________________________________________________ 33
References ______________________________________________________________________ 35
Annex 1: Relationship between System of National Accounts and Social Accounting Matrix ______ 37
Methodology: Description of SAM model ____________________________________________________ 37
Derivation of SAM multipliers _____________________________________________________________ 39
Annex 2: Construction of A Regional Social Accounting Matrix for Bangladesh _________________ 41
Bangladesh National Social Accounting Matrix (SAM) __________________________________________ 41
Bangladesh Regional Social Accounting Matrix (SAM) __________________________________________ 42
Annex 3: Map of Special Economic Zones in Bangladesh___________________________________ 45
Annex 4: Estimated backward linkages for various activities by regions _______________________ 46
Annex 5: Simulation Results _________________________________________________________ 49
Annex 6: Changes in employment by household types by different regions____________________ 53

Promoting inclusive growth in Bangladesh through special economic zones
i | EDIG Research Paper Three
ABBREVIATIONS
ADB
BBS
BEZA
EPZ
FDI
G2G
GDP
GoB
HIES
MSMEs
RMG
SAM
SEZ
7FYP
Asian Development Bank
Bangladesh Bureau of Statistics
Bangladesh Economic Zones Authority
export processing zone
foreign direct investment
government-to-government
gross domestic product
Government of Bangladesh
Household Income and Expenditure Survey
micro, small and medium enterprises
ready-made garments
social accounting matrix
special economic zone
Seventh Five Year Plan of Bangladesh

Promoting inclusive growth in Bangladesh through special economic zones
ii | EDIG Research Paper Three
EXECUTIVE SUMMARY Bangladesh has undertaken an ambitious task of developing 100 special economic zones (SEZs) to stimulate economic growth, create employment opportunities and foster poverty reduction. Bangladesh’s national development plan intends to use SEZs as a policy tool for tackling regional disparities. This study closely reviews SEZ-related regional development issues, undertakes policy experiments to assess the potential impact of pursuing different types of investment scenarios for lagging regions, and provides some recommendations for making SEZ policies effective. Considering Bangladesh’s policy target of generating additional exports of $40 billion from the SEZs, simulation results show that without any targeted intervention most of the increased production activities will concentrate in the relatively better-off greater Dhaka and Chittagong regions given the current excessively skewed distribution of manufacturing export production in favour of these regions. The lagging districts in the west still benefit from economy-wide linkages and increased demand for labour. However, since half of the targeted exports are generated in SEZs located in north-west and south-west districts, the impact of poverty reduction for these regions is much higher. Simulation results suggest that promoting exports from SEZs in lagging regions can have a strong impact on employment generation, including for women. It also generates greater demand for labour from small farm, non-farm and lower-skilled households. These are the households more likely to be associated with vulnerable and excluded groups. While SEZs can be an appealing policy tool for promoting regional development, and policy simulations can help us understand the impacts of different policy scenarios under ideal circumstances, several factors must be taken into serious consideration to make it work effectively. The strategy delineated in Bangladesh’s Seventh Five Year Plan (7FYP) for tackling regional disparities strongly suggests attaching priority to the divisions in the western part of Bangladesh. This is not matched by the progress of SEZ development so far. The problem could be better addressed by aligning strategy with the actual zone development work on the ground. SEZs do offer special incentives for investors. But incentives in lagging regions may need to be more attractive than elsewhere in order for investors to overcome any locational disadvantages. Focusing on a few major SEZs in lagging regions could be more helpful to ensure adequacy of incentives and focused policy attention for effective implementation. Too many suboptimally sized SEZs would not be able to exploit agglomeration economies, especially when these were in established urban centres. Phased implementation of the 100-SEZ programme could be a practical option. The need for appropriate, adequate and well-functioning infrastructure cannot be overemphasised for lagging regions. Their connectivity with major economic corridors should also be another important consideration. Ensuring availability of skilled staff for SEZs, particularly in less developed regions, can be a major challenge. Implementation of the 7FYP’s suggestion of supporting lagging regions with skill development is extremely important for economic viability of SEZ in these regions.

Promoting inclusive growth in Bangladesh through special economic zones
iii | EDIG Research Paper Three
Proper utilisation of allotted serviced plots – rather than catering for sheer rent-seeking objectives – is critical. To what extent small and medium-sized enterprises can access SEZs and how their participation can be ensured is also a policy challenge. Finally, utilising SEZ policies for balanced regional development will need analytical policy work for which Bangladesh currently lacks sufficient and good-quality data. In its absence, developing meaningful and informed policy analysis and advice will be a daunting prospect.

Promoting inclusive growth in Bangladesh through special economic zones
1 | EDIG Research Paper Three
1. INTRODUCTION Eradicating poverty by means of accelerating economic growth and generating employment opportunities is a key policy priority for Bangladesh. There is also an emphasis on achieving inclusive economic growth that will, among other things, help disadvantaged regions and facilitate greater participation of deprived population groups in economic activities.1 The Seventh Five Year Plan of Bangladesh (7FYP) outlines a strategy for manufacturing-sector development that includes export-led growth as a means of achieving these development aspirations (GED, 2015). Following the success of special economic zones (SEZs), especially in China, and export processing zones (EPZs) in Bangladesh, the Government of Bangladesh (GoB) has decided to establish a total of 100 SEZs over the next 15 years.2 By providing attractive fiscal and financial benefits and serviced industrial plots, these zones are expected to mobilise private investments from both domestic and foreign sources. The 7FYP also intends to use SEZs as a policy tool to generate inclusive growth by means of promoting development in lagging regions. Despite the apparent simplicity of the concept of inclusive growth, it is often not clear what it implies for regional development, and the policy instruments facilitating it are less well articulated. As agglomeration economies become a dominant force in economic development, leading to the concentration of economic activities around certain growth poles, the issue of the need for so-called balanced regional development becomes complex. Against this backdrop, free movement of workers, including women’s greater participation, is characterised as an important criterion of inclusive growth. Along with this, job market participation of other excluded and vulnerable groups represents an essential ingredient. However, regional disparities can have significant social and political consequences here.3 Bangladesh has disparities in various dimensions (e.g. in terms of differences in income, poverty incidence and educational attainment) at different regional levels (e.g. divisional, district, sub-district). However, at a wider administrative division level, there is broad-based consensus that the western part of the country is lagging compared with its eastern counterpart.4 The 7FYP aims to tackle this regional divide with the help of, among other things, SEZs. In this regard, though, the experiences of many countries with SEZs seem to suggest the outcomes are largely mixed. One question for Bangladesh, then, relates to whether the proposed SEZ strategy can help address regional disparities. Regions in Bangladesh exhibit significant differences in terms of the location
1 Two of the three major themes of the 7FYP of Bangladesh are ‘GDP [gross domestic product] growth acceleration, employment generation and rapid poverty reduction; and a broad-based strategy of inclusiveness with a view to empowering every citizen to participate full and benefit from the development process’ (GED, 2015: xlvi). The 7FYP goes to great lengths to discuss regional disparities and suggest specific policy options to address this.
2 Mandated by the Bangladesh Economic Zones Act, 2010, the Bangladesh Economic Zones Authority (BEZA) was officially instituted with the objective of establishing economic zones in all potential areas in the country, including backward and underdeveloped regions.
3 Recent political events in Europe and the US have highlighted social tensions even in advanced economies resulting from the skewed distribution of economic prosperity unmitigated by the free movement of labour.
4 In highlighting regional disparities in Bangladesh, the World Bank (2008) coined the term ‘east–west divide’ on finding that the pace of poverty reduction during 2000–2005 was much slower for the western part of Bangladesh.

Promoting inclusive growth in Bangladesh through special economic zones
2 | EDIG Research Paper Three
and distribution of economic and industrial activities. For example, employment-intensive manufacturing and export-oriented enterprises are largely concentrated in the Dhaka and Chittagong regions. Should the SEZ plan aim to attract similar investment projects to lagging regions? Keeping regional inequalities aside, it is also important to assess whether SEZs in disadvantaged regions can generate inclusive growth while not adversely affecting overall economic growth. There is not much discussion at present on these issues. This paper seeks to generate relevant policy inputs by investigating the nature of economic activities associated with different regions in Bangladesh, and assesses the potential impact of promoting certain types of SEZ investment projects in lagging regions. In doing so, it makes a technical contribution by constructing a regional social accounting matrix (SAM) analytical framework that allows us to study the implications of different SEZ policy options for growth, employment generation and poverty reduction for different regions. While we use the so-called ‘east–west divide’ to demonstrate the simulated policy impact to four greater regions (north-west, south-west, Greater Dhaka, and Greater Chittagong), the analytical framework can – where data are available – be applied to lower-level administrative regions or localities. This paper is organised as follows: After this introduction, Section 2 provides a brief review of the relevant literature on SEZs, economic development and regional disparities. Section 3 highlights the spatial variation of development in Bangladesh. Section 4 provides a brief assessment of SEZ development work in progress and – based on a constructed regional SAM – undertakes various SEZ policy experiments to assess their impact on economic growth, employment generation and poverty reduction by region. Section 5 discusses a number of issues for consideration in order to make the SEZ policy tool effective for regionally inclusive economic development. Section 6 concludes.

Promoting inclusive growth in Bangladesh through special economic zones
3 | EDIG Research Paper Three
2. SEZS AND REGIONAL DISPARITIES: A BRIEF REVIEW OF THE LITERATURE There exists a huge literature on SEZs, dealing with many different aspects of the topic. The major underlying objectives for building economic zones include attracting foreign direct investment (FDI), generating employment, undertaking economic reforms and experimenting with new policies (Farole and Akinci, 2011; ADB, 2015). Available evidence strongly suggests that SEZ benefits are not uniform across zones or economies. In some cases, even apparently successful operations have drawn criticism on the grounds that they have failed to diffuse benefits and/or to trigger spillover effects beyond their enclaves. In the developing world, East Asian countries – particularly China – are considered the most successful in terms of making an export-led growth strategy work through SEZs. As economic zones have remained popular, this mixed success of countries allows us to draw important lessons. These include, as highlighted in Farole and Akinci (2011), lessons on how to attract firms that create jobs; how to ensure positive externalities, including upgrading structural transformation and catalysing economic reforms; and how to ensure sustainability from institutional, social and environmental perspectives. However, not much explicit discussion has taken place on the role and effectiveness of SEZs in addressing regional disparities. This is despite many countries targeting disadvantaged regions with the aim of creating jobs and transforming these regions into economic growth poles. Although assessing the performance of economic zones (e.g. in terms of employment generation and enhanced exports) implicitly suggests their effectiveness in promoting regional development, an explicit focus is important. Policy-makers must confront such issues as inclusive regional development in relation to the benefits of agglomeration economies that tend to concentrate economic activities in a few existing growth centres. At the outset, there could be several reasons for differences in regional socio-economic outcomes, including historical legacy, availability of natural resources, susceptibility to natural calamities, state of human capital, local political economy, etc. Swedish economist Gunnar Myrdal suggested that regional differences were the natural outcome of economic development and an inevitable result of market forces that interact with initial conditions (Myrdal, 1957). According to his theory, economic growth would initially take place based on certain inherent locational advantages of a region (e.g. natural sources of fuel, or a supply of raw materials). This then sets in motion the process of cumulative causation, resulting in human as well as physical capital along with investment in infrastructure, and high-growth activities from other parts of the country gravitating towards this growing centre.5 The ‘new economic geography’ model developed by Krugman (1991) provided a powerful analytical framework demonstrating how clustering forces generate an uneven distribution of economic activity and income across space. Krugman’s ‘core–periphery’ approach has been applied in analysing the economics of cities, the emergence of regional disparities and the origins of
5 Myrdal called the process of relocation of wealth from less advanced regions to the central rich region ‘the backwash effect’. It takes place because the growing region offers better facilities and opportunities. ‘The spread effect’ is the process that causes development in one place to spread to its suburbs and all the adjoining areas.

Promoting inclusive growth in Bangladesh through special economic zones
4 | EDIG Research Paper Three
international inequalities (Venables, 2005). The underlying analytic framework to examine the location of the manufacturing industry shows that, when there are economies of scale in production, regions (or countries) may become locked into disadvantageous patterns of production. The agglomeration effect is the outcome of the interaction of increasing returns, costs (including trade costs in international trade dimensions of the theory) and factor price differences. When scale economies are a major factor, economic regions with higher production activities will be more profitable and will therefore attract even more firms. That is, production will tend to concentrate in a few countries, regions or cities. As economic growth is driven by productivity increases, which, in turn, are driven by industrialisation, geographical regions within a country that have industrialised are more productive and exhibit higher incomes. Under these circumstances, differences in the levels of industrialisation and/or urbanisation can be a primary cause of geographical variation in average income in developing nations. Lal and Chakravorty (2005) therefore argue that while private sector firms will tend to concentrate in existing growth centres, state-owned industry location decisions include consideration of regional balance, national security and political gains. However, as the state’s role as industrial owner and industrial location regulator has been substantially curtailed under the regime of liberalisation and structural reforms, according to Lal and Chakravorty industries will be more spatially concentrated in leading regions, which will contribute to higher levels of spatial inequality. Kanbur and Venables (2005), as part of a project for the World Institute for Development Economics Research of the United Nations University, comprehensively document the extent of spatial dimensions of regional inequality. They show high inequalities between rural and urban areas, and between geographically advantaged and disadvantaged regions. They argue that while there are efficiency gains from the concentration of economic activity in urban centres and in coastal districts, the associated regional inequalities are a major contributor to overall inequality. 6 The authors suggest managing high and rising spatial disparities by using policy interventions to ensure a more spatially equitable allocation of infrastructure and public services, and policies to ensure, among other things, freer migration. For China, there exists strong evidence of the success of policy interventions in addressing spatial inequality, with the government shifting its focus from the coast to the interior regions. The central government put the Western Development Strategy into practice in 1998, following this with the Northeast Revival Strategy in 2003 and then the Rise of Central China Strategy (Zheng and Chen, 2007). In 2005, it adopted an explicit objective of ‘harmonious development’ – one important dimension of which was balanced development across regions (Fan et al., 2011).7 According to Zheng and Chen (2007), the interior regions of China have benefited substantially from these regional development programmes and from the gains that have emerged from shifting comparative advantages, as land and labour prices in the east have risen significantly. However,
6 Kanbur and Venables (2005) also point out that regional disparities are particularly worrying if they align with political or ethnic divisions. 7 Various elaborate measures undertaken by the Chinese government are mentioned in Fan et al. (2011). These include, among others, as part of the Western Development Strategy (Go West), the central government’s starting 70 main construction projects with a total amount of investment in the western regions of 1 trillion yuan. Between 2000 and 2005, the new roads built in the western region reached 220,000 km. By 2005, the central government had invested 460 billion yuan in construction projects in the western areas. Fiscal transfers and subsidies of 500 billion yuan were also invested.

Promoting inclusive growth in Bangladesh through special economic zones
5 | EDIG Research Paper Three
they point out that it is becoming increasingly difficult for the government to intervene, as market economy mechanisms now have a far greater influence. Nevertheless, Fan et al. (2011) highlight three government strategies that have had important implications for addressing regional inequalities: infrastructure development and clustering; social investment protection; and governance reform. They propose that the Chinese government take an experimental approach to interventions, as it did in the early period of agricultural reforms, learning lessons from the outcomes before scaling up.

Promoting inclusive growth in Bangladesh through special economic zones
6 | EDIG Research Paper Three
3. REGIONAL DISPARITIES IN BANGLADESH
3.1. Spatial variation in poverty incidence: the east–west divide
Spatial inequality and regional disparities has been a subject of considerable interest in Bangladesh. There is a general perception that socio-economic conditions in the western part of the country lag behind those in the east. In a study assessing poverty trends for 2000–2005, using Household Income and Expenditure Survey (HIES) data from the Bangladesh Bureau of Statistics (BBS), the World Bank (2008) highlighted a divergence between the eastern and the western parts of the country. When the ‘east’ was defined as the divisions of Dhaka, Chittagong and Sylhet and the ‘west’ as the divisions of Khulna, Rajshahi and Barisal, the data showed significantly greater reductions in poverty from 2000 to 2005 for the eastern regions. The BBS survey results for 2010, however, depicted a different poverty reduction pattern for the latter half of the 2000s, during which the headcount ratio fell faster for western regions.8 The results of the latest BBS HIES, carried out in 2016 and published in October 2017, show that the proportion of people below the poverty line in Bangladesh fell from 31.5% in 2010 to 24.3% in 2016. However, progress on poverty reduction for the districts in the west has been on average slower (Table 1).
Figure 1: Proportion of people living below the poverty line by region (%)
Source: BBS.
8 Among others, Sen et al. (2014) and Shilpi (2013) provide detailed discussions on the reasons behind such movements in poverty trends for eastern and western parts of the country. These include unfavourable initial conditions of the west being addressed by means of development efforts such as investments in public infrastructure; construction of the Jamuna Bridge, improving connectivity between the two regions; a revival of growth in agricultural activities benefiting western districts; and deepening of microfinance activities in poor areas.
0
10
20
30
40
50
60
Barisal Chittagong Dhaka Khulna Rajshahi Sylhet
2000 2005 2010 2016

Promoting inclusive growth in Bangladesh through special economic zones
7 | EDIG Research Paper Three
Table 1: Region-wise poverty incidence (headcount ratio) using cost of basic needs method (%)
2016 2010 2005 2000
Using lower poverty lines
National Rural Urban National Rural Urban National Rural Urban National Rural Urban
East 11.3 12.6 8.3 15.4 21.1 4.1 18.7 23.2 9.2 31.3 37.2 18.0
West 17.9 18.6 14.8 20.5 21.1 17.3 33.8 35.0 27.9 37.9 39.9 28.4
National 12.9 14.9 7.6 17.6 21.1 7.7 25.1 28.6 14.6 34.3 37.9 20.0
Using upper poverty lines
East 20.9 21.8 20.0 28.8 35.1 15.5 32.9 37.7 22.6 45.9 51.2 35.9
West 32.5 33.0 30.7 35.2 35.3 33.9 49.7 50.8 43.8 52.5 54.5 40.0
National 24.3 26.4 18.9 31.5 35.2 21.3 40.0 43.8 28.4 48.9 52.3 35.2
Source: Authors’ estimates from BBS (2017) and Sen et al. (2014)
While the analysis of the 2016 survey is awaited, attempts have been made to study regional disparities with indicators other than poverty incidence, albeit with data constraints. Shilpi (2013) and Sen et al. (2014) seem to suggest narrowing divergence between eastern and western regions in relation to overall welfare measures and educational outcomes at divisional level, but lack of data prevents analysis at a more disaggregated administrative level. Raihan and Ahmed (2016) explore disparities in educational development and attainment of primary schools using data from the upazila (sub-district) level to identify various pockets of deprived regions. Khondker and Mahzab (2015) compile district-level information to suggest a greater concentration of districts from the west and south as low performers on many different economic indicators. However, they also show that the districts with the highest poverty incidence are not always the same as those ranked at the bottom based on other indicators associated with health, education, infrastructure and financial inclusion related development factors. The authors undertook a Principal Component Analysis to rank the districts based on several indicators other than poverty incidence.9 Their results reveal that, except for the three Chittagong Hill Tract districts – namely, Bandarban, Khagrachari and Rangamati – that are historically known as lagging regions, all 15 bottom districts belong to the western regions.
3.2. Distribution of economic activities by regions
Despite much discussion in Bangladesh on regional variation in socio-economic outcomes, it is not straightforward to undertake a disaggregated analysis of regions combining national income accounts data with poverty and welfare indicators from various nationally representative surveys of households. While official national accounts data providing information on aggregate gross domestic product (GDP) and outputs by different economic sectors are published annually, disaggregated data by districts are generally not available. The BBS HIES – the source of data with district-level coverage – are undertaken once every five years. We thus need to construct a
9 The reason for excluding poverty incidence was that it was considered as the outcome emanating from different levels of other development indicators.

Promoting inclusive growth in Bangladesh through special economic zones
8 | EDIG Research Paper Three
consistent data framework if we are to be able to study the regional distribution of economic activities and the impact of any relevant policy options. This can be done utilising a regional Social Accounting Matrix (SAM). As there exists no regional SAM for Bangladesh, one has been constructed in this study utilising the national SAM of 2012, as described in Annex 1. Given data and time constraints, the number of regions was limited to four, in line with the east–west divide highlighted above.10 BBS provided a detailed GDP breakdown by as many as 17 sectors for all districts of Bangladesh for the period 1996–2000. Comparable information for subsequent periods is not directly available. Hence, data updating for 2015 was carried out utilising information from various sources, including fisheries surveys, an agriculture census, a census of manufacturing industries and sectoral GDP figures as available from the national accounts database.11 Figure 2 provides the shares of regions by a few broad sectors for 1996–2000 (average) based on actual BBS data and updated information on the same for 2015.
Figure 2: GDP shares of regions by broad sectors (%)
Source: Authors’ data updating work for regional SAM.
10 This level of disaggregation can also be justified given the general recognition in the 7FYP of lagging regions being mainly associated with north-west and south-west Bangladesh. Following earlier work in the literature (e.g. World Bank, 2008), we kept Faridpur districts within the greater Dhaka region.
11 Where no information could be found, we kept the regional shares of outputs unchanged at the 1995–1996 level. To keep things within manageable limits, while constructing the regional SAM we suitably aggregated the sectors, activities and factors of production to have 30 activities (including 14 in manufacturing), 30 commodities, 4 factors of production and 8 household types. Annex 2 provides details of the Bangladesh SAM and our construction of the regional SAM.
0102030405060708090
1001996-2000
South-west North-west
Greater Dhaka Greater Chittagong
0
20
40
60
80
1002015
South-west North-west
Greater Dhaka Greater Chittagong

Promoting inclusive growth in Bangladesh through special economic zones
9 | EDIG Research Paper Three
Figure 3: Comparison of GDP structure by major sectors (%)
Source: Based on authors’ data updating work for regional SAM.
As is evident from Figure 3, the relative significance of Dhaka and Chittagong – in terms of overall output – increased from 63% in 1996–2000 to 66% in 2015, while the comparable significance of the other two regions combined declined from 37% to 33% during the same period.12 The Dhaka and Chittagong regions together accounted for 87% of the country’s manufacturing GDP in 2015 – up from 81% in 2000. Figures 4 and 5 depict similar distributions for national value added and exports. Figures 4a and 4b show that services contribute about 54% of Bangladesh’s total value added. And, of all services value added, Greater Dhaka region’s contribution is more than 40%, while Chittagong adds another 26%. In the same fashion, manufacturing constitutes about 92% of Bangladesh’s exports (Figure 5a), of which virtually everything comes from Dhaka and Chittagong. Exports of agricultural goods are the most diversified when considering regional share, but still Dhaka is the largest contributor (Figure 5b).
12 Data limitations mean the updated information should be used with caution. For a number of sectors, there was no updated information. Therefore we kept the regional shares in these sectors unchanged. In the case of manufacturing, for example, updated information was available only until 2006. Based on the perceived knowledge of the Bangladesh economy and the limitations associated with information on various sectors, particularly those in services and manufacturing, this would imply that the relative significance of the Dhaka and Chittagong regions is likely to be underestimated.
0
5
10
15
20
25
30
35
40
45
1996-2000 2015 1996-2000 2015 1996-2000 2015 1996-2000 2015
South-west North-west Dhaka Chittagong
Agriculture Manufacturing Services

Promoting inclusive growth in Bangladesh through special economic zones
10 | EDIG Research Paper Three
Figure 4: Value added by sectors and sectoral value added by regions
Source: Based on authors’ data work.
Figure 5: Export share by sectors and sectoral exports by regions
Source: Based on authors’ data work
The issue of regional disparity received a special mention (as it was treated with a separate chapter) in the Sixth Five Year Plan of 2011–2015. This recognised the reversal of poverty reduction trend found between 2005 and 2010 and concluded that regional disparity observed in previous household surveys had narrowed significantly. The Plan identified several important factors contributing to this reversal: public policy emphasis and support for agriculture; easier communication between the north-west region and the rest of Bangladesh owing to more efficient operation of the Jamuna Bridge; private sector investment as well as activities geared up in the north-west region taking advantage of this easier communication; increased coverage of public sector infrastructure and safety net programmes for the southern region; and migration of poor people from less economically active regions (i.e. Barisal and Khulna) to Dhaka city. Following on this, the 7FYP provides detailed discussion on regional disparities (GED, 2015). It states that, whatever methodology is used, a number of districts in Bangladesh can be classified as lagging. In subsequent discussions, it has mainly referred to Barisal, Khulna, Rajshahi and Rangpur divisions (all eastern divisions) as lagging. To develop lagging regions, the Plan also provides an elaborate
18.6%
27.5%
53.9%
Figure 4a: Value added by sector (%)
Agriculture Industry Services
0%
20%
40%
60%
80%
100%
Agriculture Industry Services
Figure 4b: Value added of sector by region (%)
South-West North-West Dhaka Chittagong
2.6%
91.7%
5.7%
Figure 5a: Export share by sectors
Agriculture Manufacturing Service
0%
10%
20%
30%
40%
50%
60%
70%
80%
90%
100%
Agriculture Manufacturing Service
Figure 5b: Export share of sector by region (%)
South-West North-West Dhaka Chittagong

Promoting inclusive growth in Bangladesh through special economic zones
11 | EDIG Research Paper Three
strategy, which includes, among other things, giving priority to these regions while setting up SEZs. The most recently published poverty data (for 2016), showing a much slower pace of poverty reduction for the west, seem to vindicate the 7FYP emphasis on addressing regional disparities with targeted interventions.

Promoting inclusive growth in Bangladesh through special economic zones
12 | EDIG Research Paper Three
4. BANGLADESH SEZS AND INCLUSIVE DEVELOPMENT
4.1. SEZs: development in progress
One of the more ambitious development programmes of Bangladesh is to establish 100 SEZs to create 10 million jobs and to generate an additional $40 billion worth of export earnings by 2030. The Bangladesh Economic Zones Authority (BEZA) is working to develop these zones on an estimated 30,000 ha of land across the country. In addition to zone development, some ambitious functions of BEZA listed are to create opportunities for employment through establishing backward linkage industries within or outside economic zones and to establish due rights of workers and ensure their welfare, among others. It is not clear how these will be fulfilled, but it is also too early to evaluate these roles. One salient feature of these SEZs is that they will be open to host both export-oriented and non-export firms within the same enclaves. This contrasts with the EPZs, which are reserved for export-oriented firms only. The overall impact of the EPZs on the national economy is considered to have been limited, partly because they have not helped develop local entrepreneurs (BEZA, 2017). Coexistence of different types of firms can theoretically exert positive spillover effects arising from export-oriented ones (e.g. in terms of diffusion of improved technologies, better management practices and higher compliance of labour and product standards) helping local firms improve their productivity. BEZA is working on several types of economic zones:
• public–private partnership (PPP) economic zones that are established jointly
• private economic zones, developed individually or jointly by local, non-resident Bangladeshis or foreign investor groups
• government economic zones, established and owned by GoB
• government-to-government (G2G) zones, established by governments of various foreign countries in partnership with GoB
• specialised economic zones, exclusively for certain kinds of specialised sectors/industries (e.g. tourism, agro-processing)
• economic zones in partnership with other GoB authorities or organisations (e.g. the Bangladesh Export Processing Zone Authority (BEPZA).
BEZA is to provide an elaborate incentive package for firms located in SEZs as well as to the developers of the economic zone sites. Benefits to the zone developers range from income tax exemptions to reductions in capital expenditure. Firms investing within the zones will be entitled to such benefits as income tax exemptions, no restrictions on the proportion of investment generated by foreign sources (FDI), duty-free imports of raw materials for production, etc.
4.2. The issue of regional inclusivity
It is evident from the BEZA policy documents that there is some recognition of the need to use SEZs to promote development in disadvantaged regions. BEZA’s annual report for 2016 states that it aims to establish zones in all potential areas ‘including backward and underdeveloped regions’ (p. 19).

Promoting inclusive growth in Bangladesh through special economic zones
13 | EDIG Research Paper Three
However, how those regions will be identified has not been elaborated. A close look at the map of Bangladesh indicating the locations of all economic zones makes it clear that the majority of SEZs are in the Greater Dhaka and Chittagong regions (Map A.2.1 in the Annex). Indeed, of the 79 zones that have been officially identified, only 20 (about 25%) are in north-west and south-west Bangladesh. It may appear quite striking that, except for 2 (Sirajganj, and Famcam in Bagerhat), all other private economic zones (18) are in Dhaka and its surrounding districts. This is to be expected, given the earlier discussion of agglomeration economies and industrial concentration. While further infrastructural work must be completed to enable the actual industrial operations to take place, private sector zones in terms of physical development work seem to be way ahead of government-owned ones. Given the information currently available, the progress of SEZ development can be evaluated using the status on four key milestones: 1) land acquisition; 2) preparation stages for feasibility study; 3) infrastructural development; and 4) investment in production units. SANEM (2017) has constructed an SEZ development index using these criteria. This gives equal weight to each of the four milestones, which are further assessed on their progress.13 As of October 2017, the process of land acquisition had either been completed or was ongoing in only 38 zones (48%); feasibility studies had been completed for 19 (24%), with some progress made in another 12; infrastructure development work could not be completed in any of the zones; and, finally, some kind of investment activity at the production level had taken place in 14 zones (18%). Based on the very limited progress that has been made so far, private sector zones appear to have fared better, as the constructed index makes evident (Figure 6). Of the zones to be located in the north-west and south-west regions, only Mongla and Kushtia have seen some work to kick off development of the zones. Both are being developed as part of the G2G initiative for the zones to be reserved for Indian investors.14 The 18 other zones in north-west and south-west Bangladesh, along with another 21 zones in Dhaka and Chittagong regions, have seen virtually no on-the-ground SEZ-related work. Clearly, the overall work on delivering the proposed economic zones for industrial production is at a very early stage. Nevertheless, it seems that development in the north-west and south-west regions is slower. The combined average SEZ index value for the north-west and the south-west is computed as 0.088 in comparison with 0.275 for the rest of Bangladesh, with the difference between the scores being statistically significant at less than 1% level. The estimated probability of any work not being initiated (where the index value is 0) in the north-west and south-west regions compared with other regions is 20 percentage points higher but is significant only at 12% level.15
13 While the weights are arbitrary, some further subjective judgements are used in assigning scores to assess progress on certain milestones.
14 During the field visit under the study, no infrastructural development work could be found in Kushtia, and land acquisition is also not yet complete. For Mongla, land acquisition is complete and some development work is underway.
15 This is based on a probit model that we employed to explain whether the SEZ index value is 0 or any other value, with the help of per capita income of the districts where these SEZs are located and a dummy variable indicating whether the SEZ is located in one of the districts in the north-west and the south-west or in the rest of the country.

Promoting inclusive growth in Bangladesh through special economic zones
14 | EDIG Research Paper Three
Figure 6: Index of progress of SEZs
Note: A score of 1 indicates completion of development work, while 0 indicates least progress.
Source: SANEM (2017) and authors’ calculations.

Promoting inclusive growth in Bangladesh through special economic zones
15 | EDIG Research Paper Three
4.3. Experimental policy simulations
Although the SEZ development work is at an early stage, it will be useful to undertake some experimental policy simulations to consider the likely impact of new economic zones in promoting regional inclusivity. The simulation designs are as follows: Simulation scenario (1) – current production structure-led export growth of SEZs: As one of the more concretely defined objectives of SEZs is to achieve $40 billion in additional exports by 2030, the first simulation assesses the impact assuming the new exports will follow the current regional production patterns (as discussed in Section 3.2). To simplify the simulation design, we assume these additional exports will comprise ready-made garments (RMG) and leather only in the ratio of 3:1.16 Simulation scenario (2) – export growth with increased participation of the north-west and south-west regions: As shown above, under the current production structure of the country, less than 8% of manufacturing exports is generated from the relatively backward regions. Therefore, growth of exports while maintaining the existing regional distribution of outputs would result in limited activities for these regions. This simulation considers a scenario in which half of the additional policy-targeted export of $40 billion can be generated from the north-west and south-west regions (i.e. $20 billion in additional exports will be coming from the north-west and south-west as a contribution towards the $40 billion export target).
The impact of additional exports depends partly on the sectors that will experience increased production. Consideration of backward linkages for various activities associated with different regions, as estimated from the constructed regional SAM and presented in Annex 4, can be a way of identifying sectors for maximum growth and development impact. However, since the policy target is defined in terms of increased exports, not all sectors will be suitable for generating an export response. Activities associated with jute production and rice milling seem to have the highest linkage effects, although the export prospects of these sectors are very low. To make the simulation realistic, only the additional export response from the RMG and leather sectors is considered. 17 The strong linkage effects of the leather sector and the known employment generation potential of RMG make them high-impact exporting activities for the disadvantaged regions considered here. Simulation scenario (3) – export boosts to the agro-processing sector in the north-west and south-west regions: The north-west and south-west parts of Bangladesh are widely seen to be more suited to agricultural production than to manufacturing. In this scenario, the impact of generating $20 billion worth of output (exports) from SEZs in the north-west and south-west Bangladesh is considered.
Simulation scenario (4) – SEZ-led investment push: Development of SEZs involves huge investment in terms of infrastructural development as well as investment in actual industrial units. Currently there is no estimate of expected investment push due to SEZ development. We undertake a simplified simulation design in which total investment doubles in north-west and south-west regions. Before discussing the results, it is worth pointing out that caution must be exercised before making direct comparisons amongst the simulations. Simulations 1 and 2 have the same level of increased outputs varied by regions and thus comparative assessments of the results from these two scenarios would be of interest. Simulations 3 and 4 involve different types of shocks associated with different levels of output and
16 This assumption is not unrealistic given the significance of RMG in Bangladesh’s total exports. Leather and footwear currently has a share of less than 4%.
17 The leather sector is found to have the second-highest linkage (multiplier) effects (after jute), while the RMG linkage effects are among the highest for the manufacturing export-oriented sectors.

Promoting inclusive growth in Bangladesh through special economic zones
16 | EDIG Research Paper Three
investment injections. As can be inferred from the above, overall economic activities in simulations 1 and 2 are raised by $40 billion, while for Simulation 3 the total incremental output is $20 billion. Simulation 4 involves raising the combined investment of north-west and south-west regions by $8 billion.
The simulations are implemented utilising the regional SAM constructed above. Table 2 summarises the results. Under the first simulation, an overwhelming majority of export production takes place in the Dhaka and Chittagong regions. However, because of backward and forward linkages as captured through the SAM, manufacturing GDPs of the north-west and the south-west also increase, by about 4% and 3%, respectively. Overall, manufacturing growth in the country is more than 9%, driven by higher industrial activities elsewhere. Annex Table A5.1 shows that the $40 billion in additional exports with the current structure of production will lead to more that 10% manufacturing growth for the Greater Dhaka region, while the corresponding figure for Greater Chittagong will be 9.7%. Bangladesh’s aggregate GDP rises by 5%, with real output growth from the north-west and south-west almost identical, at just above 3%.
Table 2: Summary results of simulations Manufacturing
GDP (% change)
GDP (% change)
Poverty (headcount
ratio) (percentage
point change from
2010 national
estimates)
Employment change
(millions)
Male employment
change (millions)
Female employment
change (millions)
Simulation 1: Additional SEZ exports by $40 billion by 2030 under the existing production structure by region
North-west 3.93 3.37 1.61 0.62 0.44 0.18
South-west 2.98 3.23 3.21 0.42 0.29 0.13
All Bangladesh 9.23 4.93 4.20 3.4 2.3 1.1
Simulation 2: Impact of generating additional $20 billion SEZ exports from north-west and south-west Bangladesh
North-west 15.4 4.9 3.0 0.75 0.50 0.25
South-west 20.3 5.6 5.6 0.53 0.35 0.18
All Bangladesh 9.3 5.0 4.2 3.4 2.3 1.10
Simulation 3: Increased agro-processing SEZ outputs from north-west and south-west regions
North-west 10.02 3.09 1.51 0.80 0.65 0.15
South-west 8.25 2.52 3.85 0.51 0.39 0.12
All Bangladesh 2.14 1.65 1.55 2.2 1.80 0.40
Simulation 4: Doubling of investment owing to SEZ development
North-west 1.55 2.68 1.21 0.43 0.31 0.12
South-west 1.35 2.61 2.98 0.32 0.22 0.10
All Bangladesh 1.18 2.35 1.71 1.75 1.53 0.32
Note: For each simulation, the change in manufacturing GDP and total GDP are estimated over a 12-year period.
Export expansion within the existing structure helps reduce poverty incidence. The headcount ratio in the north-west falls by 1.6 percentage points (from the base poverty incidence rate estimated for the 2010 BBS survey) while the fall in the same for the south-west is 3.2 percentage points. Comparing the two regions, higher output growth is causing poverty incidence to decline at a faster pace in the south-west. A close look at the household-level data also suggests that poor households in north-west Bangladesh are likely to be further below the poverty line income (compared with other regions). Therefore, a much bigger income/growth effect is needed to enable an equal dent on poverty incidence.

Promoting inclusive growth in Bangladesh through special economic zones
17 | EDIG Research Paper Three
This scenario is likely to generate employment opportunities of 3.4 million, of which just over 1 million will be in the north-west and south-west regions. Overall, there will be an additional 1.1 million jobs created for women, with 0.31 million for women workers in the eastern part of the country. In simulation 2, we change the regional activity structure so that much higher levels of RMG and leather export production take place in the north-west and the south-west. Currently, districts of the north-west have very limited RMG and no leather exports, while the reverse is true for the south-west. An additional $20 billion in export production of garments and leather from the west leads to massive growth in manufacturing outputs in these two regions – by more than 15% and 20%, respectively – partly because of the very small existing base. Employment generation at the national level increases to 3.4 million, as found in simulation 1. The north-west and south-west will see additional jobs numbering 1.28 million, of which 0.43 million will be for women. The impact on poverty under this scenario is quite impressive: the poverty headcount ratio for the north-west declines 3 percentage points while the corresponding figure for the south-west is 5.6 percentage points.
Figure 7: Impact on employment generation (million)
Source: Authors’ simulations.
Figure 8: Poverty reduction under different scenarios (percentage points)
Source: Authors’ simulations.
0
0.5
1
1.5
2
2.5
3
3.5
Male Female Total Male Female Total Male Female Total Male Female Total
Simulation 1 Simulation 2 Simulation 3 Simulation 4
Em
plo
ym
en
t (m
illi
on
)
North-west South-west All Bangladesh
0
1
2
3
4
5
6
Simulation 1 Simulation 2 Simulation 3 Simulation 4
North-west South-west All Bangladesh

Promoting inclusive growth in Bangladesh through special economic zones
18 | EDIG Research Paper Three
As indicated above, we could consider export expansion from other sectors. Further experiments showed that, if a similar magnitude of increased production took place in jute and wood products, the north-west and south-west would experience greater declines in poverty – by an additional 1.14 and 0.95 percentage points, respectively. This is because both these sectors have higher linkage effects for the two regions. Under simulation 3, when $20 billion worth of positive export demand shock is generated for the agro-processing sector in the north-west and south-west, the overall growth impact for the country turns out to be 1.65% per year. This results in employment generation of 2.2 million: 1.31 million jobs for the north-west and south-west, with 0.27 million for women. This impact is quite strong considering that the production enhancement comes from the two backward regions alone and that their combined relative significance in the overall economy is quite small. The related sectors, including livestock, fisheries, rice milling and food processing, have relatively large linkages, as Annex 4 shows. It needs to be mentioned here that results obtained under simulation 3 should not be directly compared with simulation 2, in which an injection of $20 billion worth of manufacturing exports in the eastern part of the country was, unlike in this case, accompanied by an identical rise in the amount of exports in other parts of Bangladesh. Finally, if SEZs lead to doubling investment, national GDP rises by 2.35% per year, with employment generation of 1.75 million, leading to poverty reduction by 1.71 percentage points. Since this scenario is implemented keeping the production structure unchanged, we find relatively weak manufacturing growth in the north-west and south-west. The results show a 1.71 percentage point decline in poverty as a result of this investment push, with a significantly higher poverty response coming from the south-west.
Figure 9: Reduction in poverty gap and severity (%)
Source: Authors’ simulations
Poverty reduction in the above cases has been considered only in terms of headcount ratios, following the policy focus on the proportion of the population living below the poverty line. However, the simulation analyses can also be used to quantify the impact of other measures of poverty incidence, such as the poverty gap ratio and the poverty severity index, as shown in Figure 9. Under simulations 1 and 2, the poverty gap and the severity index fall, but the rates of reduction are higher for simulation 2. This is again because, as poverty is more concentrated in the north-west
0
0.2
0.4
0.6
0.8
1
1.2
1.4
Poverty gap Severity Poverty gap Severity Poverty gap Severity Poverty gap Severity
Simulation 1 Simulation 2 Simulation 3 Simulation 4
North-west South-west Bangladesh
Promoting inclusive growth in Bangladesh through special economic zones
19 | EDIG Research Paper Three
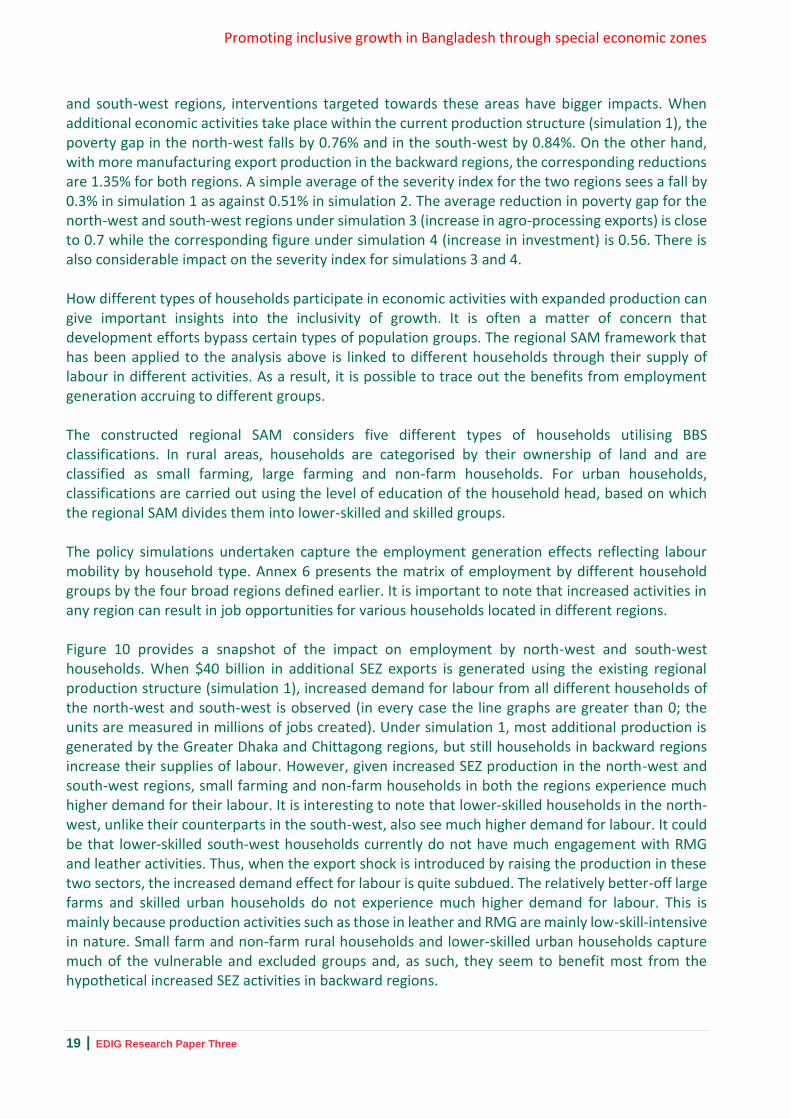
and south-west regions, interventions targeted towards these areas have bigger impacts. When additional economic activities take place within the current production structure (simulation 1), the poverty gap in the north-west falls by 0.76% and in the south-west by 0.84%. On the other hand, with more manufacturing export production in the backward regions, the corresponding reductions are 1.35% for both regions. A simple average of the severity index for the two regions sees a fall by 0.3% in simulation 1 as against 0.51% in simulation 2. The average reduction in poverty gap for the north-west and south-west regions under simulation 3 (increase in agro-processing exports) is close to 0.7 while the corresponding figure under simulation 4 (increase in investment) is 0.56. There is also considerable impact on the severity index for simulations 3 and 4. How different types of households participate in economic activities with expanded production can give important insights into the inclusivity of growth. It is often a matter of concern that development efforts bypass certain types of population groups. The regional SAM framework that has been applied to the analysis above is linked to different households through their supply of labour in different activities. As a result, it is possible to trace out the benefits from employment generation accruing to different groups. The constructed regional SAM considers five different types of households utilising BBS classifications. In rural areas, households are categorised by their ownership of land and are classified as small farming, large farming and non-farm households. For urban households, classifications are carried out using the level of education of the household head, based on which the regional SAM divides them into lower-skilled and skilled groups. The policy simulations undertaken capture the employment generation effects reflecting labour mobility by household type. Annex 6 presents the matrix of employment by different household groups by the four broad regions defined earlier. It is important to note that increased activities in any region can result in job opportunities for various households located in different regions. Figure 10 provides a snapshot of the impact on employment by north-west and south-west households. When $40 billion in additional SEZ exports is generated using the existing regional production structure (simulation 1), increased demand for labour from all different households of the north-west and south-west is observed (in every case the line graphs are greater than 0; the units are measured in millions of jobs created). Under simulation 1, most additional production is generated by the Greater Dhaka and Chittagong regions, but still households in backward regions increase their supplies of labour. However, given increased SEZ production in the north-west and south-west regions, small farming and non-farm households in both the regions experience much higher demand for their labour. It is interesting to note that lower-skilled households in the north-west, unlike their counterparts in the south-west, also see much higher demand for labour. It could be that lower-skilled south-west households currently do not have much engagement with RMG and leather activities. Thus, when the export shock is introduced by raising the production in these two sectors, the increased demand effect for labour is quite subdued. The relatively better-off large farms and skilled urban households do not experience much higher demand for labour. This is mainly because production activities such as those in leather and RMG are mainly low-skill-intensive in nature. Small farm and non-farm rural households and lower-skilled urban households capture much of the vulnerable and excluded groups and, as such, they seem to benefit most from the hypothetical increased SEZ activities in backward regions.

Promoting inclusive growth in Bangladesh through special economic zones
20 | EDIG Research Paper Three
Figure 10: Change in employment by different household types (million)
Note: The upper panel shows labour supplies by north-west households to different regions, while the lower panel shows the same for south-west households. The numbers corresponding to Bangladesh indicate the total increase in employment of a particular regional household group (i.e. either north-west or south-west) associated with one of five types of households defined. Source: Authors’ simulations.
Although policy-induced activities can benefit backward regions, is the additional investment worth considering, given its opportunity costs and impact on overall growth? Since the SAM framework captures economy-wide effects, some relevant insights can be generated. For the scenario presented in simulation 1, total investment for simplicity can be assumed to be $40 billion. The resultant overall impact in terms of changes in GDP is then estimated to be $62 billion. For simulation 2 as well, the same level of investment ($40 billion) is considered, in which case the total comparable impact is estimated at $65 billion. Even with a decent discount rate of 6%–10%, both the aggregate income effects represent a positive net present value (Figure 11). The benefit–cost ratios associated with simulations 3 and 4 are also higher than 1.18
18 One issue in the cost-benefit analysis is whether lagging regions will require additional incentives to attract SEZ investment – a point that has been argued in a later section of this paper. The SAM-based simulation results presented here have not captured the impact of higher incentives for firms located in north-west and south-west regions. It is very difficult to know a priori the size of additional incentives. Currently, the total incentive for the overall exports of Bangladesh ($35 billion in 2016/17) is about $450 million (Tk 40 billion). Even if we assume that the same amount of incentives would be required to generate $20 billion exports from north-west and south-west regions, the conclusion from the cost-benefit analysis presented here would remain unchanged (as the resultant increase in GDP under simulation 2 is $3 billion higher).
0.00
0.05
0.10
0.15
0.20
0.25
Sou
th
No
rth
Dh
aka
Ch
itta
gon
g
Ban
glad
esh
Sou
th
No
rth
Dh
aka
Ch
itta
gon
g
Ban
glad
esh
Sou
th
No
rth
Dh
aka
Ch
itta
gon
g
Ban
glad
esh
Sou
th
No
rth
Dh
aka
Ch
itta
gon
g
Ban
glad
esh
Sou
th
No
rth
Dh
aka
Ch
itta
gon
g
Ban
glad
esh
Small farm Large farm Non-farm Lower skilled Skilled
North-west households
Sim 1: Export growth with existing regional production structure
Sim 2: Export growth with increased participation of north and south
0.00
0.05
0.10
0.15
0.20
0.25
Sou
th
No
rth
Dh
aka
Ch
itta
gon
g
Ban
glad
esh
Sou
th
No
rth
Dh
aka
Ch
itta
gon
g
Ban
glad
esh
Sou
th
No
rth
Dh
aka
Ch
itta
gon
g
Ban
glad
esh
Sou
th
No
rth
Dh
aka
Ch
itta
gon
g
Ban
glad
esh
Sou
th
No
rth
Dh
aka
Ch
itta
gon
g
Ban
glad
esh
Small farm Large farm Non-farm Lower skilled Skilled
South-west households

Promoting inclusive growth in Bangladesh through special economic zones
21 | EDIG Research Paper Three
Figure 11: Benefit–cost ratio (%)
Source: Authors’ estimation.
Following a more realistic path, simulation 1 scenario outcomes can be regarded as opportunity costs for simulation 2. Since no changes in the production structure are allowed under simulation 1, any additional export production in Bangladesh will generate the rate of return that is being estimated from the SAM. When the regional production structure is changed, the return is somewhat higher (by about $3 billion). Therefore, the analysis seems to suggest no growth-compromising effect of SEZ investment in the north-west and south-west regions, while the impact on relatively poor and low-skilled households is positive (through job creation) and more prominent. Of course, we have to make assumptions that no geographical or other disadvantages are associated with new investments.19 It is important to point out that policy options do not necessarily have to be a choice between the two scenarios in simulations 1 and 2. Rather, a combination of the choices available could be feasible – and more appropriate. For example, in addressing regional inclusivity, a mix of simulations 2, 3 and 4 would be most practical. The above results appear to be quite encouraging about the potential impact SEZs can have on overall output, employment generation and poverty reduction, but it is also important to consider that the effective implementation of policy choices is going to be the predeterminant of positive outcomes.
4.4. Lessons from Bangladesh’s EPZs
As indicated above, SEZs are a newer generation of earlier EPZs. Although exclusively reserved for export-oriented firms, EPZs provide some insights that could be useful for SEZs, particularly while considering the issue of regional inclusivity. The combined exports of eight EPZs, measured at $6.7 billion in 2016, currently represent about 20% of the country’s total merchandise exports. Since their inception, the EPZs have attracted a combined total cumulative investment of about $4 billion, providing employment for more than 450,000 people. Three of the EPZs, Uttara (in Syedpur district), Ishwardi (in Pabna district) and Mongla (in Bagerhat district), are located in north-west and south-west Bangladesh. It is quite striking that in terms of investment attracted and employment generated, performance of these three is relatively weak. Particularly, the zone in Mongla, which has easy access to a seaport (also in Mongla), has the least investment and the smallest workforce employed. This experience of EPZs would suggest that
19 The relevant discussions are in the next section of this paper.
1.55 1.62
1.20
1.431.29 1.35
1.07 1.14
0.00
0.50
1.00
1.50
2.00
1 2 3 4
Series1 Series2

Promoting inclusive growth in Bangladesh through special economic zones
22 | EDIG Research Paper Three
setting up zones might not be enough to secure investments and create employment opportunities, especially in the north-west and south-west parts of the country. There are likely to be other factors that need to be taken into consideration.
Table 3: EPZs – performance indicators Location Year Area
(acres) Investment (cumulative, $ millions)
Exports (cumulative, $ millions)
Employment Share in EPZ investment
Share in EPZ
exports (%)
Share in EPZ employment
Chittagong 1983 453 1466 24222 196,969 36.67 45.86 43.42
Karnaphuli 2006 209 433 2928 63,118 10.83 5.54 13.91
Savar 1993 361 1222 20484 89,968 30.57 38.79 19.83
Adamjee 2006 238 371 2251 46,459 9.28 4.26 10.24
Comilla 2000 267 255 1681 24,343 6.38 3.18 5.37
Uttara 2001 212 114 355 23,127 2.85 0.67 5.10
Ishwardi 2001 308 96 454 8055 2.40 0.86 1.78
Mongla 1999 255 41 439 1613 1.03 0.83 0.36
All EPZs - 2,303 3998 52814 453,652 100.0 100.0 100.0
Source: Compiled from BEPZA official documents.

Promoting inclusive growth in Bangladesh through special economic zones
23 | EDIG Research Paper Three
5. SEZS FOR REGIONAL INCLUSIVITY: POLICY RECOMMENDATIONS While SEZs can be an appealing policy tool for promoting regional development, there are several factors to take into serious consideration to make it work effectively. Some of these factors are related to local conditions and connectivity, while others correspond to a complex overall national policy framework that requires fundamental changes. Along with this, as in all other development programmes, there are challenges related to how institutions function in ensuring inclusivity along with effective utilisation of resources. We highlight several issues below for promoting inclusive development through SEZs.
5.1. Developing a clear SEZ development strategy to address regional inclusivity
While BEZA ‘aims to establish economic zones in all potential areas of Bangladesh including backward and underdeveloped regions’ (BEZA, 2016, p. 16), currently it is not clear if any priority has been attached to lagging regions. The alignment of vision and action on the ground will require identifying lagging districts – which should not be difficult, given the directions provided in the 7FYP – and prioritising SEZ development work in the relevant regions. The 7FYP provides enormous leverage for a more efficient and responsive SEZ development programme for backward regions. The zone development work programme needs to reflect the fact that the national development framework aims to use SEZs as a policy tool to address regional disparities.
Addressing regional disparities may not be confined merely to dealing with the east–west divide. Even within the relatively better-off divisions/districts, there can be economically deprived regions. SEZs can also target these, under a clear strategy. It is possible that developing SEZs in certain lagging regions will not be economically viable, in which case other avenues, for example improved connectivity and easier movement of labour, can help these regions benefit from nearby zone development. Finally, while BEZA’s ambition is to generate $40 billion in additional exports from SEZs, there is no indication of how much of this might come from SEZs in lagging districts. Incorporation of such a target would emphasise the role of SEZs as a policy tool to advance development in lagging regions.
Box 1: Development of lagging regions – suggested measures in the 7FYP For the development of lagging regions, the 7FYP provides a strategy, which includes, among other things, creation of a Lagging Region Fund; narrowing the infrastructure gap; creating manufacturing opportunities in lagging districts; expanding agriculture and rural economic activities; creating opportunities for international migration; and building up resilience to adverse environmental and climate change shocks. It suggests that regions like Rangpur, Rajshahi, Khulna and Barisal – the divisions comprising the north-west and south-west regions – may be preferred destinations for investments from the proposed Lagging Region Fund. For infrastructure development, the 7FYP suggests an improved transport system between the better-off districts (i.e. Dhaka and Chittagong) and lagging districts, increased utilisation of Mongla port, attaching priority to supplying electricity, and expanded storage facilities for agricultural and fisheries in lagging districts. Furthermore, the 7FYP states that ‘lagging regions would get priority while setting up special economic zones. Such zones should be established in lagging districts with all adequate infrastructural facilities so that entrepreneurs can get benefit from economies of scale’ (GED, 2015, p. 96).

Promoting inclusive growth in Bangladesh through special economic zones
24 | EDIG Research Paper Three
5.2. An adequate and effective incentive mechanism
While it is quite natural for policy planners to use SEZs as regional development tools by targeting remote or backward areas, particularly where the perceived needs for job creation are huge, the experiences of many countries show that the investor response to these initiatives is often less than optimistic.20 Attracting foreign firms to relatively backward regions can be particularly challenging. It is standard practice for countries to offer elaborate fiscal and other incentives to attract investment in economic zones. These help firms with their cost competitiveness and profitability. Several key factors inducing firms to decide to invest have been identified (ADB, 2015): fiscal and trade policy-related schemes, such as duty-free imports of raw materials and machinery; non-fiscal incentives, including an investor-friendly customs regime and relaxed labour laws; cheap factory sites and subsidised land rents, factory space and utility charges; abundant low-wage labour supplies; strategic location of zones, providing easy access to ports and domestic connectivity for internal markets; and production to take place in economic enclaves that are insulated from dysfunctional institutions elsewhere. Bangladesh aims to provide all these incentives. To offer a meaningful pull factor, economic zones must present incentives that are significantly better and do not exist elsewhere. This was the case when establishing EPZs in Bangladesh. For the upcoming zones, BEZA is offering incentives that are, in many respects, if not all, comparable with those available in EPZs. Moreover, these measures are going to be the same across SEZs. One issue for consideration thus relates to whether incentives that are available elsewhere will be enough to make backward or lagging regions attractive places for firms. The perceived costs of doing business from these regions are much higher, and investors need to be convinced that incentive margins will help at least offset the extra costs of being in relatively remote regions. Those using SEZs as a policy tool to address regional disparities should consider this issue seriously. Innovative incentive design schemes, along with some genuinely additional fiscal and/or non-fiscal benefits will have to be found for zones in backward regions. Given the initial socio-economic conditions and investment climate, marginal improvements to the existing incentive package will not be enough. It may be an option to entice local firms first. Their success in developing a critical mass in the production and supply network and their overall profitability can then attract FDI enterprises. Meanwhile, country experiences suggest that spatially targeted incentives (investment subsidies, tax rebates, location regulations, etc.) are more likely to be effective when they reinforce geographical advantages. In the case of north-east Bangladesh, for instance, SEZs to promote agro-processing industry can be a good strategy and should be pursued alongside complementary measures (e.g. more generous export promotional measures). In developing SEZs in backward regions, some opportunities are also available in terms of collaboration with foreign governments. For example, two SEZs in north-west and south-west Bangladesh – namely Bheramara and Mongla, respectively – are being developed for Indian
20 For example, Engman (2011) shows that Honduras initially sought to promote geographic diversification by selectively expanding the zone policy to targeted regions, including the capital Tegucigalpa. But this had little success, with the government slowly abandoning the regional development approach. Eventually, it permitted investors to choose to locate where it best suited them. The market response was to agglomerate around San Pedro Sula.

Promoting inclusive growth in Bangladesh through special economic zones
25 | EDIG Research Paper Three
investors. The Government of India has offered credit facilities to develop these two sites. Rapid completion of infrastructural development work of these SEZs should be given priority so that actual industrial production can take place within the shortest possible period. Similar collaboration has been established with the Chinese and Japanese governments for industrial zones in Chittagong and Narayanganj, respectively.
5.3. Coordination between different support regimes and national policy objectives
Coordination between different policy regimes should be an important consideration in the presence of a plethora of industry support systems. As mentioned above, Bangladesh offers significant policy incentives for EPZs, which will be closely matched by SEZs. The latter will house both export-oriented and non-exporting firms. Firms targeting the domestic market only for the first time are going to access wide-ranging benefits because of their location within SEZs. If there are any significant differences between the policy incentives available for the same production within and outside SEZs, relocation of firms is likely as a result of purely rent-seeking objectives, rather than to promote overall industrial growth. Coordination is also needed to ensure the efficient delivery of incentive packages and support systems as declared under various regimes of EPZs and SEZs, the Bangladesh Small and Cottage Industries Corporation, export policy and industrial policy. Although various one-stop services are offered on-site, the need for support in certain areas will go beyond the scope and mandate of SEZs. These include, for example, accessing cash assistance for exports, supporting product development and standards, and exporting promotional measures abroad. Experiences of other countries seem to suggest that while one-stop services are intended to showcase the capacity of SEZs to deliver streamlined and efficient services, their operations demonstrate the challenge of coordination. In particular, the one-stop system has been found not to be able to align incentives and practices across agencies with highly disparate institutional objectives (Farole, 2011). It is also important to recognise that Bangladesh is striving to strike a delicate balance between industrial growth that takes advantage of the growing domestic economy and an export-led growth strategy.21 Therefore, one key policy issue, as highlighted in the 7FYP, is that relative incentives for domestic sales and exports must not be so skewed as to discourage production for exports. A successful export-led growth strategy is generally characterised by an open economy. In contrast, Bangladesh’s impressive growth has been accompanied by a much higher level of tariff protection than all other successful globalisers have seen, including China, India, Indonesia, Malaysia, the Philippines and Vietnam (Razzaque, 2017). Indeed, the analysis presented in the 7FYP shows that the use of tariffs and additional import taxes (called ‘para-tariffs’) on imports has distorted the incentive structure, which discourages export production. SEZ incentives can exacerbate this situation. In particular, if SEZs in lagging regions are going to be dominated by firms aiming only for
21 The National Industrial Policy 2016 specifies both objectives – to create entrepreneurs by protecting, promoting and developing the interests of local industries (2.4.2) and to set up export-oriented industries and achieve export diversification (Ministry of Industries, 2016).

Promoting inclusive growth in Bangladesh through special economic zones
26 | EDIG Research Paper Three
local sales, the policy incentives could result in helping inefficient production units flourish, with adverse welfare consequences.22
5.4. Using agglomeration economies and developing a few SEZ-based growth centres focusing on regional inclusivity
The objective of regional inclusivity can perhaps be most effectively achieved by creating and making use of agglomeration economies. These are the benefits that firms obtain by locating near each other. As more related firms cluster together, the cost of production of the industry is likely to decline because of externality effects and the use of economies of scale arising as a result of the increased availability of suppliers, service providers and customers. Large nearby urban centres can facilitate the development of such agglomeration effects.23 SEZs in lagging regions could suffer from lack of critical mass in attracting firms and investments to create enough positive spillover effects. While agglomeration economies often form because of locational or inherent advantages that attract more firms, regional inclusivity should not build on any unrealistic assessment of the potential for industrial growth and competitiveness and the advantages of host cities/regions. Developing too many economic zones can also undermine the benefits of economies of scale based on sufficiently large urban centres. In India, the SEZ policy has been criticised on the grounds that permission has been granted for far too many SEZs, which either are suboptimally sized or are adjuncts to mega cities, which is argued to magnify the diseconomies already associated with the large size of these cities (Mitra, 2007). There may be a need to carefully assess the development of all SEZs simultaneously. Under a longer time frame, Bangladesh would perhaps need all 100 SEZs, as policy planners want to preserve precious arable land for the country’s very large population and deal with unplanned
22 The SEZ policies will allow firms to access duty-free raw materials. On the other hand, in recent times, Bangladesh has not made any progress on rationalising its tariff structures. The increased use of para-tariffs on final consumers’ goods vis-à-vis a reduction in duties on imported inputs for the import-competing sector actually raises the effective rate of protection. 23 Auty (2011) points out that country experiences in capturing agglomeration economies will differ. For example, few economies, apart from Nigeria and South Africa, would be able to grow cities of a sufficient size and economic structure to exploit such benefits. In contrast, the size of the Chinese market quickly allowed it to promote its own agglomerations. The author suggests the smaller economies can benefit from localisation economies if clusters of same-firm activities emerge. Localisation economies are more specialised than agglomeration economies and enhance the efficiency of firms by achieving the modest thresholds required to sustain local pools of specialised labour and services and specific production inputs.
Box 2: Mirsarai-Feni industrial city The largest SEZ in Bangladesh will comprise Mirsarai upazila of Chittagong district and Sonagazi of Feni district on a combined area of 30,000 acres. This industrial park is 10 km away from the Dhaka–Chittagong highway and about 65 km away from Chittagong city. Mirsarai-Feni economic zone will be the first self-contained industrial city in Bangladesh, containing an airport, a sea port, a residential area, tourist parks and a university. About 15 national and international firms have already applied for land allotments in the zone, to set up such industrial plants as steel mills, power plants, food processing units, and liquefied petroleum gas production plants, with a combined investment proposal of over $6 billion.
Promoting inclusive growth in Bangladesh through special economic zones
27 | EDIG Research Paper Three
industrialisation. In the immediate term, however, focusing on a few major SEZs in the lagging regions with the objective of generating agglomeration economies may be a more practical option. This could perhaps ensure efficient use of financial resources and time, as zone development processes can be quite lengthy. The Chinese experience as highlighted above also shows targeted interventions in selected regions with a big investment push. In Bangladesh, Mirsarai-Feni industrial city (see Box 2) could closely resemble the kind of potential growth centre needed for the north-west and south-west regions to generate a critical mass to exploit agglomeration economies.
5.5. Developing SEZs in lagging regions as part of economic corridors
If SEZs in lagging regions are well connected to various economic corridors, this will ensure their integration into the rest of the economy and potentially into greater regional economies. As most cross-country studies suggest the location of zones is a critical determinant of success, lagging regions SEZs must overcome or mitigate any disadvantages associated with their geographical setting. As many developing countries are now increasingly embarking on economic corridor development, SEZs to promote regional inclusivity should be linked to these initiatives. Economic corridors link economic activities to increase their density within a given area and run along a region or across regions linking centres of economic activity. They are developed to upgrade and align physical infrastructure in a manner that maximises the benefits of urban agglomerations, facilitates the seamless movement of goods and people within the domestic market, and links with regional and global supply chains. They are characterised by trade and transport linkages, often serviced by a multimodal transport network. An economic corridor is envisaged in Bangladesh running from the south-west region of Bangladesh (Khulna division) to the north-east region of Bangladesh (Sylhet division) via Dhaka (PwC, 2017). This could help integrate some of the south-west SEZs with more productive and leading SEZs, particularly in Dhaka. In addition, Bangladesh is pursuing transport connectivity with many Asian countries under various regional initiatives, including the Asian Highway, the South Asian Association for Regional Cooperation (SAARC) Highway Corridor (SHC), the South Asia Subregional Economic Cooperation (SASEC) Road Corridor, the Bangladesh–China–India–Myanmar Forum for Regional Cooperation (BCIM) Road Corridor and the Bay of Bengal Initiative for Multi-Sectoral Technical and Economic Cooperation (BIMSTEC) Road Corridor (MRTB, 2016). Currently under implementation, these corridors may prove to be strategic in linking SEZs in various lagging regions in the country (Box 3). If they help promote intra-regional trade, investment and movement of goods through land borders, some of the currently lagging regions in Bangladesh will be immensely benefited. Therefore, SEZs in these regions should have strong connectivity with these corridors.

Promoting inclusive growth in Bangladesh through special economic zones
28 | EDIG Research Paper Three
Box 3: Transport corridors under various regional initiatives
Under various initiatives, South and South-East Asian countries, including Bangladesh, are pursuing improved transport connectivity. These include, among others: Asian Highway: Originally conceived of in 1959 by the United Nations Commission for East Asia and the Pacific, this road network currently comprises about 144,630 km of roads passing through 32 countries. Under three highway routes, the total length of road that falls within Bangladesh is 1,771 km. SHC: Initiated under the SAARC Regional Multimodal Transport System, 10 SHCs have been recommended, of which 6 involve Bangladesh. SASEC Road Corridor: Members of SASEC agreed to establish 21 transport corridors, with 9 involving Bangladesh. The total length of these roads inside Bangladesh is 3,326 km. BCIM Economic Corridor: This is an initiative to establish a multimodal corridor that aims to cover 1.65 million km2, connecting Bangladesh, Myanmar and West Bengal in India through road, rail, water and air linkages. BIMSTEC Road Corridor: BIMSTEC, with the technical assistance of the Asian Development Bank (ADB), undertook a study on transport infrastructure and logistics. Based on the findings, the BIMSTEC ministers identified and endorsed 14 road corridors, 4 rail corridors, 2 inland waterway corridors, 11 maritime gateways and 15 aviator gateways. Out of 14 road corridors, 7 involve Bangladesh.

Promoting inclusive growth in Bangladesh through special economic zones
29 | EDIG Research Paper Three
5.6. Infrastructure (including energy)
The importance of appropriate, adequate and well-functioning infrastructure for SEZs cannot be overemphasised, and more so for those in lagging regions. Ensuring basic infrastructure facilities for a SEZ – that is water, power, telecommunications and transport – is often a daunting prospect, but if they are not available and reliable, investment is unlikely. Beyond the wage-based advantages of Bangladesh, the available fiscal and non-fiscal incentives may not even be seen as significant; conversely, the provision of serviced industrial land infrastructure and a relatively reliable supply of power are critical. There is evidence to suggest that on a global basis, infrastructure reliability has a significant impact on SEZ success, whereas incentives have had no measurable effect (Farole, 2011).24 For lagging regions, infrastructure needs in attracting investments are more challenging. The zones should be well connected to major urban centres and ports, and there must be a means of ensuring cost-effective transportation in an appropriately timely fashion. As discussed above, SEZs in lagging regions should be linked to national and regional economic corridors. Without the provision of elaborate infrastructure, SEZs in lagging regions will be considered a poor choice of location.
5.7. Ensuring fair access to SEZs
Ensuring fair access for entrepreneurs that have the genuine intention of carrying out industrial production is extremely important. Land is very scarce in Bangladesh, and serviced industrial plots are even scarcer. As SEZs offer a range of benefits, they are likely to attract applicants for many different reasons, including relocation for sheer rent-seeking objectives. Given the current situation, it is mostly micro, small and medium enterprises (MSMEs) that operate in lagging regions. Some of these are competitive and hold promise for further growth provided their costs of doing business are brought down with the help of, for example, the improved infrastructure and connectivity that SEZs offer. These enterprises are likely to be more labour-intensive than other large-scale operations. How their participation in SEZs can be encouraged and ensured is an issue to consider. BEZA’s policy to allot land involves the open advertisement and evaluation of applications. This should work in principle if the challenges of participation by MSMEs are recognised a priori. Formal procedures, including the required paperwork and well-laid-out business plans, can be barriers to otherwise efficient smaller enterprises. It is not clear how MSMEs will be supported to overcome such issues. Big firms and corporations often submit grand proposals to secure valuable industrial plots – even if their planned investments do not follow suit. This can act lead to limited access by smaller firms. Looking at the experience of developing countries, it is not unusual to find political economy factors determining access to economic zones. In a survey of reasons for the failure of SEZs in Africa, Farole and Moberg (2014) found that the most obvious example of destructive self-interest was when political economy factors were used to access the privileges that SEZs conferred, including access to
24 Farole (2011) also finds that some of the biggest challenges faced in African SEZs have resulted from failure to deliver on promises of world-class infrastructure, a quality investment environment, etc. This has in many cases owed to difficulties coordinating across the various government bureaucracies required to deliver on the complex package of infrastructure, regulations and services for SEZs. While such coordination is a function of authority, capacity and communications, it is ultimately shaped by the incentives of individual institutions, and of the individual bureaucrats working within them.

Promoting inclusive growth in Bangladesh through special economic zones
30 | EDIG Research Paper Three
cheap land and fiscal incentives. The authors also point out that SEZs around the world are rife with examples of corrupt land deals involving government officials.
5.8. Maximising synergies between EPZ and SEZ models
Existing opportunities to maximise synergies between EPZ and SEZ regimes should be exploited. EPZs were developed based on the reality of the time, to attract foreign investment under an enclave system. SEZs have emerged as part of a new generation industrial development model that emphasises the need to grow local firms along with attracting FDI by providing similar incentives to those available in EPZs. By eliminating the restriction on domestic firms’ participation, SEZs will boost the possibilities of developing backward linkage capacities directly targeted towards the exporting firms within the same premises. More interactions between local and FDI firms are likely to result in more positive externalities being exploited, with domestic enterprises being exposed to modern production techniques and management practices. By drawing lessons from different countries, ADB (2015) suggests that economies that have not done so should consider shifting from an EPZ to an SEZ model; this should be underpinned by policies that support incentivising skills development, training, technology-upgrading and knowledge-sharing; promote industry clusters and target linkages with economic zone-based firms at the cluster level; support integration with regional value chains; encourage public–private coordination and collaboration; and ensure that labour markets are flexible and help circulate labour from declining to growing activities. In light of the policy shift in Bangladesh, scope to maximise synergies between EPZs and SEZs should be evaluated carefully, to make it possible to take practical measures. One possible option could be to allow local firms into three EPZs in north-west and south-west Bangladesh – namely, Uttara, Ishwardi and Mongla. Investment and exporting responses in these establishments have been subdued so far, and opening them to local firms based on SEZ modalities could generate momentum in these lagging regions. In the process, they could also act as a testing ground, the lessons from which can be considered when SEZs start coming into operation.
5.9. Skilled workforce
Ensuring the availability of skilled labour is an essential ingredient of industry success, be it for the domestic or the foreign market. There is no denying that this is likely to present a challenge for SEZs, particularly in relatively backward regions. The first generation EPZ firms, including those in Bangladesh, relied on low-skilled workers, mainly in garments. SEZ firm requirements are likely to be more diverse, which means they will require a labour force with a mixed skill set.25 The clustering approach – incentivising the localisation of related firms – can help at the initial stage of the production process. But over the medium to long term, availability of skilled labour is likely to be a key determinant of SEZ success. Another issue is whether skilled workers will find it attractive to reside in nearby town centres.
25 SEZs elsewhere have also confronted the problem of lack of a skilled workforce. ADB (2015) cites the case of Malaysia, which in the mid-1990s introduced an ambitious programme to induce a structural shift from low- to high-value added production. This was initially constrained by, among other things, unfavourable labour market practices and human resource constraints.

Promoting inclusive growth in Bangladesh through special economic zones
31 | EDIG Research Paper Three
The 7FYP has explicitly suggested supporting lagging regions with skills development, such as by establishing technical and vocational institutes. Implementation of this will be extremely important for the economic viability of SEZs in these regions. Civic amenities, recreational facilities and good housing will also be required to help skilled workers relocate.
5.10. Assessing costs and benefits
For any ambitious project, assessing the costs and benefits is important for learning lessons, introducing innovative policy designs and evaluating the opportunity costs associated with alternative options. The many cross-country studies that exist seem to suggest that, more often than not, economic zones produce much less than is expected. It is thus important to undertake meticulous evaluations at different stages. Of course, economic feasibility studies are undertaken prior to the zone development work. However, as time elapses and new information becomes available, there may be a need for re-evaluation to consider emerging realities. These exercises may help in being strategic: in some cases, phased and sequential zone-related development activities may be more appropriate; in others, tackling infrastructural bottlenecks away from zones could be more realistic. It is also important to assess whether SEZs generate additional activities or merely displace activities elsewhere. Policy experiments to evaluate the likely impact of different types of investment projects, particularly for ensuring regional inclusivity, are also issues for consideration while assessing costs and benefits.
5.11. General factors affecting SEZ success
Many other general factors that determine the success of SEZs will also be relevant while considering regional inclusivity. Effective institutions; a sound and enforceable legal framework; a transparent decision-making process; a business-friendly investment climate that reduces both direct and indirect transaction costs; simplified administrative and bureaucratic processes; improved trade facilitation: all these are essential preconditions for promoting industrial business growth. In fact, SEZ development should be part of an integrated development agenda that considers addressing regional disparities with the help of SEZs in combination with other supporting measures. While the 7FYP of Bangladesh provides such a useful framework, the vision needs to be developed further as part of a national perspective plan.
5.12. Need for suitable data
Bangladesh needs credible data available on a regular basis, for use in analysis of regional disparities so as to enable the development of suitable policy options. The national input-output table needs to be updated to capture new sectors and changing inter-linkages between activities. Overall economic output data should be made available at the district level at least. As discussed above, disparities are often associated with certain inner regions at the sub-district level. Therefore, regular surveys to capture local-level economic activities should greatly facilitate policy analysis. There are sporadic purpose-built short surveys providing region-specific information. While these are useful, combining information from different sources may not result in a consistent national income accounts framework – which is what is most needed to undertake policy experiments.

Promoting inclusive growth in Bangladesh through special economic zones
32 | EDIG Research Paper Three
In the short to medium term, it will be extremely helpful to develop a consistent data framework (e.g. a SAM) to capture district-level outcomes associated with incomes, social indicators, poverty incidence and sectoral interlinkages. This will allow policy experiments to study impact at district level. Ideally, efforts should also be made to build at least a few sub-district-level (including some for lagging regions) analytical models to understand the differential effects of different policy options.

Promoting inclusive growth in Bangladesh through special economic zones
33 | EDIG Research Paper Three
6. CONCLUSION Despite the mixed success of SEZs across developing countries, Bangladesh has undertaken an ambitious task of setting up 100 such economic zones. An SEZ-led industrialisation strategy can accelerate economic growth, employment generation and poverty reduction, and Bangladesh’s national development plan intends to use it as a policy tool to help lagging regions. Significant variations exist in the spatial distribution of economic activities across the country, with employment-intensive manufacturing and export-oriented enterprises largely concentrated in the Greater Dhaka and Chittagong regions. A proactive policy option will mean attracting these dynamic investment activities to disadvantaged regions. This study has closely reviewed SEZ-related regional development issues and undertaken some policy experiments to understand the potential impact of pursuing different types of investment scenarios for lagging regions, making use of a regional SAM developed for the purpose. Given Bangladesh’s policy target of generating additional exports of $40 billion from its SEZs, the simulation results show that, without any targeted intervention, most of the increased production activities will concentrate in the relatively better-off east (Greater Dhaka and Chittagong). This is related to the current excessively skewed distribution of manufacturing export production in favour of these regions. The lagging west will still benefit from economy-wide linkages and increased demand for labour. However, when half of the targeted exports are generated in SEZs located in the north-west and south-west, the impact on poverty reduction in these regions is much higher. Simulation results suggest that promoting exports from SEZs in lagging regions can have a strong impact on employment generation, including for women. Such a strategy seems likely to trigger greater demand for labour from small farm, non-farm and lower-skilled households. These are the households that are more likely to be associated with vulnerable and excluded groups. The analysis finds no growth-compromising effect of SEZ investment in lagging regions. Instead of manufacturing exports, if policy-induced production comes from the agro-processing sector – which lagging districts are generally perceived to be better suited to – poverty reduction and employment generation results are still encouraging. The positive effects of overall increased investment in SEZs are also borne out. While SEZs may be an appealing policy tool for promoting regional development, and policy simulations can help us understand the impact of different policy scenarios under ideal circumstances, we must take several factors into serious account to make them work effectively. The strategy delineated in Bangladesh’s 7FYP for tackling regional disparities needs to be aligned with the actual zone development work on the ground. Identification of lagging regions may be an issue, but the 7FYP strongly suggests attaching priority to the divisions in the western part of Bangladesh. This has not been matched by progress on SEZ development so far. SEZs do offer special incentives for investors, but incentives for investment projects in lagging regions may need to be significantly more attractive than those elsewhere, if investors are to overcome any locational disadvantages.

Promoting inclusive growth in Bangladesh through special economic zones
34 | EDIG Research Paper Three
It will also be important to carefully assess whether focusing on a few major and larger SEZs in lagging regions will help ensure that incentives and targeted policy attention are adequate for effective implementation. Having too many suboptimally sized SEZs cannot help in better exploiting agglomeration economies, especially when these are not located in established urban centres. Phased implementation of the 100 SEZ programme could be a practical option. The need for appropriate, adequate and well-functioning infrastructure for lagging regions cannot be overemphasised. Their connectivity with major economic corridors should be another important consideration. Ensuring availability of skilled workers for SEZs, particularly in relatively backward regions, can represent a major challenge. Implementing the 7FYP’s suggestion of supporting lagging regions with skills development is extremely important for the economic viability of SEZs in these regions. Proper utilisation of allotted serviced plots – rather than catering to rent-seeking objectives – is critical. The extent to which MSMEs can access SEZs and how to ensure their participation also represents a major policy challenge. Finally, using SEZ policies for balanced regional development will require analytical policy work, for which Bangladesh currently lacks sufficient and good-quality data. In the absence of such data, the task of generating meaningful and informed policy analysis and advice is a daunting prospect.

Promoting inclusive growth in Bangladesh through special economic zones
35 | EDIG Research Paper Three
REFERENCES Asian Development Bank (ADB) (2015) Asian Economic Integration Report 2015: How Can Special Economic Zones Catalyze Economic Development? Manila: ADB
Auty, R. (2011) ‘Early Reform Zones: Catalysts for Dynamic Market Economies in Africa’ in T. Farole and G. Akinci (eds.) Special Economic Zones: Progress, Emerging Challenges, and Future Directions. Washington, DC: World Bank Bangladesh Bureau of Statistics (2017) Preliminary Household Income and Expenditure Survey (HIES) Report 2016. Dhaka: BBS
Bangladesh Economic Zones Authority (BEZA) (2016) Annual Report, BEZA. Dhaka: Government of Bangladesh Bangladesh Economic Zones Authority (BEZA) (2017) Brochures for Special Economic Zones. Dhaka: Government of Bangladesh Engman, M. (2011) ‘Success and Stasis in Honduras’ Free Zones’ in T. Farole and G. Akinci (eds.) Special Economic Zones: Progress, Emerging Challenges, and Future Directions. Washington, DC: World Bank Fan, S., Kanbur, R. and Zhand, X. (2011) ‘China’s regional disparities: Experience and policy’ Review of Development Finance 1(1): 47–56 Farole, T. (2011) ‘Special Economic Zones: What Have We Learned?’ Economic Premise, Number 64. Washington, DC: World Bank Farole, T. and Akinci, G. (2011) ‘Introduction’ in T. Farole and G. Akinci (eds.) Special Economic Zones: Progress, Emerging Challenges, and Future Directions. Washington, DC: World Bank Farole, T. and Moberg, L. (2014) It worked in China, so why not in Africa: The political economy challenge of Special Economic Zones. WIDER Working Paper 2014/152 General Economics Division (GED) (2015) A Strategy for Poverty Reduction in the Lagging Regions of Bangladesh. General Economics Division, Planning Commission, Government of Bangladesh.
GED (2015) 7th Five Year Plan FY2016-2020: Accelerating Growth, Empowering Citizens. General Economics Division, Planning Commission, Government of Bangladesh. Kanbur, R. and Venables, A.J. (2005) Spatial Inequality and Development: Overview of UNU-WIDER Project. UNU-WIDER Khondker, B.H. and Mahzab, M.M. (2015) ‘Lagging District Development’. Background study paper for preparation of the Seventh Five-Year Plan (mimeo) Krugman, P.R. (1991) ‘Increasing Returns and Economic Geography’ Journal of Political Economy 49: 137–150

Promoting inclusive growth in Bangladesh through special economic zones
36 | EDIG Research Paper Three
Lal, S.V. and Chakravorty, S. (2005) ‘Industrial Location and Spatial Inequality: Theory and Evidence from India’ Review of Development Economics 9(1): 47–68 Ministry of Industries (2016) Bangladesh National Industrial Policy 2016. Dhaka: Government of Bangladesh Ministry of Road Transport and Bridges (MRTB) (2016) Regional Road Connectivity: Bangladesh Perspective. MRTB, Government of Bangladesh. Mitra, S. (2007) ‘Special Economic Zones in India: White Elephants or Race Horse?’ (https://www.researchgate.net/publication/228287121) accessed on 20 September 2017
Myrdal, G. (1957) Economic Theory and Underdeveloped Regions. London: University Paperbacks, Methuen PwC (2017) ‘Bangladesh Economic Corridor’. Draft interim report Raihan, S. and Ahmed, M. (2016) ‘How Pervasive is regional disparity in primary education in Bangladesh?’ Munich Personal RePEc Archive (https://mpra.ub.uni-muenchen.de/71177/1/MPRA_paper_71177.pdf) accessed 20 September 2017 Razzaque, M.A. (2017) ‘Globalisation Backlash and Global Trade Slowdown: Trade and Development Perspectives from Bangladesh’. Paper prepared for ISS NUS workshop in Singapore, October. South Asian Network on Economic Modelling (SANEM) (2017) ‘Progress of SEZs’. Presentation made at the Quarterly Review of Bangladesh Economy, unpublished. Sen, B., Ahmed, M., Ali, Z. and Yunus, M. (2014) Regional Inequality in Bangladesh in the 2000s: Re-visiting the East-West Divide Debate. Dhaka: Bangladesh Institute of Development Studies Shilpi (2013) ‘Understanding the Sources of Spatial Disparity and Convergence: Evidence from Bangladesh’. Blogpost at Let’s Talk Development. World Bank, Washington, DC Venables, A. (2005) ‘New Economic Geography’. Paper written for Palgrave Dictionary of Economics (http://www.m.rrojasdatabank.info/newecongeogven05.pdf) accessed 12 Dec 2017 World Bank (2008) Poverty Assessment for Bangladesh: Creating Opportunities and Bridging the East–West Divide. Washington DC: World Bank Zheng, Y. and Chen, M. (2007) ‘China’s Regional Disparity and Its Policy Responses’. Briefing Series – Issue 25. China Policy Institute, University of Nottingham.

Promoting inclusive growth in Bangladesh through special economic zones
37 | EDIG Research Paper Three
ANNEX 1: RELATIONSHIP BETWEEN SYSTEM OF NATIONAL ACCOUNTS AND SOCIAL ACCOUNTING MATRIX Table A1.1 shows the relationship between the accounts of the System of National Accounts (SNA) and the Social Accounting Matrix (SAM). Presentation of national accounts in a SAM format shows the interdependence between commodity and activity with respect to production and price formation; captures the relationship between factors and activity in primary income generation; depicts the association between the factorial and institution income distribution; and shows the relationship between commodity supply and institutional consumption. It also captures the equality between the total of expenditure and income accounts of all accounts representing behaviour of commodity, activity and institutions.
Table A1.1: Schematic presentation of SNA–SAM relationship
SAM accounts SNA accounts
Code
Commodity Activity Factors Institutions Rest of world
Capital Total
income A/C
1 2 3 4 5 6
Labour Capital
Indirect tax
Import duty
Household Government Corporation
Production A/C Commodity
1 Trade and transport
margin by commodity
Total use purchaser
Price
Expenditure purchaser
price
Expenditure purchaser
price
Export purchaser
price
Investment purchaser
price
Total income commodity
Activity A/C Activities at producer's
prices
2
Total domestic supply
Total income
activity
Distribution of primary income
Income generation by
institutions
3
Compensation to employees
Wages Total income
factor Operating surplus
Operating surplus
Indirect tax Indirect tax Total income indirect
tax Import duty Import duties
Use of income Primary
income of institutions
4
Household Wage Mixed income Remittance
Total income institutions
Government
Indirect tax
Import duty
Direct tax Corporate
tax
Corporation
Operating surplus
Rest of world Rest of world
– imports (current)
5 Import C.I.F
Total income rest of world
Consolidated Capital Account
6 Household
savings Government
savings Corporation
savings Foreign savings
Total savings
Total expenditure A/C
Total commodity supply purchaser
prices
Total activity supply purchaser
prices
Total factor income purchaser
prices
Total indirect tax
Private and public consumption purchaser
prices
Total corporate consumption
purchaser prices
Exports purchaser
prices
Investment purchaser
prices
Methodology: description of SAM model
The move from a SAM data framework to a SAM model (also known as a multiplier framework) requires decomposing the SAM accounts into ‘exogenous’ and ‘endogenous’. Generally, accounts intended for use as policy instruments (e.g. government expenditure including social protection, investment and exports) are made exogenous and accounts specified as objectives or targets must be made endogenous (e.g. output, commodity demand, factor return and household income or expenditure). For any given injection into the exogenous accounts of the SAM, influence is transmitted through the interdependent SAM system among the endogenous accounts. The interwoven nature of the system implies that the incomes of factors, households and production are all derived from exogenous injections into the economy via a multiplier process. The multiplier process is developed here on the assumption that when an endogenous income account receives an exogenous expenditure injection, it spends it in the same proportions as shown in the matrix of average propensity to spend (APS). The elements of the APS matrix are calculated by dividing each cell by the sum total of its corresponding column. The economy-wide impacts of the SAM have been examined by changing the total exogenous injection vector, especially government. More specifically, the total exogenous account is manipulated to estimate its effects on output (through an output multiplier), value added or GDP

Promoting inclusive growth in Bangladesh through special economic zones
38 | EDIG Research Paper Three
(through the GDP multiplier), household income (through the household income multiplier) and commodity demand (via commodity multipliers).
Table A1.2: Description of the endogenous and exogenous accounts and multiplier effects
Endogenous (y) Exogenous (x)
The activity (gross output multipliers) indicates the total effect on the sectoral gross output of a unit income increase in a given account, i in the SAM, and is obtained via the association with the commodity production activity account i
Intervention into through activities (x = i + g + e), where i= GFC + ST (GFCF) Exports (e) Government expenditure (g) Investment demand (i) Inventory demand (i)
The consumption commodity multipliers, which indicate the total effect on the sectoral commodity output of a unit income increase in a given account i in the SAM, is obtained by adding the associated commodity elements in the matrix along the column for account i
The value added, or GDP multiplier, giving the total increase in GDP resulting from the same unit income injection, is derived by summing up the factor payment elements along account i’s column
Intervention via households (x = r + gt + ct), where Remittance ( r) Government transfers (gt): OAA will be injected into the SAM model via government transfer account linking households and the government Corporation transfers (ct)
Household income multiplier shows the total effect on household and enterprise income, and is obtained by adding the elements for the household groups along the account i column
The shift from a ‘data’ SAM structure to a SAM multiplier module requires the introduction of assumptions and separation of the SAM accounts into ‘exogenous’ and ‘endogenous’ components.
Table A1.3: General SAM modular structure 1a-PA 1b-CM 2-FP 3-HH-OI 4-KHH-OI 5-ROW TDD
1a PA T1a, 1b 0 Y1a
1b CM T1b, 1a T1b, 3 T1b, 4 T1b, 5 Y1b
2 FP T2, 1a T2, 5 Y2
3 HH-OI T3, 1a T3, 1b T3, 2 T3, 3 T3, 5 Y3
4 KHH-OI T4, 1a T4, 3a T4, 5 Y4
5 ROW T5, 1b T5 2 T5, 3 0 0 Y5
TSS E1a E1b E2 E3 E4 E5
where: by definition Yi= Ej and 1 Production (1a PA = Production Activities and 1b CM = Commodities); 2 FP = Factors of Production; 3 HH-OI = Households and Other Institutions (incl. Government); 4 KHH-OI = Capital Account Households and Other Institutions (including Government); 5 ROW = Rest of the World (current and capital account). Blank entries indicate that there are no transactions by definition. Total demand and total supply are indicated by TDD and TSS, respectively.
The separation is needed to gain entry into the system, allowing some variables within the SAM structure to be manipulated exogenously (via injection instruments) to assess the subsequent impacts on the endogenous accounts as well as on the exogenous accounts. Generally, accounts intended to be used as policy instruments are classified as exogenous, and accounts specified a priori as objectives (or targets) are classified as endogenous. Three accounts are designated as endogenous accounts: (1) Production (production activities and commodities) account; (2) Factors of Production account; and (3a) Households and Other Institutions (excluding the Government). The exogenous accounts comprise: (3b) Government (expenditure, transfer, remittances); (4) capital account of institutions (savings and demand for houses, investment demand, infrastructure and machinery and equipment); and (5) ROW transfers, remittances, export demand and capital. The SAM flows and the categorisation into endogenous and exogenous accounts are shown below.

Promoting inclusive growth in Bangladesh through special economic zones
39 | EDIG Research Paper Three
Table A1.4: Endogenous and exogenous accounts 1a-PA 1b-CM 2-FP 3a-HH-OI 3b-Gov 4-KHH-OI 5-ROW TDD
1a PA T1a, 1b 0 Y1a 1b CM T1b, 1a T1b, 3a T1b, 3b T1b, 4 T1b,5 Y1b 2 FP T2, 1a T2, 5 Y2 3a HH-OI T3a, 2 T3a, 3a T3a, 3b T2, 5 Y3 3b Gov T3b, 1a T3b, 1b T3b, 3a T3b, 3b T3a, 5 4 KHH-OI T4, 1a T4, 3 T4, 5 Y4 5 ROW T5, 1b T5, 2 T5, 3a T5, 3b T5, 4 0 Y5 TSS E1a E1b E2 E3a E3b E4 E5
where Endogenous: 1 Production (1a PA = Production Activities and 1b CM = Commodities); 2 FP = Factors of Production; 3a HH OI = Households and Other Institutions (excluding Government); Exogenous: 3b Government; 4 KHH-OI = Capital Account of Households and of Other Institutions (incl. Government); 5 ROW = Rest of the World (current and capital account). Blank entries indicate that there are no transactions by definition. Total demand and total supply are indicated by TDD and TSS, respectively.
Table A1.5: Endogenous and components of exogenous accounts
PA CM FP 3a HH&OI EXO INCOME Exogenous Accounts (EXO) used as injections Column Vectors
1a PA T1a 1b 0 X1a Y1a X1a = 0
1b CM T1b 1a T1b 3a X1b Y1b
X1b = Government Consumption Subsidies - Taxes + Exports + Gov. Investment (capital formation in infrastructure and machinery and equipment) + Gross Capital Stock formation
2 FP T2 1a X2 Y2 X2 =Factor Remittances from ROW
3a HH&OI T3a
2 T3a 3a X3a Y3a X3a= Transfers (OAA), remittance
3b-5 Leaks L1a L1b L2 L3a L3b-5 = X3b-5
Y3b-5 3b =Aid to Government from ROW
EXPN E1a E1b E2 E3a E3b-5 Where Ei = Yj
L1a = Activity Tax L3a = Income Tax + Household Savings + Corporate Savings
L1b = Commodity Tax + Import Duty + Imports L3b-5 X3b-5 and Y3b-5 falls out of the model
L2 = Factor Remittances to ROW Blank entries indicate that there are no transactions by definition.
Note on injection: For any given injection into the exogenous accounts Xi (i.e., instruments) of the SAM, influence is
transmitted through the interdependent SAM system among the endogenous accounts. The interwoven nature of the system implies that the incomes of factors, institutions and production are all derived from exogenous injections into the economy via a multiplier process. Multiplier models may also be built on the input-output frameworks. The main shortcoming of the I-O model is that the feedback between factor income generation (value-added) and demand by private institutions (households) does not exist. In this case, the circular economic flow is truncated. The problem can be partly tackled by endogenising household consumption within the I-O framework; this is typically referred to as a ‘closed I-O model’. In this case, the circular economic flow is only partially truncated. A better solution is to extend the I-O to a SAM framework, which captures the full circular economic flow.
Derivation of SAM multipliers
SAM coefficients (Aij) are derived from payments flows by endogenous accounts to themselves (Tij) and other endogenous accounts as to the corresponding outlays (Ei = Yj); similarly, the leak coefficients (Bij) are derived from flows reflecting payments from endogenous accounts to exogenous accounts. They are derived below.

Promoting inclusive growth in Bangladesh through special economic zones
40 | EDIG Research Paper Three
Table A1.6: Coefficient matrices and vectors of the SAM model
Account 1a - PA 1b - CM 2 - FP 3a - HH&OI
3b … 5 EXO Income
1a - PA A1a,1b
= T1a,1b/ Y1b X1a Y1a
1b - CM A1b,1a = T1b,1a/ Y1a
A1b,3a = T1b,3a/ Y3a
X1b Y1b
2 - FP A2,1a = T2,1a/ Y1a
X2 Y2
3a - HH&OI A3a,2
= T3a,2/ Y2 A3a,3a = T3a,3a/ Y3a
X3a Y3a
3b … 5 Leaks B1a = L1a / Y1a
B1b = L1b / Y1b
B2 = L2/ Y2
B3a = L3a / Y3a
Expenditure E1a = Y1a E1b = Y1b E2 = Y2 E3 = Y3a
The multiplier analysis using the SAM framework helps us to understand the linkages between the different sectors and the institutional agents at work within the economy. Accounting multipliers have been calculated according to the standard formula for accounting (impact) multipliers, as follows: Y(t) = A Y (t) + X(t) = (I – A) –1 X(t) = MaX(t), where: t is time; Y is a vector of incomes of endogenous variables; X is a vector of expenditures of exogenous variables; A is the matrix of average expenditure propensities for endogenous accounts; Ma = (I – A) –1 is a matrix of aggregate accounting multipliers (generalised Leontief inverse). The aggregate accounting multiplier (Ma) will be further decomposed to separately examine the direct and induced effect. In order to generate the direct and induced effects the Ma multiplier will be decomposed using both multiplicative and additive forms.
From the above it logically follows that the SAM model mainly is helpful for the following: 1. assessing the impacts on the endogenous and exogenous accounts in a clear and differentiated
manner 2. analysing the technological structure of the sectors oriented towards the production of basic
intermediate and final goods and services 3. assessing expenditure structures of factors of production, institutions and demand for goods
and services of domestic and foreign origin 4. identifying key sectors, commodities, factors of production, institutional accounts and basic
needs in the economy and quantification of the main linkages (total and partial) 5. studying the dynamics of the production structure, factorial and institutional income formation 6. assessing the effects of incomes of institutions and their impact on production via their
corresponding demand 7. examining the intra, across or extra and inter-circular group effects, in both additive and
multiplicative manner 8. matching labour and investment requirements that can be calculated 9. assessing price changes on endogenous accounts arising out of endogenous account price
changes as well as exogenous account price changes 10. designing simulations and alternative scenarios for and 11. providing the basis for development of computable general equilibrium models.

Promoting inclusive growth in Bangladesh through special economic zones
41 | EDIG Research Paper Three
ANNEX 2: CONSTRUCTION OF A REGIONAL SOCIAL ACCOUNTING MATRIX FOR BANGLADESH
Bangladesh national Social Accounting Matrix (SAM)
The Bangladesh national SAM identifies the economic relations through four types of accounts: (i) production activity and commodity accounts for the 86 sectors; (ii) 4 factors of productions with 2 different types of labour and 2 types of capital; (iii) current account transactions among the 4 main institutional agents; household members and unincorporated capital, corporation, government and the rest of the world; and (iv) two consolidated capital accounts distinguished by public and private origins to capture the flows of savings and investment. The disaggregation of activities, commodities, factors and institutions in the SAM is given in Table A2.1.
Table A2.1: Activities and their description in Bangladesh national SAM accounts Set Description of Elements
Activities (86) Agriculture (20) Paddy Cultivation, Wheat Cultivation, Other Grain Cultivation, Jute Cultivation, Sugarcane Cultivation,
Potato Cultivation, Vegetable Cultivation, Pulses Cultivation, Oilseed Cultivation, Fruit Cultivation, Cotton Cultivation, Tobacco Cultivation, Tea Cultivation, Spice Cultivation, Other Crop Cultivation, Livestock Rearing, Poultry Rearing, Shrimp Farming, Fishing, Forestry
Mining & Quarrying (01) Mining and Quarrying
Manufacturing (39) Rice Milling, Grain Milling, Fish Process, Oil Industry, Sweetener Industry, Tea Product, Salt Refining, Food Process, Tanning and Finishing, Leather Industry, Baling, Jute Fabrication, Yarn Industry, Cloth Milling, Handloom Cloth, Dyeing and Bleaching, Woven, Knitting, Toiletries, Cigarette Industry, Bidi Industry, Wood and Cork Product, Furniture Industry, Paper Industry, Printing and Publishing, Pharmaceuticals, Fertiliser Industry, Basic Chemical, Petroleum Refinery, Earthenware Industry, Plastic Products, Glass Industry, Clay Industry, Cement, Basic Metal, Metal, Machinery and Equipment, Transport Equipment, Miscellaneous Industry
Construction (04) Building, Kutcha House, Agriculture Construction and Other Construction
Electricity, Gas and Water Supply (03)
Electricity, Water Generation, Gas Extraction and Distribution
Trade, and Transport (07) Wholesale Trade, Retail Trade, Air Transport, Water Transport, Land Transport, Railway Transport, Other Transport
Services (12) Housing and Real Estate Service, Health Service, Education Service, Public Administration and Defense, Bank and other Financial Services, Insurance, Professional Service, Entertainment, Hotel and Restaurant, Communication, Other Services, ICT
Commodities (86) Agriculture (20) Paddy Cultivation, Wheat Cultivation, Other Grain Cultivation, Jute Cultivation, Sugarcane Cultivation,
Potato Cultivation, Vegetable Cultivation, Pulses Cultivation, Oilseed Cultivation, Fruit Cultivation, Cotton Cultivation, Tobacco Cultivation, Tea Cultivation, Spice Cultivation, Other Crop Cultivation, Livestock Rearing, Poultry Rearing, Shrimp Farming, Fishing, Forestry
Mining & Quarrying (01) Mining and Quarrying
Manufacturing (39) Rice Milling, Grain Milling, Fish Process, Oil Industry, Sweetener Industry, Tea Product, Salt Refining, Food Process, Tanning and Finishing, Leather Industry, Baling, Jute Fabrication, Yarn Industry, Cloth Milling, Handloom Cloth, Dyeing and Bleaching, Woven, Knitting, Toiletries, Cigarette Industry, Bidi Industry, Wood and Cork Product, Furniture Industry, Paper Industry, Printing and Publishing, Pharmaceuticals, Fertiliser Industry, Basic Chemical, Petroleum Refinery, Earthenware Industry, Plastic Products, Glass Industry, Clay Industry, Cement, Basic Metal, Metal, Machinery and Equipment, Transport Equipment, Miscellaneous Industry
Construction (04) Building, Kutcha House, Agriculture Construction and Other Construction
Electricity, Gas and Water Supply (03)
Electricity, Water Generation, Gas Extraction and Distribution
Trade, and Transport (07) Wholesale Trade, Retail Trade, Air Transport, Water Transport, Land Transport, Railway Transport, Other Transport,
Services (12) Housing and Real Estate Service, Health Service, Education Service, Public Administration and Defense, Bank and other Financial Services, Insurance, Professional Service, Entertainment, Hotel and Restaurant, Communication, Other Services, ICT
Factors of Production (4) Labour (2) Labour unskilled, and Labour skilled
Capital (2) Capital and Land

Promoting inclusive growth in Bangladesh through special economic zones
42 | EDIG Research Paper Three
Current Institutions (11)
Households (8) Rural: landless, Agricultural marginal, Agricultural small, Agricultural large, Non-farm poor and Non-farm non-poor Urban: Households with low-educated heads, and households with high-educated heads
Others (3) Government, Corporation and Rest of the World
Capital Institution (1) Capital
The construction of SAM is based on several data sets drawn from diverse sources. They are listed below. 1. The Input-Output Table 2012 for Bangladesh; prepared as a background document for the
technical frame for the Seventh Five Year Plan. 2. Social Accounting Matrix for Bangladesh for 2006/07. 3. Bangladesh Bureau of Statistics (2011), Household Income and Expenditure Survey, 2010. 4. Ministry of Finance (2014), Economic Survey of Bangladesh. The updating/construction of the SAM proceeded in two steps. In the first step, a ‘proto-SAM’ was constructed using the data collected from diverse sources. Since the data came from different sources and was for different years, in line with the expectation, the estimated ‘proto-SAM’ was unbalanced. In the second step, the SAM was balanced by adjusting the activity and commodity (i.e. private consumption, intermediate demand vectors) accounts as explained below. The updating of a SAM is not only an exercise in putting together a complete data set, but also an estimation process on the basis of insufficient and partly inconsistent data. In this current exercise, the first step in generating a consistent and balanced SAM is to build a macroeconomic SAM (i.e. the macro SAM). The main objective of the macro SAM is to summarise and to show the circular flow in the economy in general and interdependence between commodity, activity, consumption, and flow-of-fund accounts without sectoral or institutional details. Thus, in the second step a preliminary disaggregated SAM (which is also referred to as the micro SAM) is constructed using available disaggregated information drawn from various data-producing agencies. Subject to data availability, the disaggregated SAM segregates most of the macro SAM accounts to desired sectoral and institutional breakdowns. While ensuring balance between the receipts and outlays for all accounts, the disaggregated or micro SAM must reproduce the control totals of the macro SAM. The correspondence between accounts of the aggregated micro SAM and macro SAM thus ensure its desired consistency with the national account data.
Bangladesh regional Social Accounting Matrix (SAM)
Generally, two accepted methods of construction of a SAM or a regional SAM are (i) the survey method and (ii) the non-survey method. The survey method is very expensive in terms of both time and financial resources. Such an approach is not possible to adopt for this study. Thus in the study a non-survey method 26 has been adopted to construct the regional SAM for Bangladesh. The following steps have been adopted to construct the regional SAM from the national SAM. 1. Define the four regions: south-western; north-western; greater Dhaka; and greater Chittagong. 2. Collate regional-level data by major economic activities and commodities.
26 Some of the widely used non-survey methods employed to construct multiregional SAM/I-O tables include unadjusted national coefficients, the techniques location quotient (LQ), commodity balance (CB), supply-demand pool (SDP) and RAS.

Promoting inclusive growth in Bangladesh through special economic zones
43 | EDIG Research Paper Three
3. To stay within manageable limits, we aggregate certain activities within the original 86 activities and commodities defined in the national SAM to reduced levels based on the regional value added and consumption data by activities/commodities. More specifically, available regional-level data include value added; consumption; employment etc.
4. Combine the available data with the simple location quotients (SLQ) method to derive the regional vectors and matrices.
Map A2.1: Bangladesh map showing four broad regions
Source: Authors
The Bangladesh regional SAM identifies the economic relations through four types of accounts: (i) production activity and commodity accounts for the 30 sectors; (ii) four factors of production (labour – skilled and unskilled, capital and land); (iii) current account transactions among the four main institutional agents; household members and unincorporated capital, corporation, government and the rest of the world; and (iv) two consolidated capital accounts distinguished by public and private origins to capture the flows of savings and investment. The disaggregation of activities, commodities, factors and institutions in the SAM is given in Table A2.1.

Promoting inclusive growth in Bangladesh through special economic zones
44 | EDIG Research Paper Three
Table A2.2: Disaggregation and description of a 4-regional Bangladesh SAM accounts
Set Description of Elements
Regions (4) South-western; north-western; Dhaka; and Chittagong
Activities (30) Agriculture (04) Crop Cultivation, Livestock Rearing, Fisheries, and Forestry
Mining & Quarrying (01) Mining and Quarrying
Manufacturing (14) Milling, Food Process, Tanning and Leather Industry, Jute, Clothing, Ready-made Garments, Tobacco Industry, Wood, Paper Industry, Pharmaceuticals, Chemical, Cement, Machinery and Equipment, and Miscellaneous Industry
Construction (01) Construction
Utility (01) Utility
Services (09) Trade, Transport, Housing and Real Estate Service, Health Service, Education Service, Public Administration and Defense, Bank and other Financial Services, Hotel and Restaurant, and Services
Commodities (30) Agriculture (04) Crop Cultivation, Livestock Rearing, Fisheries, and Forestry
Mining & Quarrying (01) Mining and Quarrying
Manufacturing (14) Milling, Food Process, Tanning and Leather Industry, Jute, Clothing, Ready-made Garments, Tobacco Industry, Wood, Paper Industry, Pharmaceuticals, Chemical, Cement, Machinery and Equipment, and Miscellaneous Industry
Construction (01) Construction
Utility (01) Utility
Services (09) Trade, Transport, Housing and Real Estate Service, Health Service, Education Service, Public Administration and Defense, Bank and other Financial Services, Hotel and Restaurant, and Services
Factors of Production (4) Labour (2) Labour unskilled, and Labour skilled
Capital (2) Capital and Land
Current Institutions (11)
Households (8) Rural: Agricultural small farmer, Agricultural large farmer, Non-farm household. Urban: Households with low-educated heads, and households with high-educated heads
Others (3) Government, Corporation and Rest of the World
Capital Institution (1) Capital

Promoting inclusive growth in Bangladesh through special economic zones
45 | EDIG Research Paper Three
ANNEX 3: MAP OF SPECIAL ECONOMIC ZONES IN BANGLADESH

Promoting inclusive growth in Bangladesh through special economic zones
46 | EDIG Research Paper Three
ANNEX 4: ESTIMATED BACKWARD LINKAGES FOR VARIOUS ACTIVITIES BY REGIONS Backward linkages capture the strength of the integration of a particular activity with the overall domestic economy through their interdependence. The higher the values of the backward linkages the greater is the integration. For example, the activity ‘Crops_South-west’ has a backward linkage of 3.424. It means a one-unit injection into this activity will generate 3.4236 units of output growth other activities in the domestic economy.
Sector Classification Activity
Agr
icu
ltu
re
Crops_South-west 3.4236
Crops_North-west 3.4072
Crops_Dhaka 3.2652
Crops_Chittagong 3.3919
Livestock_South-west 3.6949
Livestock_North-west 3.7098
Livestock_Dhaka 3.7094
Livestock_Chittagong 3.6933
Fisheries_South-west 3.3947
Fisheries_North-west 3.4023
Fisheries_Dhaka 3.4209
Fisheries_Chittagong 3.4490
Forestry_South-west 3.6290
Forestry_North-west 3.6251
Forestry_Dhaka 3.7420
Forestry_Chittagong 3.7180
Man
ufa
ctu
rin
g
Milling_South-west 3.8834
Milling_North-west 3.8775
Milling_Dhaka 3.8918
Milling_Chittagong 3.8989
Food_South-west 3.3473
Food_North-west 3.2808
Food_Dhaka 3.4805
Food_Chittagong 3.4463
Leather_South-west 3.9122
Leather_North-west 3.8873
Leather_Dhaka 3.9647
Leather_Chittagong 3.9446
Jute_South-west 4.0073
Jute_North-west 4.0113
Jute_Dhaka 4.0055
Jute_Chittagong 3.9942
Cloth_South-west 3.5774
Cloth_North-west 3.6195
Cloth_Dhaka 3.5972
Cloth_Chittagong 3.6013
RMG_South-west 3.0000
RMG_North-west 3.0268
RMG_Dhaka 3.2593
RMG_Chittagong 3.3518
Pharm_South-west 2.9802
Pharm_North-west 2.9443
Pharm_Dhaka 3.0938
Pharm_Chittagong 3.1552
Tobacco_South-west 2.5691
Tobacco_North-west 2.2441
Tobacco_Dhaka 2.7000

Promoting inclusive growth in Bangladesh through special economic zones
47 | EDIG Research Paper Three
Tobacco_Chittagong 2.6327
Wood_South-west 3.7838
Wood_North-west 3.8249
Wood_Dhaka 3.9726
Wood_Chittagong 3.9106
Paper_South-west 3.3155
Paper_North-west 3.2997
Paper_Dhaka 3.4518
Paper_Chittagong 3.4648
Chemical_South-west 2.7166
Chemical_North-west 2.6749
Chemical_Dhaka 2.8287
Chemical_Chittagong 2.9217
Cement_South-west 3.6120
Cement_North-west 3.5833
Cement_Dhaka 3.6630
Cement_Chittagong 3.6830
Machinery_South-west 3.0659
Machinery_North-west 3.0090
Machinery_Dhaka 3.2829
Machinery_Chittagong 3.2270
Other Manufacturing_South-west 2.9468
Other Manufacturing_North-west 2.8329
Other Manufacturing_Dhaka 3.1857
Other Manufacturing_Chittagong 3.0964
Co
nst
ruct
io
n
Construction_South-west 3.1264
Construction_North-west 3.0879
Construction_Dhaka 3.0493
Construction_Chittagong 3.2013
Uti
lity
Utility_South-west 2.6817
Utility_North-west 2.6237
Utility_Dhaka 2.4579
Utility_Chittagong 2.5887
Min
ing
Mining_South-west 3.0690
Mining_North-west 3.0428
Mining_Dhaka 3.0353
Mining_Chittagong 3.0523
Serv
ice
s
Trade_South-west 3.0297
Trade_North-west 3.0239
Trade_Dhaka 3.0177
Trade_Chittagong 3.0196
Transport_South-west 3.1437
Transport_North-west 3.1889
Transport_Dhaka 3.0964
Transport_Chittagong 3.1554
Real Estate_South-west 2.8573
Real Estate_North-west 2.8468
Real Estate_Dhaka 2.8692
Real Estate_Chittagong 2.8976
Health_South-west 3.2238
Health_North-west 3.2336
Health_Dhaka 3.3103
Health_Chittagong 3.2808
Education_South-west 3.1656
Education_North-west 3.1572
Education_Dhaka 3.2661
Education_Chittagong 3.2649
Public Administration_South-west 3.2055
Public Administration_North-west 3.2296

Promoting inclusive growth in Bangladesh through special economic zones
48 | EDIG Research Paper Three
Public Administration_Dhaka 3.1277
Public Administration_Chittagong 3.2254
Bank_South-west 3.1105
Bank_North-west 3.1061
Bank_Dhaka 3.1351
Bank_Chittagong 3.1396
Hotel_South-west 3.7094
Hotel_North-west 3.7215
Hotel_Dhaka 3.4921
Hotel_Chittagong 3.5375
Services_South-west 3.2233
Services_North-west 3.2243
Services_Dhaka 3.1859
Services_Chittagong 3.1843
All 3.3053
Source: Regional SAM as constructed

Promoting inclusive growth in Bangladesh through special economic zones
49 | EDIG Research Paper Three
ANNEX 5: SIMULATION RESULTS
Table A5.1: Impact of additional $40 billion SEZ exports under the same regional production structure
GDP (by subsector and total) Base (million TK in constant
prices)
Simulated values (due to shock) (mill Tk
in constant prices)
% change Average per year change
over 12 years (%)
Agriculture south-west 337610 497123 47.25 3.94
Agriculture north-west 506153 747404 47.66 3.97
Agriculture greater Dhaka 432661 656380 51.71 4.31
Agriculture greater Chittagong 332936 497878 49.54 4.13
Total agriculture 1609359 2398784 49.05 4.09
Manufacturing south-west 77104 104662 35.74 2.98
Manufacturing north-west 108534 159755 47.19 3.93
Manufacturing greater Dhaka 932721 2072010 122.15 10.18
Manufacturing greater Chittagong 354937 768682 116.57 9.71
Total manufacturing 1473296 3105109 110.76 9.23
Construction south-west 131622 133560 1.47 0.12
Construction north-west 183104 185477 1.3 0.11
Construction greater Dhaka 253528 257944 1.74 0.15
Construction greater Chittagong 165688 168272 1.56 0.13
Total construction 733942 745253 1.54 0.13
Utilities south-west 14398 20823 44.63 3.72
Utilities north-west 20062 29187 45.48 3.79
Utilities greater Dhaka 55575 113307 103.88 8.66
Utilities greater Chittagong 25393 44938 76.97 6.41
Total utilities 115428 208255 80.42 6.7
Mining south-west 7260 8174 12.58 1.05
Mining north-west 3604 4204 16.67 1.39
Mining greater Dhaka 4291 5515 28.51 2.38
Mining greater Chittagong 41960 47083 12.21 1.02
Total mining 57115 64976 13.76 1.15
Services south-west 678284 965261 42.31 3.53
Services north-west 863318 1239553 43.58 3.63
Services greater Dhaka 1887691 3151419 66.95 5.58
Services greater Chittagong 1226240 1881537 53.44 4.45
Total services 4655533 7237770 55.47 4.62
South-west GDP 1246277 1729603 38.78 3.23
North-west GDP 1684775 2365579 40.41 3.37
Greater Dhaka GDP 3566467 6256576 75.43 6.29
Greater Chittagong GDP 2147154 3408389 58.74 4.89
All Bangladesh 8644673 13760147 59.17 4.93
Source: Authors’ simulations

Promoting inclusive growth in Bangladesh through special economic zones
50 | EDIG Research Paper Three
Table A5.2: Impact of additional $20 billion SEZ exports from north-west and south-west Bangladesh
GDP (by subsector and total) Base (million TK in constant
prices)
Simulated values (due to shock) (mill Tk
in constant prices)
% change Average per year change over 12
years (%)
Agriculture south-west 337610 506449 50.01 4.17
Agriculture north-west 506153 758611 49.88 4.16
Agriculture greater Dhaka 432661 649913 50.21 4.18
Agriculture greater Chittagong 332936 499774 50.11 4.18
Total agriculture 1609359 2414746 50.04 4.17
Manufacturing south-west 151209 519394 243.49 20.29
Manufacturing north-west 181341 516428 184.78 15.4
Manufacturing greater Dhaka 820906 1487429 81.19 6.77
Manufacturing greater Chittagong 319839 593901 85.69 7.14
Total manufacturing 1473296 3117153 111.58 9.3
Construction south-west 131622 133638 1.53 0.13
Construction north-west 183104 185564 1.34 0.11
Construction greater Dhaka 253528 258182 1.84 0.15
Construction greater Chittagong 165688 168392 1.63 0.14
Total construction 733942 745776 1.61 0.13
Utilities south-west 14398 20970 45.65 3.8
Utilities north-west 20062 29360 46.34 3.86
Utilities greater Dhaka 55575 116447 109.53 9.13
Utilities greater Chittagong 25393 46275 82.23 6.85
Total utilities 115428 213051 84.58 7.05
Mining south-west 7260 8201 12.95 1.08
Mining north-west 3604 4218 17.04 1.42
Mining greater Dhaka 4291 5529 28.85 2.4
Mining greater Chittagong 41960 47283 12.69 1.06
Total mining 57115 65231 14.21 1.18
Services south-west 678284 1020662 50.48 4.21
Services north-west 863318 1287416 49.12 4.09
Services greater Dhaka 1887691 3081517 63.24 5.27
Services greater Chittagong 1226240 1886917 53.88 4.49
Total services 4655533 7276512 56.3 4.69
South-west GDP 1320382 2209313 67.32 5.61
North-west GDP 1757582 2781597 58.26 4.86
Greater Dhaka GDP 3454652 5599017 62.07 5.17
Greater Chittagong GDP 2112057 3242542 53.53 4.46
All Bangladesh 8644673 13832469 60.01 5.00
Source: Authors’ simulations

Promoting inclusive growth in Bangladesh through special economic zones
51 | EDIG Research Paper Three
Table A5.3: Impact of additional agro-processing demand GDP (by subsector and total) Base (million TK in
constant prices) Simulated
values (due to shock) (mill Tk in constant prices)
% change Average per year change over 12
years (%)
Agriculture south-west 337610 506867 50.13 4.18
Agriculture north-west 506153 812861 60.6 5.05
Agriculture greater Dhaka 432661 622360 43.84 3.65
Agriculture greater Chittagong 332936 483825 45.32 3.78
Total agriculture 1609359 2425913 50.74 4.23
Manufacturing south-west 151209 300928 99.01 8.25
Manufacturing north-west 181341 399333 120.21 10.02
Manufacturing greater Dhaka 820906 827454 0.8 0.07
Manufacturing greater Chittagong 319839 323871 1.26 0.11
Total manufacturing 1473296 1851585 25.68 2.14
Construction south-west 131622 132014 0.3 0.02
Construction north-west 183104 183582 0.26 0.02
Construction greater Dhaka 253528 254351 0.32 0.03
Construction greater Chittagong 165688 166192 0.3 0.03
Total construction 733942 736140 0.3 0.02
Utilities south-west 14398 14965 3.94 0.33
Utilities north-west 20062 20657 2.96 0.25
Utilities greater Dhaka 55575 56559 1.77 0.15
Utilities greater Chittagong 25393 25995 2.37 0.2
Total utilities 115428 118176 2.38 0.2
Mining south-west 7260 7327 0.92 0.08
Mining north-west 3604 3630 0.72 0.06
Mining greater Dhaka 4291 4313 0.5 0.04
Mining greater Chittagong 41960 42469 1.21 0.1
Total mining 57115 57738 1.09 0.09
Services south-west 678284 756863 11.58 0.97
Services north-west 863318 990215 14.7 1.22
Services greater Dhaka 1887691 2101298 11.32 0.94
Services greater Chittagong 1226240 1323460 7.93 0.66
Total services 4655533 5171836 11.09 0.92
South-west GDP 1320382 1718964 30.19 2.52
North-west GDP 1757582 2410277 37.14 3.09
Greater Dhaka GDP 3454652 3866335 11.92 0.99
Greater Chittagong GDP 2112057 2365811 12.01 1.00
All Bangladesh 8644673 10361388 19.86 1.65
Source: Authors’ simulations

Promoting inclusive growth in Bangladesh through special economic zones
52 | EDIG Research Paper Three
Table A5.4: Impact of doubling investment GDP (by subsector and total) Base (million TK
in constant prices)
Simulated values (due to shock)
(mill Tk in constant prices)
% change Average per year change
over 12 years (%)
Agriculture south-west 337610 420582 24.58 2.05
Agriculture north-west 506153 631352 24.74 2.06
Agriculture greater Dhaka 432661 537261 24.18 2.01
Agriculture greater Chittagong 332936 414167 24.4 2.03
Total agriculture 1609359 2003362 24.48 2.04
Manufacturing south-west 151209 175666 16.17 1.35
Manufacturing north-west 181341 215016 18.57 1.55
Manufacturing greater Dhaka 820906 925661 12.76 1.06
Manufacturing greater Chittagong 319839 366290 14.52 1.21
Total manufacturing 1473296 1682632 14.21 1.18
Construction south-west 131622 260593 97.99 8.17
Construction north-west 183104 362961 98.23 8.19
Construction greater Dhaka 253528 476856 88.09 7.34
Construction greater Chittagong 165688 311919 88.26 7.35
Total construction 733942 1412329 92.43 7.7
Utilities south-west 14398 18139 25.98 2.17
Utilities north-west 20062 25226 25.74 2.14
Utilities greater Dhaka 55575 62887 13.16 1.1
Utilities greater Chittagong 25393 30529 20.22 1.69
Total utilities 115428 136781 18.5 1.54
Mining south-west 7260 11738 61.67 5.14
Mining north-west 3604 5424 50.52 4.21
Mining greater Dhaka 4291 6647 54.88 4.57
Mining greater Chittagong 41960 69153 64.8 5.4
Total mining 57115 92961 62.76 5.23
Services south-west 678284 847466 24.94 2.08
Services north-west 863318 1082679 25.41 2.12
Services greater Dhaka 1887691 2303490 22.03 1.84
Services greater Chittagong 1226240 1515930 23.62 1.97
Total services 4655533 5749565 23.5 1.96
South-west GDP 1320382 1734184 31.34 2.61
North-west GDP 1757582 2322659 32.15 2.68
Greater Dhaka GDP 3454652 4312801 24.84 2.07
Greater Chittagong GDP 2112057 2707987 28.22 2.35
All Bangladesh 8644673 11077630 28.14 2.35
Source: Authors’ simulations

Promoting inclusive growth in Bangladesh through special economic zones
53 | EDIG Research Paper Three
ANNEX 6: CHANGES IN EMPLOYMENT BY HOUSEHOLD TYPES BY DIFFERENT REGIONS
Simulation 1: Additional SEZ exports by $40 billion under the existing production structure by regions
South-west
North-west Greater Dhaka
Greater Chittagong
All Bangladesh
Small farm SW 0.01663 0.02494 0.06061 0.03146 0.13363
Small farm NW 0.02111 0.03166 0.07697 0.03994 0.16968
Small farm Dhaka 0.04380 0.06570 0.15969 0.08288 0.35206
Small farm Chittagong 0.02700 0.04049 0.09843 0.05108 0.21700
Large farm SW 0.00421 0.00632 0.01537 0.00797 0.03388
Large farm NW 0.00577 0.00865 0.02102 0.01091 0.04635
Large farm Dhaka 0.01229 0.01844 0.04481 0.02326 0.09880
Large farm Chittagong 0.00738 0.01106 0.02689 0.01395 0.05928
Non-farm SW 0.01409 0.02113 0.05135 0.02665 0.11322
Non-farm NW 0.01902 0.02852 0.06933 0.03598 0.15284
Non-farm Dhaka 0.03960 0.05939 0.14436 0.07492 0.31827
Non-farm Chittagong 0.02507 0.03760 0.09138 0.04743 0.20147
Lower-skilled SW 0.01020 0.01530 0.03718 0.01930 0.08197
Lower-skilled NW 0.01377 0.02065 0.05020 0.02605 0.11067
Lower-skilled Dhaka 0.02948 0.04421 0.10746 0.05577 0.23692
Lower-skilled Chittagong 0.01734 0.02601 0.06323 0.03281 0.13939
Higher-skilled SW 0.01604 0.02405 0.05846 0.03034 0.12888
Higher-skilled NW 0.02165 0.03247 0.07892 0.04096 0.17399
Higher-skilled Dhaka 0.04587 0.06880 0.16723 0.08679 0.36869
Higher-skilled Chittagong 0.02774 0.04161 0.10113 0.05249 0.22297
Simulation 2: Impact of generating additional $20 billion exports from north-west and south-west regions
South-west
North-west Greater Dhaka
Greater Chittagong
All Bangladesh
Small farm SW 0.02830 0.03905 0.08057 0.04738 0.19531
Small farm NW 0.03334 0.04633 0.09490 0.05544 0.23000
Small farm Dhaka 0.04915 0.07104 0.13990 0.07870 0.33878
Small farm Chittagong 0.03029 0.04379 0.08623 0.04851 0.20881
Large farm SW 0.00473 0.00684 0.01346 0.00757 0.03260
Large farm NW 0.00647 0.00935 0.01842 0.01036 0.04460
Large farm Dhaka 0.01379 0.01994 0.03926 0.02208 0.09507
Large farm Chittagong 0.00827 0.01196 0.02356 0.01325 0.05704
Non-farm SW 0.02545 0.03493 0.07246 0.04282 0.17567
Non-farm NW 0.03099 0.04293 0.08820 0.05168 0.21380
Non-farm Dhaka 0.04443 0.06422 0.12647 0.07114 0.30626
Non-farm Chittagong 0.02812 0.04065 0.08006 0.04503 0.19387
Lower-skilled SW 0.01144 0.01654 0.03257 0.01832 0.07888
Lower-skilled NW 0.02510 0.03442 0.07144 0.04225 0.17321
Lower-skilled Dhaka 0.04272 0.05990 0.12161 0.07047 0.29470
Lower-skilled Chittagong 0.01946 0.02813 0.05539 0.03116 0.13413
Higher-skilled SW 0.01799 0.02601 0.05121 0.02881 0.12402
Higher-skilled NW 0.02429 0.03511 0.06914 0.03889 0.16743
Higher-skilled Dhaka 0.01287 0.02604 0.03663 0.01236 0.08789
Higher-skilled Chittagong 0.03113 0.04499 0.08860 0.04984 0.21456


