
2016
California Department
of Transportation
Project Prioritization Criteria for the SHOPP Asset Management Pilot Program

Project Prioritization Criteria Page 1
Table of Contents Acknowledgments ......................................................................................................................................... 3
Executive Summary ....................................................................................................................................... 4
1 Introduction .......................................................................................................................................... 6
2 Background ........................................................................................................................................... 7
3 Goal 1: Safety and Health ..................................................................................................................... 9
3.1 Safety ............................................................................................................................................ 9
3.1.1 User Safety ............................................................................................................................ 9
3.1.2 Worker Safety ..................................................................................................................... 10
3.2 Health .......................................................................................................................................... 12
3.2.1 Air Quality ........................................................................................................................... 12
3.2.2 Active Transportation ......................................................................................................... 13
4 Goal 2: Stewardship and Efficiency..................................................................................................... 15
4.1 Asset Condition ........................................................................................................................... 15
4.2 Consequence of Conditional Failure ........................................................................................... 16
4.3 Traffic Volume and Freight ......................................................................................................... 16
4.4 Project Funding ........................................................................................................................... 17
4.5 Combining Stewardship Factors ................................................................................................. 17
4.6 Relinquishment of Asset ............................................................................................................. 17
5 Goal 3: Sustainability, Livability, and Economy .................................................................................. 19
5.1 Tool Research .............................................................................................................................. 19
5.2 Tool Development ....................................................................................................................... 20
5.2.1 People ................................................................................................................................. 20
5.2.2 Planet .................................................................................................................................. 21
5.2.3 Prosperity ............................................................................................................................ 21
5.3 Scoring ......................................................................................................................................... 22
5.4 Cross-Goal Issue .......................................................................................................................... 23
6 Goal 4: System Performance .............................................................................................................. 24
6.1 Delay Reduction .......................................................................................................................... 24
6.2 System Reliability ........................................................................................................................ 25
6.3 Corridor Management and Integration ...................................................................................... 26
6.4 Complete Streets ........................................................................................................................ 27
Project Prioritization Criteria Page 2
6.5 Final Score ................................................................................................................................... 28
7 Goal 5: Organizational Excellence ....................................................................................................... 29
7.1 Employee Engagement and Innovation ...................................................................................... 29
7.2 Collaborative Partnerships .......................................................................................................... 29
7.3 Skilled Communication ............................................................................................................... 30
7.4 Effective Decision Making through Risk Management ............................................................... 30
7.5 Qualitative Self-Evaluation Rubric .............................................................................................. 30
8 Cumulative Benefit ............................................................................................................................. 33
8.1 The Linear Additive Model .......................................................................................................... 33
8.2 The Analytic Hierarchy Process ................................................................................................... 34
8.3 The Magnitude Factors ............................................................................................................... 37
8.3.1 No Magnitude Factor .......................................................................................................... 38
8.3.2 Single Magnitude Factor ..................................................................................................... 38
8.3.3 Multiple Magnitude Factors................................................................................................ 39
9 Benefit-Cost Analysis .......................................................................................................................... 41
10 Future Needs ...................................................................................................................................... 42
References .................................................................................................................................................. 43
Appendix A: Crash Modification Factors for Spot Locations and Systemic Safety ..................................... 44
Appendix B: Raw and Normalized Scores of the Nominated Projects ........................................................ 49
Appendix C: Ranks of the Nominated Projects under No Magnitude Factor Assumption ......................... 51
Appendix D: Ranks of the Nominated Projects under Single Magnitude Factor Assumption .................... 52
Appendix E: Typical Project Activities ......................................................................................................... 53
Appendix F: Multiple Magnitude Factors of the Nominated Projects ........................................................ 54
Appendix G: Ranks of the Nominated Projects under Multiple Magnitude Factor Assumption ................ 55
Appendix H: Complete Streets Tally Sheet ................................................................................................. 56
Project Prioritization Criteria Page 3
Acknowledgments
The completion of the Asset Management Pilot Program marks a significant milestone in
the implementation of asset management in California. This pilot program would not have
been possible without significant support and contributions from numerous sources. The
willingness of Caltrans employees to embrace the pilot program objectives is greatly
appreciated. This pilot program challenged project proposers to be creative in developing
new approaches to project justification in a short nomination time window. The
nominations for this program were creative, innovative, and collaborative in nature. The
subject matter expert review teams were challenged with developing objective data driven
project evaluation criteria and testing the criteria on the project nominations. Over eighty
subject matter experts were involved in developing evaluation criteria and scoring of the
thirty seven project nominations. The five goal team leaders provided the guidance and
perseverance to arrive at criteria that reflected the sometimes diverse perspectives of the
team members. Their efforts are greatly appreciated. I would also like to acknowledge the
contributions from the Division of Research and Innovation and System Information for the
development of the Analytical Hierarchy Process tool and assistance drafting this report.
Finally, the support of Director Dougherty, Deputy Directors and District Directors was
instrumental in making this pilot happen. I would like to acknowledge and thank the many
contributors from across the department who helped make this pilot a success.
Michael B. Johnson, P.E.
State Asset Management Engineer
Project Prioritization Criteria Page 4
Executive Summary
Caltrans has federal and state requirements to prepare a robust transportation asset
management plan. This plan has to provide guidelines for the prioritization of projects in
the State Highway Operation and Protection Program (SHOPP). Two pilot programs were
initiated to lay the foundation for the development of these guidelines. The 2014 SHOPP
Project Prioritization Pilot Program evaluated the viability of a Multi-Objective Decision
Analysis (MODA) approach for the prioritization of disparate assets. The 2016 SHOPP
Asset Management Pilot Program refined the project prioritization parameters,
incorporated the Caltrans Strategic Management Plan 2015-2020 [10], and applied the
revised model to multi-objective projects nominated under the pilot program. This report
documents the 2016 SHOPP Asset Management Pilot Program project prioritization criteria
and calculation methodology.
The 2016 SHOPP Asset Management Pilot Program began with a call for project
nominations in July 2015. The nominations were required to include at least three
different departmental assets or objectives and were capped at a maximum project value of
$20 million. Each of the Caltrans twelve districts nominated at least one project under this
pilot program. In total, 37 nominations were received. Five subject matter expert review
teams were established to evaluate the nominated projects. Each team developed criteria
to evaluate the nominated projects for one of the departmental strategic goals. The subject
matter expert teams then applied their evaluation criteria to each of the nominations
developing a score for each of the five strategic plan goals. The scores reflect how well the
project contributes to the departmental strategic goals. Each project received five different
scores corresponding to each strategic goal. An executive leadership group used the
Analytic Hierarchy Process (AHP) to determine the weights for each of the five
departmental strategic goals. A linear additive model then used the goal weights to
combine the five goal scores into a single cumulative benefit. The weighted scores were
adjusted using a magnitude factor to reflect the magnitude of the asset or objective which
were improved. The projects’ cumulative benefits were then divided by the projects’ total
SHOPP costs. The benefit to cost ratios were used to rank the projects from highest to
lowest. Projects were selected from the top until the available planning target capacity of
$100 million had been exhausted. In total, nine projects were selected to move into the
formal planning process for possible programming in the 2018 SHOPP.
The 2016 SHOPP Asset Management Pilot Program resulted in the development of a
transparent project prioritization criteria for the SHOPP, determined information that is
needed at planning stages in order to perform the prioritization, tested the concept of
funding multiple objectives in a single project, and established initial departmental
strategic goal weights. The results from this pilot program will be evaluated by external
academic decision analysis experts for potential improvements in the formation of the
Project Prioritization Criteria Page 5
objectives. Sensitivity analyses will be conducted to determine if the data driving the
prioritization is appropriately influencing the overall results. An evaluation of the
influence of traffic volumes will be undertaken to ensure that both rural and urban
transportation projects are equitably competing. The findings from this external review
will be used to improve the prioritization models for future application.
Project Prioritization Criteria Page 6
1 Introduction
Caltrans has Federal [1, 2] and State [13] requirements to prepare a robust transportation
asset management plan. This plan has to provide guidelines for the prioritization of
projects in the State Highway Operation and Protection Program (SHOPP). The 2016
SHOPP Asset Management Pilot Program project prioritization criteria marks a significant
step toward the establishment of a transparent project selection criteria for the SHOPP.
The Project Prioritization Criteria 2016 aligned the project prioritization process with the
five strategic goals which the Caltrans Strategic Management Plan 2015-2020 [10]
established. These strategic goals are
1. Safety and Health
2. Stewardship and Efficiency
3. Sustainability, Livability, and Economy
4. System Performance
5. Organizational Excellence
The project prioritization criteria provides the following:
1. A methodology to determine a project’s score toward each strategic goal
2. A methodology to evaluate a project’s cumulative benefit toward all strategic goals
3. A top to bottom benefit-cost ratio ranking of competing projects in the SHOPP
This report is intended to capture the methodology used for project prioritization in the
2016 SHOPP Asset Management Pilot Program and should not be considered policy for the
Department.

Project Prioritization Criteria Page 7
2 Background
Caltrans has historically defined projects by a single program element or accounting code
which represents the funding source and implies the nature of the work and
accomplishments. Examples of these program elements include safety improvement
(201.010), bridge major rehabilitation (201.110), and pavement rehabilitation (201.121).
Each of these programs has a primary purpose and one or more measures of performance
related to the primary purpose. Program Managers are allocated a portion of the total
SHOPP funds. Each Program Manager allocates his or her portion to projects which address
the purpose of his or her program. This silo-based allocation approach has discouraged
Program Managers from accommodating objectives other than the primary program
objective. New guidelines are needed to shift the Department’s current silo-based
programming to a goal-oriented project prioritization process.
The 2014 SHOPP Project Prioritization Pilot Program started in July 2014 to propose a new
methodology for the project prioritization process [3]. This pilot program found that a
Multi-Objective Decision Analysis (MODA) framework is the appropriate approach to align
the project prioritization process with the Department’s strategic goals. The MODA
approach provides a pathway around silo-based programming and provides a mechanism
to evaluate all project benefits regardless of asset or objective combination included in the
project. Using the MODA approach, a project receives credit for its contributions toward all
departmental strategic goals and objectives. New goals and objectives, such as
sustainability, which were never tied to the project prioritization process are incorporated.
Overall, the MODA approach provides an improved and transparent project prioritization
process. This pilot program concluded with a report in June 2015 [3].
In July 2015, the 2016 SHOPP Asset Management Pilot Program initiated a call to nominate
multi-objective projects. The nominations were required to include at least three asset
types or have benefits toward at least three departmental strategic objectives. As a result,
each of the Caltrans twelve districts nominated at least one project, and a total of 37
nominations were received. The State Asset Management Engineer initiated five subject
matter expert review teams. Each team was responsible for the following tasks for one
strategic goal:
Divide the goal into a number of underlying strategic objectives
Determine the weight of each strategic objective within its strategic goal,
independent from the other teams and the other strategic goals
Define a methodology to calculate a project’s score toward each strategic objective
Present an equation which combines the objective scores into a goal score
Apply the goal score equation to each of the 37 nominated projects and evaluate the
overall soundness of the outcome
Project Prioritization Criteria Page 8
The efforts of the five subject matter expert review teams are summarized in Sections 3, 4,
5, 6, and 7. An executive leadership group was responsible for determining the weights of
the departmental strategic goals and to calculate the cumulative benefits of the 37
nominated projects. The efforts of this group is summarized in Section 8. At the conclusion
of this pilot program, the Project Prioritization Criteria 2016 was prepared.
Project Prioritization Criteria Page 9
3 Goal 1: Safety and Health
The Goal 1 subject matter expert review team was initiated to develop criteria to determine
a project’s score toward the strategic goal of Safety and Health. The Caltrans Strategic
Management Plan 2015-2020 identifies the following objectives under this strategic goal
[10]:
Zero worker fatalities
Reduce employee injury and illness rates
Reduce user fatalities and injuries by adopting a “Toward Zero Deaths” practice
Promote community health through active transportation and reduced pollution in
communities.
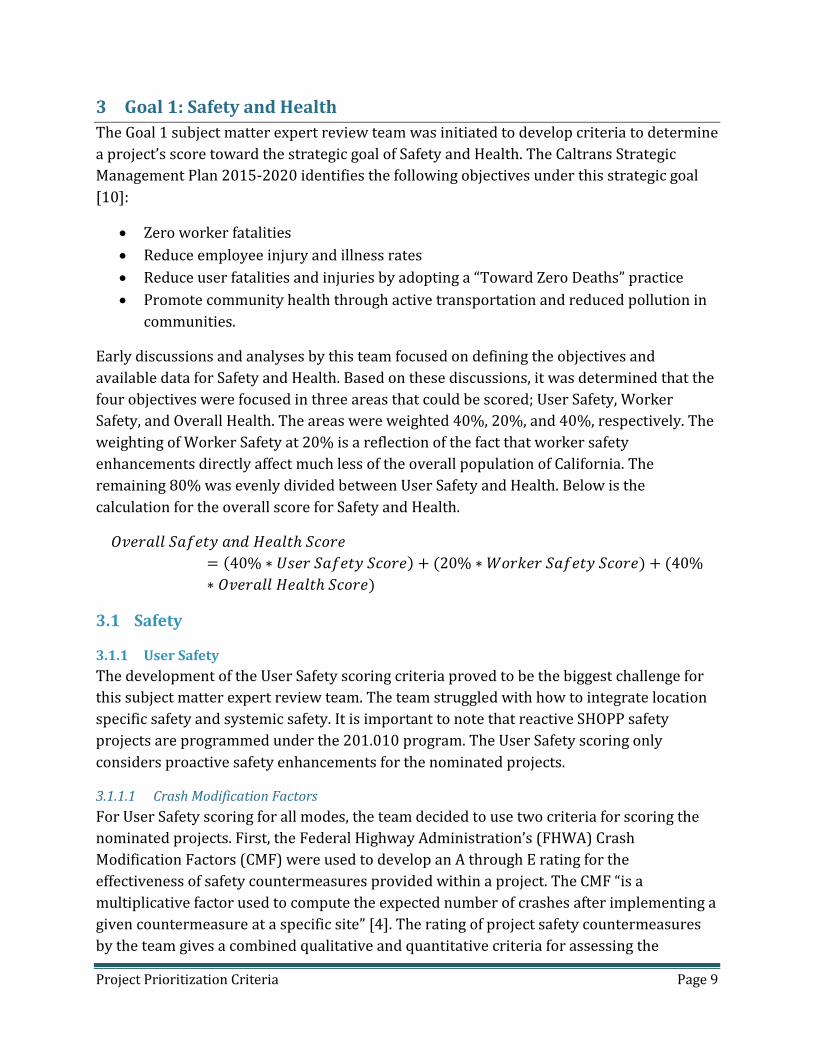
Early discussions and analyses by this team focused on defining the objectives and
available data for Safety and Health. Based on these discussions, it was determined that the
four objectives were focused in three areas that could be scored; User Safety, Worker
Safety, and Overall Health. The areas were weighted 40%, 20%, and 40%, respectively. The
weighting of Worker Safety at 20% is a reflection of the fact that worker safety
enhancements directly affect much less of the overall population of California. The
remaining 80% was evenly divided between User Safety and Health. Below is the
calculation for the overall score for Safety and Health.
𝑂𝑣𝑒𝑟𝑎𝑙𝑙 𝑆𝑎𝑓𝑒𝑡𝑦 𝑎𝑛𝑑 𝐻𝑒𝑎𝑙𝑡ℎ 𝑆𝑐𝑜𝑟𝑒
= (40% ∗ 𝑈𝑠𝑒𝑟 𝑆𝑎𝑓𝑒𝑡𝑦 𝑆𝑐𝑜𝑟𝑒) + (20% ∗ 𝑊𝑜𝑟𝑘𝑒𝑟 𝑆𝑎𝑓𝑒𝑡𝑦 𝑆𝑐𝑜𝑟𝑒) + (40%
∗ 𝑂𝑣𝑒𝑟𝑎𝑙𝑙 𝐻𝑒𝑎𝑙𝑡ℎ 𝑆𝑐𝑜𝑟𝑒)
3.1 Safety
3.1.1 User Safety
The development of the User Safety scoring criteria proved to be the biggest challenge for
this subject matter expert review team. The team struggled with how to integrate location
specific safety and systemic safety. It is important to note that reactive SHOPP safety
projects are programmed under the 201.010 program. The User Safety scoring only
considers proactive safety enhancements for the nominated projects.
3.1.1.1 Crash Modification Factors
For User Safety scoring for all modes, the team decided to use two criteria for scoring the
nominated projects. First, the Federal Highway Administration’s (FHWA) Crash
Modification Factors (CMF) were used to develop an A through E rating for the
effectiveness of safety countermeasures provided within a project. The CMF “is a
multiplicative factor used to compute the expected number of crashes after implementing a
given countermeasure at a specific site” [4]. The rating of project safety countermeasures
by the team gives a combined qualitative and quantitative criteria for assessing the
Project Prioritization Criteria Page 10
nominated projects. The team’s determination on the CMF criteria was rooted in the notion
that proactive safety enhancements, and their degree of safety contribution, would be
crucial to determining criteria for scoring the User Safety objective. Although all modes are
considered, it should be noted that there is very little data available for bicycle
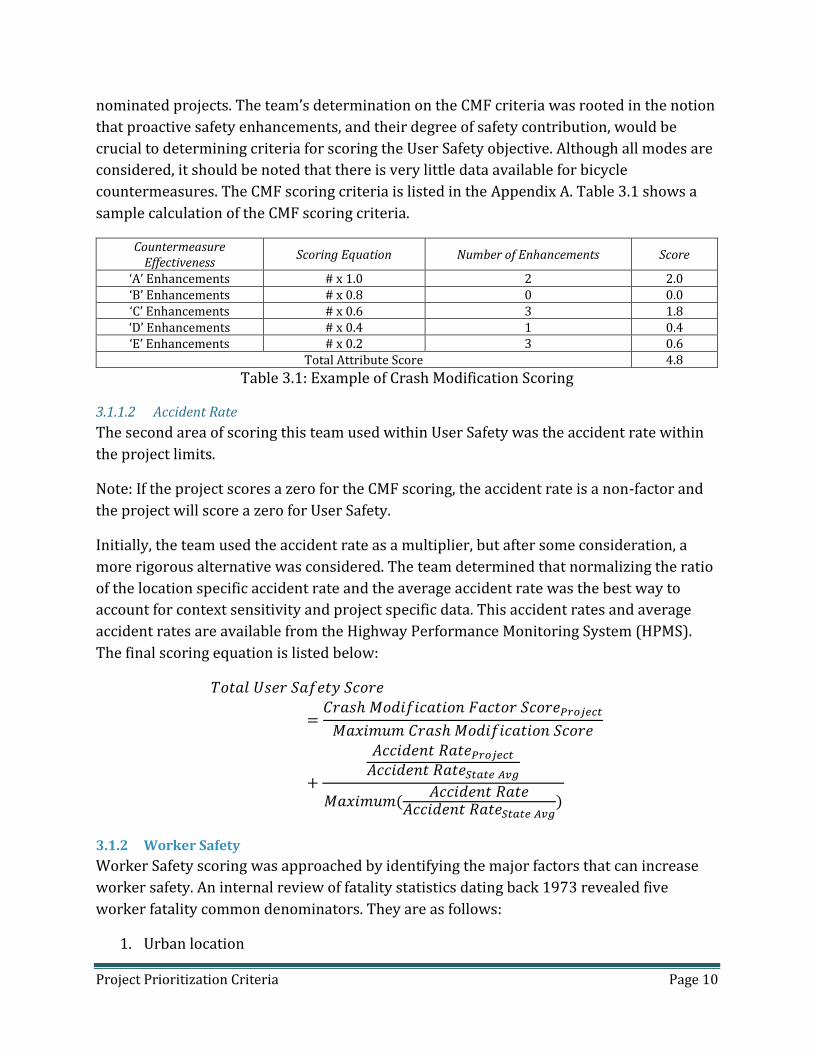
countermeasures. The CMF scoring criteria is listed in the Appendix A. Table 3.1 shows a
sample calculation of the CMF scoring criteria.
Countermeasure Effectiveness
Scoring Equation Number of Enhancements Score
‘A’ Enhancements # x 1.0 2 2.0 ‘B’ Enhancements # x 0.8 0 0.0 ‘C’ Enhancements # x 0.6 3 1.8 ‘D’ Enhancements # x 0.4 1 0.4 ‘E’ Enhancements # x 0.2 3 0.6
Total Attribute Score 4.8
Table 3.1: Example of Crash Modification Scoring
3.1.1.2 Accident Rate
The second area of scoring this team used within User Safety was the accident rate within
the project limits.
Note: If the project scores a zero for the CMF scoring, the accident rate is a non-factor and
the project will score a zero for User Safety.
Initially, the team used the accident rate as a multiplier, but after some consideration, a
more rigorous alternative was considered. The team determined that normalizing the ratio
of the location specific accident rate and the average accident rate was the best way to
account for context sensitivity and project specific data. This accident rates and average
accident rates are available from the Highway Performance Monitoring System (HPMS).
The final scoring equation is listed below:
𝑇𝑜𝑡𝑎𝑙 𝑈𝑠𝑒𝑟 𝑆𝑎𝑓𝑒𝑡𝑦 𝑆𝑐𝑜𝑟𝑒
=𝐶𝑟𝑎𝑠ℎ 𝑀𝑜𝑑𝑖𝑓𝑖𝑐𝑎𝑡𝑖𝑜𝑛 𝐹𝑎𝑐𝑡𝑜𝑟 𝑆𝑐𝑜𝑟𝑒𝑃𝑟𝑜𝑗𝑒𝑐𝑡
𝑀𝑎𝑥𝑖𝑚𝑢𝑚 𝐶𝑟𝑎𝑠ℎ 𝑀𝑜𝑑𝑖𝑓𝑖𝑐𝑎𝑡𝑖𝑜𝑛 𝑆𝑐𝑜𝑟𝑒
+
𝐴𝑐𝑐𝑖𝑑𝑒𝑛𝑡 𝑅𝑎𝑡𝑒𝑃𝑟𝑜𝑗𝑒𝑐𝑡
𝐴𝑐𝑐𝑖𝑑𝑒𝑛𝑡 𝑅𝑎𝑡𝑒𝑆𝑡𝑎𝑡𝑒 𝐴𝑣𝑔
𝑀𝑎𝑥𝑖𝑚𝑢𝑚(𝐴𝑐𝑐𝑖𝑑𝑒𝑛𝑡 𝑅𝑎𝑡𝑒
𝐴𝑐𝑐𝑖𝑑𝑒𝑛𝑡 𝑅𝑎𝑡𝑒𝑆𝑡𝑎𝑡𝑒 𝐴𝑣𝑔)
3.1.2 Worker Safety
Worker Safety scoring was approached by identifying the major factors that can increase
worker safety. An internal review of fatality statistics dating back 1973 revealed five
worker fatality common denominators. They are as follows:
1. Urban location
Project Prioritization Criteria Page 11
2. High Annual Average Daily Traffic (AADT)
3. Roadside work near shoulder
4. Vehicle parked on shoulder
5. Employee on foot
The subject matter expert review team first looked at urban location and High AADT. The
assumption was made by the team that it is implied that a high AADT is in an urban
location. Therefore, only AADT is considered in the scoring criteria. This data is available
from the Highway Performance Monitoring System (HPMS).
Next, the team considered the final three fatality common denominators for worker
exposure; roadside work near shoulder, vehicle parked on shoulder, employee on foot. In
looking at these, the team determined that the exposure mainly has to do with the
proximity to the traveled way and the duration of time spent in the work zone.
Unfortunately, the data for proximity is not available. However, the Integrated Maintenance
Management System (IMMS) does track the time spent by workers in the work zone. The
average time spent within the project limits for each project nomination was used to
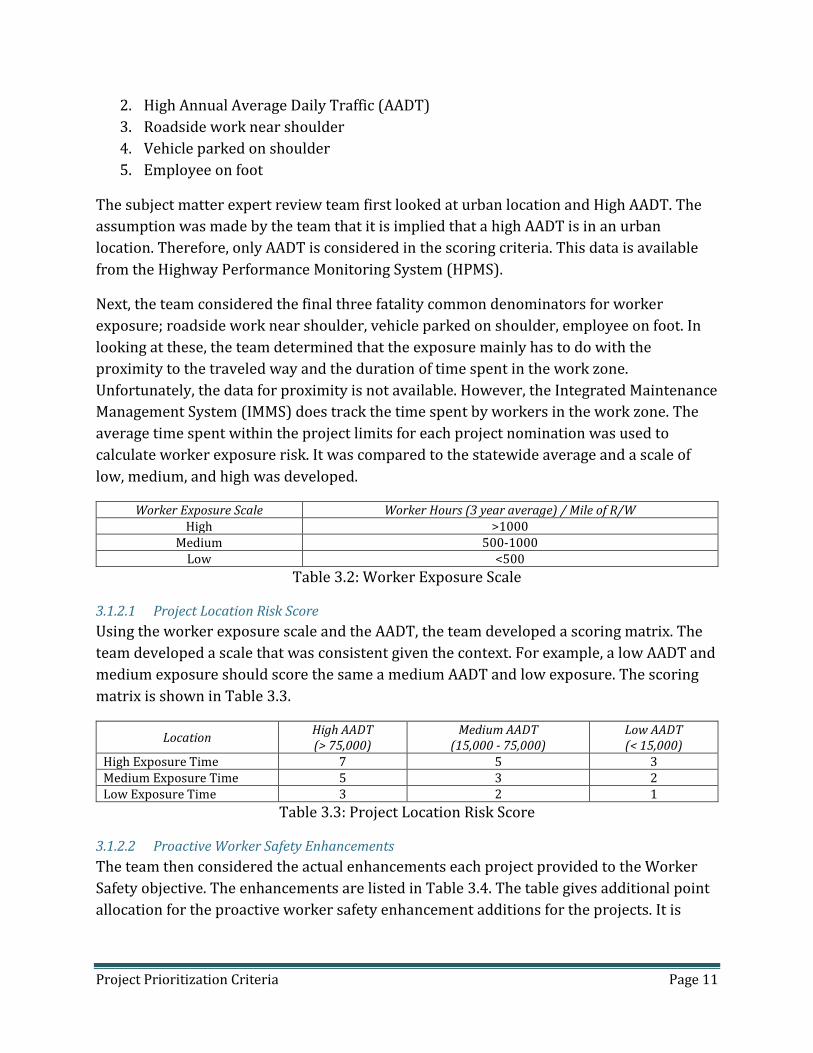
calculate worker exposure risk. It was compared to the statewide average and a scale of
low, medium, and high was developed.
Worker Exposure Scale Worker Hours (3 year average) / Mile of R/W High >1000
Medium 500-1000 Low <500
Table 3.2: Worker Exposure Scale
3.1.2.1 Project Location Risk Score
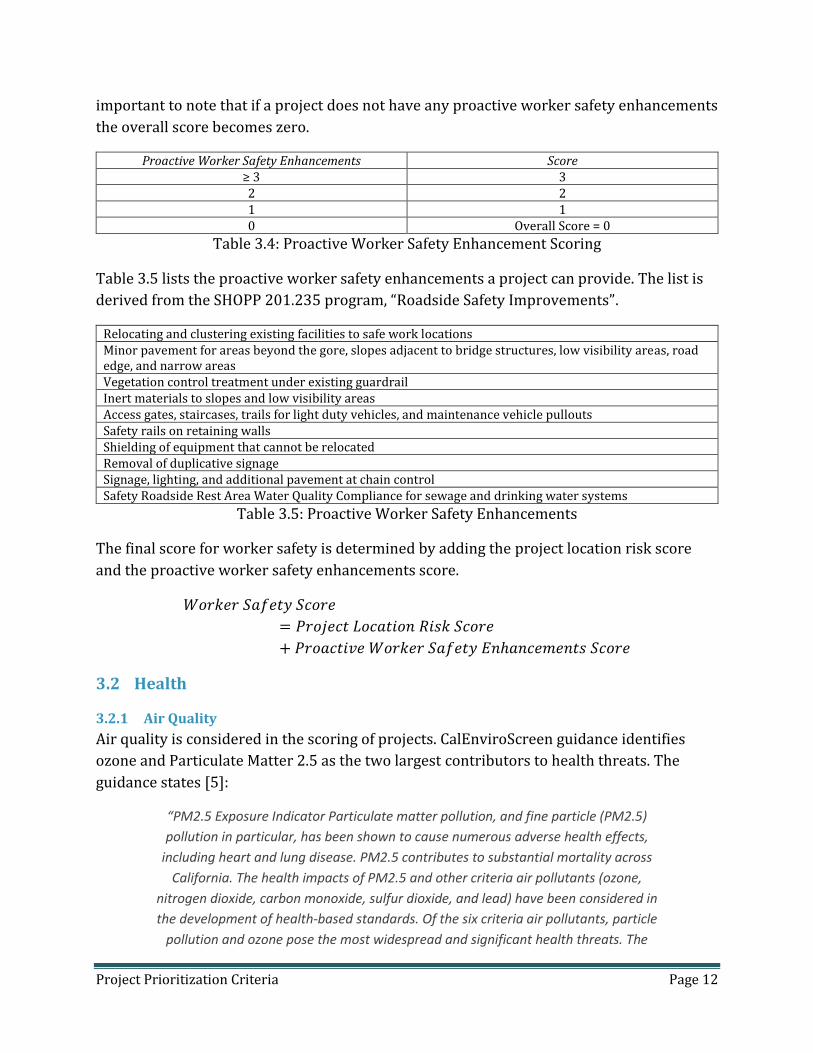
Using the worker exposure scale and the AADT, the team developed a scoring matrix. The
team developed a scale that was consistent given the context. For example, a low AADT and
medium exposure should score the same a medium AADT and low exposure. The scoring
matrix is shown in Table 3.3.
Location High AADT (> 75,000)
Medium AADT (15,000 - 75,000)
Low AADT (< 15,000)
High Exposure Time 7 5 3 Medium Exposure Time 5 3 2 Low Exposure Time 3 2 1
Table 3.3: Project Location Risk Score
3.1.2.2 Proactive Worker Safety Enhancements
The team then considered the actual enhancements each project provided to the Worker
Safety objective. The enhancements are listed in Table 3.4. The table gives additional point
allocation for the proactive worker safety enhancement additions for the projects. It is
Project Prioritization Criteria Page 12
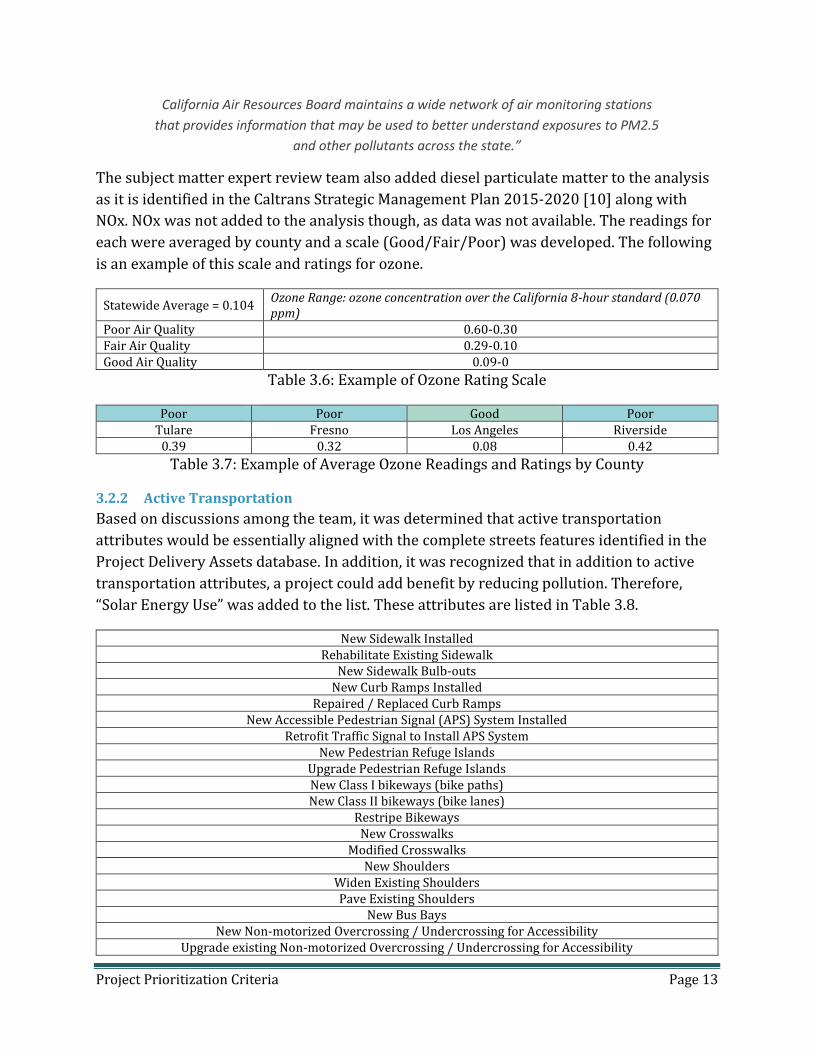
important to note that if a project does not have any proactive worker safety enhancements
the overall score becomes zero.
Proactive Worker Safety Enhancements Score ≥ 3 3 2 2 1 1 0 Overall Score = 0
Table 3.4: Proactive Worker Safety Enhancement Scoring
Table 3.5 lists the proactive worker safety enhancements a project can provide. The list is
derived from the SHOPP 201.235 program, “Roadside Safety Improvements”.
Relocating and clustering existing facilities to safe work locations Minor pavement for areas beyond the gore, slopes adjacent to bridge structures, low visibility areas, road edge, and narrow areas Vegetation control treatment under existing guardrail Inert materials to slopes and low visibility areas Access gates, staircases, trails for light duty vehicles, and maintenance vehicle pullouts Safety rails on retaining walls Shielding of equipment that cannot be relocated Removal of duplicative signage Signage, lighting, and additional pavement at chain control Safety Roadside Rest Area Water Quality Compliance for sewage and drinking water systems
Table 3.5: Proactive Worker Safety Enhancements
The final score for worker safety is determined by adding the project location risk score
and the proactive worker safety enhancements score.
𝑊𝑜𝑟𝑘𝑒𝑟 𝑆𝑎𝑓𝑒𝑡𝑦 𝑆𝑐𝑜𝑟𝑒
= 𝑃𝑟𝑜𝑗𝑒𝑐𝑡 𝐿𝑜𝑐𝑎𝑡𝑖𝑜𝑛 𝑅𝑖𝑠𝑘 𝑆𝑐𝑜𝑟𝑒
+ 𝑃𝑟𝑜𝑎𝑐𝑡𝑖𝑣𝑒 𝑊𝑜𝑟𝑘𝑒𝑟 𝑆𝑎𝑓𝑒𝑡𝑦 𝐸𝑛ℎ𝑎𝑛𝑐𝑒𝑚𝑒𝑛𝑡𝑠 𝑆𝑐𝑜𝑟𝑒
3.2 Health
3.2.1 Air Quality
Air quality is considered in the scoring of projects. CalEnviroScreen guidance identifies
ozone and Particulate Matter 2.5 as the two largest contributors to health threats. The
guidance states [5]:
“PM2.5 Exposure Indicator Particulate matter pollution, and fine particle (PM2.5)
pollution in particular, has been shown to cause numerous adverse health effects,
including heart and lung disease. PM2.5 contributes to substantial mortality across
California. The health impacts of PM2.5 and other criteria air pollutants (ozone,
nitrogen dioxide, carbon monoxide, sulfur dioxide, and lead) have been considered in
the development of health-based standards. Of the six criteria air pollutants, particle
pollution and ozone pose the most widespread and significant health threats. The
Project Prioritization Criteria Page 13
California Air Resources Board maintains a wide network of air monitoring stations
that provides information that may be used to better understand exposures to PM2.5
and other pollutants across the state.”
The subject matter expert review team also added diesel particulate matter to the analysis
as it is identified in the Caltrans Strategic Management Plan 2015-2020 [10] along with
NOx. NOx was not added to the analysis though, as data was not available. The readings for
each were averaged by county and a scale (Good/Fair/Poor) was developed. The following
is an example of this scale and ratings for ozone.
Statewide Average = 0.104 Ozone Range: ozone concentration over the California 8-hour standard (0.070 ppm)
Poor Air Quality 0.60-0.30 Fair Air Quality 0.29-0.10 Good Air Quality 0.09-0
Table 3.6: Example of Ozone Rating Scale
Poor Poor Good Poor Tulare Fresno Los Angeles Riverside
0.39 0.32 0.08 0.42
Table 3.7: Example of Average Ozone Readings and Ratings by County
3.2.2 Active Transportation
Based on discussions among the team, it was determined that active transportation
attributes would be essentially aligned with the complete streets features identified in the
Project Delivery Assets database. In addition, it was recognized that in addition to active
transportation attributes, a project could add benefit by reducing pollution. Therefore,
“Solar Energy Use” was added to the list. These attributes are listed in Table 3.8.
New Sidewalk Installed Rehabilitate Existing Sidewalk
New Sidewalk Bulb-outs New Curb Ramps Installed
Repaired / Replaced Curb Ramps New Accessible Pedestrian Signal (APS) System Installed
Retrofit Traffic Signal to Install APS System New Pedestrian Refuge Islands
Upgrade Pedestrian Refuge Islands New Class I bikeways (bike paths) New Class II bikeways (bike lanes)
Restripe Bikeways New Crosswalks
Modified Crosswalks New Shoulders
Widen Existing Shoulders Pave Existing Shoulders
New Bus Bays New Non-motorized Overcrossing / Undercrossing for Accessibility
Upgrade existing Non-motorized Overcrossing / Undercrossing for Accessibility

Project Prioritization Criteria Page 14
Lightings Bike / Ped Signage
New Sidewalk Installed Solar Energy Use
Table 3.8: Active Transportation Attributes
Once the projects are analyzed for active transportation attributes and rated for air quality,
the score is determined from Table 3.9.
Active Transportation Attributes Poor Air Quality Fair Air Quality Good Air Quality ≥ 6 10 8 6 3-5 8 6 4 < 3 6 4 2
Table 3.9: Health Scoring
Project Prioritization Criteria Page 15
4 Goal 2: Stewardship and Efficiency
The Goal 2 subject matter expert review team was initiated to develop criteria to determine
a project’s score toward the strategic goal of Stewardship and Efficiency. The Caltrans
Strategic Management Plan 2015-2020 identifies a number of objectives under this
strategic goal [10], from which the following objectives have applications to the SHOPP:
Effectively manage transportation assets by implementing the asset management
plan and embracing a "fix it first philosophy".
Effectively manage taxpayer funds and maximize the use of available financial
resources.
Assign ownership of transportation facilities, including roads and streets to the
appropriate level of government.
From these strategic objectives, a number of performance measures are defined related to
the condition of assets, leveraging the use of non-state funding sources, and relinquishment
of appropriate transportation facilities. Each of these objectives have been incorporated
into the project prioritization process as detailed below.
4.1 Asset Condition
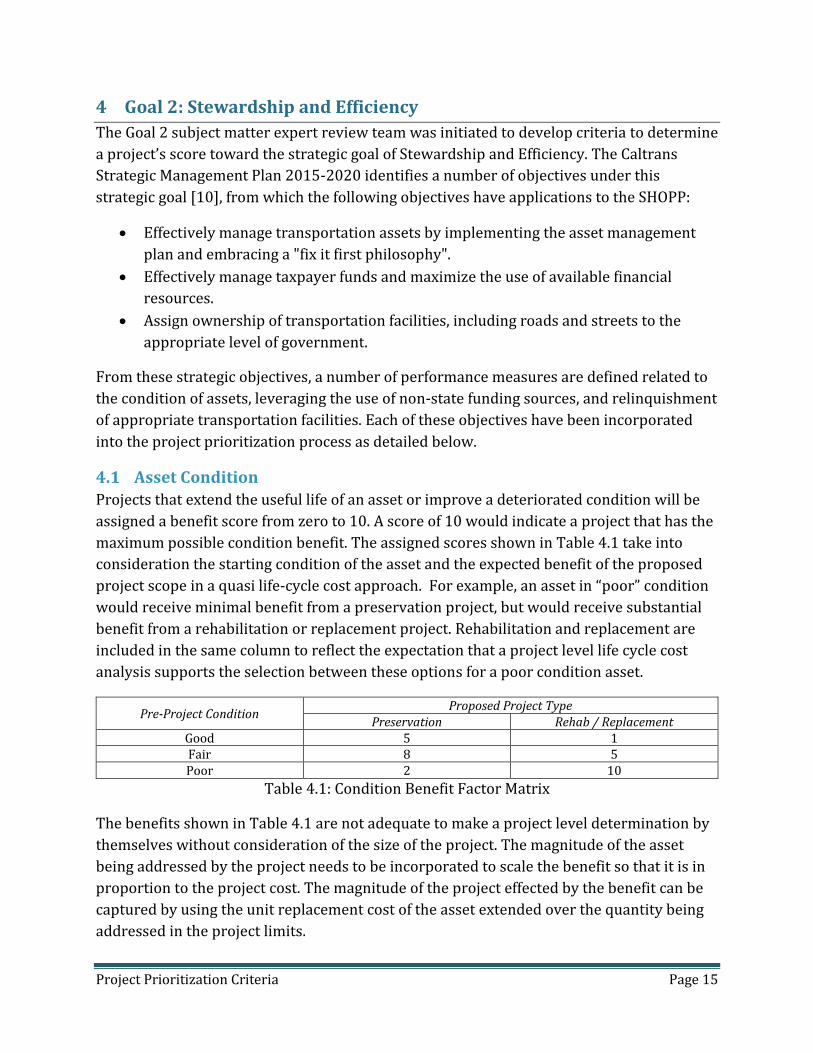
Projects that extend the useful life of an asset or improve a deteriorated condition will be
assigned a benefit score from zero to 10. A score of 10 would indicate a project that has the
maximum possible condition benefit. The assigned scores shown in Table 4.1 take into
consideration the starting condition of the asset and the expected benefit of the proposed
project scope in a quasi life-cycle cost approach. For example, an asset in “poor” condition
would receive minimal benefit from a preservation project, but would receive substantial
benefit from a rehabilitation or replacement project. Rehabilitation and replacement are
included in the same column to reflect the expectation that a project level life cycle cost
analysis supports the selection between these options for a poor condition asset.
Pre-Project Condition Proposed Project Type
Preservation Rehab / Replacement Good 5 1 Fair 8 5 Poor 2 10
Table 4.1: Condition Benefit Factor Matrix
The benefits shown in Table 4.1 are not adequate to make a project level determination by
themselves without consideration of the size of the project. The magnitude of the asset
being addressed by the project needs to be incorporated to scale the benefit so that it is in
proportion to the project cost. The magnitude of the project effected by the benefit can be
captured by using the unit replacement cost of the asset extended over the quantity being
addressed in the project limits.
Project Prioritization Criteria Page 16
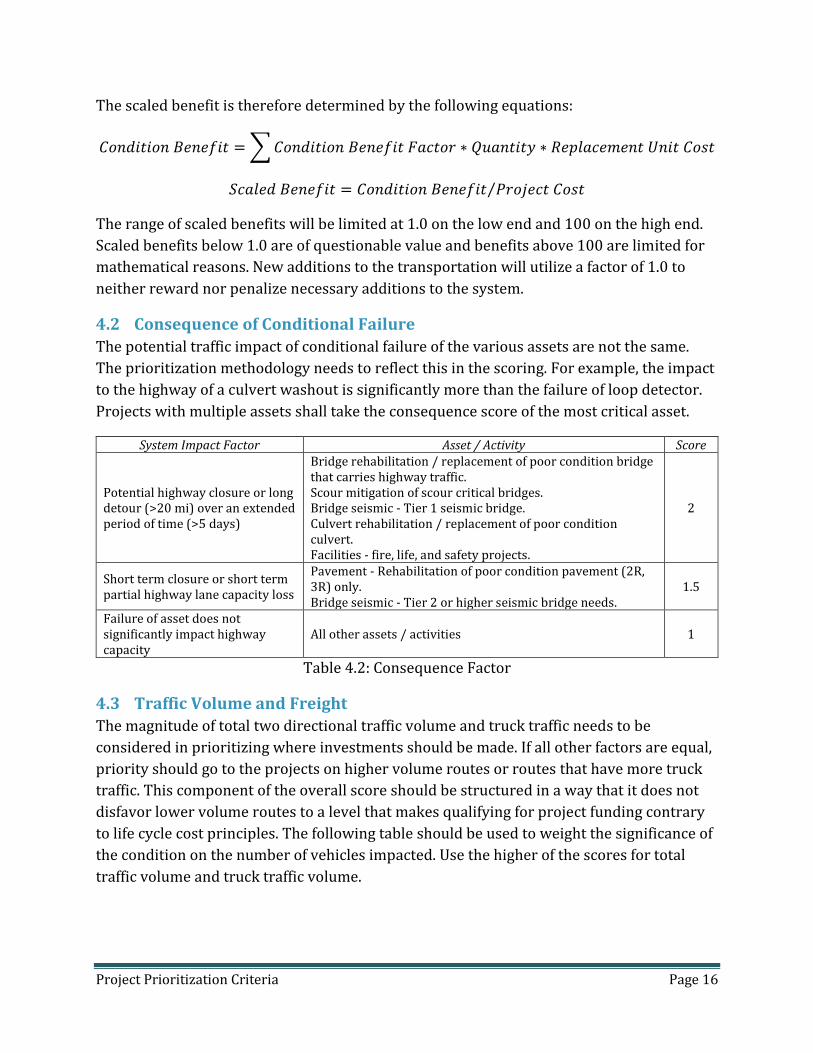
The scaled benefit is therefore determined by the following equations:
𝐶𝑜𝑛𝑑𝑖𝑡𝑖𝑜𝑛 𝐵𝑒𝑛𝑒𝑓𝑖𝑡 = ∑ 𝐶𝑜𝑛𝑑𝑖𝑡𝑖𝑜𝑛 𝐵𝑒𝑛𝑒𝑓𝑖𝑡 𝐹𝑎𝑐𝑡𝑜𝑟 ∗ 𝑄𝑢𝑎𝑛𝑡𝑖𝑡𝑦 ∗ 𝑅𝑒𝑝𝑙𝑎𝑐𝑒𝑚𝑒𝑛𝑡 𝑈𝑛𝑖𝑡 𝐶𝑜𝑠𝑡
𝑆𝑐𝑎𝑙𝑒𝑑 𝐵𝑒𝑛𝑒𝑓𝑖𝑡 = 𝐶𝑜𝑛𝑑𝑖𝑡𝑖𝑜𝑛 𝐵𝑒𝑛𝑒𝑓𝑖𝑡 𝑃𝑟𝑜𝑗𝑒𝑐𝑡 𝐶𝑜𝑠𝑡⁄
The range of scaled benefits will be limited at 1.0 on the low end and 100 on the high end.
Scaled benefits below 1.0 are of questionable value and benefits above 100 are limited for
mathematical reasons. New additions to the transportation will utilize a factor of 1.0 to
neither reward nor penalize necessary additions to the system.
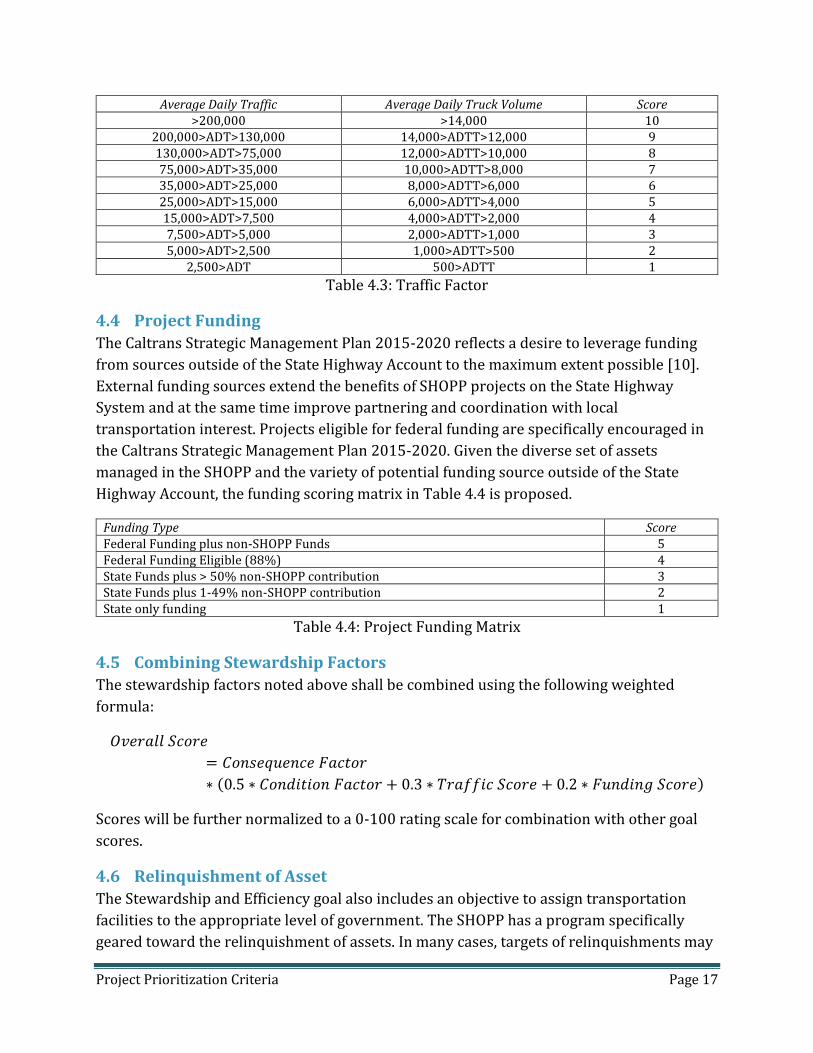
4.2 Consequence of Conditional Failure
The potential traffic impact of conditional failure of the various assets are not the same.
The prioritization methodology needs to reflect this in the scoring. For example, the impact
to the highway of a culvert washout is significantly more than the failure of loop detector.
Projects with multiple assets shall take the consequence score of the most critical asset.
System Impact Factor Asset / Activity Score
Potential highway closure or long detour (>20 mi) over an extended period of time (>5 days)
Bridge rehabilitation / replacement of poor condition bridge that carries highway traffic. Scour mitigation of scour critical bridges. Bridge seismic - Tier 1 seismic bridge. Culvert rehabilitation / replacement of poor condition culvert. Facilities - fire, life, and safety projects.
2
Short term closure or short term partial highway lane capacity loss
Pavement - Rehabilitation of poor condition pavement (2R, 3R) only. Bridge seismic - Tier 2 or higher seismic bridge needs.
1.5
Failure of asset does not significantly impact highway capacity
All other assets / activities 1
Table 4.2: Consequence Factor
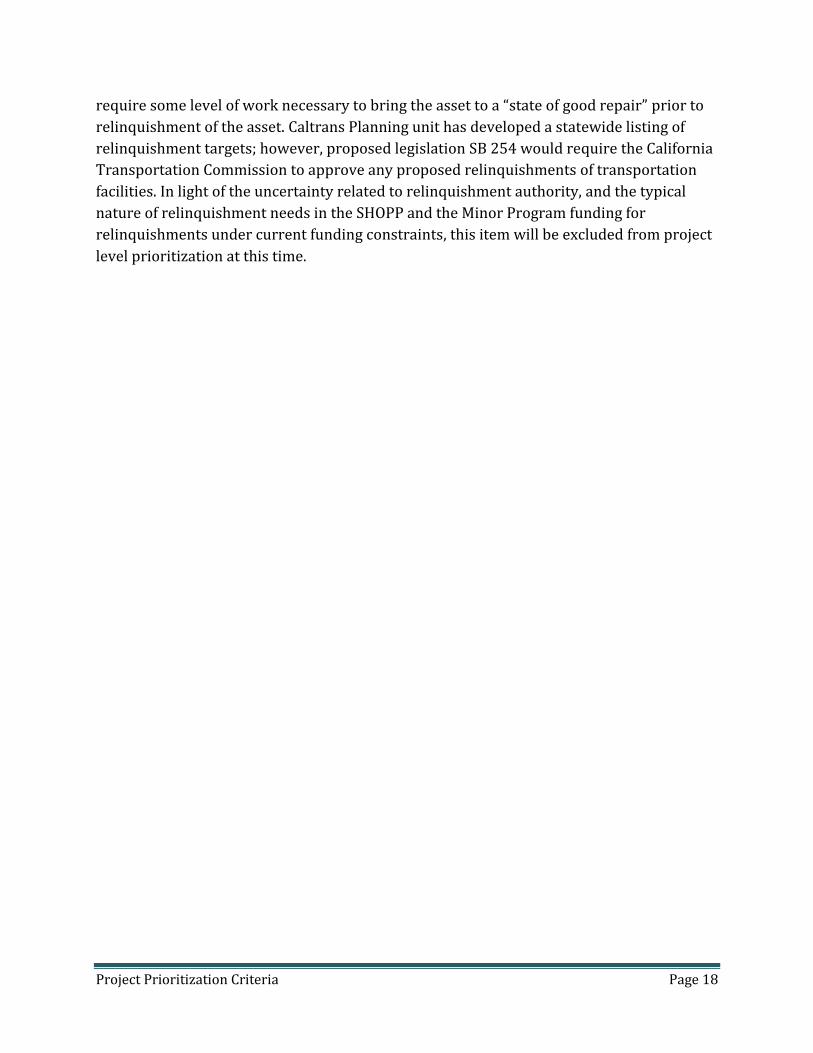
4.3 Traffic Volume and Freight
The magnitude of total two directional traffic volume and truck traffic needs to be
considered in prioritizing where investments should be made. If all other factors are equal,
priority should go to the projects on higher volume routes or routes that have more truck
traffic. This component of the overall score should be structured in a way that it does not
disfavor lower volume routes to a level that makes qualifying for project funding contrary
to life cycle cost principles. The following table should be used to weight the significance of
the condition on the number of vehicles impacted. Use the higher of the scores for total
traffic volume and truck traffic volume.
Project Prioritization Criteria Page 17
Average Daily Traffic Average Daily Truck Volume Score >200,000 >14,000 10
200,000>ADT>130,000 14,000>ADTT>12,000 9 130,000>ADT>75,000 12,000>ADTT>10,000 8 75,000>ADT>35,000 10,000>ADTT>8,000 7 35,000>ADT>25,000 8,000>ADTT>6,000 6 25,000>ADT>15,000 6,000>ADTT>4,000 5 15,000>ADT>7,500 4,000>ADTT>2,000 4 7,500>ADT>5,000 2,000>ADTT>1,000 3 5,000>ADT>2,500 1,000>ADTT>500 2
2,500>ADT 500>ADTT 1
Table 4.3: Traffic Factor
4.4 Project Funding
The Caltrans Strategic Management Plan 2015-2020 reflects a desire to leverage funding
from sources outside of the State Highway Account to the maximum extent possible [10].
External funding sources extend the benefits of SHOPP projects on the State Highway
System and at the same time improve partnering and coordination with local
transportation interest. Projects eligible for federal funding are specifically encouraged in
the Caltrans Strategic Management Plan 2015-2020. Given the diverse set of assets
managed in the SHOPP and the variety of potential funding source outside of the State
Highway Account, the funding scoring matrix in Table 4.4 is proposed.
Funding Type Score Federal Funding plus non-SHOPP Funds 5 Federal Funding Eligible (88%) 4 State Funds plus > 50% non-SHOPP contribution 3 State Funds plus 1-49% non-SHOPP contribution 2 State only funding 1
Table 4.4: Project Funding Matrix
4.5 Combining Stewardship Factors
The stewardship factors noted above shall be combined using the following weighted
formula:
𝑂𝑣𝑒𝑟𝑎𝑙𝑙 𝑆𝑐𝑜𝑟𝑒
= 𝐶𝑜𝑛𝑠𝑒𝑞𝑢𝑒𝑛𝑐𝑒 𝐹𝑎𝑐𝑡𝑜𝑟
∗ (0.5 ∗ 𝐶𝑜𝑛𝑑𝑖𝑡𝑖𝑜𝑛 𝐹𝑎𝑐𝑡𝑜𝑟 + 0.3 ∗ 𝑇𝑟𝑎𝑓𝑓𝑖𝑐 𝑆𝑐𝑜𝑟𝑒 + 0.2 ∗ 𝐹𝑢𝑛𝑑𝑖𝑛𝑔 𝑆𝑐𝑜𝑟𝑒)
Scores will be further normalized to a 0-100 rating scale for combination with other goal
scores.
4.6 Relinquishment of Asset
The Stewardship and Efficiency goal also includes an objective to assign transportation
facilities to the appropriate level of government. The SHOPP has a program specifically
geared toward the relinquishment of assets. In many cases, targets of relinquishments may
Project Prioritization Criteria Page 18
require some level of work necessary to bring the asset to a “state of good repair” prior to
relinquishment of the asset. Caltrans Planning unit has developed a statewide listing of
relinquishment targets; however, proposed legislation SB 254 would require the California
Transportation Commission to approve any proposed relinquishments of transportation
facilities. In light of the uncertainty related to relinquishment authority, and the typical
nature of relinquishment needs in the SHOPP and the Minor Program funding for
relinquishments under current funding constraints, this item will be excluded from project
level prioritization at this time.

Project Prioritization Criteria Page 19
5 Goal 3: Sustainability, Livability, and Economy
The Goal 3 subject matter expert review team was initiated to develop criteria to determine
a project’s score toward the strategic goal of Sustainability, Livability, and Economy. The
Caltrans Strategic Management Plan 2015-2020 identifies the following objectives under
this strategic goal [10]:
People — Improve the quality of life for all Californians by providing mobility
choice, increasing accessibility to all modes of transportation and creating
transportation corridors not only for conveyance of people, goods, and services, but
also as livable public spaces.
Planet — Reduce environmental impacts from the transportation system with
emphasis on supporting a statewide reduction of greenhouse gas emissions to
achieve 80% below 1990 levels by 2050.
Prosperity — Improve economic prosperity of the State and local communities
through a resilient and integrated transportation system.
Each of these objectives includes four performance measures. All of these performance
measures have application to the project prioritization process. Initial application of the
performance measures will be more qualitative than quantitative.
5.1 Tool Research
Evaluation of sustainability factors in projects is a new way of looking at transportation
priorities, and the best practices for project scoring for sustainability are limited. The
Caltrans Division of Research, Innovation, and System Information performed two
Preliminary Investigation studies on sustainability tools [11, 12]. These studies included
several sustainability measuring tools. The subject matter expert review team reviewed
two newer tools currently being used around the country: INVEST, and Envision.
INVEST 1.0: A self-evaluation scoring system, developed by FHWA, and has three
independent modules that can be used to evaluate transportation services: system
planning, project development, and operations and maintenance. Each module has a
variety of criteria (scorecards) to score a project. Each criterion is tied to a leg of the triple
bottom line. Point value is driven by the potential impact on sustainability. The
Department’s pilot using INVEST 1.0 determined that this tool was a broad programmatic
indicator and more useful to begin the Department’s implementation of sustainability. It
did not appear to be a tool ready for the project prioritization process.
Envision: Created by a strategic alliance of the Zofnass Program for Sustainable
Infrastructure at the Harvard University Graduate School of Design, and the Institute for
Sustainable Infrastructure, and was designed as a project assessment tool. It evaluates,
grades, and gives recognition to infrastructure projects that use transformational,
Project Prioritization Criteria Page 20
collaborative approaches to assess sustainability indicators over the course of a project’s
life cycle.
5.2 Tool Development
After a careful review of the two products examined in the research, the subject matter
expert review team chose Envision as the basis for the scoring tool. It was preferred
because of its similarity to the Leadership in Energy and Environmental Design (LEED),
which is one of the most popular green building certification programs used worldwide.
LEED is a fairly well known green building rating tool. Envision had been vetted by the
engineering community to evaluate a broad spectrum of infrastructure projects, and
includes an optional use of third party scoring, addresses relevant topics, and contains a
free scoring tool and free simple checklist.
The team pared the sixty questions in the Envision checklist down to twenty questions.
These questions were then tied to the sustainability performance measures in the Caltrans
Strategic Management Plan 2015-2020 with emphasis on people, planet, and prosperity.
The team considered the qualitative nature of the twenty questions as a beginning point to
encourage the Caltrans districts to consider and to understand sustainability elements. The
team however intends to move toward outcome-based performance measures that are
extensively quantitative in nature in the future cycles. The following elements were
included in the twenty questions:
5.2.1 People
The following four performance measures from the Caltrans Strategic Management Plan
2015-2020 target “People”:
Bike, pedestrian, and transit increase
Accessibility score
Livability score
Sustainable corridors
Six (30%) of the twenty questions, with a possible score of five for each question,
addressed “People”. The “People” questions ask whether the nominated project provides
any of the following:
Access to adjacent facilities, amenities, and transportation hubs, including way
finding signage
Encourages the use of transit and / or non-motorized transportation
Coordinates the design with other infrastructure assets to improve walkability and
livability

Project Prioritization Criteria Page 21
Enhances of public spaces, or addresses Section 4(f) properties (examples include
parks, plazas, recreational facilities, or wildlife refuges) to enhance community,
livability, and quality of life
Context Sensitive Solutions view of the project
Seeks input from local stakeholders on impacts or enhancements to community
infrastructure
5.2.2 Planet
The following four performance measures from the Caltrans Strategic Management Plan
2015-2020 target “Planet”:
Per capita vehicle-miles traveled reduction
System pollution reduction (air and energy)
Operational pollution reduction (air, energy, and water)
Improve green infrastructure score
Eight (40%) of the twenty questions, with a possible score of five for each question,
addressed “Planet”. The “Planet” questions ask whether the nominated project provides
any of the following:
Reduces energy consumption or generates energy supply
Storm water treatment requirements
Improvements to roadside vegetation through restorative actions to native /
appropriate vegetation to reduce / eliminate need for future management
(maintenance, water use, pesticides, invasive species, etc.)
Based on a life-cycle carbon assessment, substantially reduces carbon emissions
Includes green infrastructure, such as reducing heat island effects by reducing the
percentage of low solar reflectance index (SRI) surfaces
Preserves, improves, or connects important natural resources (habitat, species
needs, or fish and wildlife movement corridors)
Improves or enhances existing agricultural conditions or associated interface with
the transportation facility (water conveyance, quality, habitat preservation, weed
management, farming operation, etc.)
Avoids or minimizes impacts on historic and cultural resources
5.2.3 Prosperity
The following four performance measures from the Caltrans Strategic Management Plan
2015-2020 target “Prosperity”:
Prosperity score
Freight efficiency score

Project Prioritization Criteria Page 22
Resiliency score (climate change, system, and financial)
Resources consumption reduction (materials and potable water)
The final six (30%) of the twenty questions, also with a possible score of five for each
question, addressed “Prosperity”. The “Prosperity” questions ask whether the nominated
project provides any of the following:
Addresses potential risks or vulnerability deficiencies identified in state, regional,
local, or site specific plans (i.e. for climate change, extreme weather, etc.)
Enhances the community’s quality of life and economic prosperity
Priority freight network included in the Freight Mobility Plan
Reuses existing materials or recycled materials or use of materials from within 100
miles of the project site
Addresses or enhances adjacent wetlands, hydraulic connection, and water
functions, values, or existing deficiencies
Allows for natural floodplain functions to be restored or rectified related to existing
infrastructure impingements
5.3 Scoring
The scoring sheet developed by the subject matter expert review team provided a
minimum of five possible non-exclusive answers, listed “a” through “e”, for each of the
twenty questions. Each appropriate answer received one point. If all five or more answers
applied, the nominated project received the maximum five points for the question. Some
questions had a tiered approach with a minimum criteria of “a”, and each subsequent
criteria built upon its base.
For example, one of the twenty questions asked, “Will the proposed project make
meaningful enhancements to public space, or address Section 4(f) properties (examples
include parks, plazas, recreational facilities, or wildlife refuges) to enhance community,
livability, and quality of life?” The nominated project received one point if any of the
following five answers applied:
a. Minimally recognizes any 4(f) property and how project scope addresses initial idea
of how to integrate into project consideration, including publicly-owned public
parks, recreational areas, or wildlife or waterfowl refuges, or historic sites.
b. Contributes to meeting local, regional, or general plan (recreation / bike / ped /
goals).
c. Provides linkage to public space (making connection with bike path or road, trail
system, adjacency to state park, wildlife refuge, etc.), enhances or leaves in better
condition at end of project / construction.
Project Prioritization Criteria Page 23
d. Identifies a goal of the project to include avoidance of 4(f) use or leaves in better
condition at end of project / construction.
e. Consulted with the official jurisdiction over 4(f) property.
In addition to a score, a summary feedback sheet, citing strong and weak features, was
prepared for each project. The feedback was designed to address two important goals. The
first goal was to improve the evaluation process, so the most sustainable projects are
highly rated, and the second goal was to educate those preparing project documents about
how to clearly identify and present the most sustainable projects. Sustainability has not
been a major focus of project selection in the past, so addressing sustainability will be an
ongoing learning process.
5.4 Cross-Goal Issue
One issue which was raised was the potential overlaps or duplications in the performance
measures for greenhouse gas emissions which are included both under Overall Health in
the Safety and Health goal and under Planet in the Sustainability, Livability, and Economy
goal. The Overall Health objective evaluates greenhouse gas emissions by measuring
components of the infrastructure that contribute to active transportation. The Planet
objective evaluates greenhouse gas emissions by measuring CO2 emissions. These are two
very different measures with very different outcomes and do not appear to be overlapping
or duplicating.
A similar issue was raised with the bike and pedestrian targets which are both under
sustainability and under the Overall Health objective. Since it is not an issue to consider
vehicles across multiple goals, it should not be an issue with other modes of transportation,
such as bike and pedestrian.
Project Prioritization Criteria Page 24
6 Goal 4: System Performance
The Goal 4 subject matter expert review team was initiated to develop criteria to determine
a project’s score toward the strategic goal of System Performance. The Caltrans Strategic
Management Plan 2015-2020 identifies the following objectives under this strategic goal
[10]:
Delay reduction
System reliability
Corridor management and integration
Complete streets
6.1 Delay Reduction
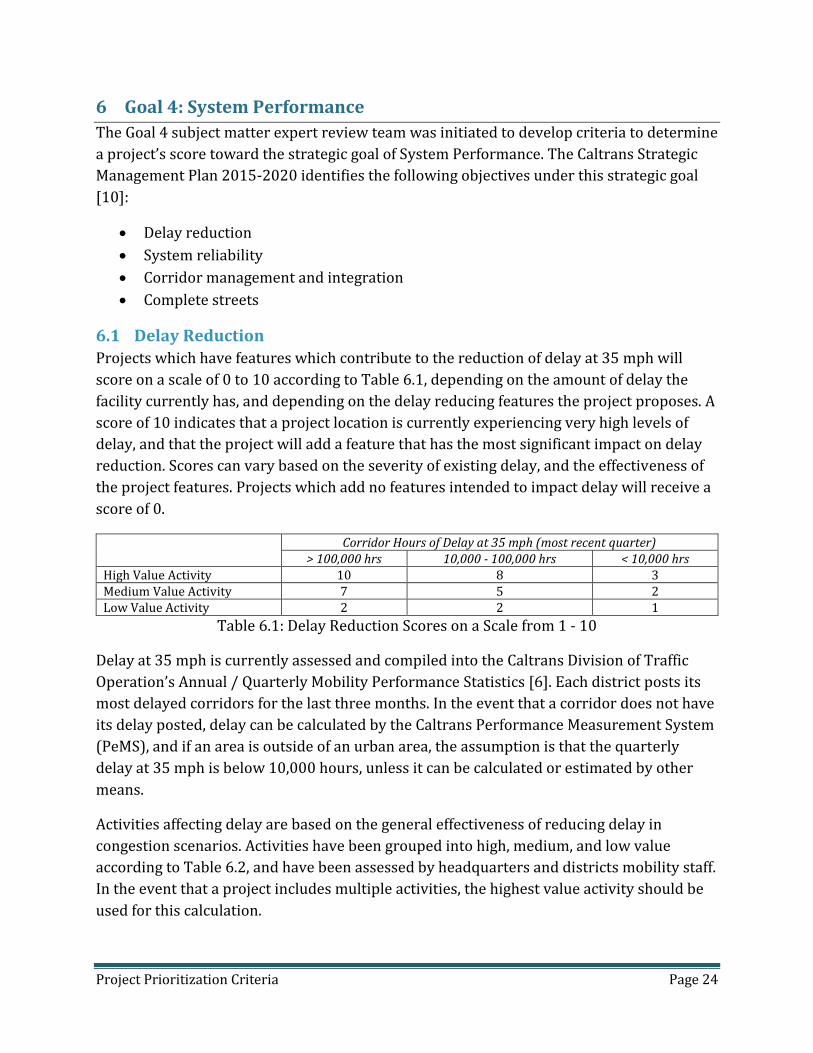
Projects which have features which contribute to the reduction of delay at 35 mph will
score on a scale of 0 to 10 according to Table 6.1, depending on the amount of delay the
facility currently has, and depending on the delay reducing features the project proposes. A
score of 10 indicates that a project location is currently experiencing very high levels of
delay, and that the project will add a feature that has the most significant impact on delay
reduction. Scores can vary based on the severity of existing delay, and the effectiveness of
the project features. Projects which add no features intended to impact delay will receive a
score of 0.
Corridor Hours of Delay at 35 mph (most recent quarter)
> 100,000 hrs 10,000 - 100,000 hrs < 10,000 hrs High Value Activity 10 8 3 Medium Value Activity 7 5 2 Low Value Activity 2 2 1
Table 6.1: Delay Reduction Scores on a Scale from 1 - 10
Delay at 35 mph is currently assessed and compiled into the Caltrans Division of Traffic
Operation’s Annual / Quarterly Mobility Performance Statistics [6]. Each district posts its
most delayed corridors for the last three months. In the event that a corridor does not have
its delay posted, delay can be calculated by the Caltrans Performance Measurement System
(PeMS), and if an area is outside of an urban area, the assumption is that the quarterly
delay at 35 mph is below 10,000 hours, unless it can be calculated or estimated by other
means.
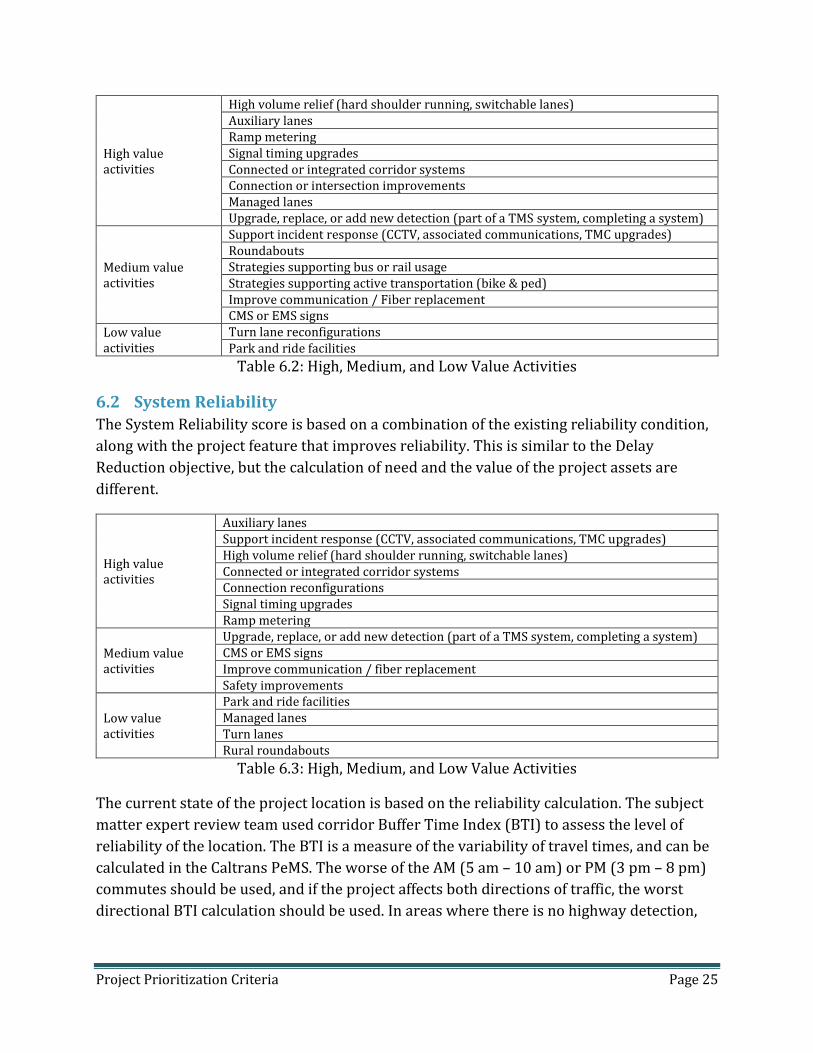
Activities affecting delay are based on the general effectiveness of reducing delay in
congestion scenarios. Activities have been grouped into high, medium, and low value
according to Table 6.2, and have been assessed by headquarters and districts mobility staff.
In the event that a project includes multiple activities, the highest value activity should be
used for this calculation.
Project Prioritization Criteria Page 25
High value activities
High volume relief (hard shoulder running, switchable lanes) Auxiliary lanes Ramp metering Signal timing upgrades Connected or integrated corridor systems Connection or intersection improvements Managed lanes Upgrade, replace, or add new detection (part of a TMS system, completing a system)
Medium value activities
Support incident response (CCTV, associated communications, TMC upgrades) Roundabouts Strategies supporting bus or rail usage Strategies supporting active transportation (bike & ped) Improve communication / Fiber replacement CMS or EMS signs
Low value activities
Turn lane reconfigurations Park and ride facilities
Table 6.2: High, Medium, and Low Value Activities
6.2 System Reliability
The System Reliability score is based on a combination of the existing reliability condition,
along with the project feature that improves reliability. This is similar to the Delay
Reduction objective, but the calculation of need and the value of the project assets are
different.
High value activities
Auxiliary lanes Support incident response (CCTV, associated communications, TMC upgrades) High volume relief (hard shoulder running, switchable lanes) Connected or integrated corridor systems Connection reconfigurations Signal timing upgrades Ramp metering
Medium value activities
Upgrade, replace, or add new detection (part of a TMS system, completing a system) CMS or EMS signs Improve communication / fiber replacement Safety improvements
Low value activities
Park and ride facilities Managed lanes Turn lanes Rural roundabouts
Table 6.3: High, Medium, and Low Value Activities
The current state of the project location is based on the reliability calculation. The subject
matter expert review team used corridor Buffer Time Index (BTI) to assess the level of
reliability of the location. The BTI is a measure of the variability of travel times, and can be
calculated in the Caltrans PeMS. The worse of the AM (5 am – 10 am) or PM (3 pm – 8 pm)
commutes should be used, and if the project affects both directions of traffic, the worst
directional BTI calculation should be used. In areas where there is no highway detection,
Project Prioritization Criteria Page 26
the system should be considered reliable, unless the engineer has calculated a BTI that
shows otherwise.
Activities are organized in high, medium, and low values according to Table 6.3 depending
on the amount of influence an improvement would have on System Reliability. While there
is a significant amount of overlap with the features that contribute to Delay Reduction,
System Reliability relies heavier on features that help with clearing out systems of non-
recurrent delay.
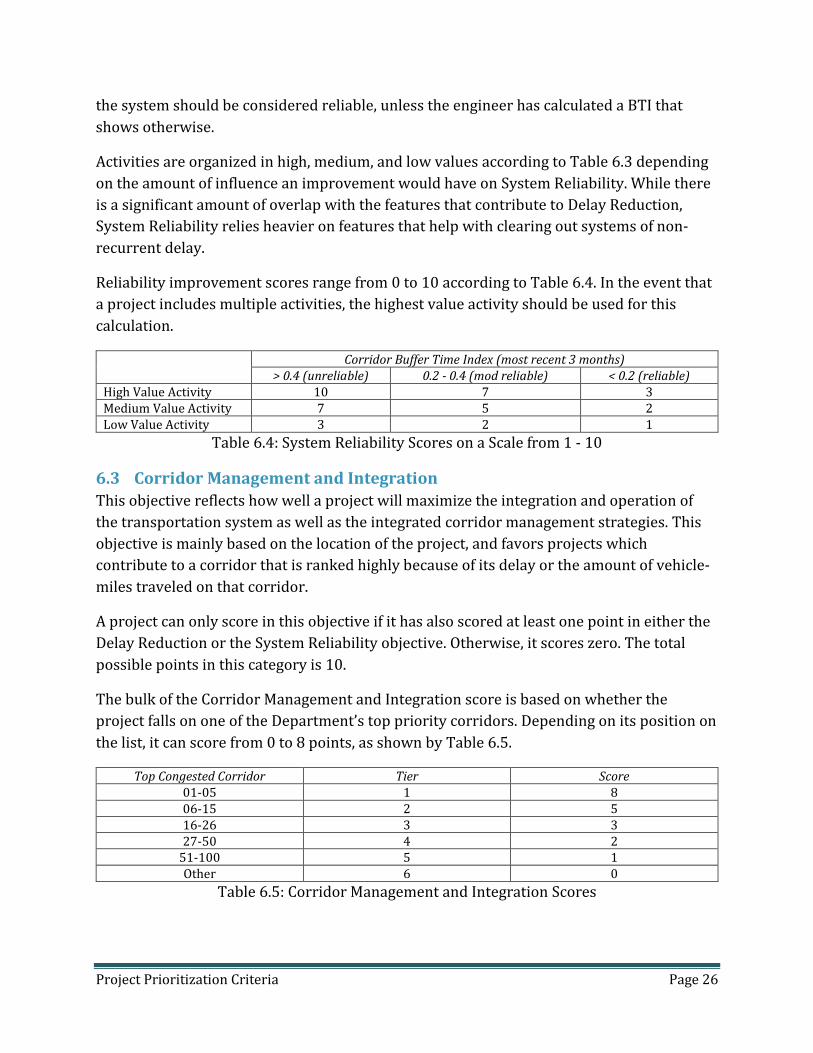
Reliability improvement scores range from 0 to 10 according to Table 6.4. In the event that
a project includes multiple activities, the highest value activity should be used for this
calculation.
Corridor Buffer Time Index (most recent 3 months)
> 0.4 (unreliable) 0.2 - 0.4 (mod reliable) < 0.2 (reliable)
High Value Activity 10 7 3 Medium Value Activity 7 5 2 Low Value Activity 3 2 1
Table 6.4: System Reliability Scores on a Scale from 1 - 10
6.3 Corridor Management and Integration
This objective reflects how well a project will maximize the integration and operation of
the transportation system as well as the integrated corridor management strategies. This
objective is mainly based on the location of the project, and favors projects which
contribute to a corridor that is ranked highly because of its delay or the amount of vehicle-
miles traveled on that corridor.
A project can only score in this objective if it has also scored at least one point in either the
Delay Reduction or the System Reliability objective. Otherwise, it scores zero. The total
possible points in this category is 10.
The bulk of the Corridor Management and Integration score is based on whether the
project falls on one of the Department’s top priority corridors. Depending on its position on
the list, it can score from 0 to 8 points, as shown by Table 6.5.
Top Congested Corridor Tier Score 01-05 1 8 06-15 2 5 16-26 3 3 27-50 4 2
51-100 5 1 Other 6 0
Table 6.5: Corridor Management and Integration Scores
Project Prioritization Criteria Page 27
The project can score an additional point if it has a headquarters approved partnership or
an integrated corridor management plan within its project limits. It can also score an
additional point if it is on a truck or interregional route.
6.4 Complete Streets
The intent of the Complete Streets objective is to elevate projects with complete street
features which are designed as part of a collaborative, multi-modal transportation solution
supporting a region’s transportation vision. These regionally supported projects provide a
seamless, interconnected transportation system that provides safe and accessible active
transportation modes from and to destinations. These systems improve a region’s livability
and revitalize communities. Integrating complete street elements is an integral component
of designing a sustainable, multimodal system that considers land use, context,
destinations, safety, environmental stewardship, and life-cycle fiscal investments. To
achieve this transportation system, Caltrans should work with its transportation partners
early in planning and project development to identify community, environmental, and
aesthetic considerations. This approach ensures that transportation and land use concerns
are addressed before projects are scoped, programmed, and constructed.
The nominated projects are rated by the number of complete street features from the
FHWA’s safety countermeasures from its Pedestrian and Bicycle Safety Guide and
Countermeasure Selection System [7]. These treatments have been proven effective. The
effectiveness of each of the countermeasures on pedestrian crashes and safety has been
documented in a separate report, “Evaluation of Pedestrian-Related Roadway Measures: A
Summary of Available Research” [7].
Each nominated project is reviewed, and complete street features are tallied in eight
categories of “Facility Location and Purpose” with a maximum count of two for each
countermeasure type. The eight categories are
1. Along Roadway
2. Crossings
3. Intersection Design
4. Roadway Design
5. Signals and Signs
6. Traffic Calming
7. Transit
8. Other Treatments Appropriate to Location
The complete streets tally sheet from FHWA’s Pedestrian and Bicycle Safety Guide and
Countermeasure Selection System [7], filled out for a sample project, is presented in
Appendix H. For projects identified in a regional or local transportation plan or equivalent,
Project Prioritization Criteria Page 28
the score receives a bonus of 0.2. The total number of points possible on this goal after
being normalized is 10.
6.5 Final Score
The four components of the System Performance goal have equal weights. After the four
objective scores are averaged, a goal score from 0 to 10 will be obtained.
Project Prioritization Criteria Page 29
7 Goal 5: Organizational Excellence
The Goal 5 subject matter expert review team was initiated to develop criteria to determine
a project’s score toward the strategic goal of Organizational Excellence. The team identified
four objectives under this strategic goal. These objectives sustain the Department as a
strong and effective organization through
Enabling employee engagement and innovation
Fostering collaboration
Encouraging skilled communication
Supporting effective decision making through the application of risk management.
Traditionally, the work environment cultivated around projects has been thought of in
terms of occupational health and safety and employee health promotion. However, the
missing piece which the Organizational Excellence goal can provide is to encourage a
comprehensively healthy and high performing work environment by bringing into focus
elements of organizational health in areas such as leadership, employee recognition,
learning and growth, collaboration, communication, and effective decision making at the
project initiation level. Adding these criteria to the project prioritization process
encourages management action and team dynamics which will ultimately support the
successful delivery of a project.
The scoring rubric for each of the four objectives is based on documentable products. In
addition, a rubric of qualitative expectations is developed for when a project is selected for
programming and delivery is initiated. The inclusion of this supplementary rubric, which
further develops expectations of organizational maturity, is meant to provide guidance to
encourage ongoing self-evaluation and review by the project development teams. The
maximum number of points for the Organizational Excellence goal is twenty. After a
project’s total number of points is calculated, a multiplier of five is applied to obtain a
normalized score between 0 and 100 for this goal.
7.1 Employee Engagement and Innovation
Under Employee Engagement and Innovation objective, a project receives two points if it
identifies new or creative / innovative ways of doing things.
7.2 Collaborative Partnerships
Under Collaborative Partnerships objective, a project receives
One point if it identifies partners
Two points if it has a formal outreach plan
Three points if it has a collaborative agreement.
The maximum number of points for this objective is six.
Project Prioritization Criteria Page 30
7.3 Skilled Communication
Under Skilled Communication objective, a project receives
One point if it identifies target audience
Two points if it develops a communication plan
Three points if it has outreach activities with target audience.
The maximum number of points for this objective is six.
7.4 Effective Decision Making through Risk Management
Under Effective Decision Making through Risk Management objective, a project receives
One point if it identifies / assesses risks
Two points if it manages risks
Three points if it certifies risks.
The maximum number of points for this objective is six.
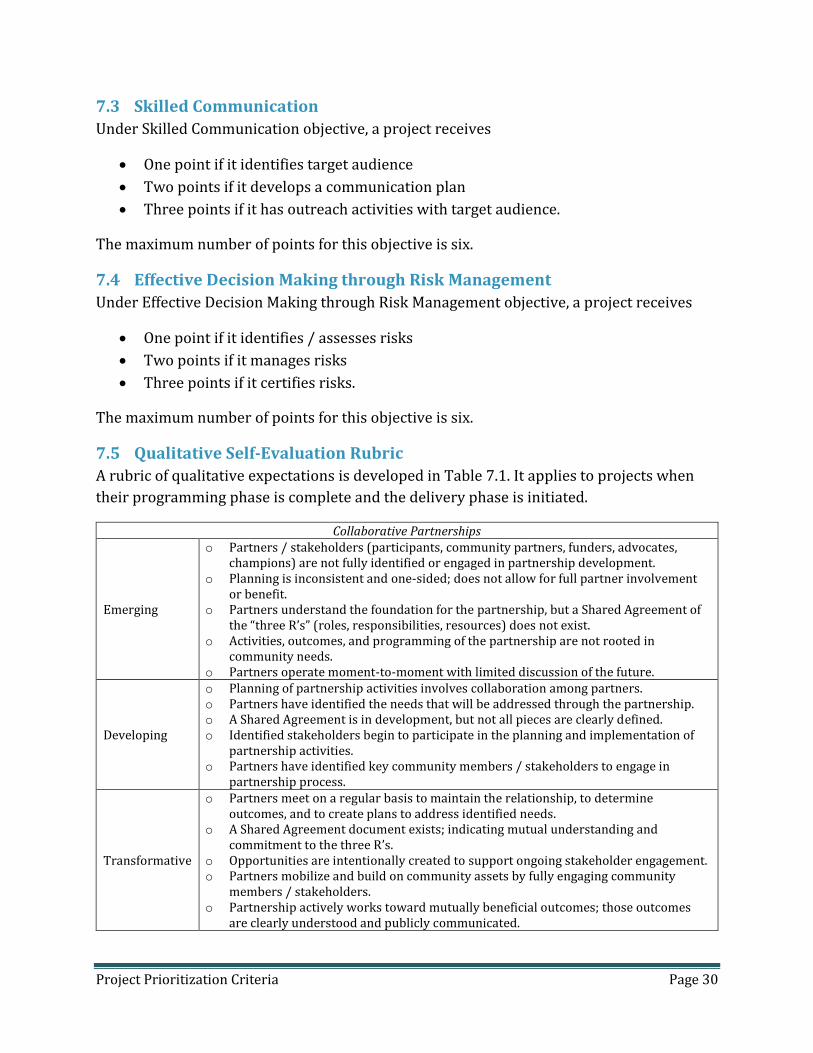
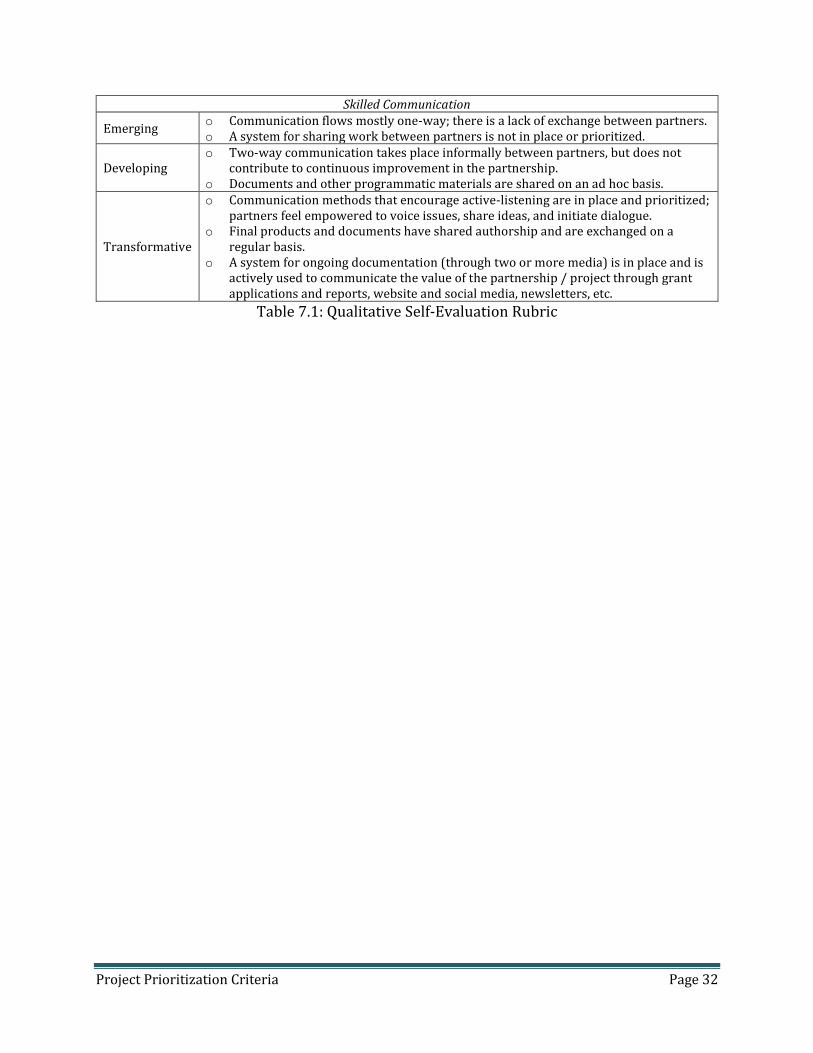
7.5 Qualitative Self-Evaluation Rubric
A rubric of qualitative expectations is developed in Table 7.1. It applies to projects when
their programming phase is complete and the delivery phase is initiated.
Collaborative Partnerships
Emerging
o Partners / stakeholders (participants, community partners, funders, advocates, champions) are not fully identified or engaged in partnership development.
o Planning is inconsistent and one-sided; does not allow for full partner involvement or benefit.
o Partners understand the foundation for the partnership, but a Shared Agreement of the “three R’s” (roles, responsibilities, resources) does not exist.
o Activities, outcomes, and programming of the partnership are not rooted in community needs.
o Partners operate moment-to-moment with limited discussion of the future.
Developing
o Planning of partnership activities involves collaboration among partners. o Partners have identified the needs that will be addressed through the partnership. o A Shared Agreement is in development, but not all pieces are clearly defined. o Identified stakeholders begin to participate in the planning and implementation of
partnership activities. o Partners have identified key community members / stakeholders to engage in
partnership process.
Transformative
o Partners meet on a regular basis to maintain the relationship, to determine outcomes, and to create plans to address identified needs.
o A Shared Agreement document exists; indicating mutual understanding and commitment to the three R’s.
o Opportunities are intentionally created to support ongoing stakeholder engagement. o Partners mobilize and build on community assets by fully engaging community
members / stakeholders. o Partnership actively works toward mutually beneficial outcomes; those outcomes
are clearly understood and publicly communicated.
Project Prioritization Criteria Page 31
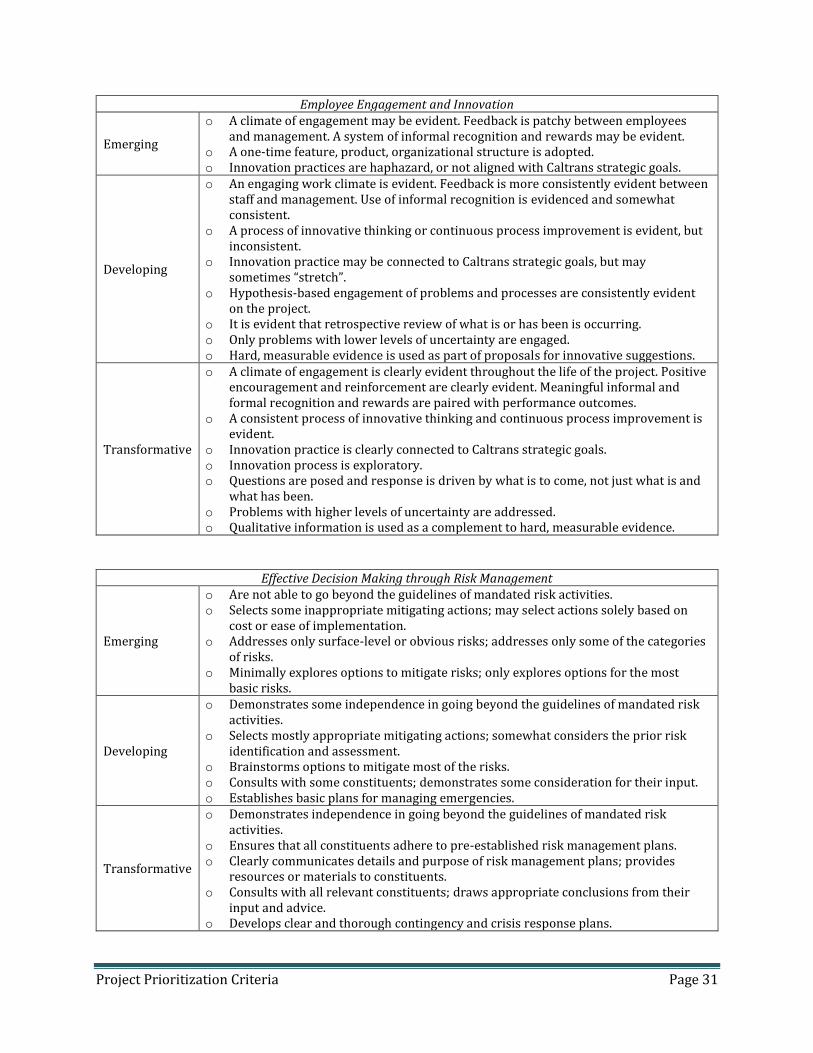
Employee Engagement and Innovation
Emerging
o A climate of engagement may be evident. Feedback is patchy between employees and management. A system of informal recognition and rewards may be evident.
o A one-time feature, product, organizational structure is adopted. o Innovation practices are haphazard, or not aligned with Caltrans strategic goals.
Developing
o An engaging work climate is evident. Feedback is more consistently evident between staff and management. Use of informal recognition is evidenced and somewhat consistent.
o A process of innovative thinking or continuous process improvement is evident, but inconsistent.
o Innovation practice may be connected to Caltrans strategic goals, but may sometimes “stretch”.
o Hypothesis-based engagement of problems and processes are consistently evident on the project.
o It is evident that retrospective review of what is or has been is occurring. o Only problems with lower levels of uncertainty are engaged. o Hard, measurable evidence is used as part of proposals for innovative suggestions.
Transformative
o A climate of engagement is clearly evident throughout the life of the project. Positive encouragement and reinforcement are clearly evident. Meaningful informal and formal recognition and rewards are paired with performance outcomes.
o A consistent process of innovative thinking and continuous process improvement is evident.
o Innovation practice is clearly connected to Caltrans strategic goals. o Innovation process is exploratory. o Questions are posed and response is driven by what is to come, not just what is and
what has been. o Problems with higher levels of uncertainty are addressed. o Qualitative information is used as a complement to hard, measurable evidence.
Effective Decision Making through Risk Management
Emerging
o Are not able to go beyond the guidelines of mandated risk activities. o Selects some inappropriate mitigating actions; may select actions solely based on
cost or ease of implementation. o Addresses only surface-level or obvious risks; addresses only some of the categories
of risks. o Minimally explores options to mitigate risks; only explores options for the most
basic risks.
Developing
o Demonstrates some independence in going beyond the guidelines of mandated risk activities.
o Selects mostly appropriate mitigating actions; somewhat considers the prior risk identification and assessment.
o Brainstorms options to mitigate most of the risks. o Consults with some constituents; demonstrates some consideration for their input. o Establishes basic plans for managing emergencies.
Transformative
o Demonstrates independence in going beyond the guidelines of mandated risk activities.
o Ensures that all constituents adhere to pre-established risk management plans. o Clearly communicates details and purpose of risk management plans; provides
resources or materials to constituents. o Consults with all relevant constituents; draws appropriate conclusions from their
input and advice. o Develops clear and thorough contingency and crisis response plans.
Project Prioritization Criteria Page 32
Skilled Communication
Emerging o Communication flows mostly one-way; there is a lack of exchange between partners. o A system for sharing work between partners is not in place or prioritized.
Developing o Two-way communication takes place informally between partners, but does not
contribute to continuous improvement in the partnership. o Documents and other programmatic materials are shared on an ad hoc basis.
Transformative
o Communication methods that encourage active-listening are in place and prioritized; partners feel empowered to voice issues, share ideas, and initiate dialogue.
o Final products and documents have shared authorship and are exchanged on a regular basis.
o A system for ongoing documentation (through two or more media) is in place and is actively used to communicate the value of the partnership / project through grant applications and reports, website and social media, newsletters, etc.
Table 7.1: Qualitative Self-Evaluation Rubric
Project Prioritization Criteria Page 33
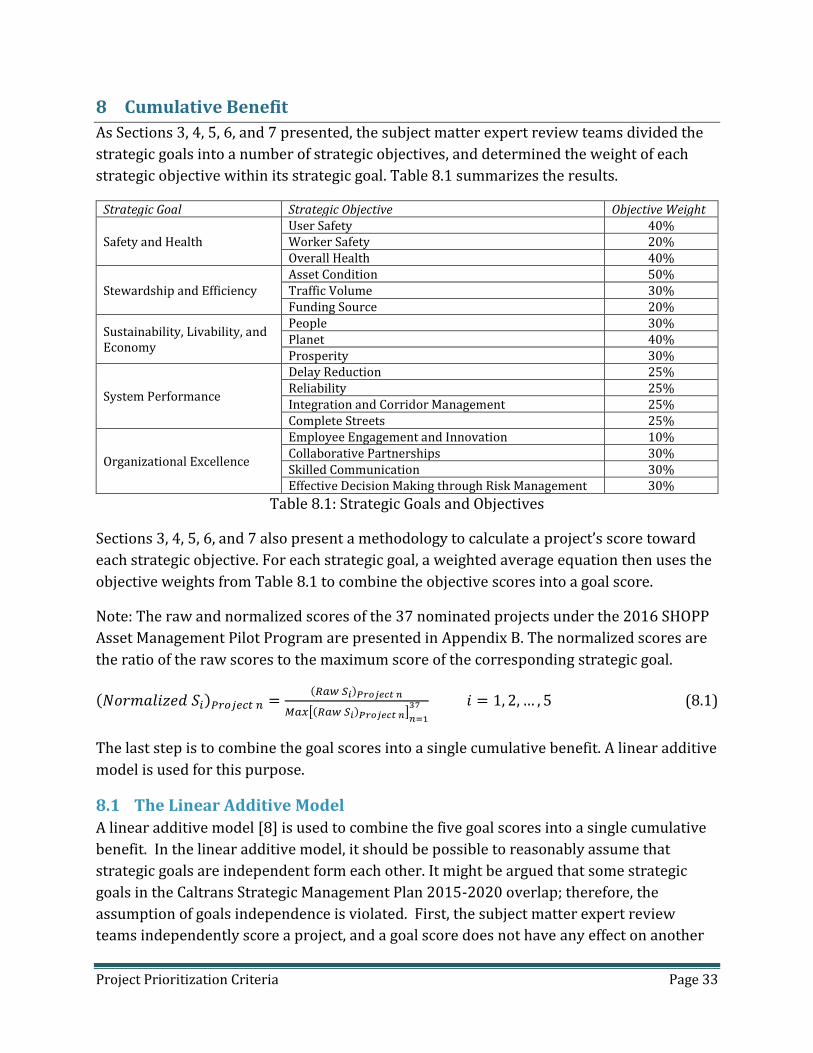
8 Cumulative Benefit
As Sections 3, 4, 5, 6, and 7 presented, the subject matter expert review teams divided the
strategic goals into a number of strategic objectives, and determined the weight of each
strategic objective within its strategic goal. Table 8.1 summarizes the results.
Strategic Goal Strategic Objective Objective Weight
Safety and Health User Safety 40% Worker Safety 20% Overall Health 40%
Stewardship and Efficiency Asset Condition 50% Traffic Volume 30% Funding Source 20%
Sustainability, Livability, and Economy
People 30% Planet 40% Prosperity 30%
System Performance
Delay Reduction 25% Reliability 25% Integration and Corridor Management 25% Complete Streets 25%
Organizational Excellence
Employee Engagement and Innovation 10% Collaborative Partnerships 30% Skilled Communication 30% Effective Decision Making through Risk Management 30%
Table 8.1: Strategic Goals and Objectives
Sections 3, 4, 5, 6, and 7 also present a methodology to calculate a project’s score toward
each strategic objective. For each strategic goal, a weighted average equation then uses the
objective weights from Table 8.1 to combine the objective scores into a goal score.
Note: The raw and normalized scores of the 37 nominated projects under the 2016 SHOPP
Asset Management Pilot Program are presented in Appendix B. The normalized scores are
the ratio of the raw scores to the maximum score of the corresponding strategic goal.
(𝑁𝑜𝑟𝑚𝑎𝑙𝑖𝑧𝑒𝑑 𝑆𝑖)𝑃𝑟𝑜𝑗𝑒𝑐𝑡 𝑛 =(𝑅𝑎𝑤 𝑆𝑖)𝑃𝑟𝑜𝑗𝑒𝑐𝑡 𝑛
𝑀𝑎𝑥[(𝑅𝑎𝑤 𝑆𝑖)𝑃𝑟𝑜𝑗𝑒𝑐𝑡 𝑛]𝑛=1
37 𝑖 = 1, 2, … , 5 (8.1)
The last step is to combine the goal scores into a single cumulative benefit. A linear additive
model is used for this purpose.
8.1 The Linear Additive Model
A linear additive model [8] is used to combine the five goal scores into a single cumulative
benefit. In the linear additive model, it should be possible to reasonably assume that
strategic goals are independent form each other. It might be argued that some strategic
goals in the Caltrans Strategic Management Plan 2015-2020 overlap; therefore, the
assumption of goals independence is violated. First, the subject matter expert review
teams independently score a project, and a goal score does not have any effect on another
Project Prioritization Criteria Page 34
goal score. Second, in cases such as active transportation where an overlap between Goal 1
and Goal 4 is suspected, different aspects of active transportation are evaluated. In other
words, there is no overlap between the contributions of active transportation toward
Overall Health (Goal 1) and toward Complete Streets (Goal 4). The linear additive model
calculates the cumulative benefit through the following equations:
𝐵𝑒𝑛𝑒𝑓𝑖𝑡 = ∑ 𝐺𝑜𝑎𝑙 𝐵𝑒𝑛𝑒𝑓𝑖𝑡𝑖5𝑖=1
𝐺𝑜𝑎𝑙 𝐵𝑒𝑛𝑒𝑓𝑖𝑡𝑖 = 𝑤𝑖 ∗ 𝑀𝑖 ∗ 𝑆𝑖 𝑖 = 1, 2, … , 5 (8.2)
In Equations (8.2), 𝑤𝑖 is the goal weight of the i-th goal, 𝑀𝑖 is the magnitude factor of the i-
th goal, and 𝑆𝑖 is the goal score of the i-th goal. A goal score is calculated via a weighted
average equation which uses the weights and the scores of the goal’s underlying objectives,
and it was thoroughly explained in previous sections. The goal weights are determined
through the Analytic Hierarchy Process (AHP) which will be explained in Section 8.2. The
magnitude factors and the alternative ways to apply the magnitude factors will be
explained in Section 8.3.
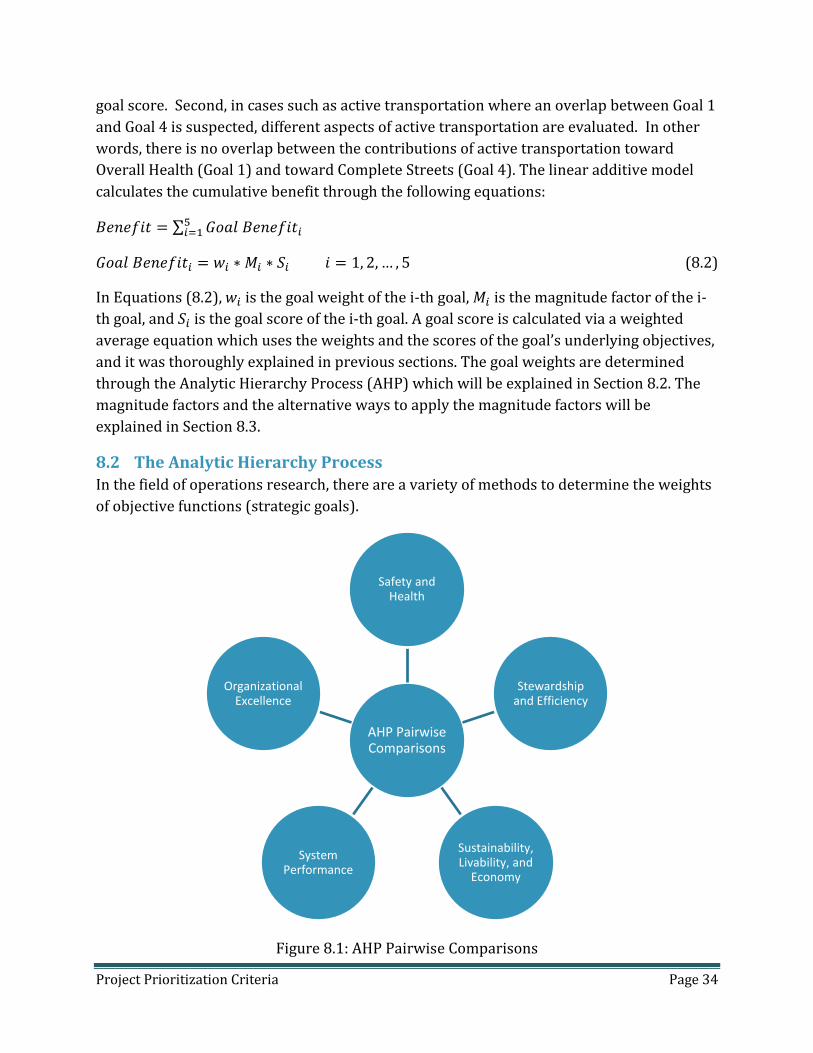
8.2 The Analytic Hierarchy Process
In the field of operations research, there are a variety of methods to determine the weights
of objective functions (strategic goals).
Figure 8.1: AHP Pairwise Comparisons
AHP Pairwise Comparisons
Safety and Health
Stewardship and Efficiency
Sustainability, Livability, and
Economy
System Performance
Organizational Excellence
Project Prioritization Criteria Page 35
One of these methods is the Analytic Hierarchy Process (AHP) [8]. Although the AHP has a
number of challenges [9], it was deemed to be the most practical for the determination of
the goal weights in the Project Prioritization Criteria 2016.
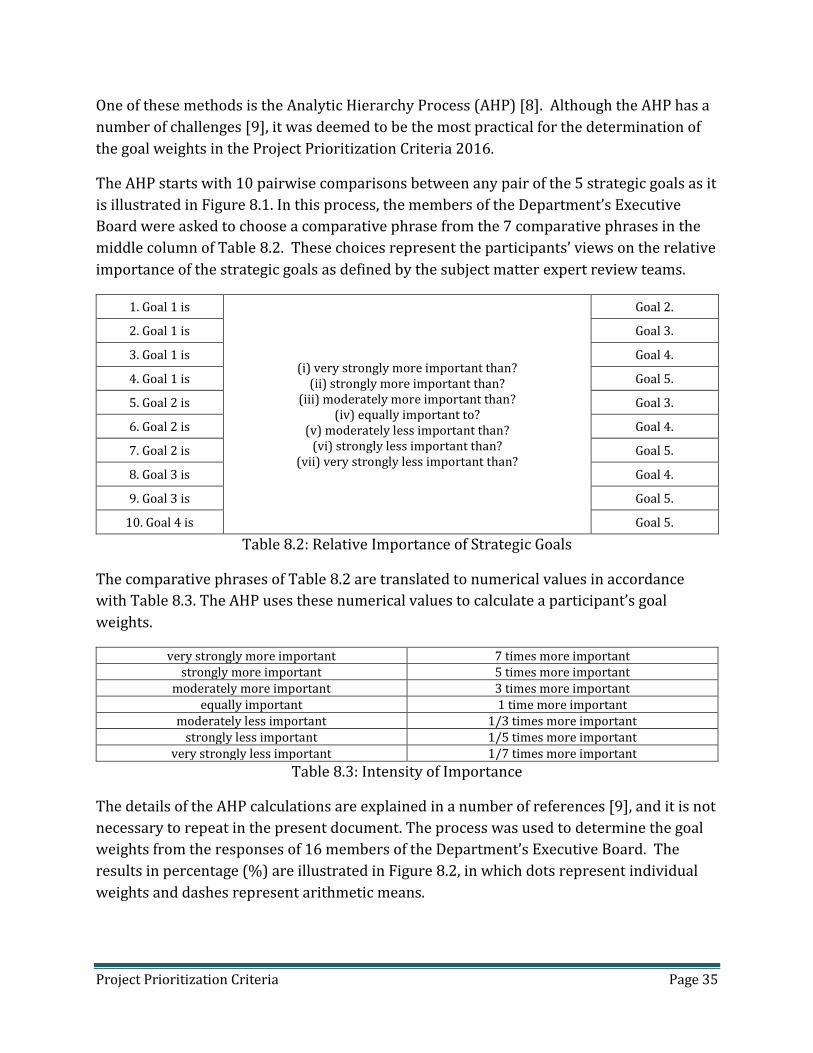
The AHP starts with 10 pairwise comparisons between any pair of the 5 strategic goals as it
is illustrated in Figure 8.1. In this process, the members of the Department’s Executive
Board were asked to choose a comparative phrase from the 7 comparative phrases in the
middle column of Table 8.2. These choices represent the participants’ views on the relative
importance of the strategic goals as defined by the subject matter expert review teams.
1. Goal 1 is
(i) very strongly more important than? (ii) strongly more important than?
(iii) moderately more important than? (iv) equally important to?
(v) moderately less important than? (vi) strongly less important than?
(vii) very strongly less important than?
Goal 2.
2. Goal 1 is Goal 3.
3. Goal 1 is Goal 4.
4. Goal 1 is Goal 5.
5. Goal 2 is Goal 3.
6. Goal 2 is Goal 4.
7. Goal 2 is Goal 5.
8. Goal 3 is Goal 4.
9. Goal 3 is Goal 5.
10. Goal 4 is Goal 5.
Table 8.2: Relative Importance of Strategic Goals
The comparative phrases of Table 8.2 are translated to numerical values in accordance
with Table 8.3. The AHP uses these numerical values to calculate a participant’s goal
weights.
very strongly more important 7 times more important strongly more important 5 times more important
moderately more important 3 times more important equally important 1 time more important
moderately less important 1/3 times more important strongly less important 1/5 times more important
very strongly less important 1/7 times more important
Table 8.3: Intensity of Importance
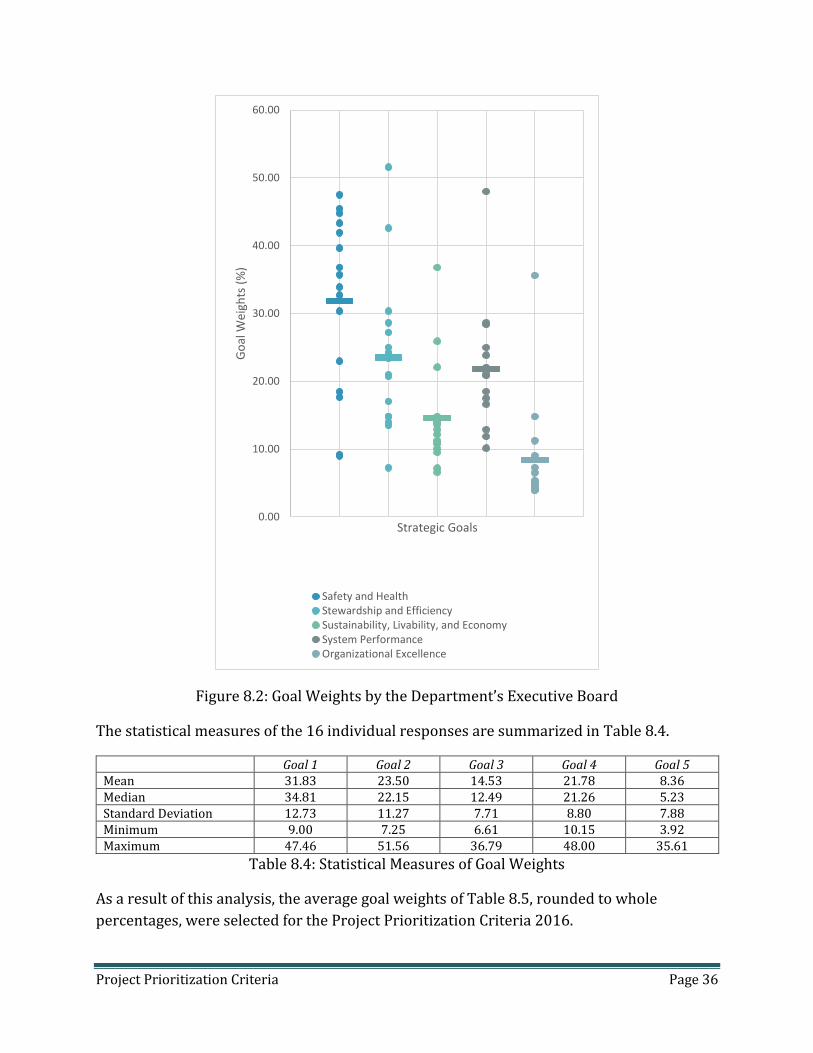
The details of the AHP calculations are explained in a number of references [9], and it is not
necessary to repeat in the present document. The process was used to determine the goal
weights from the responses of 16 members of the Department’s Executive Board. The
results in percentage (%) are illustrated in Figure 8.2, in which dots represent individual
weights and dashes represent arithmetic means.
Project Prioritization Criteria Page 36
Figure 8.2: Goal Weights by the Department’s Executive Board
The statistical measures of the 16 individual responses are summarized in Table 8.4.
Goal 1 Goal 2 Goal 3 Goal 4 Goal 5 Mean 31.83 23.50 14.53 21.78 8.36 Median 34.81 22.15 12.49 21.26 5.23 Standard Deviation 12.73 11.27 7.71 8.80 7.88 Minimum 9.00 7.25 6.61 10.15 3.92 Maximum 47.46 51.56 36.79 48.00 35.61
Table 8.4: Statistical Measures of Goal Weights
As a result of this analysis, the average goal weights of Table 8.5, rounded to whole
percentages, were selected for the Project Prioritization Criteria 2016.
0.00
10.00
20.00
30.00
40.00
50.00
60.00
Go
al W
eigh
ts (
%)
Strategic Goals
Safety and HealthStewardship and EfficiencySustainability, Livability, and EconomySystem PerformanceOrganizational Excellence

Project Prioritization Criteria Page 37
Strategic Goal Goal Weight Goal 1: Safety and Health 32% Goal 2: Stewardship and Efficiency 23% Goal 3: Sustainability, Livability, and Economy 15% Goal 4: System Performance 22% Goal 5: Organizational Excellence 8%
Table 8.5: Goal Weights
The global objective weights are the product of the goal weights from Table 8.5 and the
objective weights from Table 8.1. The global objective weights are presented in Table 8.6
although they are not explicitly used in Equations (8.2).
Strategic Objective Global Objective Weight User Safety 12.8% Worker Safety 6.4% Overall Health 12.8% Asset Condition 11.5% Traffic Volume 6.9% Funding Source 4.6% People 4.5% Planet 6.0% Prosperity 4.5% Delay Reduction 5.5% Reliability 5.5% Integration and Corridor Management 5.5% Complete Streets 5.5% Employee Engagement and Innovation 0.8% Collaborative Partnerships 2.4% Skilled Communication 2.4% Effective Decision Making through Risk Management 2.4%
Table 8.6: Global Objective Weights
The goal weights 𝑤1, 𝑤2, … , 𝑤5 which are explicitly used in Equations (8.2) are the goal
weights which are presented in Table 8.5.
8.3 The Magnitude Factors
The magnitude factors 𝑀1, 𝑀2, … , 𝑀5 are introduced to reflect the magnitude of the
improvements resulting from a project. The magnitude factors adjust the goal benefits to
reflect the varying units of the activities involved in the project and the extent of the system
improved by the project.
For example, two similar projects add shoulder rumble strips to pavement assets, but the
length of the improvements for one project is greater than the other project. As a result,
although they both share the same safety improvement benefit, the first project should
receive a higher credit, i.e. a higher magnitude factor, for its enhancement over the greater
length. This factor, in theory, allows the two projects to be equitably treated from a
benefit-cost standpoint.
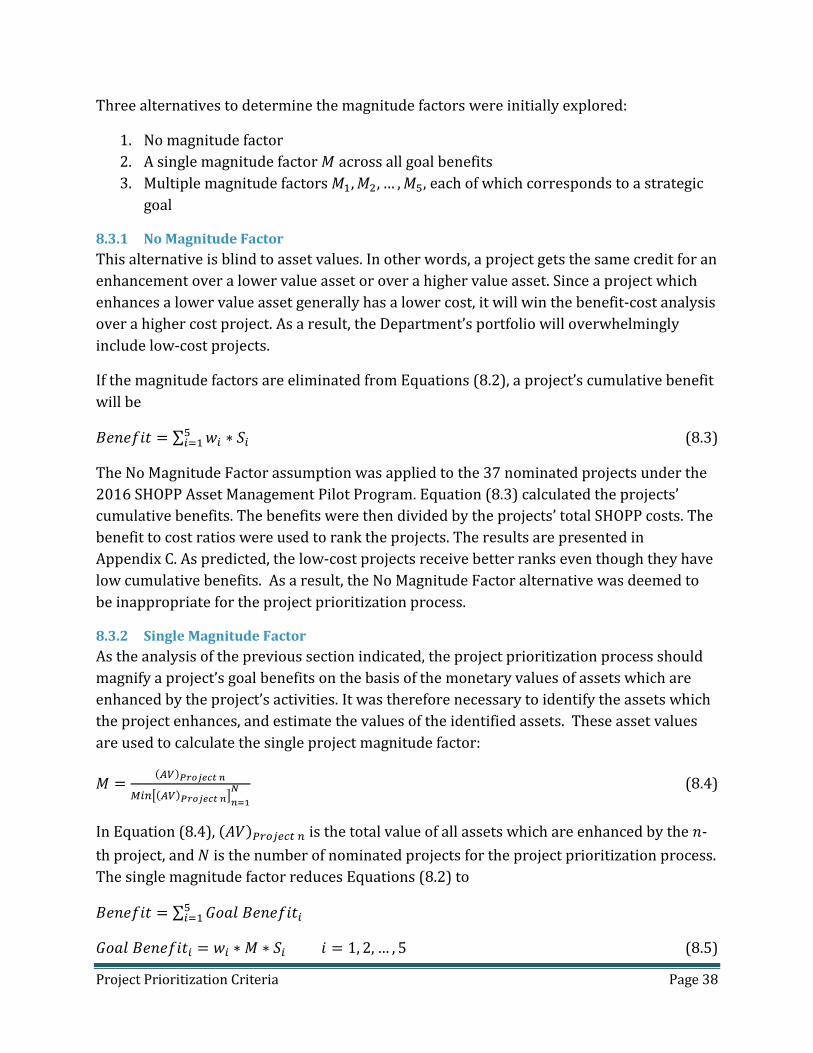
Project Prioritization Criteria Page 38
Three alternatives to determine the magnitude factors were initially explored:
1. No magnitude factor
2. A single magnitude factor 𝑀 across all goal benefits
3. Multiple magnitude factors 𝑀1, 𝑀2, … , 𝑀5, each of which corresponds to a strategic
goal
8.3.1 No Magnitude Factor
This alternative is blind to asset values. In other words, a project gets the same credit for an
enhancement over a lower value asset or over a higher value asset. Since a project which
enhances a lower value asset generally has a lower cost, it will win the benefit-cost analysis
over a higher cost project. As a result, the Department’s portfolio will overwhelmingly
include low-cost projects.
If the magnitude factors are eliminated from Equations (8.2), a project’s cumulative benefit
will be
𝐵𝑒𝑛𝑒𝑓𝑖𝑡 = ∑ 𝑤𝑖 ∗ 𝑆𝑖5𝑖=1 (8.3)
The No Magnitude Factor assumption was applied to the 37 nominated projects under the
2016 SHOPP Asset Management Pilot Program. Equation (8.3) calculated the projects’
cumulative benefits. The benefits were then divided by the projects’ total SHOPP costs. The
benefit to cost ratios were used to rank the projects. The results are presented in
Appendix C. As predicted, the low-cost projects receive better ranks even though they have
low cumulative benefits. As a result, the No Magnitude Factor alternative was deemed to
be inappropriate for the project prioritization process.
8.3.2 Single Magnitude Factor
As the analysis of the previous section indicated, the project prioritization process should
magnify a project’s goal benefits on the basis of the monetary values of assets which are
enhanced by the project’s activities. It was therefore necessary to identify the assets which
the project enhances, and estimate the values of the identified assets. These asset values
are used to calculate the single project magnitude factor:
𝑀 =(𝐴𝑉)𝑃𝑟𝑜𝑗𝑒𝑐𝑡 𝑛
𝑀𝑖𝑛[(𝐴𝑉)𝑃𝑟𝑜𝑗𝑒𝑐𝑡 𝑛]𝑛=1
𝑁 (8.4)
In Equation (8.4), (𝐴𝑉)𝑃𝑟𝑜𝑗𝑒𝑐𝑡 𝑛 is the total value of all assets which are enhanced by the 𝑛-
th project, and 𝑁 is the number of nominated projects for the project prioritization process.
The single magnitude factor reduces Equations (8.2) to
𝐵𝑒𝑛𝑒𝑓𝑖𝑡 = ∑ 𝐺𝑜𝑎𝑙 𝐵𝑒𝑛𝑒𝑓𝑖𝑡𝑖5𝑖=1
𝐺𝑜𝑎𝑙 𝐵𝑒𝑛𝑒𝑓𝑖𝑡𝑖 = 𝑤𝑖 ∗ 𝑀 ∗ 𝑆𝑖 𝑖 = 1, 2, … , 5 (8.5)
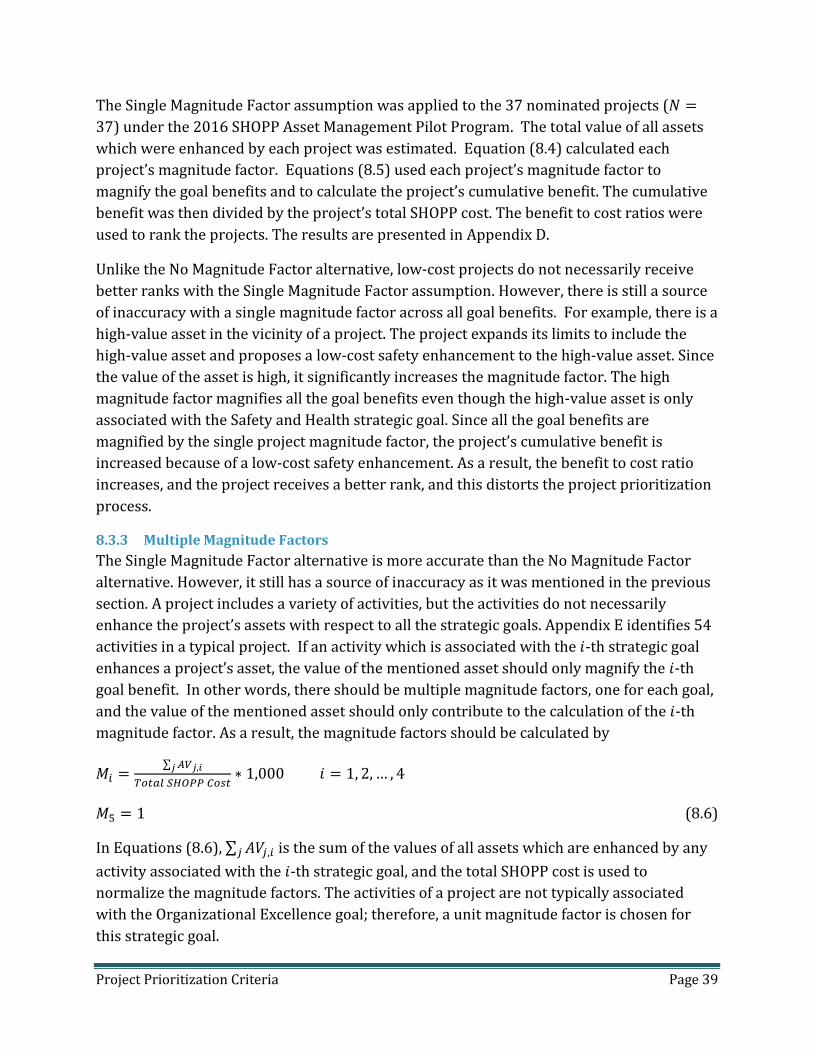
Project Prioritization Criteria Page 39
The Single Magnitude Factor assumption was applied to the 37 nominated projects (𝑁 =
37) under the 2016 SHOPP Asset Management Pilot Program. The total value of all assets
which were enhanced by each project was estimated. Equation (8.4) calculated each
project’s magnitude factor. Equations (8.5) used each project’s magnitude factor to
magnify the goal benefits and to calculate the project’s cumulative benefit. The cumulative
benefit was then divided by the project’s total SHOPP cost. The benefit to cost ratios were
used to rank the projects. The results are presented in Appendix D.
Unlike the No Magnitude Factor alternative, low-cost projects do not necessarily receive
better ranks with the Single Magnitude Factor assumption. However, there is still a source
of inaccuracy with a single magnitude factor across all goal benefits. For example, there is a
high-value asset in the vicinity of a project. The project expands its limits to include the
high-value asset and proposes a low-cost safety enhancement to the high-value asset. Since
the value of the asset is high, it significantly increases the magnitude factor. The high
magnitude factor magnifies all the goal benefits even though the high-value asset is only
associated with the Safety and Health strategic goal. Since all the goal benefits are
magnified by the single project magnitude factor, the project’s cumulative benefit is
increased because of a low-cost safety enhancement. As a result, the benefit to cost ratio
increases, and the project receives a better rank, and this distorts the project prioritization
process.
8.3.3 Multiple Magnitude Factors
The Single Magnitude Factor alternative is more accurate than the No Magnitude Factor
alternative. However, it still has a source of inaccuracy as it was mentioned in the previous
section. A project includes a variety of activities, but the activities do not necessarily
enhance the project’s assets with respect to all the strategic goals. Appendix E identifies 54
activities in a typical project. If an activity which is associated with the 𝑖-th strategic goal
enhances a project’s asset, the value of the mentioned asset should only magnify the 𝑖-th
goal benefit. In other words, there should be multiple magnitude factors, one for each goal,
and the value of the mentioned asset should only contribute to the calculation of the 𝑖-th
magnitude factor. As a result, the magnitude factors should be calculated by
𝑀𝑖 =∑ 𝐴𝑉𝑗,𝑖𝑗
𝑇𝑜𝑡𝑎𝑙 𝑆𝐻𝑂𝑃𝑃 𝐶𝑜𝑠𝑡∗ 1,000 𝑖 = 1, 2, … , 4
𝑀5 = 1 (8.6)
In Equations (8.6), ∑ 𝐴𝑉𝑗,𝑖𝑗 is the sum of the values of all assets which are enhanced by any
activity associated with the 𝑖-th strategic goal, and the total SHOPP cost is used to
normalize the magnitude factors. The activities of a project are not typically associated
with the Organizational Excellence goal; therefore, a unit magnitude factor is chosen for
this strategic goal.
Project Prioritization Criteria Page 40
The Multiple Magnitude Factor alternative, Equations (8.2) and (8.6), was deemed to be the
most comprehensive among the three alternatives for the project prioritization process. It
was applied to the 37 nominated projects under the 2016 SHOPP Asset Management Pilot
Program. First, the values of all assets which were enhanced by an activity in Appendix E
were estimated. Then, the sums of the values of all assets which were enhanced with
respect to a strategic goal were estimated. Equations (8.6) calculated each project’s
magnitude factors. The results are presented in Appendix F. Equations (8.2) calculated each
project’s cumulative benefit. The cumulative benefit was then divided by the project’s total
SHOPP cost. The benefit to cost ratios were used to rank the projects. The results are
presented in Appendix G.
As it was implied in Section 8, a project’s cumulative benefit is not enough to rank the
project. The cumulative benefit per unit cost of a project determines its rank. Section 9 has
a discussion on the benefit-cost analysis.
Project Prioritization Criteria Page 41
9 Benefit-Cost Analysis
Section 8 presented how a project’s cumulative benefit is determined in the Project
Prioritization Criteria 2016. Section 9 concludes the project prioritization process by a
discussion on how the projects are ranked on the basis of both their cumulative benefits
and their costs.
A project with a higher cumulative benefit should not necessarily rank higher than a
project with a lower cumulative benefit. A higher cumulative benefit is desirable if it comes
at a lower cost. The project prioritization process should analyze projects on the basis of
both their cumulative benefits and their costs. In other words, a project with a higher
cumulative benefit to cost ratio should rank higher than a project with a lower cumulative
benefit to cost ratio. It is this ratio which should be used to rank projects. Using this
approach, the projects with the greatest value to cost ratio are selected.
It is encouraged for projects to use partnered funds as it was mentioned in Section 4.4. If a
project receives funds from other sources in addition to the SHOPP, the total project cost is
not equal to the total SHOPP cost. The benefit-cost analysis therefore has two options:
1. 𝐵 𝐶⁄ =𝐵𝑒𝑛𝑒𝑓𝑖𝑡
𝑇𝑜𝑡𝑎𝑙 𝑃𝑟𝑜𝑗𝑒𝑐𝑡 𝐶𝑜𝑠𝑡
2. 𝐵 𝐶⁄ =𝐵𝑒𝑛𝑒𝑓𝑖𝑡
𝑇𝑜𝑡𝑎𝑙 𝑆𝐻𝑂𝑃𝑃 𝐶𝑜𝑠𝑡
If the project receives funds in addition to the SHOPP, the sources of these funds could be
other agencies with other strategic goals. The purpose of the Project Prioritization Criteria
2016 is to maximize the cumulative benefit to cost ratio for the SHOPP. Therefore, the
second option is deemed to fulfill this purpose.
In summary, the Project Prioritization Criteria 2016 recommend to maximize the
cumulative benefit to cost ratio for a project. A project with a higher value of the 𝐵 𝐶⁄ ratio
has a better chance to rank higher in the Department’s project portfolio. This project
prioritization process depends on the accomplishments of each project relative to its cost.
This approach provides repeatable and objective criteria for project prioritization that is
performance-based and considers the value for dollar of each transportation project across
all assets and objectives. This prioritization process has shown to have merit and will
allow the department to shift from silo-based management to a process that evaluates the
comprehensive benefit to cost ratio for each project.

Project Prioritization Criteria Page 42
10 Future Needs
The completion of the 2016 SHOPP Asset Management Pilot Program marks a significant
step toward the overall implementation of Transportation Asset Management. This pilot
resulted in significant accomplishments that include a documented project evaluation
criteria, alignment with the Caltrans Strategic Management Plan 2015-2020, a formal
benefit-cost methodology for the SHOPP, initial weights for each of the Strategic Plan goals,
and a shift in the cultural approach to project planning.
The Pilot Program also highlighted several areas for further study and refinement in the
approach. Caltrans is not currently capturing the necessary data in the planning process
that will allow prioritization to be conducted. The Pilot Program identified numerous data
items that will need to be incorporated into future planning documents. There is need for
additional analysis and external review of the objective functions and underlying data to
determine if the prioritization criteria and weights are equitably treating all transportation
system needs. For example, are the rural project locations being treated fairly in the
analysis? Are the goal weights appropriate given the range of data underlying each goal
scores? Are the Strategic Plan objectives sufficiently independent of each other as defined
for each goal? Is the project magnitude factor being appropriately applied across all assets
and objectives? The Department has initiated a contract with an external MODA expert
who will be tasked with evaluating the questions noted above.
There are other considerations that need to be evaluated. Federal law requires the
incorporation of risk management, life-cycle cost analysis, and performance management
within the context of the Transportation Asset Management Plan (TAMP). The relationship
between this project prioritization methodology and these other requirements needs to be
evaluated. For example, it could be possible that the project prioritization methodology
may not identify the appropriate project needed to achieve a condition performance
objective identified under federal performance management requirements. The structure
of the objective and sub-objective value functions used in the prioritization process needs
to be aligned with the performance objectives to ensure that sufficient granularity exists
within the weighting to address performance management objectives. These related asset
management requirements will need to be evaluated and integrated into a single
comprehensive asset management approach.
Project Prioritization Criteria Page 43
References
1. 112th Congress of the United States of America. Moving Ahead for Progress in the 21st
Century Act.
2. 114th Congress of the United States of America. Fixing America’s Surface
Transportation Act
3. State of California Department of Transportation (2015) SHOPP Pilot Project; Phase 1:
A Framework for Project Prioritization.
4. Crash Modification Factors Clearinghouse. http://www.cmfclearinghouse.org.
5. California Environmental Protection Agency (2014) California Communities
Environmental Health Screening Tool, Version 2.0 (CalEnviroScreen 2.0); Guidance and
Screening Tool.
6. State of California Department of Transportation Annual / Quarterly Mobility
Performance Statistics. http://www.dot.ca.gov/hq/traffops/mpr/stats.html.
7. Pedestrian and Bicycle Safety Guide and Countermeasure Selection System.
http://pedbikesafe.org/.
8. Department for Communities and Local Government: London (2009) Multi-Criteria
Analysis: A Manual.
9. Triantaphyllou E, Mann SH (1995) Using the Analytic Hierarchy Process for Decision
Making in Engineering Applications: Some Challenges. International Journal of
Industrial Engineering, 2: 35-44.
10. State of California Department of Transportation (2015) The California Department of
Transportation Strategic Management Plan 2015-2020.
11. State of California Department of Transportation (2012) Smart Mobility: A Survey of
Current Practice and Related Research. Division of Research, Innovation, and System
Information Preliminary Investigation.
12. State of California Department of Transportation (2013) Sustainability Tools and
Practices: An Examination of Selected State Departments of Transportation, California
Metropolitan Planning Organizations and National Tools. Division of Research,
Innovation, and System Information Preliminary Investigation.
13. State of California. California Government Code § 14526.4.

Project Prioritization Criteria Page 44
Appendix A: Crash Modification Factors for Spot Locations and Systemic
Safety
Countermeasure (s)
Cra
sh T
ype
Cra
sh Severity
Area
Typ
e / Ro
ad
Typ
e
Da
ily Tra
ffic Vo
l. (veh/d
ay)
Cra
sh R
edu
ction
Fa
ctor / F
un
ction
(%)
Co
un
termea
sure E
ffectiveness
ROADWAY DEPARTURE: BARRIER Improve guardrail All All < 5000 18 D All All > 5000 9 E ROR All 28 C Install animal fencing Animal All All 90 A Install barrier (concrete) inside and outside curve
All Fatal / Injury 39 B
Install guardrail (as shield for rocks and posts)
All All 14 D
Install guardrail (as shield for trees)
All Fatal 65 A
Install guardrail (at culvert)
All All 27 C
Install guardrail (at ditch) All Injury 26 C Install guardrail (at embankment)
ROR Fatal 44 A
Install guardrail (inside curves)
All Fatal / Injury 28 C
Install guardrail (outside curves)
All Fatal / Injury 63 A
Install impact attenuators All All 29 C Replace guardrail with a softer material (concrete→steel→wire)
ROR Injury All 32 B
ROADWAY DEPARTURE: BRIDGE Install bridge lighting All All 59 A Install delineators (on bridges)
All All 39 B
Install guardrail (at bridge)
All All 24 C
Repair bridge deck All All 14 D Replace bridge (general) All All All 45 A
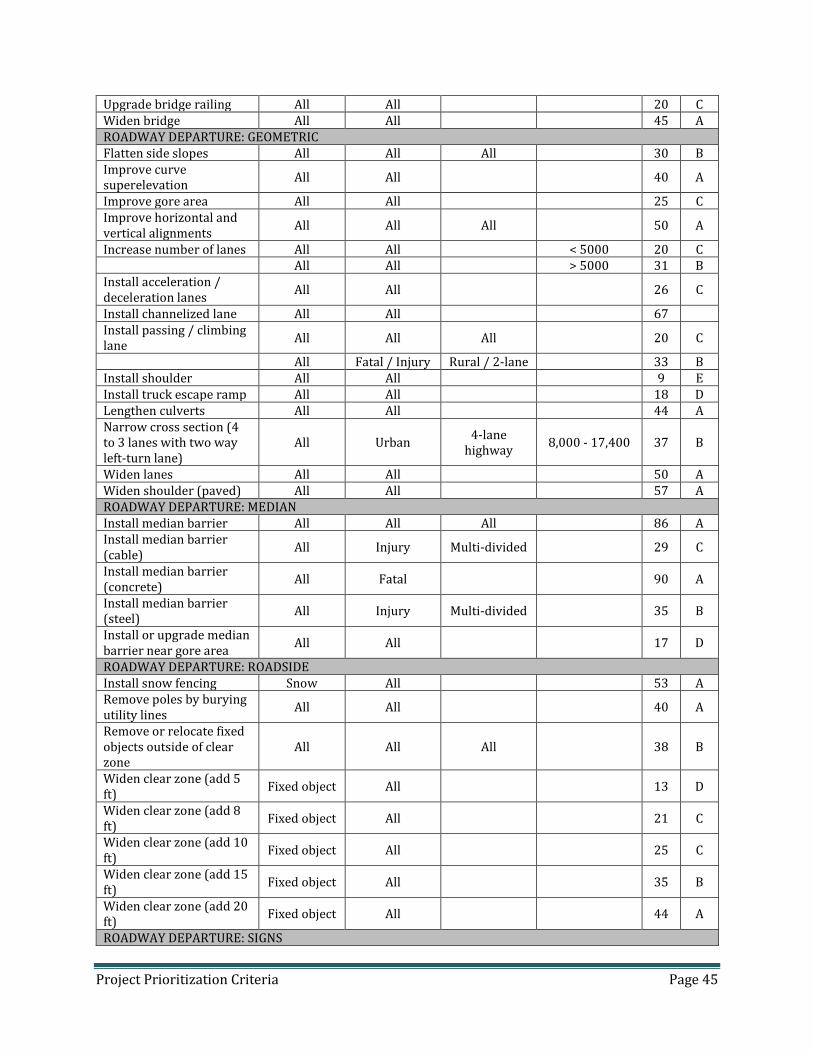
Project Prioritization Criteria Page 45
Upgrade bridge railing All All 20 C Widen bridge All All 45 A ROADWAY DEPARTURE: GEOMETRIC Flatten side slopes All All All 30 B Improve curve superelevation
All All 40 A
Improve gore area All All 25 C Improve horizontal and vertical alignments
All All All 50 A
Increase number of lanes All All < 5000 20 C All All > 5000 31 B Install acceleration / deceleration lanes
All All 26 C
Install channelized lane All All 67 Install passing / climbing lane
All All All 20 C
All Fatal / Injury Rural / 2-lane 33 B Install shoulder All All 9 E Install truck escape ramp All All 18 D Lengthen culverts All All 44 A Narrow cross section (4 to 3 lanes with two way left-turn lane)
All Urban 4-lane
highway 8,000 - 17,400 37 B
Widen lanes All All 50 A Widen shoulder (paved) All All 57 A ROADWAY DEPARTURE: MEDIAN Install median barrier All All All 86 A Install median barrier (cable)
All Injury Multi-divided 29 C
Install median barrier (concrete)
All Fatal 90 A
Install median barrier (steel)
All Injury Multi-divided 35 B
Install or upgrade median barrier near gore area
All All 17 D
ROADWAY DEPARTURE: ROADSIDE Install snow fencing Snow All 53 A Remove poles by burying utility lines
All All 40 A
Remove or relocate fixed objects outside of clear zone
All All All 38 B
Widen clear zone (add 5 ft)
Fixed object All 13 D
Widen clear zone (add 8 ft)
Fixed object All 21 C
Widen clear zone (add 10 ft)
Fixed object All 25 C
Widen clear zone (add 15 ft)
Fixed object All 35 B
Widen clear zone (add 20 ft)
Fixed object All 44 A
ROADWAY DEPARTURE: SIGNS

Project Prioritization Criteria Page 46
Install chevron signs on horizontal curves
All All 35 B
Install curve advance warning signs
All All 30 B
Install curve advance warning signs (advisory speed)
All All 29 C
Install delineators (general)
All All 11 D
Install dynamic / variable accident warning signs
All Injury Freeways 44 A
Install dynamic / variable speed warning signs
All All 46 A
Install guide signs (general)
All All 15 D
Install guideposts or barrier reflectors
All Fatal / Injury Rural 2-lane 8 E
Install illuminated signs All All 15 D Install pavement condition warning signs
All All 5 E
Install post-mounted delineators (curves)
All All 25 C
ROADWAY DEPARTURE: PAVEMENT Improve pavement friction (grooving)
All All 21 C
Improve pavement friction (increase skid resistance)
Wet pavement
All All 45 A
Improve pavement friction (overlay)
All All > 5000 13 D
< 5000 20 C Improve pavement friction (curve overlay)
All All 17 D
Improve pavement friction (resurface with open-graded mix)
All All 75 A
Install centerline rumble strips
All All Rural / 2-lane 5000 - 22000 14 D
Install shoulder rumble strips
All All Rural / multi-lane divided
16 D
ROR All Rural / 2-lane 13 D
ROR All Rural /
Highway 27 C
ROR All Freeway 18 D Pave shoulder All All 15 D ROADWAY DEPARTURE: MARKINGS Delineate multiple lanes (painted lane lines)
All All Urban /
multi-lane 18 D
Install edgelines, centerlines and delineators
All Injury All 45 A
Prohibit on-street parking
All All Urban / Arterial
30000 42 A
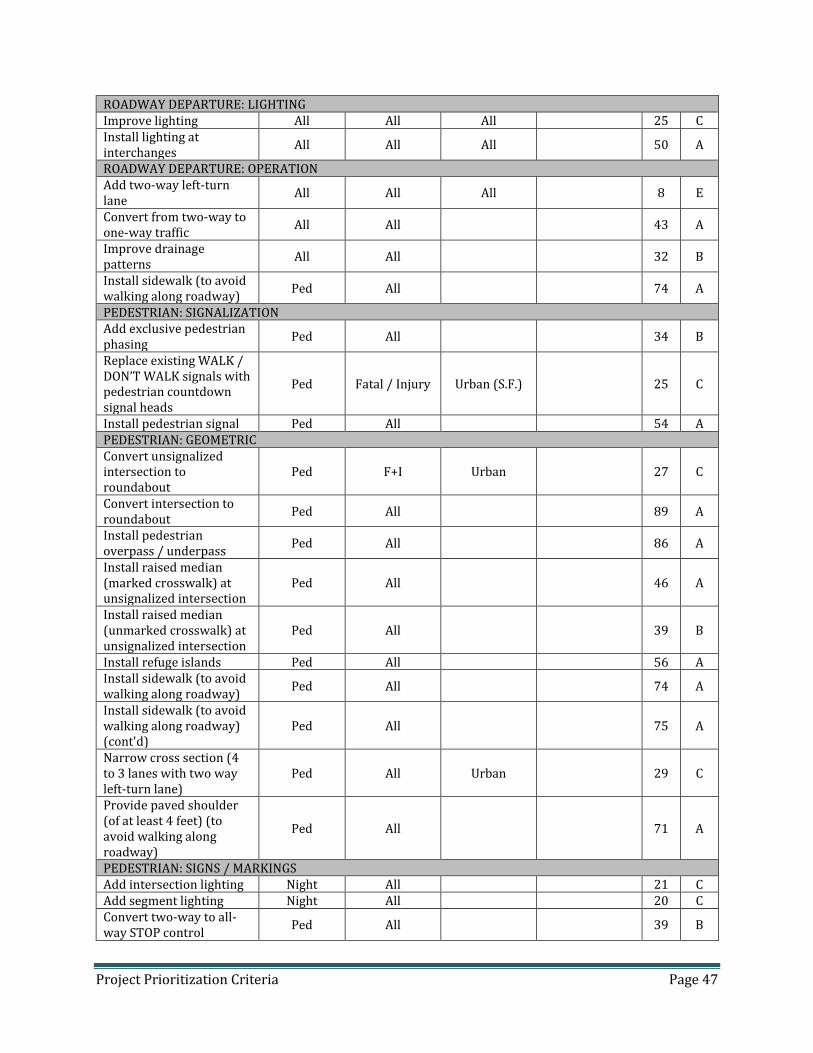
Project Prioritization Criteria Page 47
ROADWAY DEPARTURE: LIGHTING Improve lighting All All All 25 C Install lighting at interchanges
All All All 50 A
ROADWAY DEPARTURE: OPERATION Add two-way left-turn lane
All All All 8 E
Convert from two-way to one-way traffic
All All 43 A
Improve drainage patterns
All All 32 B
Install sidewalk (to avoid walking along roadway)
Ped All 74 A
PEDESTRIAN: SIGNALIZATION Add exclusive pedestrian phasing
Ped All 34 B
Replace existing WALK / DON’T WALK signals with pedestrian countdown signal heads
Ped Fatal / Injury Urban (S.F.) 25 C
Install pedestrian signal Ped All 54 A PEDESTRIAN: GEOMETRIC Convert unsignalized intersection to roundabout
Ped F+I Urban 27 C
Convert intersection to roundabout
Ped All 89 A
Install pedestrian overpass / underpass
Ped All 86 A
Install raised median (marked crosswalk) at unsignalized intersection
Ped All 46 A
Install raised median (unmarked crosswalk) at unsignalized intersection
Ped All 39 B
Install refuge islands Ped All 56 A Install sidewalk (to avoid walking along roadway)
Ped All 74 A
Install sidewalk (to avoid walking along roadway) (cont'd)
Ped All 75 A
Narrow cross section (4 to 3 lanes with two way left-turn lane)
Ped All Urban 29 C
Provide paved shoulder (of at least 4 feet) (to avoid walking along roadway)
Ped All 71 A
PEDESTRIAN: SIGNS / MARKINGS Add intersection lighting Night All 21 C Add segment lighting Night All 20 C Convert two-way to all-way STOP control
Ped All 39 B

Project Prioritization Criteria Page 48
Improve lighting at intersections
Ped Injury 42 A
INTERSECTION: SIGNAL OPERATIONS Install pedestrian signal All All 20 C Provide protected left turn phase
All All < 5000 30 B
> 5000 36 B Convert signal from pedestal-mounted to mast arm
All All 49 A
Install signals All All < 5000 38 B > 5000 20 C Install left-turn lane and add turn phase
All All 58 A
Install right-turn lane All All 25 C Install flashing beacons as advance warning
All All 25 C
INTERSECTION: GEOMETRIC Convert intersection to roundabout
All All 48 A
Improve sight distance to intersection
All Fatal 56 A
Install Median All All 27 C Provide bicycle box (advance stop bar to leave dedicated space for cyclists)
Bicycle All 35 B
Provide Bike Lanes Bicycle All 36 B Prohibit left-turns All All 45 A Prohibit right-turn-on red 23 C
Crash Reduction Factor (%) Countermeasure Effectiveness 0 - 9 ‘E’
10 - 19 ‘D’ 20 - 29 ‘C’ 30 - 39 ‘B’
40+ ‘A’
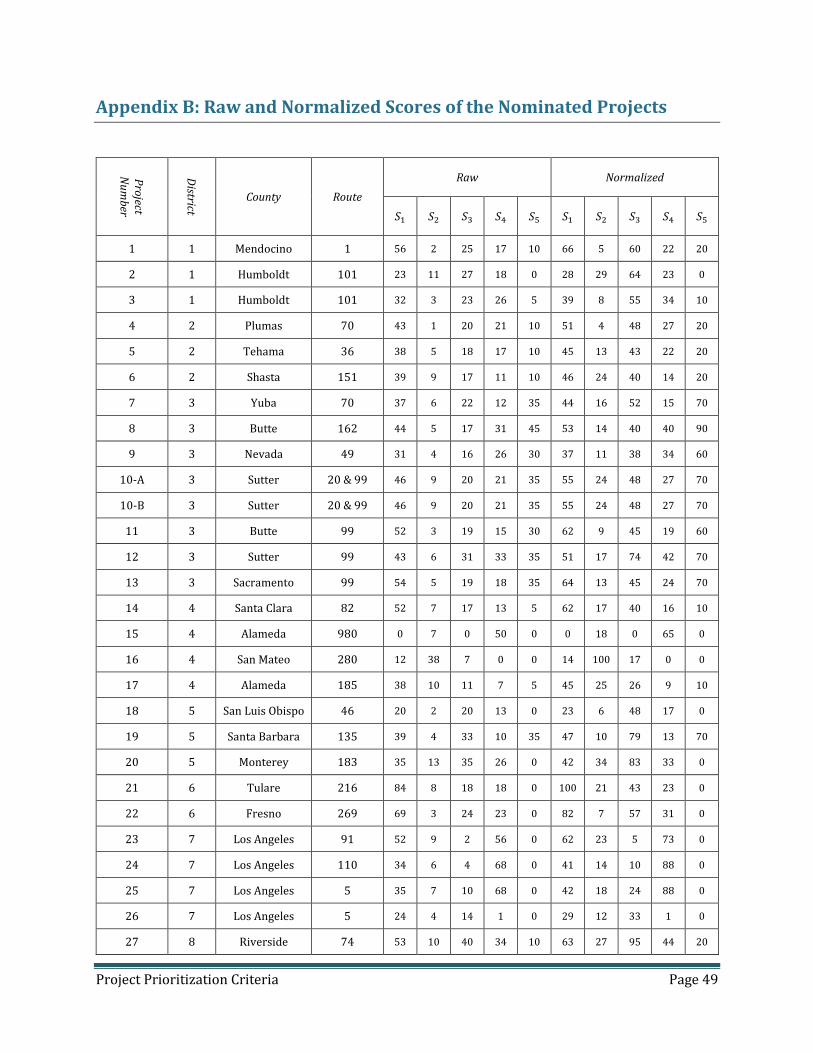
Project Prioritization Criteria Page 49
Appendix B: Raw and Normalized Scores of the Nominated Projects
Pro
ject N
um
ber
District
County Route
Raw Normalized
𝑆1 𝑆2 𝑆3 𝑆4 𝑆5 𝑆1 𝑆2 𝑆3 𝑆4 𝑆5
1 1 Mendocino 1 56 2 25 17 10 66 5 60 22 20
2 1 Humboldt 101 23 11 27 18 0 28 29 64 23 0
3 1 Humboldt 101 32 3 23 26 5 39 8 55 34 10
4 2 Plumas 70 43 1 20 21 10 51 4 48 27 20
5 2 Tehama 36 38 5 18 17 10 45 13 43 22 20
6 2 Shasta 151 39 9 17 11 10 46 24 40 14 20
7 3 Yuba 70 37 6 22 12 35 44 16 52 15 70
8 3 Butte 162 44 5 17 31 45 53 14 40 40 90
9 3 Nevada 49 31 4 16 26 30 37 11 38 34 60
10-A 3 Sutter 20 & 99 46 9 20 21 35 55 24 48 27 70
10-B 3 Sutter 20 & 99 46 9 20 21 35 55 24 48 27 70
11 3 Butte 99 52 3 19 15 30 62 9 45 19 60
12 3 Sutter 99 43 6 31 33 35 51 17 74 42 70
13 3 Sacramento 99 54 5 19 18 35 64 13 45 24 70
14 4 Santa Clara 82 52 7 17 13 5 62 17 40 16 10
15 4 Alameda 980 0 7 0 50 0 0 18 0 65 0
16 4 San Mateo 280 12 38 7 0 0 14 100 17 0 0
17 4 Alameda 185 38 10 11 7 5 45 25 26 9 10
18 5 San Luis Obispo 46 20 2 20 13 0 23 6 48 17 0
19 5 Santa Barbara 135 39 4 33 10 35 47 10 79 13 70
20 5 Monterey 183 35 13 35 26 0 42 34 83 33 0
21 6 Tulare 216 84 8 18 18 0 100 21 43 23 0
22 6 Fresno 269 69 3 24 23 0 82 7 57 31 0
23 7 Los Angeles 91 52 9 2 56 0 62 23 5 73 0
24 7 Los Angeles 110 34 6 4 68 0 41 14 10 88 0
25 7 Los Angeles 5 35 7 10 68 0 42 18 24 88 0
26 7 Los Angeles 5 24 4 14 1 0 29 12 33 1 0
27 8 Riverside 74 53 10 40 34 10 63 27 95 44 20
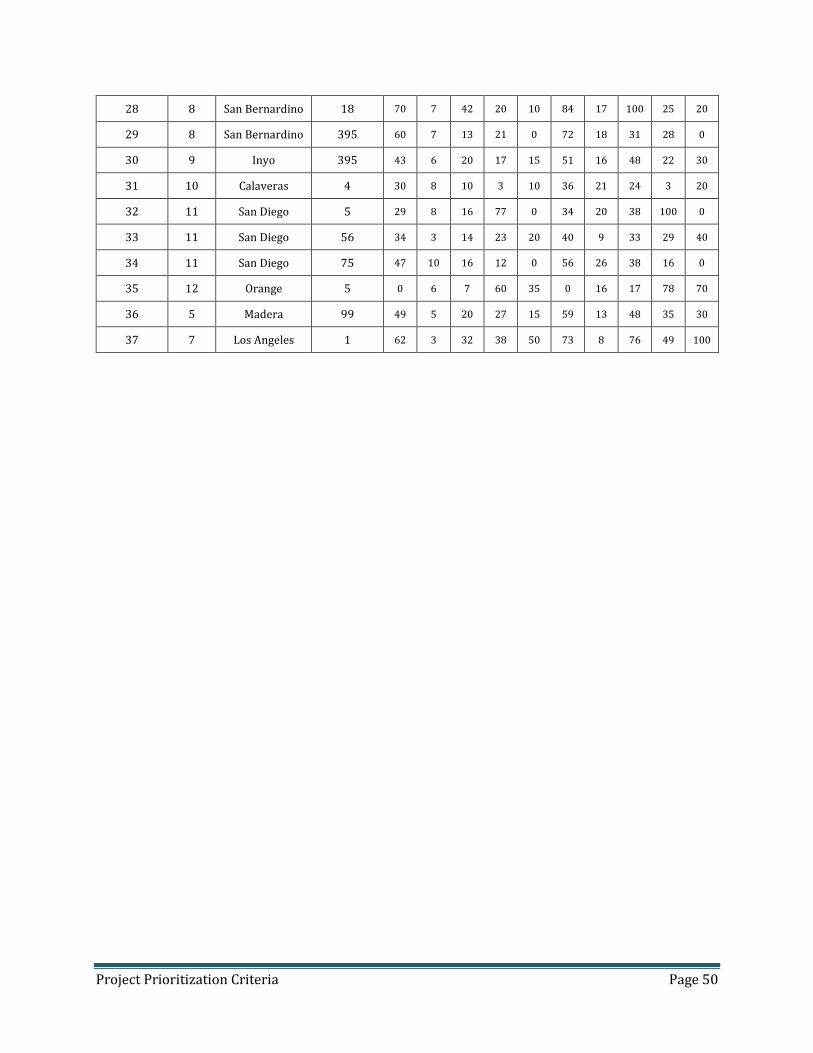
Project Prioritization Criteria Page 50
28 8 San Bernardino 18 70 7 42 20 10 84 17 100 25 20
29 8 San Bernardino 395 60 7 13 21 0 72 18 31 28 0
30 9 Inyo 395 43 6 20 17 15 51 16 48 22 30
31 10 Calaveras 4 30 8 10 3 10 36 21 24 3 20
32 11 San Diego 5 29 8 16 77 0 34 20 38 100 0
33 11 San Diego 56 34 3 14 23 20 40 9 33 29 40
34 11 San Diego 75 47 10 16 12 0 56 26 38 16 0
35 12 Orange 5 0 6 7 60 35 0 16 17 78 70
36 5 Madera 99 49 5 20 27 15 59 13 48 35 30
37 7 Los Angeles 1 62 3 32 38 50 73 8 76 49 100
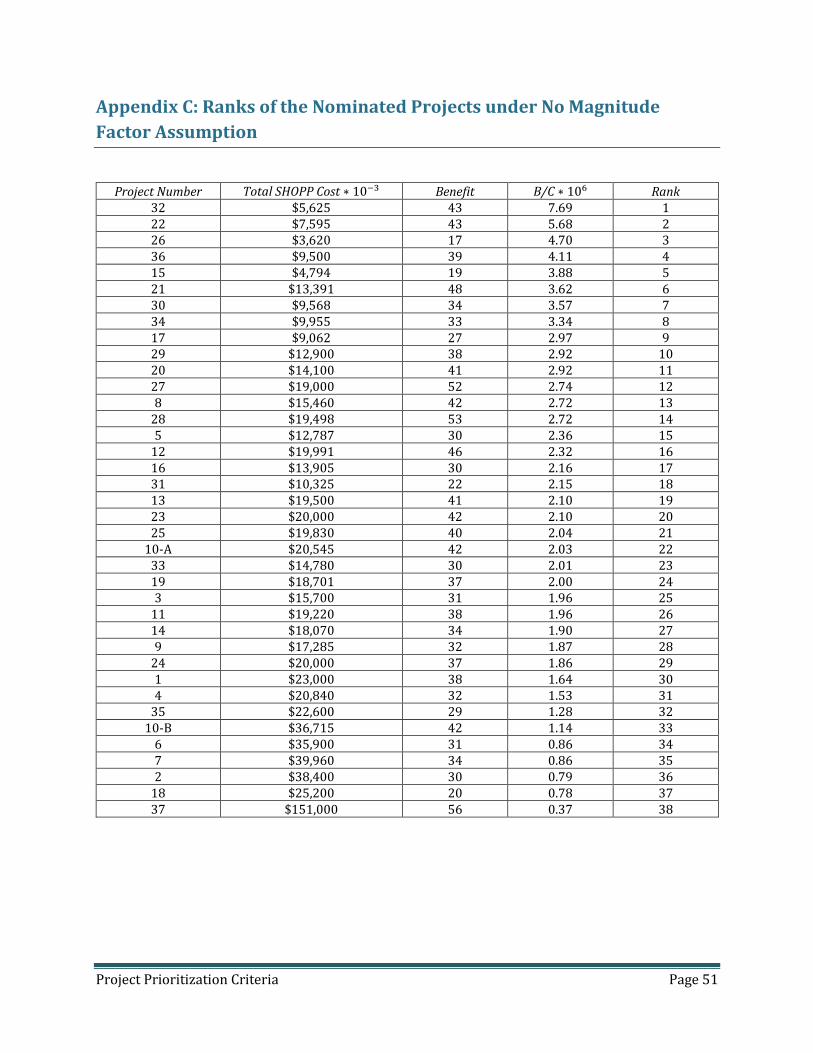
Project Prioritization Criteria Page 51
Appendix C: Ranks of the Nominated Projects under No Magnitude
Factor Assumption
Project Number Total SHOPP Cost ∗ 10−3 Benefit B/C ∗ 106 Rank 32 $5,625 43 7.69 1 22 $7,595 43 5.68 2 26 $3,620 17 4.70 3 36 $9,500 39 4.11 4 15 $4,794 19 3.88 5 21 $13,391 48 3.62 6 30 $9,568 34 3.57 7 34 $9,955 33 3.34 8 17 $9,062 27 2.97 9 29 $12,900 38 2.92 10 20 $14,100 41 2.92 11 27 $19,000 52 2.74 12 8 $15,460 42 2.72 13
28 $19,498 53 2.72 14 5 $12,787 30 2.36 15
12 $19,991 46 2.32 16 16 $13,905 30 2.16 17 31 $10,325 22 2.15 18 13 $19,500 41 2.10 19 23 $20,000 42 2.10 20 25 $19,830 40 2.04 21
10-A $20,545 42 2.03 22 33 $14,780 30 2.01 23 19 $18,701 37 2.00 24 3 $15,700 31 1.96 25
11 $19,220 38 1.96 26 14 $18,070 34 1.90 27 9 $17,285 32 1.87 28
24 $20,000 37 1.86 29 1 $23,000 38 1.64 30 4 $20,840 32 1.53 31
35 $22,600 29 1.28 32 10-B $36,715 42 1.14 33
6 $35,900 31 0.86 34 7 $39,960 34 0.86 35 2 $38,400 30 0.79 36
18 $25,200 20 0.78 37 37 $151,000 56 0.37 38
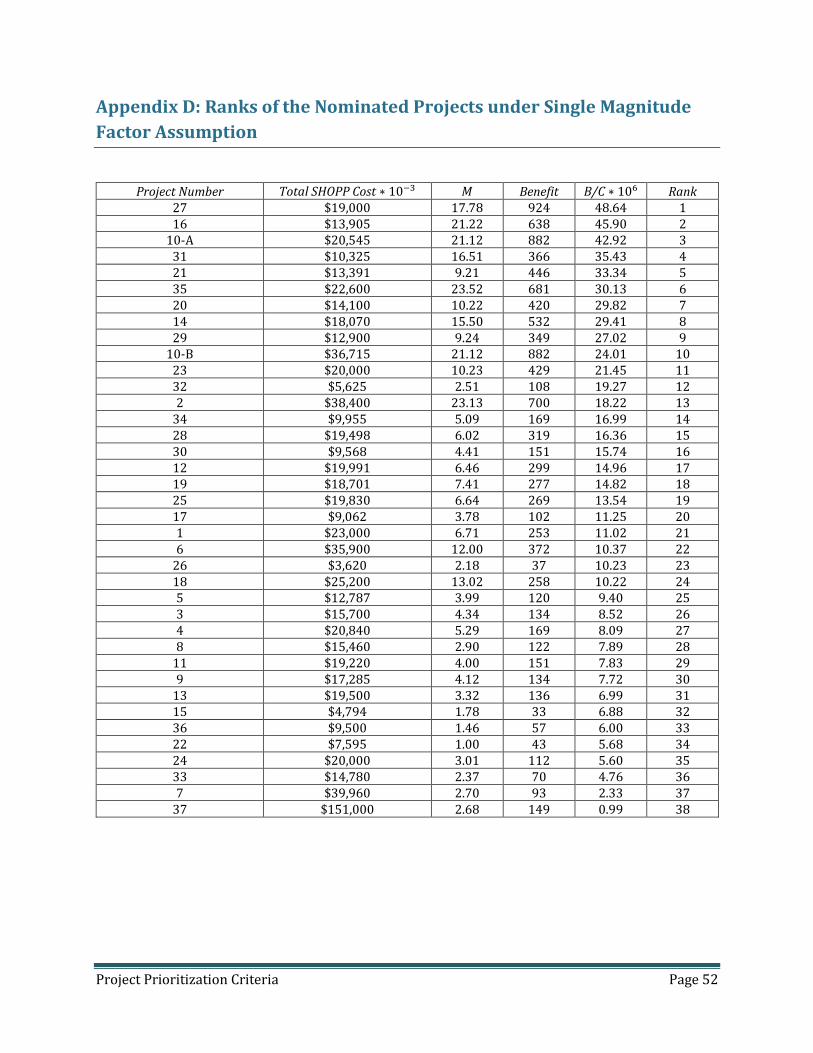
Project Prioritization Criteria Page 52
Appendix D: Ranks of the Nominated Projects under Single Magnitude
Factor Assumption
Project Number Total SHOPP Cost ∗ 10−3 𝑀 Benefit B/C ∗ 106 Rank 27 $19,000 17.78 924 48.64 1 16 $13,905 21.22 638 45.90 2
10-A $20,545 21.12 882 42.92 3 31 $10,325 16.51 366 35.43 4 21 $13,391 9.21 446 33.34 5 35 $22,600 23.52 681 30.13 6 20 $14,100 10.22 420 29.82 7 14 $18,070 15.50 532 29.41 8 29 $12,900 9.24 349 27.02 9
10-B $36,715 21.12 882 24.01 10 23 $20,000 10.23 429 21.45 11 32 $5,625 2.51 108 19.27 12 2 $38,400 23.13 700 18.22 13
34 $9,955 5.09 169 16.99 14 28 $19,498 6.02 319 16.36 15 30 $9,568 4.41 151 15.74 16 12 $19,991 6.46 299 14.96 17 19 $18,701 7.41 277 14.82 18 25 $19,830 6.64 269 13.54 19 17 $9,062 3.78 102 11.25 20 1 $23,000 6.71 253 11.02 21 6 $35,900 12.00 372 10.37 22
26 $3,620 2.18 37 10.23 23 18 $25,200 13.02 258 10.22 24 5 $12,787 3.99 120 9.40 25 3 $15,700 4.34 134 8.52 26 4 $20,840 5.29 169 8.09 27 8 $15,460 2.90 122 7.89 28
11 $19,220 4.00 151 7.83 29 9 $17,285 4.12 134 7.72 30
13 $19,500 3.32 136 6.99 31 15 $4,794 1.78 33 6.88 32 36 $9,500 1.46 57 6.00 33 22 $7,595 1.00 43 5.68 34 24 $20,000 3.01 112 5.60 35 33 $14,780 2.37 70 4.76 36 7 $39,960 2.70 93 2.33 37
37 $151,000 2.68 149 0.99 38
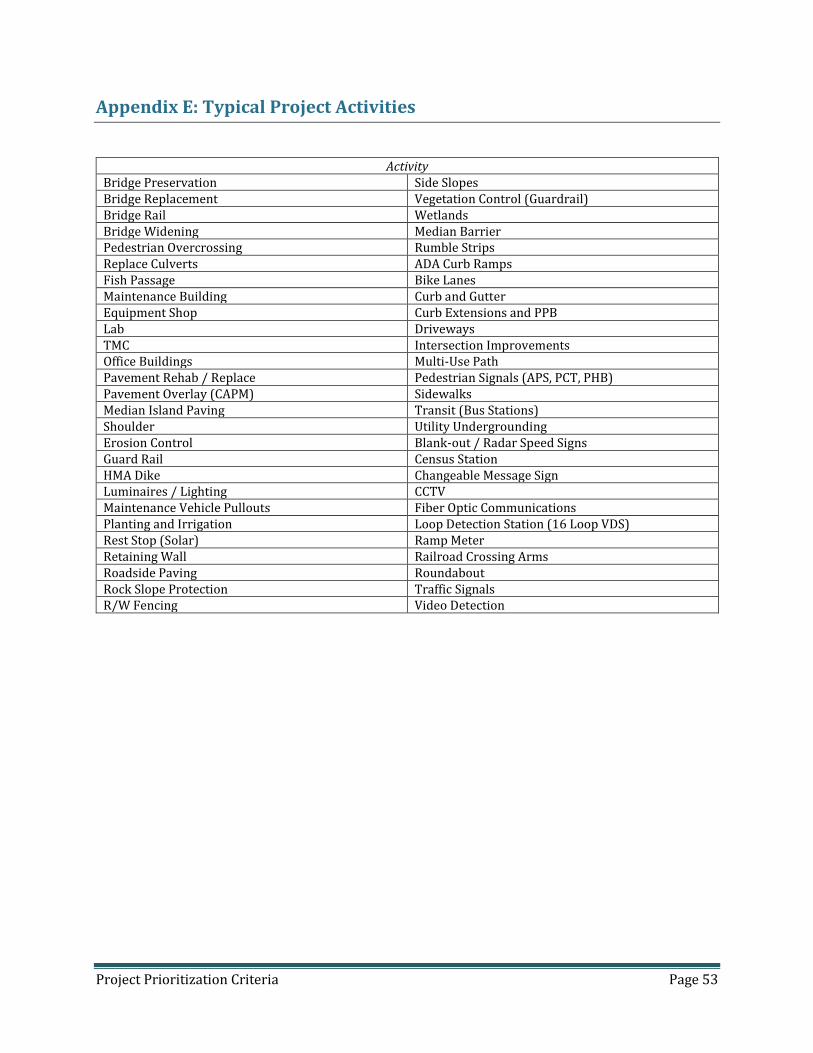
Project Prioritization Criteria Page 53
Appendix E: Typical Project Activities
Activity Bridge Preservation Side Slopes Bridge Replacement Vegetation Control (Guardrail) Bridge Rail Wetlands Bridge Widening Median Barrier Pedestrian Overcrossing Rumble Strips Replace Culverts ADA Curb Ramps Fish Passage Bike Lanes Maintenance Building Curb and Gutter Equipment Shop Curb Extensions and PPB Lab Driveways TMC Intersection Improvements Office Buildings Multi-Use Path Pavement Rehab / Replace Pedestrian Signals (APS, PCT, PHB) Pavement Overlay (CAPM) Sidewalks Median Island Paving Transit (Bus Stations) Shoulder Utility Undergrounding Erosion Control Blank-out / Radar Speed Signs Guard Rail Census Station HMA Dike Changeable Message Sign Luminaires / Lighting CCTV Maintenance Vehicle Pullouts Fiber Optic Communications Planting and Irrigation Loop Detection Station (16 Loop VDS) Rest Stop (Solar) Ramp Meter Retaining Wall Railroad Crossing Arms Roadside Paving Roundabout Rock Slope Protection Traffic Signals R/W Fencing Video Detection

Project Prioritization Criteria Page 54
Appendix F: Multiple Magnitude Factors of the Nominated Projects
Project Number 𝑀1 𝑀2 𝑀3 𝑀4 1 13.48 530.36 61.33 0.87 2 0.00 1249.38 1.30 0.52 3 0.00 0.00 37.55 536.31 4 9.64 512.74 0.00 4.70 5 61.49 538.93 0.00 47.24 6 8.60 675.53 10.15 0.00 7 0.00 140.39 0.00 0.00 8 0.00 309.83 15.31 64.04 9 3.18 478.68 0.01 13.54
10-A 29.45 1365.34 226.33 513.99 10-B 16.48 764.02 126.65 287.62
11 0.00 342.62 85.07 4.16 12 0.00 209.59 91.54 369.99 13 76.41 270.77 6.92 0.00 14 12.17 427.50 1342.23 0.00 15 0.00 0.00 0.00 769.09 16 5.75 3164.33 0.00 0.00 17 0.00 790.11 76.97 0.00 18 281.65 787.24 0.00 4.48 19 11.12 667.85 142.71 1.34 20 11.06 1123.76 344.89 25.82 21 7.47 267.34 806.74 347.53 22 0.00 56.96 94.80 121.73 23 0.00 537.00 0.00 525.65 24 21.92 0.00 0.00 290.93 25 0.00 0.00 0.00 695.99 26 1113.26 0.00 137.02 0.00 27 212.11 878.21 510.87 342.51 28 0.00 351.57 290.15 0.00 29 0.00 1314.12 32.56 141.09 30 0.00 600.18 209.21 147.24 31 68.37 3238.26 14.99 0.00 32 97.78 355.56 422.22 50.18 33 234.20 41.81 13.19 44.29 34 0.00 664.81 119.34 278.62 35 0.00 0.00 0.00 2161.73 36 16.00 201.68 101.89 0.00 37 9.13 0.00 21.58 6.12

Project Prioritization Criteria Page 55
Appendix G: Ranks of the Nominated Projects under Multiple Magnitude
Factor Assumption
Project Number Total SHOPP Cost ∗ 10−3 Benefit B/C ∗ 106 Rank 16 $13,905 72808 5236 1 26 $3,620 10869 3003 2 15 $4,794 11031 2301 3 35 $22,600 37206 1646 4 31 $10,325 16130 1562 5 32 $5,625 6227 1107 6 27 $19,000 20418 1075 7 20 $14,100 13517 959 8 25 $19,830 13493 680 9 21 $13,391 8521 636 10
10-A $20,545 12722 619 11 34 $9,955 5681 571 12 23 $20,000 11326 566 13 14 $18,070 10104 559 14 17 $9,062 4927 544 15 29 $12,900 6353 492 16 30 $9,568 4383 458 17 28 $19,498 5798 297 18 24 $20,000 5923 296 19 3 $15,700 4365 278 20
12 $19,991 5302 265 21 33 $14,780 3461 234 22 22 $7,595 1754 231 23 2 $38,400 8381 218 24 5 $12,787 2670 209 25
10-B $36,715 7121 194 26 19 $18,701 3336 178 27 36 $9,500 1653 174 28 18 $25,200 3248 129 29 13 $19,500 2404 123 30 6 $35,900 3920 109 31 8 $15,460 1687 109 32 9 $17,285 1391 80 33
11 $19,220 1330 69 34 1 $23,000 1440 63 35 4 $20,840 649 31 36 7 $39,960 531 13 37
37 $151,000 537 4 38
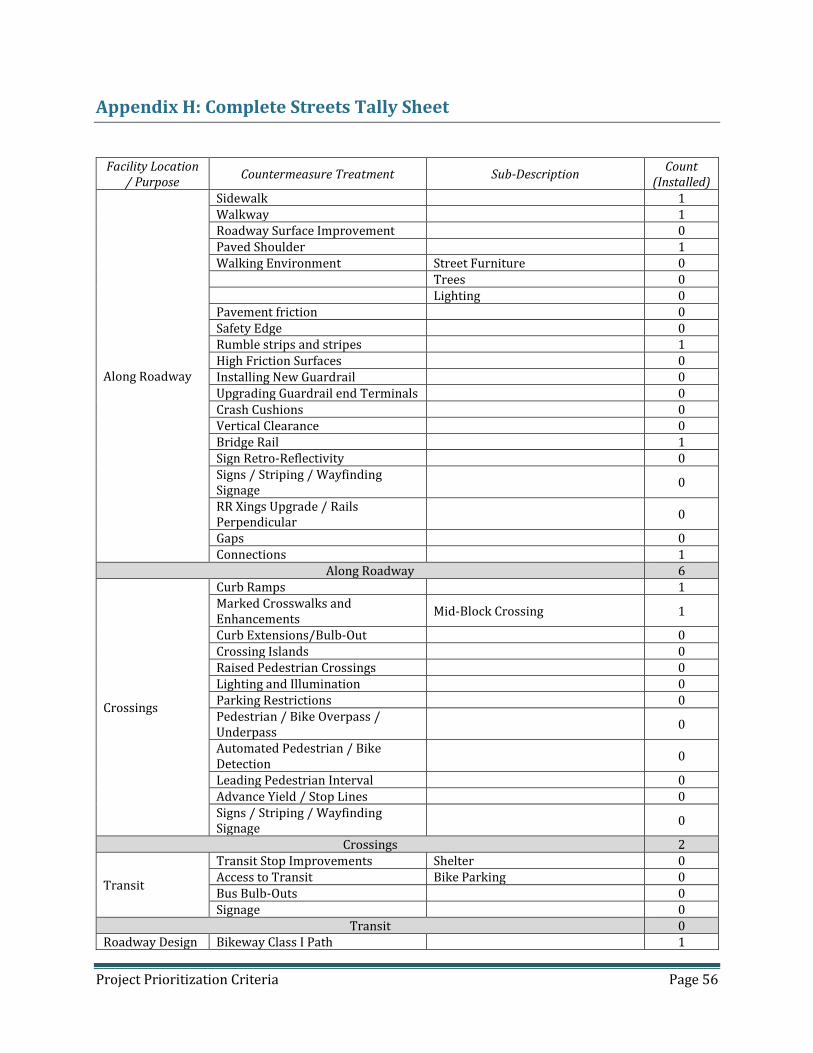
Project Prioritization Criteria Page 56
Appendix H: Complete Streets Tally Sheet
Facility Location / Purpose
Countermeasure Treatment Sub-Description Count
(Installed)
Along Roadway
Sidewalk 1 Walkway 1 Roadway Surface Improvement 0 Paved Shoulder 1 Walking Environment Street Furniture 0 Trees 0 Lighting 0 Pavement friction 0 Safety Edge 0 Rumble strips and stripes 1 High Friction Surfaces 0 Installing New Guardrail 0 Upgrading Guardrail end Terminals 0 Crash Cushions 0 Vertical Clearance 0 Bridge Rail 1 Sign Retro-Reflectivity 0 Signs / Striping / Wayfinding Signage
0
RR Xings Upgrade / Rails Perpendicular
0
Gaps 0 Connections 1
Along Roadway 6
Crossings
Curb Ramps 1 Marked Crosswalks and Enhancements
Mid-Block Crossing 1
Curb Extensions/Bulb-Out 0 Crossing Islands 0 Raised Pedestrian Crossings 0 Lighting and Illumination 0 Parking Restrictions 0 Pedestrian / Bike Overpass / Underpass
0
Automated Pedestrian / Bike Detection
0
Leading Pedestrian Interval 0 Advance Yield / Stop Lines 0 Signs / Striping / Wayfinding Signage
0
Crossings 2
Transit
Transit Stop Improvements Shelter 0 Access to Transit Bike Parking 0 Bus Bulb-Outs 0 Signage 0
Transit 0 Roadway Design Bikeway Class I Path 1
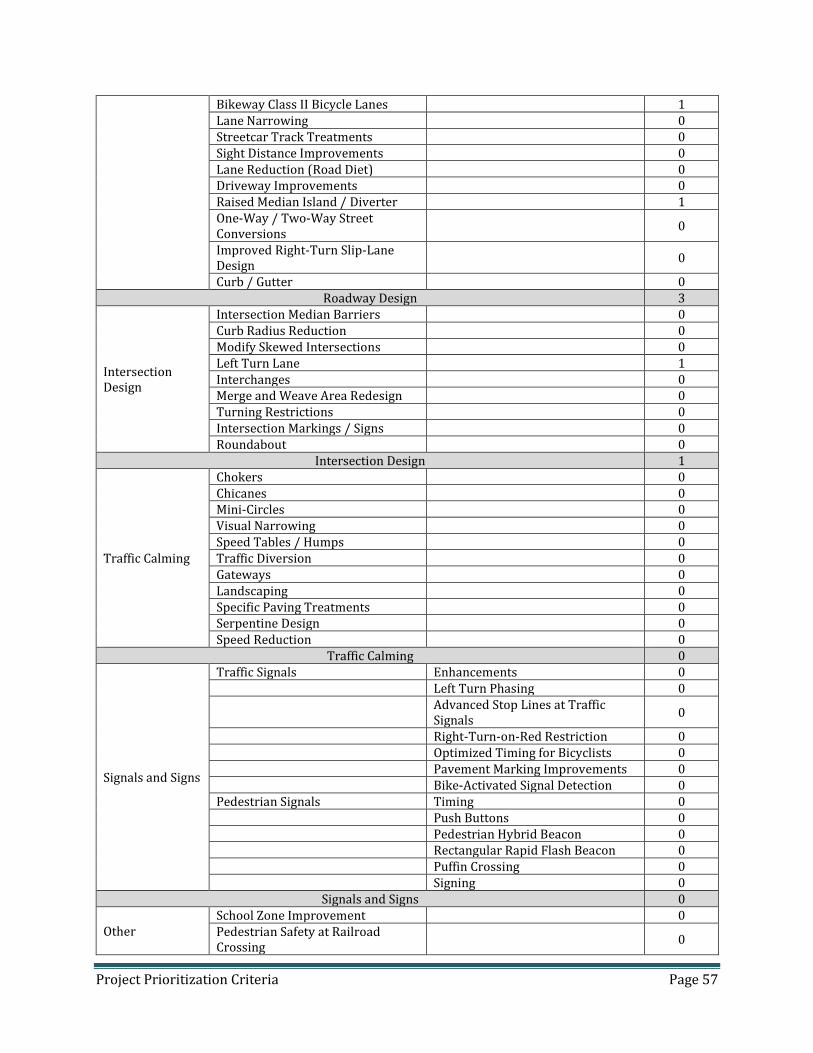
Project Prioritization Criteria Page 57
Bikeway Class II Bicycle Lanes 1 Lane Narrowing 0 Streetcar Track Treatments 0 Sight Distance Improvements 0 Lane Reduction (Road Diet) 0 Driveway Improvements 0 Raised Median Island / Diverter 1 One-Way / Two-Way Street Conversions
0
Improved Right-Turn Slip-Lane Design
0
Curb / Gutter 0 Roadway Design 3
Intersection Design
Intersection Median Barriers 0 Curb Radius Reduction 0 Modify Skewed Intersections 0 Left Turn Lane 1 Interchanges 0 Merge and Weave Area Redesign 0 Turning Restrictions 0 Intersection Markings / Signs 0 Roundabout 0
Intersection Design 1
Traffic Calming
Chokers 0 Chicanes 0 Mini-Circles 0 Visual Narrowing 0 Speed Tables / Humps 0 Traffic Diversion 0 Gateways 0 Landscaping 0 Specific Paving Treatments 0 Serpentine Design 0 Speed Reduction 0
Traffic Calming 0
Signals and Signs
Traffic Signals Enhancements 0 Left Turn Phasing 0
Advanced Stop Lines at Traffic Signals
0
Right-Turn-on-Red Restriction 0 Optimized Timing for Bicyclists 0 Pavement Marking Improvements 0 Bike-Activated Signal Detection 0 Pedestrian Signals Timing 0 Push Buttons 0 Pedestrian Hybrid Beacon 0 Rectangular Rapid Flash Beacon 0 Puffin Crossing 0 Signing 0
Signals and Signs 0
Other School Zone Improvement 0 Pedestrian Safety at Railroad Crossing
0
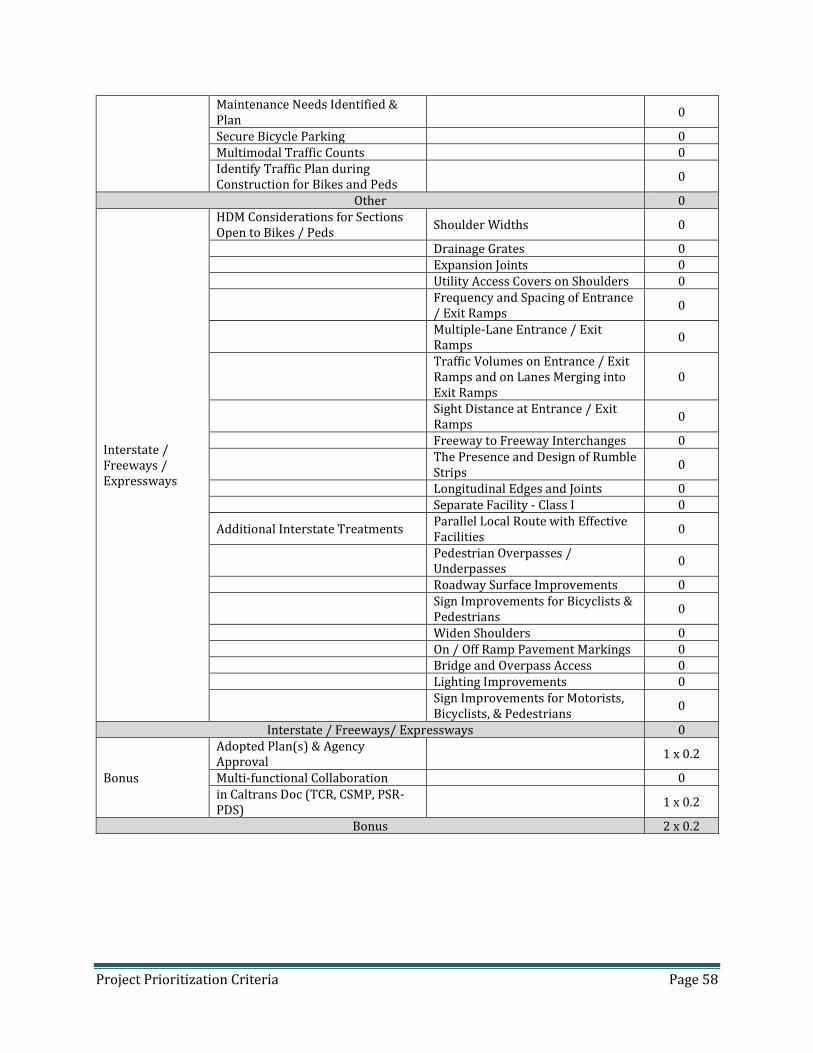
Project Prioritization Criteria Page 58
Maintenance Needs Identified & Plan
0
Secure Bicycle Parking 0 Multimodal Traffic Counts 0 Identify Traffic Plan during Construction for Bikes and Peds
0
Other 0
Interstate / Freeways / Expressways
HDM Considerations for Sections Open to Bikes / Peds
Shoulder Widths 0
Drainage Grates 0 Expansion Joints 0 Utility Access Covers on Shoulders 0
Frequency and Spacing of Entrance / Exit Ramps
0
Multiple-Lane Entrance / Exit Ramps
0
Traffic Volumes on Entrance / Exit Ramps and on Lanes Merging into Exit Ramps
0
Sight Distance at Entrance / Exit Ramps
0
Freeway to Freeway Interchanges 0
The Presence and Design of Rumble Strips
0
Longitudinal Edges and Joints 0 Separate Facility - Class I 0
Additional Interstate Treatments Parallel Local Route with Effective Facilities
0
Pedestrian Overpasses / Underpasses
0
Roadway Surface Improvements 0
Sign Improvements for Bicyclists & Pedestrians
0
Widen Shoulders 0 On / Off Ramp Pavement Markings 0 Bridge and Overpass Access 0 Lighting Improvements 0
Sign Improvements for Motorists, Bicyclists, & Pedestrians
0
Interstate / Freeways/ Expressways 0
Bonus
Adopted Plan(s) & Agency Approval
1 x 0.2
Multi-functional Collaboration 0 in Caltrans Doc (TCR, CSMP, PSR-PDS)
1 x 0.2
Bonus 2 x 0.2


