
Washington State Department of Transportation
Technical Report WA-RD 512.2
Preliminary Assessment of Infiltration Rates and Effects on Water Quality of Selected Infiltration Media for Use in Highway Runoff Retention Basins in Washington State
By Kenneth C. Ames, Emily L. Inkpen, Lonna M. Frans and William R. Bidlake

1. REPORT NO. 2. GOVERNMENT ACCESSION NO. 3. RECIPIENT'S CATALOG NO.
WA-RD 512.2
4. TITLE AND SUBTITLE 5. REPORT DATE
Preliminary Assessment of Infiltration Rates and Effects on Water September 2001Quality of Selected Infiltration Media for Use in Highway Runoff 6. PERFORMING ORGANIZATION CODE
Retention Basins in Washington State 7. AUTHOR(S) 8. PERFORMING ORGANIZATION REPORT NO.
Ames, K. C.; Inkpen, E. L.; Frans, L. M.;Bidlake, W. R. 9. PERFORMING ORGANIZATION NAME AND ADDRESS 10. WORK UNIT NO.
U. S. Geological Survey Tacoma, WA
11. CONTRACT OR GRANT NO.
GCA2878
12. SPONSORING AGENCY NAME AND ADDRESS 13. TYPE OF REPORT AND PERIOD COVERED
Washington State Department of TransportationResearch Office
Olympia, Washington 98504-7370 14. SPONSORING AGENCY CODE
15. SUPPLEMENTARY NOTES
This study was conducted in cooperation with the U.S. Department of Transportation, Federal HighwayAdministration.16. ABSTRACT
Infiltration experiments were undertaken to investigate an infiltration medium thatcould be used in retention basins to decrease the infiltration rate to between 5 and 10inches per hour and to also decrease the concentrations of some pollutants in highwayrunoff. Fourteen infiltration media formulations were tested in small-scale preliminaryinfiltration tests to estimate their infiltration rates and select candidates for furtherstudy. Subsequent cylinder infiltrometer tests were then conducted using two of themedia to gather additional infiltration rate estimates and to investigate the potentialeffects of the infiltration media on the water quality of highway runoff. A formulation of70-percent sand, 15-percent clay, and 15-percent mulch had a steady-state infiltrationrate of between 1 and 3 inches per hour. Two batches of the 90-percent sand,5-percent clay, and 5-percent mulch formulation were tested. The first batch of theformulation had a steady-state infiltration rate of between 9 and 10 inches per hourand was consistent between replicate tests. The second batch had a steady-stateinfiltration rate of approximately 36 inches per hour, and a subsequent test using thesecond batch in a second infiltrometer had a steady-state infiltration rate ofapproximately 50 inches per hour. Water-quality samples taken prior to and after infiltration of highway runoff throughthe 90-percent sand, 5-percent clay, and 5-percent mulch formulation indicate thatthere may be a decrease in the concentrations of dissolved copper, lead, zinc, andcadmium as well as total petroleum hydrocarbons and nitrate plus nitrite. Theinfiltration medium may also increase the concentrations of total and dissolved arsenic,total lead, total copper, and suspended and dissolved solids. Further testing would beneeded to establish if the changes in water quality are statistically significant.
17. KEY WORDS 18. DISTRIBUTION STATEMENT
Runoff, infiltration, retention basins No restrictions. This document is available to the public through the National Technical InformationService, Springfield, VA 22616
19. SECURITY CLASSIF. (of this report) 20. SECURITY CLASSIF. (of this page) 21. NO. OF PAGES 22. PRICE

Contents iii
CONTENTS
Abstract ................................................................................................................................................................ 1Introduction .......................................................................................................................................................... 1
Purpose and scope ....................................................................................................................................... 2Acknowledgments....................................................................................................................................... 2
Components and formulation of infiltration media.............................................................................................. 2Determination of infiltration rates........................................................................................................................ 3
Preliminary infiltration tests........................................................................................................................ 3Methods....................................................................................................................................................... 4Results ......................................................................................................................................................... 4Cylinder infiltrometer tests ......................................................................................................................... 5Methods....................................................................................................................................................... 5Results ......................................................................................................................................................... 6
Effects of the infiltration medium on water quality ............................................................................................. 7Methods....................................................................................................................................................... 7Results ......................................................................................................................................................... 8
Summary .............................................................................................................................................................. 8References ............................................................................................................................................................ 10Appendix A. ......................................................................................................................................................... 10

iv Contents

Contents v
FIGURES
Figure 1. Graph and photo showing cylinder infiltrometer apparatus............................................................. 5Figure 2. Graph showing infiltration rates as measured in the cylinder infiltrometer for medium
formulation number 12, the 70-percent sand, 15-percent clay, and 15-percent mulchmixture ............................................................................................................................................... 6
Figure 3. Graph showing infiltration rates as measured in the cylinder infiltrometer for mediumformulation number 9, the 90-percent sand, 5-percent clay, and 5-percent mulchmixture ............................................................................................................................................... 7
Figure A1a. Graph showing selected stage, volumetric water content, and temperature data forthe first cylinder infiltrometer test conducted on a medium formulation of 70-percentsand, 15-percent clay, and 15-percent mulch..................................................................................... 11
Figure A1b. Graph showing selected stage, volumetric water content, and temperature data forthe second cylinder infiltrometer test conducted on a medium formulation of 70-percent sand, 15-percent clay, and 15-percent mulch .................................................................. 12
Figure A1c. Graph showing selected stage, volumetric water content, and temperature data forthe third cylinder infiltrometer test conducted on a medium formulation of 70-percent sand, 15-percent clay, and 15-percent mulch .................................................................. 13
Figure A2a. Graph showing selected stage, volumetric water content, and temperature data for thefirst cylinder infiltrometer test conducted on the first medium formulation batch of90-percent sand, 5-percent clay, and 5-percent mulch ...................................................................... 14
Figure A2b. Graph showing selected stage, volumetric water content, and temperature data for thesecond cylinder infiltrometer test conducted on the first medium formulation batchof 90-percent sand, 5-percent clay, and 5-percent mulch .................................................................. 15
Figure A3a. Graph showing stage, volumetric water content, and temperature data for thefirst cylinder infiltrometer test on the second medium formulation batch of90-percent sand, 5-percent clay, and 5-percent mulch ...................................................................... 16
Figure A3b. Graph showing stage, volumetric water content, and temperature data for thesecond cylinder infiltrometer test on the second medium formulation batch of90-percent sand, 5-percent clay, and 5-percent mulch ...................................................................... 17

vi Contents

Contents vii
Table 1. Composition and infiltration characteristics of infiltration media during preliminary tests.............. 3Table 2. Infiltration rates from replicate tests for selected infiltration media.................................................. 4Table 3. Concentrations of compounds in highway runoff prior to and after infiltration through the
second batch of medium formulation number 9: 90-percent sand, 5-percent clay, and5-percent mulch ................................................................................................................................. 9
Any use of trade, product, or firm names in this publication is for descriptive purposes only and does not imply endorsement by the U.S. Government.

viii Contents

1
Preliminary Assessment of Infiltration Rates and Effects on Water Quality of Selected Infiltration Media for Use in Highway Runoff Retention Basins in Washington State
By Kenneth C. Ames, Emily L. Inkpen, Lonna M. Frans, and William R. Bidlake
ABSTRACT
Infiltration experiments were undertaken to investigate an infiltration medium that could be used in retention basins to decrease the infiltration rate to between 5 and 10 inches per hour and to also decrease the concentrations of some pollutants in highway runoff. Fourteen infiltration media formulations were tested in small-scale preliminary infiltration tests to estimate their infiltration rates and select candidates for further study. Subsequent cylinder infiltrometer tests were then conducted using two of the media to gather additional infiltration rate estimates and to investigate the potential effects of the infiltration media on the water quality of highway runoff. A formulation of 70-percent sand, 15-percent clay, and 15-percent mulch had a steady-state infiltration rate of between 1 and 3 inches per hour. Two batches of the 90-percent sand, 5-percent clay, and 5-percent mulch formulation were tested. The first batch of the formulation had a steady-state infiltration rate of between 9 and 10 inches per hour and was consistent between replicate tests. The second batch had a steady-state infiltration rate of approximately 36 inches per hour, and a subsequent test using the second batch in a second infiltrometer had a steady-state infiltration rate of approximately 50 inches per hour.
Water-quality samples taken prior to and after infiltration of highway runoff through the 90-percent sand, 5-percent clay, and 5-percent mulch formulation indicate that there may be a decrease in the concentrations of dissolved copper, lead, zinc, and cadmium as well as total petroleum hydrocarbons and nitrate plus nitrite. The infiltration medium may also increase the
concentrations of total and dissolved arsenic, total lead, total copper, and suspended and dissolved solids. Further testing would be needed to establish if the changes in water quality are statistically significant.
INTRODUCTION
Runoff of water from highways in Washington is sometimes directed into retention basins that store the water while it infiltrates into the ground. The desired result of these retention basins is to redirect storm water back into the ground-water system without adversely affecting the ground-water quality. Current State regulations require that a retention basin have an infiltration rate of between one-half and 2 and one-half inches per hour (in/hr) (Washington State Department of Transportation, 1999). The rate of infiltration is important because if the rate is too slow, the retention pond may overflow and cause property damage and threaten public safety, and if the infiltration rate is too fast, water-quality treatment and spill containment are compromised (Washington State Department of Transportation, 1999). In regions with native soils that exceed the required infiltration rate, an infiltration medium must be placed in the retention basin to slow the infiltration rate.
Experiments were undertaken by the U.S. Geological Survey in cooperation with the Washington State Department of Transportation (WSDOT) to develop an infiltration medium that could be placed in retention basins to slow the infiltration rate. Because the WSDOT believes that the infiltration media will eventually clog up with sediment in field applications resulting in a slowing of the infiltration rate, they set an experimental steady-state infiltration rate of between 5 and 10 in/hr as the goal (Jim Schafer, WSDOT, oral commun., 2000).

2
The experiments involved developing various formulations of sand, clay, and mulch and then testing them for their infiltration rates in a preliminary fashion. Further infiltration tests were then conducted on the infiltration media that came closest to the target infiltration rate in the preliminary tests. Water-quality tests were then conducted using highway runoff on the infiltration medium with the best infiltration rate.
A cylinder infiltrometer was used to measure the infiltration rates of the infiltration media (Bouwer, 1986). Cylinder infiltrometers are typically used in-situ to measure the infiltration rates of soils in flooded areas, including retention basins for ground-water recharge (Bouwer, 1986). A metal cylinder is usually pounded into the soil, the cylinder is flooded, and the rate at which the water seeps into the ground is measured. However, because the infiltration media in this study are engineered rather than native soils, the experiments were conducted above-ground. Conducting the tests above ground has the additional benefit of eliminating one of the major errors associated with cylinder infiltrometer tests, the lateral divergence of flow below the base of the cylinder infiltrometer.
Purpose and Scope
The purpose of this report is to summarize the results of preliminary and cylinder infiltrometer tests of various infiltration media which are intended to retard infiltration rates of highway runoff in retention ponds and to assess any effects that the infiltration media may have on water quality. This report describes the components of the various media formulations that were constructed, the results of the initial screening process to select media for further study, the measurement of the infiltration rates of the select
media using a cylinder infiltrometer, and the effects of the medium with the best infiltration rate on the water quality of highway runoff.
Acknowledgments
The authors would like to thank Mutual Materials, Miles Sand & Gravel, and H&B Fuel for donating the materials for the preliminary infiltration tests.
COMPONENTS AND FORMULATION OF INFILTRATION MEDIA
Four types of materials were selected to be combined into 14 different infiltration media: coarse- and fine-grained sand, clay, and organic material (mulch). Materials were selected specifically for their availability in Washington State at a reasonable cost. Sand for filtering of the storm water was procured from both a local gravel company and a home improvement store. The clay and the mulch were incorporated into the sand to reduce the infiltration rate. The selected clay was iron-rich and powdered, and the selected organic material was alder wood mulch up to three-fourth inches in size.
Fourteen different formulations of sand, clay, and mulch were used to determine the best combination of these constituents to allow for the infiltration of water at the desired rate (table 1). Two of the formulations were multi-layered and the other twelve were not. For the multi-layered infiltration media, the top and bottom layers consisted of mixtures of fine sand and clay with a middle layer of fine sand and mulch sandwiched in between.

3
DETERMINATION OF INFILTRATION RATES
Preliminary infiltration tests were conducted on the fourteen media formulations to narrow down the number of choices to those that were closest to the targeted infiltration rate. Upon completion of the preliminary infiltration tests, cylinder infiltrometer tests (Bouwer, 1986) were conducted on the best candidates to gather additional infiltration-rate estimates in a larger-scale experiment.
Preliminary Infiltration Tests
As a first step in selecting media formulations for detailed study, fourteen formulations of sand, clay and mulch were tested on a small-scale to get a preliminary estimate of the infiltration rates and to identify likely candidates for further study. These tests were not designed to describe the hydraulic properties of any given medium formulation, and were used solely as a screening tool to narrow the choices of infiltration media down to those that appeared to be closest to the target infiltration rate. Because these tests were to be used only as a screening tool and not to meet any type of rigorous scientific standards, no currently established methodology was followed.
Table 1. Composition and infiltration characteristics of infiltration media duringpreliminary tests
[HH, hours; MM, minutes; SS, seconds]
Composition(percentage of weight)
Infiltration rate(inches per hour)
Time(HH:MM:SS)
Mediumnumber
Coarsesand
Finesand
Clay MulchDry
MediaWet
MediaDry
MediaWet
Media
Single-Layer Media
1 50 50 0 0 179 81 00:04:01 00:08:53
2 30 70 0 0 120 65 00:06:01 00:11:03
3 30 60 0 10 156 80 00:04:37 00:08:58
4 20 70 0 10 111 50 00:07:56 00:17:27
5 10 80 0 10 133 76 00:05:25 00:09:30
6 10 70 0 20 91 41 00:06:30 00:14:29
7 10 60 0 30 138 65 00:05:14 00:11:04
8 10 70 5 15 82 37 00:08:45 00:19:45
9 0 90 5 5 39 25 00:18:18 00:28:36
10 0 80 5 15 40 19 00:18:04 00:38:49
11 0 80 10 10 37 13 00:19:25 00:55:32
12 0 70 15 15 10 7 01:12:29 01:43:51
Multi-Layer Media1
13 0 90/80/90 10/0/10 0/20/0 30 17 00:24:06 00:41:49
14 0 90/60/90 10/0/10 0/40/0 7 3 01:46:35 03:33:231Multi-layered media consist of 3 different layers.
4
Methods
An infiltration rate was determined for both dry and wet media. For the dry-media infiltration rate, the clay, sands and organic material were each separately wrapped in foil and oven-baked at 105οC for 24 hours prior to the infiltration experiment. The three constituents were then mixed together in a bucket. A mass of 2,180 grams of the mixture was then poured into a tube. A consistent mass was used for each run so that the only variance was the percent mass of each constituent. The tubes used in the experiments were either a 2-inch diameter poly-vinyl-chloride (PVC) pipe with a ruler to measure the change in water levels or a 2-inch-diameter acrylic tube with measurement intervals marked on the side. A screen was attached to the bottom of each tube to support the medium and to allow for the flow of water out of the apparatus. For each run, 615 milliliters of water (equivalent to 12 inches of standing water) was poured into the tube and allowed to pass through the mixed, baked material and the amount of time required for the water to completely infiltrate each medium was measured. Once all of the water had infiltrated each medium, an additional 615 milliliters of water was added to the tube to determine the wet infiltration rate. The infiltration rates were calculated by dividing the initial head of 12 inches by the amount of time required for all of the water to infiltrate each medium.
Results
The infiltration rates of all fourteen dry media were faster than the corresponding wet media; dry media ranged from 7 to 179 in/hr and wet media ranged from 3 to 81 in/hr (table 1). Because wet conditions are more prevalent in field situations, the infiltration rates of the wet media were used in selecting media formulations for further study.
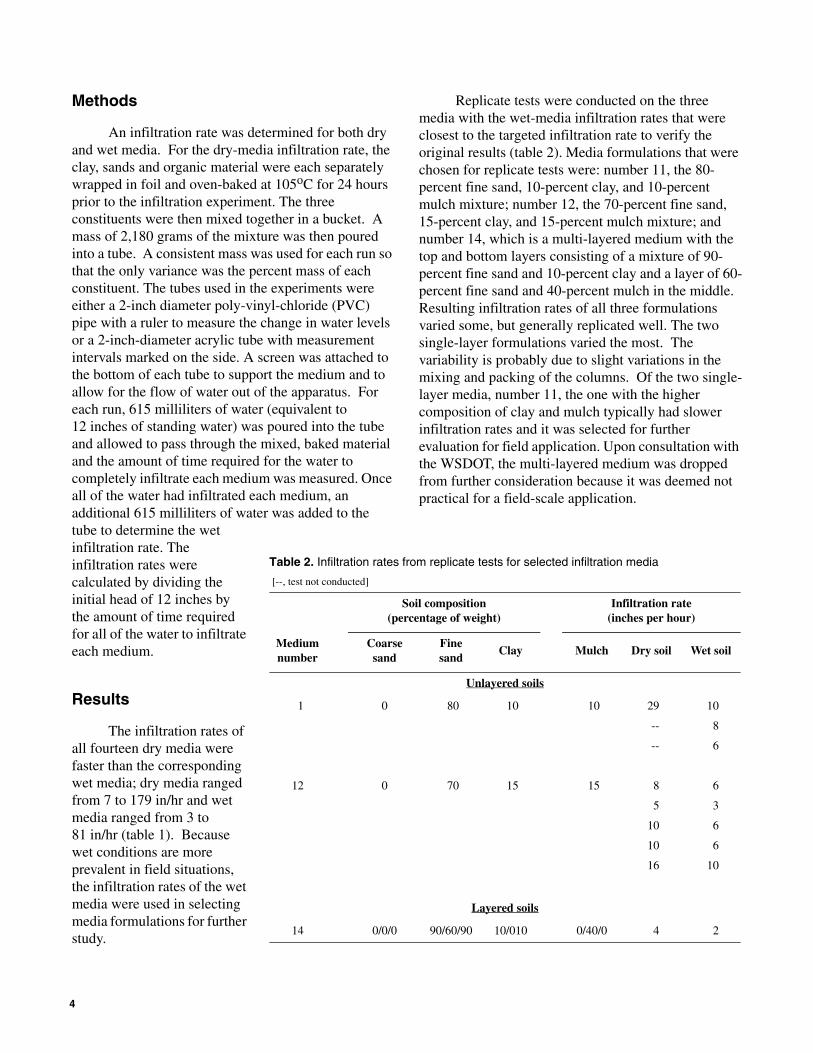
Replicate tests were conducted on the three media with the wet-media infiltration rates that were closest to the targeted infiltration rate to verify the original results (table 2). Media formulations that were chosen for replicate tests were: number 11, the 80-percent fine sand, 10-percent clay, and 10-percent mulch mixture; number 12, the 70-percent fine sand, 15-percent clay, and 15-percent mulch mixture; and number 14, which is a multi-layered medium with the top and bottom layers consisting of a mixture of 90-percent fine sand and 10-percent clay and a layer of 60-percent fine sand and 40-percent mulch in the middle. Resulting infiltration rates of all three formulations varied some, but generally replicated well. The two single-layer formulations varied the most. The variability is probably due to slight variations in the mixing and packing of the columns. Of the two single-layer media, number 11, the one with the higher composition of clay and mulch typically had slower infiltration rates and it was selected for further evaluation for field application. Upon consultation with the WSDOT, the multi-layered medium was dropped from further consideration because it was deemed not practical for a field-scale application.
Table 2. Infiltration rates from replicate tests for selected infiltration media
[--, test not conducted]
Soil composition(percentage of weight)
Infiltration rate(inches per hour)
Mediumnumber
Coarsesand
Finesand
Clay Mulch Dry soil Wet soil
Unlayered soils
1 0 80 10 10 29 10
-- 8
-- 6
12 0 70 15 15 8 6
5 3
10 6
10 6
16 10
Layered soils
14 0/0/0 90/60/90 10/010 0/40/0 4 2

5
~18 inchesinfiltrationmedium
~12 incheswater
Figure 1. Cylinder infiltrometer apparatus (not to scale).
24-inch-diameterABS pipe
Drain holesSolid bottomcap
~6 inchespea
gravel
Cylinder Infiltrometer Tests
Upon completion of the preliminary infiltration tests, cylinder infiltrometer tests (Bouwer, 1986) were conducted on the best candidates to gather additional infiltration-rate estimates in a larger-scale experiment and to investigate the effect of the infiltration media on the water quality of highway runoff.
Methods
The cylinder infiltrometer tests were conducted in 24-inch-diameter acrylonitrile-butadiene-styrene (ABS) pipe. The pipe was selected for the test to ensure that the measured infiltration rate was one-
dimensional and that there was no horizontal flow, which could occur in a field test where the medium in the infiltration basin has a much lower infiltration rate than the native material or where the basin has slanted sides.
The design of the infiltrometer for above-ground tests is shown on figure 1. A cap was placed over the bottom of the pipe and drain holes were drilled around the bottom edge of the pipe. Several inches of pea gravel were placed in the bottom of the pipe to allow for the free flow of water through the medium and to assure that none of the medium fell through the drain holes. The infiltration medium constituents were mixed together in a small cement mixer and placed into the pipe to a thickness of approximately 18 inches.

6
0
1
2
3
4
5
6
7
8
0 2 4 6 8 10 12
HOURS SINCE START OF TEST
INF
ILT
RAT
ION
RAT
E, I
N IN
CH
ES
PE
R H
OU
R
Figure 2. Infiltration rates as measured in the cylinder infiltrometerfor medium formulation number 12, the 70-percent sand,15-percent clay, and 15-percent mulch mixture.
First testSecond testThird test
The 24-inch-diameter pipe was fitted with a pressure transducer (Druck PTX1230) to measure the changes in the height of the water column in the pipe so that the infiltration rate could be calculated, water-content reflectometers (Campbell Scientific CS615) to verify that the medium was becoming saturated, and temperature probes (Campbell Scientific 107B) to verify that the temperature of both the medium and water was similar, to avoid dissolving soil air in the infiltrating water, which would alter the infiltration rate (Bouwer, 1986). A data logger (Campbell Scientific 21X) was used to record all measurements over the course of the experiment.
Deionized water was poured into the infiltrometer to a depth of approximately 13.25 inches of water. More water was added to the infiltrometer, to a depth of approximately 13.25 inches, whenever the water level fell to approximately 10.75 inches so that an approximate average of 12 inches of water was maintained in the infiltrometer throughout the experiment. The time required for the water level to drop from 13.25 to 10.75 inches was monitored so that the infiltration rate could be calculated on the basis of the change in water level over time as recorded by the pressure transducer.
All instrumentation in the infiltrometer was continuously monitored throughout the experiment until the infiltration rate reached approximately steady state. All data collected during the cylinder infiltrometer tests are reported in Appendix A at the end of the report. The water content and temperature data were not required in order to calculate the infiltration rate, but were included in the experiment to verify that the experimental apparatus was working correctly without any unforeseen problems. No problems were detected with the experiment based on the water content and temperature data.
Results
Based on the results of the preliminary infiltration tests, the infiltration medium first tested in the cylinder infiltrometer test was formulation number 12, a mixture of 70-percent sand, 15-percent clay, and 15-percent mulch. The tests took place in June and July 2000. The medium was tested three times, and the steady-state infiltration rate typically ranged between 1 and 3 in/hr (fig. 2). This mixture did not meet the targeted infiltration rate of 5 to 10 in/hr, so a second medium formulation was selected for additional assessment.
7
0
10
20
30
40
50
60
70
80
2 4 6 8
HOURS SINCE START OF TEST
INF
ILT
RA
TIO
N R
AT
E, I
N IN
CH
ES
PE
R H
OU
R
Batch 1 Test 1
Batch 1 Test 2
Batch 2 Test 1
Batch 2 Test 2
0
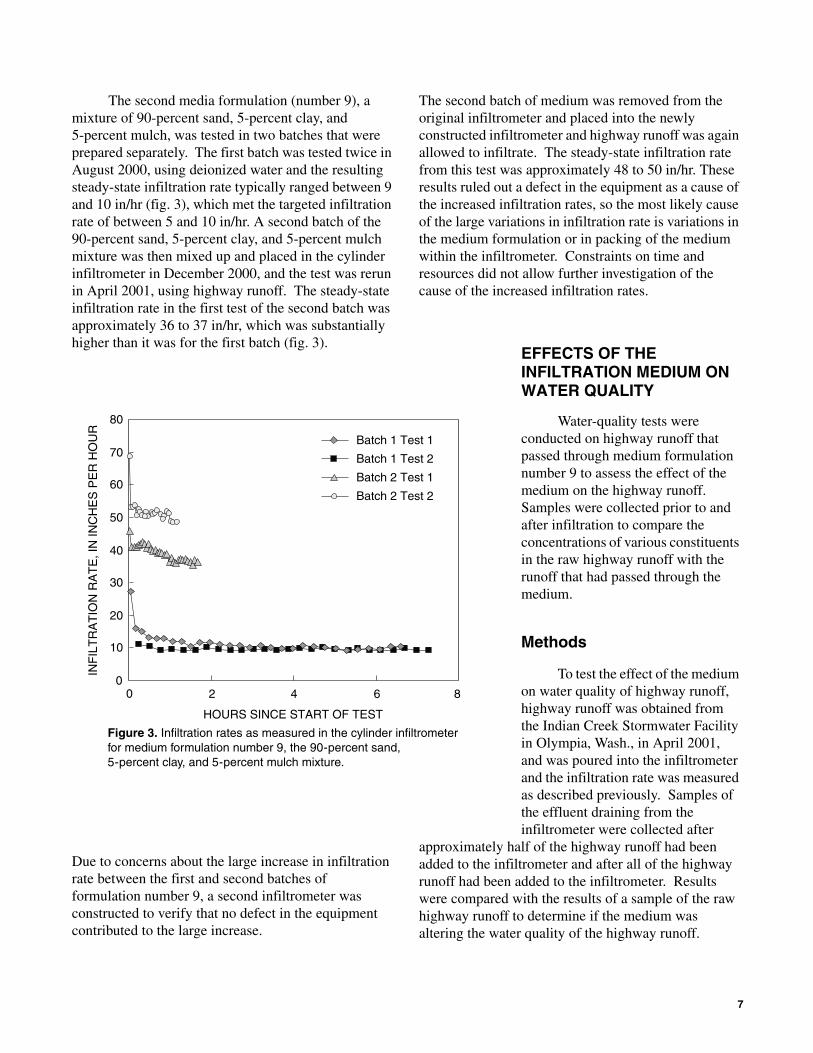
Figure 3. Infiltration rates as measured in the cylinder infiltrometerfor medium formulation number 9, the 90-percent sand,5-percent clay, and 5-percent mulch mixture.
The second media formulation (number 9), a mixture of 90-percent sand, 5-percent clay, and 5-percent mulch, was tested in two batches that were prepared separately. The first batch was tested twice in August 2000, using deionized water and the resulting steady-state infiltration rate typically ranged between 9 and 10 in/hr (fig. 3), which met the targeted infiltration rate of between 5 and 10 in/hr. A second batch of the 90-percent sand, 5-percent clay, and 5-percent mulch mixture was then mixed up and placed in the cylinder infiltrometer in December 2000, and the test was rerun in April 2001, using highway runoff. The steady-state infiltration rate in the first test of the second batch was approximately 36 to 37 in/hr, which was substantially higher than it was for the first batch (fig. 3).
Due to concerns about the large increase in infiltration rate between the first and second batches of formulation number 9, a second infiltrometer was constructed to verify that no defect in the equipment contributed to the large increase.
The second batch of medium was removed from the original infiltrometer and placed into the newly constructed infiltrometer and highway runoff was again allowed to infiltrate. The steady-state infiltration rate from this test was approximately 48 to 50 in/hr. These results ruled out a defect in the equipment as a cause of the increased infiltration rates, so the most likely cause of the large variations in infiltration rate is variations in the medium formulation or in packing of the medium within the infiltrometer. Constraints on time and resources did not allow further investigation of the cause of the increased infiltration rates.
EFFECTS OF THE INFILTRATION MEDIUM ON WATER QUALITY
Water-quality tests were conducted on highway runoff that passed through medium formulation number 9 to assess the effect of the medium on the highway runoff. Samples were collected prior to and after infiltration to compare the concentrations of various constituents in the raw highway runoff with the runoff that had passed through the medium.
Methods
To test the effect of the medium on water quality of highway runoff, highway runoff was obtained from the Indian Creek Stormwater Facility in Olympia, Wash., in April 2001, and was poured into the infiltrometer and the infiltration rate was measured as described previously. Samples of the effluent draining from the infiltrometer were collected after
approximately half of the highway runoff had been added to the infiltrometer and after all of the highway runoff had been added to the infiltrometer. Results were compared with the results of a sample of the raw highway runoff to determine if the medium was altering the water quality of the highway runoff.

8
The samples were shipped on ice to the U.S. Geological Survey’s National Water Quality Laboratory in Denver, Colo., where they were analyzed for total and dissolved metals (arsenic, copper, cadmium, lead, and zinc), major ions (calcium, magnesium, potassium, sodium, chloride, fluoride, silica, and sulfate), nitrate plus nitrite, total petroleum hydrocarbons (TPH), and suspended solids. Methods used to analyze the samples are presented in Faires (1993), Fishman (1993), Fishman and Freidman (1989), and Garbarino and Struzeski (1998), and by Ronald Brenton (written commun., 1996).
Results
The concentrations of several key pollutants including dissolved concentrations of copper, lead, zinc, cadmium and TPH appeared to decline after passing through the second batch of formulation number 9, the 90-percent sand, 5-percent clay, and 5-percent mulch media formulation (table 3). By the end of the experiment, the dissolved zinc concentration declined approximately 90 percent, the dissolved cadmium concentration approximately 80 percent, the dissolved copper concentration approximately 33 percent, the dissolved lead concentration approximately 85 percent, and TPH at least 50 percent. There were also slight declines in the concentrations of nitrate plus nitrite and total cadmium. On the other hand, concentrations of total and dissolved arsenic, total lead, total copper, and suspended and dissolved solids appeared to increase. Some of these increases could possibly be caused by the leaching of clay particles from the medium as a large amount of clay particles were noted in the effluent, but further research would be needed to determine if that was the cause.There was generally little change in the concentrations of the major ions with the exception of manganese, which declined more than 80 percent, and
iron which increased in the sample taken halfway through the experiment, then greatly decreased in concentration by the end of the experiment. The changes in concentrations shown in this study are based on only one test and further testing would be needed to establish if the changes in water quality are statistically significant. These results should not be extrapolated for use with other starting concentrations.
SUMMARY
Infiltration experiments were undertaken to identify an infiltration medium that could be used in retention basins to decrease the infiltration rate to between 5 and 10 inches per hour (in/hr). Fourteen infiltration media were tested in preliminary infiltration tests to estimate their infiltration rates and select candidates for further study. Cylinder infiltrometer tests were conducted on two media to estimate their infiltration rates at a larger scale. The formulation of 70-percent sand, 15-percent clay, and 15-percent mulch had a steady-state infiltration rate of between 1 and 3 in/hr and the mixture of 90-percent sand, 5-percent clay, and 5-percent mulch had a steady-state infiltration rate of between 9 and 10 in/hr in the first batch and between 36 and 50 in/hr in the second batch. Water-quality samples were taken prior to and after infiltration of highway runoff through the 90-percent sand, 5-percent clay, and 5-percent mulch formulation to evaluate the effect of the infiltration medium on water quality. Declines in concentration were found for dissolved copper, lead, zinc, and cadmium as well as total petroleum hydrocarbons and nitrate plus nitrite in the effluent highway runoff after passing through the infiltration medium. However, increases were found in the concentrations of total and dissolved arsenic, total lead, total copper, and suspended and dissolved solids.

9
the
Table 3. Concentrations of compounds in highway runoff prior to and after infiltration throughthe second batch of medium formulation number 9: 90-percent sand, 5-percent clay, and 5-percent mulch
[mg/L, milligrams per liter; µg/L, micrograms per liter; <, less than; >, greater than; e, estimated value; --, not computed]
Effluent after infiltration
AnalyteInfluent prior to infiltration
Halfway through
experiment
End of experi-ment
Percent change1
Calcium, dissolved (mg/L) 6.3 5.2 5.1 -19
Magnesium, dissolved (mg/L) 1.2 1.9 1.8 50
Potassium, dissolved (mg/L) 1.2 1.6 1.6 33
Sodium, dissolved (mg/L) 3.2 3.5 3.4 6
Chloride, dissolved (mg/L) 2.8 3.0 3.0 7
Fluoride, dissolved (mg/L) <0.2 e0.1 e0.1 --
Silica, dissolved (mg/L) 7.6 8.3 7.9 4
Sulfate, dissolved (mg/L) 11 11 11 0
Nitrate + nitrite (mg/L) 0.83 0.83 0.80 -4
Suspended solids (mg/L) 13 42 65 400
Dissolved solids (mg/L) 48 55 52 8
Arsenic, dissolved (µg/L) 0.3 0.5 0.7 133
Arsenic, total (µg/L) <2 e2 e1 --
Cadmium, dissolved (µg/L) 0.1 e0.02 e0.02 e-80
Cadmium, total (µg/L) 0.28 0.17 0.16 -43
Copper, dissolved (µg/L) 6 4 4 -33
Copper, total (µg/L) 10.5 16.9 12.9 23
Iron, dissolved (µg/L) 48 79 19 -60
Lead, dissolved (µg/L) 0.4 0.09 e0.06 e-85
Lead, total (µg/L) 2.8 8.1 6.4 129
Manganese, dissolved (µg/L) 17 e2 <3 >-82
Zinc, dissolved (µg/L) 20 2 2 -90
Zinc, total (µg/L) 55.3 54.0 54.7 -1
Total petroleum hydrocarbons (mg/L)
4 <2 <2 >-50
Calcium, dissolved (mg/L) 6.3 5.2 5.1 -19
Magnesium, dissolved (mg/L) 1.2 1.9 1.8 50
Potassium, dissolved (mg/L) 1.2 1.6 1.6 33
Sodium, dissolved (mg/L) 3.2 3.5 3.4 61Percent change was calculated using the prior-to-infiltration and end-of-experiment values

10
REFERENCES
Bouwer, H., 1986, Intake rate: cylinder infiltrometer, in Klute, A., ed., Methods of soil analysis: Part 1 Physical and mineralogical methods (2d ed.): Madison, WI., American Society of Agronomy and Soil Science Society of America, p. 825-844.
Campbell Scientific, Inc., 1996, CS615 Water content reflectometer instruction manual, version 8221-07, 12 p.
Faires, L.M., 1993, Methods of analysis by the U.S. Geological Survey National Water Quality Laboratory–Determination of metals in water by inductively coupled plasma-mass spectrometry: U.S. Geological Survey Open-File Report 92-634, 28 p.
Fishman, M.J., 1993, Methods of analysis by the U.S. Geological Survey National Water Quality Laboratory–Determination of inorganic and organic constituents in water and fluvial sediments: U.S. Geological Survey Open-File Report 93-125, 217 p.
Fishman, M.J., and Friedman, L.C., 1989, Methods for determination of inorganic substances in water and fluvial sediments: U.S. Geological Survey Techniques of Water-Resources Investigations, book 5, chap. A1, 545 p.
Garbarino, J.R., and Struzeski, T.M., 1998, Methods of analysis by the U.S. Geological Survey National Water Quality Laboratory -- Determination of elements in whole-water digests using inductively coupled plasma-optical emission spectrometry and inductively coupled plasma-mass spectrometry: U.S. Geological Survey Open-File Report 98-165, 101 p.
Washington State Department of Transportation, 1999, Guidance on infiltration design rates, 3 p.
APPENDIX A
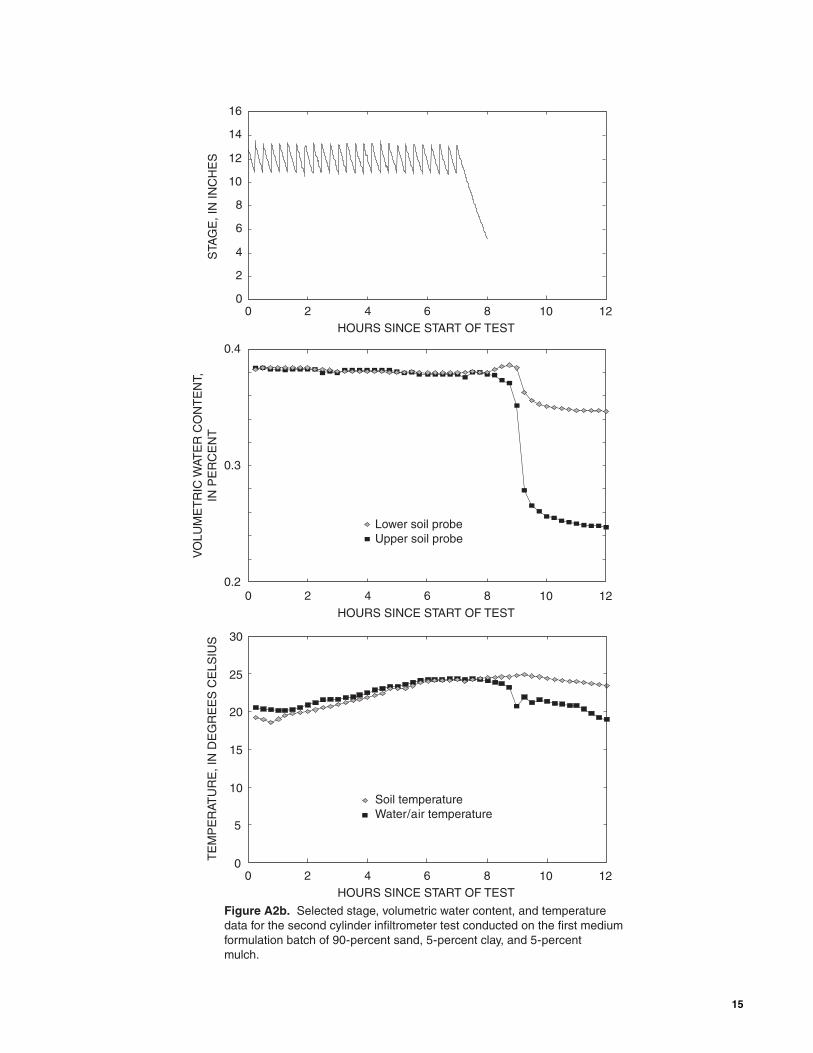
Data collected during the above-ground cylinder infiltrometer tests included the stage, volumetric water content of both the upper and lower portions of the soil column, and the temperature of the soil and water/air (figs. A1-A7). In the tests of the 70-percent sand, 15-percent clay, and 15-percent mulch mixture, the volumetric water content of the upper 12 inches of the soil column was not collected during the first two tests and was only gathered in the third test after additional water was no longer being added to the apparatus. The calculations of volumetric water contents were based on the standard calibration curve for soils with low electrical conductivity (Campbell Scientific, Inc., 1996).

11
0
2
4
6
8
10
12
14
16
0 2 4 6 8 10 12 14 16 18
0 2 4 6 8 10 12 14 16 18
HOURS SINCE START OF TEST
STA
GE
, IN
INC
HE
SV
OLU
ME
TR
IC W
ATE
R C
ON
TE
NT,
IN P
ER
CE
NT
0
0.1
0.2
0.3
0.4
0.5
HOURS SINCE START OF TEST
Figure A1a. Selected stage, volumetric water content,and temperature data for the first cylinder infiltrometertest conducted on a medium formulation of 70-percentsand, 15-percent clay, and 15-percent mulch.
TE
MP
ER
ATU
RE
, IN
DE
GR
EE
S C
ELS
IUS
0
5
10
15
20
25
30
0 2 4 6 8 10 12 14 16 18
HOURS SINCE START OF TEST
Lower soil probe
Soil temperatureWater/air temperature

12
0
0.1
0.2
0.3
0.4
0
2
4
6
8
10
12
14
16
STA
GE
, IN
INC
HE
S
Figure A1b. Selected stage, volumetric water content, and temperaturedata for the second cylinder infiltrometer test conducted on a mediumformulation of 70-percent sand, 15-percent clay, and 15-percent mulch.
0
5
10
15
20
25
30
35
0 2 4 6 8 10 12 14 16 18
HOURS SINCE START OF TEST
0 2 4 6 8 10 12 14 16 18
HOURS SINCE START OF TEST
0 2 4 6 8 10 12 14 16 18
HOURS SINCE START OF TEST
VO
LUM
ET
RIC
WAT
ER
CO
NT
EN
T,IN
PE
RC
EN
TT
EM
PE
RAT
UR
E, I
N D
EG
RE
ES
CE
LSIU
S
Lower soil probe
Soil temperatureWater/air temperature

13
0.3
0.4
0.5
0 2 4 6 8 10 12 14 16 18HOURS SINCE START OF TEST
0 2 4 6 8 10 12 14 16 18HOURS SINCE START OF TEST
0 2 4 6 8 10 12 14 16 18HOURS SINCE START OF TEST
0
2
4
6
8
10
12
14
16
0
5
10
15
20
25
30
TE
MP
ER
ATU
RE
, IN
DE
GR
EE
S C
ELS
IUS
STA
GE
, IN
INC
HE
SV
OLU
ME
TR
IC W
ATE
R C
ON
TE
NT,
IN P
ER
CE
NT
Figure A1c. Selected stage, volumetric water content, and temperaturedata for the third cylinder infiltrometer test conducted on a medium form-ulation of 70-percent sand, 15-percent clay, and 15-percent mulch.
Lower soil probeUpper soil probe
Soil temperatureWater/air temperature

14
0
5
10
15
20
25
30
35
0
2
4
6
8
10
12
14
16
0 2 4 6 8
0
0.1
0.2
0.3
0.4
10 12
0 2 4 6 8 10 12
0 2 4 6 8 10 12
HOURS SINCE START OF TEST
HOURS SINCE START OF TEST
HOURS SINCE START OF TEST
STA
GE
, IN
INC
HE
SV
OLU
ME
TR
IC W
ATE
R C
ON
TE
NT,
IN P
ER
CE
NT
TE
MP
ER
ATU
RE
, IN
DE
GR
EE
S C
ELS
IUS
Figure A2a . Selected stage, volumetric water content, and temperaturedata for the first cylinder infiltrometer test conducted on the first mediumformulation batch of 90-percent sand, 5-percent clay, and 5-percent mulch.
Soil temperature
Upper soil probeLower soil probe
Water/air temperature
15
Figure A2b. Selected stage, volumetric water content, and temperaturedata for the second cylinder infiltrometer test conducted on the first mediumformulation batch of 90-percent sand, 5-percent clay, and 5-percentmulch.
0
5
10
15
20
25
30
0.2
0.3
0.4
HOURS SINCE START OF TEST
HOURS SINCE START OF TEST
HOURS SINCE START OF TEST
TE
MP
ER
ATU
RE
, IN
DE
GR
EE
S C
ELS
IUS
Lower soil probeUpper soil probe
Soil temperatureWater/air temperature
0
2
4
6
8
10
12
14
16
0 2 4 6 8
STA
GE
, IN
INC
HE
SV
OLU
ME
TR
IC W
ATE
R C
ON
TE
NT,
IN P
ER
CE
NT
10 12
0 2 4 6 8 10 12
0 2 4 6 8 10 12

16
0
2
4
6
8
10
12
14
0 1 2 3 4
0 1 2 3 4
0 1 2 3 4
HOURS SINCE START OF TEST
ST
AG
E, I
N IN
CH
ES
0
0.1
0.2
0.3
0.4
0.5
0.6
HOURS SINCE START OF TEST
VO
LUM
ET
RIC
WA
TE
R C
ON
TE
NT
,IN
PE
RC
EN
T
Lower soil probe
Upper soil probe
0
2
4
6
8
10
HOURS SINCE START OF TEST
TE
MP
ER
AT
UR
E, I
N D
EG
RE
ES
CE
LCIU
S
Soil temperature
Air/water temperature
Figure A3a. Stage, volumetric water content, and temperature data forthe first cylinder infiltrometer test on the second medium formulationbatch of 90-percent sand, 5-percent clay, and 5-percent mulch.

17
0
2
4
6
8
10
12
14
16
0 1 2 3
0 1 2 3
0 1 2 3
HOURS SINCE START OF TEST
HOURS SINCE START OF TEST
HOURS SINCE START OF TEST
ST
AG
E, I
N IN
CH
ES
0
0.1
0.2
0.3
0.4
0.5
0.6
VO
LUM
ET
RIC
WA
TE
R C
ON
TE
NT
,IN
PE
RC
EN
T
Lower soil probe
Upper soil probe
0
2
4
6
8
10
12
TE
MP
ER
AT
UR
E, I
N D
EG
RE
ES
CE
LSIU
S
Soil temperature
Water/air temperture
Figure A3b. Stage, volumetric water content, and temperature data forthe second cylinder infiltrometer test on the second medium formulationbatch of 90-percent sand, 5-percent clay, and 5-percent mulch.


