
Perpetual Pavement Asphalt Concrete on WAY-30 Test Road and APLF
Perpetual Pavement Asphalt Concrete on WAY-30 Test Road and APLF
Roger GreenOffice of Pavement EngineeringOhio Dept. of Transportation
Shad SargandDepartment of Civil EngineeringOhio University
Ohio Asphalt Paving ConferenceFebruary 4, 2009
2Ohio University - Department of Civil Engineering
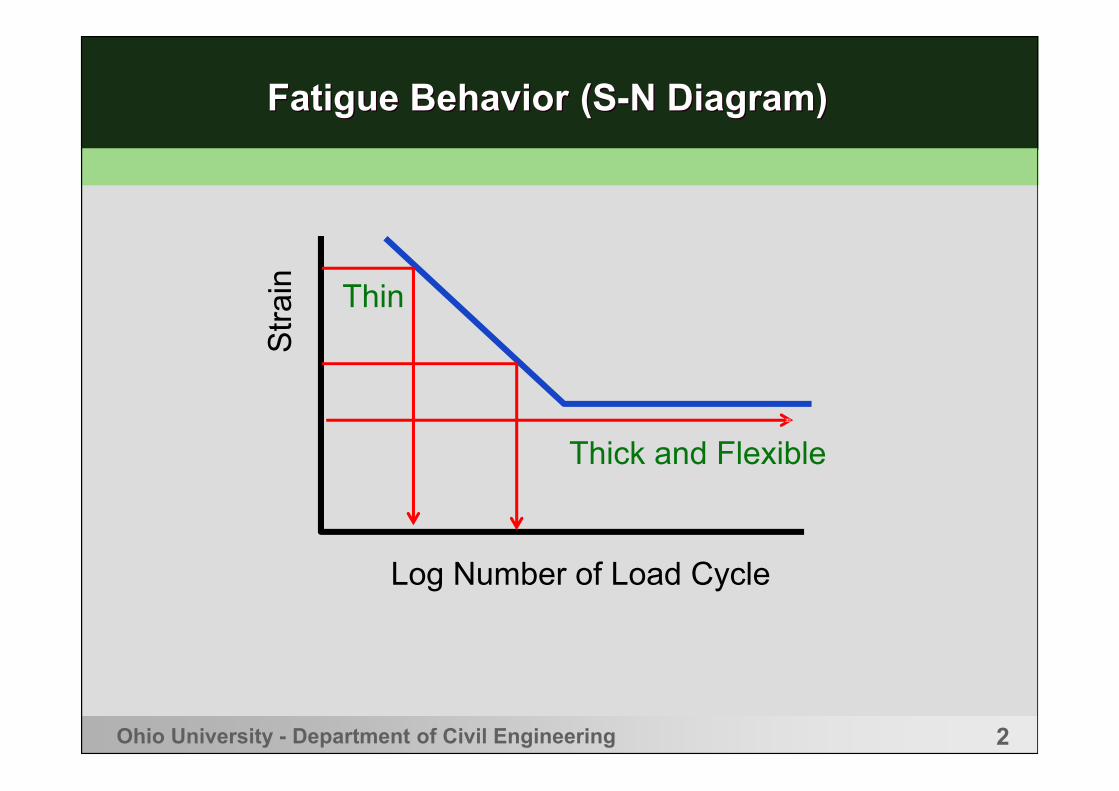
Fatigue Behavior (S-N Diagram)Fatigue Behavior (S-N Diagram)
Log Number of Load Cycle
Str
ain
Thin
Thick and Flexible
3Ohio University - Department of Civil Engineering
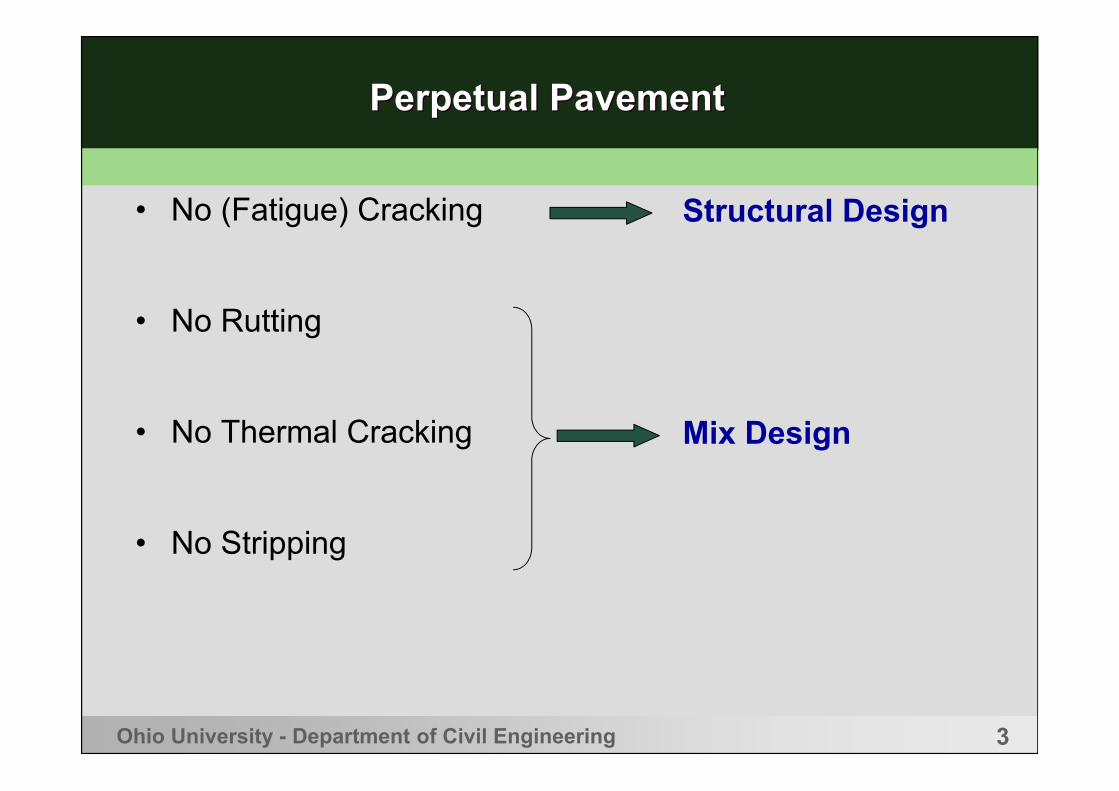
Perpetual Pavement Perpetual Pavement
• No (Fatigue) Cracking
• No Rutting
• No Thermal Cracking
• No Stripping
Structural Design
Mix Design
4Ohio University - Department of Civil Engineering
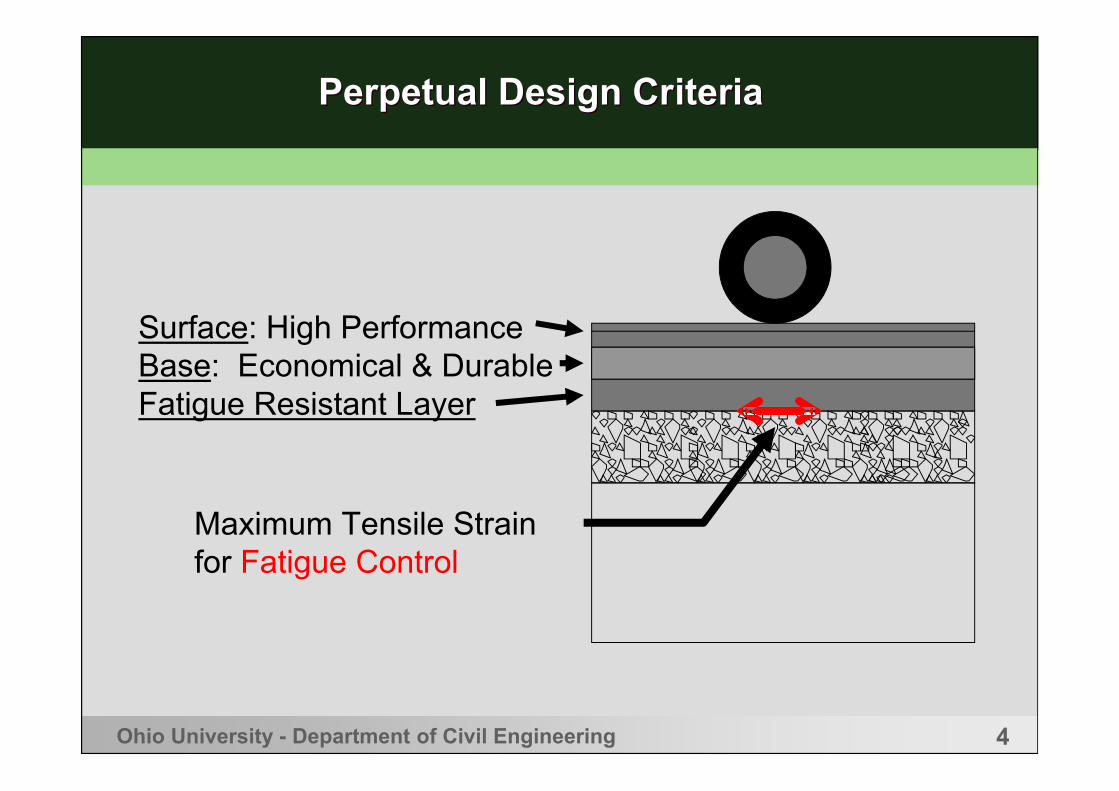
Perpetual Design CriteriaPerpetual Design Criteria
Maximum Tensile Strain for Fatigue Control
Surface: High Performance Base: Economical & Durable Fatigue Resistant Layer
5Ohio University - Department of Civil Engineering
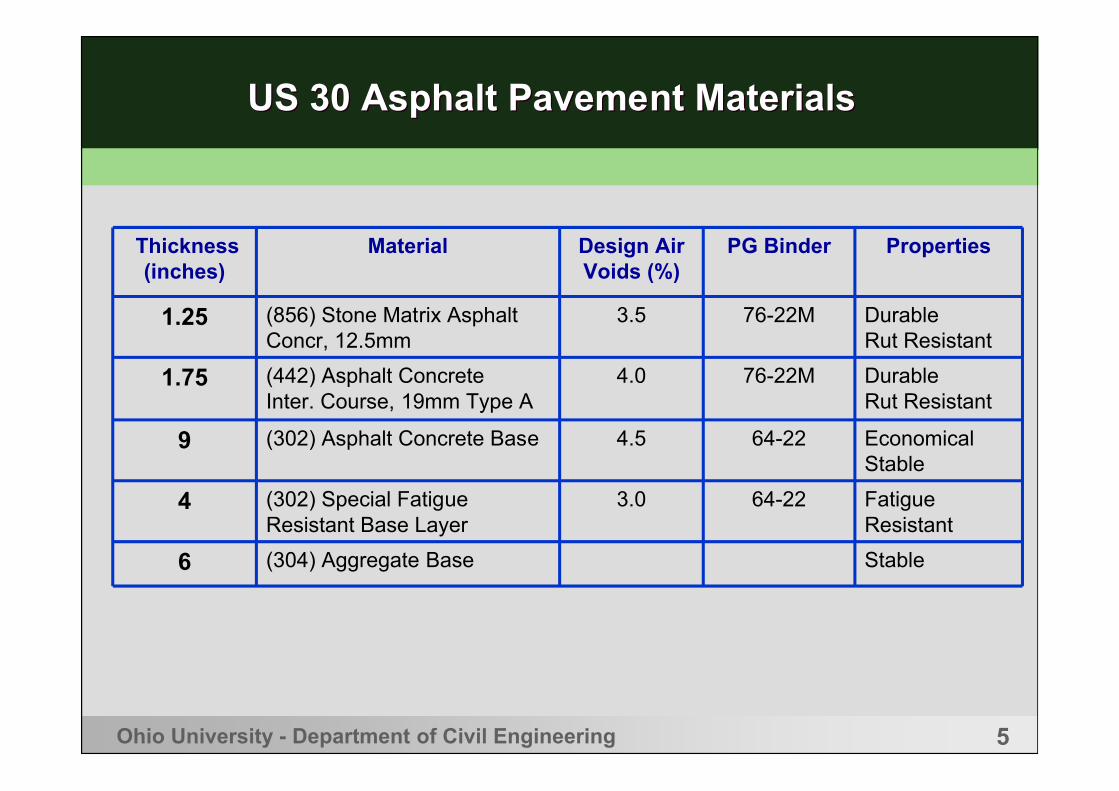
US 30 Asphalt Pavement MaterialsUS 30 Asphalt Pavement Materials
Thickness(inches)
Material Design Air Voids (%)
PG Binder Properties
1.25 (856) Stone Matrix Asphalt Concr, 12.5mm
3.5 76-22M Durable Rut Resistant
1.75 (442) Asphalt ConcreteInter. Course, 19mm Type A
4.0 76-22M Durable Rut Resistant
9 (302) Asphalt Concrete Base 4.5 64-22 Economical Stable
4 (302) Special Fatigue Resistant Base Layer
3.0 64-22 Fatigue Resistant
6 (304) Aggregate Base Stable
6
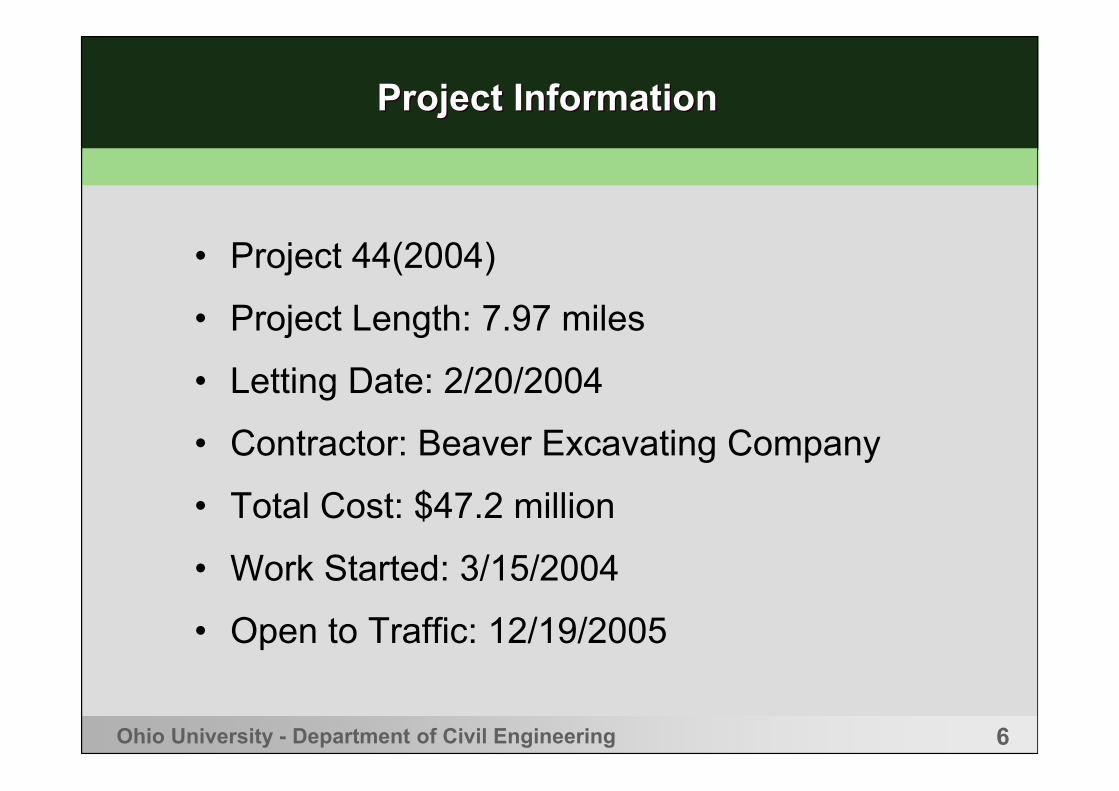
Project InformationProject Information
• Project 44(2004)
• Project Length: 7.97 miles
• Letting Date: 2/20/2004
• Contractor: Beaver Excavating Company
• Total Cost: $47.2 million
• Work Started: 3/15/2004
• Open to Traffic: 12/19/2005
Ohio University - Department of Civil Engineering
7
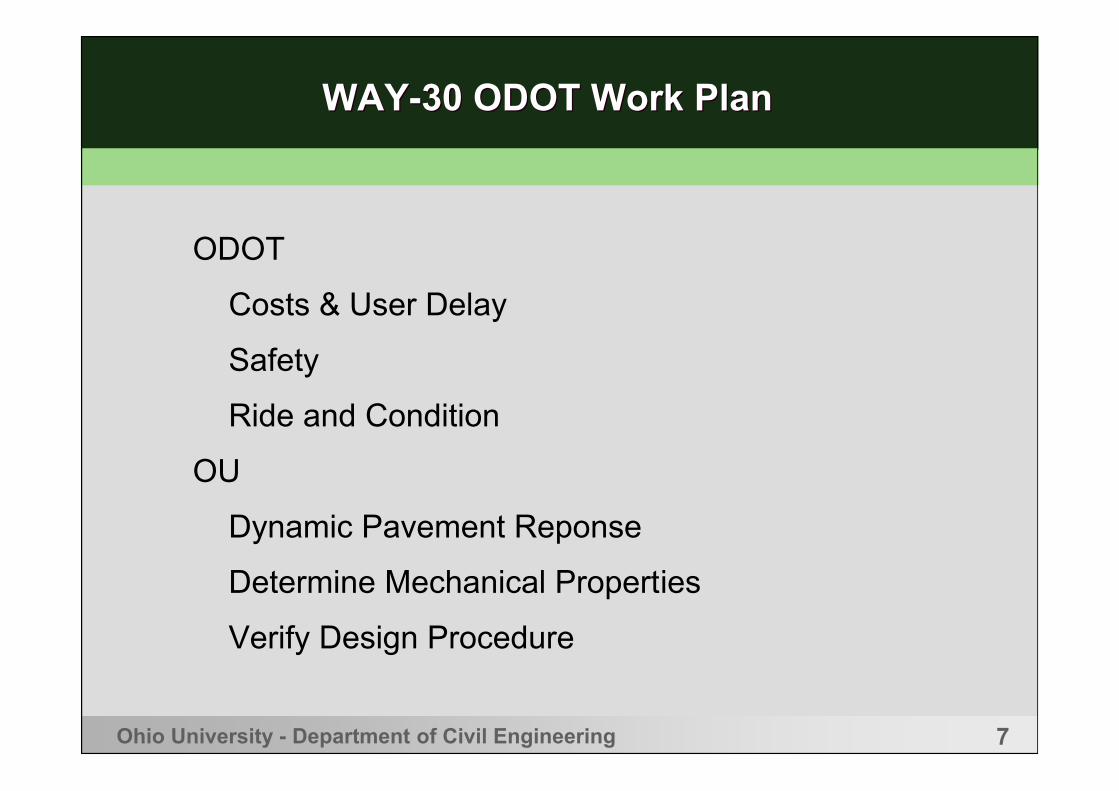
WAY-30 ODOT Work PlanWAY-30 ODOT Work Plan
ODOT
Costs & User Delay
Safety
Ride and Condition
OU
Dynamic Pavement Reponse
Determine Mechanical Properties
Verify Design Procedure
Ohio University - Department of Civil Engineering
8Ohio University - Department of Civil Engineering
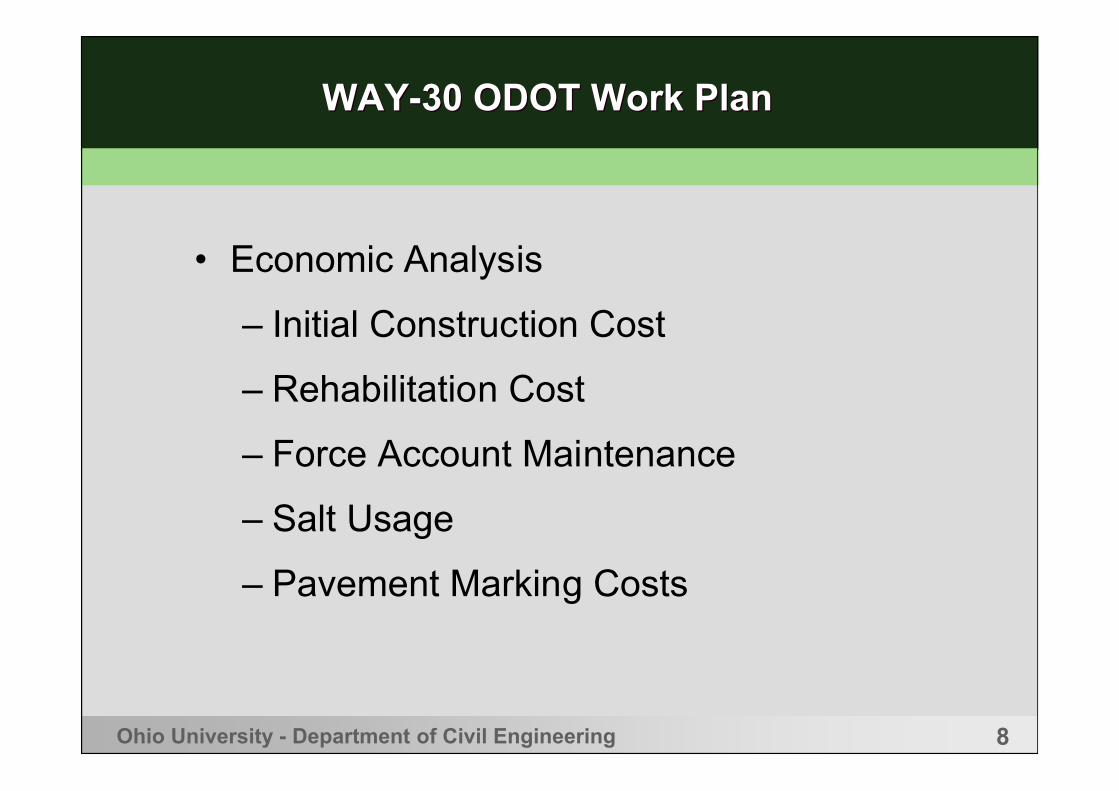
WAY-30 ODOT Work PlanWAY-30 ODOT Work Plan
• Economic Analysis
– Initial Construction Cost
– Rehabilitation Cost
– Force Account Maintenance
– Salt Usage
– Pavement Marking Costs
9Ohio University - Department of Civil Engineering
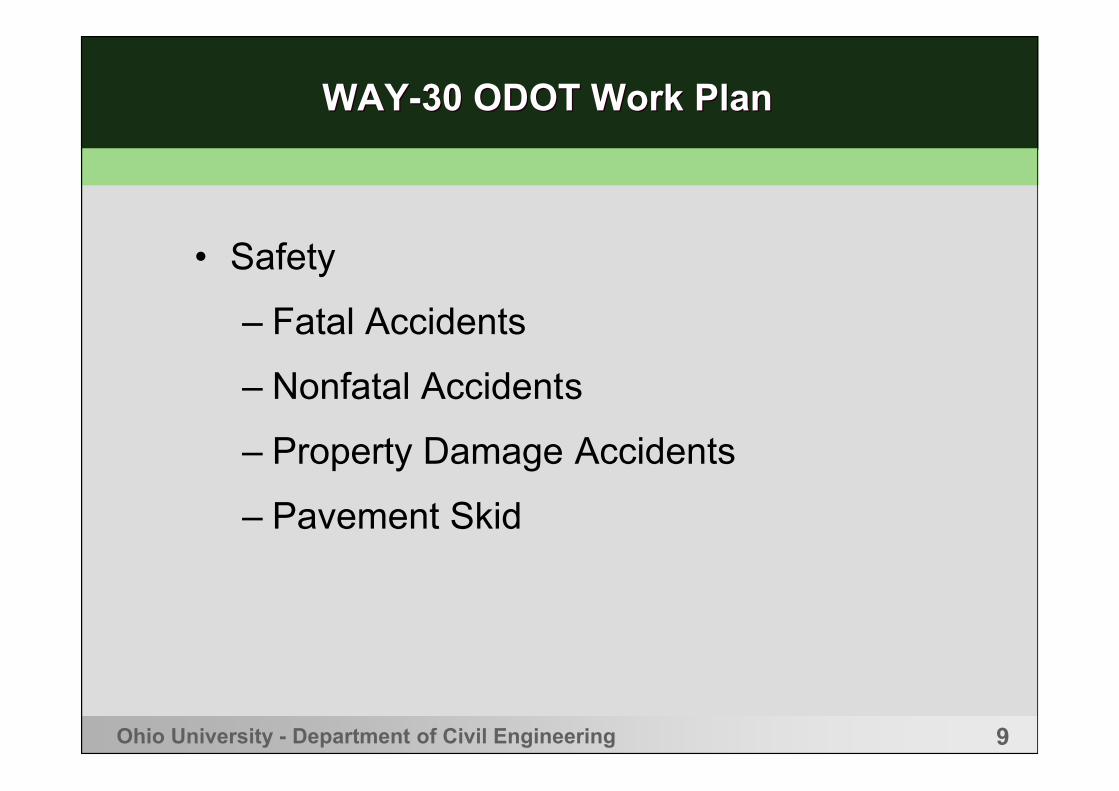
WAY-30 ODOT Work PlanWAY-30 ODOT Work Plan
• Safety
– Fatal Accidents
– Nonfatal Accidents
– Property Damage Accidents
– Pavement Skid
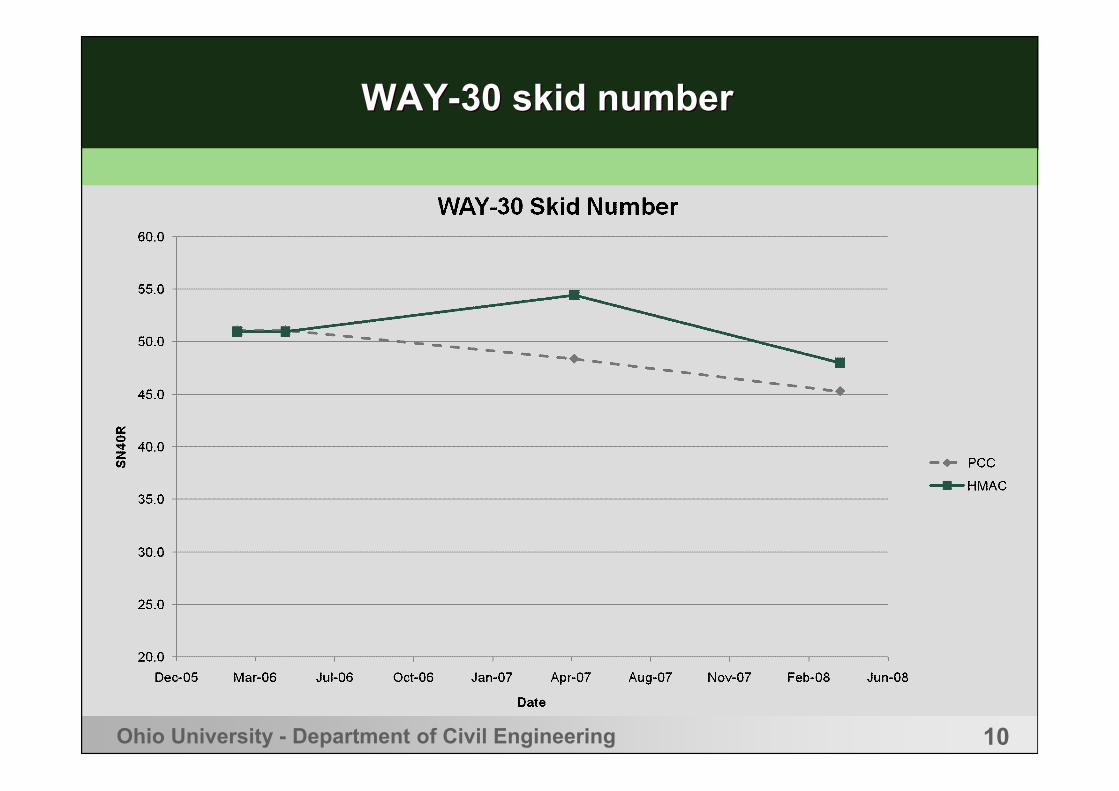
10Ohio University - Department of Civil Engineering
WAY-30 skid numberWAY-30 skid number
11Ohio University - Department of Civil Engineering
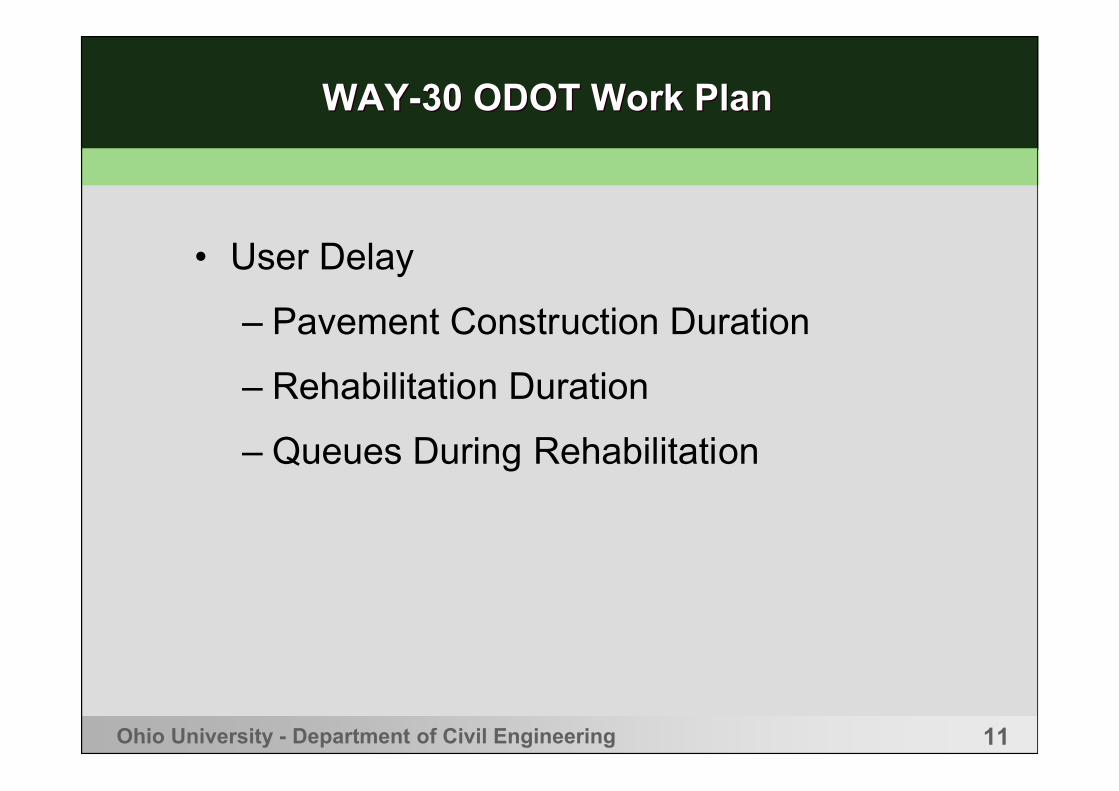
WAY-30 ODOT Work PlanWAY-30 ODOT Work Plan
• User Delay
– Pavement Construction Duration
– Rehabilitation Duration
– Queues During Rehabilitation
12Ohio University - Department of Civil Engineering
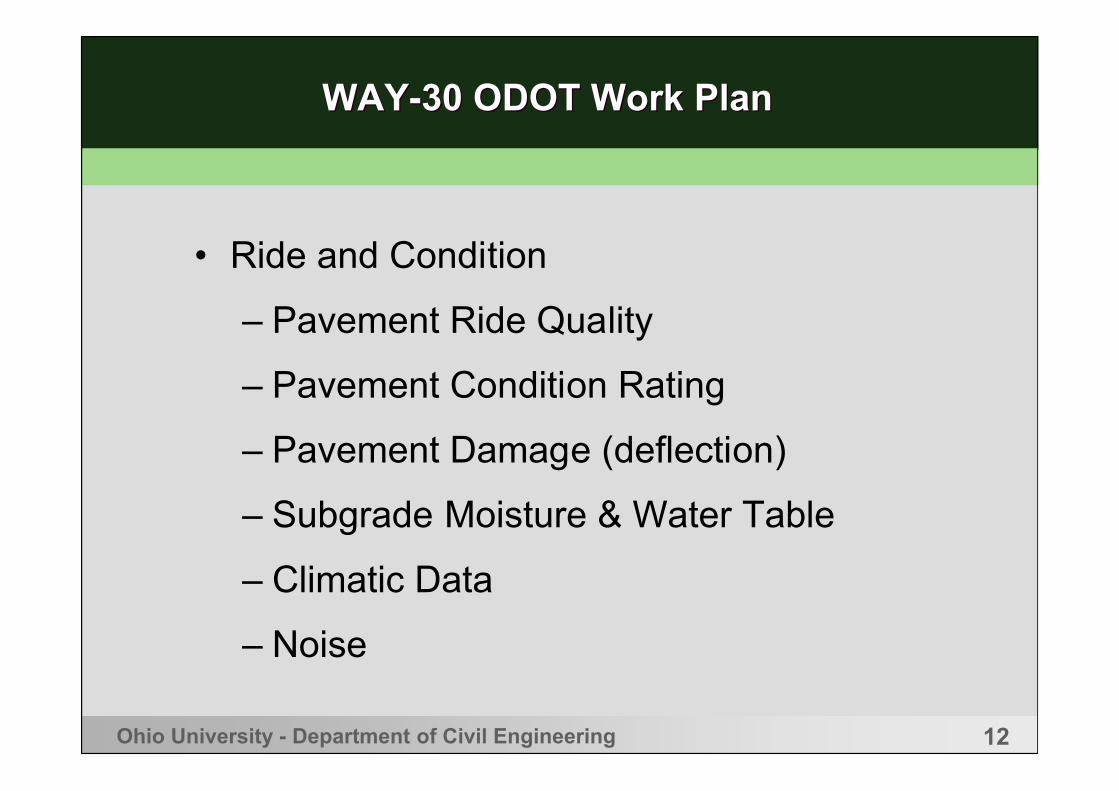
WAY-30 ODOT Work PlanWAY-30 ODOT Work Plan
• Ride and Condition
– Pavement Ride Quality
– Pavement Condition Rating
– Pavement Damage (deflection)
– Subgrade Moisture & Water Table
– Climatic Data
– Noise
13Ohio University - Department of Civil Engineering
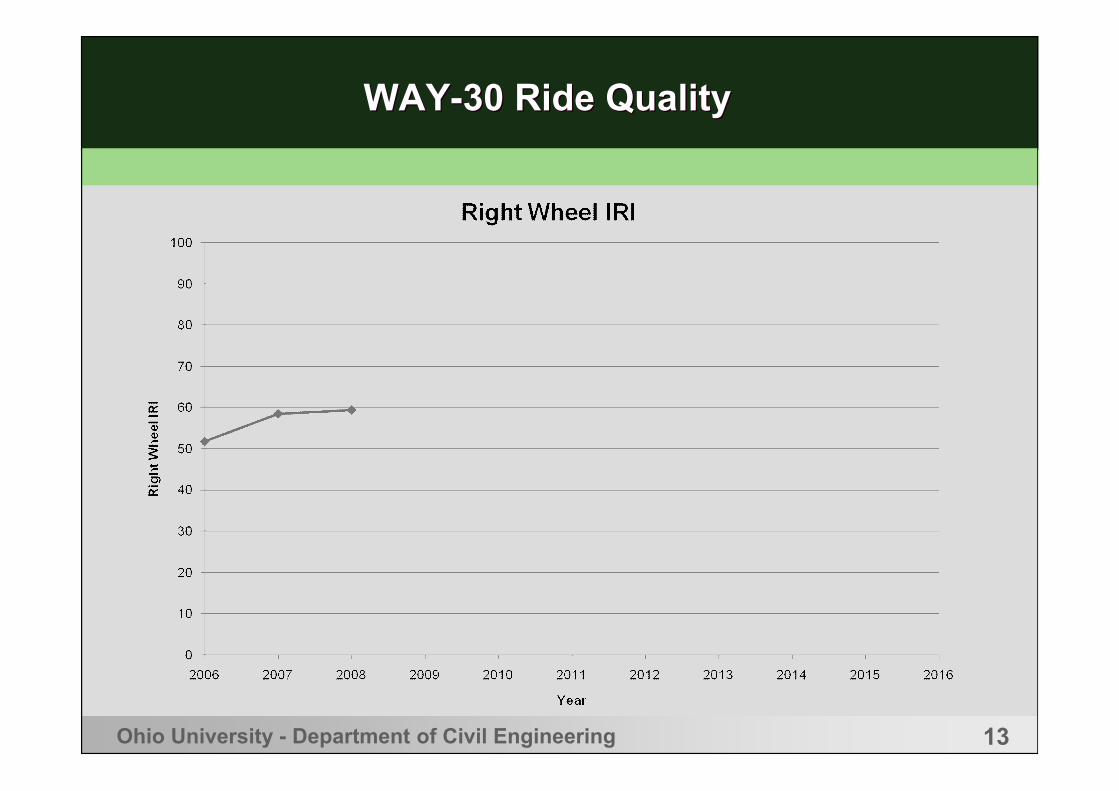
WAY-30 Ride QualityWAY-30 Ride Quality

14Ohio University - Department of Civil Engineering
WAY-30 FWD W1WAY-30 FWD W1
15Ohio University - Department of Civil Engineering
WAY-30 FWD W5WAY-30 FWD W5
16Ohio University - Department of Civil Engineering
WAY-30 FWD W7WAY-30 FWD W7

17Ohio University - Department of Civil Engineering
WAY-30 PCRWAY-30 PCR
18Ohio University - Department of Civil Engineering
y
x
Research Objectives for ORITE and OPE
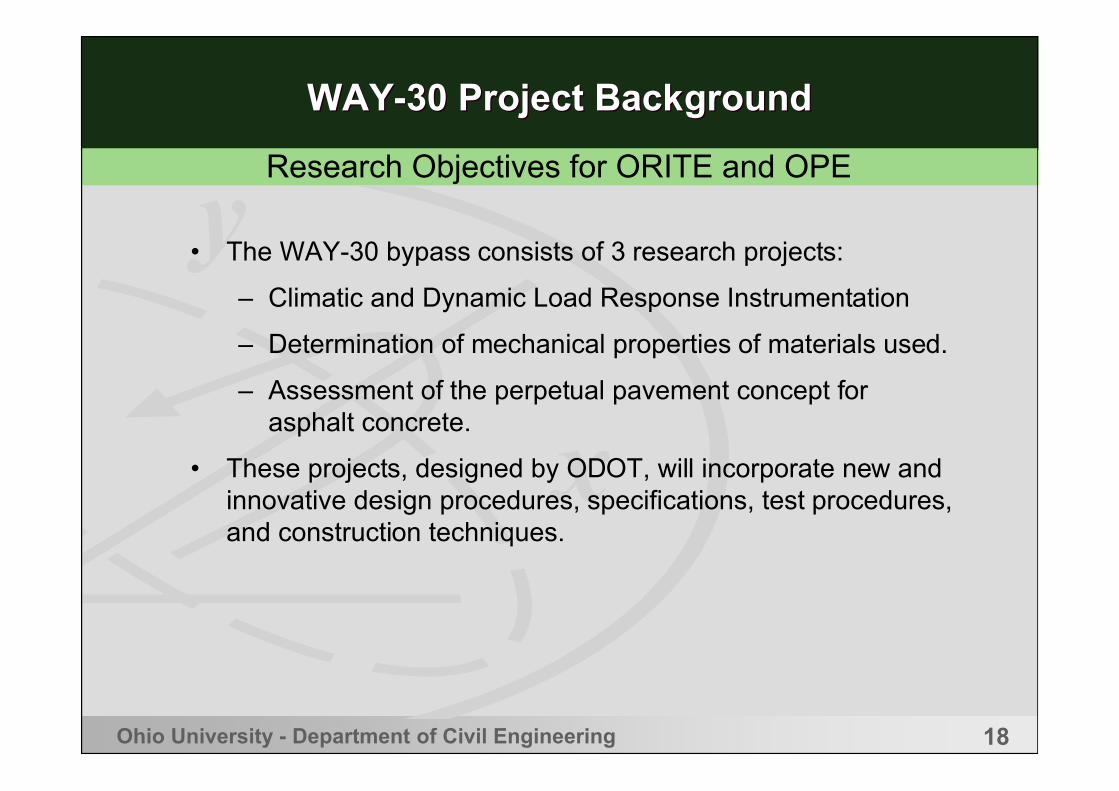
WAY-30 Project BackgroundWAY-30 Project Background
• The WAY-30 bypass consists of 3 research projects:
– Climatic and Dynamic Load Response Instrumentation
– Determination of mechanical properties of materials used.
– Assessment of the perpetual pavement concept for asphalt concrete.
• These projects, designed by ODOT, will incorporate new and innovative design procedures, specifications, test procedures, and construction techniques.
19Ohio University - Department of Civil Engineering
y
x
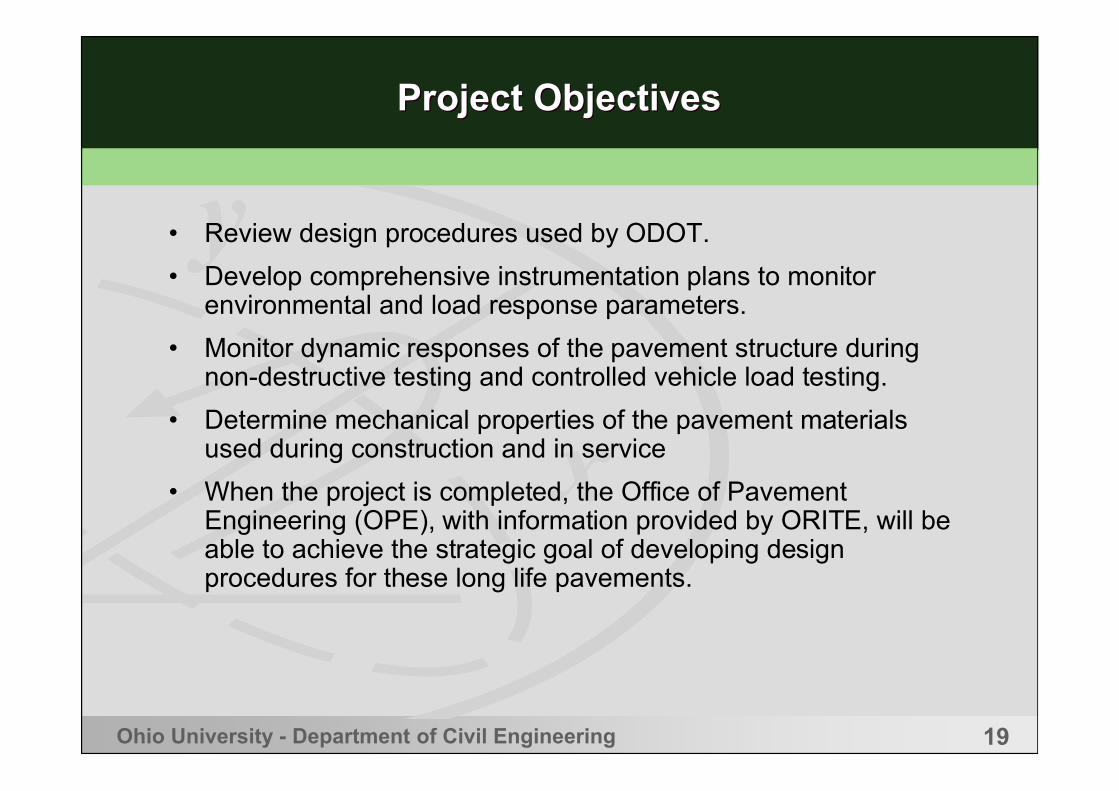
Project ObjectivesProject Objectives
• Review design procedures used by ODOT.
• Develop comprehensive instrumentation plans to monitor environmental and load response parameters.
• Monitor dynamic responses of the pavement structure during non-destructive testing and controlled vehicle load testing.
• Determine mechanical properties of the pavement materials used during construction and in service
• When the project is completed, the Office of Pavement Engineering (OPE), with information provided by ORITE, will be able to achieve the strategic goal of developing design procedures for these long life pavements.

20Ohio University - Department of Civil Engineering
y
x
Instrumentation PlanInstrumentation Plan
• ORITE’s instrumentation plan will monitor environmental and response parameters in each pavement type.
• Environmental parameters to be monitored in only one section of each pavement type.
• Dynamic load responses will be collected.
21Ohio University - Department of Civil Engineering
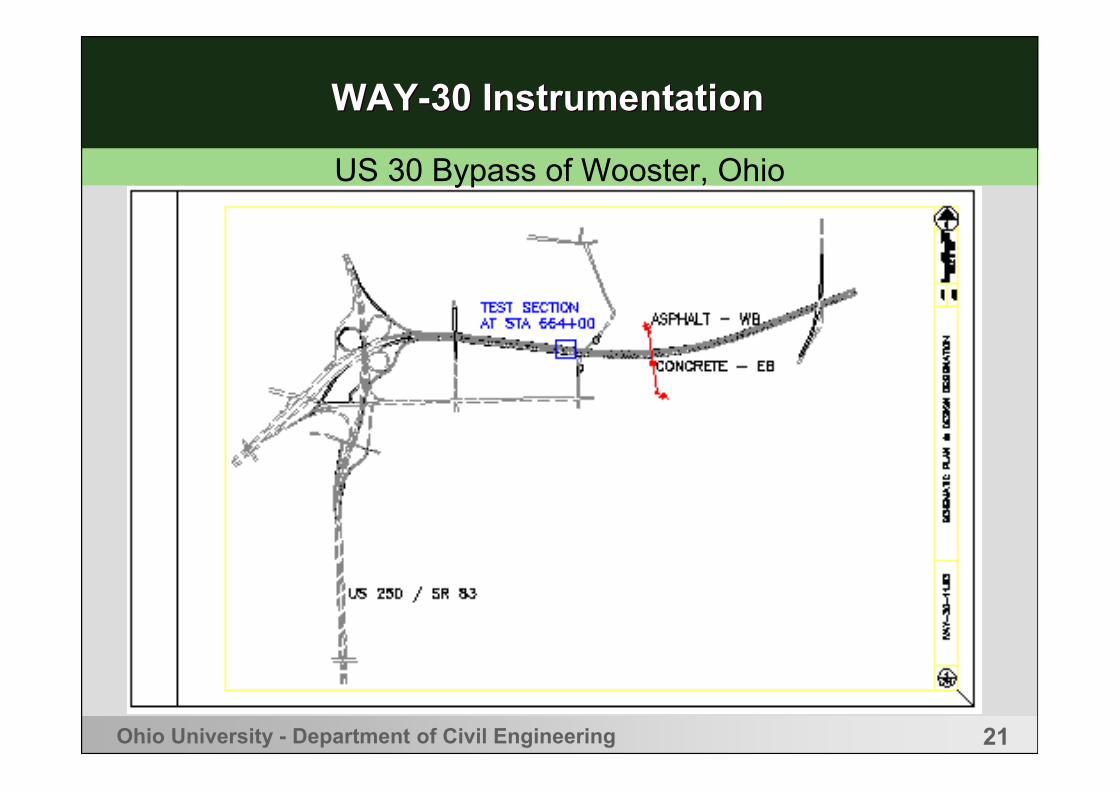
WAY-30 InstrumentationWAY-30 Instrumentation
US 30 Bypass of Wooster, Ohio
22Ohio University - Department of Civil Engineering
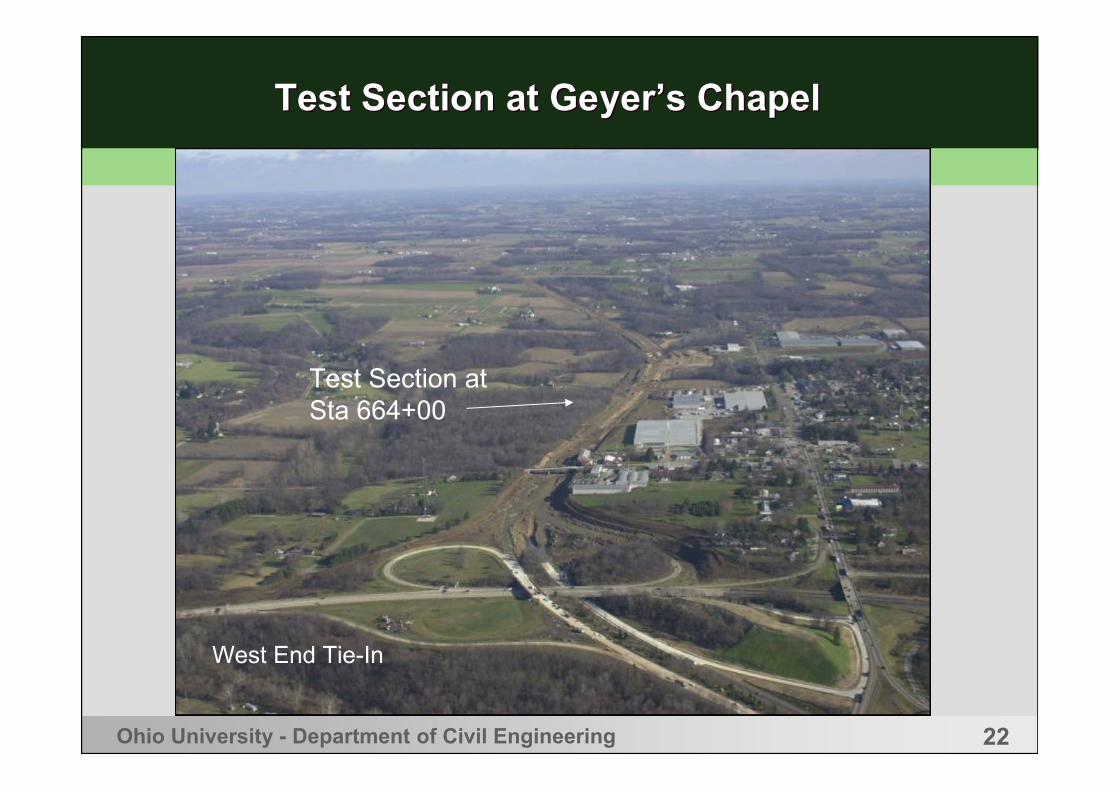
Test Section at Geyer’s ChapelTest Section at Geyer’s Chapel
West End Tie-In
Test Section at Sta 664+00
23Ohio University - Department of Civil Engineering
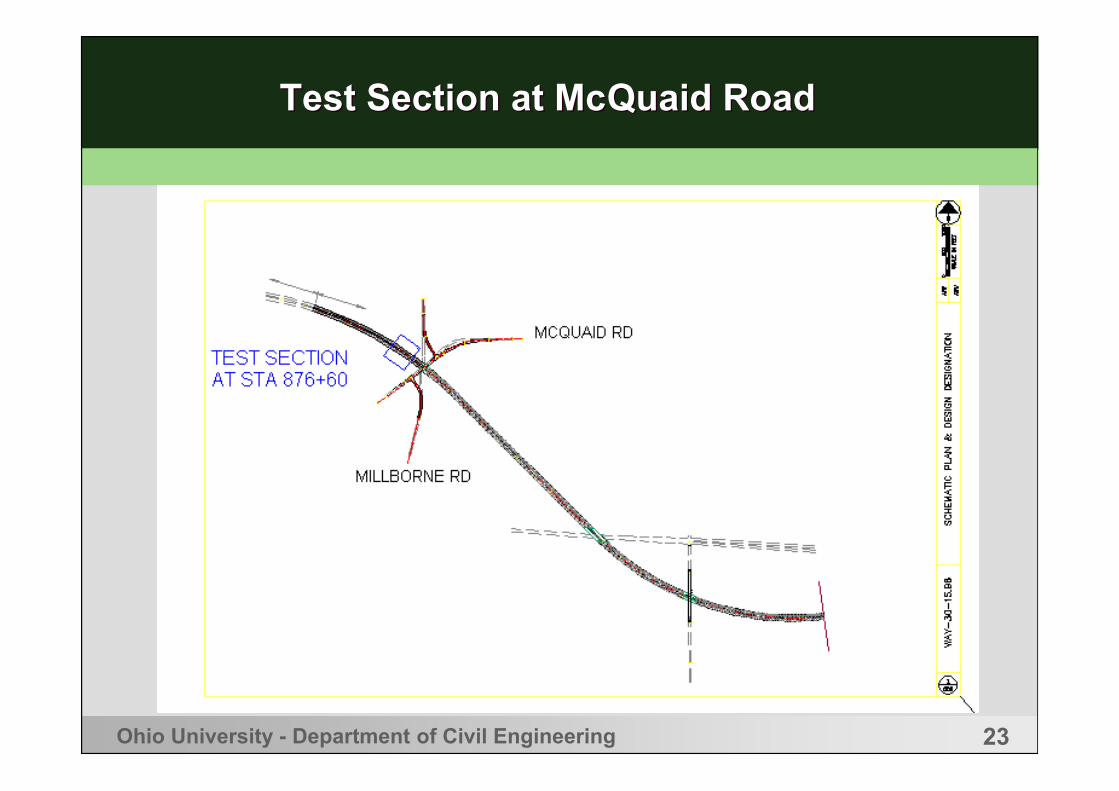
Test Section at McQuaid RoadTest Section at McQuaid Road
24Ohio University - Department of Civil Engineering
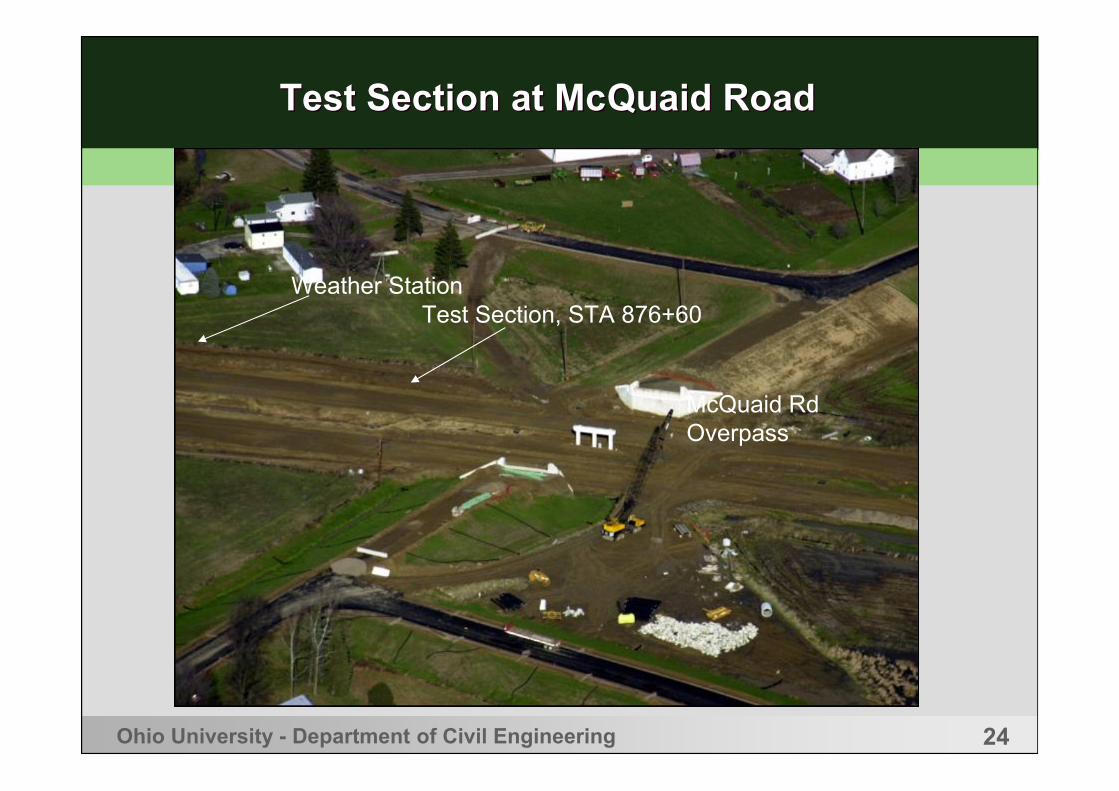
Test Section at McQuaid RoadTest Section at McQuaid Road
Weather StationTest Section, STA 876+60
McQuaid Rd Overpass
25Ohio University - Department of Civil Engineering
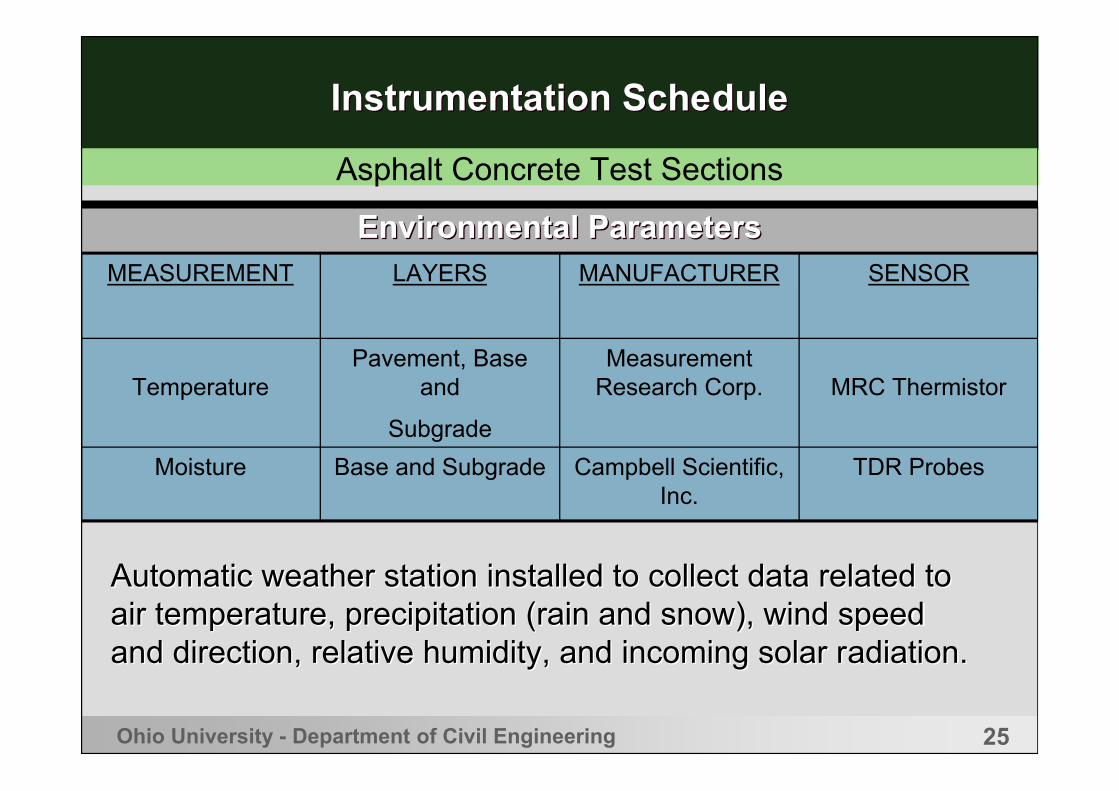
Instrumentation ScheduleInstrumentation Schedule
Environmental ParametersEnvironmental ParametersMEASUREMENT LAYERS MANUFACTURER SENSOR
TemperaturePavement, Base
and
Subgrade
Measurement Research Corp. MRC Thermistor
Moisture Base and Subgrade Campbell Scientific, Inc.
TDR Probes
Automatic weather station installed to collect data related to Automatic weather station installed to collect data related to air temperature, precipitation (rain and snow), wind speed air temperature, precipitation (rain and snow), wind speed and direction, relative humidity, and incoming solar radiation.and direction, relative humidity, and incoming solar radiation.
Asphalt Concrete Test Sections
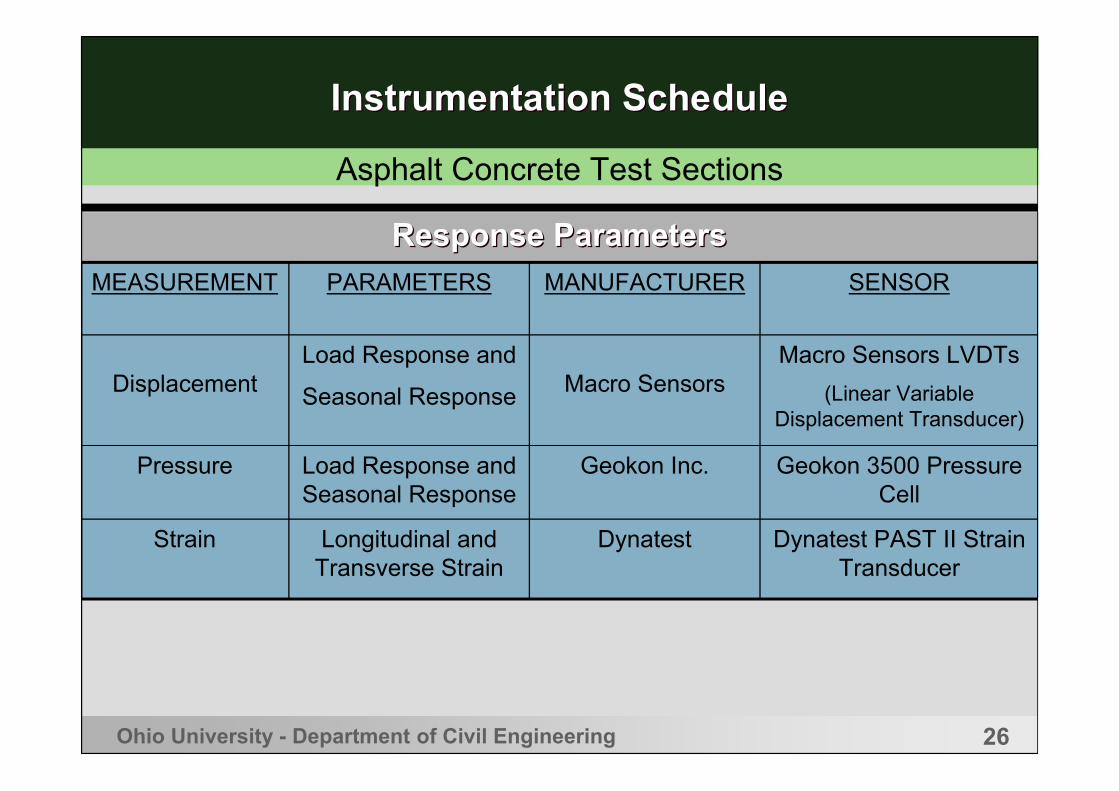
26Ohio University - Department of Civil Engineering
Instrumentation ScheduleInstrumentation Schedule
Response ParametersResponse ParametersMEASUREMENT PARAMETERS MANUFACTURER SENSOR
DisplacementLoad Response and
Seasonal Response Macro SensorsMacro Sensors LVDTs
(Linear Variable Displacement Transducer)
Pressure Load Response and Seasonal Response
Geokon Inc. Geokon 3500 Pressure Cell
Strain Longitudinal and Transverse Strain
Dynatest Dynatest PAST II Strain Transducer
Asphalt Concrete Test Sections
27Ohio University - Department of Civil Engineering
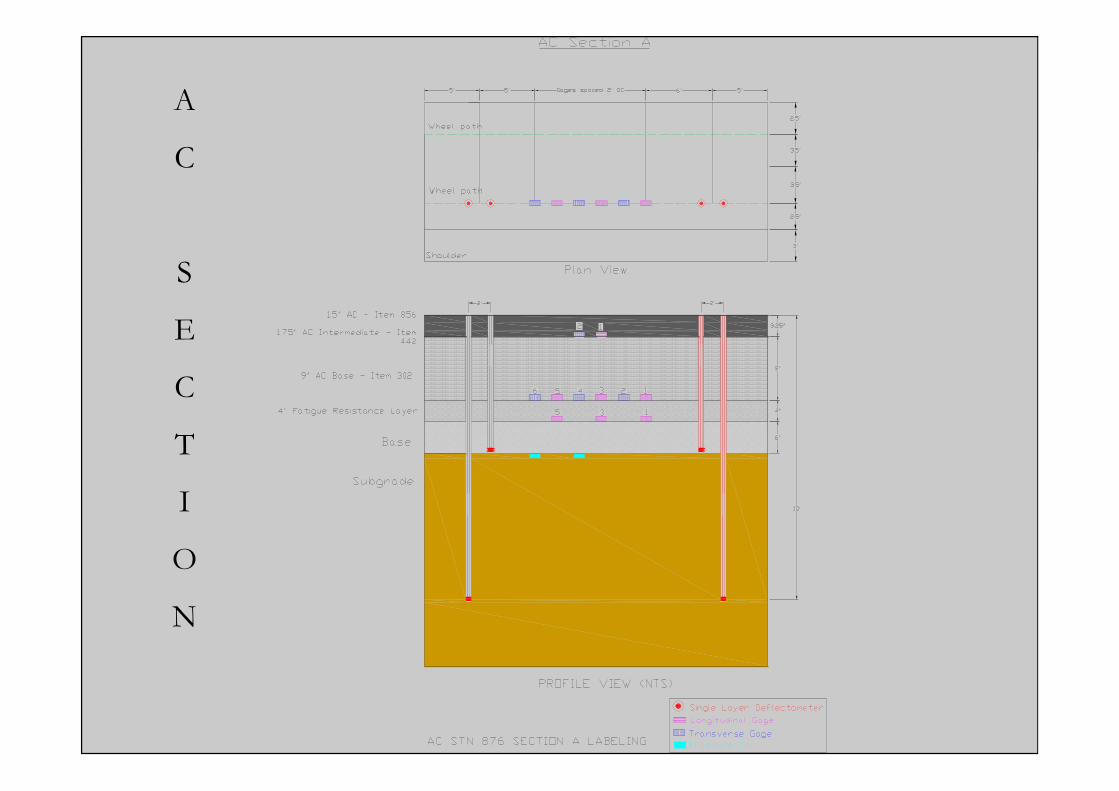
A
C
S
E
C
T
I
O
N
28Ohio University - Department of Civil Engineering
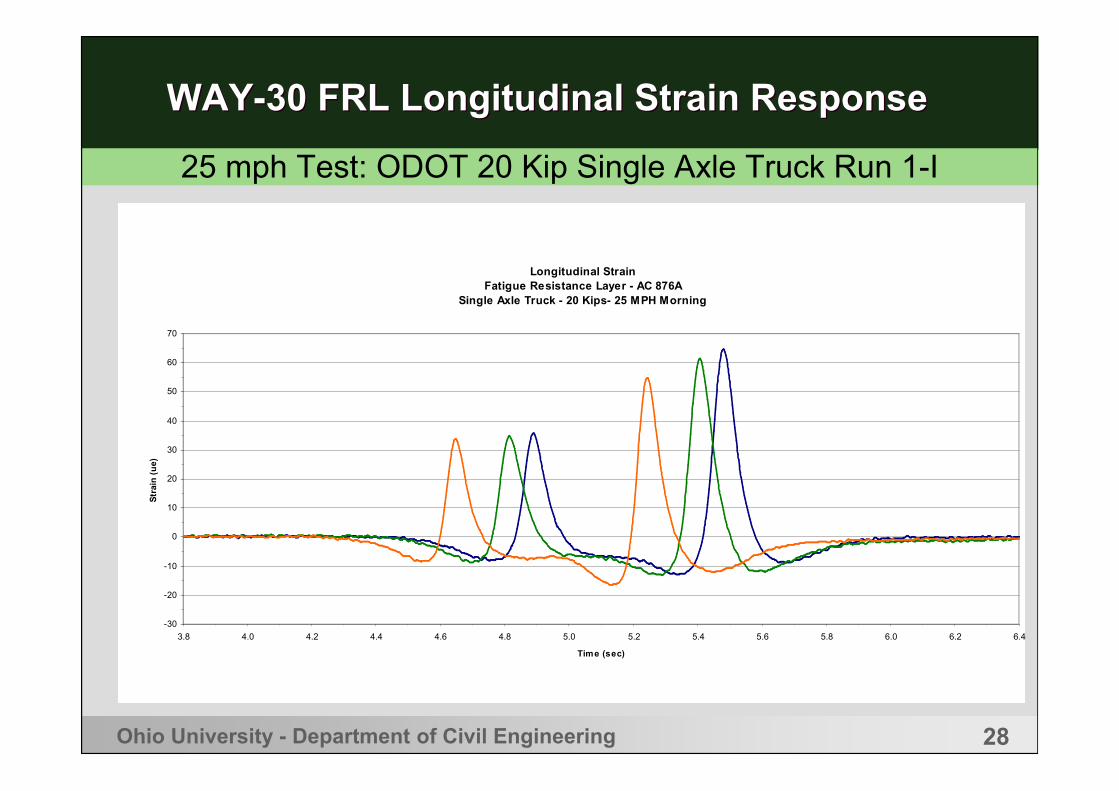
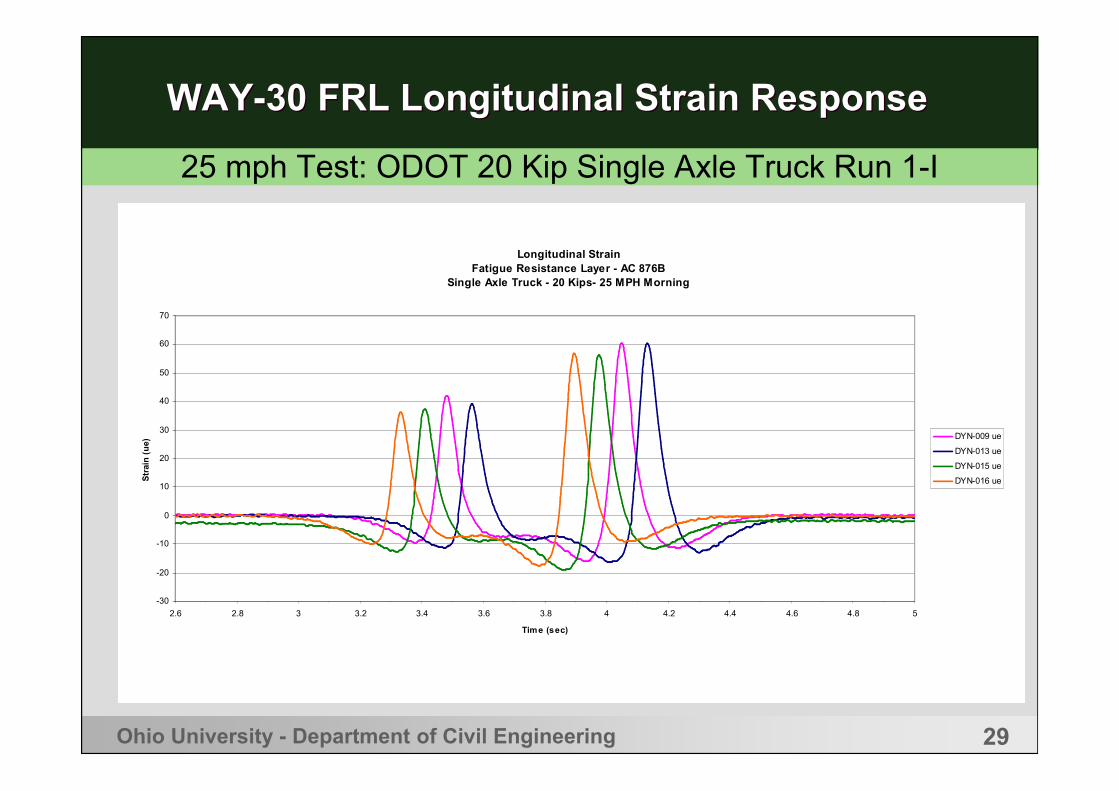
WAY-30 FRL Longitudinal Strain ResponseWAY-30 FRL Longitudinal Strain Response
25 mph Test: ODOT 20 Kip Single Axle Truck Run 1-I
Longitudinal StrainFatigue Resistance Layer - AC 876A
Single Axle Truck - 20 Kips- 25 MPH Morning
-30
-20
-10
0
10
20
30
40
50
60
70
3.8 4.0 4.2 4.4 4.6 4.8 5.0 5.2 5.4 5.6 5.8 6.0 6.2 6.4
Time (sec)
Str
ain
(u
e)
29Ohio University - Department of Civil Engineering
WAY-30 FRL Longitudinal Strain ResponseWAY-30 FRL Longitudinal Strain Response
25 mph Test: ODOT 20 Kip Single Axle Truck Run 1-I
Longitudinal StrainFatigue Resistance Layer - AC 876B
Single Axle Truck - 20 Kips- 25 MPH Morning
-30
-20
-10
0
10
20
30
40
50
60
70
2.6 2.8 3 3.2 3.4 3.6 3.8 4 4.2 4.4 4.6 4.8 5
Time (sec)
Str
ain
(u
e)
DYN-009 ue
DYN-013 ue
DYN-015 ue
DYN-016 ue
30Ohio University - Department of Civil Engineering
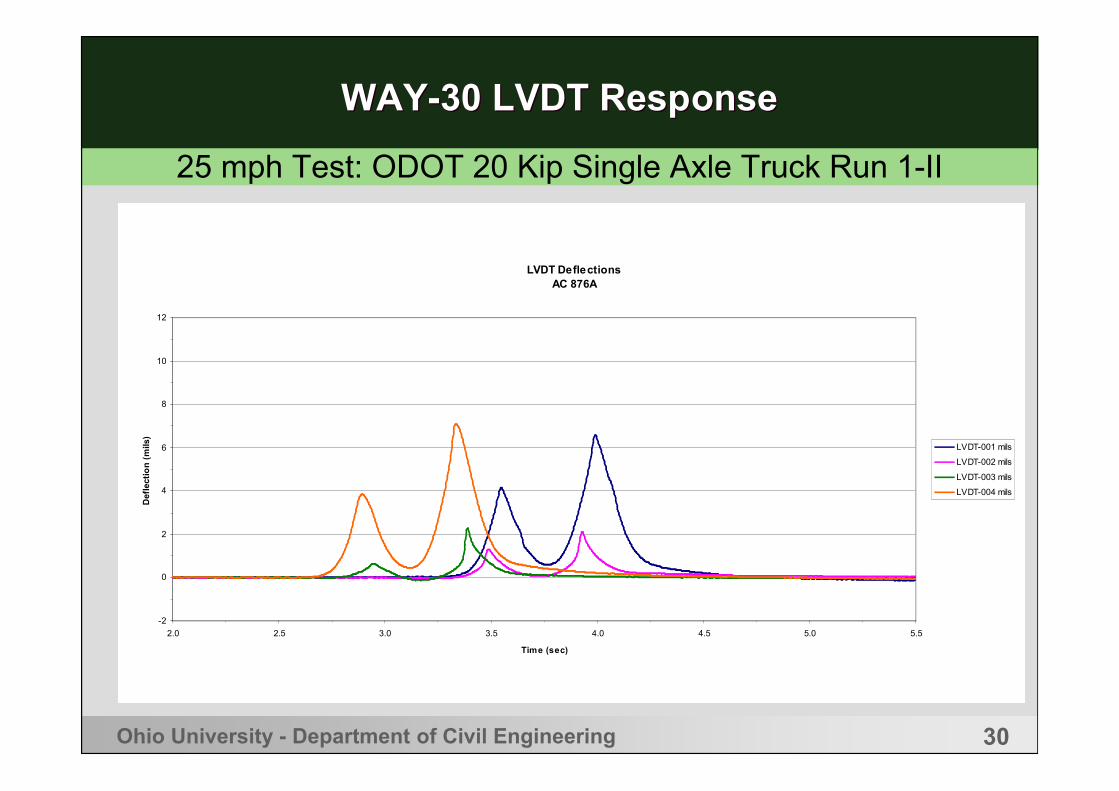
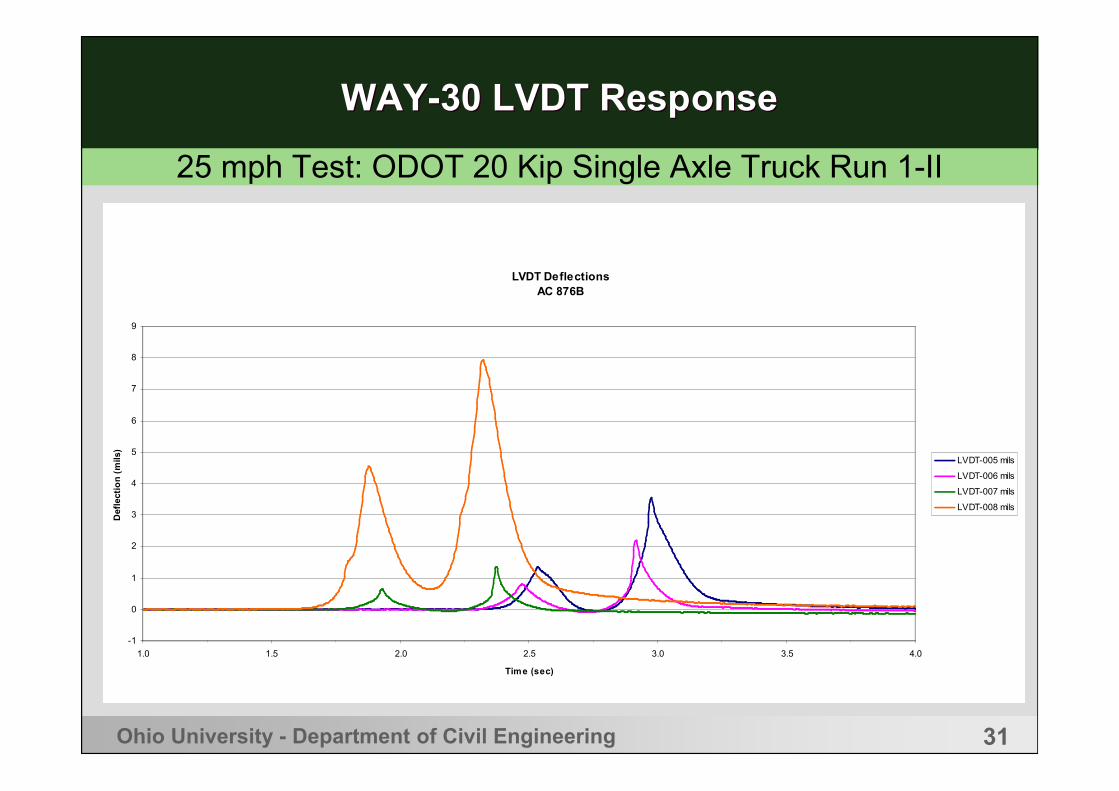
WAY-30 LVDT ResponseWAY-30 LVDT Response
25 mph Test: ODOT 20 Kip Single Axle Truck Run 1-II
LVDT DeflectionsAC 876A
-2
0
2
4
6
8
10
12
2.0 2.5 3.0 3.5 4.0 4.5 5.0 5.5
Time (sec)
Def
lect
ion
(m
ils)
LVDT-001 mils
LVDT-002 mils
LVDT-003 mils
LVDT-004 mils
31Ohio University - Department of Civil Engineering
WAY-30 LVDT ResponseWAY-30 LVDT Response
25 mph Test: ODOT 20 Kip Single Axle Truck Run 1-II
LVDT DeflectionsAC 876B
-1
0
1
2
3
4
5
6
7
8
9
1.0 1.5 2.0 2.5 3.0 3.5 4.0
Time (sec)
Def
lect
ion
(m
ils)
LVDT-005 mils
LVDT-006 mils
LVDT-007 mils
LVDT-008 mils
32
ConclusionsConclusions
• In the December 2005 CVL test, at low temperature, the longitudinal strain in the FRL was under 35 με, even at the slowest speeds.
• In general, observed strains under FRL remained below design strains, even under hot summer conditions for CVL truck loads at near highway speeds (45 mph (72 km/h) and higher). CVL loads are heavier than most truck loads.
• Loads at slower speeds (e.g. 5 mph (8 km/h)) were higher, but would only be experienced rarely, e.g. when traffic is stalled. The perpetual pavement FRL is designed to withstand a limited number (dozens or perhaps hundreds) of these loads with no ill effect.
33
ConclusionsConclusions
• Strains developed at the bottom of the ATB layer are lower than the strains developed at the bottom of the fatigue layer, as expected. Overall, the maximum longitudinal strains in the ATB layer are slightly higher than the maximum transverse strain in all axle configurations and loading conditions during the December tests,and for the single axle loads during the July tests.
• Maximum longitudinal strains are slightly higher than maximum transverse strains for all December runs and all single axle runs in July.
• The maximum pressure observed in the subgrade during CVL tests on the AC sections was 6.5 psi (44.8 kPa) at 45 mph (72 km/h) under a 40 kip (178 kN) tandem axle load.
34Ohio University - Department of Civil Engineering
y
x
Warm Mix Asphalt Perpetual Pavement
35Ohio University - Department of Civil Engineering
ORITE Warm Mix Asphalt Research ProjectORITE Warm Mix Asphalt Research Project
• Detailed field, controlled environment, and laboratory evaluation of Aspha-min, Evotherm, and Sasobit and Conventional mixes
– Field study in Guernsey County, OH
– Controlled load and environment test at ORITE’s Accelerated Pavement Load Facility (APLF) in Lancaster, OH
– Laboratory studies of materials
• Project sponsored by the Ohio Department of Transportation (ODOT) and the the US Federal Highway Administration (FHWA)
36Ohio University - Department of Civil Engineering
Controlled Load and Environment Testing at the Accelerated Pavement Load Facility (APLF)
Controlled Load and Environment Testing at the Accelerated Pavement Load Facility (APLF)
• WMA and HMA surface layers have been built and will be tested at the Accelerated Pavement Load Facility (APLF)
– Same types as those used on GUE-541 (Aspha-min, Evotherm, Sasobit, and HMA)
– Built on perpetual pavement sections at two thicknesses
• Perpetual Pavement similar to WAY-30 construction
• Testing under load at three temperatures:
high (105°F (40.6°C)), medium (70°F (21.1°C)), low (40°F (4.4°C))
• FWD
• Collect Pavement Response data
• Infrared camera (during construction)
37Ohio University - Department of Civil Engineering
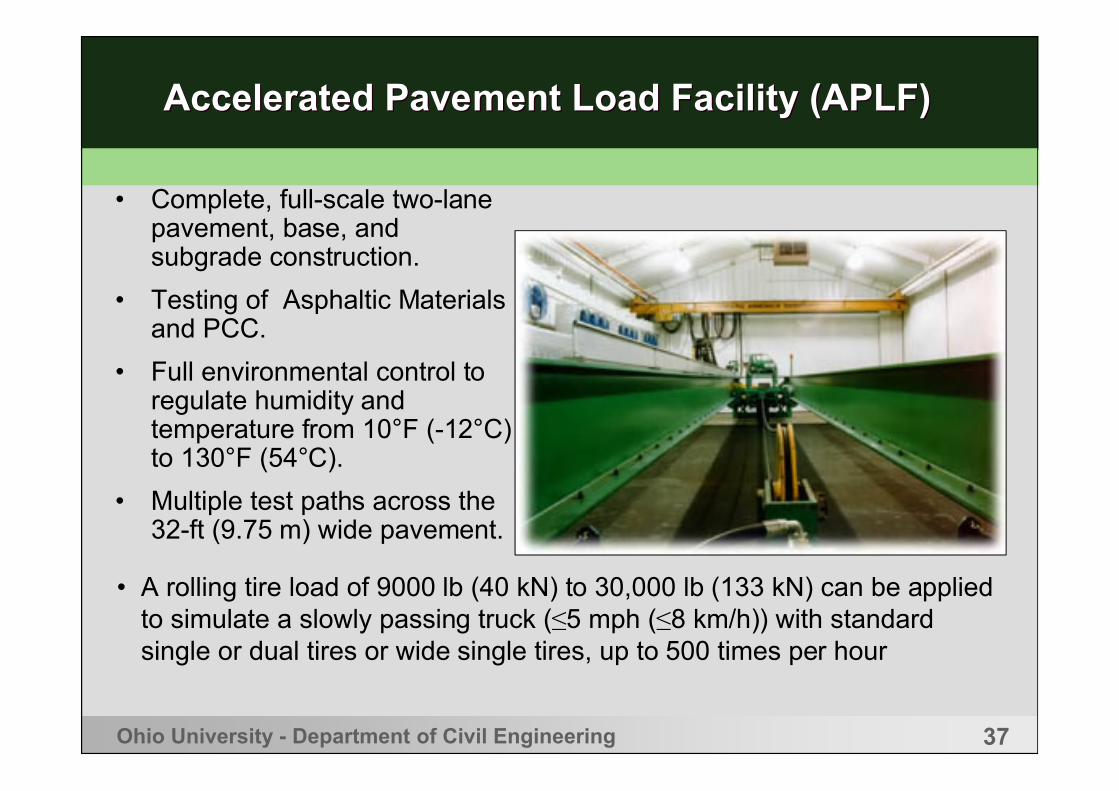
Accelerated Pavement Load Facility (APLF)Accelerated Pavement Load Facility (APLF)
• Complete, full-scale two-lane pavement, base, and subgrade construction.
• Testing of Asphaltic Materials and PCC.
• Full environmental control to regulate humidity and temperature from 10°F (-12°C)to 130°F (54°C).
• Multiple test paths across the 32-ft (9.75 m) wide pavement.
• A rolling tire load of 9000 lb (40 kN) to 30,000 lb (133 kN) can be applied to simulate a slowly passing truck (≤5 mph (≤8 km/h)) with standard single or dual tires or wide single tires, up to 500 times per hour
38Ohio University - Department of Civil Engineering
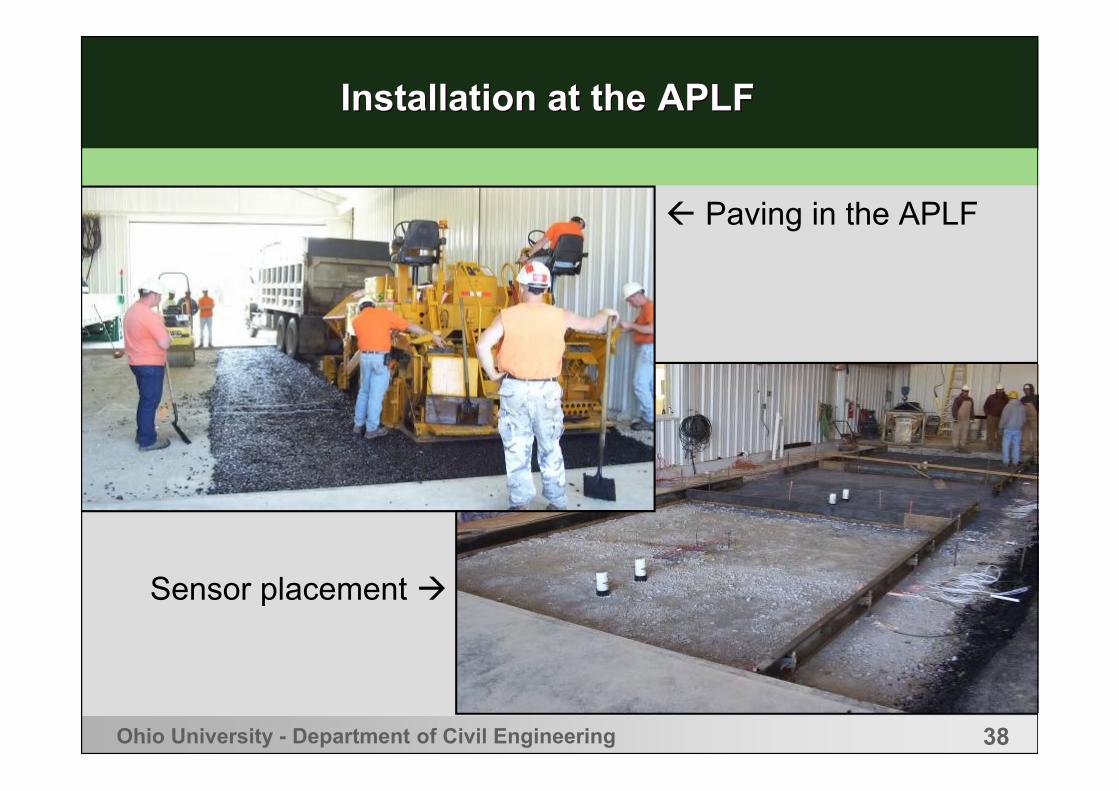
Installation at the APLFInstallation at the APLF
Paving in the APLF
Sensor placement
39Ohio University - Department of Civil Engineering
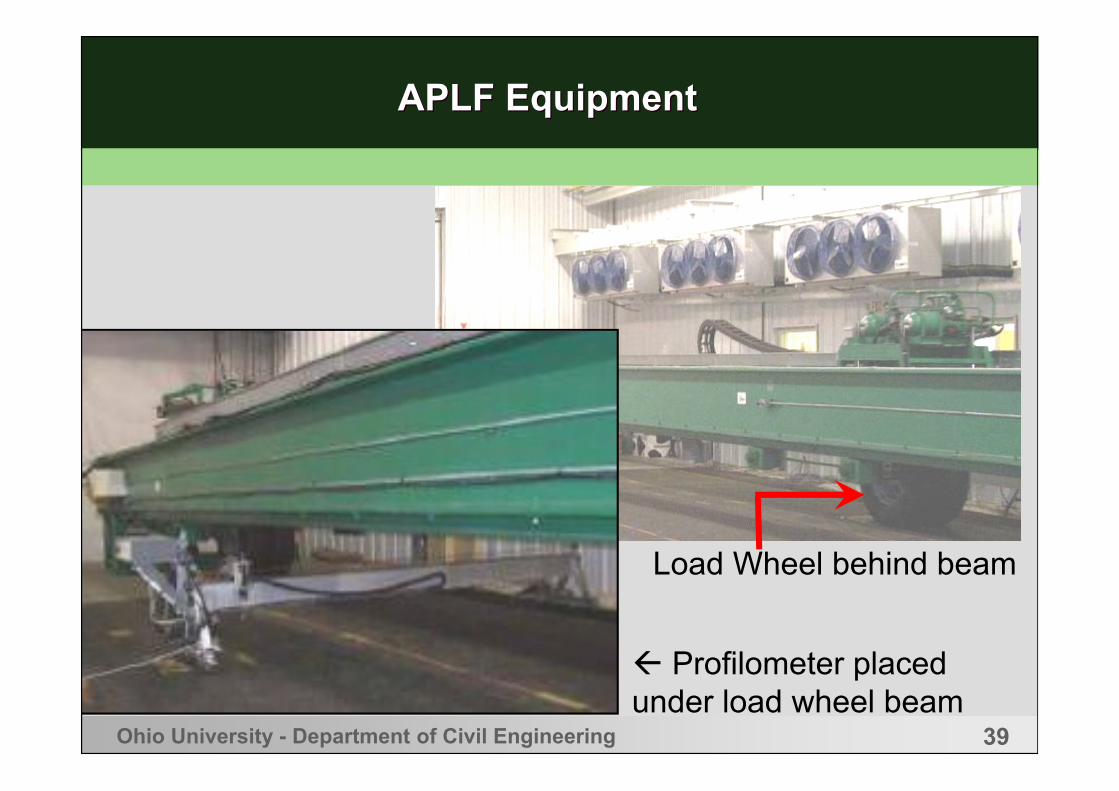
APLF EquipmentAPLF Equipment
Load Wheel behind beam
Profilometer placed under load wheel beam
40Ohio University - Department of Civil Engineering
Abbreviations usedAbbreviations used
• AC=Asphalt Concrete
• WMA=Warm Mix Asphalt
• HMA=conventional Hot Mix Asphalt
• ODOT=Ohio Department of Transportation
• 304 or DGAB=Dense Graded Aggregate Base (ODOT item 304)
• 448 Intermediate Layer=ODOT Item 448
• ATB=Asphalt Treated Base: Modified ODOT Item 302
• FRL=Fatigue Resistant Layer
41Ohio University - Department of Civil Engineering
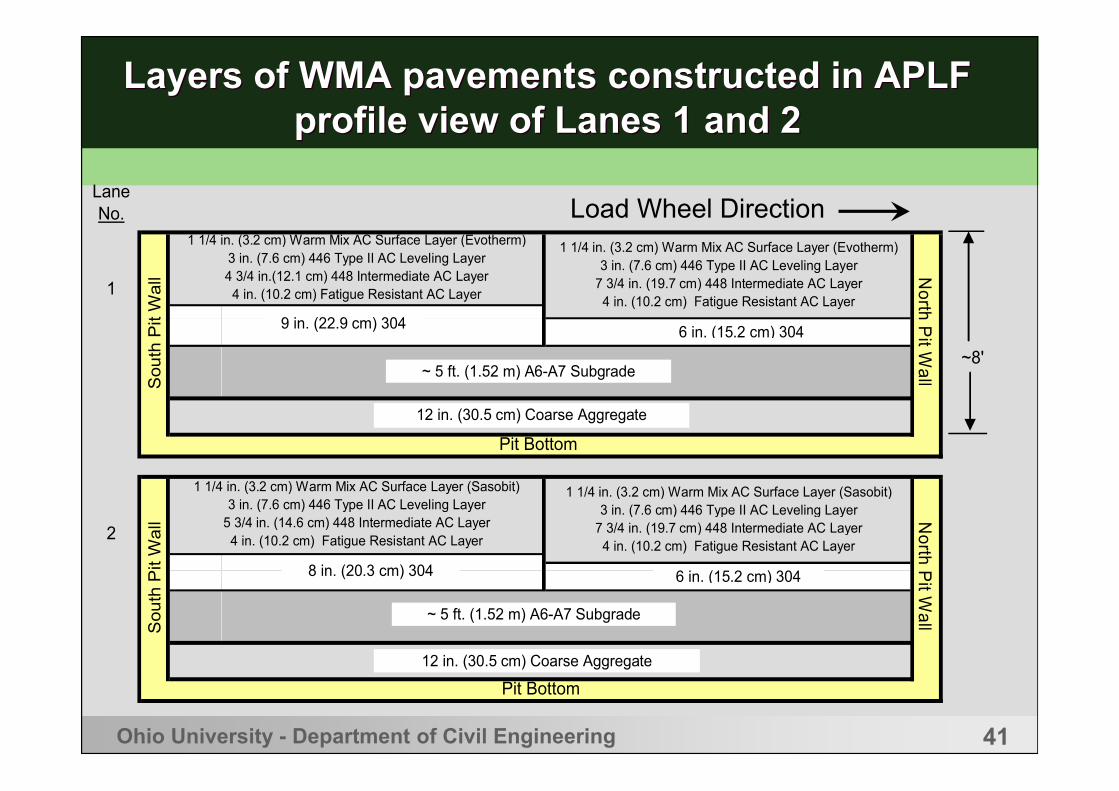
Layers of WMA pavements constructed in APLFprofile view of Lanes 1 and 2
Layers of WMA pavements constructed in APLFprofile view of Lanes 1 and 2
~8'
Lane 1
South
Pit
Wall N
orth P
it Wall
N
1 1/4 in. (3.2 cm) Warm Mix AC Surface Layer (Sasobit) 3 in. (7.6 cm) 446 Type II AC Leveling Layer
7 3/4 in. (19.7 cm) 448 Intermediate AC Layer 4 in. (10.2 cm) Fatigue Resistant AC Layer
2
1
Lane No.
1 1/4 in. (3.2 cm) Warm Mix AC Surface Layer (Evotherm) 3 in. (7.6 cm) 446 Type II AC Leveling Layer 4 3/4 in.(12.1 cm) 448 Intermediate AC Layer
4 in. (10.2 cm) Fatigue Resistant AC Layer
1 1/4 in. (3.2 cm) Warm Mix AC Surface Layer (Evotherm) 3 in. (7.6 cm) 446 Type II AC Leveling Layer
7 3/4 in. (19.7 cm) 448 Intermediate AC Layer 4 in. (10.2 cm) Fatigue Resistant AC Layer
Pit Bottom
Pit Bottom
1 1/4 in. (3.2 cm) Warm Mix AC Surface Layer (Sasobit) 3 in. (7.6 cm) 446 Type II AC Leveling Layer
5 3/4 in. (14.6 cm) 448 Intermediate AC Layer 4 in. (10.2 cm) Fatigue Resistant AC Layer
North P
it WallS
outh
Pit
Wall
9 in. (22.9 cm) 304 DGAB
6 in. (15.2 cm) 304
8 in. (20.3 cm) 304 6 in. (15.2 cm) 304
~ 5 ft. (1.52 m) A6-A7 Subgrade
~ 5 ft. (1.52 m) A6-A7 Subgrade
12 in. (30.5 cm) Coarse Aggregate
12 in. (30.5 cm) Coarse Aggregate
Load Wheel Direction
42Ohio University - Department of Civil Engineering
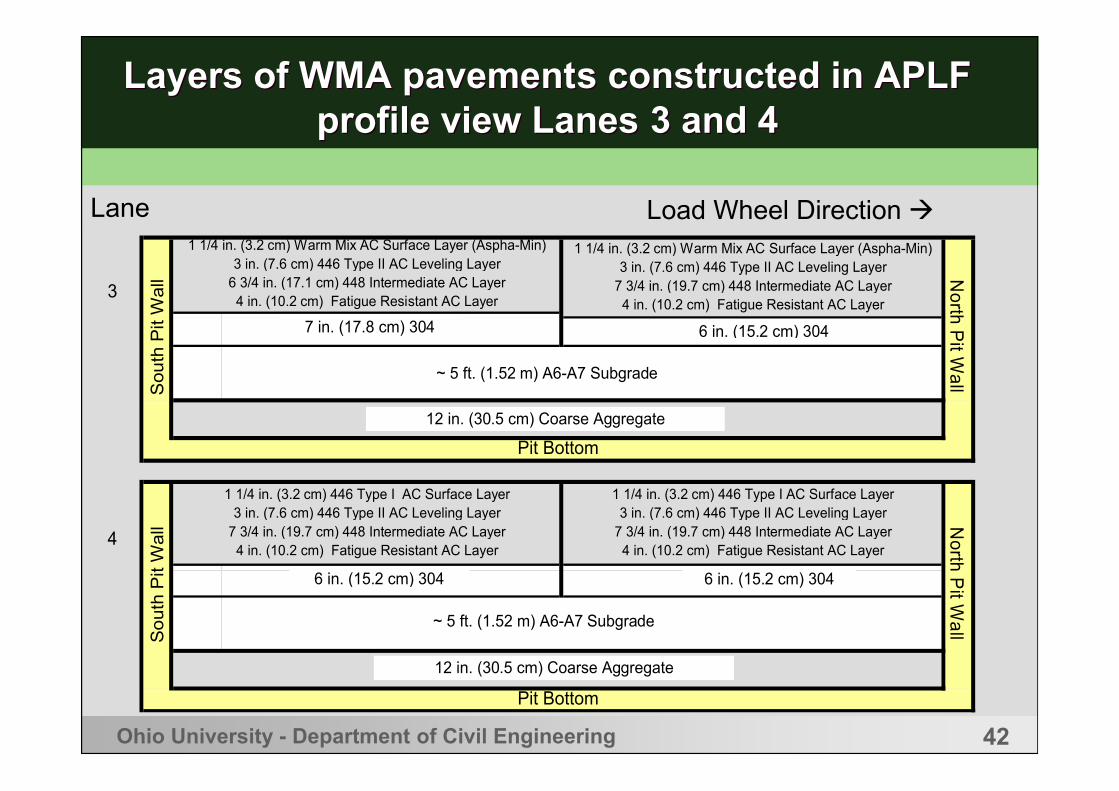
Layers of WMA pavements constructed in APLFprofile view Lanes 3 and 4
Layers of WMA pavements constructed in APLFprofile view Lanes 3 and 4
So
uth
Pit
Wall
Pit Bottom
1 1/4 in. (3.2 cm) 446 Type I AC Surface Layer 3 in. (7.6 cm) 446 Type II AC Leveling Layer
7 3/4 in. (19.7 cm) 448 Intermediate AC Layer 4 in. (10.2 cm) Fatigue Resistant AC Layer
North
Pit W
all
North
Pit W
allS
ou
th P
it W
all
4
1 1/4 in. (3.2 cm) Warm Mix AC Surface Layer (Aspha-Min) 3 in. (7.6 cm) 446 Type II AC Leveling Layer
7 3/4 in. (19.7 cm) 448 Intermediate AC Layer 4 in. (10.2 cm) Fatigue Resistant AC Layer
3
1 1/4 in. (3.2 cm) 446 Type I AC Surface Layer 3 in. (7.6 cm) 446 Type II AC Leveling Layer
7 3/4 in. (19.7 cm) 448 Intermediate AC Layer 4 in. (10.2 cm) Fatigue Resistant AC Layer
Pit Bottom
1 1/4 in. (3.2 cm) Warm Mix AC Surface Layer (Aspha-Min) 3 in. (7.6 cm) 446 Type II AC Leveling Layer
6 3/4 in. (17.1 cm) 448 Intermediate AC Layer 4 in. (10.2 cm) Fatigue Resistant AC Layer
7 in. (17.8 cm) 304 6 in. (15.2 cm) 304
6 in. (15.2 cm) 304 6 in. (15.2 cm) 304
~ 5 ft. (1.52 m) A6-A7 Subgrade
~ 5 ft. (1.52 m) A6-A7 Subgrade
12 in. (30.5 cm) Coarse Aggregate
12 in. (30.5 cm) Coarse Aggregate
Load Wheel Direction Lane
43Ohio University - Department of Civil Engineering
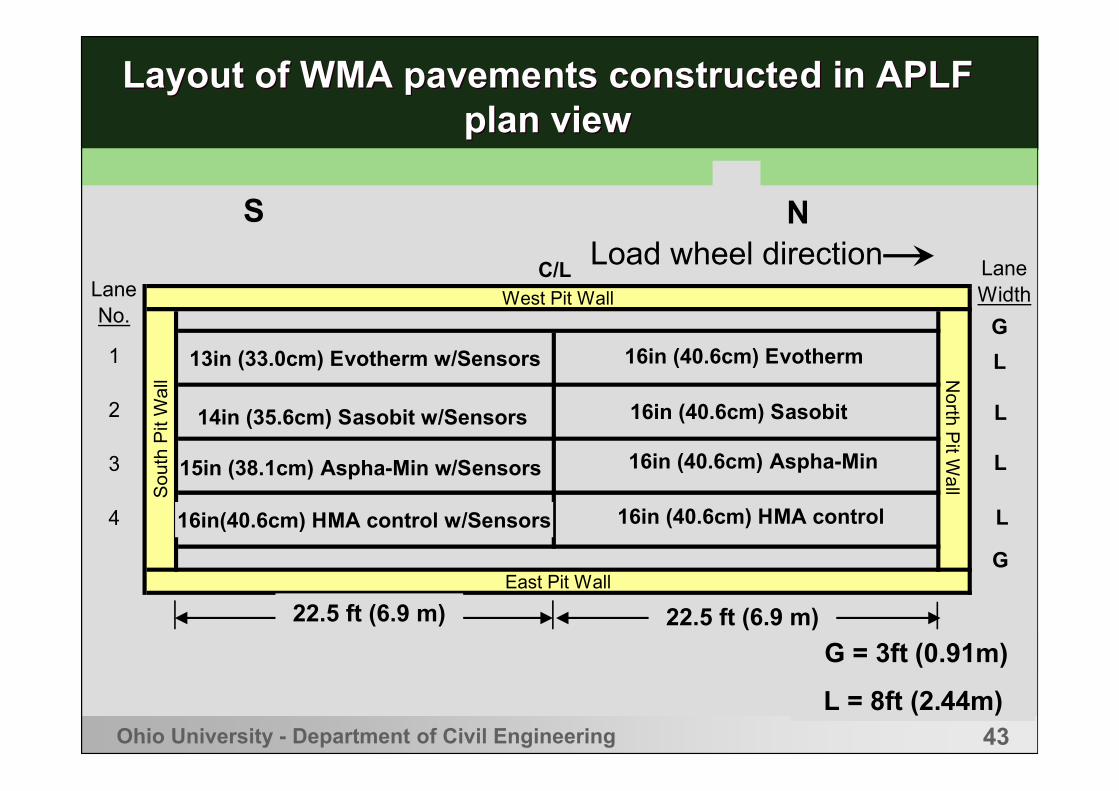
Layout of WMA pavements constructed in APLFplan view
Layout of WMA pavements constructed in APLFplan view
S NN
3'
3'
Lane No.
West Pit Wall
East Pit Wall
So
uth
Pit
Wa
ll
14" Sasobit w/Sensors 16" Sasobit
13" Evotherm w/Sensors 16" Evotherm
16" Control w/Sensors 16" Control
16" Aspha-Min15" Aspha-Min w/Sensors
1
2
3
4
8'
8'
8'
8'
Lane Width
22.5' 22.5'
North P
it Wall
C/L
22.5 ft (6.9 m) 22.5 ft (6.9 m)
G = 3ft (0.91m)
G
G
L
L
L
L
L = 8ft (2.44m)
13in (33.0cm) Evotherm w/Sensors
14in (35.6cm) Sasobit w/Sensors
15in (38.1cm) Aspha-Min w/Sensors
16in(40.6cm) HMA control w/Sensors 16in (40.6cm) HMA control
16in (40.6cm) Aspha-Min
16in (40.6cm) Sasobit
16in (40.6cm) Evotherm
Load wheel direction
44Ohio University - Department of Civil Engineering
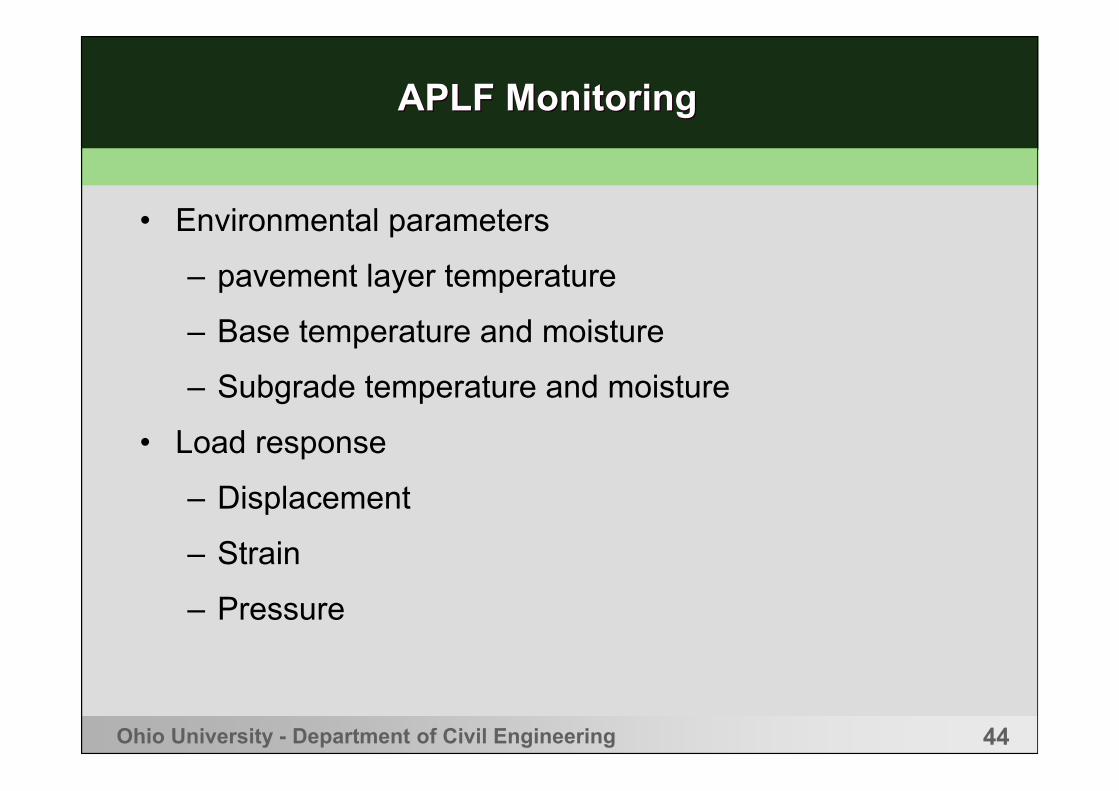
APLF MonitoringAPLF Monitoring
• Environmental parameters
– pavement layer temperature
– Base temperature and moisture
– Subgrade temperature and moisture
• Load response
– Displacement
– Strain
– Pressure
45Ohio University - Department of Civil Engineering
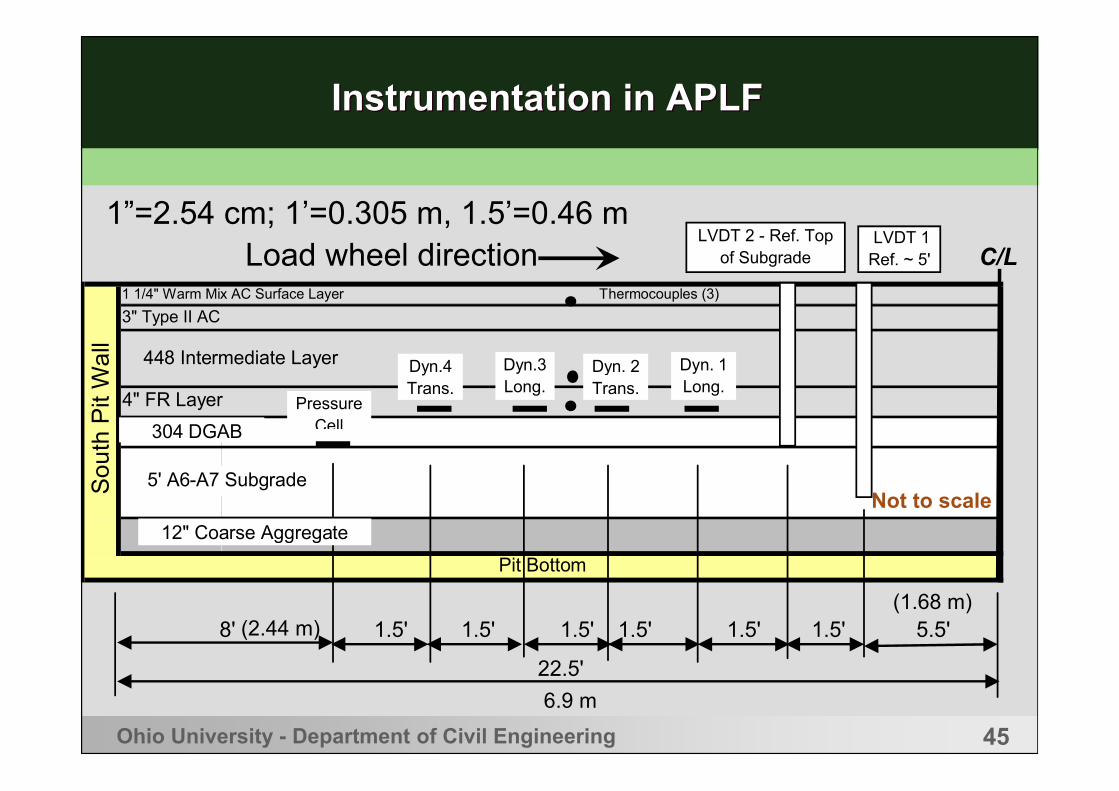
Instrumentation in APLFInstrumentation in APLF
1.5' 1.5' 1.5' 1.5' 1.5' 1.5' 5.5'
So
uth
Pit
Wa
ll
Pit Bottom
N
22.5'
8'
1 1/4" Warm Mix AC Surface Layer Thermocouples (3)
3" Type II AC
448 Intermediate Layer
4" FR Layer
C/L LVDT 1Ref. ~ 5'
LVDT 2 - Ref. Top of Subgrade
Dyn. 1 Long.
Dyn.4 Trans.
Dyn.3 Long.
Dyn. 2 Trans.
Pressure Cell
5' A6-A7 Subgrade
304 DGAB
12" Coarse Aggregate
Load wheel direction1”=2.54 cm; 1’=0.305 m, 1.5’=0.46 m
6.9 m
(2.44 m)(1.68 m)
Not to scale
46Ohio University - Department of Civil Engineering
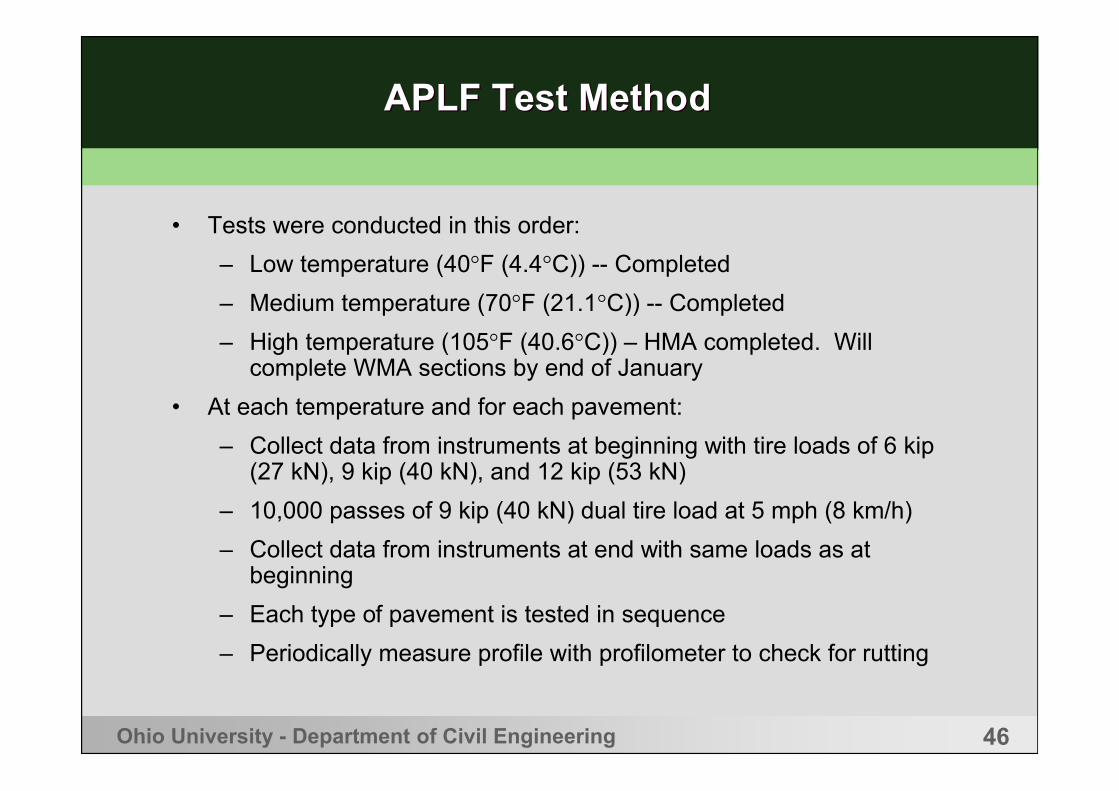
APLF Test MethodAPLF Test Method
• Tests were conducted in this order:
– Low temperature (40°F (4.4°C)) -- Completed
– Medium temperature (70°F (21.1°C)) -- Completed
– High temperature (105°F (40.6°C)) – HMA completed. Will complete WMA sections by end of January
• At each temperature and for each pavement:
– Collect data from instruments at beginning with tire loads of 6 kip (27 kN), 9 kip (40 kN), and 12 kip (53 kN)
– 10,000 passes of 9 kip (40 kN) dual tire load at 5 mph (8 km/h)
– Collect data from instruments at end with same loads as at beginning
– Each type of pavement is tested in sequence
– Periodically measure profile with profilometer to check for rutting
47Ohio University - Department of Civil Engineering
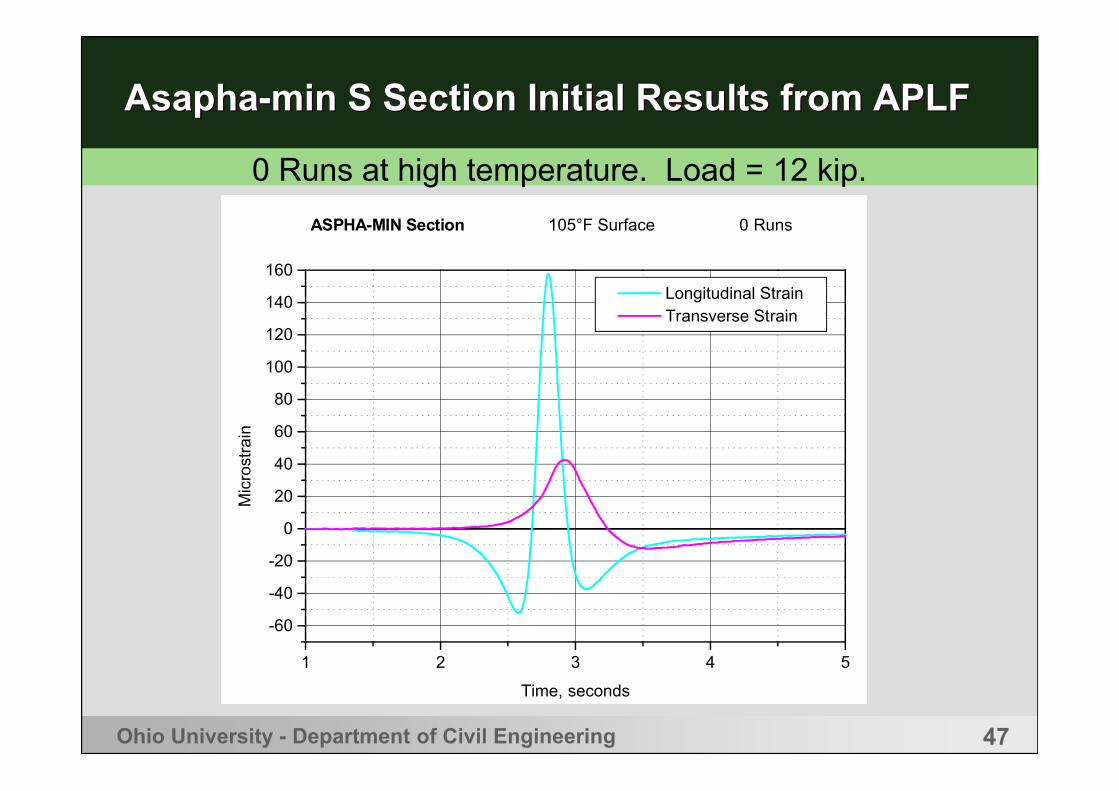
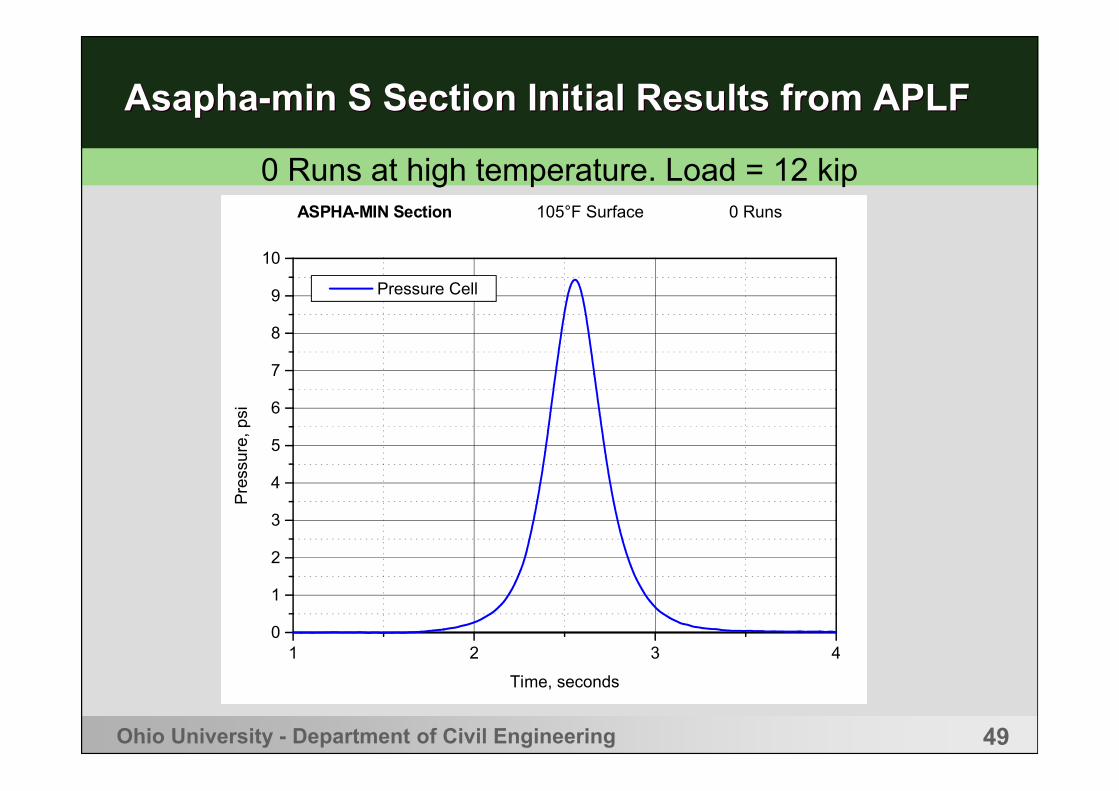
Asapha-min S Section Initial Results from APLFAsapha-min S Section Initial Results from APLF
1 2 3 4 5
-60
-40
-20
0
20
40
60
80
100
120
140
160
ASPHA-MIN Section 105°F Surface 0 Runs
Longitudinal Strain Transverse Strain
Mic
rost
rain
Time, seconds
0 Runs at high temperature. Load = 12 kip.
48Ohio University - Department of Civil Engineering
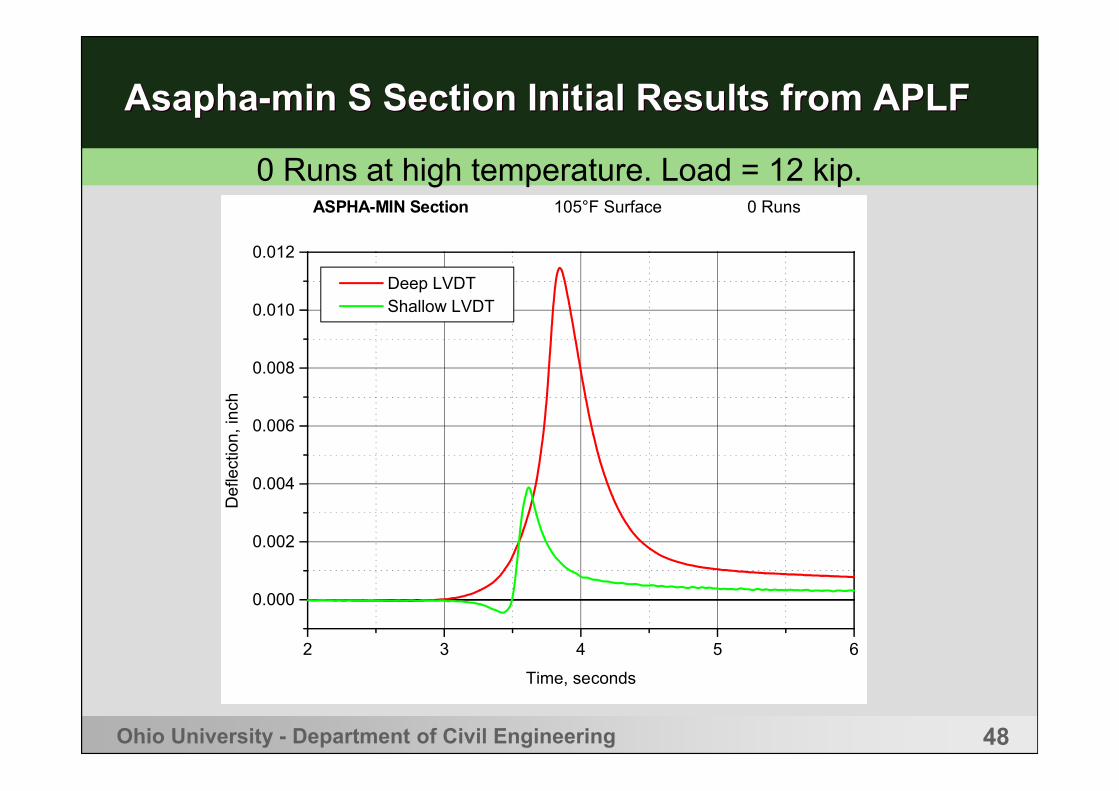
Asapha-min S Section Initial Results from APLFAsapha-min S Section Initial Results from APLF
2 3 4 5 6
0.000
0.002
0.004
0.006
0.008
0.010
0.012
ASPHA-MIN Section 105°F Surface 0 Runs
Deep LVDT Shallow LVDT
Def
lect
ion,
inch
Time, seconds
0 Runs at high temperature. Load = 12 kip.
49Ohio University - Department of Civil Engineering
Asapha-min S Section Initial Results from APLFAsapha-min S Section Initial Results from APLF
0 Runs at high temperature. Load = 12 kip
1 2 3 40
1
2
3
4
5
6
7
8
9
10
ASPHA-MIN Section 105°F Surface 0 Runs
Pressure Cell
Pre
ssu
re,
psi
Time, seconds

50Ohio University - Department of Civil Engineering
FWD Strain Response Longitudinal strain in FRL
FWD Strain Response Longitudinal strain in FRL
FWD Testing, DYN 03 Response82 MPa (12 kips), South Sasobit
0
10
20
30
40
50
60
24 24.5 25 25.5 26 26.5Time (Sec)
Mic
ro S
trai
n
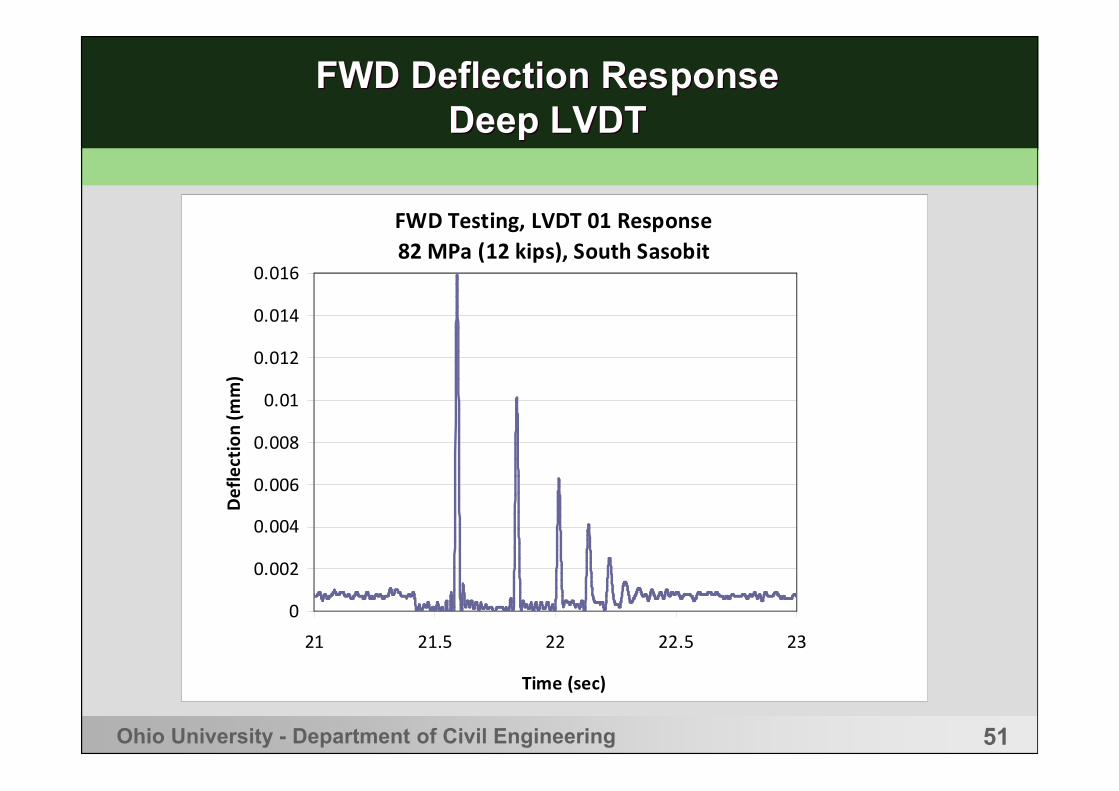
51Ohio University - Department of Civil Engineering
FWD Deflection ResponseDeep LVDT
FWD Deflection ResponseDeep LVDT
FWD Testing, LVDT 01 Response82 MPa (12 kips), South Sasobit
0
0.002
0.004
0.006
0.008
0.01
0.012
0.014
0.016
21 21.5 22 22.5 23
Time (sec)
Def
lect
ion
(mm
)
52Ohio University - Department of Civil Engineering
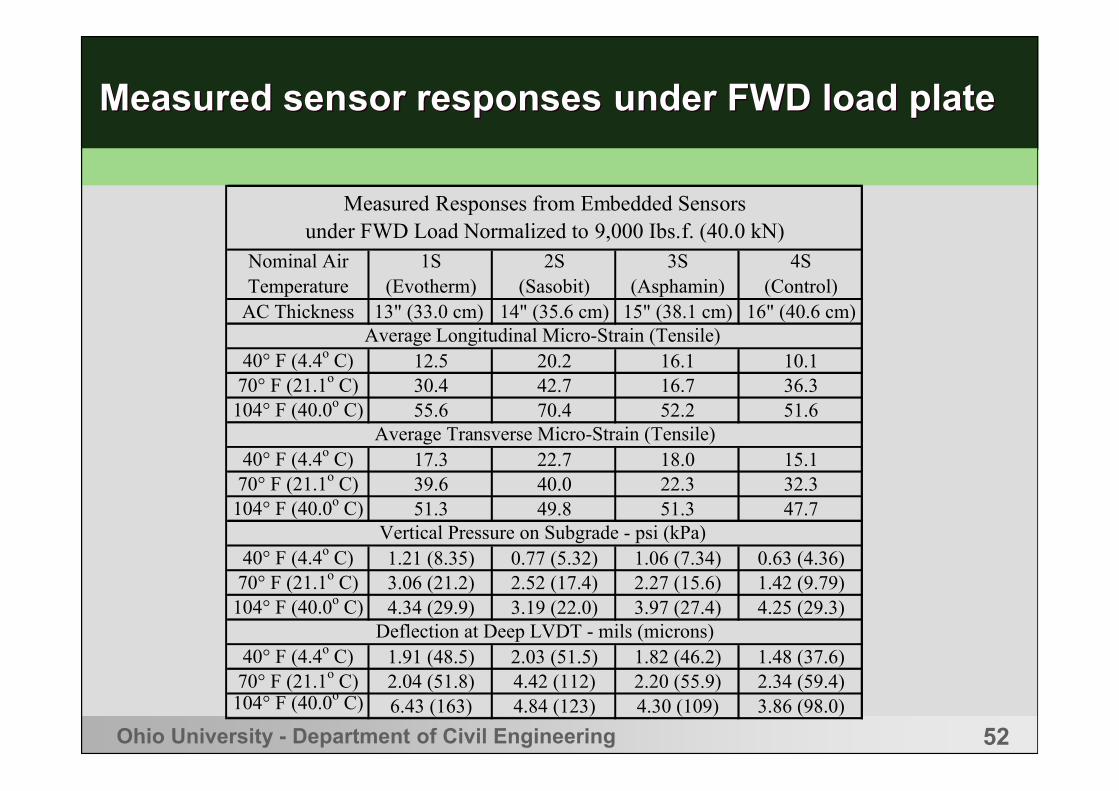
Measured sensor responses under FWD load plateMeasured sensor responses under FWD load plate
AC Thickness 13" (33.0 cm) 14" (35.6 cm) 15" (38.1 cm) 16" (40.6 cm)
40° F (4.4o C) 12.5 20.2 16.1 10.170° F (21.1o C) 30.4 42.7 16.7 36.3
104° F (40.0o C) 55.6 70.4 52.2 51.6
40° F (4.4o C) 17.3 22.7 18.0 15.170° F (21.1o C) 39.6 40.0 22.3 32.3
104° F (40.0o C) 51.3 49.8 51.3 47.7
40° F (4.4o C) 1.21 (8.35) 0.77 (5.32) 1.06 (7.34) 0.63 (4.36)70° F (21.1o C) 3.06 (21.2) 2.52 (17.4) 2.27 (15.6) 1.42 (9.79)
104° F (40.0o C) 4.34 (29.9) 3.19 (22.0) 3.97 (27.4) 4.25 (29.3)
40° F (4.4o C) 1.91 (48.5) 2.03 (51.5) 1.82 (46.2) 1.48 (37.6)70° F (21.1o C) 2.04 (51.8) 4.42 (112) 2.20 (55.9) 2.34 (59.4)
104° F (40.0o C) 6.43 (163) 4.84 (123) 4.30 (109) 3.86 (98.0)
Measured Responses from Embedded Sensors under FWD Load Normalized to 9,000 Ibs.f. (40.0 kN)
Nominal Air Temperature
1S (Evotherm)
2S (Sasobit)
3S (Asphamin)
4S (Control)
Average Longitudinal Micro-Strain (Tensile)
Average Transverse Micro-Strain (Tensile)
Vertical Pressure on Subgrade - psi (kPa)
Deflection at Deep LVDT - mils (microns)
53Ohio University - Department of Civil Engineering
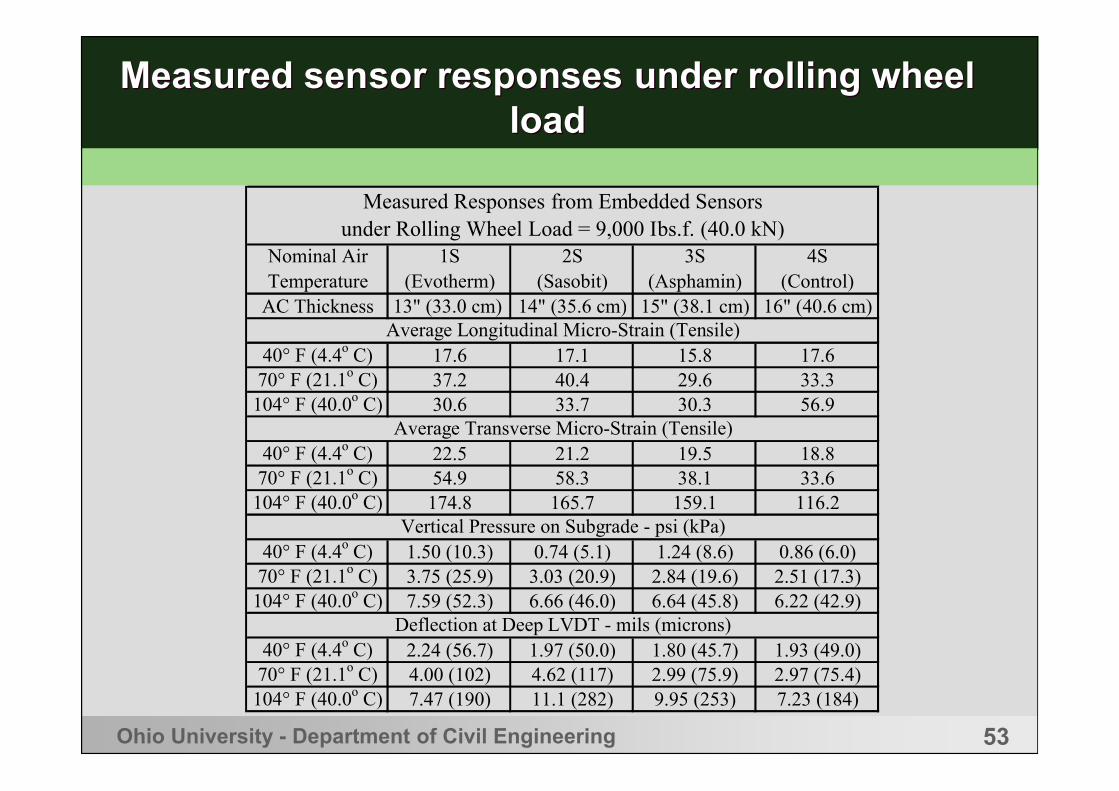
Measured sensor responses under rolling wheel load
Measured sensor responses under rolling wheel load
AC Thickness 13" (33.0 cm) 14" (35.6 cm) 15" (38.1 cm) 16" (40.6 cm)
40° F (4.4o C) 17.6 17.1 15.8 17.670° F (21.1o C) 37.2 40.4 29.6 33.3
104° F (40.0o C) 30.6 33.7 30.3 56.9
40° F (4.4o C) 22.5 21.2 19.5 18.870° F (21.1o C) 54.9 58.3 38.1 33.6
104° F (40.0o C) 174.8 165.7 159.1 116.2
40° F (4.4o C) 1.50 (10.3) 0.74 (5.1) 1.24 (8.6) 0.86 (6.0)70° F (21.1o C) 3.75 (25.9) 3.03 (20.9) 2.84 (19.6) 2.51 (17.3)
104° F (40.0o C) 7.59 (52.3) 6.66 (46.0) 6.64 (45.8) 6.22 (42.9)
40° F (4.4o C) 2.24 (56.7) 1.97 (50.0) 1.80 (45.7) 1.93 (49.0)70° F (21.1o C) 4.00 (102) 4.62 (117) 2.99 (75.9) 2.97 (75.4)
104° F (40.0o C) 7.47 (190) 11.1 (282) 9.95 (253) 7.23 (184)
Measured Responses from Embedded Sensors under Rolling Wheel Load = 9,000 Ibs.f. (40.0 kN)
Vertical Pressure on Subgrade - psi (kPa)
Nominal Air Temperature
1S (Evotherm)
2S (Sasobit)
3S (Asphamin)
4S (Control)
Average Longitudinal Micro-Strain (Tensile)
Average Transverse Micro-Strain (Tensile)
Deflection at Deep LVDT - mils (microns)
54Ohio University - Department of Civil Engineering
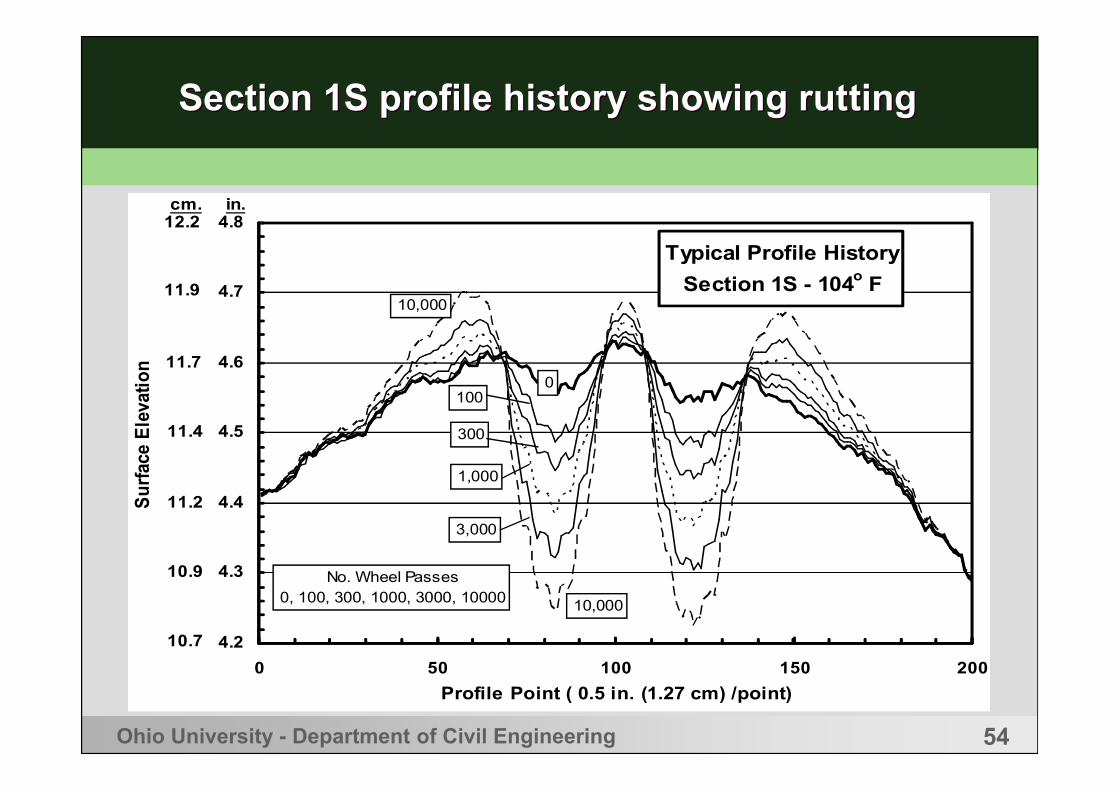
Section 1S profile history showing rutting Section 1S profile history showing rutting
Typical Profile History
Section 1S - 104o F
4.2
4.3
4.4
4.5
4.6
4.7
4.8
0 50 100 150 200
Profile Point ( 0.5 in. (1.27 cm) /point)
Sur
face
Ele
vatio
n
cm. in.
11.9
11.7
11.4
11.2
10.9
10.7
12.2
10,000
0
1,000
3,000
10,000
100
300
No. Wheel Passes0, 100, 300, 1000, 3000, 10000
55Ohio University - Department of Civil Engineering
WMA ConclusionsWMA Conclusions
• In this study, the main purpose of studying the different WMA sections was to determine the rutting behavior of the different mixes
• Early consolidation of warm AC mixes under rolling tires was more than the conventional mix, after which the rate of consolidation was slightly less for the warm AC mixes than that for the conventional mix. Of the three warm AC mixes, Evotherm showed more consolidation than Aspha-Min and Sasobit, which were about the same.
56Ohio University - Department of Civil Engineering
Perpetual Pavement ConclusionsPerpetual Pavement Conclusions
• The main purpose of looking at the different thicknesses of the perpetual pavement intermediate layers was to compare the strains in the FRLs.
• Reducing the thickness of the intermediate (ODOT Item 448) course from 7.75 in (19.7 cm) to as small as 4.75 in (12.1 cm) and increasing the thickness of the DGAB (ODOT Item 304) layer a corresponding amount did not significantly increase the strain at the base of the FRL.
• When examining FRL strain behavior, it should be noted that this testing was conducted with the pavement at a uniform high temperature; in the field there would typically be a temperature gradient that would moderate the effect.
57Ohio University - Department of Civil Engineering
FWD ConclusionsFWD Conclusions
• While trends of increasing response with increasing temperature and decreasing AC thickness generally prevailed under the rolling wheels, there were two major differences in responses measured with the FWD and the rolling wheels. First, transverse strains were much higher than longitudinal strains under the rolling wheels at higher temperatures, and higher than either strain under the FWD load plate. Second, the magnitudes of surface deflection and vertical pressure on the subgrade were much larger under the 5 mph (8.0 km/hr) rolling wheels than under the FWD load plate at higher temperatures. Both observations confirm that vehicles moving at creep speed induce higher responses than the FWD, which is designed to simulate vehicles traveling at normal highway speeds.

http://webce.ent.ohiou.eduhttp://webce.ent.ohiou.edu
www.ohio.edu/engineering


