
Saving Lives, Time and Resources
Pavement Design Basics
Darlene Goehl, P.E.Texas A&M Transportation Institute
2018 Transportation Short CourseOctober 16, 2018
Overview
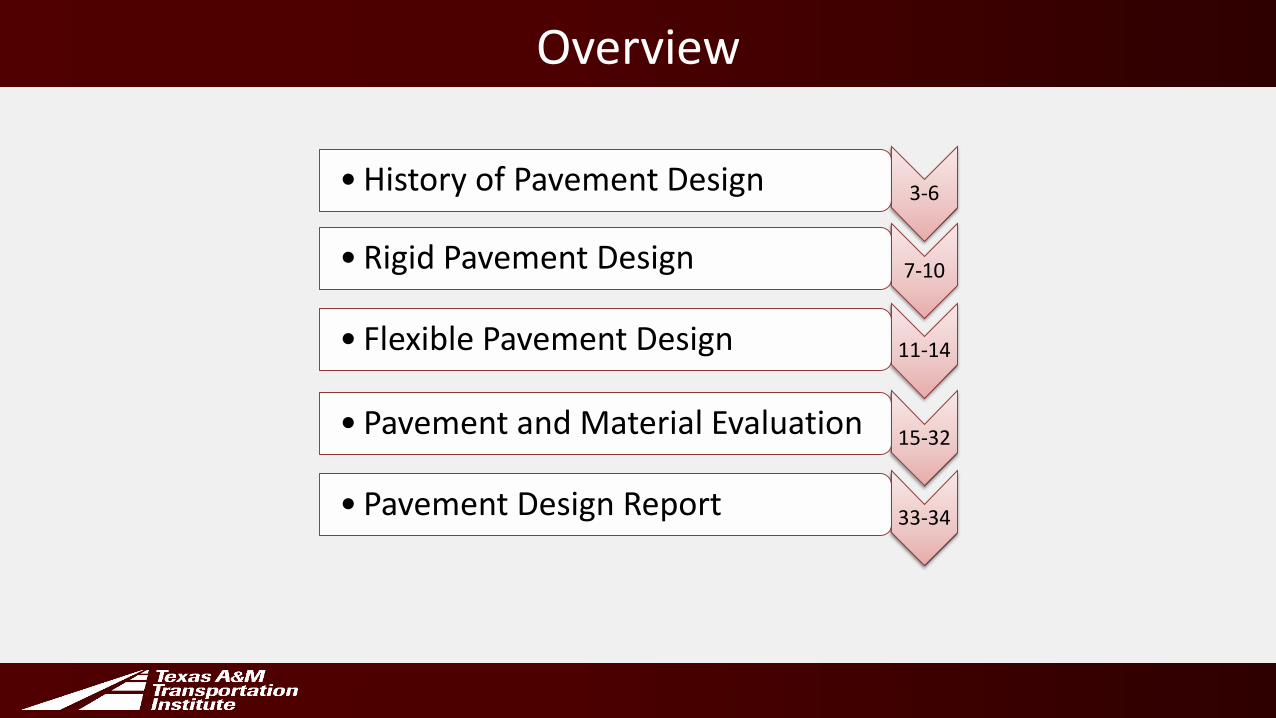
3-6• History of Pavement Design
7-10• Rigid Pavement Design
11-14• Flexible Pavement Design
15-32• Pavement and Material Evaluation
33-34• Pavement Design Report
History• TxDOT established 100+ years ago• Pavement design largely concerned with protecting the
subgrade until the end of WWII• Initiation of highway road tests following WWII• AASHO develops relationship between repetitive axle
loads and pavement damage/serviceability• AASHO Empirical design is developed based on Road Test;
formalized in early 1970’s.
History• TxDOT initializes research into developing own empirical
flexible design system early 1970s into 1980s. • FPS-19 introduced early 1990s using material moduli and
elastic layer theory• AASHTO ME design released 2006• TxME development continues . . .
Pavement• Pavement Structure. Combination of surface course and base
course placed on a subgrade to support the traffic load and distribute it to the roadbed
• The primary structural difference between a rigid and flexible pavement is the manner in which each type of pavement distributes traffic loads over the subgrade.
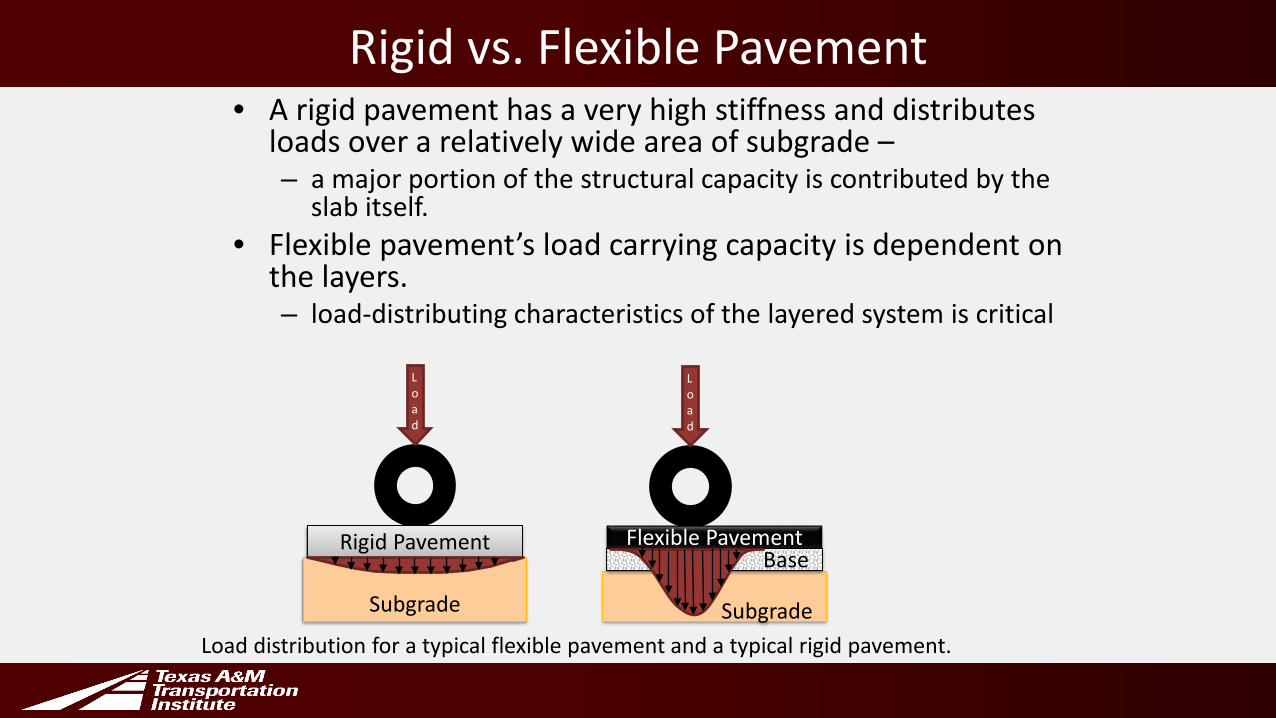
Rigid vs. Flexible Pavement• A rigid pavement has a very high stiffness and distributes
loads over a relatively wide area of subgrade –– a major portion of the structural capacity is contributed by the
slab itself.• Flexible pavement’s load carrying capacity is dependent on
the layers.– load-distributing characteristics of the layered system is critical
Load distribution for a typical flexible pavement and a typical rigid pavement.
Load
Rigid Pavement
Subgrade
Flexible Pavement
Subgrade
Load
Base
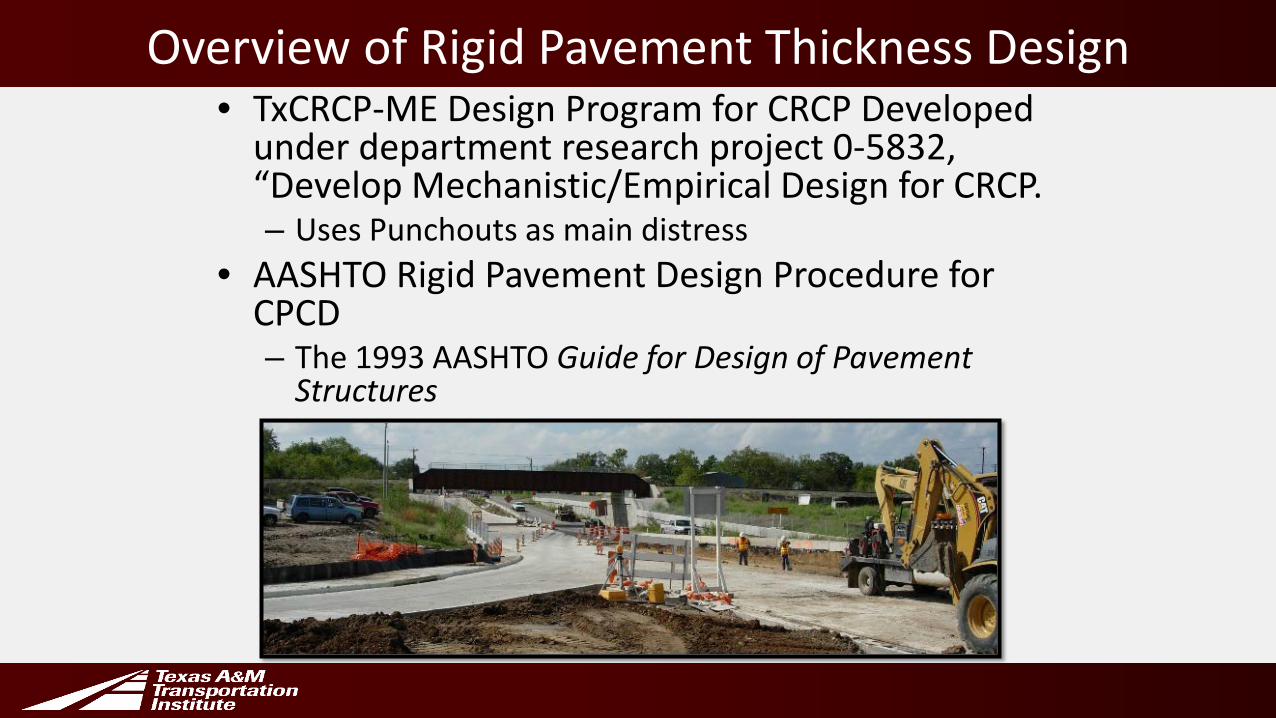
Overview of Rigid Pavement Thickness Design• TxCRCP-ME Design Program for CRCP Developed
under department research project 0-5832, “Develop Mechanistic/Empirical Design for CRCP.– Uses Punchouts as main distress
• AASHTO Rigid Pavement Design Procedure for CPCD– The 1993 AASHTO Guide for Design of Pavement
Structures
6” CTB
Subgrade
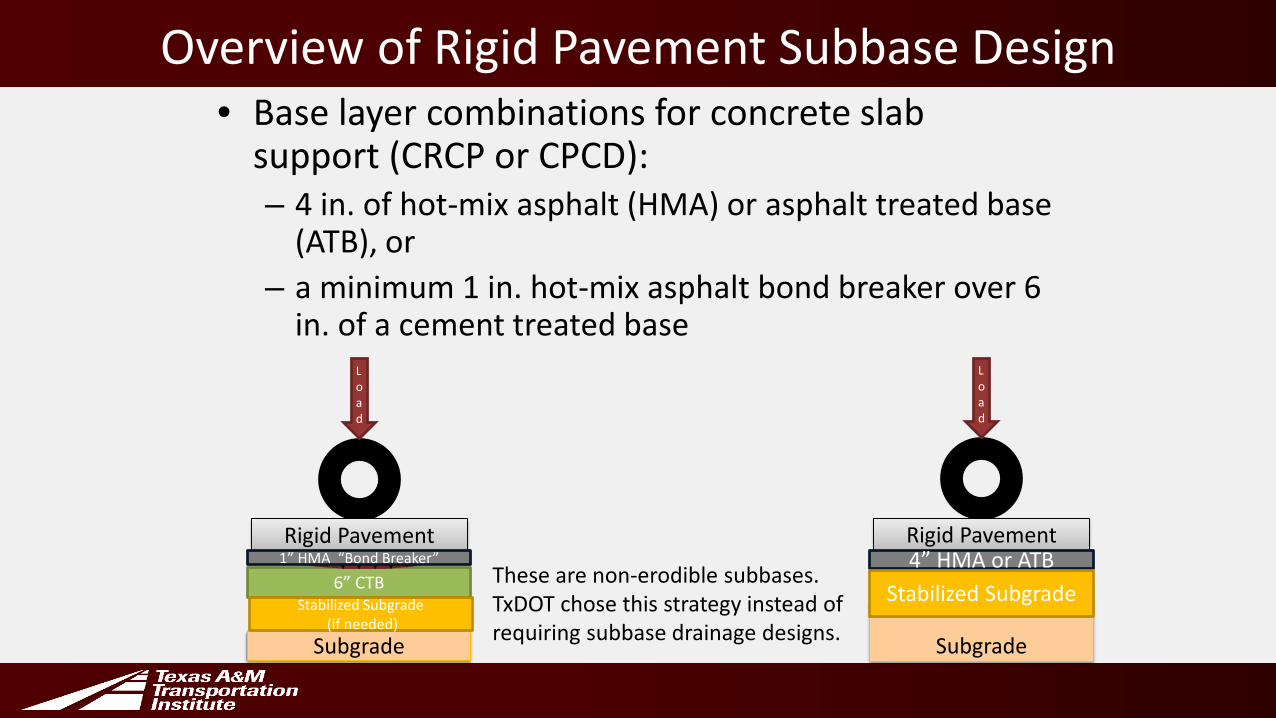
Overview of Rigid Pavement Subbase Design• Base layer combinations for concrete slab
support (CRCP or CPCD):– 4 in. of hot-mix asphalt (HMA) or asphalt treated base
(ATB), or– a minimum 1 in. hot-mix asphalt bond breaker over 6
in. of a cement treated baseLoad
Rigid Pavement
Subgrade
4” HMA or ATBStabilized Subgrade
Load
Rigid Pavement1” HMA “Bond Breaker”
Stabilized Subgrade(if needed)
These are non-erodible subbases. TxDOT chose this strategy instead of requiring subbase drainage designs.
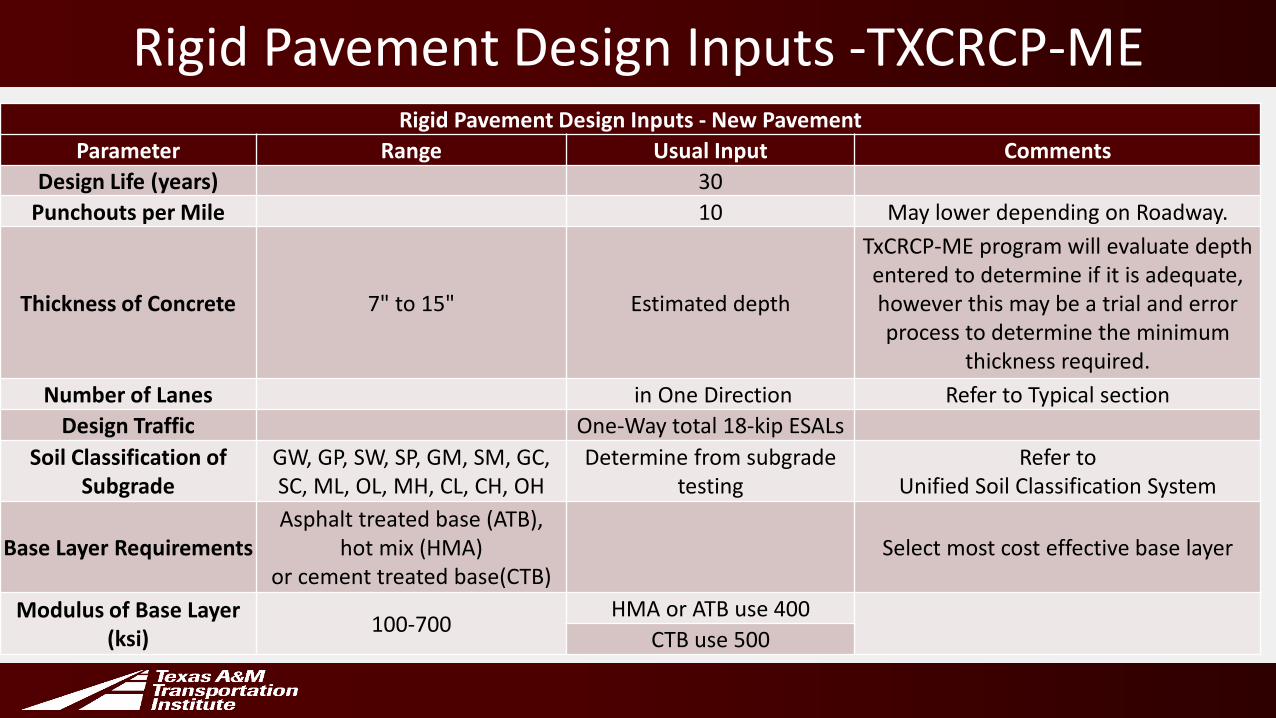
Rigid Pavement Design Inputs -TXCRCP-MERigid Pavement Design Inputs - New Pavement
Parameter Range Usual Input CommentsDesign Life (years) 30
Punchouts per Mile 10 May lower depending on Roadway.
Thickness of Concrete 7" to 15" Estimated depth
TxCRCP-ME program will evaluate depth entered to determine if it is adequate, however this may be a trial and error process to determine the minimum
thickness required.Number of Lanes in One Direction Refer to Typical section
Design Traffic One-Way total 18-kip ESALsSoil Classification of
SubgradeGW, GP, SW, SP, GM, SM, GC, SC, ML, OL, MH, CL, CH, OH
Determine from subgrade testing
Refer to Unified Soil Classification System
Base Layer RequirementsAsphalt treated base (ATB),
hot mix (HMA) or cement treated base(CTB)
Select most cost effective base layer
Modulus of Base Layer (ksi) 100-700
HMA or ATB use 400CTB use 500
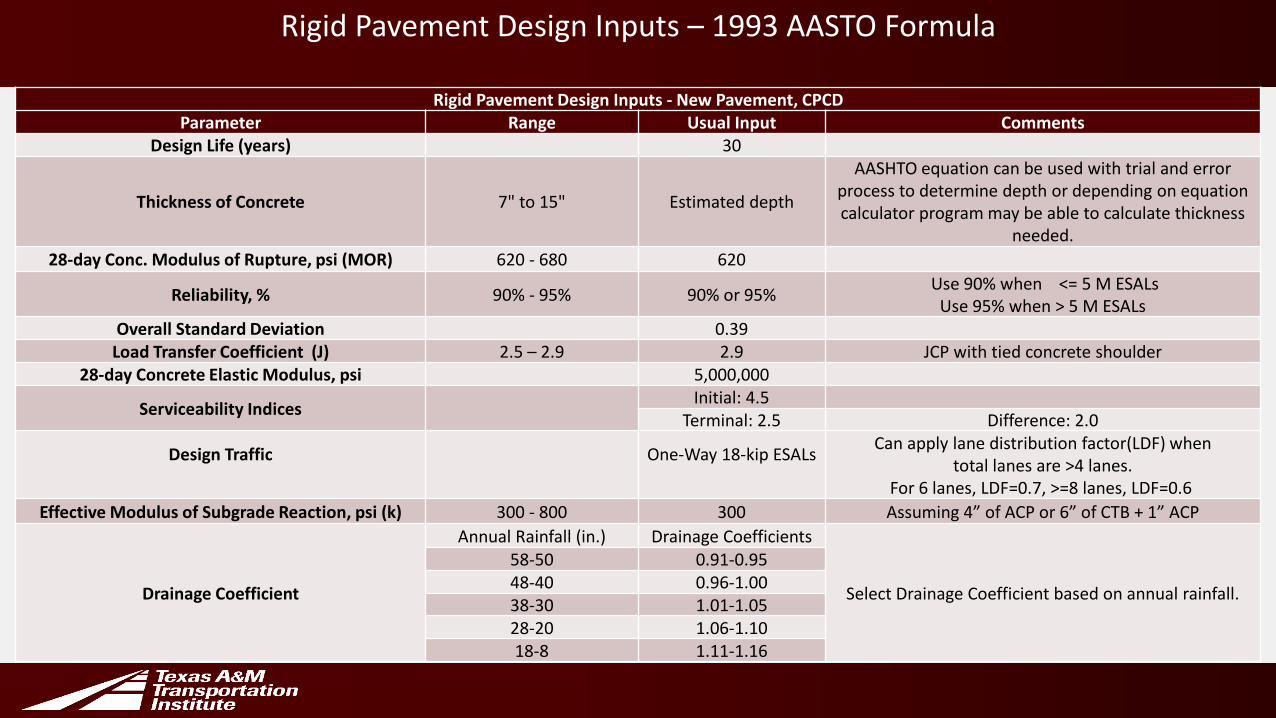
Rigid Pavement Design Inputs – 1993 AASTO Formula
Rigid Pavement Design Inputs - New Pavement, CPCDParameter Range Usual Input Comments
Design Life (years) 30
Thickness of Concrete 7" to 15" Estimated depth
AASHTO equation can be used with trial and error process to determine depth or depending on equation calculator program may be able to calculate thickness
needed.28-day Conc. Modulus of Rupture, psi (MOR) 620 - 680 620
Reliability, % 90% - 95% 90% or 95% Use 90% when <= 5 M ESALsUse 95% when > 5 M ESALs
Overall Standard Deviation 0.39Load Transfer Coefficient (J) 2.5 – 2.9 2.9 JCP with tied concrete shoulder
28-day Concrete Elastic Modulus, psi 5,000,000
Serviceability Indices Initial: 4.5Terminal: 2.5 Difference: 2.0
Design Traffic One-Way 18-kip ESALs Can apply lane distribution factor(LDF) when total lanes are >4 lanes.
For 6 lanes, LDF=0.7, >=8 lanes, LDF=0.6Effective Modulus of Subgrade Reaction, psi (k) 300 - 800 300 Assuming 4” of ACP or 6” of CTB + 1” ACP
Drainage Coefficient
Annual Rainfall (in.) Drainage Coefficients
Select Drainage Coefficient based on annual rainfall.
58-50 0.91-0.9548-40 0.96-1.0038-30 1.01-1.0528-20 1.06-1.1018-8 1.11-1.16
11
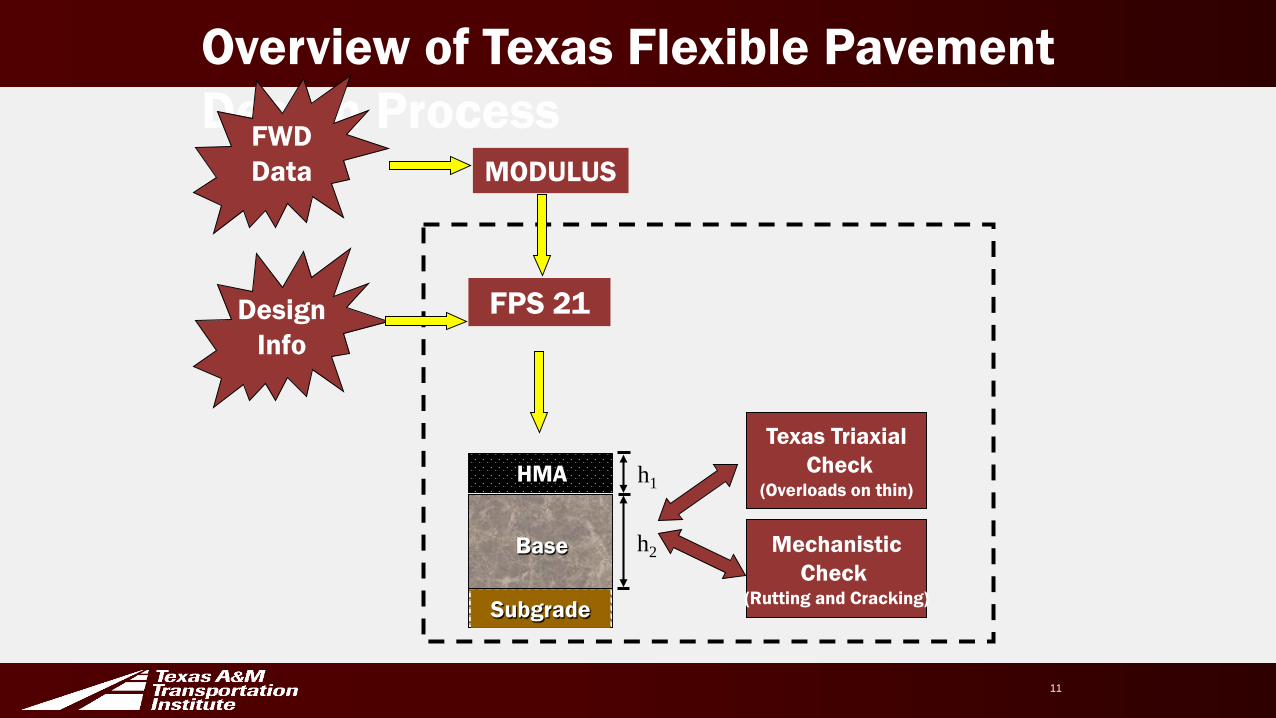
MODULUS
FPS 21Design Info
HMA
Base
Subgrade
Texas TriaxialCheck
(Overloads on thin)
MechanisticCheck
(Rutting and Cracking)
h1
h2
Overview of Texas Flexible Pavement Design ProcessFWD
Data
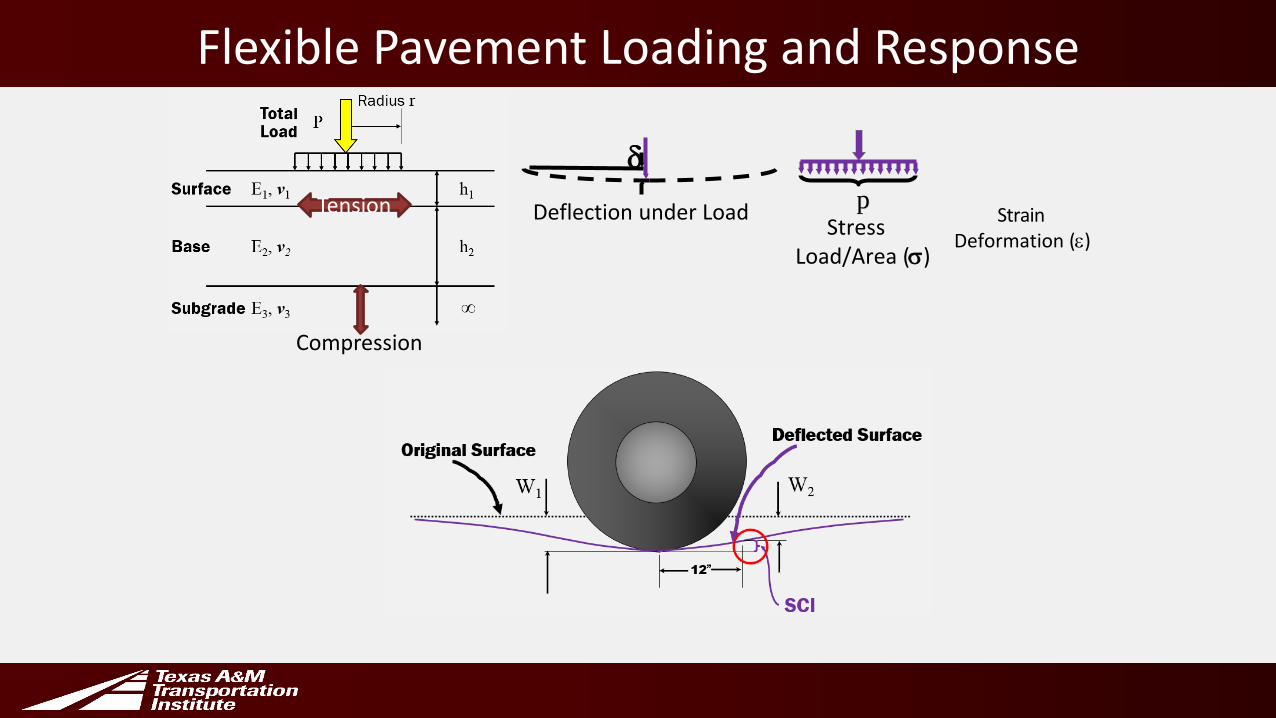
Flexible Pavement Loading and Response
δ
Deflection under Load ppStress
Load/Area (σ)
Strain Deformation (ε)
Tension
Compression
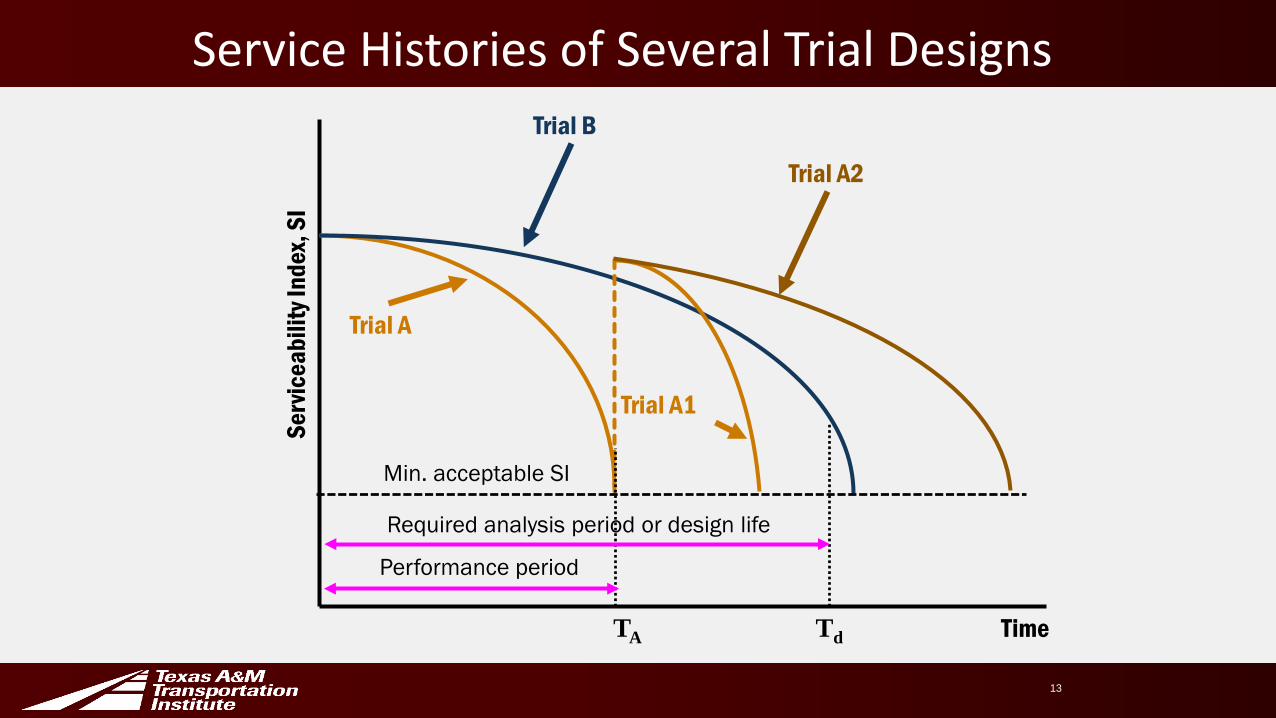
Service Histories of Several Trial Designs
13
Time
Serv
icea
bilit
y Ind
ex, S
I
Min. acceptable SI
Trial A
Trial B
Trial A1
Trial A2
TA Td
Required analysis period or design life
Performance period
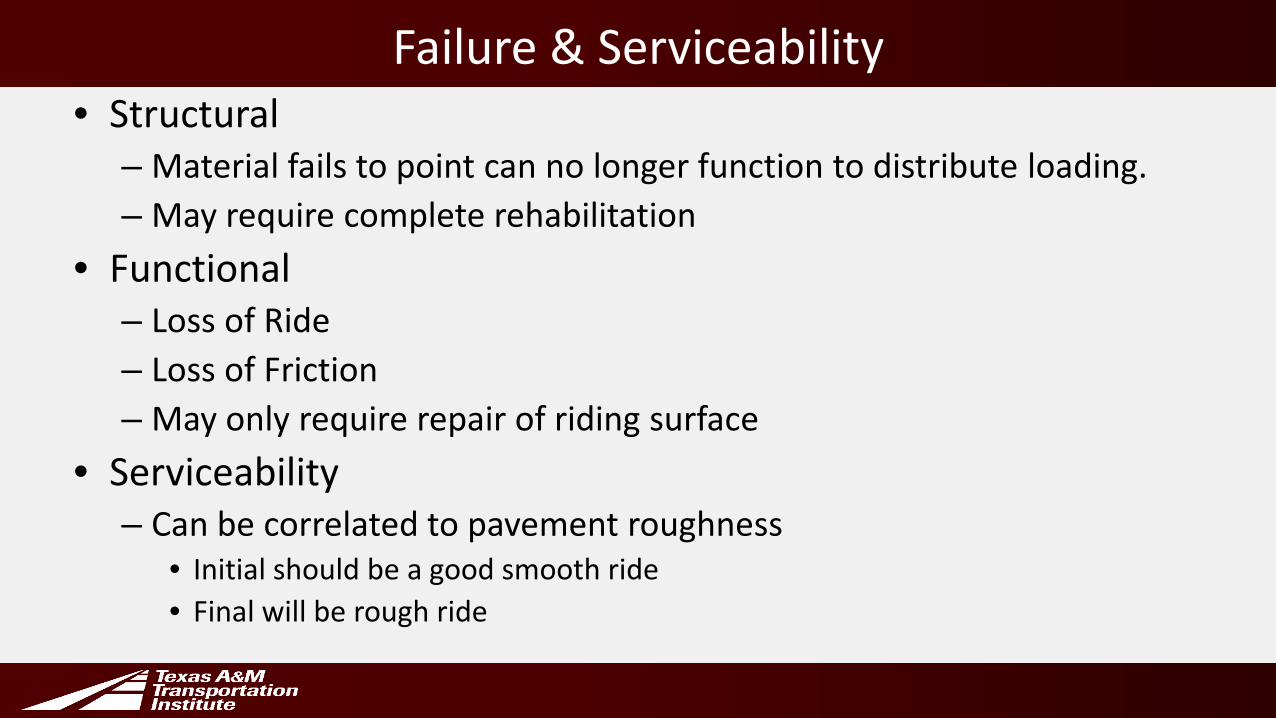
Failure & Serviceability • Structural
– Material fails to point can no longer function to distribute loading.– May require complete rehabilitation
• Functional– Loss of Ride– Loss of Friction– May only require repair of riding surface
• Serviceability– Can be correlated to pavement roughness
• Initial should be a good smooth ride• Final will be rough ride

Available Pavement Evaluation Tools
1
• FWD structural strength, including subgrade
• GPR thickness variability; identify major problem areas; sampling locations
• DCP in-site strengths of lower layers• TPAD structural strength of concrete
pavement, weak subgrades, poor load transfer
• LIDAR ditch depth; horizontal and longitudinal slopes; drainage evaluations
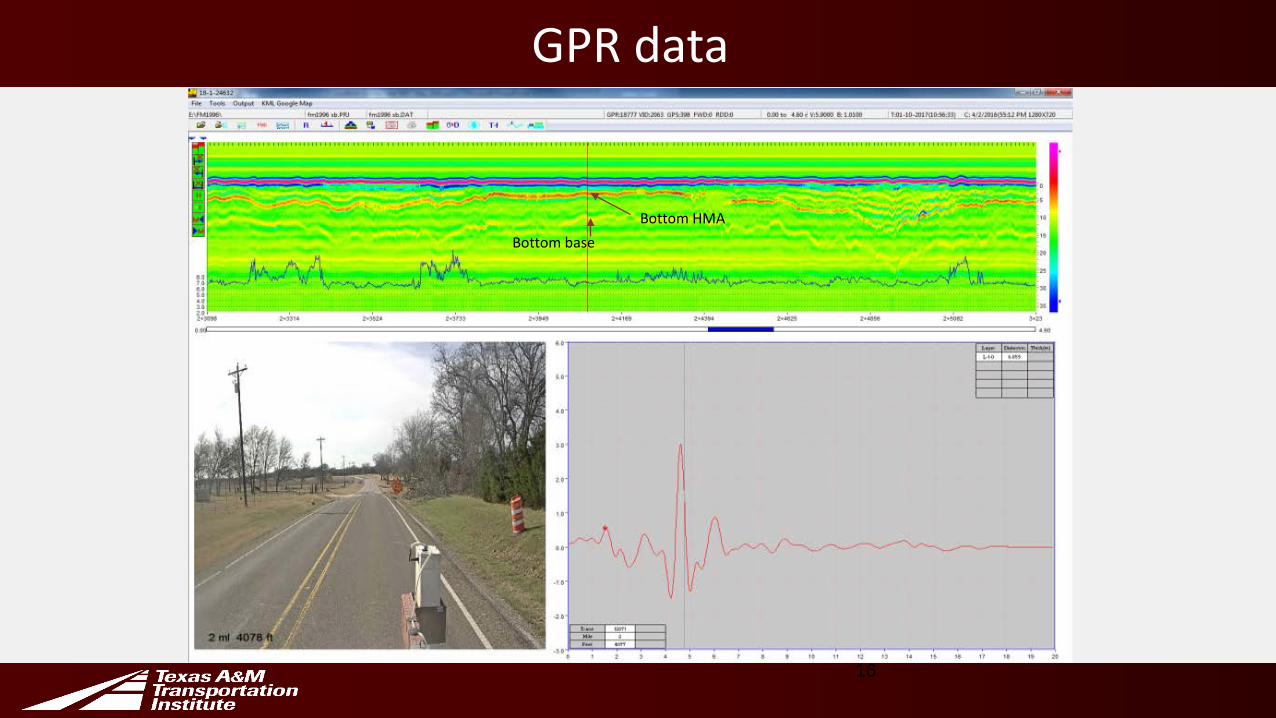
GPR data
16
Bottom HMABottom base
1
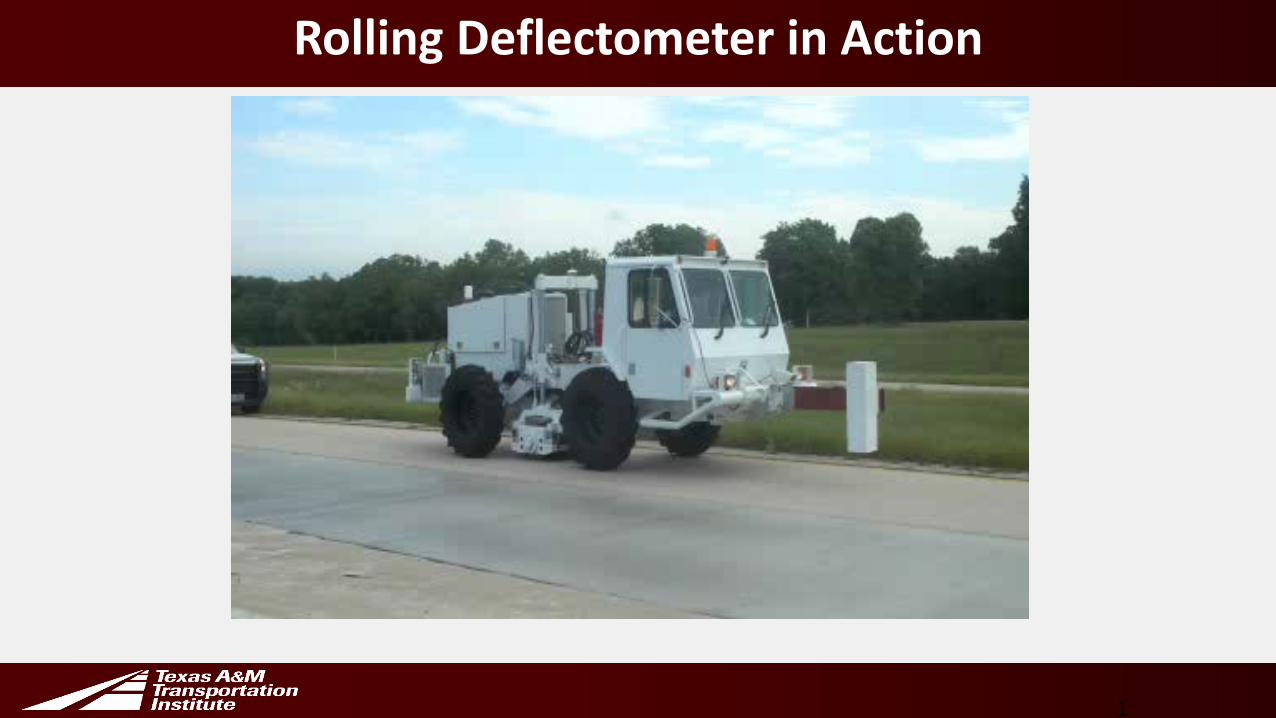
Rolling Deflectometer in Action
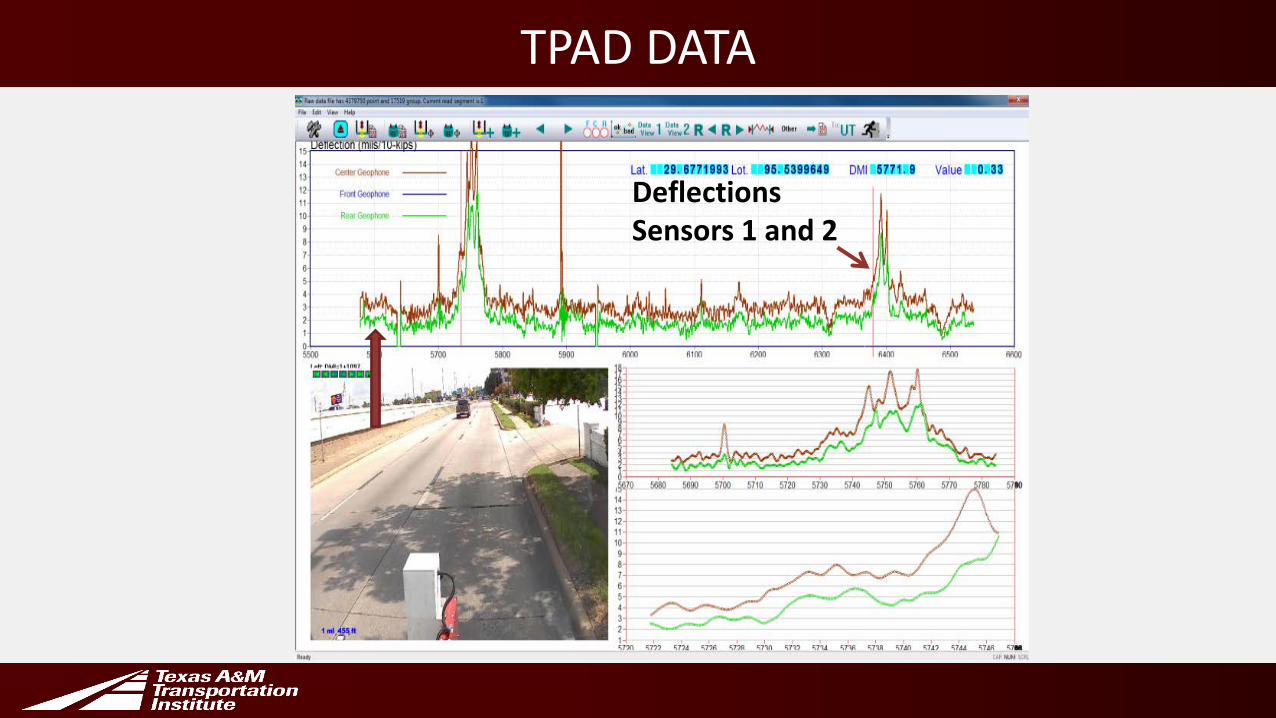
TPAD DATA
Deflections Sensors 1 and 2
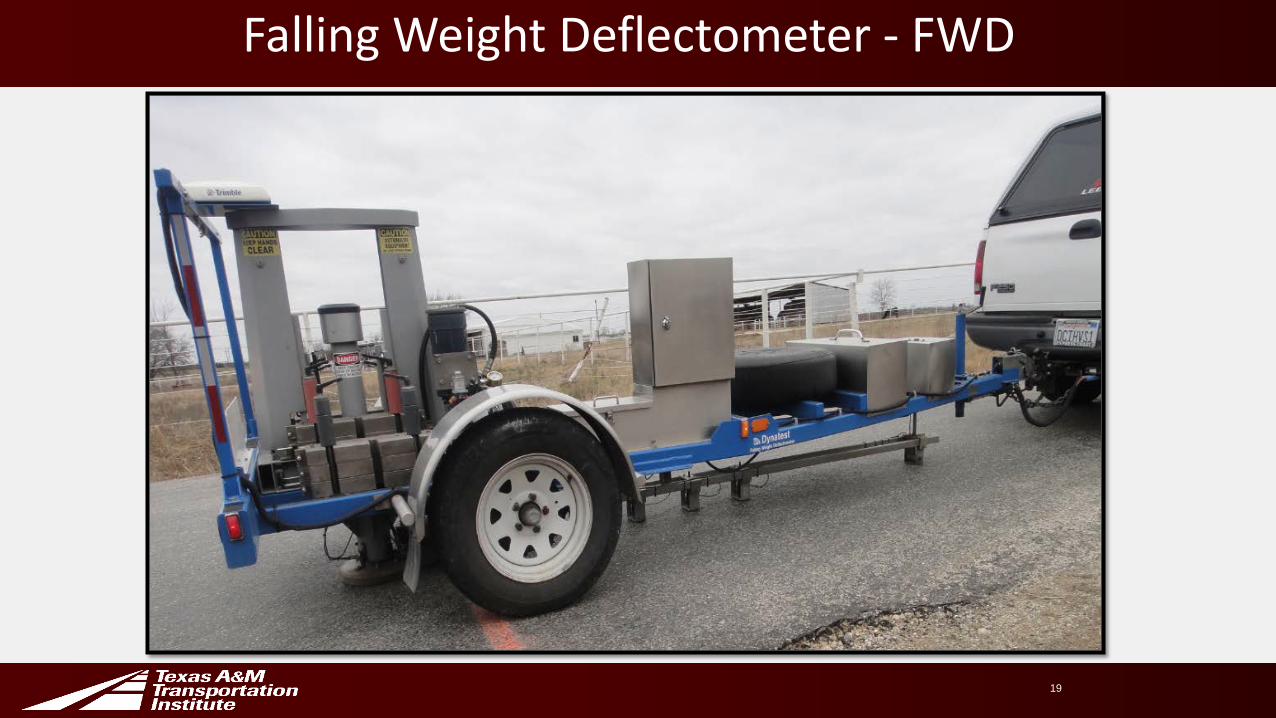
Falling Weight Deflectometer - FWD
19
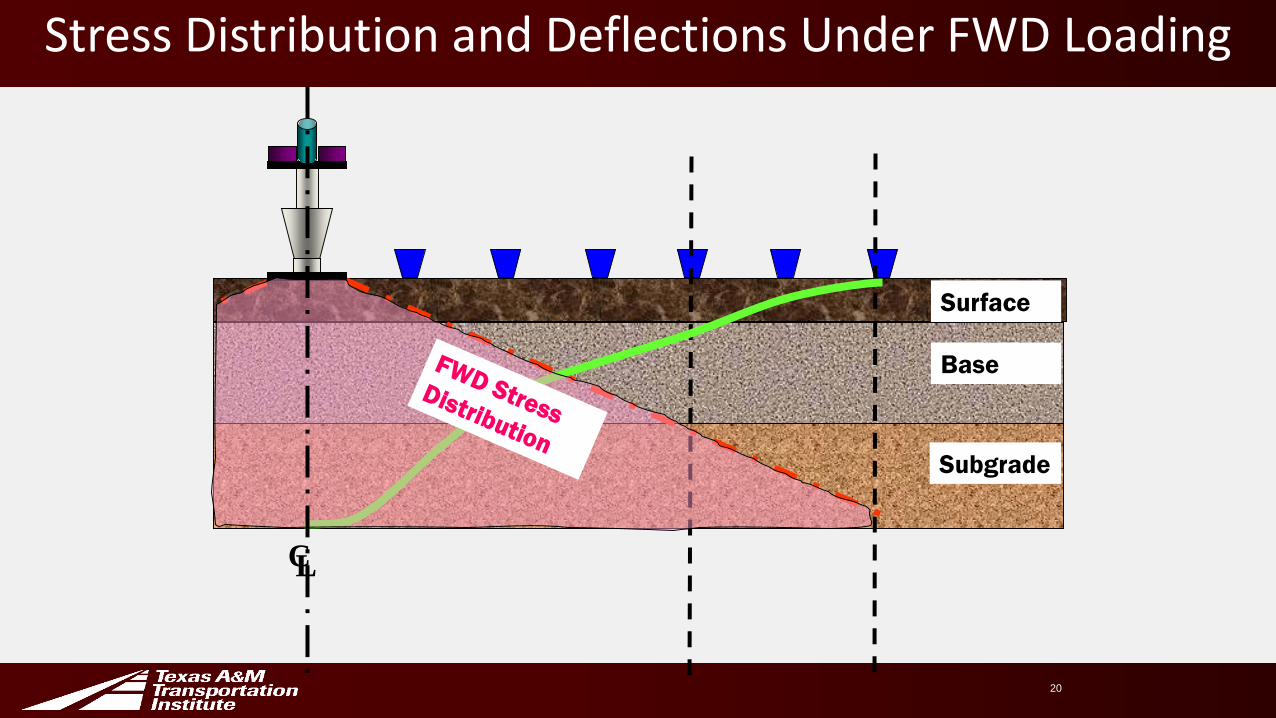
Stress Distribution and Deflections Under FWD Loading
20
CL
Surface
Base
Subgrade
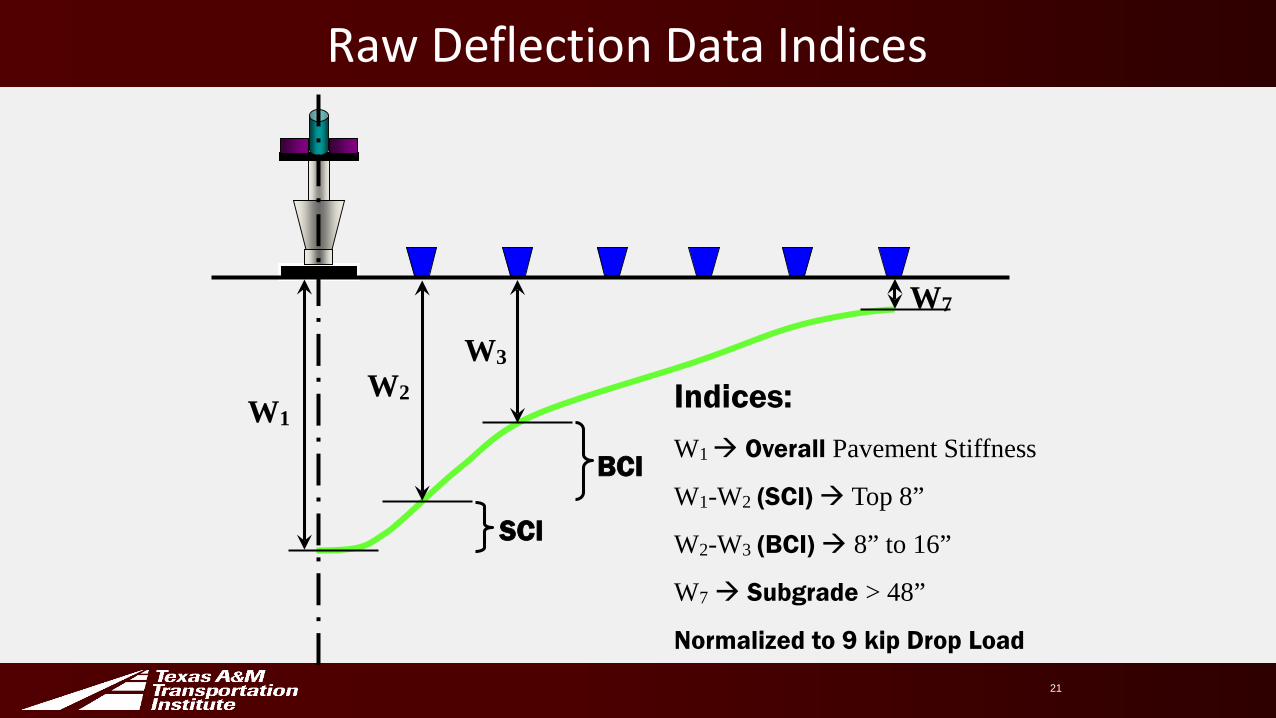
Raw Deflection Data Indices
21
W1W2
W3
W7
SCI
BCI
Indices:W1 Overall Pavement Stiffness
W1-W2 (SCI) Top 8”
W2-W3 (BCI) 8” to 16”
W7 Subgrade > 48”
Normalized to 9 kip Drop Load
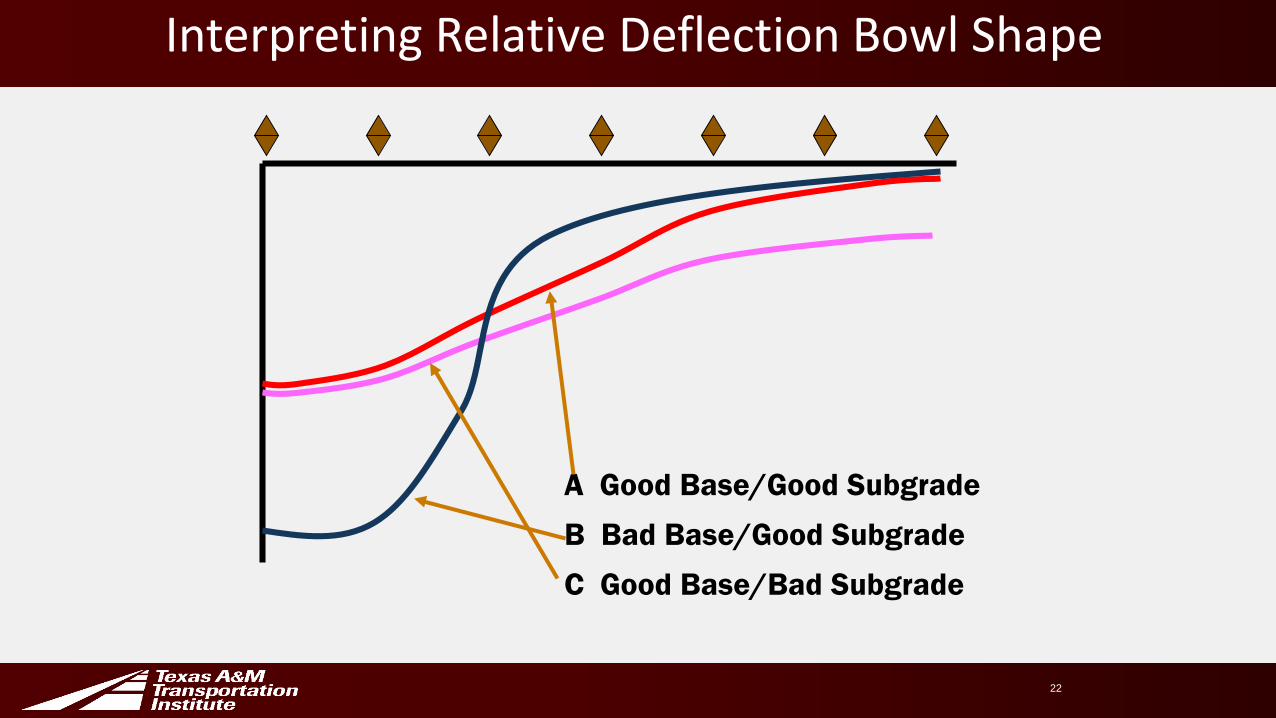
Interpreting Relative Deflection Bowl Shape
22
A Good Base/Good SubgradeB Bad Base/Good SubgradeC Good Base/Bad Subgrade
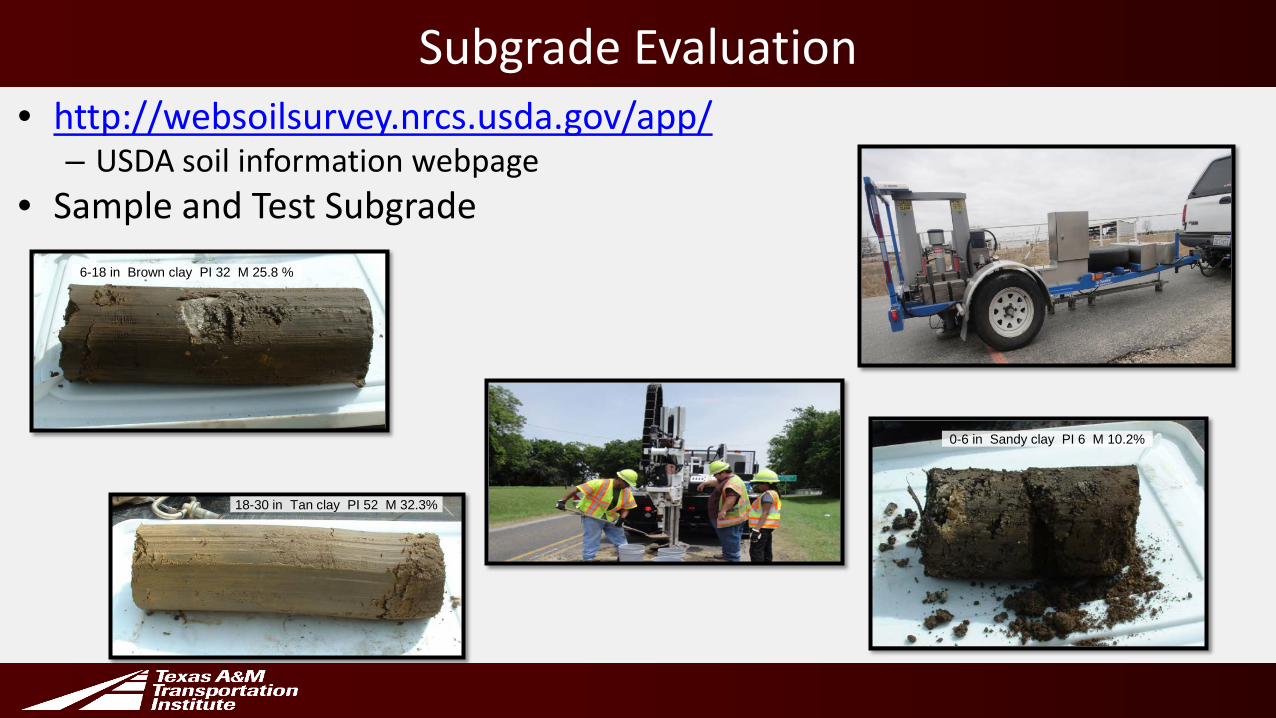
Subgrade Evaluation• http://websoilsurvey.nrcs.usda.gov/app/
– USDA soil information webpage• Sample and Test Subgrade
0-6 in Sandy clay PI 6 M 10.2%
6-18 in Brown clay PI 32 M 25.8 %
18-30 in Tan clay PI 52 M 32.3%
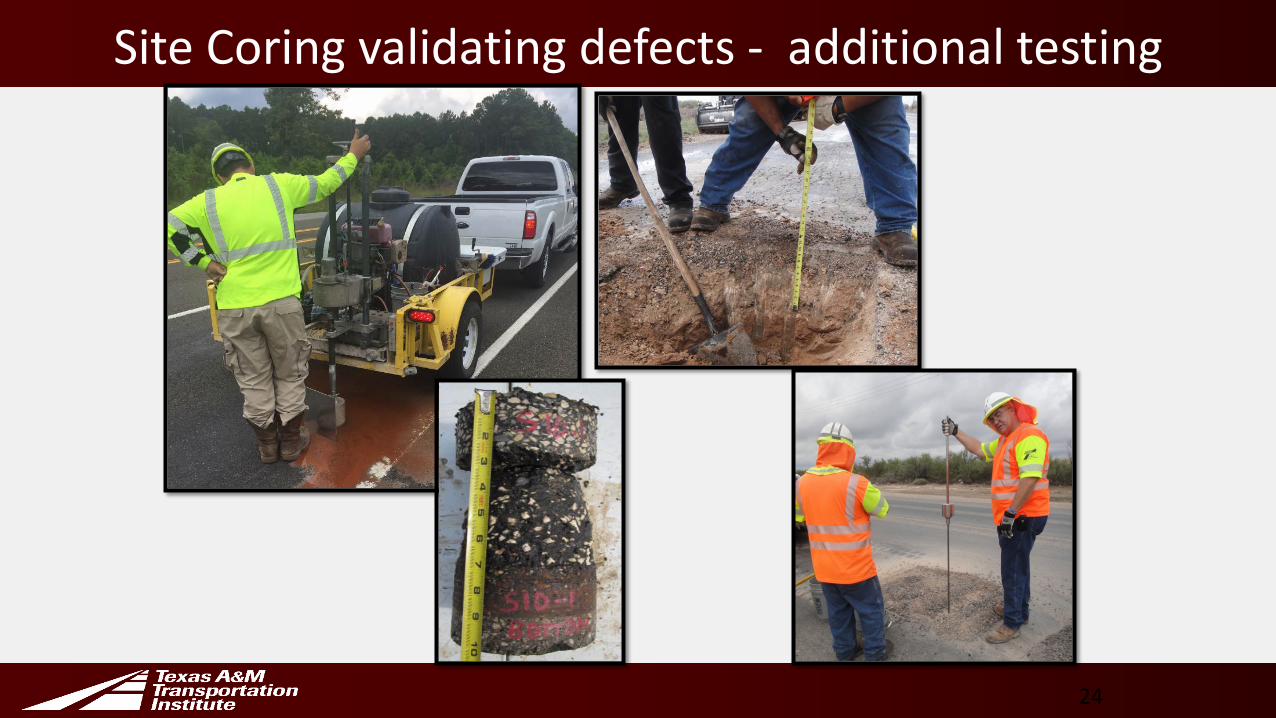
Site Coring validating defects - additional testing
24
Subgrade and Existing Pavement Layers • FPS
• Priority should be to use the project-specific backcalculated subgrade modulus. • Defaults by county are available in the FPS design program. • Typical Design Modulus range is 8-20 ksi.• Typical Poisson’s Ratio range is 0.35-0.45
• Wetter or more highly plastic materials warrant higher Poisson ratios.
• New location construction • deflection testing on an adjacent highway, or • intersecting highways can provide data for backcalculation. • Alternatively, elastic modulus correlations to field or laboratory derived CBR or the program default
may be used.
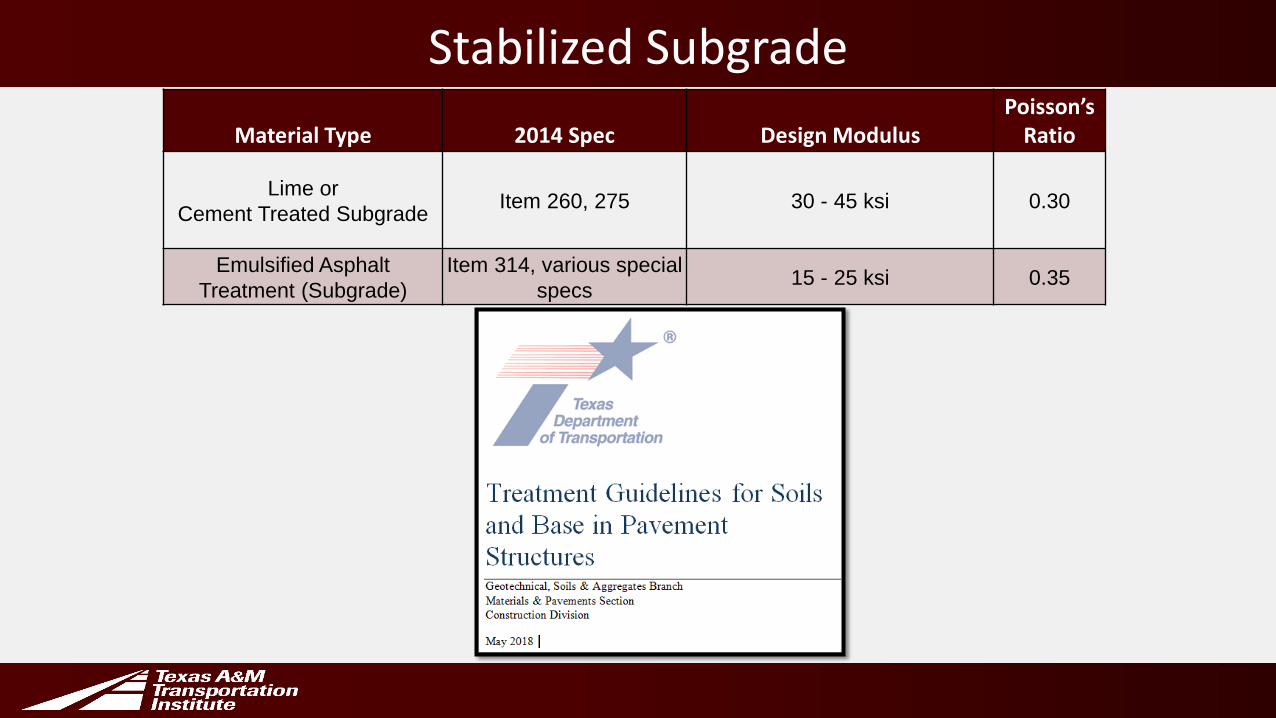
Stabilized SubgradeMaterial Type 2014 Spec Design Modulus
Poisson’s Ratio
Lime or Cement Treated Subgrade Item 260, 275 30 - 45 ksi 0.30
Emulsified Asphalt Treatment (Subgrade)
Item 314, various special specs 15 - 25 ksi 0.35
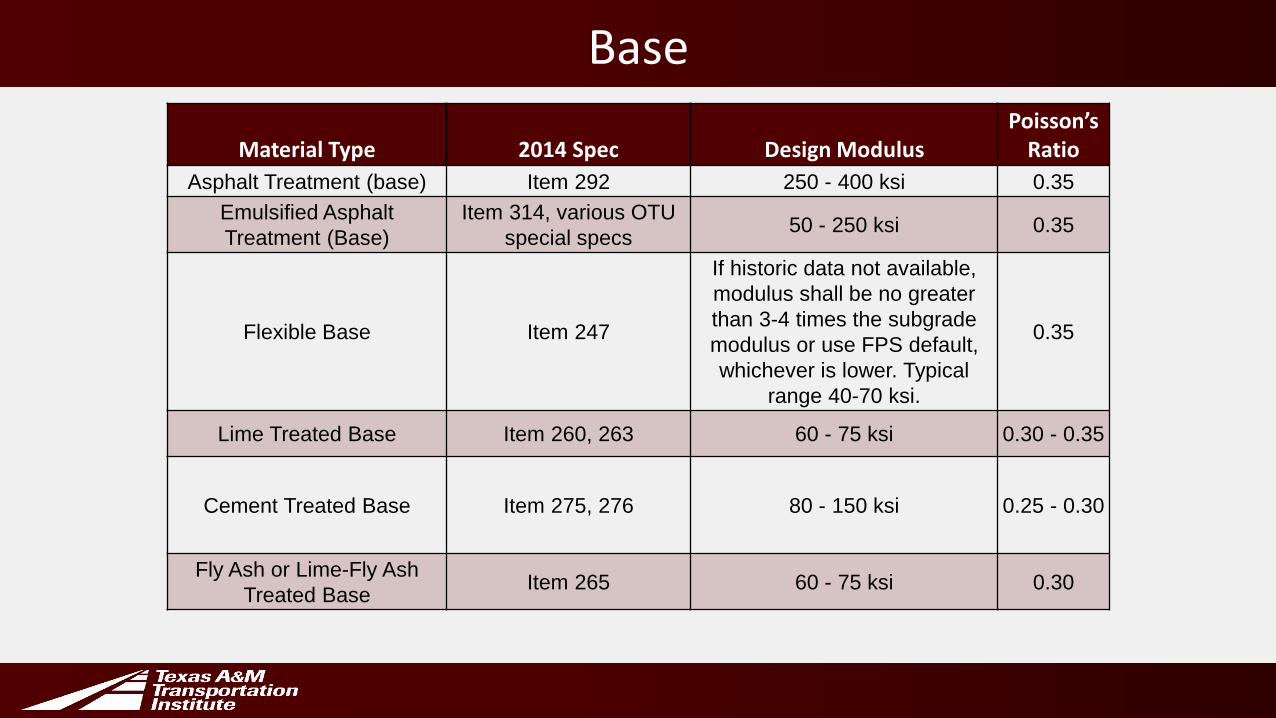
Base
Material Type 2014 Spec Design ModulusPoisson’s
RatioAsphalt Treatment (base) Item 292 250 - 400 ksi 0.35
Emulsified Asphalt Treatment (Base)
Item 314, various OTU special specs 50 - 250 ksi 0.35
Flexible Base Item 247
If historic data not available, modulus shall be no greater than 3-4 times the subgrade modulus or use FPS default, whichever is lower. Typical
range 40-70 ksi.
0.35
Lime Treated Base Item 260, 263 60 - 75 ksi 0.30 - 0.35
Cement Treated Base Item 275, 276 80 - 150 ksi 0.25 - 0.30
Fly Ash or Lime-Fly Ash Treated Base Item 265 60 - 75 ksi 0.30
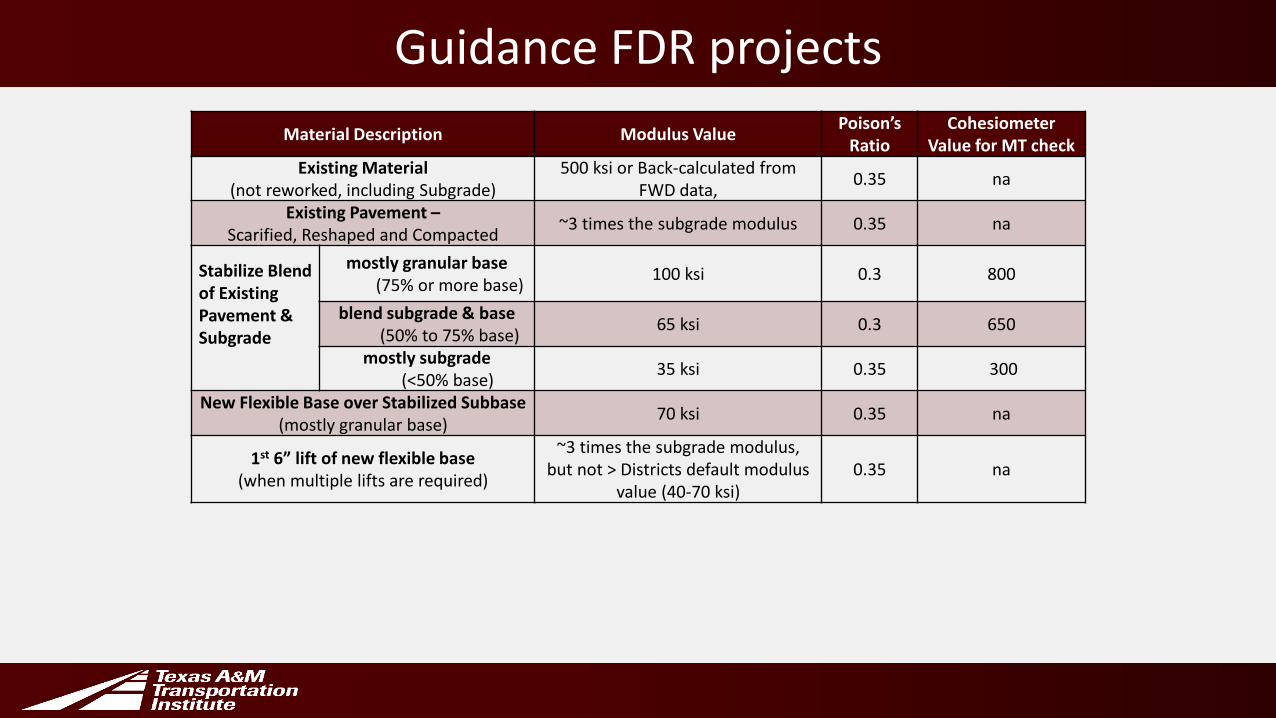
Guidance FDR projectsMaterial Description Modulus Value Poison’s
RatioCohesiometer
Value for MT checkExisting Material
(not reworked, including Subgrade)500 ksi or Back-calculated from
FWD data, 0.35 na
Existing Pavement –Scarified, Reshaped and Compacted ~3 times the subgrade modulus 0.35 na
Stabilize Blend of Existing Pavement &Subgrade
mostly granular base (75% or more base) 100 ksi 0.3 800
blend subgrade & base(50% to 75% base) 65 ksi 0.3 650
mostly subgrade (<50% base) 35 ksi 0.35 300
New Flexible Base over Stabilized Subbase (mostly granular base) 70 ksi 0.35 na
1st 6” lift of new flexible base (when multiple lifts are required)
~3 times the subgrade modulus, but not > Districts default modulus
value (40-70 ksi)0.35 na
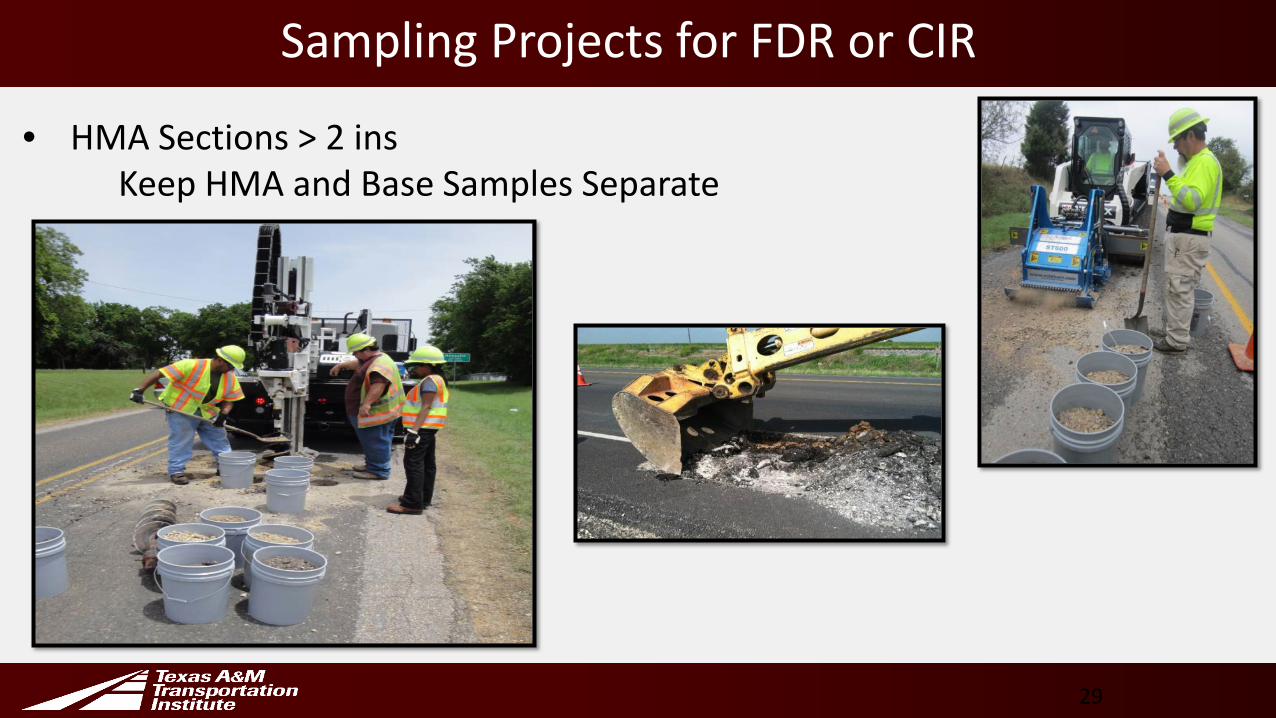
• HMA Sections > 2 insKeep HMA and Base Samples Separate
29
Sampling Projects for FDR or CIR
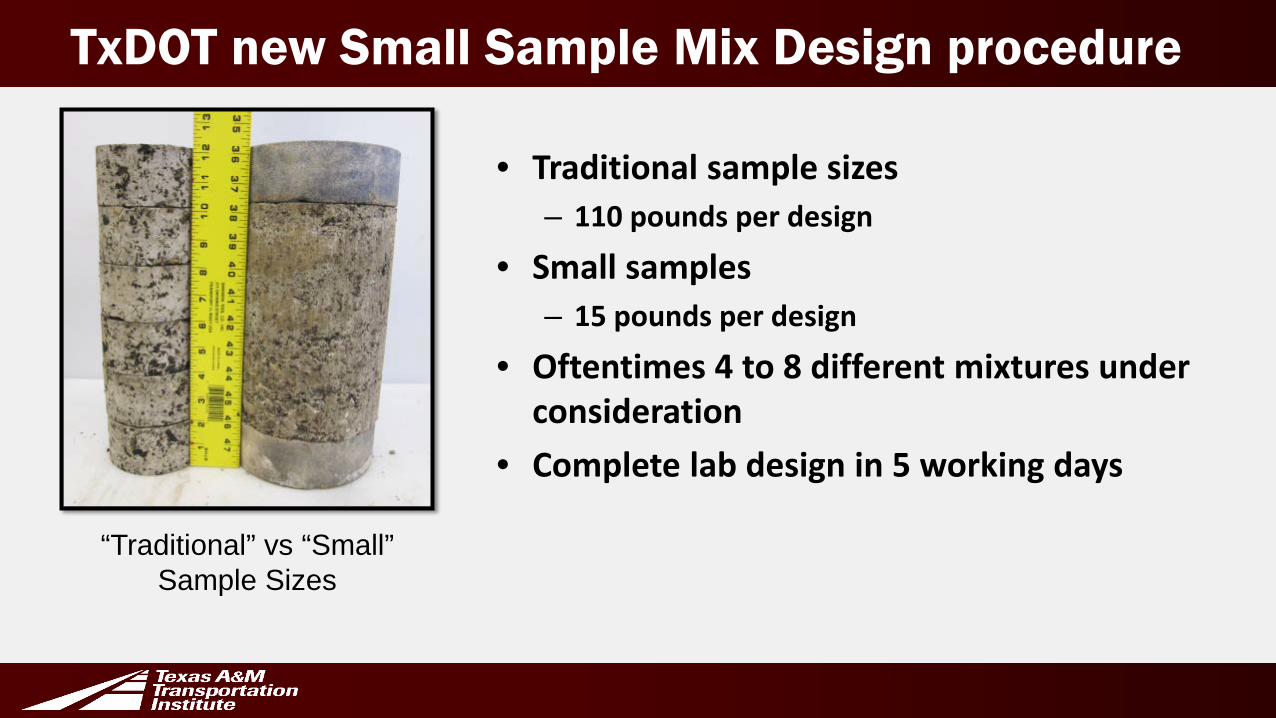
• Traditional sample sizes– 110 pounds per design
• Small samples– 15 pounds per design
• Oftentimes 4 to 8 different mixtures under consideration
• Complete lab design in 5 working days
“Traditional” vs “Small” Sample Sizes
TxDOT new Small Sample Mix Design procedure
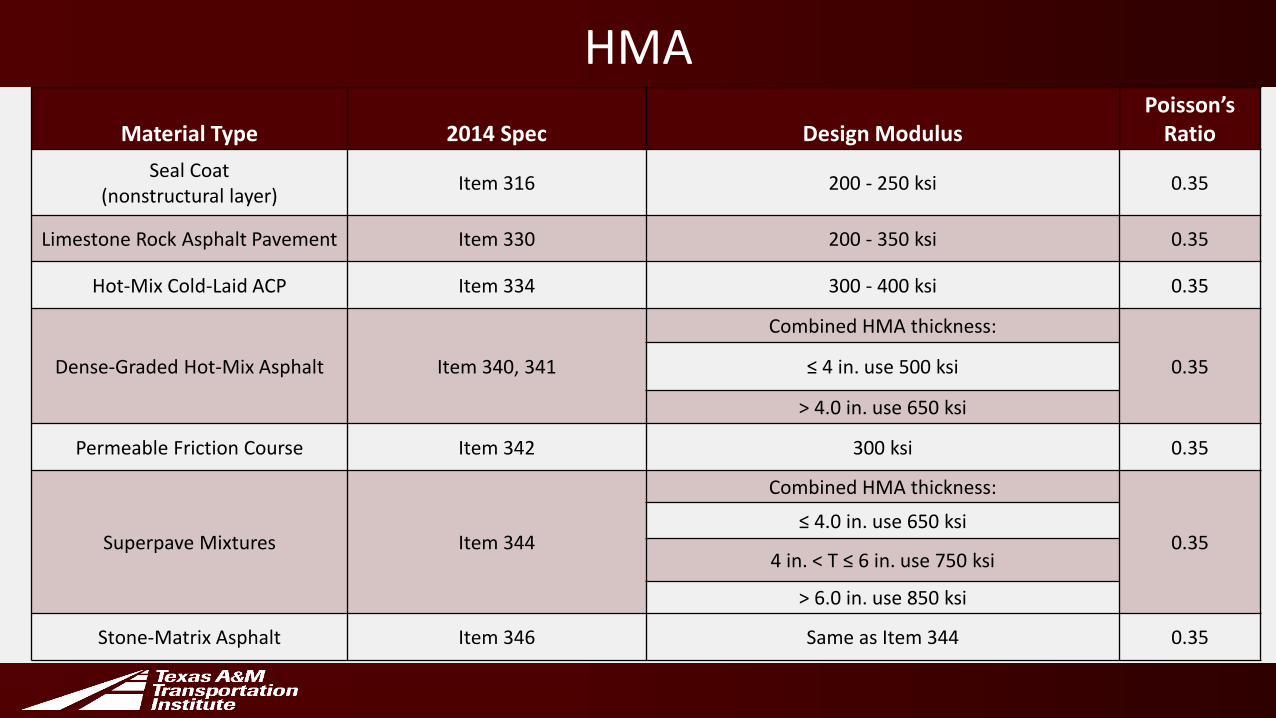
HMAMaterial Type 2014 Spec Design Modulus
Poisson’s Ratio
Seal Coat (nonstructural layer) Item 316 200 - 250 ksi 0.35
Limestone Rock Asphalt Pavement Item 330 200 - 350 ksi 0.35
Hot-Mix Cold-Laid ACP Item 334 300 - 400 ksi 0.35
Dense-Graded Hot-Mix Asphalt Item 340, 341
Combined HMA thickness:
0.35≤ 4 in. use 500 ksi
> 4.0 in. use 650 ksi
Permeable Friction Course Item 342 300 ksi 0.35
Superpave Mixtures Item 344
Combined HMA thickness:
0.35≤ 4.0 in. use 650 ksi
4 in. < T ≤ 6 in. use 750 ksi
> 6.0 in. use 850 ksi
Stone-Matrix Asphalt Item 346 Same as Item 344 0.35
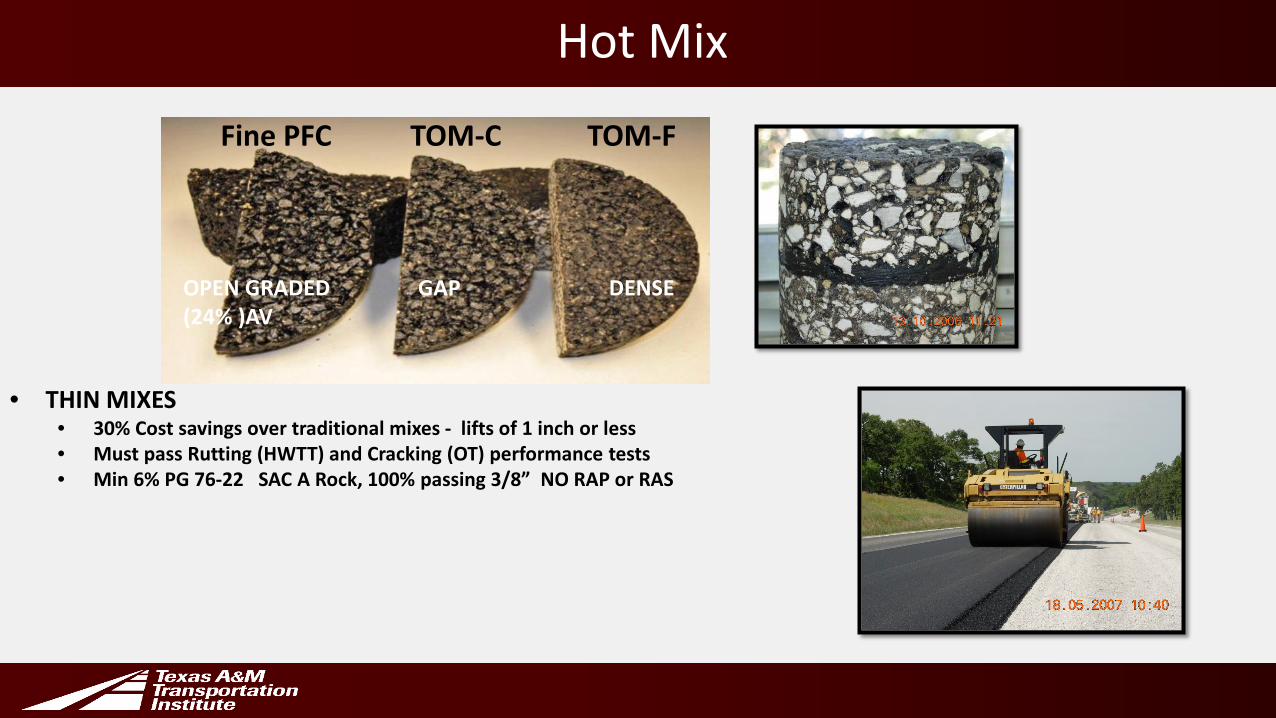
Hot Mix
Fine PFC TOM-C TOM-F
OPEN GRADED GAP DENSE (24% )AV
• THIN MIXES• 30% Cost savings over traditional mixes - lifts of 1 inch or less• Must pass Rutting (HWTT) and Cracking (OT) performance tests• Min 6% PG 76-22 SAC A Rock, 100% passing 3/8” NO RAP or RAS
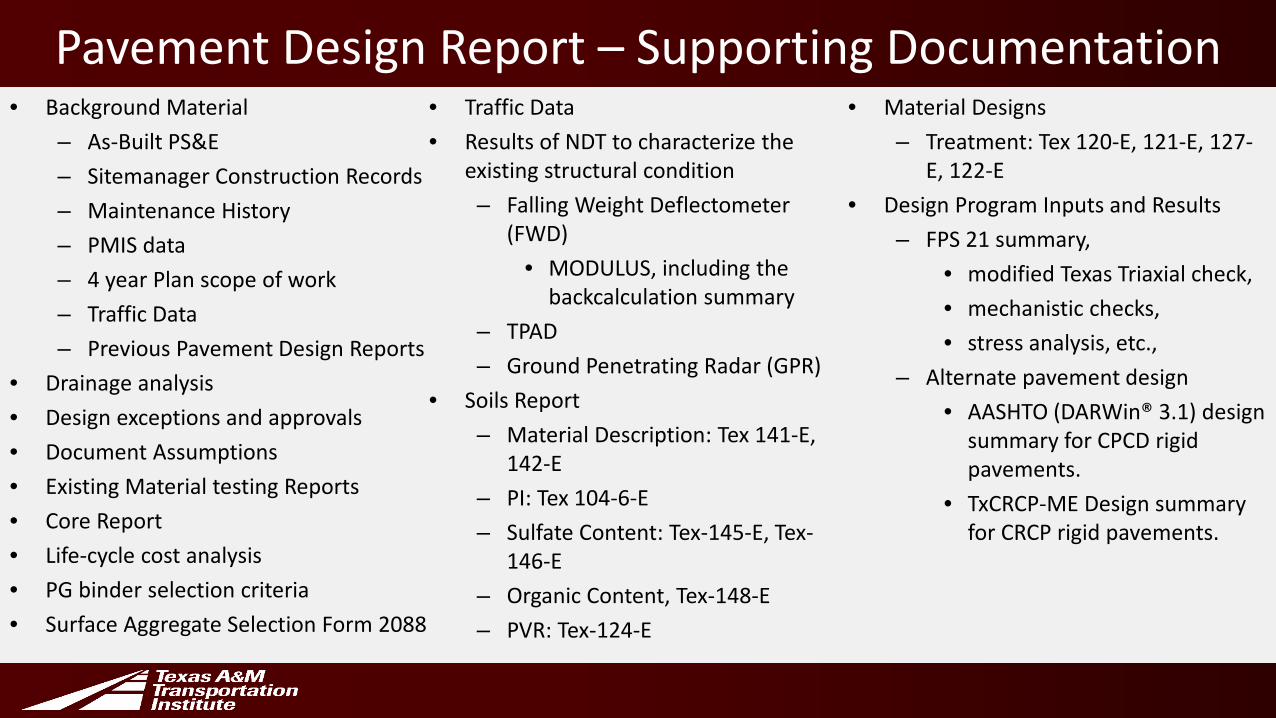
Pavement Design Report – Supporting Documentation• Background Material
– As-Built PS&E– Sitemanager Construction Records– Maintenance History– PMIS data– 4 year Plan scope of work– Traffic Data– Previous Pavement Design Reports
• Drainage analysis• Design exceptions and approvals• Document Assumptions• Existing Material testing Reports• Core Report• Life-cycle cost analysis• PG binder selection criteria• Surface Aggregate Selection Form 2088
• Traffic Data• Results of NDT to characterize the
existing structural condition – Falling Weight Deflectometer
(FWD)• MODULUS, including the
backcalculation summary– TPAD– Ground Penetrating Radar (GPR)
• Soils Report– Material Description: Tex 141-E,
142-E– PI: Tex 104-6-E– Sulfate Content: Tex-145-E, Tex-
146-E– Organic Content, Tex-148-E– PVR: Tex-124-E
• Material Designs– Treatment: Tex 120-E, 121-E, 127-
E, 122-E• Design Program Inputs and Results
– FPS 21 summary, • modified Texas Triaxial check, • mechanistic checks, • stress analysis, etc.,
– Alternate pavement design • AASHTO (DARWin® 3.1) design
summary for CPCD rigid pavements.
• TxCRCP-ME Design summary for CRCP rigid pavements.
34
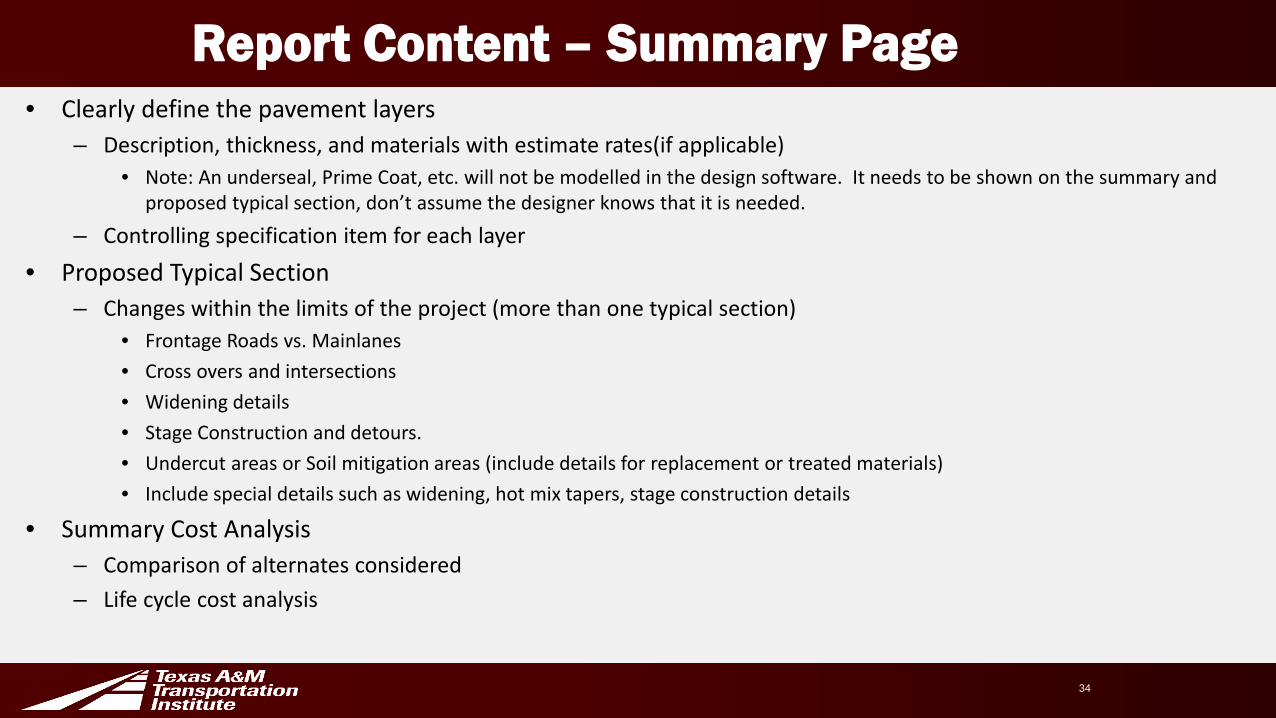
Report Content – Summary Page• Clearly define the pavement layers
– Description, thickness, and materials with estimate rates(if applicable)• Note: An underseal, Prime Coat, etc. will not be modelled in the design software. It needs to be shown on the summary and
proposed typical section, don’t assume the designer knows that it is needed.
– Controlling specification item for each layer• Proposed Typical Section
– Changes within the limits of the project (more than one typical section)• Frontage Roads vs. Mainlanes• Cross overs and intersections• Widening details• Stage Construction and detours. • Undercut areas or Soil mitigation areas (include details for replacement or treated materials)• Include special details such as widening, hot mix tapers, stage construction details
• Summary Cost Analysis– Comparison of alternates considered– Life cycle cost analysis
Questions
3


