1 paragon AG | Update | May 2016
Turnover up by 9.4% in Q1/16. Driven by the acoustic and electromobility business divisions, paragon´s revenues rose from € 21.2m to € 23.2m in the first quarter. The favourable change in own work capitalized enhanced gross profit, which climbed to € 14.2m (14.4% y/y). EBITDA grew by 8.3% y/y to € 3.0m (margin 13.1%) despite the new hired staff and consequent increase in personal costs (12% y/y). Higher financial expenses and tax payments reduced the net income to € 0.1m in Q1/16 (prior year € 0.8m). Available liquidity
at the balance sheet date stated at € 12.7m (vs. Q1/15: € 7.3m).
E-mobility the fastest growing division. Voltabox achieved € 1.8m in revenues in Q1/16 primarily because the battery systems sales in the US, a market where paragon began supplying two local clients. The acoustic business increased sales by 14.8% y/y, a performance that likely should improve given the confirmed production launch of the seat belt microphones for a German premium carmaker. Sensor revenues climbed by 2.0% (37.5% in group revenues), while the cockpit and body kinematics sales fell 4.3% and 12.0% y/y
respectively.
Capex volume expected normalised in 2016. During the last year paragon has almost completed the investment stage finalized to expand internationally the business and start new facilities. Capex are expected to reach roughly € 14m in 2016, and thus stabilized. The rise
in total assets lowered equity ratio to 19.2% (prior year 23.7%).
Order backlog boost our forecasts. It is scheduled for Q3/16 the production launch for a major starter battery order received the last year in the electromobility business. Based on the further expansion in Voltabox, we estimated a substantial EBIT growth (23.3% CAGR 2015-2018E), which accompanied by a decline in capex and scale effects for the next years should drive cash generation. Hence, we
have revised up our target price from €35.4 to €37.1 per share.
Key Figures
EURm 2012 2013 2014 2015 2016E 2017E
Net sales 70.4 73.9 79.0 95.0 103.5 114.9EBITDA 11.7 12.2 10.5 14.1 16.9 20.8EBIT 7.8 7.9 6.2 7.8 10.1 13.4Net income 4.6 3.9 2.8 3.4 5.1 7.3
EPS 1.1 1.0 0.7 0.8 1.2 1.8BVPS 3.2 3.9 4.2 4.7 5.8 7.4
RoE 40.6% 27.3% 16.8% 18.6% 23.3% 27.0%EBIT margin 11.0 % 10.7 % 7.9 % 8.2 % 9.7 % 11.7 %P/E 27.7x 32.5x 46.2x 37.7x 25.4x 17.5xP/BVPS 9.8x 8.1x 7.5x 6.9x 5.5x 4.3xEV/EBITDA 14.4x 13.8x 16.0x 11.9x 9.9x 8.1x
Source: Company, Dr. Kalliwoda Research GmbH © Copyright 2016
May 26, 2016 Europa | Germany | Auto Supplier
Update
BUY
Target Price: EUR 37.1
paragon AG
Industry: Automotive Supplier
Country: Germany
ISIN: DE0005558696
Bloomberg: PGNG.DE
Reuters: PGN GR
Website: www.paragon.ag
Last Price: 29.2
High LowPrice 52 W.: 36.4 14.6
Market Cap. (EURm) 120.3
No. of Shares (in m) 4.1
Shareholders
Klaus-Dieter Frers 51.3%
Free Float 48.7%
Dividend in EUR in %
2011 0.25 0.9%
2012 0.35 1.2%
2013 0.25 0.9%
2014 0.25 0.9%
2015 0.16 0.5%
Analyst Dr. Norbert Kalliwoda Email: [email protected] Phone: +49 69 97 20 58 53 www.kalliwoda.com Also see our Bloomberg page: KALL

2 paragon AG | Update | May 2016
Content
1 Company Profile ...................................................................................................................................... 3
1.1 Products and Market Share ................................................................................................................... 3
1.2 Clients ....................................................................................................................................................... 4
2 SWOT ....................................................................................................................................................... 4
3 Valuation .................................................................................................................................................. 6
4 Q1/16 Turnover and Outlook ................................................................................................................. 7
5 Shareholder´s structure ........................................................................................................................ 10
6 Profit and Loss Statement .................................................................................................................... 11
7 Balance Sheet ......................................................................................................................................... 12
8 Cash Flow Statement ............................................................................................................................ 13

3 paragon AG | Update | May 2016
paragon AG was founded in 1988 as an electronics manufacturer. The company's headquarters are located in Delbruck (North Rhine-Westphalia). Other Company’s divisions are based in Suhl, St. Georgen, Bexbach and Nuremberg (production or development). The paragon AG has also finished to build a battery production plant in Texas (USA), as well as a factory in Kunshan (greater Suzhou region), which will be fully operative in Autumn 2015. The Group currently employs a staff of 482 permanent and 79 temporary workers.
Founded as a contract manufacturer for electronics, paragon is now a pure Tier 1 automotive supplier. Its main focus relies on auto electronics for interior products to enhance the health, comfort, communication and efficiency. The product catalog includes more than 170 products with a capacity of over 15 million units produced per annum, in addition to its 250 patents owned.
Source: Company, Dr. Kalliwoda Research GmbH © Copyright 2016
Many of paragon’s products own its unique features, such as the Voltabox battery systems, when they come to fruition in the enhancement of electromobility for commercial vehicles. The sensors, besides, can be softer and simultaneously faster gearshift, as well as for the vehicle manufacturer resulting in economic benefits, where a separate reverse gear sensor is no longer required.
4 paragon AG | Update | May 2016
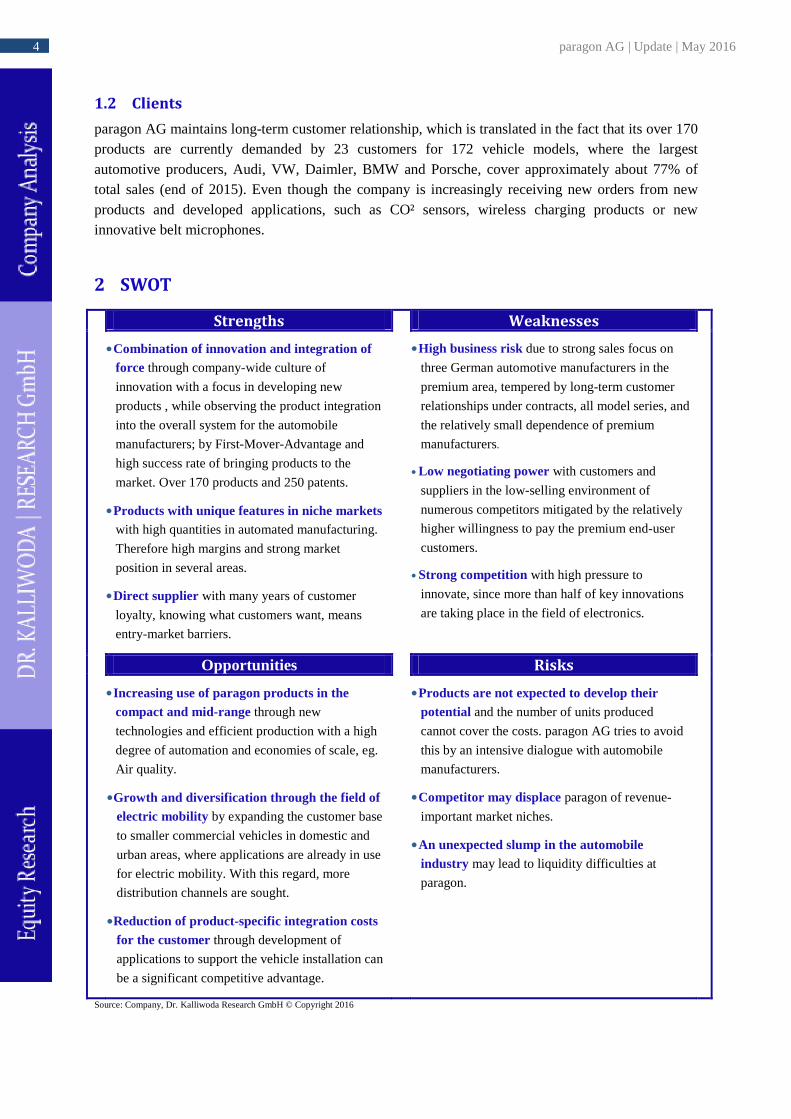
paragon AG maintains long-term customer relationship, which is translated in the fact that its over 170 products are currently demanded by 23 customers for 172 vehicle models, where the largest automotive producers, Audi, VW, Daimler, BMW and Porsche, cover approximately about 77% of total sales (end of 2015). Even though the company is increasingly receiving new orders from new products and developed applications, such as CO² sensors, wireless charging products or new innovative belt microphones.
Source: Company, Dr. Kalliwoda Research GmbH © Copyright 2016
Combination of innovation and integration of force through company-wide culture of
innovation with a focus in developing new
products , while observing the product integration
into the overall system for the automobile
manufacturers; by First-Mover-Advantage and
high success rate of bringing products to the
market. Over 170 products and 250 patents.
Products with unique features in niche markets with high quantities in automated manufacturing.
Therefore high margins and strong market
position in several areas.
Direct supplier with many years of customer
loyalty, knowing what customers want, means
entry-market barriers.
High business risk due to strong sales focus on
three German automotive manufacturers in the
premium area, tempered by long-term customer
relationships under contracts, all model series, and
the relatively small dependence of premium
manufacturers.
Low negotiating power with customers and
suppliers in the low-selling environment of
numerous competitors mitigated by the relatively
higher willingness to pay the premium end-user
customers.
Strong competition with high pressure to
innovate, since more than half of key innovations
are taking place in the field of electronics.
Opportunities
Increasing use of paragon products in the compact and mid-range through new
technologies and efficient production with a high
degree of automation and economies of scale, eg.
Air quality.
Growth and diversification through the field of electric mobility by expanding the customer base
to smaller commercial vehicles in domestic and
urban areas, where applications are already in use
for electric mobility. With this regard, more
distribution channels are sought.
Reduction of product-specific integration costs for the customer through development of
applications to support the vehicle installation can
be a significant competitive advantage.
Products are not expected to develop their potential and the number of units produced
cannot cover the costs. paragon AG tries to avoid
this by an intensive dialogue with automobile
manufacturers.
Competitor may displace paragon of revenue-
important market niches.
An unexpected slump in the automobile industry may lead to liquidity difficulties at
paragon.
5 paragon AG | Update | May 2016
In order to estimate paragon AG fair value we have used a traditional DCF model, which incorporates
our outlook and forecasts. The final result is a 12-month target price of € 37.1 per share.
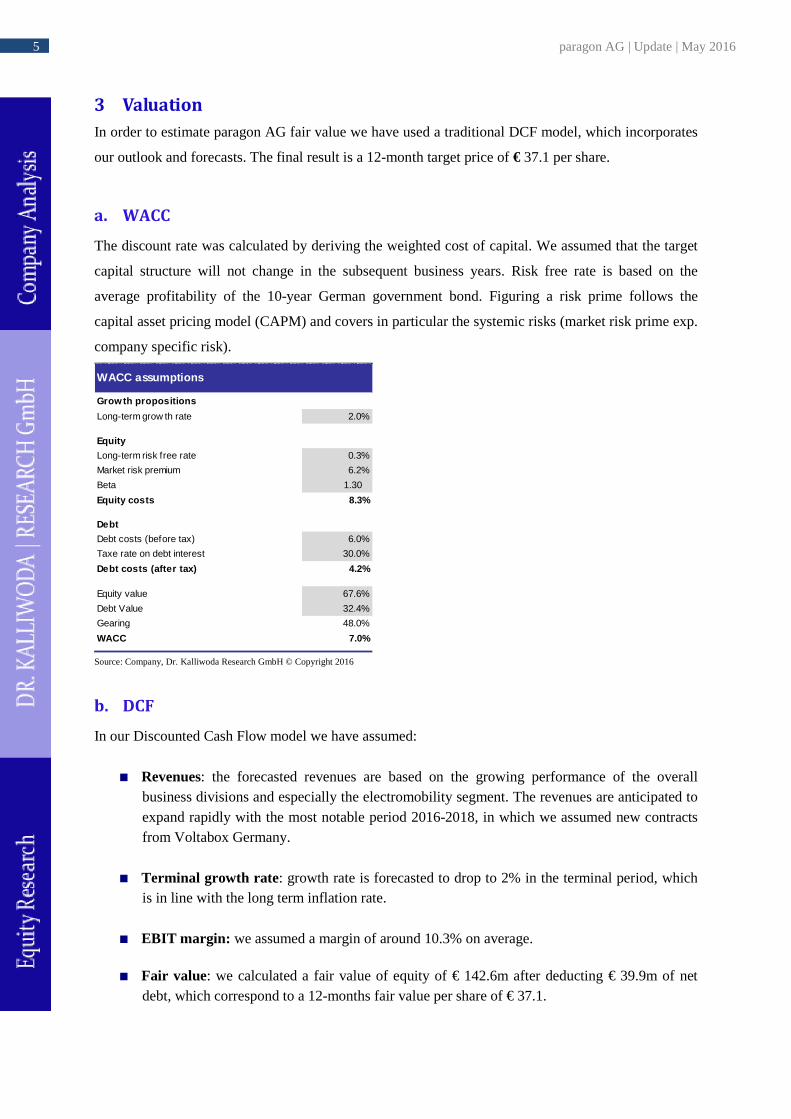
The discount rate was calculated by deriving the weighted cost of capital. We assumed that the target
capital structure will not change in the subsequent business years. Risk free rate is based on the
average profitability of the 10-year German government bond. Figuring a risk prime follows the
capital asset pricing model (CAPM) and covers in particular the systemic risks (market risk prime exp.
company specific risk).
Grow th propositions
Long-term grow th rate 2.0%
Equity
Long-term risk free rate 0.3%
Market risk premium 6.2%
Beta 1.30
Equity costs 8.3%
Debt
Debt costs (before tax) 6.0%
Taxe rate on debt interest 30.0%
Debt costs (after tax) 4.2%
Equity value 67.6%
Debt Value 32.4%
Gearing 48.0%
WACC 7.0%
WACC assumptions
Source: Company, Dr. Kalliwoda Research GmbH © Copyright 2016
In our Discounted Cash Flow model we have assumed:
Revenues: the forecasted revenues are based on the growing performance of the overall business divisions and especially the electromobility segment. The revenues are anticipated to expand rapidly with the most notable period 2016-2018, in which we assumed new contracts from Voltabox Germany.
Terminal growth rate : growth rate is forecasted to drop to 2% in the terminal period, which is in line with the long term inflation rate.
EBIT margin: we assumed a margin of around 10.3% on average.
Fair value: we calculated a fair value of equity of € 142.6m after deducting € 39.9m of net debt, which correspond to a 12-months fair value per share of € 37.1.
6 paragon AG | Update | May 2016
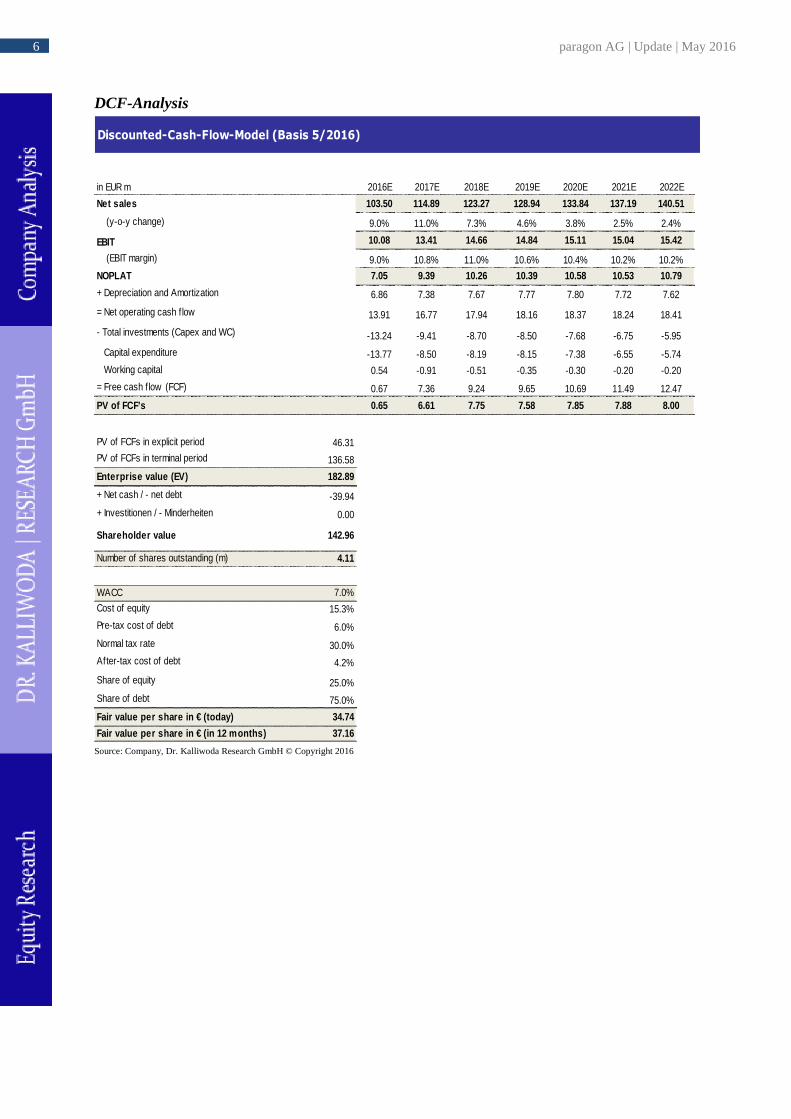
DCF-Analysis
in EUR m 2016E 2017E 2018E 2019E 2020E 2021E 2022E
Net sales 103.50 114.89 123.27 128.94 133.84 137.19 140.51
(y-o-y change) 9.0% 11.0% 7.3% 4.6% 3.8% 2.5% 2.4%
EBIT 10.08 13.41 14.66 14.84 15.11 15.04 15.42
(EBIT margin) 9.0% 10.8% 11.0% 10.6% 10.4% 10.2% 10.2%
NOPLAT 7.05 9.39 10.26 10.39 10.58 10.53 10.79
+ Depreciation and Amortization 6.86 7.38 7.67 7.77 7.80 7.72 7.62
= Net operating cash f low 13.91 16.77 17.94 18.16 18.37 18.24 18.41
- Total investments (Capex and WC) -13.24 -9.41 -8.70 -8.50 -7.68 -6.75 -5.95
Capital expenditure -13.77 -8.50 -8.19 -8.15 -7.38 -6.55 -5.74
Working capital 0.54 -0.91 -0.51 -0.35 -0.30 -0.20 -0.20
= Free cash f low (FCF) 0.67 7.36 9.24 9.65 10.69 11.49 12.47
PV of FCF's 0.65 6.61 7.75 7.58 7.85 7.88 8.00
PV of FCFs in explicit period 46.31
PV of FCFs in terminal period 136.58
Enterprise value (EV) 182.89
+ Net cash / - net debt -39.94
+ Investitionen / - Minderheiten 0.00
Shareholder value 142.96
Number of shares outstanding (m) 4.11
WACC 7.0%
Cost of equity 15.3%
Pre-tax cost of debt 6.0%
Normal tax rate 30.0%
After-tax cost of debt 4.2%
Share of equity 25.0%
Share of debt 75.0%
Fair value per share in € (today) 34.74
Fair value per share in € (in 12 months) 37.16 Source: Company, Dr. Kalliwoda Research GmbH © Copyright 2016
7 paragon AG | Update | May 2016
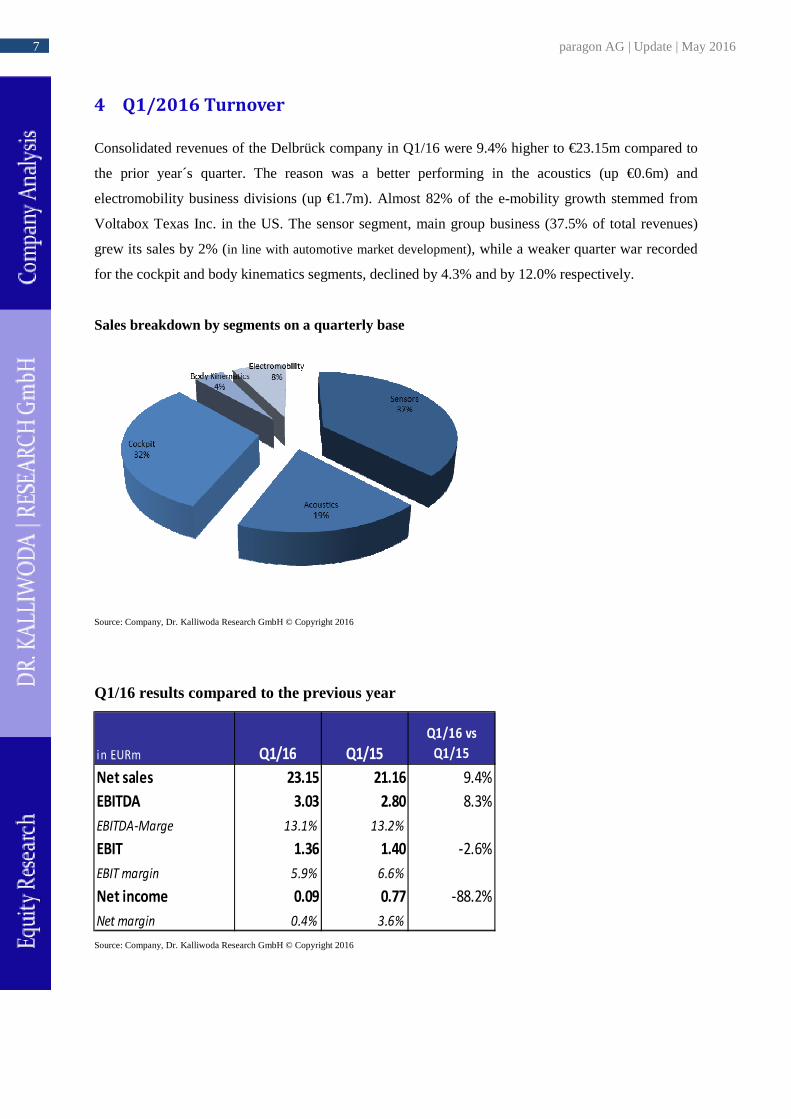
Consolidated revenues of the Delbrück company in Q1/16 were 9.4% higher to €23.15m compared to
the prior year´s quarter. The reason was a better performing in the acoustics (up €0.6m) and
electromobility business divisions (up €1.7m). Almost 82% of the e-mobility growth stemmed from
Voltabox Texas Inc. in the US. The sensor segment, main group business (37.5% of total revenues)
grew its sales by 2% (in line with automotive market development), while a weaker quarter war recorded
for the cockpit and body kinematics segments, declined by 4.3% and by 12.0% respectively.
Sales breakdown by segments on a quarterly base
Source: Company, Dr. Kalliwoda Research GmbH © Copyright 2016
Q1/16 results compared to the previous year
Source: Company, Dr. Kalliwoda Research GmbH © Copyright 2016
8 paragon AG | Update | May 2016
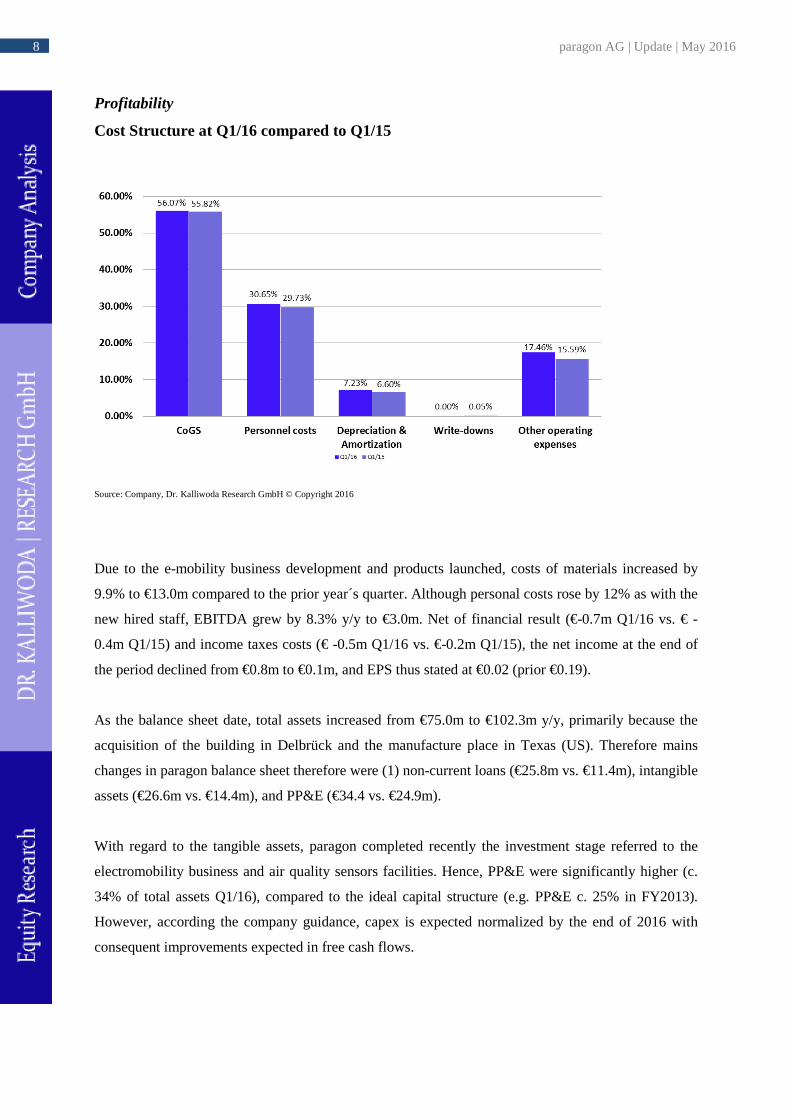
Profitability
Cost Structure at Q1/16 compared to Q1/15
Source: Company, Dr. Kalliwoda Research GmbH © Copyright 2016
Due to the e-mobility business development and products launched, costs of materials increased by
9.9% to €13.0m compared to the prior year´s quarter. Although personal costs rose by 12% as with the
new hired staff, EBITDA grew by 8.3% y/y to €3.0m. Net of financial result (€-0.7m Q1/16 vs. € -
0.4m Q1/15) and income taxes costs (€ -0.5m Q1/16 vs. €-0.2m Q1/15), the net income at the end of
the period declined from €0.8m to €0.1m, and EPS thus stated at €0.02 (prior €0.19).
As the balance sheet date, total assets increased from €75.0m to €102.3m y/y, primarily because the
acquisition of the building in Delbrück and the manufacture place in Texas (US). Therefore mains
changes in paragon balance sheet therefore were (1) non-current loans (€25.8m vs. €11.4m), intangible
assets (€26.6m vs. €14.4m), and PP&E (€34.4 vs. €24.9m).
With regard to the tangible assets, paragon completed recently the investment stage referred to the
electromobility business and air quality sensors facilities. Hence, PP&E were significantly higher (c.
34% of total assets Q1/16), compared to the ideal capital structure (e.g. PP&E c. 25% in FY2013).
However, according the company guidance, capex is expected normalized by the end of 2016 with
consequent improvements expected in free cash flows.
9 paragon AG | Update | May 2016
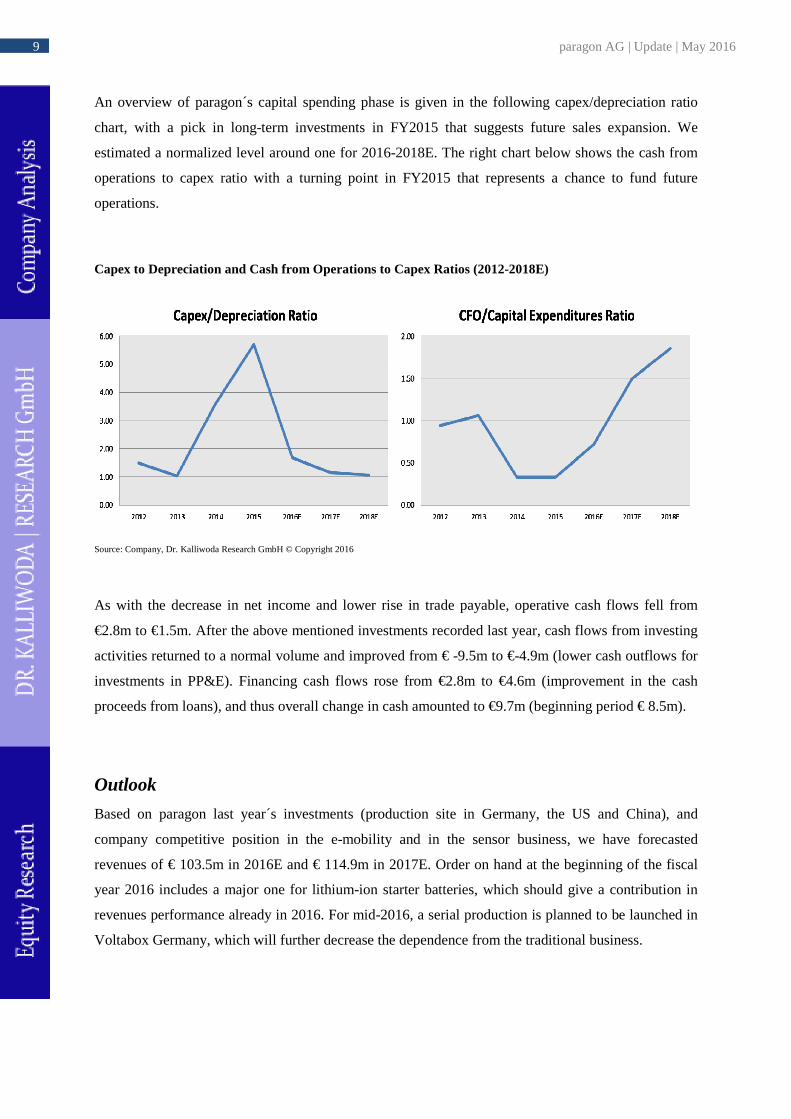
An overview of paragon´s capital spending phase is given in the following capex/depreciation ratio
chart, with a pick in long-term investments in FY2015 that suggests future sales expansion. We
estimated a normalized level around one for 2016-2018E. The right chart below shows the cash from
operations to capex ratio with a turning point in FY2015 that represents a chance to fund future
operations.
Capex to Depreciation and Cash from Operations to Capex Ratios (2012-2018E)
Source: Company, Dr. Kalliwoda Research GmbH © Copyright 2016
As with the decrease in net income and lower rise in trade payable, operative cash flows fell from
€2.8m to €1.5m. After the above mentioned investments recorded last year, cash flows from investing
activities returned to a normal volume and improved from € -9.5m to €-4.9m (lower cash outflows for
investments in PP&E). Financing cash flows rose from €2.8m to €4.6m (improvement in the cash
proceeds from loans), and thus overall change in cash amounted to €9.7m (beginning period € 8.5m).
Outlook
Based on paragon last year´s investments (production site in Germany, the US and China), and
company competitive position in the e-mobility and in the sensor business, we have forecasted
revenues of € 103.5m in 2016E and € 114.9m in 2017E. Order on hand at the beginning of the fiscal
year 2016 includes a major one for lithium-ion starter batteries, which should give a contribution in
revenues performance already in 2016. For mid-2016, a serial production is planned to be launched in
Voltabox Germany, which will further decrease the dependence from the traditional business.

10 paragon AG | Update | May 2016
We have assumed a lower capital intensity structure and a higher automatization in paragon niche
applications. These should lead to a better efficiency and higher margins. Nevertheless, we have
considered various risks in the analysis such as risks related to the increase of OEMs´ pricing pressure
and technological and replacement risks for the lithium-ion battery. Our analysis of the funding
sources has assumed a decrease in company debt, which is translated in a lower net debt/EBITDA
ratio of 2.65x in 2016E and 1.98x in 2017E.
Source: Company, Dr. Kalliwoda Research GmbH © Copyright 2016
11 paragon AG | Update | May 2016
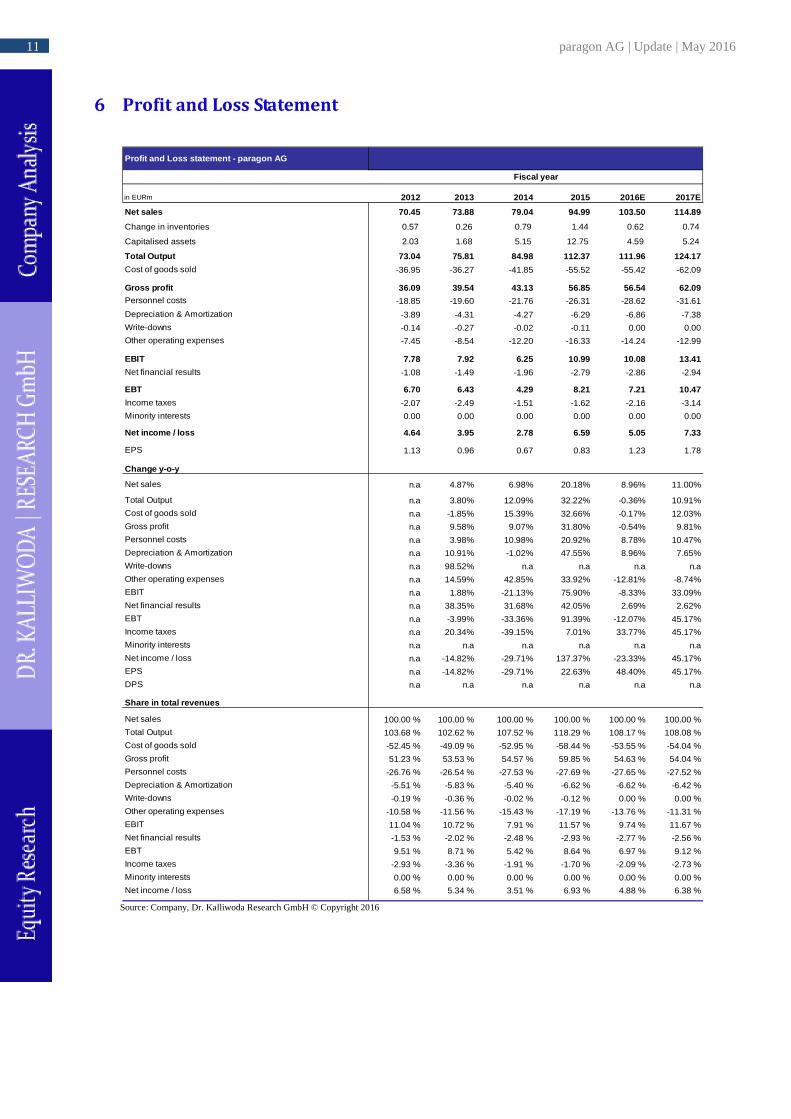
in EURm 2012 2013 2014 2015 2016E 2017E
Net sales 70.45 73.88 79.04 94.99 103.50 114.89
Change in inventories 0.57 0.26 0.79 1.44 0.62 0.74
Capitalised assets 2.03 1.68 5.15 12.75 4.59 5.24
Total Output 73.04 75.81 84.98 112.37 111.96 124.17
Cost of goods sold -36.95 -36.27 -41.85 -55.52 -55.42 -62.09
Gross profit 36.09 39.54 43.13 56.85 56.54 62.09Personnel costs -18.85 -19.60 -21.76 -26.31 -28.62 -31.61
Depreciation & Amortization -3.89 -4.31 -4.27 -6.29 -6.86 -7.38
Write-downs -0.14 -0.27 -0.02 -0.11 0.00 0.00
Other operating expenses -7.45 -8.54 -12.20 -16.33 -14.24 -12.99
EBIT 7.78 7.92 6.25 10.99 10.08 13.41
Net financial results -1.08 -1.49 -1.96 -2.79 -2.86 -2.94
EBT 6.70 6.43 4.29 8.21 7.21 10.47
Income taxes -2.07 -2.49 -1.51 -1.62 -2.16 -3.14
Minority interests 0.00 0.00 0.00 0.00 0.00 0.00
Net income / loss 4.64 3.95 2.78 6.59 5.05 7.33
EPS 1.13 0.96 0.67 0.83 1.23 1.78
Change y-o-y
Net sales n.a 4.87% 6.98% 20.18% 8.96% 11.00%
Total Output n.a 3.80% 12.09% 32.22% -0.36% 10.91%
Cost of goods sold n.a -1.85% 15.39% 32.66% -0.17% 12.03%
Gross profit n.a 9.58% 9.07% 31.80% -0.54% 9.81%
Personnel costs n.a 3.98% 10.98% 20.92% 8.78% 10.47%
Depreciation & Amortization n.a 10.91% -1.02% 47.55% 8.96% 7.65%
Write-downs n.a 98.52% n.a n.a n.a n.a
Other operating expenses n.a 14.59% 42.85% 33.92% -12.81% -8.74%
EBIT n.a 1.88% -21.13% 75.90% -8.33% 33.09%
Net financial results n.a 38.35% 31.68% 42.05% 2.69% 2.62%
EBT n.a -3.99% -33.36% 91.39% -12.07% 45.17%
Income taxes n.a 20.34% -39.15% 7.01% 33.77% 45.17%
Minority interests n.a n.a n.a n.a n.a n.a
Net income / loss n.a -14.82% -29.71% 137.37% -23.33% 45.17%
EPS n.a -14.82% -29.71% 22.63% 48.40% 45.17%
DPS n.a n.a n.a n.a n.a n.a
Share in total revenues
Net sales 100.00 % 100.00 % 100.00 % 100.00 % 100.00 % 100.00 %
Total Output 103.68 % 102.62 % 107.52 % 118.29 % 108.17 % 108.08 %
Cost of goods sold -52.45 % -49.09 % -52.95 % -58.44 % -53.55 % -54.04 %
Gross profit 51.23 % 53.53 % 54.57 % 59.85 % 54.63 % 54.04 %
Personnel costs -26.76 % -26.54 % -27.53 % -27.69 % -27.65 % -27.52 %
Depreciation & Amortization -5.51 % -5.83 % -5.40 % -6.62 % -6.62 % -6.42 %
Write-downs -0.19 % -0.36 % -0.02 % -0.12 % 0.00 % 0.00 %
Other operating expenses -10.58 % -11.56 % -15.43 % -17.19 % -13.76 % -11.31 %
EBIT 11.04 % 10.72 % 7.91 % 11.57 % 9.74 % 11.67 %
Net financial results -1.53 % -2.02 % -2.48 % -2.93 % -2.77 % -2.56 %
EBT 9.51 % 8.71 % 5.42 % 8.64 % 6.97 % 9.12 %
Income taxes -2.93 % -3.36 % -1.91 % -1.70 % -2.09 % -2.73 %
Minority interests 0.00 % 0.00 % 0.00 % 0.00 % 0.00 % 0.00 %
Net income / loss 6.58 % 5.34 % 3.51 % 6.93 % 4.88 % 6.38 %
Profit and Loss statement - paragon AG
Fiscal year
Source: Company, Dr. Kalliwoda Research GmbH © Copyright 2016
12 paragon AG | Update | May 2016
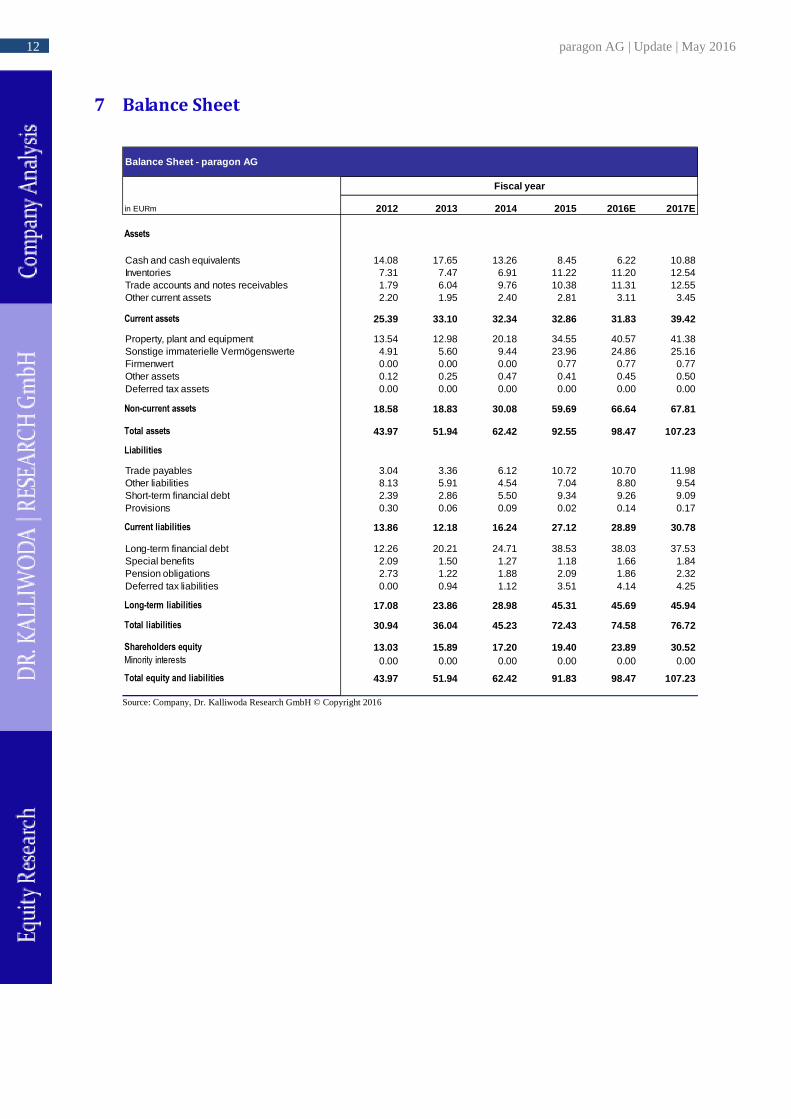
in EURm 2012 2013 2014 2015 2016E 2017E
Cash and cash equivalents 14.08 17.65 13.26 8.45 6.22 10.88Inventories 7.31 7.47 6.91 11.22 11.20 12.54Trade accounts and notes receivables 1.79 6.04 9.76 10.38 11.31 12.55Other current assets 2.20 1.95 2.40 2.81 3.11 3.45
25.39 33.10 32.34 32.86 31.83 39.42
Property, plant and equipment 13.54 12.98 20.18 34.55 40.57 41.38Sonstige immaterielle Vermögenswerte 4.91 5.60 9.44 23.96 24.86 25.16Firmenwert 0.00 0.00 0.00 0.77 0.77 0.77Other assets 0.12 0.25 0.47 0.41 0.45 0.50Deferred tax assets 0.00 0.00 0.00 0.00 0.00 0.00
18.58 18.83 30.08 59.69 66.64 67.81
43.97 51.94 62.42 92.55 98.47 107.23
Trade payables 3.04 3.36 6.12 10.72 10.70 11.98Other liabilities 8.13 5.91 4.54 7.04 8.80 9.54Short-term financial debt 2.39 2.86 5.50 9.34 9.26 9.09Provisions 0.30 0.06 0.09 0.02 0.14 0.17
13.86 12.18 16.24 27.12 28.89 30.78
Long-term financial debt 12.26 20.21 24.71 38.53 38.03 37.53Special benefits 2.09 1.50 1.27 1.18 1.66 1.84Pension obligations 2.73 1.22 1.88 2.09 1.86 2.32Deferred tax liabilities 0.00 0.94 1.12 3.51 4.14 4.25
17.08 23.86 28.98 45.31 45.69 45.94
30.94 36.04 45.23 72.43 74.58 76.72
13.03 15.89 17.20 19.40 23.89 30.520.00 0.00 0.00 0.00 0.00 0.00
43.97 51.94 62.42 91.83 98.47 107.23
Balance Sheet - paragon AG
Fiscal year
Source: Company, Dr. Kalliwoda Research GmbH © Copyright 2016

13 paragon AG | Update | May 2016
in EURm 2012 2013 2014 2015 2016E 2017E Net income 4.64 3.95 2.78 3.40 5.05 7.33
Depreciation 3.89 4.31 4.27 6.29 6.86 7.38
Change of working capital -1.62 -3.42 -2.24 -0.30 0.54 -0.91
Others -1.10 0.27 0.22 2.32 0.74 0.15
Net operating cash flow 5.80 5.10 5.03 11.72 13.18 13.95
Cash flow from investing -6.15 -4.81 -15.30 -35.96 -13.7 7 -8.50
Free cash flow -0.35 0.29 -10.27 -24.24 -0.59 5.45
Cash flow from financing -0.90 3.27 5.89 19.43 -1.65 -0.7 9
Change in cash -1.25 3.56 -4.38 -4.81 -2.24 4.66
Cash, start of the year 15.33 14.08 17.65 13.26 8.45 6.22
Cash, end of the year 14.08 17.65 13.26 8.45 6.22 10.88
Cash Flow statement - paragon
Fiscal year
Source: Company, Dr. Kalliwoda Research GmbH © Copyright 2016

14 paragon AG | Update | May 2016
Source: Company, Dr. Kalliwoda Research GmbH © Copyright 2016
15 paragon AG | Update | May 2016
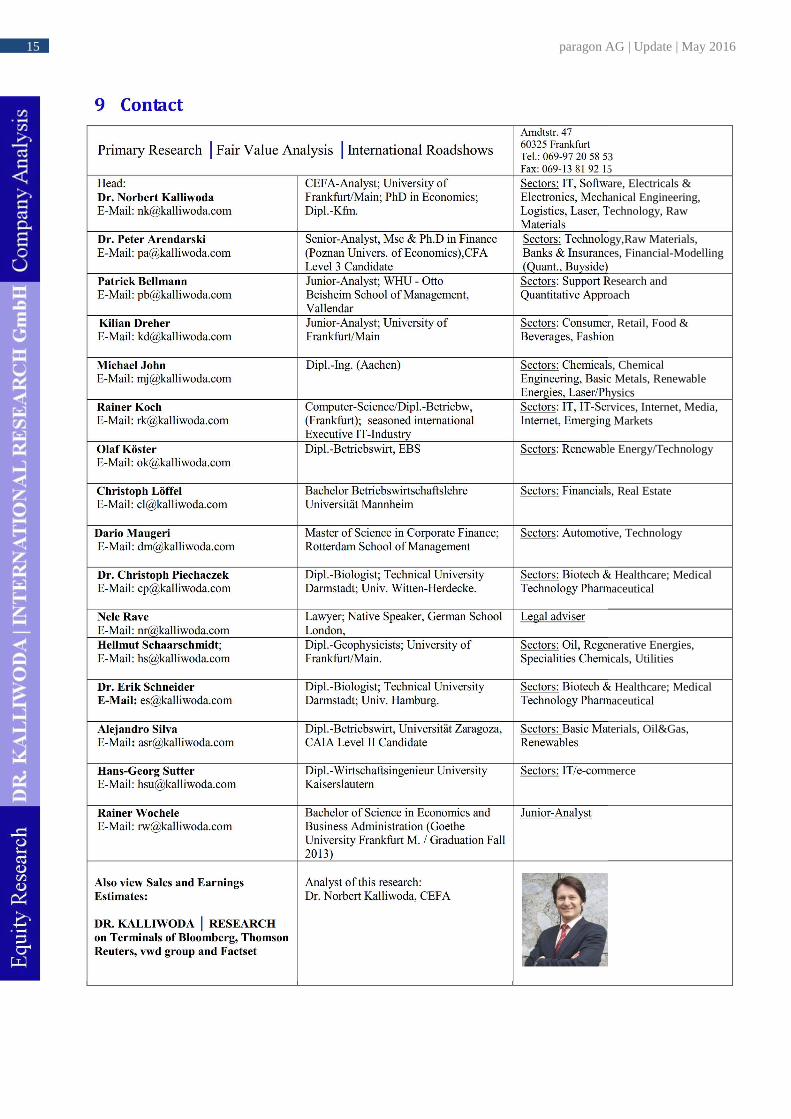
Primary Research Fair Value Analysis International Roadshows
Arndtstr. 47 60325 Frankfurt Tel.: 069-97 20 58 53 Fax: 069-13 81 92 15
Head: Dr. Norbert Kalliwoda E-Mail: [email protected]
CEFA-Analyst; University of Frankfurt/Main; PhD in Economics; Dipl.-Kfm.
Sectors: IT, Software, Electricals & Electronics, Mechanical Engineering, Logistics, Laser, Technology, Raw Materials
Dr. Peter Arendarski E-Mail: [email protected]
Senior-Analyst, Msc & Ph.D in Finance (Poznan Univers. of Economics),CFA Level 3 Candidate
Sectors: Technology,Raw Materials, Banks & Insurances, Financial-Modelling (Quant., Buyside)
Patrick Bellmann E-Mail: [email protected]
Junior-Analyst; WHU - Otto Beisheim School of Management, Vallendar
Sectors: Support Research and Quantitative Approach
Robin Kilian Dreher E-Mail: [email protected]
Junior-Analyst; University of Frankfurt/Main
Sectors: Consumer, Retail, Food & Beverages, Fashion
Michael John E-Mail: [email protected]
Dipl.-Ing. (Aachen) Sectors: Chemicals, Chemical Engineering, Basic Metals, Renewable Energies, Laser/Physics
Rainer Koch E-Mail: [email protected]
Computer-Science/Dipl.-Betriebw, (Frankfurt); seasoned international Executive IT-Industry
Sectors: IT, IT-Services, Internet, Media, Internet, Emerging Markets
Olaf Köster E-Mail: [email protected]
Dipl.-Betriebswirt, EBS Sectors: Renewable Energy/Technology
Christoph Löffel E-Mail: [email protected]
Bachelor Betriebswirtschaftslehre Universität Mannheim
Sectors: Financials, Real Estate
Dario Maugeri E-Mail: [email protected]
Master of Science in Corporate Finance; Rotterdam School of Management
Sectors: Automotive, Technology
Dr. Christoph Piechaczek E-Mail: [email protected]
Dipl.-Biologist; Technical University Darmstadt; Univ. Witten-Herdecke.
Sectors: Biotech & Healthcare; Medical Technology Pharmaceutical
Nele Rave E-Mail: [email protected]
Lawyer; Native Speaker, German School London,
Legal adviser
Hellmut Schaarschmidt; E-Mail: [email protected]
Dipl.-Geophysicists; University of Frankfurt/Main.
Sectors: Oil, Regenerative Energies, Specialities Chemicals, Utilities
Dr. Erik Schneider E-Mail: [email protected]
Dipl.-Biologist; Technical University Darmstadt; Univ. Hamburg.
Sectors: Biotech & Healthcare; Medical Technology Pharmaceutical
Alejandro Silva E-Mail: [email protected]
Dipl.-Betriebswirt, Universität Zaragoza, CAIA Level II Candidate
Sectors: Basic Materials, Oil&Gas, Renewables
Hans-Georg Sutter E-Mail: [email protected]
Dipl.-Wirtschaftsingenieur University Kaiserslautern
Sectors: IT/e-commerce
Rainer Wochele E-Mail: [email protected]
Bachelor of Science in Economics and Business Administration (Goethe University Frankfurt M. / Graduation Fall 2013)
Junior-Analyst
Also view Sales and Earnings Estimates: DR. KALLIWODA RESEARCH on Terminals of Bloomberg, Thomson Reuters, vwd group and Factset
Analyst of this research: Dr. Norbert Kalliwoda, CEFA
16 paragon AG | Update | May 2016
Essential information, disclosures and disclaimer
A. Essential information
The investments in financial instruments and securities (e.g. equities, bonds) generally involved on high risks. It is possible that the investors lose some or all of the invested money. Potential investors should be aware of the fact that the prices of securities could fall and rise. The income from such an investment might be considerable fluctuations. Investment strategies are not appropriate at all times and past results are not a guarantee for the future performance. Investors should make their own and independent decisions as to whether a risky investment.
B. Disclosures according to Section 34b of the German Securities Trading Act (WpHG) and to the German Regulation governing the Analysis of Financial Instruments (FinAnV).
I. Information about author, company held accountable, regulatory authority:
Company responsible for the content of this document: Dr. Kalliwoda Research GmbH, Frankfurt am Main, Germany.
Regulatory authority for Dr. Kalliwoda Research GmbH is the Federal Financial Supervisory Authority (BaFin), Graurheindorfer Straße 108, 53117 Bonn, Germany and Lurgiallee 12, 60439 Frankfurt am Main, Germany.
Author of this research: Dr. Norbert Kalliwoda, Analyst, CEO and founder of Dr. Kalliwoda Research GmbH.
II. Additional Information:
1. Sources of information:
Essential sources of information for the compilation of this document are publications from domestic and international information services and media (e.g. Bloomberg, dpa-AFX, Reuters, VWD, among others), financial press (e.g. Allgemeine Zeitung Frankfurter, Börsenzeitung, Financial Times Handelsblatt and others), specialized trade press, published statistics, rating agencies as well as publications by peer group companies and the company itself. Additionally, conservation has been held with the management of the company. This document was made available to the company before publishing to ensure the correctness of the information provided.
2. Summary of the basis of valuation principles and methods used to prepare this document:
Within the scope of the evaluation of companies the following valuation methods are applied: Multiple-based models (Price/Earnings, Price/Cash-flow, Price/Book value, EV/Sales, EV/EBIT, EV/EBITDA), peer group comparisons, historic valuation methods, discounting models, sum-of-the-parts-approaches, substance-valuation methods and swot-analyses. The valuation principles and models are dependent on macroeconomic factors, such as interest rates, exchange rates, raw materials and on basic assumptions about the economy. Besides, the market moods and market sentiment affects the valuation of enterprises. The approaches are based on expectations that could change rapidly and without advance warning according on developments specific to individual branch. The valuation results and fair values derived from the models might therefore change accordingly.
17 paragon AG | Update | May 2016
The ratings are the evaluation results and refer to a fair value pricing reflecting a time-horizon of up general relate to a twelve-months. Nevertheless, evaluation results are subject to changing market conditions and constitute merely a snapshot. The evaluation results and fair values may be reached faster or slower than expected by the analysts. The results and fair values may to be scale upwards or downwards.
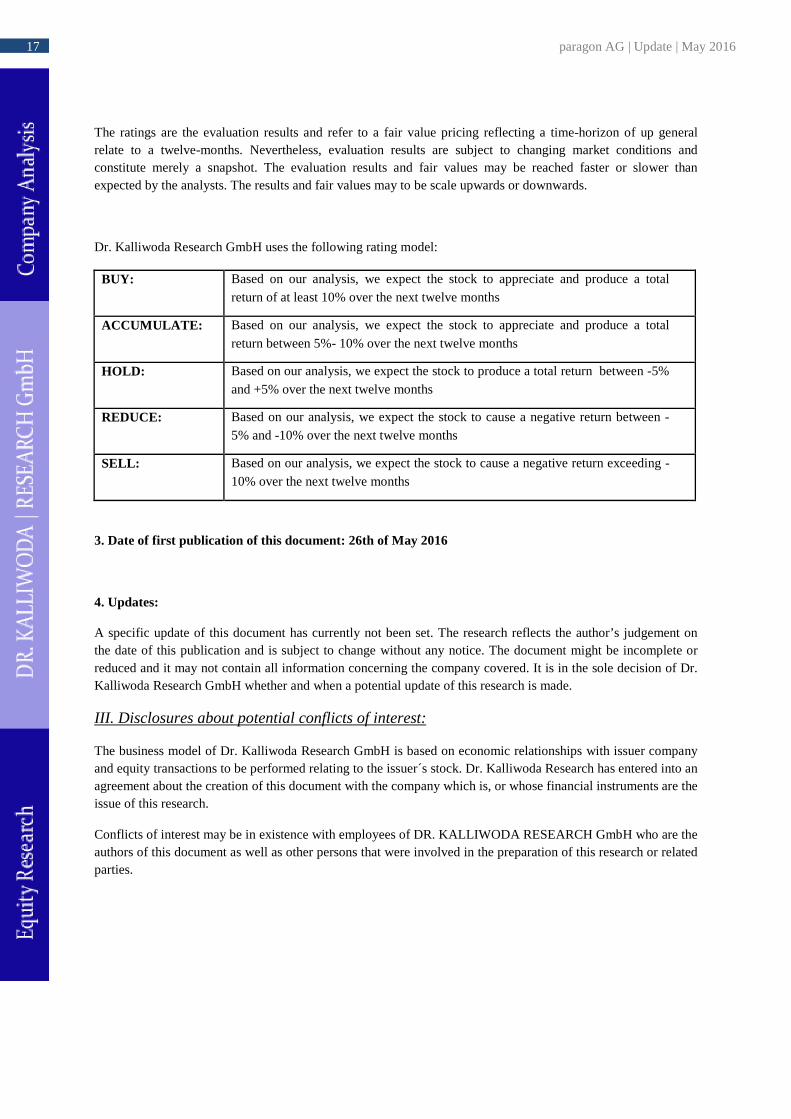
Dr. Kalliwoda Research GmbH uses the following rating model:
BUY: Based on our analysis, we expect the stock to appreciate and produce a total return of at least 10% over the next twelve months
ACCUMULATE: Based on our analysis, we expect the stock to appreciate and produce a total return between 5%- 10% over the next twelve months
HOLD: Based on our analysis, we expect the stock to produce a total return between -5% and +5% over the next twelve months
REDUCE: Based on our analysis, we expect the stock to cause a negative return between -5% and -10% over the next twelve months
SELL: Based on our analysis, we expect the stock to cause a negative return exceeding -10% over the next twelve months
3. Date of first publication of this document: 26th of May 2016
4. Updates:
A specific update of this document has currently not been set. The research reflects the author’s judgement on the date of this publication and is subject to change without any notice. The document might be incomplete or reduced and it may not contain all information concerning the company covered. It is in the sole decision of Dr. Kalliwoda Research GmbH whether and when a potential update of this research is made.
III. Disclosures about potential conflicts of interest:
The business model of Dr. Kalliwoda Research GmbH is based on economic relationships with issuer company and equity transactions to be performed relating to the issuer´s stock. Dr. Kalliwoda Research has entered into an agreement about the creation of this document with the company which is, or whose financial instruments are the issue of this research.
Conflicts of interest may be in existence with employees of DR. KALLIWODA RESEARCH GmbH who are the authors of this document as well as other persons that were involved in the preparation of this research or related parties.
18 paragon AG | Update | May 2016
Following conflicts of interest might exist:
1. Dr. Kalliwoda Research GmbH employees or other persons that were involved in the preparation of this document or
related parties might have a major shareholding (holding more than 5%) of the share capital of the emitter that is, or whose financial instruments are, the subject of the research.
2. Dr. Kalliwoda Research GmbH employees or other persons that were involved in the preparation of this document or
related parties are possibly holders of instruments that are mentioned in this research (or that are linked to these instruments) or might become holders and could regularly trade the emitter´s securities or securities based on these issues as principal or agent.
3. Dr. Kalliwoda Research GmbH employees or other persons that were involved in the preparation of this document or
related parties could have participated in leading a consortium for the emitter via a public offering of the financial instruments that are the subject of this research.
4. Dr. Kalliwoda Research GmbH employees or other persons that were involved in the preparation of this document or
related parties might have been party to an agreement on the provision of investment banking services with the emitter which is the subject of this research, or have received services or a pledge to perform under the terms of such an arrangement during the same period.
5. Dr. Kalliwoda Research GmbH employees or other persons that were involved in the preparation of this document or
related parties may have other substantial economic interests concerning to the emitter which is the subject of this research.
6. Dr. Kalliwoda Research GmbH employees or other persons that were involved in the preparation of this document or
related parties might have been party to an agreement with the company, which is the subject of this research, resulting in receiving the compensation for preparation of this research.
7. Dr. Kalliwoda Research GmbH employees or other persons that were involved in the preparation of this document or
related parties received the feedback concerning the company profile and SWOT from the company, which is the subject of this research, before publishing this report to the public.
Important: Please get familiar with possible risks and possible conflicts of interest in the disclosure and disclaimer at the end of this report, especially for this report: 6. and 7.
The analysts have limited access to gain information that possibly could constitute a conflict of interest for the institution Dr. Kalliwoda Research GmbH keeps insider registers appropriate to sec. 15 WpHG for assignees that normally have approach to inside information. Insiders´ dealings appropriate to sec. 14 WpHG categorically are prohibited.
The analysts that composed this research did not receive or acquire shares in the emitter that is the subject of this document at any time. The analysts mentioned above herby certify that all of the views expressed accurately reflect the individual views about the emitter. No part of the indemnity was, is or will be, directly or indirectly, linked to the evaluation result or views expressed by the analyst in this research.
C. Disclaimer:
This document is published and being distributed by Dr. Kalliwoda Research GmbH solely for informational purposes and for the personal use by persons in Germany. This research is not intended to be in any form an offer or advice to buy or sell the securities referred to herein. This research is intended to provide information to assist investors in making their own investment decisions. Any decision to purchase any securities of the emitter must be made solely on the basis of the information contained in the offering documents from the emitter relating to such securities and not on the contents hereof. Furthermore, our recommendation may not be fully
19 paragon AG | Update | May 2016
suitable to every investor, depending on their investment objective, individual financial situation or targeted holding period.
Potential investors should seek professional and individual information and advice before making their investment decisions. This document neither constitutes a contract or any kind of obligation.
Neither this document nor any copy, in whole or in part, thereof may be distributed in any other jurisdiction where its distribution might be restricted by law, and person into whose published this document comes should inform and observe themselves about any such restrictions.
The information within this document has been obtained from sources believed by Dr. Kalliwoda Research GmbH to be reliable. Dr. Kalliwoda Research GmbH does not examine the information to be verify and complete, nor warrantees its correctness and completeness. Although due attention has been taken in compilation this document, it cannot be excluded that the information given is not complete or the document contains mistakes.
The liability of Dr. Kalliwoda Research GmbH shall be restricted to gross negligence and wilful misconduct. All aspects penned in this document are those of Dr. Kalliwoda Research GmbH respectively the authors and subject to modify without notice. Possible faults or incompleteness of this document may be reformed by Dr. Kalliwoda Research GmbH and do not constitute reasons for liability, neither with regard to indirect nor to direct or consequential losses.
Moreover, Dr. Kalliwoda Research GmbH does not accept any responsibility and liability for any damage arising from using of this research or its contents or otherwise arising in relation herewith. In each case, the liability and responsibility of Dr. Kalliwoda Research GmbH is limited to typical, predictable damages and the liability for any direct or indirect losses is excluded.
This document is subject to the laws of the Federal Republic of Germany. Place of jurisdiction is Frankfurt am Main, Germany.
This document or any copy, in whole or in part thereof, may be distributed in any other jurisdiction where its distribution might be restricted by law and persons who have access to this document have to inform and observe themselves about any such restrictions.
In the United Kingdom this document is to be distributed only to persons who are described in Section 11 (3) of the Financial Services Act 1986 (Investment Advertisements) (Exemptions) Order 1996 (as amended). This research may not be distributed and forwarded directly or indirectly to any other group of individuals. The distribution of this document in other international jurisdictions may be restricted by law and individuals who possess this study should inform themselves of any existing restrictions and comply with them.
Neither this document nor any copy of it may be taken or transmitted into the United States of America, Canada, Japan or Australia or distributed, directly or indirectly, in the United States of America, Canada, Japan or Australia or to any resident thereof. Any Failure to comply with these restrictions may constitute a violation of United States, Canadian, Japanese or Australian securities laws or the law of any other jurisdiction.
By confirming this document the reader or user agrees and accepts to be bound by all of the foregoing provisions and this disclaimer. Besides, the user accepts not to distribute this document to unauthorized persons. The user of this document compensated Dr. Kalliwoda Research GmbH for any disadvantages, damages, claims and losses resulting from or in relation with the unauthorized use of this document.
© 2016 Dr. Kalliwoda Research GmbH, Arndtstraße 47, D-60325 Frankfurt am Main. All rights reserved.


