PARADOXICAL MOVEMENT OF THE LOWER RIB CAGE AT REST AND
DURING EXERCISE IN COPD PATIENTS
Andrea Aliverti1, Marco Quaranta1,2, Biswajit Chakrabarti2
Andre Luis Pereira Albuquerque2,3 and Peter M. Calverley2
1 TBM Lab, Dipartimento di Bioingegneria, Politecnico di Milano, Milano, Italy
2 Clinical Sciences Centre, University Hospital Aintree, University of Liverpool, Liverpool,
United Kingdom.
3 Federal University of Sao Paulo, Brazil
Address for correspondence
Andrea Aliverti,
TBM Lab, Dipartimento di Bioingegneria, Politecnico di Milano
P.zza L. da Vinci, 32, 20133 Milano, Italy
Tel.: +39 02 23999006,
Email: [email protected]
This work is supported by the British Lung Foundation and by a ERS Training Fellowship
Andrea Aliverti is a recipient of an ERS COPD award.
Part of this work has been presented as a poster (A. Aliverti, M. Quaranta, B. Chakrabarti,
P.M. Calverley. Hoover's Sign, Dynamic Hyperinflation and Dyspnoea during Exercise in
COPD) at the ATS International Conference, San Francisco, May 2007.
. Published on September 17, 2008 as doi: 10.1183/09031936.00141607ERJ Express
Copyright 2008 by the European Respiratory Society.
ABSTRACT
Paradoxical inward displacement of the costal margin during inspiration is observed in many
COPD patients at rest but its importance is unclear.
We studied 20 patients (FEV1=32.6±11.7, FRC=186±32%pred) and 10 healthy controls at
rest and during symptom-limited incremental exercise. With optoelectronic plethysmography
we quantified the phase shift between pulmonary and abdominal ribcage volumes and the
percentage of inspiratory time the rib cage compartments moved in opposite directions using
control data to define the normal range of movement.
Eight patients showed lower ribcage inspiratory paradox (P+) at rest while 12 patients did not
(P-). This was unrelated to resting lung function or exercise tolerance.
Total end-expiratory chest wall volume (EEVcw) increased immediately when exercise
began in P+ patients, but later in exercise in P- patients (p<0.001). This difference in EEVcw
was mainly due to a greater increase of end-expiratory pulmonary ribcage volume (p<0.001) in
P+ patients. During exercise, dyspnoea increased similarly in the two groups, while leg effort
increased more markedly in the patients without paradox (p<0.01).
We conclude that lower ribcage paradox at rest is reproducible, associated with early-onset
hyperinflation of the chest wall and predominant dyspnoea at end-exercise. When paradox is
absent, the sense of leg effort becomes a more important symptom limiting exercise.

Keywords: Chronic Obstructive Pulmonary disease; Hoover’s sign; chest wall asynchrony;
exercise; dyspnoea
Running title: Rib cage paradox in COPD
INTRODUCTION
In healthy people inspiration occurs as a result of the coordinated action of the chest wall
muscles. As the diaphragm flattens, the incompressible abdominal contents displace the
abdominal wall outwards. The ribcage comprises two linked compartments: the lung apposed
part (pulmonary rib cage, RC,p) expanded by inspiratory rib cage muscle action and submitted
to pleural pressure, and the diaphragm apposed part (abdominal rib cage, RC,a) expanded as
this muscle contracts and submitted to abdominal pressure. During inspiration the expansions
of the abdomen and both ribcage compartments are in phase, a relationship that persists when
the subject exercises although now end-expiratory lung volume is actively reduced by
increased expiratory abdominal muscle action [1].
In Chronic Obstructive Pulmonary Disease (COPD) the situation is different. Here, the
diaphragm is flatter and the respiratory drive is increased [2]. In this condition, the
effectiveness of the diaphragm is less than in normal subjects, the expansion of the lower rib
cage caused by diaphragmatic contraction is smaller than in normal subjects and consequently
it is possible that an uncoordinated expansion of the two rib cage compartments occurs, leading
to rib cage distortion [3, 4]. Before the advent of objective measurements of chest wall volume,
clinical observation had identified patients who exhibited paradoxical (inward) movement of
their lower ribcage on inspiration [5, 6, 7, 8]. Such inspiratory paradoxical motion of the lower
rib cage is common in COPD [7, 8] and has been proposed as an aid to diagnosis [9]. However,
until now it has not been quantified or related to other forms of respiratory behavior or the
symptoms which limit exercise.
Previously, we have used Opto-Electronic Plethysmography (OEP) to identify differences in
the behaviour of the rib cage and abdominal compartments of COPD patients during rest and
exercise [10, 11, 12, 13]. However, we did not study the effect of within-breath asynchrony
between different rib cage compartments. We hypothesized that the presence of lower rib cage
paradoxical movement would relate to the pattern of the end-expiratory and end-inspiratory
chest wall volume changes during exercise. To test this we defined the normal range of lower
rib cage paradox by studying a group of age-matched healthy controls and then measured
regional chest wall volumes at rest and during exercise in stable COPD. Additionally, to
investigate the relevance of paradoxical lower rib cage movement to exercise undertaken in
daily life, we measured exercise performance and symptoms during self-paced corridor
walking.
METHODS
Subjects
We studied 20 male patients who met the clinical and physiological diagnostic criteria for
COPD [14]. All patients were or had been tobacco smokers, were less than 75 years old and
had a post-bronchodilator FEV1/FVC <0.7, a pre-bronchodilator FEV1 <50% predicted and
showed <10% improvement in FEV1 after inhaled bronchodilator drugs. Patients were not
known to have paradoxical lower rib cage movement prior to the study and no specific
examination for the presence of Hoover’s sign [5, 6] was undertaken. No patient had
experienced a COPD exacerbation requiring treatment in the previous six weeks. All were
treated with inhaled corticosteroids and long-acting inhaled bronchodilators together with
short-acting rescue therapy. In addition, we recruited 10 healthy age-matched volunteers who
followed the same measurement protocol as follows. Subjects had normal spirometry for their
age and an FEV1/FVC value >0.7.
Protocol
All assessments were made on a single study day. After clinical review, spirometry and
plethysmographic lung volumes were measured in all subjects and repeated in the COPD
patients 15 minutes after 400 µg Salbutamol given via a spacer device. Each COPD patient
performed two six-minute walking tests with a 20 minute rest period between testing. The first
walk was used to familiarise the patient with the test and only data from the second walk are
reported. After a 20 minutes rest during which the OEP reflective markers were applied (see
below), patients were seated on the cycle ergometer and asked to execute three Slow Vital
Capacity (SVC) and three Forced Vital Capacity (FVC) maneuvers followed by two minutes of
quiet breathing (QB) to establish baseline values for the chest wall volumes. After this,
subjects undertook the incremental exercise protocol described below. Subject started
pedalling, first unloaded for 2 minutes, and then with an incremental load of 5 watts per minute
until exhaustion.
The research protocol was approved by the district research ethics committee and informed
consent was obtained from each participant.
Measurements
Subdivisions of lung volumes were measured to ATS standards in a body plethysmograph
(Medgraphic Autolink 1085D, MedicalGraphics, St Paul, MN, USA) . Flow was measured at
the mouth by a screen pneumotachograph and integrated to display the flow-volume loop from
which spirometry and flow indices were derived.
Self-paced corridor walking tests were performed according to standard protocols with a
standardised walking course [15]. Subjects walked at their maximal pace along an elliptical 40
meter course. They were asked to cover as much ground as possible while maintaining a
steady pace without running during the allotted time. No encouragement was given, and
subjects were informed each minute of the time remaining. The patients were allowed to stop,
but they could start again, if possible, within the allocated 6 min. Distance covered in 6 min
was recorded, together with oxygen saturation and HR from a lightweight pulse oximeter
(Minolta PulseOx 3i, USA). During exercise subjects were asked to rate their breathlessness
and the sense of leg effort every minute on a 10-point modified Borg category scale.
Incremental exercise was performed while seated on an electrically braked cycle ergometer.
With the subjects breathing through a mouth piece with a nose clip, breath by breath
ventilatory variables were derived from the flow signal detected by a pneumotachograph
system (Medical Graphics, St Paul, MN, USA). Oxygen consumption and carbon dioxide
production were measured using a paramagnetic sensor and infrared carbon dioxide analyser,
respectively, as part of an exercise testing system (Medical Graphics, St Paul, MN, USA). The
flow signal was synchronised to that of the motion analyser used for OEP and sent to a
personal computer for subsequent analysis. Oxygen saturation was measured by pulse oximetry
(Biox 3700e, Ohmeda, Louisville, CO, USA) and cardiac frequency was determined using the
R-R interval from a 4-lead electrocardiogram. During the exercise tests, subjects were asked to
rate their breathlessness and legs effort every minute on the same Borg category scale used in
the walking tests.
Kinematics of the chest wall (see below) were measured by Opto-Electronic
Plethysmography (OEP System, BTS, Milano, Italy). In brief, the volumes displaced by the
three compartments of the chest wall were measured by 89 retro-reflective markers placed on
the trunk of the subject according to precise anatomical reference points. Marker positions
were captured by 6 TV cameras (3 in front and 3 behind the subject) operating at 60 frames per
second and synchronised with coaxial infrared flashing LEDs. The three-dimensional
coordinates of the markers were calculated with stereo-photogrammetry and linked with a
mesh of triangles to create the surface embedding the trunk. The volume of the trunk enclosed
by the surface was obtained through a computing algorithm based on the Gauss’ theorem [16].
Data analysis
Modeling of the chest wall. The chest wall was modelled in three compartments: pulmonary
rib cage (RC,p), abdominal rib cage (RC,a), and abdomen (AB). Thus, the total volume
displaced by the chest wall (CW) was calculated as the sum of the volumes displaced by the
individual compartments. The boundaries between the three portions were represented by a
transversal section placed at the level of the xiphoid process(between RC,p and RC,a) and
another surface positioned at the level of the lower costal margin (between RC,a and AB)
(figure 1). The time courses of the volume of each region (Vrc,p, Vrc,a, Vab), along with their
sum (Vcw) was processed to obtain a breath-by-breath assessment of both ventilatory pattern
and operational chest wall volumes [1, 4, 16].
Chest wall volume data were standardized for the duration of each test to allow comparisons
between different subjects as a percentage of maximum exercise. Comparisons were also made
using minute ventilation as a percentage of the maximum value reached and as an absolute
value.
Quantitative analysis of the paradoxical movement of the lower rib cage. The presence of
paradoxical lower rib cage motion was established by comparing the time courses of Vrc,p,
and Vrc,a. In each patient the volume tracings were normalized with respect to time to allow
ensemble averaging over three reproducible consecutive breaths randomly chosen within the
period of interest (either quiet breathing or during exercise at different levels) and to derive an
'average' respiratory cycle at each level of workload. Inspiratory and expiratory phases of the
breathing cycles were derived from the Vcw signal. From these average breaths asynchronous
and paradoxical motion between the two rib cage compartments were then assessed by
calculating the following parameters (Figure 2 for graphical illustrations):
a. Phase shift (θ) between Vrc,a and Vrc,p, as indicated by the degree of opening of the
Lissajou figure produced when these two volumes were plotted against each other. This
was measured as the ratio of the distance delimited by the intercepts of the Vrc,p vs.
Vrc,a dynamic loop on a line parallel to the X-axis at 50% of pulmonary rib cage tidal
volume (m), divided by RC,a tidal volume (s), as θ=sin-1(m/s) , an approach adopted by
others [17]. In this system a phase angle of 0 represents completely synchronous
movement of the compartments and 180o total asynchrony.
b. Inspiratory paradox time (IP), defined as the fraction of the inspiratory time during which
the abdominal rib cage volume decreased (see dashed area in Fig. 2).
Patients were subdivided into those showing paradox at rest (P+) and those who did not (P-
). This grouping was based on threshold values of IP and θ, obtained at rest before the various
maneuvers in the 10 healthy volunteers and defined as values two standard deviations beyond
the respective means. To confirm the validity of these measurements three different breaths
were selected under the same workload in both the control and COPD subjects and the data
compared to the initial estimate. In three COPD patients the data on the first incremental test
were repeated on a subsequent day to determine whether differences in marker position
positioned by different experimenters or day to day variability in the subjects breathing
influenced the classification of paradoxical movement.
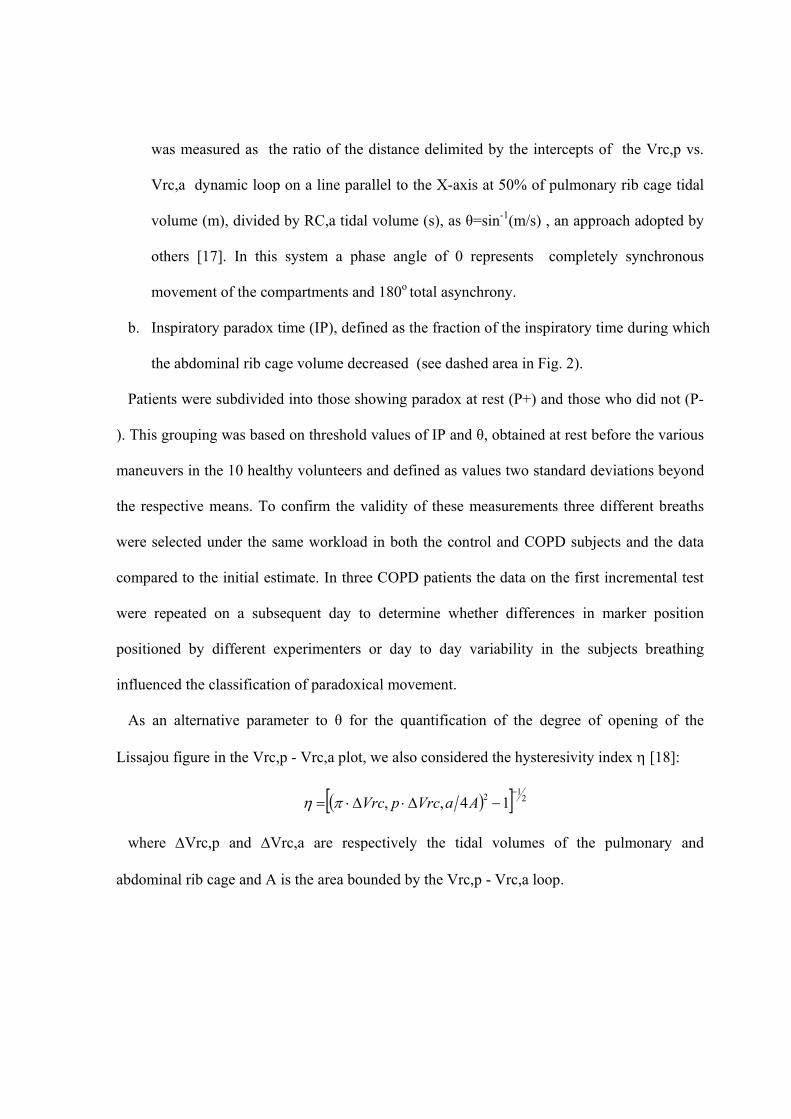
As an alternative parameter to θ for the quantification of the degree of opening of the
Lissajou figure in the Vrc,p - Vrc,a plot, we also considered the hysteresivity index η [18]:
( )[ ] 212 14,,−
−∆⋅∆⋅= AaVrcpVrcπη
where ∆Vrc,p and ∆Vrc,a are respectively the tidal volumes of the pulmonary and
abdominal rib cage and A is the area bounded by the Vrc,p - Vrc,a loop.
In a post-hoc analysis we examined whether the presence of tidal expiratory flow limitation
at rest was related to our indices of paradoxical lower rib cage movement and the behavior of
patients during exercise. The flow signal was integrated to obtain flow-volume loops during
rest, forced expiratory maneuvers and maximal exercise. To correct the drift of the volume
signal obtained from the integration of the flow measured at the mouth we positioned the
loops accordingly to the values of chest wall volume measured at TLC during inspiratory
capacity maneuvers performed at rest before the various maneuvers during which the loops to
be compared were recorded. Expiratory flow limitation was considered present at rest when
>50% of the tidal breath met or exceeded the expiratory boundary of the maximal flow-
volume loop [19].
Statistical analysis
Data are presented as mean (SD) unless otherwise stated. Differences between
anthropometric, spirometric, and exercise data sets were tested using Wilcoxon and Mann-
Whitney tests for paired and unpaired data, respectively with appropriate adjustment for
multiple comparisons. To evaluate the influence of rib cage paradox and exercise intensity on
ventilatory parameters and operational volumes a two way analysis of variance (ANOVA)
was performed. Statistical significance was assumed if the null-hypothesis was rejected with a
probability of p<0.05.
RESULTS
Anthropometric characteristics, spirometry values and subdivision of lung volumes are
reported in Table 1.
Defining the occurrence of paradoxical rib cage movement at rest
The magnitude of volume change, its timing and the phase angle relationship of the RC,p
and RC,a regions are shown for three typical subjects in figure 2, while all the individual
Vrc,a and Vrc,p time courses and Vrc,p-Vrca loops are presented in the online supplement.
Using a difference of at least two standard deviations above the mean value for the normal
subjects (99% C.I.) gave a threshold for the upper limit of normal of 14.0 degrees for phase
angle and 20.3% for the IP%. When three different breaths were chosen and the analysis
repeated similar values were obtained and no individual would have been classified as
showing rib cage paradox, even if only one criterion were used (see online supplement).
Among the COPD patients, 8 subjects met both criteria for paradox (P+) while the
remaining 12 did not (P-). Of these, 7 subjects showed no evidence of paradox by either
criteria, 4 showed only an abnormal phase angle and one an increased IP (fig. 3a).
Both indices of paradoxical lower ribcage movement lay close to the upper limit of normal
in the P- subjects but were clearly separate from those in the P+ subjects at rest (p<0.001) (fig.
4). The reproducibility of the % inspiratory time and phase angle in the COPD patient data
was good. No patient would have been re-classified had different breaths been chosen.
Likewise we did not see any difference among the replicate data on three different occasions
both at rest and during exercise (see online supplement).
When hysteresivity η was plotted instead of phase angle against IP to investigate rib cage
paradox (fig. 3b), among the COPD patients, 9 subjects showed values of both IP and η above
threshold. Of these, 8 subjects were previously classified as P+, and the remaining was the
one with above-threshold IP and below-threshold θ.
Tidal expiratory flow limitation
Among the P+ patients, all showed clear evidence of expiratory flow limitation at rest using
our flow-volume criteria (see above). Among the P- patients, 9 of the 12 where flow limited
and three of these flow limited patients had a value of phase angle above the threshold (see
online supplement, fig. E4).
Paradoxical ribcage movement during exercise
The time courses of the phase angle and %IP during unloaded, half maximal and maximal
exercise are shown in fig. 4. At rest, the P+ group showed, by definition, high mean phase
angle and %IP than the P- group. During exercise, the phase angle did not change
significantly in the control and the P- groups, but in the P+ group the phase angle fell at
maximal exercise so that there was no longer any significant difference between the P+ and
the P- groups. The %IP patterns, like the phase angle, were similar throughout for the control
and P- groups, but, unlike the phase angle, increased substantially during exercise,
approaching the levels of the P+ group.
Spirometry, lung volumes and exercise performance in the COPD
The presence of rib cage paradox was not associated with statistically significant differences
in spirometry or any measurement of resting lung volume when compared to patients who did
not show this finding. There were no significant differences in the maximum workload, peak
oxygen consumption achieved, maximum minute ventilation or breathing pattern between the
two groups of COPD patients (table 2).
Chest wall volumes during incremental exercise.
None of the normal subjects showed evidence of an increased end-expiratory total chest
wall volume (EEVcw) at end-exercise relative to their baseline values and all showed an
early fall in EEVcw as exercise began (Fig. 5). In contrast, P+ subjects showed an early
increase in EEVcw (Fig.6a) and this was maintained up to the maximum workload, exceeding
the values of the spontaneous breathing by a mean of 328 ml. In contrast, P- subjects
maintained an EEVcw similar to the baseline value up to approximately 50% of maximum
workload. EEVcw slowly rose thereafter showing a late hyperinflation of 297 ml at end
exercise, a value similar to that of the P+ subjects (when volumes were expressed as change
from baseline as in fig. 6) but statistically different from the healthy volunteers (p<0.001).
These findings were similar when data where expressed using minute ventilation either as a
percentage of the maximum or as an absolute value (fig. 6b) .
The time course of the end-expiratory and end-inspiratory regional chest wall volumes
differed significantly between the healthy subjects and the two COPD groups (fig. 7). In P+,
RC,p end-expiratory volumes rose immediately after the onset of exercise while this volume
increased to a lesser degree in P- and normals (p<0.001). End-expiratory volumes of RC,a
increased during exercise in a similar way in P+ and P- groups, while in healthy subjects they
remained constant up to approximately 60% of the maximum workload and then increased on
average by 316 ml at end exercise. In healthy subjects the abdominal volume at end-expiration
significantly fell throughout the exercise while at end exercise the two COPD groups reached
values identical on average to those measured during quiet breathing.
Symptoms and self-paced exercise.
Data for the symptom intensity of dyspnoea and leg effort for both incremental and self-
paced exercise and total distance walked for both P+ and P- patients are presented in table 2
while the symptoms at rest, the mid-point of exercise testing and end-exercise are shown in
fig. 8. The intensity of dyspnoea reported at end-exercise was similar in the two groups with
both types of exercise. However, the symptom intensity of leg effort was significantly less in
P+ patients during incremental exercise (p<0.01) with a similar trend in the self-paced walk
test (p<0.05). The difference between dyspnoea and sense of leg effort severity was
statistically significant in both types of test (p<0.01 or less). Oxygen saturation and heart rate
data did not show significant differences between P+ and P- groups for either corridor
walking or cycling test.
DISCUSSION
Although the movement of the rib cage during the respiratory cycle normally tracks the change
in lung volume, this is not always the case in patients with obstructive lung disease, as has
been recognised by clinicians for many years [5, 6]. Magnetometer studies have identified
different patterns of behaviour in the upper and lower rib cage [2, 7, 8] but our data are the first
to provide a quantitative three-dimensional assessment of the effect of lower rib cage paradox
on chest wall volumes, ventilatory pattern and symptoms at rest and during exercise. We
observed that COPD patients with paradox increased their end-expiratory chest wall volume as
soon as exercise began while those without lower rib cage paradox only hyperinflated their
chest wall towards the end of incremental exercise. These changes were reflected in the
symptoms reported during exercise with dyspnoea being the major complaint when paradox
was present, irrespective of whether the exercise was incremental or self-paced. This suggests
that different patterns in the timing of end-expiratory chest wall volume change [12] relates to
patient symptoms and can be reliably predicted by rib cage movement assessed under resting
conditions.
We defined paradoxical rib cage movement by quantifying the asynchrony between the two rib
cage regions during inspiration. We followed the model proposed by Ward et al [20] and used
by others reporting data with opto-electronic plethysmography [1, 4] in which the rib cage is
considered as formed by two sub-compartments, i.e. the part that is apposed to the lung, the
pulmonary rib cage, and the part apposed to the diaphragm, the abdominal rib cage. The
boundary between the pulmonary and the abdominal rib cage was defined by a surface
identified by a set of markers placed at the level of the xiphisternum (fig. 1) and this does not
change with diaphragm movement. Thus in COPD patients the abdominal rib cage volume
may not precisely correspond to the true area of apposition but is best considered as
representing the lower rib cage where the muscles inserted and acting in that area differ from
those influencing upper rib cage volume.
While previous workers have used changes in the lateral and antero-posterior dimensions of the
rib cage to do this [7, 8], our approach was based on the analysis of volume variation, obtained
by integrating the three-dimensional motion of multiple surface markers. Thus our data are not
strictly comparable to those obtained by two-dimensional analysis of lower ribcage movement
alone, and they provide a description of normal or paradoxical inspiratory motion that includes
and integrates changes of dimensions in multiple directions. We used a conservative definition
of paradox based on the relative movement of the upper and lower rib cage regions which was
only considered to be significant when there were changes beyond the normal range in both the
percentage of inspiratory time where paradox was seen and in the phase angle shift. The latter
index provided a measure of the degree of chest wall distortion while the former indicated how
much of the inspiratory period was affected. We were able to classify individuals in a binary
fashion although the variables themselves are likely to represent a continuous spectrum of
severity as can be seen in fig. 3 and table E1. Each of these measurements proved relatively
reproducible in both healthy subjects and those with COPD when different breaths were
ensemble averaged to generate the data. Moreover, differences in individual operators
positioning the markers on different days did not influence the results nor did the classification
if resting paradoxical rib cage movement change if different breaths were used to define it.
When a different index like the hysteresivity of the Vrc,p-Vrc,a loop was considered instead of
the phase shift angle, the classification did not change substantially. Only one patient who
previously showed an increased percentage inspiratory paradox without an apparently
abnormal phase angle shift would have been re-classified as belonging to the P+ group.
Interestingly, this patient showed relatively early onset of chest wall hyperinflation during
exercise.
Our data were primarily observational rather than mechanistic. Like the investigators who
identified Hoover’s sign clinically, [9, 21] we found no relationship between the presence of
lower ribcage paradox and resting lung function. The only significant differences we found
between P+ and P- groups were for weight and BMI, suggesting that paradox may be
commoner as weight increases. This needs to be confirmed in a larger population of patients.
However, a selective activation of different respiratory muscle groups might explain the
relationship between the presence of rib cage paradox at rest and the increased end-expiratory
volume of the pulmonary rib cage at the onset of exercise in the P+ subjects. These patients
may exhibit an increase in ribcage and related accessory muscle tonic activation. More detailed
studies to understand the basis of resting paradox defined as we have are now underway.
Future experiments are needed to correlate paradoxical movement of the lower rib cage to
diaphragm shape and length of the area of apposition, as recently proposed by preliminary
studies based on ultrasound [2, 22, 23] and magnetic resonance [24] imaging.
Exercise modified the different components of paradox in different ways. In normal and P-
COPD subjects the phase angle was unchanged by exercise, while in P+ patients it only
decreased at maximum workload, but even then did not reach the values seen in the healthy
subjects and COPD patients without resting paradox. This result may reflect the increasing
volume, and therefore decreasing compliance, of the pulmonary ribcage as hyperinflation
develops, with a concomitant increase in the mechanical linkage between the two rib cage
portions. In contrast, in the normal and P- subjects the percentage of inspiratory paradox time
tended to increase at the onset of exercise and to remain constant thereafter, approaching levels
similar to those seen in the P+ group. This result may be attributed to the insertional action of
the expiratory abdominal muscles on the lower rib cage [1, 4], even though abdominal end-
expiratory volume decreases substantially only at the onset and during exercise in the healthy
(fig. 7).
All the P+ patients showed an early increase of total chest wall end-expiratory volume. This
was mainly due to the increase of the pulmonary rib cage volume, presumably to cope with
the expiratory action of the lower ribcage, which was not seen in the P- patients. The early
onset of chest wall hyperinflation in P+ patients was unexpected and was not related to the
duration of exercise or the severity of airflow obstruction or baseline pulmonary
hyperinflation. Retrospective classification of the presence of tidal expiratory flow-limitation
showed that all the 8 P+ patients were flow-limited compared to 9 out of 12 P- patients. None
of the P- patients exhibited chest wall hyperinflation at the onset of exercise. These results
suggest that paradoxical motion rather than the presence of tidal EFL determines early chest
wall hyperinflation. .
Breathlessness and sense of leg effort increased during exercise in patients with and without
ribcage paradox, although the relative importance of each symptom differed. At the end of
cycle exercise end-inspiratory chest wall volume which is not influenced by gas compression
and blood shift effects, approached the critical inspiratory reserve volume associated with
neuromechanical dissociation [25] in both groups. However the P+ patients were less likely to
report severe sense of leg effort than the P- patients leaving breathlessness as their principal
complaint at the end of exercise. This is in keeping with previous reports of symptom
limitation in severe COPD [26] and the predominance of effort in P- subjects was replicated
during the self-paced corridor testing. These differences were not related to degree of oxygen
desaturation, peak workload or exercise duration. The early-onset of dynamic hyperinflation
of the chest wall is the likeliest explanation for the predominance of dyspnoea in P+ patients.
In P- patients other factors such as the onset of peripheral muscle fatigue which limits exercise
in some COPD patients may have been more important [27].
Our study was designed to identify reliable objective criteria for the presence of paradoxical
lower ribcage movement and test whether these predicted physiological differences during
exercise in stable hyperinflated COPD patients. Although our criteria resemble the subjective
ones described by Hoover [6] ,we did not select our patients on the basis of a clinical diagnosis
of Hoover’s sign and we did not record this to avoid the risk of biasing our results. Others
have examined resting lower rib cage movement using the OEP method in patients defined
clinically as having Hoover’s sign and reported that Hoover's sign did not correlate with the
level of hyperinflation and therefore rib cage distortion and hyperinflation appear to be
independent factor limiting ventilatory function in stable COPD patients [21].
In summary, we have shown that abnormal lower rib cage movement is not just a clinical
curiosity but that it identifies important physiological differences in the chest wall volumes

during exercise and these translate into different patterns of reported symptoms. The early
onset of hyperinflation in those with paradox helps to explain why differences seen in
incremental exercise are still present during lower intensity self paced exercise, which relates
to the daily activity undertaken by COPD patients.
REFERENCES
1. Aliverti A, Cala SJ, Duranti R, Ferrigno G, Kenyon CM, Pedotti A, Scano G, Sliwinski P,
Macklem PT and Yan S. Human respiratory muscle actions and control during exercise. J Appl
Physiol 1997; 83:1256–1269.
2. Gorman RB, McKenzie DK, Pride NB, Tolman JF, Gandevia SC. Diaphragm length during
tidal breathing in patients with chronic obstructive pulmonary disease. Am J Respir Crit Care
Med. 2002; 166:1461-1469.
3. Chihara K, Kenyon CM, Macklem PT. Human rib cage distortability. J Appl Physiol. 1996;
81:437-447.
4. Kenyon CM, Cala SJ, Yan S, Aliverti A, Scano G, Duranti R, Pedotti A and Macklem PT.
Rib Cage Mechanics during Quiet Breathing and Exercise in Humans. J Appl Physiol 1997;
83:1242-1255.
5. Stokes W. A treatise on the diagnosis and treatment of diseases of the chest. Part 1. Diseases
of the lung and windpipe. London: The New Sydenham Society; 1837. pp. 168–169.
6. Hoover CF. The diagnostic significance of inspiratory movements of the costal margins. Am
J Med Sci 1920; 159:633-646.
7. Gilmartin JJ, Gibson GJ. Abnormalities of chest wall motion in patients with chronic airflow
obstruction. Thorax 1984; 39:264-271.
8. Gilmartin JJ, Gibson GJ. Mechanisms of paradoxical rib cage motion in patients with
chronic obstructive pulmonary disease. Am Rev Respir Dis. 1986;134:683-687.
9. Garcia-Pachon E. Paradoxical movement of the lateral rib margin (Hoover sign) for
detecting obstructive airway disease. Chest 2002;122:651-655.
10. Aliverti A, Stevenson N, Dellaca RL, Lo Mauro A, Pedotti A, Calverley PM. Regional
chest wall volumes during exercise in chronic obstructive pulmonary disease. Thorax 2004;
59:210-216.
11. Aliverti A, Rodger K, Dellaca RL, Stevenson N, Lo Mauro A, Pedotti A, Calverley PMA.
Effect of salbutamol on lung function and chest wall volumes at rest and during exercise in
COPD. Thorax 2005;60:916-924.
12. Vogiatzis I, Georgiadou O, Golemati S, Aliverti A Kosmas E, Kastanakis E, Geladas N
Koutsoukou A, Nanas S, Zakynthinos S, Roussos C. Patterns of dynamic hyperinflation during
exercise and recovery in patients with severe chronic obstructive pulmonary disease. Thorax
2005;60:723-729.
13. Georgiadou O, Vogiatzis I, Stratakos G, Koutsoukou A, Golemati S, Aliverti A, Roussos
C, Zakynthinos S. Effects of rehabilitation on chest wall volume regulation during exercise in
COPD patients. Eur Respir J 2007;29:284-291.
14. Standards for the diagnosis and care of patients with chronic obstructive pulmonary
disease. American Thoracic Society. Am J Respir Crit Care Med 1995; 152:S77-121.
15. Brooks D, Solway S and Gibbons WJ. ATS statement on six-minute walk test. Am J Respir
Crit Care Med 2003;167:1287.
16. Cala SJ, Kenyon C, Ferrigno G, Carnevali P, Aliverti A, Pedotti A, Macklem PT and
Rochester DF. Chest wall and lung volume estimation by optical reflectance motion analysis. J
Appl Physiol 1996;81:2680-2689.
17. Agostoni E, Mognoni P. Deformation of the chest wall during breathing efforts. J Appl
Physiol 1966;21:1827-32.
18. Fredberg JJ, Stamenovic D. On the imperfect elasticity of lung tissue. J Appl Physiol 1989;
67: 2408-2419.
19. Johnson BD, Weisman IM, Zeballos RJ, Beck KC. Emerging concepts in the evaluation of
ventilatory limitation during exercise: the exercise tidal flow–volume loop. Chest
1999;116:488–503
20. Ward ME, Ward JW, Macklem PT. Analysis of human chest wall motion using a two
compartment rib cage model. J Appl Physiol 1992;72:1338–1347.
21. Binazzi B, Bianchi R, Romagnoli I, Lanini B, Stendardi L, Gigliotti F, Scano G. Chest wall
kinematics and Hoover's sign. Respir Physiol Neurobiol 2008;160:325-333.
22. Singh B, Eastwood PR, Finucane KE. Volume displaced by diaphragm motion in
emphysema. J Appl Physiol 2001; 91:1913-1923.
23. Aliverti A, Ghidoli G, Dellacà RL, Pedotti A, Macklem PT. Chest wall kinematic
determinants of diaphragm length by optoelectronic plethysmography and ultrasonography. J
Appl Physiol 2003;94:621-630.
24. Suga K, Tsukuda T, Awaya H, Takano K, Koike S, Matsunaga N, Sugi K, Esato K.
Impaired respiratory mechanics in pulmonary emphysema: evaluation with dynamic breathing
MRI. J Magn Reson Imaging. 1999; 10:510-520.
25. O’Donnell DE, Voduc N, Fitzpatrick M, Webb KA. Effect of salmeterol on the ventilatory
response to exercise in chronic obstructive pulmonary disease. Eur Respir J. 2004; 24:86-94.
26. Man WD, Soliman MG, Gearing J, Radford SG, Rafferty GF, Gray BJ, Polkey MI,
Moxham J. Symptoms and quadriceps fatigability after walking and cycling in chronic
obstructive pulmonary disease. Am J Respir Crit Care Med. 2003; 168:562-567.
27. Pepin V, Saey D, Whittom F, LeBlanc P, Maltais F. Walking versus cycling: sensitivity to
bronchodilation in chronic obstructive pulmonary disease. Am J Respir Crit Care Med. 2005;
172:1517-1522.

FIGURES LEGENDS
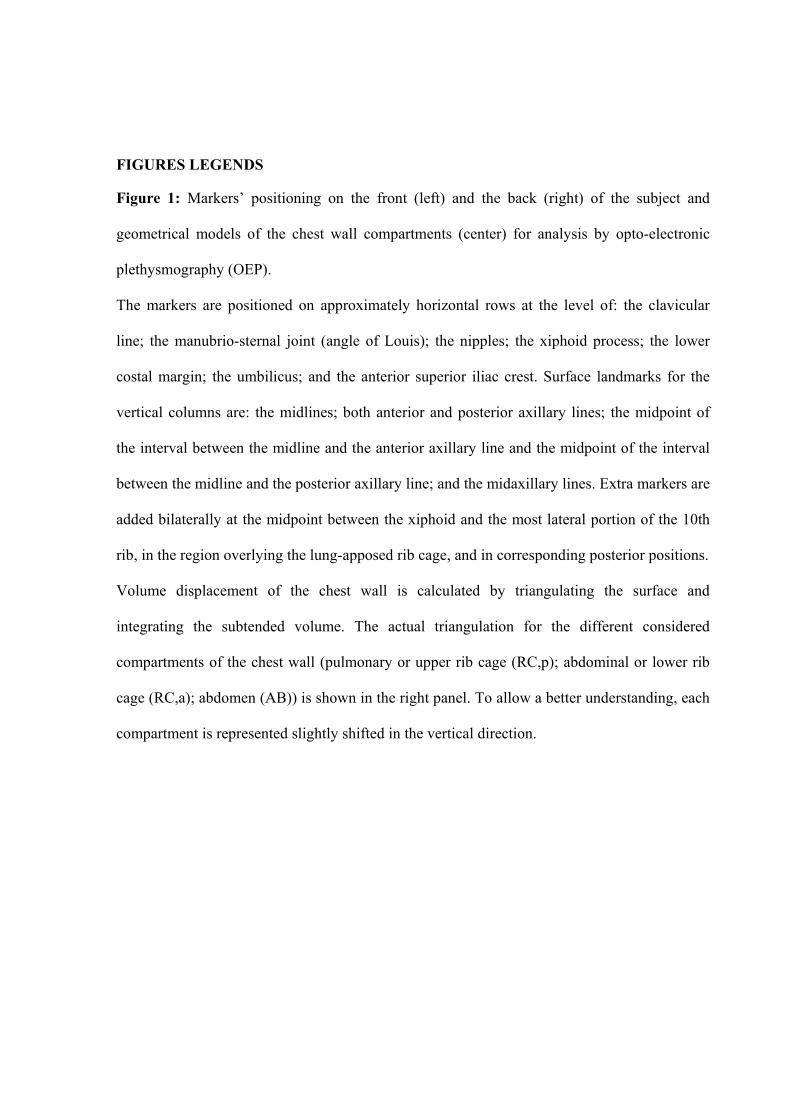
Figure 1: Markers’ positioning on the front (left) and the back (right) of the subject and
geometrical models of the chest wall compartments (center) for analysis by opto-electronic
plethysmography (OEP).
The markers are positioned on approximately horizontal rows at the level of: the clavicular
line; the manubrio-sternal joint (angle of Louis); the nipples; the xiphoid process; the lower
costal margin; the umbilicus; and the anterior superior iliac crest. Surface landmarks for the
vertical columns are: the midlines; both anterior and posterior axillary lines; the midpoint of
the interval between the midline and the anterior axillary line and the midpoint of the interval
between the midline and the posterior axillary line; and the midaxillary lines. Extra markers are
added bilaterally at the midpoint between the xiphoid and the most lateral portion of the 10th
rib, in the region overlying the lung-apposed rib cage, and in corresponding posterior positions.
Volume displacement of the chest wall is calculated by triangulating the surface and
integrating the subtended volume. The actual triangulation for the different considered
compartments of the chest wall (pulmonary or upper rib cage (RC,p); abdominal or lower rib
cage (RC,a); abdomen (AB)) is shown in the right panel. To allow a better understanding, each
compartment is represented slightly shifted in the vertical direction.
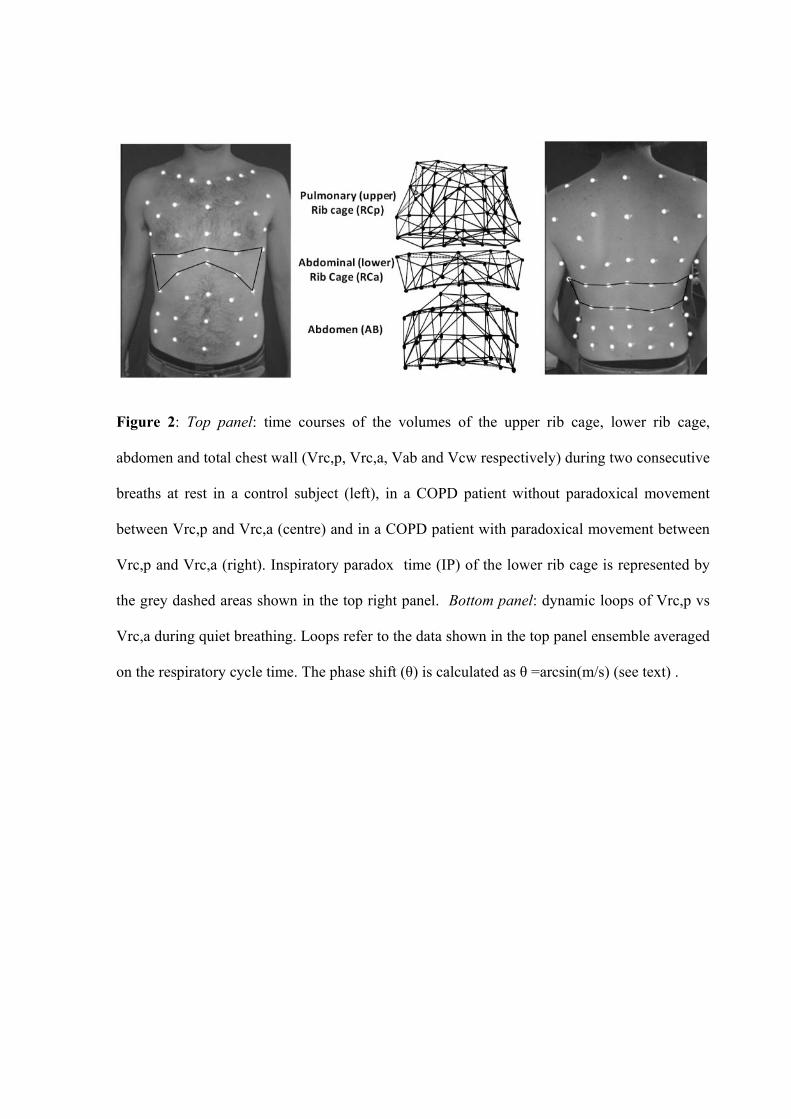
Figure 2: Top panel: time courses of the volumes of the upper rib cage, lower rib cage,
abdomen and total chest wall (Vrc,p, Vrc,a, Vab and Vcw respectively) during two consecutive
breaths at rest in a control subject (left), in a COPD patient without paradoxical movement
between Vrc,p and Vrc,a (centre) and in a COPD patient with paradoxical movement between
Vrc,p and Vrc,a (right). Inspiratory paradox time (IP) of the lower rib cage is represented by
the grey dashed areas shown in the top right panel. Bottom panel: dynamic loops of Vrc,p vs
Vrc,a during quiet breathing. Loops refer to the data shown in the top panel ensemble averaged
on the respiratory cycle time. The phase shift (θ) is calculated as θ =arcsin(m/s) (see text) .
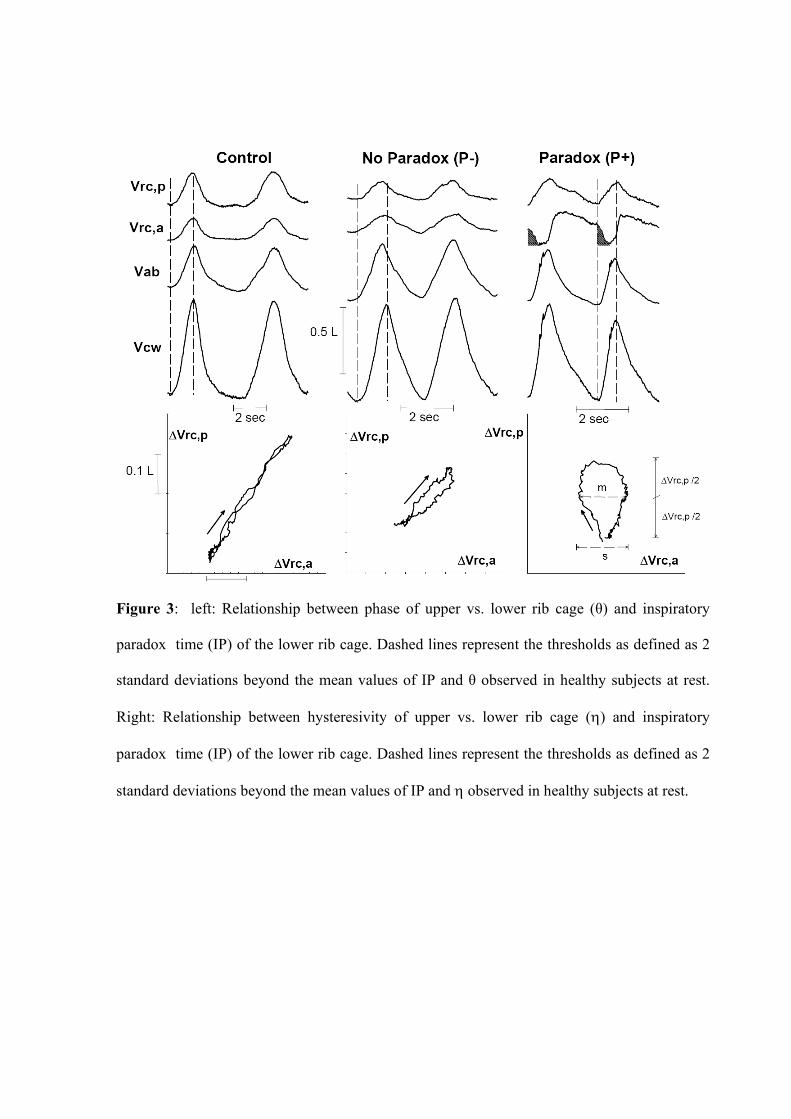
Figure 3: left: Relationship between phase of upper vs. lower rib cage (θ) and inspiratory
paradox time (IP) of the lower rib cage. Dashed lines represent the thresholds as defined as 2
standard deviations beyond the mean values of IP and θ observed in healthy subjects at rest.
Right: Relationship between hysteresivity of upper vs. lower rib cage (η) and inspiratory
paradox time (IP) of the lower rib cage. Dashed lines represent the thresholds as defined as 2
standard deviations beyond the mean values of IP and η observed in healthy subjects at rest.
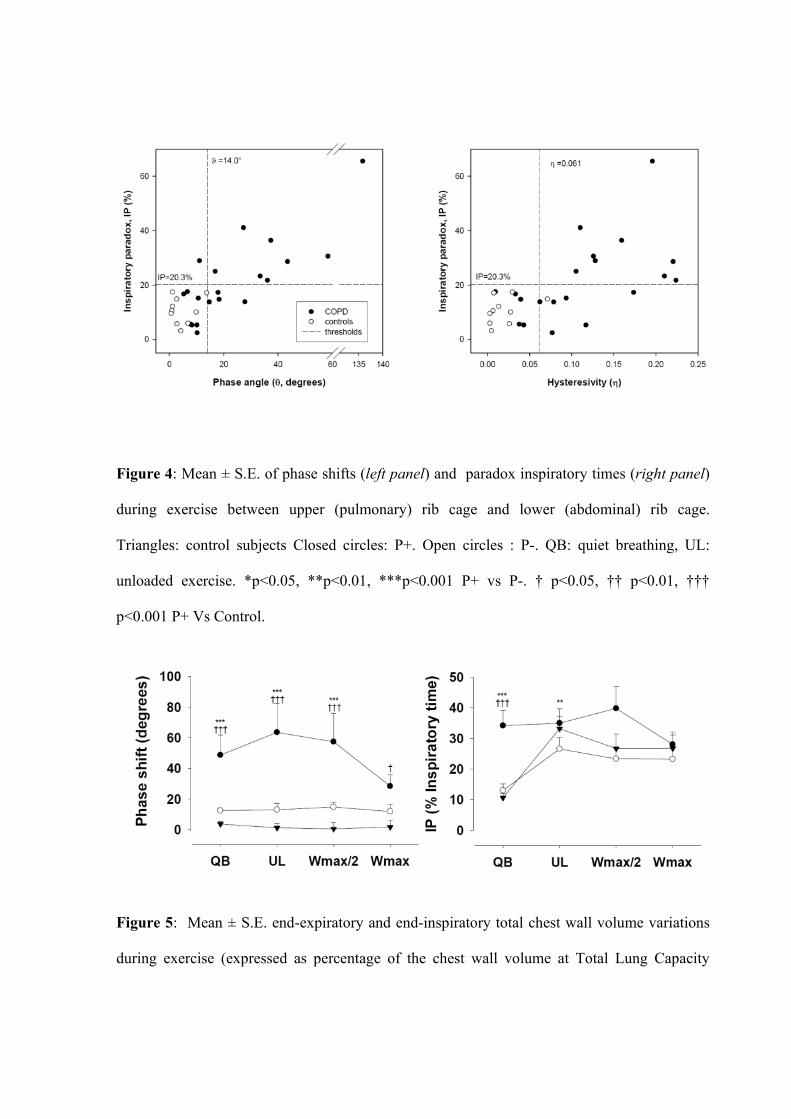
Figure 4: Mean ± S.E. of phase shifts (left panel) and paradox inspiratory times (right panel)
during exercise between upper (pulmonary) rib cage and lower (abdominal) rib cage.
Triangles: control subjects Closed circles: P+. Open circles : P-. QB: quiet breathing, UL:
unloaded exercise. *p<0.05, **p<0.01, ***p<0.001 P+ vs P-. † p<0.05, †† p<0.01, †††
p<0.001 P+ Vs Control.
Figure 5: Mean ± S.E. end-expiratory and end-inspiratory total chest wall volume variations
during exercise (expressed as percentage of the chest wall volume at Total Lung Capacity
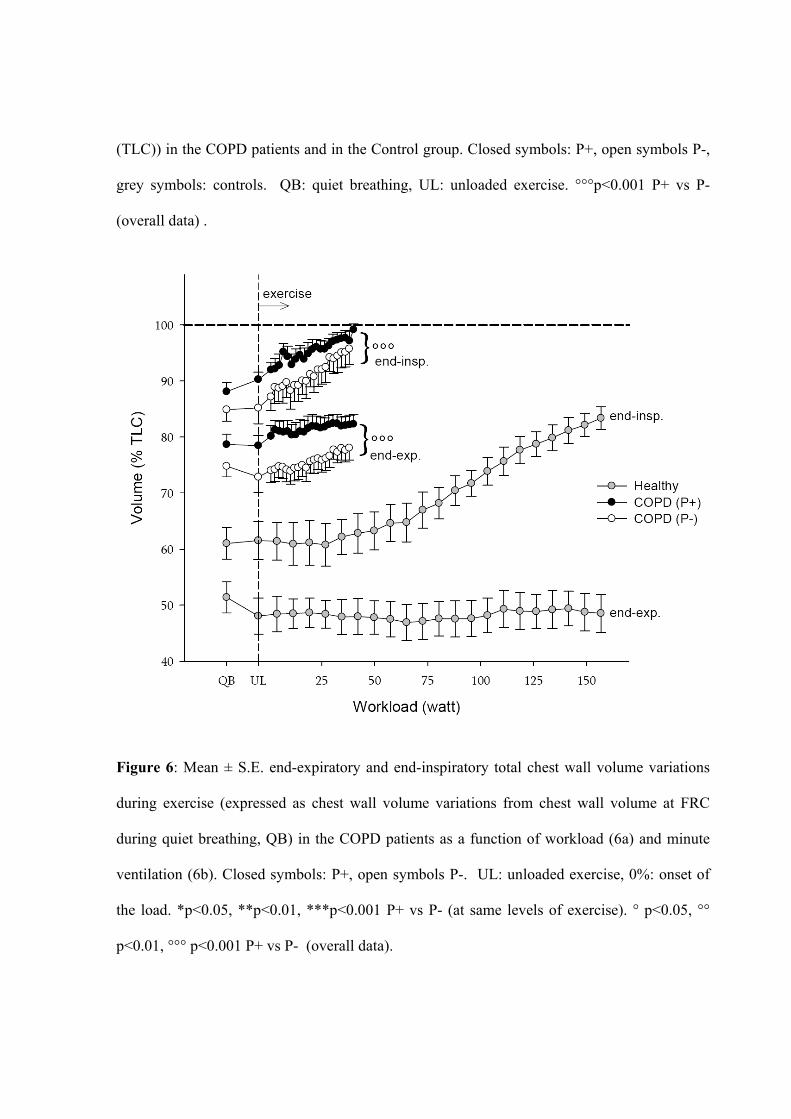
(TLC)) in the COPD patients and in the Control group. Closed symbols: P+, open symbols P-,
grey symbols: controls. QB: quiet breathing, UL: unloaded exercise. °°°p<0.001 P+ vs P-
(overall data) .
Figure 6: Mean ± S.E. end-expiratory and end-inspiratory total chest wall volume variations
during exercise (expressed as chest wall volume variations from chest wall volume at FRC
during quiet breathing, QB) in the COPD patients as a function of workload (6a) and minute
ventilation (6b). Closed symbols: P+, open symbols P-. UL: unloaded exercise, 0%: onset of
the load. *p<0.05, **p<0.01, ***p<0.001 P+ vs P- (at same levels of exercise). ° p<0.05, °°
p<0.01, °°° p<0.001 P+ vs P- (overall data).
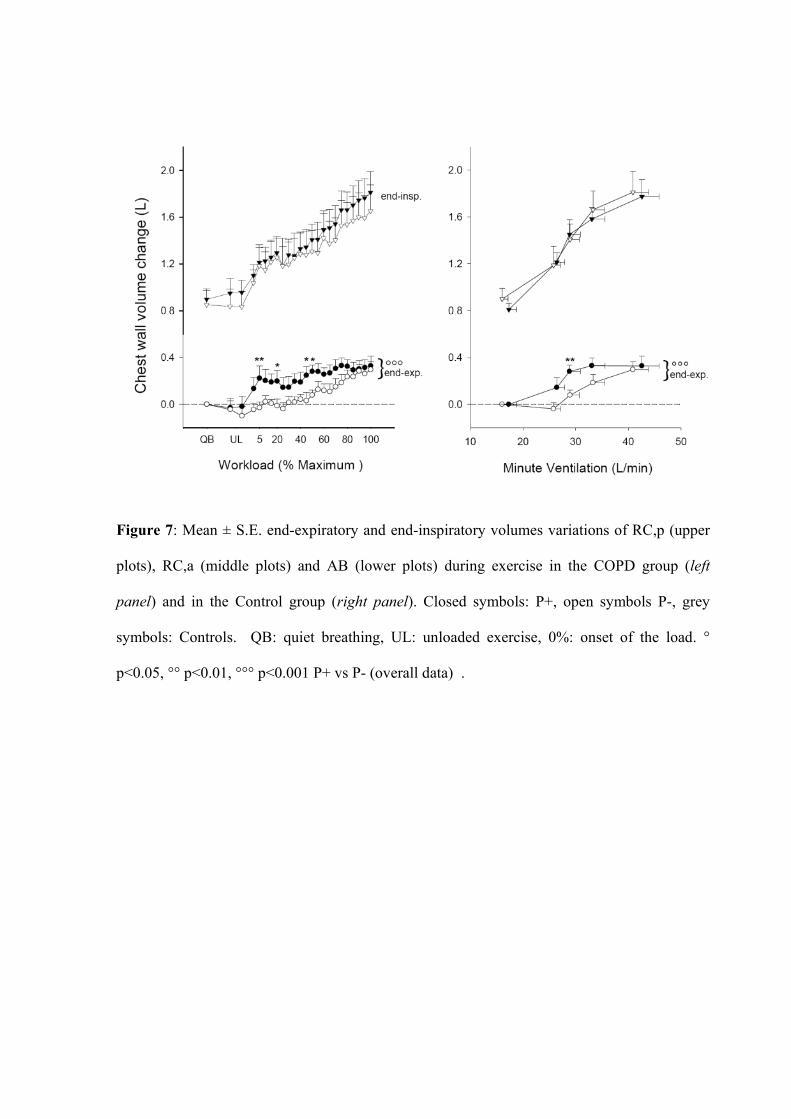
Figure 7: Mean ± S.E. end-expiratory and end-inspiratory volumes variations of RC,p (upper
plots), RC,a (middle plots) and AB (lower plots) during exercise in the COPD group (left
panel) and in the Control group (right panel). Closed symbols: P+, open symbols P-, grey
symbols: Controls. QB: quiet breathing, UL: unloaded exercise, 0%: onset of the load. °
p<0.05, °° p<0.01, °°° p<0.001 P+ vs P- (overall data) .
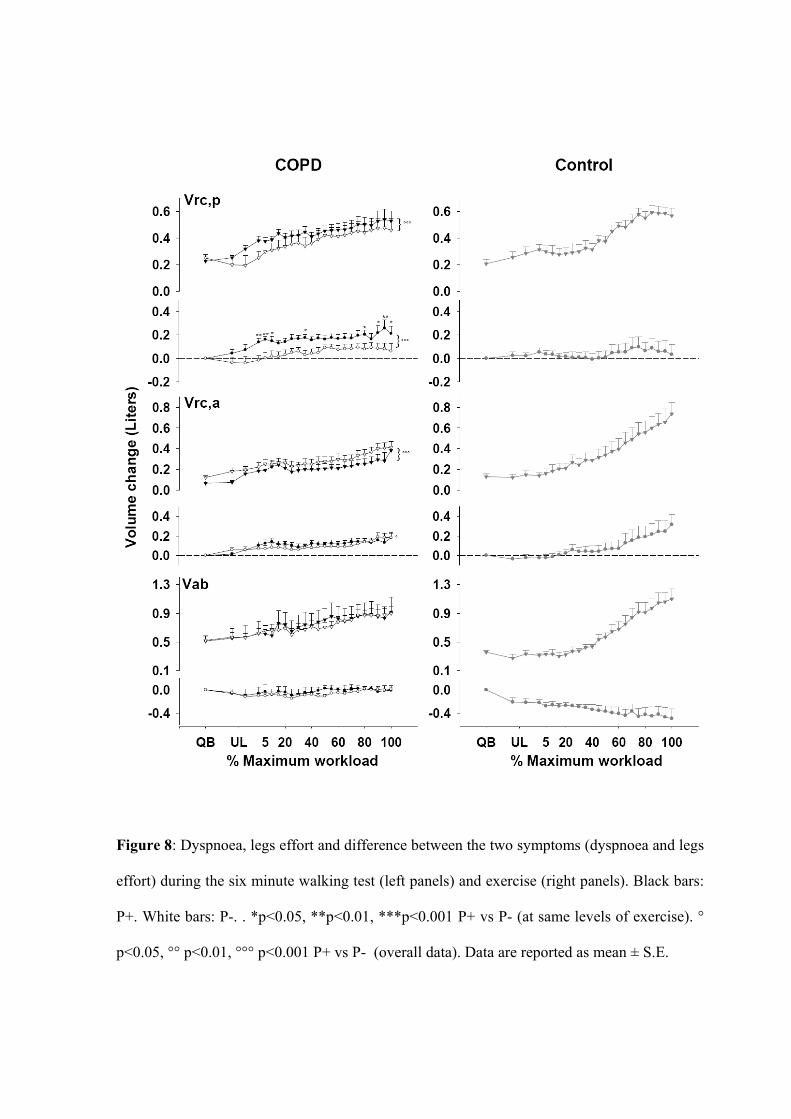
Figure 8: Dyspnoea, legs effort and difference between the two symptoms (dyspnoea and legs
effort) during the six minute walking test (left panels) and exercise (right panels). Black bars:
P+. White bars: P-. . *p<0.05, **p<0.01, ***p<0.001 P+ vs P- (at same levels of exercise). °
p<0.05, °° p<0.01, °°° p<0.001 P+ vs P- (overall data). Data are reported as mean ± S.E.

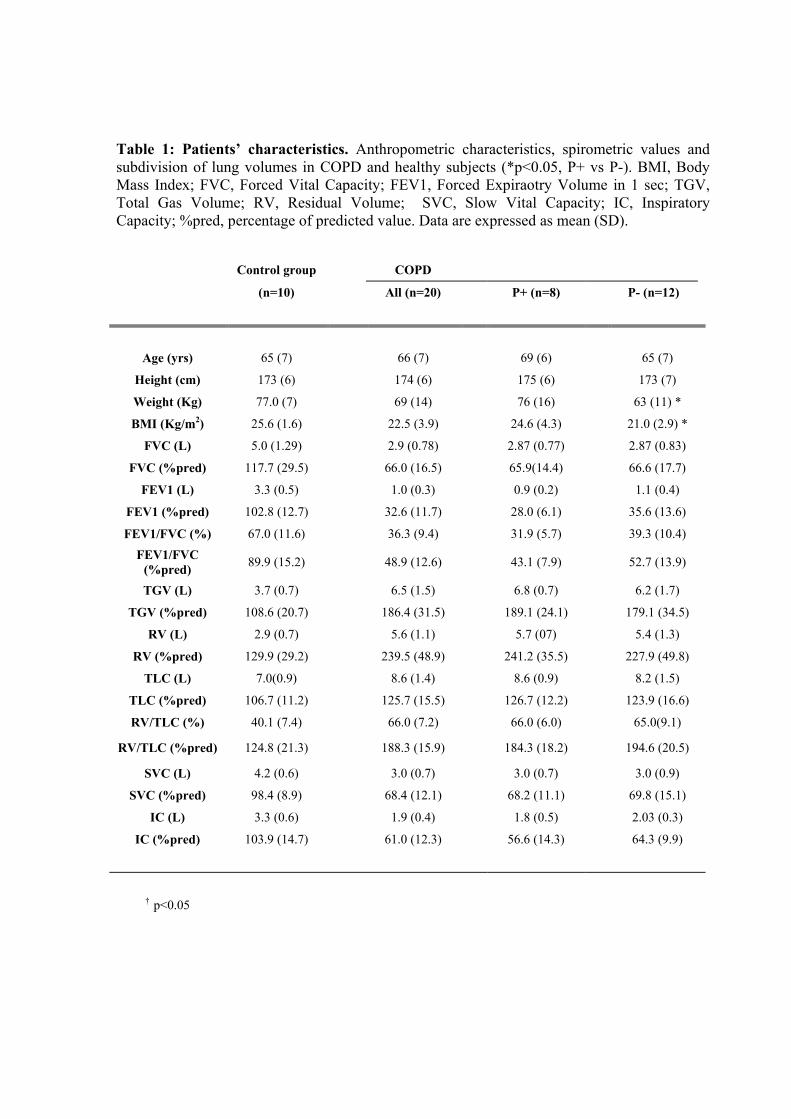
Table 1: Patients’ characteristics. Anthropometric characteristics, spirometric values and subdivision of lung volumes in COPD and healthy subjects (*p<0.05, P+ vs P-). BMI, Body Mass Index; FVC, Forced Vital Capacity; FEV1, Forced Expiraotry Volume in 1 sec; TGV, Total Gas Volume; RV, Residual Volume; SVC, Slow Vital Capacity; IC, Inspiratory Capacity; %pred, percentage of predicted value. Data are expressed as mean (SD).
Control group COPD
(n=10) All (n=20) P+ (n=8) P- (n=12)
Age (yrs) 65 (7) 66 (7) 69 (6) 65 (7)
Height (cm) 173 (6) 174 (6) 175 (6) 173 (7)
Weight (Kg) 77.0 (7) 69 (14) 76 (16) 63 (11) *
BMI (Kg/m2) 25.6 (1.6) 22.5 (3.9) 24.6 (4.3) 21.0 (2.9) *
FVC (L) 5.0 (1.29) 2.9 (0.78) 2.87 (0.77) 2.87 (0.83)
FVC (%pred) 117.7 (29.5) 66.0 (16.5) 65.9(14.4) 66.6 (17.7)
FEV1 (L) 3.3 (0.5) 1.0 (0.3) 0.9 (0.2) 1.1 (0.4)
FEV1 (%pred) 102.8 (12.7) 32.6 (11.7) 28.0 (6.1) 35.6 (13.6)
FEV1/FVC (%) 67.0 (11.6) 36.3 (9.4) 31.9 (5.7) 39.3 (10.4) FEV1/FVC
(%pred) 89.9 (15.2) 48.9 (12.6) 43.1 (7.9) 52.7 (13.9)
TGV (L) 3.7 (0.7) 6.5 (1.5) 6.8 (0.7) 6.2 (1.7)
TGV (%pred) 108.6 (20.7) 186.4 (31.5) 189.1 (24.1) 179.1 (34.5)
RV (L) 2.9 (0.7) 5.6 (1.1) 5.7 (07) 5.4 (1.3)
RV (%pred) 129.9 (29.2) 239.5 (48.9) 241.2 (35.5) 227.9 (49.8)
TLC (L) 7.0(0.9) 8.6 (1.4) 8.6 (0.9) 8.2 (1.5)
TLC (%pred) 106.7 (11.2) 125.7 (15.5) 126.7 (12.2) 123.9 (16.6)
RV/TLC (%) 40.1 (7.4) 66.0 (7.2) 66.0 (6.0) 65.0(9.1)
RV/TLC (%pred) 124.8 (21.3) 188.3 (15.9) 184.3 (18.2) 194.6 (20.5)
SVC (L) 4.2 (0.6) 3.0 (0.7) 3.0 (0.7) 3.0 (0.9)
SVC (%pred) 98.4 (8.9) 68.4 (12.1) 68.2 (11.1) 69.8 (15.1)
IC (L) 3.3 (0.6) 1.9 (0.4) 1.8 (0.5) 2.03 (0.3)
IC (%pred) 103.9 (14.7) 61.0 (12.3) 56.6 (14.3) 64.3 (9.9)
† p<0.05
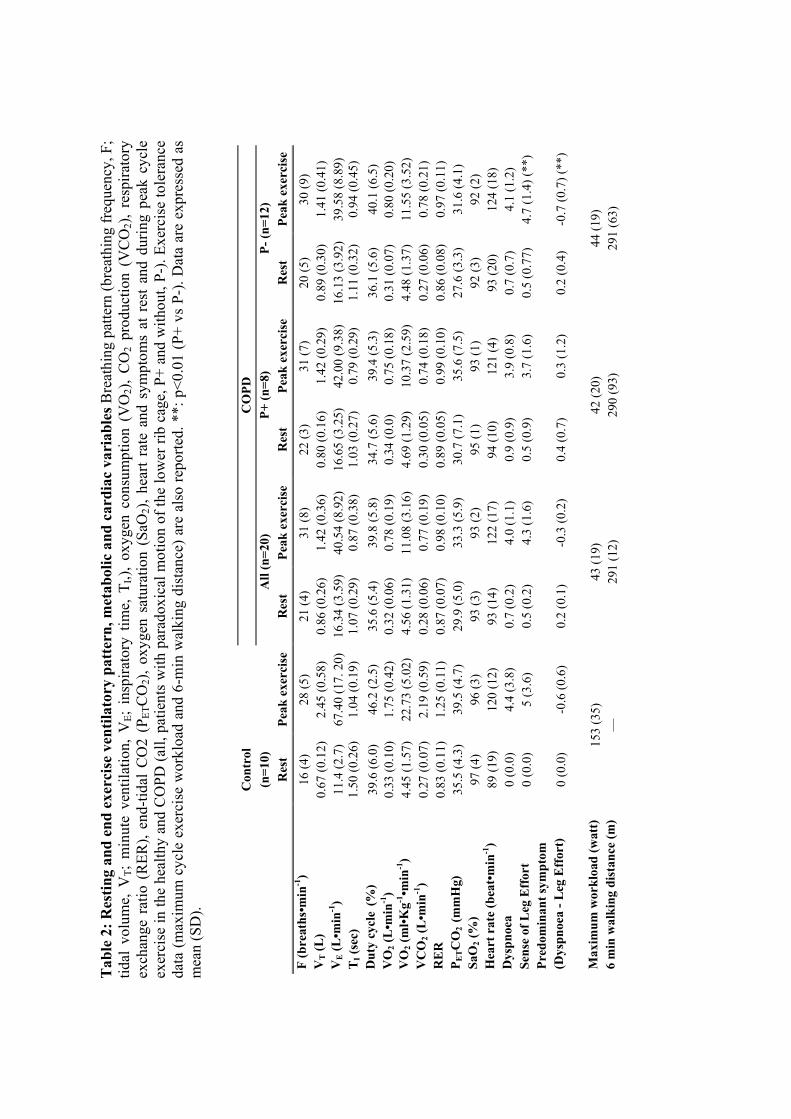
Tab
le 2
: Res
ting
and
end
exer
cise
ven
tilat
ory
patt
ern,
met
abol
ic a
nd c
ardi
ac v
aria
bles
Bre
athi
ng p
atte
rn (b
reat
hing
freq
uenc
y, F
; tid
al v
olum
e, V
T; m
inut
e ve
ntila
tion,
VE;
ins
pira
tory
tim
e, T
I,),
oxyg
en c
onsu
mpt
ion
(VO
2),
CO
2 pr
oduc
tion
(VC
O2)
, re
spira
tory
ex
chan
ge r
atio
(R
ER),
end-
tidal
CO
2 (P
ETC
O2)
, oxy
gen
satu
ratio
n (S
aO2)
, hea
rt ra
te a
nd s
ympt
oms
at r
est
and
durin
g pe
ak c
ycle
ex
erci
se in
the
heal
thy
and
CO
PD (a
ll, p
atie
nts
with
par
adox
ical
mot
ion
of th
e lo
wer
rib
cage
, P+
and
with
out,
P-).
Exer
cise
tole
ranc
e da
ta (m
axim
um c
ycle
exe
rcis
e w
orkl
oad
and
6-m
in w
alki
ng d
ista
nce)
are
als
o re
porte
d. *
*: p
<0.0
1 (P
+ vs
P-)
. Dat
a ar
e ex
pres
sed
as
mea
n (S
D).
C
ontr
ol
C
OPD
(n=1
0)
A
ll (n
=20)
P+
(n=8
) P-
(n=1
2)
R
est
Peak
exe
rcis
e R
est
Peak
exe
rcis
e R
est
Peak
exe
rcis
e R
est
Peak
exe
rcis
e F
(bre
aths
•min
-1)
16 (4
) 28
(5)
21 (4
) 31
(8)
22 (3
) 31
(7)
20 (5
) 30
(9)
VT (L
) 0.
67 (0
.12)
2.
45 (0
.58)
0.
86 (0
.26)
1.
42 (0
.36)
0.
80 (0
.16)
1.
42 (0
.29)
0.
89 (0
.30)
1.
41 (0
.41)
V
E (L
•min
-1)
11.4
(2.7
) 67
.40
(17.
20)
16
.34
(3.5
9)
40.5
4 (8
.92)
16
.65
(3.2
5)
42.0
0 (9
.38)
16
.13
(3.9
2)
39.5
8 (8
.89)
T
I (se
c)
1.50
(0.2
6)
1.04
(0.1
9)
1.07
(0.2
9)
0.87
(0.3
8)
1.03
(0.2
7)
0.79
(0.2
9)
1.11
(0.3
2)
0.94
(0.4
5)
Dut
y cy
cle (%
) 39
.6 (6
.0)
46.2
(2.5
) 35
.6 (5
.4)
39.8
(5.8
) 34
.7 (5
.6)
39.4
(5.3
) 36
.1 (5
.6)
40.1
(6.5
) V
O2 (
L•m
in-1
) 0.
33 (0
.10)
1.
75 (0
.42)
0.
32 (0
.06)
0.
78 (0
.19)
0.
34 (0
.0)
0.75
(0.1
8)
0.31
(0.0
7)
0.80
(0.2
0)
VO
2 (m
l•Kg-1
•min
-1)
4.45
(1.5
7)
22.7
3 (5
.02)
4.
56 (1
.31)
11
.08
(3.1
6)
4.69
(1.2
9)
10.3
7 (2
.59)
4.
48 (1
.37)
11
.55
(3.5
2)
VC
O2 (
L•m
in-1
) 0.
27 (0
.07)
2.
19 (0
.59)
0.
28 (0
.06)
0.
77 (0
.19)
0.
30 (0
.05)
0.
74 (0
.18)
0.
27 (0
.06)
0.
78 (0
.21)
R
ER
0.
83 (0
.11)
1.
25 (0
.11)
0.
87 (0
.07)
0.
98 (0
.10)
0.
89 (0
.05)
0.
99 (0
.10)
0.
86 (0
.08)
0.
97 (0
.11)
P E
TC
O2
(mm
Hg)
35
.5 (4
.3)
39.5
(4.7
) 29
.9 (5
.0)
33.3
(5.9
) 30
.7 (7
.1)
35.6
(7.5
) 27
.6 (3
.3)
31.6
(4.1
) Sa
O2 (
%)
97 (4
) 96
(3)
93 (3
) 93
(2)
95 (1
) 93
(1)
92 (3
) 92
(2)
Hea
rt r
ate
(bea
t•m
in-1
) 89
(19)
12
0 (1
2)
93 (1
4)
122
(17)
94
(10)
12
1 (4
) 93
(20)
12
4 (1
8)
Dys
pnoe
a 0
(0.0
) 4.
4 (3
.8)
0.7
(0.2
) 4.
0 (1
.1)
0.9
(0.9
) 3.
9 (0
.8)
0.7
(0.7
) 4.
1 (1
.2)
Sens
e of
Leg
Eff
ort
0 (0
.0)
5 (3
.6)
0.5
(0.2
) 4.
3 (1
.6)
0.5
(0.9
) 3.
7 (1
.6)
0.5
(0.7
7)
4.7
(1.4
) (**
) Pr
edom
inan
t sym
ptom
(D
yspn
oea
- Leg
Eff
ort)
0
(0.0
) -0
.6 (0
.6)
0.2
(0.1
) -0
.3 (0
.2)
0.4
(0.7
) 0.
3 (1
.2)
0.2
(0.4
) -0
.7 (0
.7) (
**)
M
axim
um w
orkl
oad
(wat
t)
153
(35)
43
(19)
42
(20)
44
(19)
6
min
wal
king
dis
tanc
e (m
) —
29
1 (1
2)
290
(93)
29
1 (6
3)


