PAKISTANMICROFINANCEREVIEW2015ANNUAL ASSESSMENT OFTHE MICROFINANCE INDUSTRYF I N A N C I A L S E R V I C E S F O R A L L


Produced by Pakistan Microfinance NetworkDesign and Layout by O3 Interfaces
www.o3interfaces.com
ANNUAL ASSESSMENTOF THE MICROFINANCE INDUSTRY
PAKISTAN MICROFINANCEREVIEW2015
Financial Services for all
Pakistan Microfinance Review 2015
i
EDITORIAL BOARD
Mr. Ghalib NishtarChairperson, Editorial Board,President, Khushhali Bank Limited (KBL)
Mr. Yasir AshfaqGroup Head, Financial Services Group,Pakistan Poverty Alleviation Fund (PPAF)
Syed Samar HusnainExecutive Director, Development Finance Group, State Bank of Pakistan (SBP)
Mr. Azfar JamalExecutive Vice President, Head Payment Services & E-Banking, National Bank of Pakistan (NBP)
Mr. Blain StephensCOO and Director of Analysis,Microfinance Information eXchange, Inc. (MIX)
Mr. Masood Safdar GillDirector Programme, Urban Poverty Alleviation Pro-gramme, National Rural Support Programme (NRSP)
Ms. Gemma StevensonPrivate Sector Development Advisor,Finance, Markets and Jobs Team, Economic Growth Group,Department for International Development (UK)
Annual Assessment of the Microfinance Industry
Financial Services for all ii
PMR TEAM
Mr. Ali BasharatAuthor and Managing Editor
Ms. Saquiba AzizData Collection
Mr. Ammar ArshadCo-Author and Data Collection
Ms. Saba AbbasCo-Author and Data Collection

Financial Services for all
Pakistan Microfinance Review 2015
iii
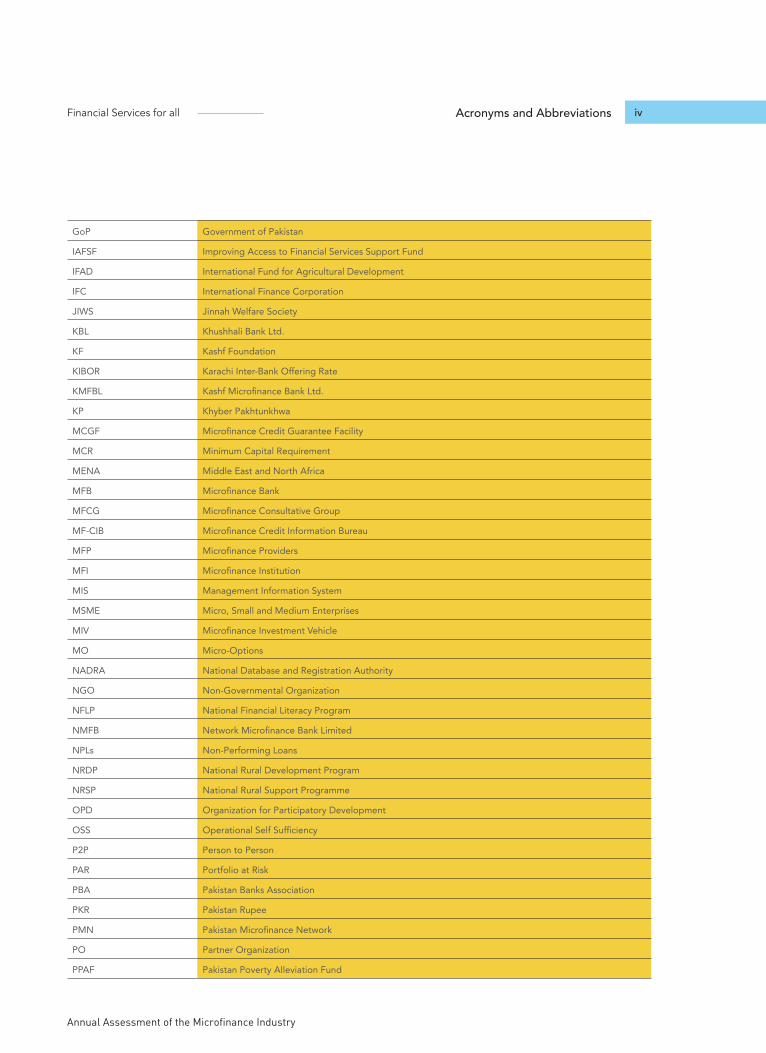
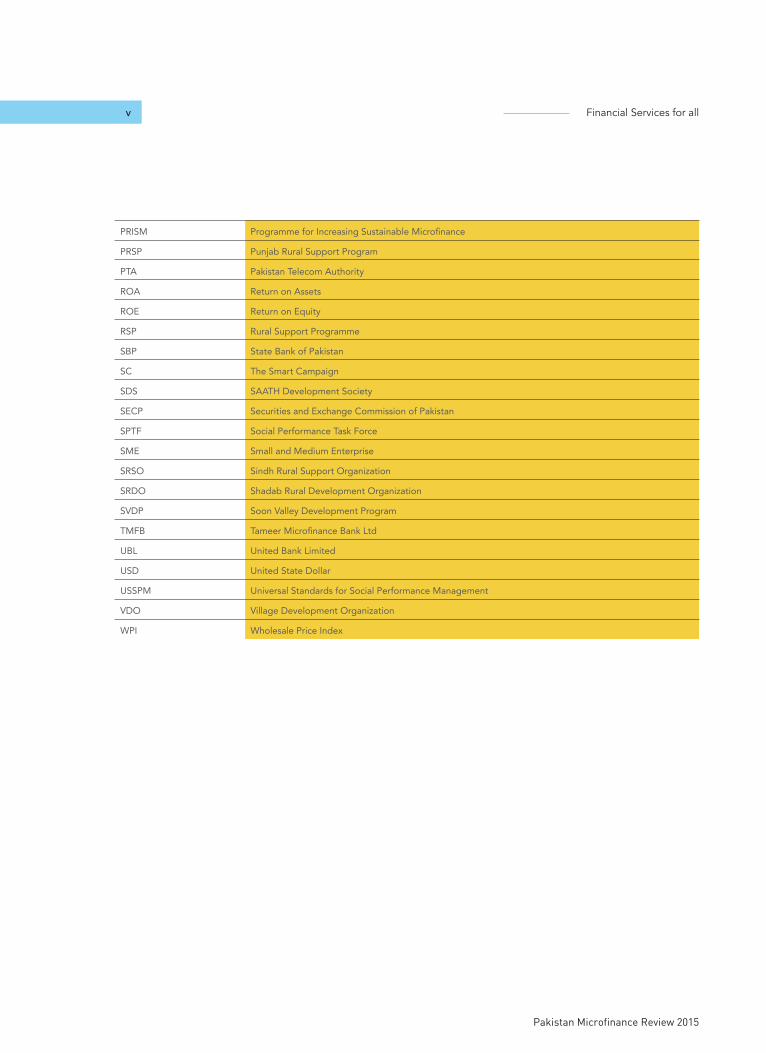
ACRONYMS AND ABBREVIATIONS
AC&MFD Agriculture and Microfinance Division
ADB Asian Development Bank
AMRDO Al-Mehran Rural Development Organization
AML Anti-Money Laundering
BPS Basis Points
CAR Capital Adequacy Ratio
CIB Credit Information Bureau
CDD Customer Due Diligence
CGAP Consultative Group to Assist the Poor
CNIC Computerized National Identity Card
CPP Client Protection Principles
CPI Consumer Price Index
CPC Consumer Protection Code
DFI Development Financial Institution
DFID Department for International Development, UK
DPF Depositor’s Protection Fund
ECA Eastern and Central Europe
ESM Environment and Social Management
EUR Euro
FATF Financial Action Task Force
FIP Financial Inclusion Program
FMFB The First Microfinance Bank Ltd.
FSS Financial Self Sufficiency
FY Financial Year
G2P Government to Person
GBP Great Britain Pound
GDP Gross Domestic Product
GLP Gross Loan Portfolio
GNI Gross National Income
Annual Assessment of the Microfinance Industry
Financial Services for all ivAcronyms and Abbreviations
GoP Government of Pakistan
IAFSF Improving Access to Financial Services Support Fund
IFAD International Fund for Agricultural Development
IFC International Finance Corporation
JIWS Jinnah Welfare Society
KBL Khushhali Bank Ltd.
KF Kashf Foundation
KIBOR Karachi Inter-Bank Offering Rate
KMFBL Kashf Microfinance Bank Ltd.
KP Khyber Pakhtunkhwa
MCGF Microfinance Credit Guarantee Facility
MCR Minimum Capital Requirement
MENA Middle East and North Africa
MFB Microfinance Bank
MFCG Microfinance Consultative Group
MF-CIB Microfinance Credit Information Bureau
MFP Microfinance Providers
MFI Microfinance Institution
MIS Management Information System
MSME Micro, Small and Medium Enterprises
MIV Microfinance Investment Vehicle
MO Micro-Options
NADRA National Database and Registration Authority
NGO Non-Governmental Organization
NFLP National Financial Literacy Program
NMFB Network Microfinance Bank Limited
NPLs Non-Performing Loans
NRDP National Rural Development Program
NRSP National Rural Support Programme
OPD Organization for Participatory Development
OSS Operational Self Sufficiency
P2P Person to Person
PAR Portfolio at Risk
PBA Pakistan Banks Association
PKR Pakistan Rupee
PMN Pakistan Microfinance Network
PO Partner Organization
PPAF Pakistan Poverty Alleviation Fund
Financial Services for all
Pakistan Microfinance Review 2015
v
PRISM Programme for Increasing Sustainable Microfinance
PRSP Punjab Rural Support Program
PTA Pakistan Telecom Authority
ROA Return on Assets
ROE Return on Equity
RSP Rural Support Programme
SBP State Bank of Pakistan
SC The Smart Campaign
SDS SAATH Development Society
SECP Securities and Exchange Commission of Pakistan
SPTF Social Performance Task Force
SME Small and Medium Enterprise
SRSO Sindh Rural Support Organization
SRDO Shadab Rural Development Organization
SVDP Soon Valley Development Program
TMFB Tameer Microfinance Bank Ltd
UBL United Bank Limited
USD United State Dollar
USSPM Universal Standards for Social Performance Management
VDO Village Development Organization
WPI Wholesale Price Index
Annual Assessment of the Microfinance Industry
Financial Services for all viHighlights
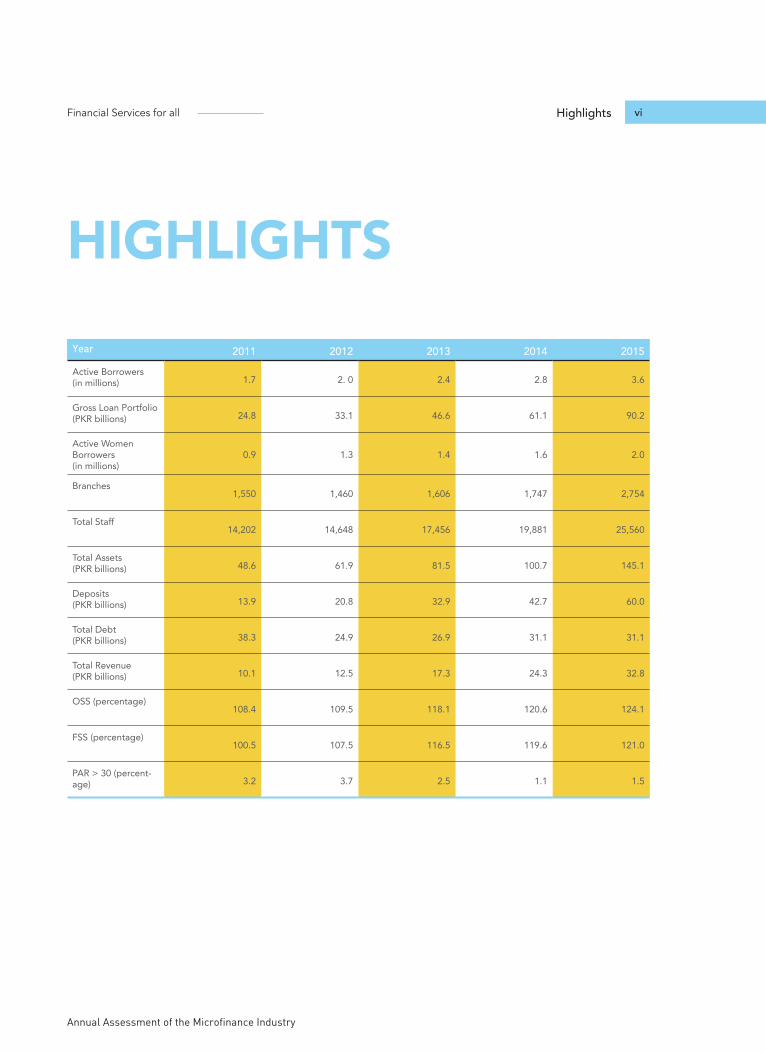
HIGHLIGHTSYear 2011 2012 2013 2014 2015Active Borrowers (in millions) 1.7 2. 0 2.4 2.8 3.6
Gross Loan Portfolio(PKR billions) 24.8 33.1 46.6 61.1 90.2
Active Women Borrowers(in millions)
0.9 1.3 1.4 1.6 2.0
Branches1,550 1,460 1,606 1,747 2,754
Total Staff 14,202 14,648 17,456 19,881 25,560
Total Assets (PKR billions) 48.6 61.9 81.5 100.7 145.1
Deposits (PKR billions) 13.9 20.8 32.9 42.7 60.0
Total Debt (PKR billions) 38.3 24.9 26.9 31.1 31.1
Total Revenue(PKR billions) 10.1 12.5 17.3 24.3 32.8
OSS (percentage)108.4 109.5 118.1 120.6 124.1
FSS (percentage)100.5 107.5 116.5 119.6 121.0
PAR > 30 (percent-age) 3.2 3.7 2.5 1.1 1.5
Financial Services for all
Pakistan Microfinance Review 2015
vii
PAKISTAN MICROFINANCEREVIEW2015ANNUAL ASSESSMENTOF THE MICROFINANCE INDUSTRYFinancial services for all
Annual Assessment of the Microfinance Industry
Financial Services for all viii
CONTENTSTHE YEAR IN REVIEW
SOCIAL PERFORMANCE
ANNEXURES
FINANCIAL PERFORMANCE REVIEW
CHALLENGES AND OPPORTUNITIES
01
41
73
17
61
Macro-Economy and The Microfinance Industry
02
Policy and Regulatory Environment 03
Microfinance Industry Initiatives 05
Conclusion 13
Introduction 41
Analysis of The Sector’s SP Indicators
42
Target Market 43
Development Goals 43
Poverty Measurement Tools 45
Governance & HR 46
Products and Services: Financial 49
Products and Services: Non-Financial
53
Transparency of Cost 54
Client Protection 56
Environmental Policies 57
AI – Performance Indicators of Industry 2015
73
AII – Performance Indicators of Individual MFPs 2015
83
Scale and Outreach 18
Financial Structure 27
Profitability and Sustainability 31
Productivity 35
Risk 36
Conclusion 37
Role of Microfinance in Financial Inclusion In Pakistan
61
Mainstreaming Non-Bank Microfinance Players
62
Credit Scoring 63
Mobile Wallets 63
Exploring New Horizons: Serving New Markets
64
Deposit Protection Fund: Moving Towards A Secure Financial Landscape
67
Deposits Mobilization: Untying Gordian’s Knot
68
Funding 68
Setting Up of Pakistan Microfinance Investment Company Limited (PMIC)
69

SECTION 1
THE YEAR IN REVIEW
Section 1 Financial Services for all
Pakistan Microfinance Review 2015
1
The microfinance industry witnessed continued growth and expansion in outreach in the year 2015. There were also notable developments in the poli-cy environment which can lead to strengthening of players such that the sector will be positioned to play a crucial role in furthering the agenda of finan-cial inclusion in the country.
Major developments were witnessed on the policy and regulatory fronts such as the launch of the Na-tional Financial Inclusion Strategy (NFIS) and the in-troduction of a regulatory framework for Non-Bank Microfinance Institutes (NBMFI) by the Securities & Exchange Commission of Pakistan (SECP). In addi-tion, results of the second Access to Finance Survey were launched. With the launch of NFIS, a road-map for achievement of financial inclusion in the country has been laid out. A key challenge facing the microfinance industry has been the absence of a regulatory framework for non-bank microfinance players. Now with the introduction of the rules and regulations for NBMFI a level playing field has been created in the industry and provides an opportunity for non-bank players to scale up their businesses.
The improving security situation, low inflation and subsequent reduction in the policy rate by the cen-tral bank bode well for the industry. However, fall-ing agriculture commodity prices could adversely affect the industry particularly those providers op-erating predominantly in the rural areas.
A number of new initiatives were launched in 2015 while existing ones were improved upon. One of the main initiatives last year was the re-estimation of the microfinance market in the country. In ad-
dition, 2015 saw the completion of three years of the Client Protection Initiative (CPI), funded by the State Bank of Pakistan (SBP) under the auspices of the Financial Inclusion Program (FIP). Moreover, the Microfinance Credit Information Bureau (MF-CIB) has become an essential component of the credit approval process by practitioners and credit scor-ing models are being developed based on its data. Branchless banking continues to witness huge trac-tion on all fronts stimulated by an enabling environ-ment. Moreover, a number of microfinance banks (MFBs) have initiated lending to micro-enterprises.
The Microfinance Growth Strategy 2020 launched by PMN during the year forecasts that the sector would require additional debt for on-lending of up to PKR 300 billion to reach the 10 million borrower mark. In order to meet the funding demands of the sector, PPAF, the Department for International De-velopment (DFID) through Karandaaz Pakistan, and the German Development Bank, KfW, have joined hands to establish Pakistan Microfinance Invest-ment Company Limited (PMICL), a private-sector investment finance company. The major objective of the new entity is to attract commercial funding to serve the increasing demand of those who are financially excluded and further improve the capa-bility and capacity of the sector to absorb these funds. The NFIS also recognizes microfinance as an important instrument for increasing financial inclu-sion in the country and an important milestone of the strategy is enhancing commercial funding for the microfinance sector through the creation of PMIC.
THE YEAR IN REVIEW
Annual Assessment of the Microfinance Industry
Financial Services for all 2The Year in Review
Pakistan’s economy grew by 4.2 percent in the fi-nancial year 2015 which is the highest growth rate witnessed in the last seven years1. Despite im-provement in all the fundamental macro-economic indicators like inflation, fiscal and current account balance and improvement in the security situation, persistent energy shortages and low investment rates remained a challenge for the economy and it could not meet the target of 5.1 percent growth for the year2. Despite the challenging external environ-ment, the microfinance industry grew by nearly 20 percent in terms of outreach during the year 20153.
Inflation measured by CPI continued to witness a
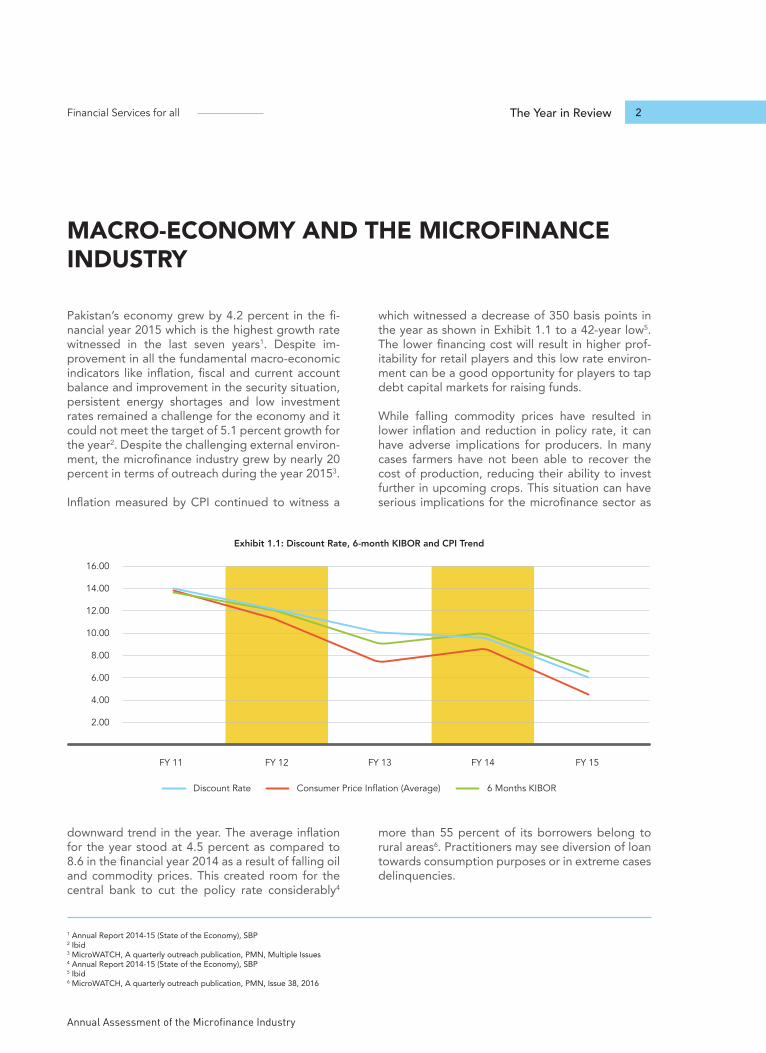
downward trend in the year. The average inflation for the year stood at 4.5 percent as compared to 8.6 in the financial year 2014 as a result of falling oil and commodity prices. This created room for the central bank to cut the policy rate considerably4
which witnessed a decrease of 350 basis points in the year as shown in Exhibit 1.1 to a 42-year low5. The lower financing cost will result in higher prof-itability for retail players and this low rate environ-ment can be a good opportunity for players to tap debt capital markets for raising funds.
While falling commodity prices have resulted in lower inflation and reduction in policy rate, it can have adverse implications for producers. In many cases farmers have not been able to recover the cost of production, reducing their ability to invest further in upcoming crops. This situation can have serious implications for the microfinance sector as
more than 55 percent of its borrowers belong to rural areas6. Practitioners may see diversion of loan towards consumption purposes or in extreme cases delinquencies.
MACRO-ECONOMY AND THE MICROFINANCE INDUSTRY
2.00
FY 11 FY 12 FY 13 FY 14 FY 15
4.00
6.00
8.00
10.00
12.00
14.00
16.00
Discount Rate Consumer Price Inflation (Average) 6 Months KIBOR
Exhibit 1.1: Discount Rate, 6-month KIBOR and CPI Trend
1 Annual Report 2014-15 (State of the Economy), SBP 2 Ibid3 MicroWATCH, A quarterly outreach publication, PMN, Multiple Issues 4 Annual Report 2014-15 (State of the Economy), SBP5 Ibid6 MicroWATCH, A quarterly outreach publication, PMN, Issue 38, 2016
Section 1 Financial Services for all
Pakistan Microfinance Review 2015
3
Despite the policy rate touching a historical low, ex-pansion in the private sector credit remained low as compared to the previous year7. Commercial banks continued to invest in the government securities in order to generate risk-less returns. With most of the existing private sector concentrated towards
manufacturing sector, areas like SMEs and agricul-ture continue to remain unserved. In this situation, MFPs will continue find it challenging to raise funds from commercial banks.
Pakistan’s overall regulatory environment continues to be ranked among the best globally8. Key devel-opments were witnessed in the industry on the pol-icy and regulatory domain in 2015. Last year saw the launch of the National Financial Inclusion Strat-egy (NFIS) and roll-out of regulations for non-bank MFPs which was among the key challenges being faced by the sector.
NATIONAL FINANCIAL INCLUSION STRATEGY (NFIS)
The National Financial Inclusion Strategy (NFIS) has outlined a roadmap for financial inclusion in the country. Developed by the State Bank of Pa-kistan with active assistance from The World Bank, the strategy aims to “build a dynamic and inclusive financial sector to support Pakistan’s growth in 21st century”9. The strategy will direct efforts and ini-tiatives to expand and deepen financial inclusion during the course of five years (2015-2020) and has set objectives to be achieved through a compre-hensive and well-thought action plan.
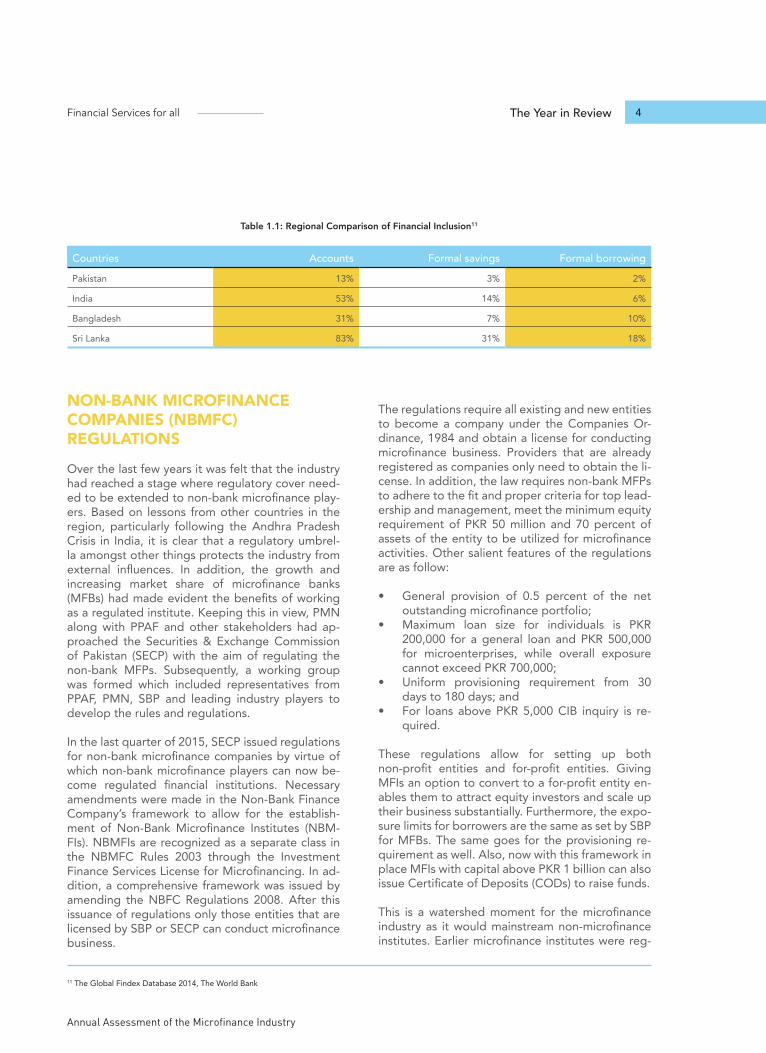
The state of financial inclusion in Pakistan depicts a dismal picture. Only 16 percent of the adult population can be categorized as banked and 23 percent of the population use formal financial services10. The situation worsens in the rural areas where only 14 percent of the adult population is banked. In the case of women, only 11 percent are banked. The state of financial inclusion is no more evident when compared regionally as shown in Table 1.1 where Pakistan continues to lag behind
other countries. Despite sustained efforts by the policy makers, regulators and donors and enjoying an enviable enabling environment a lot more needs to be done. In this regard, NFIS will play a crucial role in furthering financial inclusion in the country by coordinating the efforts of all the stakeholders, by defining responsibilities among them and by de-veloping a comprehensive approach to promoting access and usage of formal financial services.
The framework for action for the strategy identi-fies four targeted actions or key drivers to achieve financial inclusion in the country. These four drivers are 1) promoting digital transactions and reaching scale through bulk payments; 2) expanding and di-versifying access points; 3) improving capacity of financial services providers; and 4) increasing levels of financial capability. The success of these drivers is dependent upon meeting four preconditions or key enablers which have been identified as:
• Public and private sector commitment to NFIS• Enabling Legal and Regulatory Requirements • Adequate supervisory and judicial capacity • Financial payments, information and communi-
cation technology
Achievement of financial inclusion in the country requires efforts from a wide range of stakeholders and in order to direct their efforts a coordination mechanism has been developed which includes a NFIS Council to be chaired by the Finance Minister, a steering committee headed by the Governor SBP and the establishment of an NFIS Secretariat.
POLICY AND REGULATORY ENVIRONMENT
7 Annual Report 2014-15 (State of the Economy), SBP 8 The Global Microscope 2015: The enabling environment for financial inclusion, EIU,20159 National Financial Inclusion Strategy (NFIS), SBP10 www.a2f2015.com
Annual Assessment of the Microfinance Industry
Financial Services for all 4The Year in Review
NON-BANK MICROFINANCE COMPANIES (NBMFC) REGULATIONS
Over the last few years it was felt that the industry had reached a stage where regulatory cover need-ed to be extended to non-bank microfinance play-ers. Based on lessons from other countries in the region, particularly following the Andhra Pradesh Crisis in India, it is clear that a regulatory umbrel-la amongst other things protects the industry from external influences. In addition, the growth and increasing market share of microfinance banks (MFBs) had made evident the benefits of working as a regulated institute. Keeping this in view, PMN along with PPAF and other stakeholders had ap-proached the Securities & Exchange Commission of Pakistan (SECP) with the aim of regulating the non-bank MFPs. Subsequently, a working group was formed which included representatives from PPAF, PMN, SBP and leading industry players to develop the rules and regulations.
In the last quarter of 2015, SECP issued regulations for non-bank microfinance companies by virtue of which non-bank microfinance players can now be-come regulated financial institutions. Necessary amendments were made in the Non-Bank Finance Company’s framework to allow for the establish-ment of Non-Bank Microfinance Institutes (NBM-FIs). NBMFIs are recognized as a separate class in the NBMFC Rules 2003 through the Investment Finance Services License for Microfinancing. In ad-dition, a comprehensive framework was issued by amending the NBFC Regulations 2008. After this issuance of regulations only those entities that are licensed by SBP or SECP can conduct microfinance business.
The regulations require all existing and new entities to become a company under the Companies Or-dinance, 1984 and obtain a license for conducting microfinance business. Providers that are already registered as companies only need to obtain the li-cense. In addition, the law requires non-bank MFPs to adhere to the fit and proper criteria for top lead-ership and management, meet the minimum equity requirement of PKR 50 million and 70 percent of assets of the entity to be utilized for microfinance activities. Other salient features of the regulations are as follow:
• General provision of 0.5 percent of the net outstanding microfinance portfolio;
• Maximum loan size for individuals is PKR 200,000 for a general loan and PKR 500,000 for microenterprises, while overall exposure cannot exceed PKR 700,000;
• Uniform provisioning requirement from 30 days to 180 days; and
• For loans above PKR 5,000 CIB inquiry is re-quired.
These regulations allow for setting up both non-profit entities and for-profit entities. Giving MFIs an option to convert to a for-profit entity en-ables them to attract equity investors and scale up their business substantially. Furthermore, the expo-sure limits for borrowers are the same as set by SBP for MFBs. The same goes for the provisioning re-quirement as well. Also, now with this framework in place MFIs with capital above PKR 1 billion can also issue Certificate of Deposits (CODs) to raise funds.
This is a watershed moment for the microfinance industry as it would mainstream non-microfinance institutes. Earlier microfinance institutes were reg-
Countries Accounts Formal savings Formal borrowing Pakistan 13% 3% 2%
India 53% 14% 6%
Bangladesh 31% 7% 10%
Sri Lanka 83% 31% 18%
Table 1.1: Regional Comparison of Financial Inclusion11
11 The Global Findex Database 2014, The World Bank
Section 1 Financial Services for all
Pakistan Microfinance Review 2015
5
istered in multiple legal jurisdictions and operated under a legal framework that can be categorized as ambiguous at best. Lastly, it is hoped that the SECP will play a similar role to that played by the SBP in nurturing MFBs and interact frequently with the players for the benefit of the industry.
LIMIT TO FINANCING AGAINST GOLD BACKED LOANS
Financing against gold backed loans by Microfi-nance Banks (MFBs) had gained widespread pop-ularity in the last few years. It had allowed MFBs to move from traditional group lending to individ-ual lending and also, increase their loan sizes. This mode of financing drew its strength from the fact that gold and gold ornaments have been a tradi-tional mode of savings among the masses which in times of emergency is liquidated often at a deep discount. Obtaining a loan against this gold without having to liquidate provided a better alternative to potential borrowers and saw to its massive popular-ity. This product effectively transformed gold from a non-liquid asset into a liquid and earning asset. Pioneered by Tameer Microfinance Bank (TMFB), it was soon adopted by other MFBs. At this time up to 5 MFBs are dealing in this product and the per-
centage of the gross loan portfolio (GLP) financed against gold ranges from 20 percent to 55 percent. However, concerns were raised about the practice especially whether the loan were being utilized for consumption purposes rather than productive ones. Also, were the loan amounts being determined based on the value of the gold or based on the repayment capacity of the client? These concerns led to strengthening of the belief that gold backed loans were against the spirit of microfinance which promotes lending without physical collateral. This coupled with falling gold prices leading to reduced value of collateral available with MFBs led the cen-tral bank to place a limit on financing against gold.
SBP by virtue of an amendment in the prudential regulation R-5 dealing with maximum loan size and eligibility of borrowers for MFBs placed a limit that aggregate loan exposure of a MFB cannot exceed 35 percent of its GLP12. Existing MFBs having an exposure of more than 35 percent were given two years to bring their portfolios in compliance with the above regulation. In addition, SBP also stressed that MFBs develop a collateral handling policy duly approved by their Board for managing the security, procedures and contingency planning for the gold collateral.
The year saw a number of new initiatives being undertaken including most significantly the re-es-timation of the microfinance market potential and successful completion of the Client Protection Ini-tiative (CPI).
BRANCHLESS BANKING
With a firmly established regulatory environment and a supporting institutional framework, the branchless banking sector of Pakistan continued to excel on all fronts in the calendar year 2015. The mandatory biometric SIM verification for all new and existing mobile phone customers in the same year, as instructed by the Pakistan Telecommunica-tion Authority (PTA), also played a crucial role in
stimulating branchless banking activity.
As of September 30, 2015, the value of branchless banking transactions stood at PKR 526 billion as compared to PKR 376 billion in the same period for the previous year13 – depicting an increase of 40 percent. Moreover, the number of branchless banking transactions, for the first time, crossed the 100-million mark resting at 101 million as of Sep-tember 30, 2015.
It is important to note that approximately 5 per-cent of the 101 million transactions were carried out by agents for liquidity management, whereas, the remaining 95 percent were customer oriented transactions (which include over-the-counter and
MICROFINANCE INDUSTRY INITIATIVES
12 AC & MFD Circular 02 of 2015, June 18, 2015, SBP13 Branchless Banking Newsletter, Issue 17, 2015, State Bank of Pakistan (SBP)
Annual Assessment of the Microfinance Industry
Financial Services for all 6The Year in Review
m-wallet transactions). However, branchless bank-ing agents had a significant share (of 40 percent) in the value of transactions – PKR 208 billion worth of transactions were conducted for liquidity man-agement.
In terms of customer oriented transactions, over-the-counter transactions amounted to 69 percent of the total number of transactions and 71 percent of the total value of transactions. Fund transfers through CNIC (sending and receiving) remained the top contributor in terms of volume and value of transactions with a share of 33 percent and 44 percent respectively. Bill payments (utility and in-ternet) had the second largest share in terms of both, volume (29 percent) and value (18 percent) within customer oriented transactions14.
The branchless banking platform is also proving to be an effective instrument in channeling govern-ment-to-person payments of salary disbursements, pensions, and tax collection services. An amount of PKR 22 billion was disbursed to 4.5 million bene-ficiaries during the third quarter of 2015 as com-pared to PKR 16 billion disbursed to 5.5 million beneficiaries during the same quarter of 2014. The majority of the G2P payment beneficiaries are as-sociated with the Benazir Income Support Program (BISP), followed by internally displaced people.
Lately, branchless banking operators have also in-troduced innovative Person-to-Government (P2G) payment products for the collection of taxes, traf-fic penalties and other payments to government agencies. Mobile network operators are partnering with public entities to enhance the scope of digital financial services that can be accessed quickly and at the convenience of the users, thus facilitating both the government and individuals.
Telenor’s EasyPaisa was the first service provider to set foot in this domain by offering the option to pay for traffic penalties through the branchless banking platform – including mobile wallets. Mobilink’s Mo-bicash has recently introduced a product where consumers can pay for their passport fee through any Mobicash agent or via their m-wallet account.
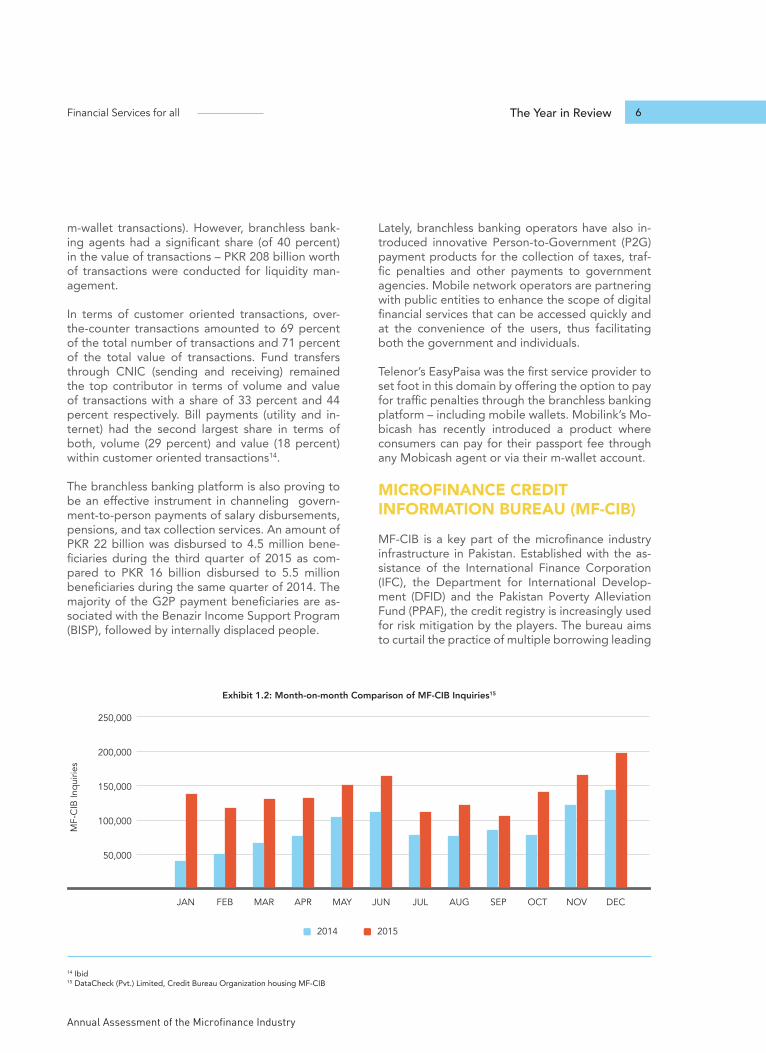
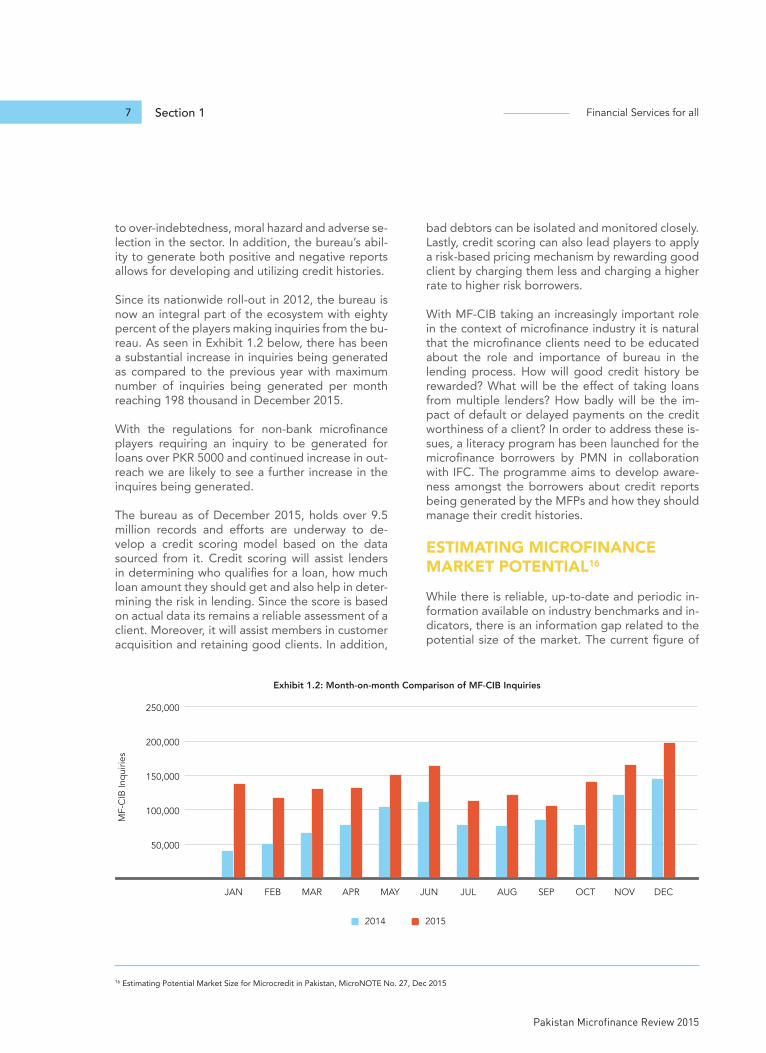
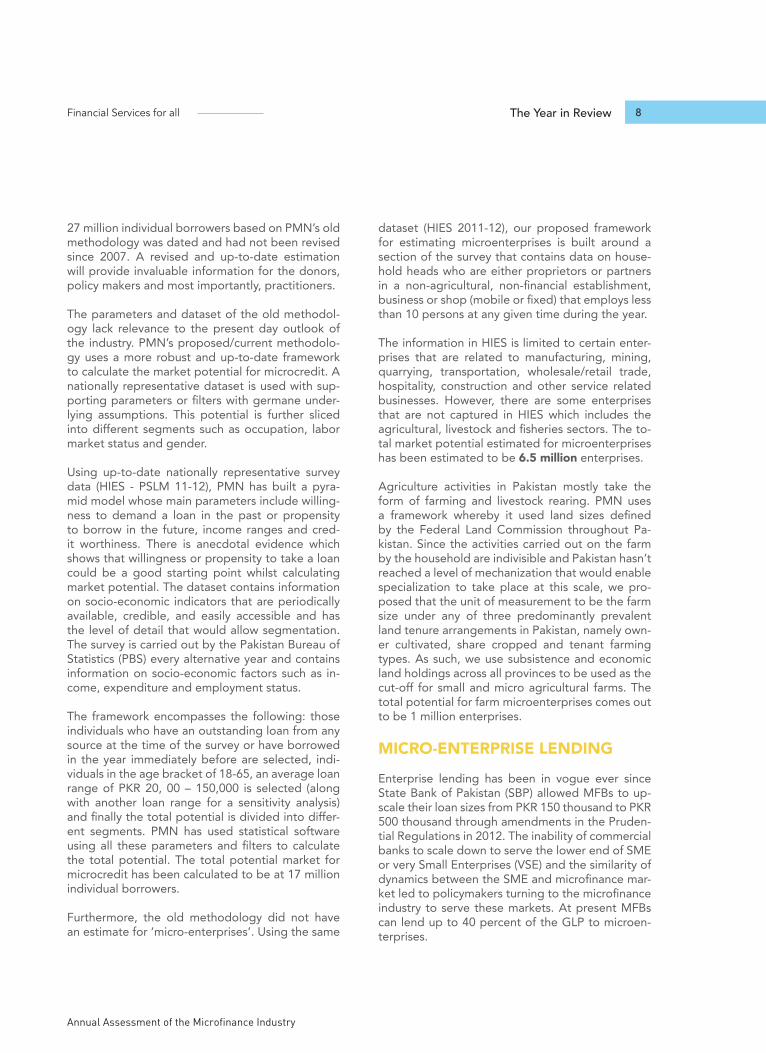
MICROFINANCE CREDIT INFORMATION BUREAU (MF-CIB)
MF-CIB is a key part of the microfinance industry infrastructure in Pakistan. Established with the as-sistance of the International Finance Corporation (IFC), the Department for International Develop-ment (DFID) and the Pakistan Poverty Alleviation Fund (PPAF), the credit registry is increasingly used for risk mitigation by the players. The bureau aims to curtail the practice of multiple borrowing leading
14 Ibid15 DataCheck (Pvt.) Limited, Credit Bureau Organization housing MF-CIB
Exhibit 1.2: Month-on-month Comparison of MF-CIB Inquiries15
50,000
2014 2015
100,000
150,000
200,000
250,000
MF-
CIB
Inqu
iries
JAN FEB MAR APR MAY JUN JUL AUG SEP OCT NOV DEC
Section 1 Financial Services for all
Pakistan Microfinance Review 2015
7
to over-indebtedness, moral hazard and adverse se-lection in the sector. In addition, the bureau’s abil-ity to generate both positive and negative reports allows for developing and utilizing credit histories.
Since its nationwide roll-out in 2012, the bureau is now an integral part of the ecosystem with eighty percent of the players making inquiries from the bu-reau. As seen in Exhibit 1.2 below, there has been a substantial increase in inquiries being generated as compared to the previous year with maximum number of inquiries being generated per month reaching 198 thousand in December 2015.
With the regulations for non-bank microfinance players requiring an inquiry to be generated for loans over PKR 5000 and continued increase in out-reach we are likely to see a further increase in the inquires being generated.
The bureau as of December 2015, holds over 9.5 million records and efforts are underway to de-velop a credit scoring model based on the data sourced from it. Credit scoring will assist lenders in determining who qualifies for a loan, how much loan amount they should get and also help in deter-mining the risk in lending. Since the score is based on actual data its remains a reliable assessment of a client. Moreover, it will assist members in customer acquisition and retaining good clients. In addition,
bad debtors can be isolated and monitored closely. Lastly, credit scoring can also lead players to apply a risk-based pricing mechanism by rewarding good client by charging them less and charging a higher rate to higher risk borrowers.
With MF-CIB taking an increasingly important role in the context of microfinance industry it is natural that the microfinance clients need to be educated about the role and importance of bureau in the lending process. How will good credit history be rewarded? What will be the effect of taking loans from multiple lenders? How badly will be the im-pact of default or delayed payments on the credit worthiness of a client? In order to address these is-sues, a literacy program has been launched for the microfinance borrowers by PMN in collaboration with IFC. The programme aims to develop aware-ness amongst the borrowers about credit reports being generated by the MFPs and how they should manage their credit histories.
ESTIMATING MICROFINANCE MARKET POTENTIAL16
While there is reliable, up-to-date and periodic in-formation available on industry benchmarks and in-dicators, there is an information gap related to the potential size of the market. The current figure of
16 Estimating Potential Market Size for Microcredit in Pakistan, MicroNOTE No. 27, Dec 2015
Exhibit 1.2: Month-on-month Comparison of MF-CIB Inquiries
50,000
2014 2015
100,000
150,000
200,000
250,000
MF-
CIB
Inqu
iries
JAN FEB MAR APR MAY JUN JUL AUG SEP OCT NOV DEC
Annual Assessment of the Microfinance Industry
Financial Services for all 8The Year in Review
27 million individual borrowers based on PMN’s old methodology was dated and had not been revised since 2007. A revised and up-to-date estimation will provide invaluable information for the donors, policy makers and most importantly, practitioners.
The parameters and dataset of the old methodol-ogy lack relevance to the present day outlook of the industry. PMN’s proposed/current methodolo-gy uses a more robust and up-to-date framework to calculate the market potential for microcredit. A nationally representative dataset is used with sup-porting parameters or filters with germane under-lying assumptions. This potential is further sliced into different segments such as occupation, labor market status and gender.
Using up-to-date nationally representative survey data (HIES - PSLM 11-12), PMN has built a pyra-mid model whose main parameters include willing-ness to demand a loan in the past or propensity to borrow in the future, income ranges and cred-it worthiness. There is anecdotal evidence which shows that willingness or propensity to take a loan could be a good starting point whilst calculating market potential. The dataset contains information on socio-economic indicators that are periodically available, credible, and easily accessible and has the level of detail that would allow segmentation. The survey is carried out by the Pakistan Bureau of Statistics (PBS) every alternative year and contains information on socio-economic factors such as in-come, expenditure and employment status.
The framework encompasses the following: those individuals who have an outstanding loan from any source at the time of the survey or have borrowed in the year immediately before are selected, indi-viduals in the age bracket of 18-65, an average loan range of PKR 20, 00 – 150,000 is selected (along with another loan range for a sensitivity analysis) and finally the total potential is divided into differ-ent segments. PMN has used statistical software using all these parameters and filters to calculate the total potential. The total potential market for microcredit has been calculated to be at 17 million individual borrowers.
Furthermore, the old methodology did not have an estimate for ‘micro-enterprises’. Using the same
dataset (HIES 2011-12), our proposed framework for estimating microenterprises is built around a section of the survey that contains data on house-hold heads who are either proprietors or partners in a non-agricultural, non-financial establishment, business or shop (mobile or fixed) that employs less than 10 persons at any given time during the year.
The information in HIES is limited to certain enter-prises that are related to manufacturing, mining, quarrying, transportation, wholesale/retail trade, hospitality, construction and other service related businesses. However, there are some enterprises that are not captured in HIES which includes the agricultural, livestock and fisheries sectors. The to-tal market potential estimated for microenterprises has been estimated to be 6.5 million enterprises.
Agriculture activities in Pakistan mostly take the form of farming and livestock rearing. PMN uses a framework whereby it used land sizes defined by the Federal Land Commission throughout Pa-kistan. Since the activities carried out on the farm by the household are indivisible and Pakistan hasn’t reached a level of mechanization that would enable specialization to take place at this scale, we pro-posed that the unit of measurement to be the farm size under any of three predominantly prevalent land tenure arrangements in Pakistan, namely own-er cultivated, share cropped and tenant farming types. As such, we use subsistence and economic land holdings across all provinces to be used as the cut-off for small and micro agricultural farms. The total potential for farm microenterprises comes out to be 1 million enterprises.
MICRO-ENTERPRISE LENDING
Enterprise lending has been in vogue ever since State Bank of Pakistan (SBP) allowed MFBs to up-scale their loan sizes from PKR 150 thousand to PKR 500 thousand through amendments in the Pruden-tial Regulations in 2012. The inability of commercial banks to scale down to serve the lower end of SME or very Small Enterprises (VSE) and the similarity of dynamics between the SME and microfinance mar-ket led to policymakers turning to the microfinance industry to serve these markets. At present MFBs can lend up to 40 percent of the GLP to microen-terprises.
Section 1 Financial Services for all
Pakistan Microfinance Review 2015
9
VSE or microenterprises make up nearly 99 per-cent of the SMEs in the country and play a crucial role in income and employment generation17. The segment is viewed as more stable as compared to microfinance as it has a higher degree of formaliza-tion, a designated business premises and possess-es some fixed assets. Lending to this particular seg-ment allows, MFPs to retain graduating clients who have grown to size where micro-loans cannot meet their funding needs and diversify into a newer mar-ket segment. In addition, it provides an opportuni-ty to increase profitability as enterprise loans have lower operational costs as compared to microloans and allows for risk-based pricing of loans.
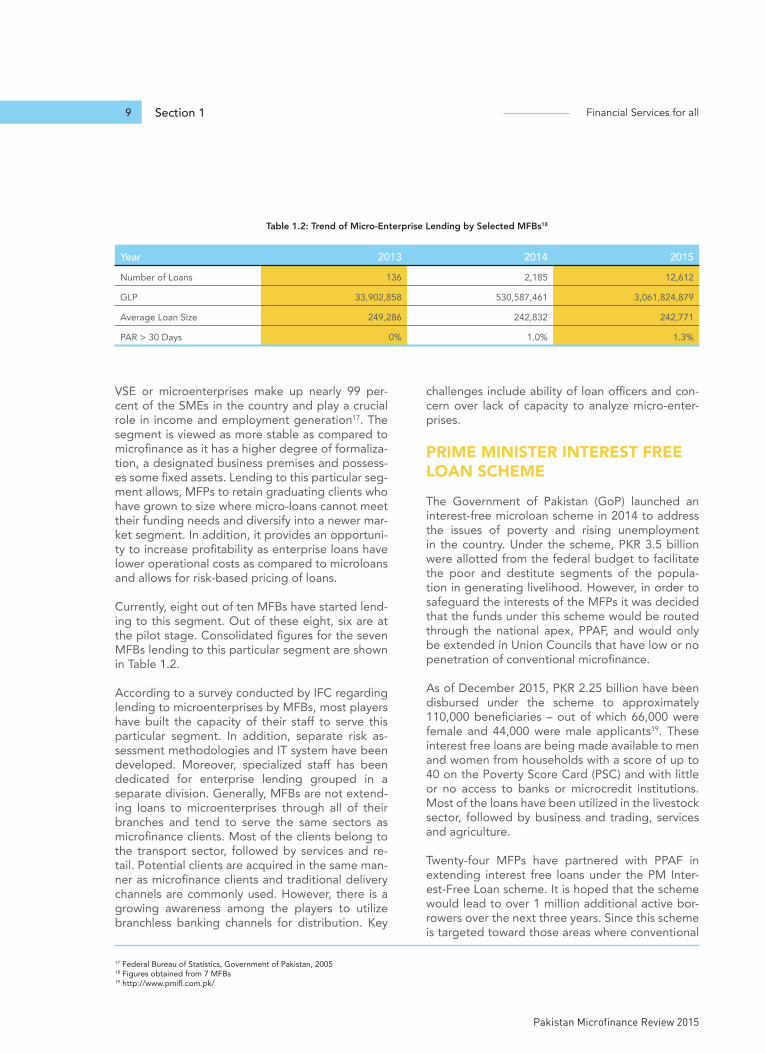
Currently, eight out of ten MFBs have started lend-ing to this segment. Out of these eight, six are at the pilot stage. Consolidated figures for the seven MFBs lending to this particular segment are shown in Table 1.2.
According to a survey conducted by IFC regarding lending to microenterprises by MFBs, most players have built the capacity of their staff to serve this particular segment. In addition, separate risk as-sessment methodologies and IT system have been developed. Moreover, specialized staff has been dedicated for enterprise lending grouped in a separate division. Generally, MFBs are not extend-ing loans to microenterprises through all of their branches and tend to serve the same sectors as microfinance clients. Most of the clients belong to the transport sector, followed by services and re-tail. Potential clients are acquired in the same man-ner as microfinance clients and traditional delivery channels are commonly used. However, there is a growing awareness among the players to utilize branchless banking channels for distribution. Key
challenges include ability of loan officers and con-cern over lack of capacity to analyze micro-enter-prises.
PRIME MINISTER INTEREST FREE LOAN SCHEME
The Government of Pakistan (GoP) launched an interest-free microloan scheme in 2014 to address the issues of poverty and rising unemployment in the country. Under the scheme, PKR 3.5 billion were allotted from the federal budget to facilitate the poor and destitute segments of the popula-tion in generating livelihood. However, in order to safeguard the interests of the MFPs it was decided that the funds under this scheme would be routed through the national apex, PPAF, and would only be extended in Union Councils that have low or no penetration of conventional microfinance.
As of December 2015, PKR 2.25 billion have been disbursed under the scheme to approximately 110,000 beneficiaries – out of which 66,000 were female and 44,000 were male applicants19. These interest free loans are being made available to men and women from households with a score of up to 40 on the Poverty Score Card (PSC) and with little or no access to banks or microcredit institutions. Most of the loans have been utilized in the livestock sector, followed by business and trading, services and agriculture.
Twenty-four MFPs have partnered with PPAF in extending interest free loans under the PM Inter-est-Free Loan scheme. It is hoped that the scheme would lead to over 1 million additional active bor-rowers over the next three years. Since this scheme is targeted toward those areas where conventional
Year 2013 2014 2015Number of Loans 136 2,185 12,612
GLP 33,902,858 530,587,461 3,061,824,879
Average Loan Size 249,286 242,832 242,771
PAR > 30 Days 0% 1.0% 1.3%
Table 1.2: Trend of Micro-Enterprise Lending by Selected MFBs18
17 Federal Bureau of Statistics, Government of Pakistan, 2005 18 Figures obtained from 7 MFBs19 http://www.pmifl.com.pk/
Annual Assessment of the Microfinance Industry
Financial Services for all 10The Year in Review
microfinance has little or no penetration, it pro-vides MFPs an opportunity to expand outreach in newer geographic markets. Moreover, it has the potential to allow borrowers of interest free loans to graduate to conventional microfinance. This is ensured as the interest free loan would be provided only once to an individual and after the completion of the first cycle he/she would be eligible only for a conventional microfinance loan.
CREDIT GUARANTEE SCHEME FOR SMALL & MARGINALIZED FARMERS
In 2015, the Government of Pakistan launched a credit guarantee scheme for small and marginalized farmers to ensure greater access to bank loans for production purposes. The scheme provides 50 per-cent risk coverage against the principal outstand-ing on loans to small and marginalized farmers by commercial, specialized and microfinance banks.
The federal government made an initial allocation of PKR 1 billion in the federal budget FY 2015-16, for the scheme which may be topped up annually. The allocated funds will be used to create a guaran-tee fund for farmers having up to 5 acres irrigated and 10 acres non-irrigated land holdings.
The objective of the scheme is to encourage par-ticipating commercial, specialized and microfi-nance banks to lend collateral-free to small and marginalized farmers to meet their working capital requirements. Credit Guarantee Limits (CGLs) will be assigned to all financial institutions involved in agriculture financing based on their exposure and potential in agricultural credit disbursements. The scheme is also open to all those banks which are not currently involved in agricultural financing by expressing their willingness to participate in the said scheme.
The scheme aims to benefit 300,000 farmer house-holds with production loans of up to PKR 100,000 and the loan tenor will be based on the cropping cycle up to a maximum period of one year20.
The scheme will exclusively apply to small and mar-ginalized farmers across the country owning/culti-
vating irrespective of land ownership. According to SBP, as per the Agriculture Census 2010, 5.35 million farm households (out of total 8.3 million) have landholding up to five acres in Pakistan. These small farmers have a significant share in the nation-al agricultural output. Despite their significance, they face difficulties in accessing formal credit due to size of the landholding and lack of collateral. As a result, they are forced to borrow from informal sources on unfair terms. Therefore, the scheme has been designed to enhance access of small and mar-ginalized farmers to formal credit.
CLIENT PROTECTION INITIATIVE (CPI)
The microfinance sector in Pakistan has shown an increasing focus on balancing social performance and financial sustainability among microfinance providers (MFPs). There is an understanding of mi-crofinance as a double-bottom line industry, where sustainability is not an end in itself but rather a means to achieving social goals. These goals can differ; while some MFPs may have a vision of pov-erty alleviation or women and rural community em-powerment, others focus on increasing access to formal finance for the poor and low-income strata of the population. In all cases, it has become im-portant for MFPs to track their progress towards achieving their respective social goals, using social performance and client protection parameters in the same way that financial data is used to manage the financial bottom line.
In tandem with its commitment to responsible fi-nance principles, PMN implemented the Client Protection Initiative (CPI), a 3-year project, funded under the State Bank of Pakistan (SBP) Financial Inclusion Program (FIP), which advocated client protection processes at industry level. The year in review saw the closing of the said project, culminat-ing in a series of lessons for the industry and paving the road forward.
The project consisted of two components:
20 Credit Guarantee for Small & Marginalized Farmers (CGSMF) Circular No.1, State Bank of Pakistan
Section 1 Financial Services for all
Pakistan Microfinance Review 2015
11
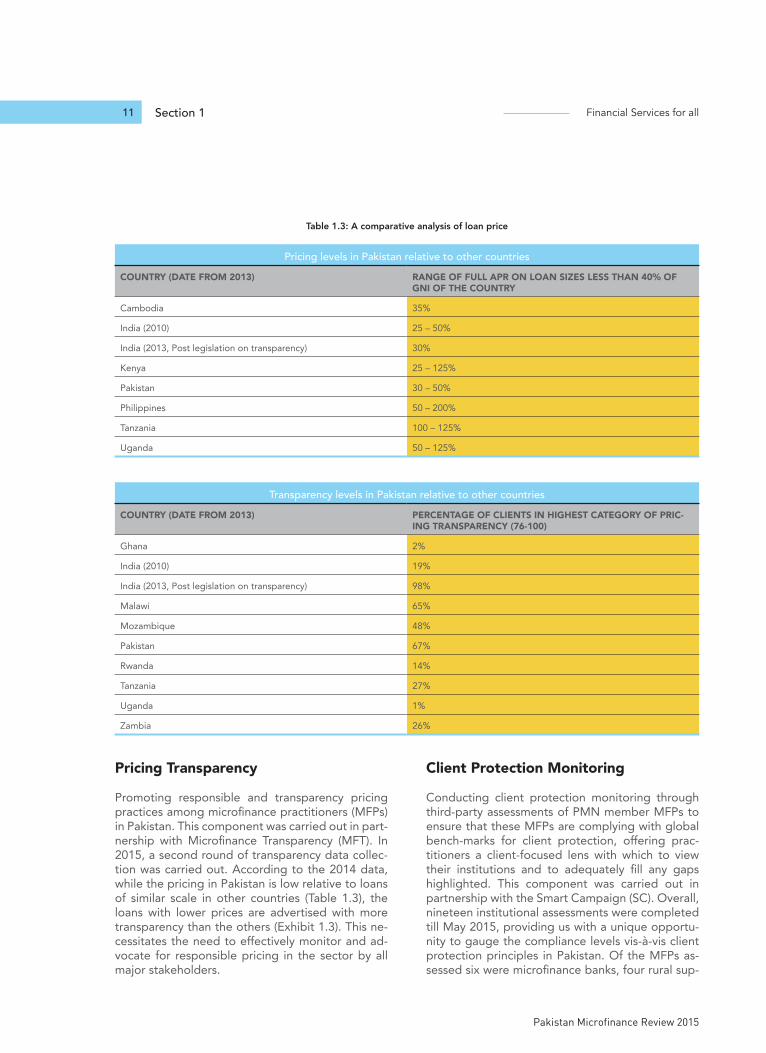
Pricing Transparency
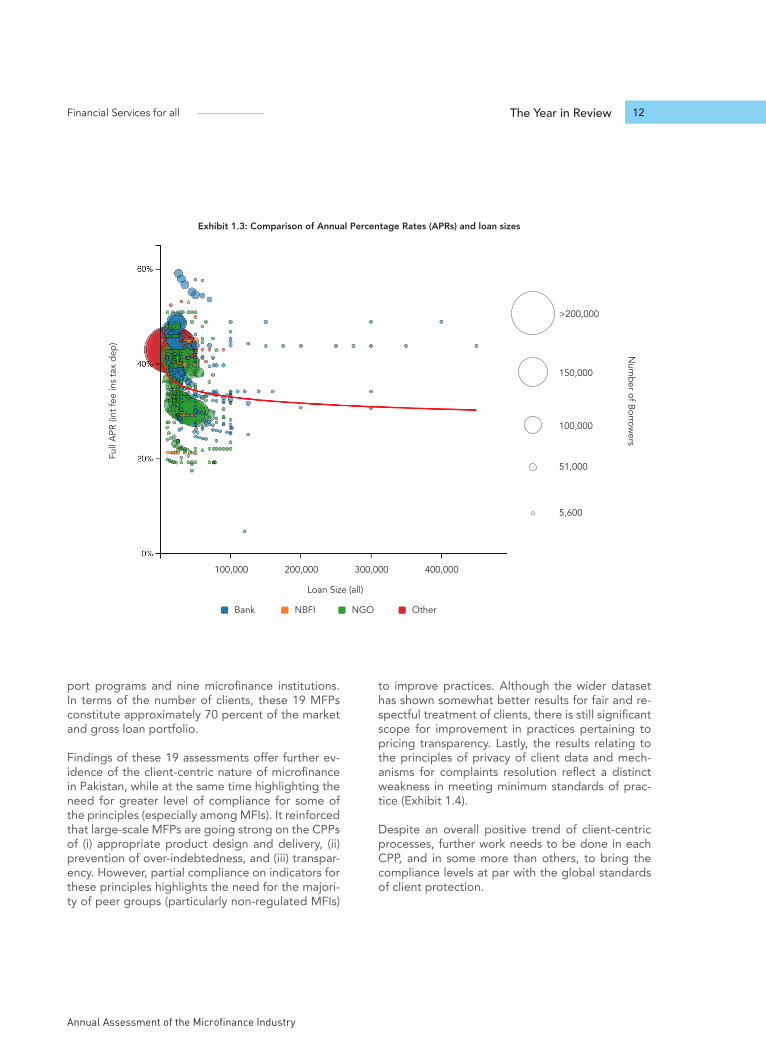
Promoting responsible and transparency pricing practices among microfinance practitioners (MFPs) in Pakistan. This component was carried out in part-nership with Microfinance Transparency (MFT). In 2015, a second round of transparency data collec-tion was carried out. According to the 2014 data, while the pricing in Pakistan is low relative to loans of similar scale in other countries (Table 1.3), the loans with lower prices are advertised with more transparency than the others (Exhibit 1.3). This ne-cessitates the need to effectively monitor and ad-vocate for responsible pricing in the sector by all major stakeholders.
Client Protection Monitoring
Conducting client protection monitoring through third-party assessments of PMN member MFPs to ensure that these MFPs are complying with global bench-marks for client protection, offering prac-titioners a client-focused lens with which to view their institutions and to adequately fill any gaps highlighted. This component was carried out in partnership with the Smart Campaign (SC). Overall, nineteen institutional assessments were completed till May 2015, providing us with a unique opportu-nity to gauge the compliance levels vis-à-vis client protection principles in Pakistan. Of the MFPs as-sessed six were microfinance banks, four rural sup-
Pricing levels in Pakistan relative to other countriesCOUNTRY (DATE FROM 2013) RANGE OF FULL APR ON LOAN SIZES LESS THAN 40% OF
GNI OF THE COUNTRY
Cambodia 35%
India (2010) 25 – 50%
India (2013, Post legislation on transparency) 30%
Kenya 25 – 125%
Pakistan 30 – 50%
Philippines 50 – 200%
Tanzania 100 – 125%
Uganda 50 – 125%
Transparency levels in Pakistan relative to other countriesCOUNTRY (DATE FROM 2013) PERCENTAGE OF CLIENTS IN HIGHEST CATEGORY OF PRIC-
ING TRANSPARENCY (76-100)
Ghana 2%
India (2010) 19%
India (2013, Post legislation on transparency) 98%
Malawi 65%
Mozambique 48%
Pakistan 67%
Rwanda 14%
Tanzania 27%
Uganda 1%
Zambia 26%
Table 1.3: A comparative analysis of loan price
Annual Assessment of the Microfinance Industry
Financial Services for all 12The Year in Review
Exhibit 1.3: Comparison of Annual Percentage Rates (APRs) and loan sizes
Full
APR
(int
fee
ins
tax
dep) N
umber of B
orrowers
100,000
5,600
51,000
100,000
150,000
>200,000
200,000 300,000
Loan Size (all)
400,000
Bank NGONBFI Other
port programs and nine microfinance institutions. In terms of the number of clients, these 19 MFPs constitute approximately 70 percent of the market and gross loan portfolio.
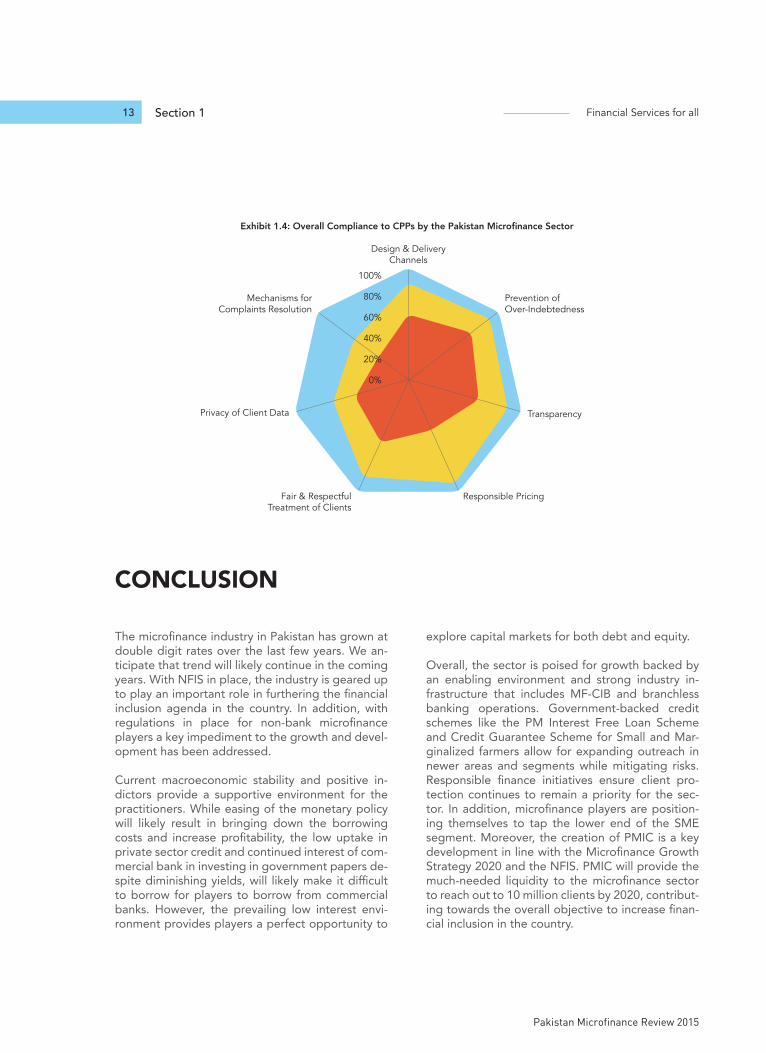
Findings of these 19 assessments offer further ev-idence of the client-centric nature of microfinance in Pakistan, while at the same time highlighting the need for greater level of compliance for some of the principles (especially among MFIs). It reinforced that large-scale MFPs are going strong on the CPPs of (i) appropriate product design and delivery, (ii) prevention of over-indebtedness, and (iii) transpar-ency. However, partial compliance on indicators for these principles highlights the need for the majori-ty of peer groups (particularly non-regulated MFIs)
to improve practices. Although the wider dataset has shown somewhat better results for fair and re-spectful treatment of clients, there is still significant scope for improvement in practices pertaining to pricing transparency. Lastly, the results relating to the principles of privacy of client data and mech-anisms for complaints resolution reflect a distinct weakness in meeting minimum standards of prac-tice (Exhibit 1.4).
Despite an overall positive trend of client-centric processes, further work needs to be done in each CPP, and in some more than others, to bring the compliance levels at par with the global standards of client protection.
Section 1 Financial Services for all
Pakistan Microfinance Review 2015
13
The microfinance industry in Pakistan has grown at double digit rates over the last few years. We an-ticipate that trend will likely continue in the coming years. With NFIS in place, the industry is geared up to play an important role in furthering the financial inclusion agenda in the country. In addition, with regulations in place for non-bank microfinance players a key impediment to the growth and devel-opment has been addressed.
Current macroeconomic stability and positive in-dictors provide a supportive environment for the practitioners. While easing of the monetary policy will likely result in bringing down the borrowing costs and increase profitability, the low uptake in private sector credit and continued interest of com-mercial bank in investing in government papers de-spite diminishing yields, will likely make it difficult to borrow for players to borrow from commercial banks. However, the prevailing low interest envi-ronment provides players a perfect opportunity to
explore capital markets for both debt and equity.
Overall, the sector is poised for growth backed by an enabling environment and strong industry in-frastructure that includes MF-CIB and branchless banking operations. Government-backed credit schemes like the PM Interest Free Loan Scheme and Credit Guarantee Scheme for Small and Mar-ginalized farmers allow for expanding outreach in newer areas and segments while mitigating risks. Responsible finance initiatives ensure client pro-tection continues to remain a priority for the sec-tor. In addition, microfinance players are position-ing themselves to tap the lower end of the SME segment. Moreover, the creation of PMIC is a key development in line with the Microfinance Growth Strategy 2020 and the NFIS. PMIC will provide the much-needed liquidity to the microfinance sector to reach out to 10 million clients by 2020, contribut-ing towards the overall objective to increase finan-cial inclusion in the country.
CONCLUSION
PAK
ISTA
N M
ICR
OFI
NA
NC
E R
EV
IEW
201
5
Privacy of Client Data
Mechanisms forComplaints Resolution
0%
20%
40%
60%
80%
100%
Fair & RespectfulTreatment of Clients
Design & DeliveryChannels
Prevention ofOver-Indebtedness
Responsible Pricing
Transparency
Exhibit 1.4: Overall Compliance to CPPs by the Pakistan Microfinance Sector

Annual Assessment of the Microfinance Industry
Financial Services for all 14The Year in Review
PAK
ISTA
N M
ICR
OFI
NA
NC
E R
EV
IEW
201
5

Section 1 Financial Services for all
Pakistan Microfinance Review 2015
15
Annual Assessment of the Microfinance Industry
Financial Services for all 16Financial Performance Review
SECTION 2
FINANCIAL PERFORMANCE REVIEW

Section 2 Financial Services for all
Pakistan Microfinance Review 2015
17
This section provides a detailed analysis of the fi-nancial performance of Pakistan’s microfinance in-dustry in 2015. Performance has been assessed on three levels: industry wise, across peer groups and institution wise. The analysis is backed by 88 finan-cial indicators, calculated from the audited financial statements of the reporting organizations. These
indicators have been compared across time and regions to develop a reliable and fair assessment of sector.
Detailed financial information is provided in the An-nex A-I and A-II of the PMR. Aggregate data has been reproduced for five years, whereas, the peer
FINANCIAL PERFORMANCE REVIEW
BOX 2.1PEER GROUPS
Microfinance InstitutionA non-bank non-government organization (NGO) providing microfinance services. Organizations in this group are registered under a variety of regulations, including the Societies Act, Trust Act, and the Companies Ordinance. The MFI peer group includes local as well as multinational NGOs such as BRAC-Pakistan and ASA-Pakistan. As of now these organizations are in process of transformation into Non-Bank MFIs under the new regulatory frame-work laid out for non-bank players by SECP.
Microfinance BankA commercial bank licensed and prudentially regulated by the SBP to exclusively service the microfinance market. The first MFB was established in 2000 under a presidential decree. Since then, 11 MFBs have been licensed under the Microfinance Institutions Ordinance, 2001. MFBs are legally empowered to accept and intermediate deposits from the public. Currently there are 11 MFBs operating in the country.
Rural Support ProgrammeAn NGO registered as a non-profit company under the Companies Ordinance. An RSP is differentiated from the MFI peer group based on the purely rural focus of its credit operations. As of now these organizations are in process of transformation into Non-Bank MFI under the new regulatory framework laid out for non-bank players by SECP.
Annual Assessment of the Microfinance Industry
Financial Services for all 18Financial Performance Review
group and institution specific data has been made available only for the year 2015.
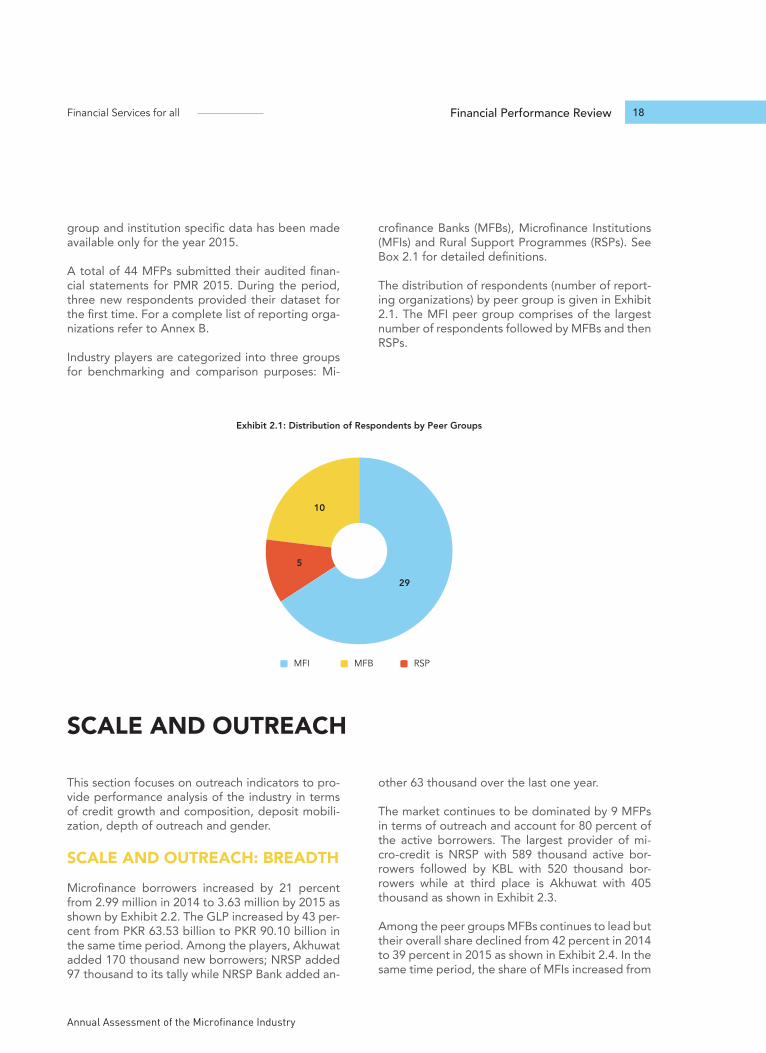
A total of 44 MFPs submitted their audited finan-cial statements for PMR 2015. During the period, three new respondents provided their dataset for the first time. For a complete list of reporting orga-nizations refer to Annex B.
Industry players are categorized into three groups for benchmarking and comparison purposes: Mi-
crofinance Banks (MFBs), Microfinance Institutions (MFIs) and Rural Support Programmes (RSPs). See Box 2.1 for detailed definitions.
The distribution of respondents (number of report-ing organizations) by peer group is given in Exhibit 2.1. The MFI peer group comprises of the largest number of respondents followed by MFBs and then RSPs.
29
10
5
MFI RSPMFB
Exhibit 2.1: Distribution of Respondents by Peer Groups
This section focuses on outreach indicators to pro-vide performance analysis of the industry in terms of credit growth and composition, deposit mobili-zation, depth of outreach and gender.
SCALE AND OUTREACH: BREADTH
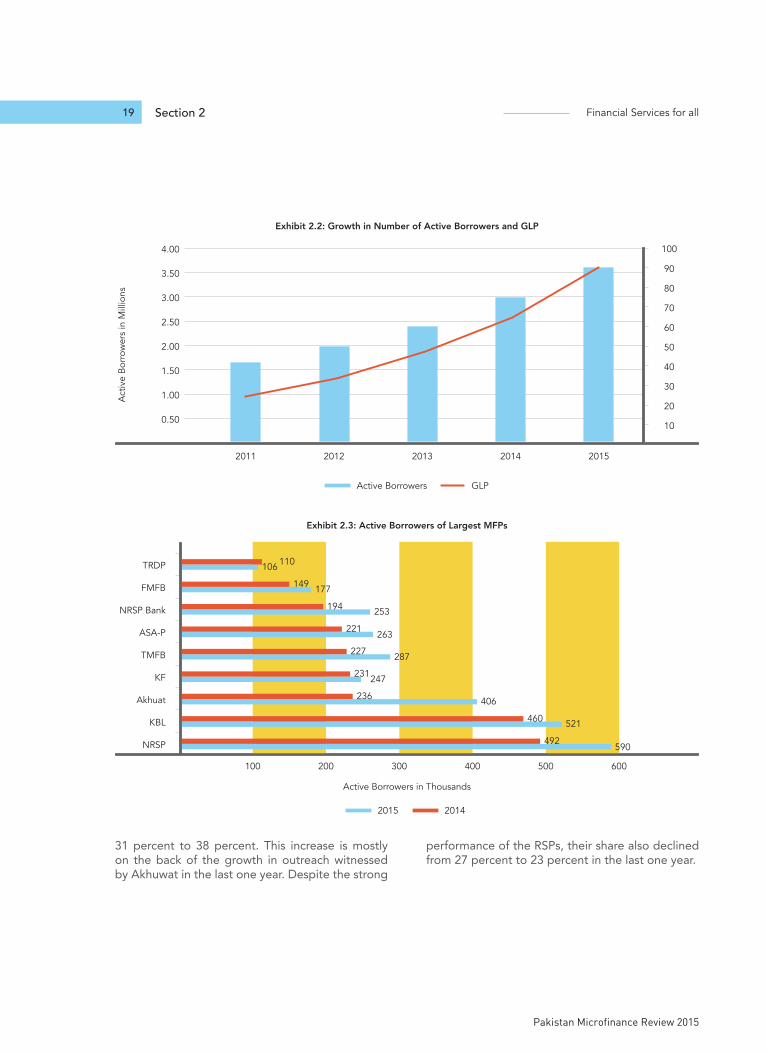
Microfinance borrowers increased by 21 percent from 2.99 million in 2014 to 3.63 million by 2015 as shown by Exhibit 2.2. The GLP increased by 43 per-cent from PKR 63.53 billion to PKR 90.10 billion in the same time period. Among the players, Akhuwat added 170 thousand new borrowers; NRSP added 97 thousand to its tally while NRSP Bank added an-
other 63 thousand over the last one year.
The market continues to be dominated by 9 MFPs in terms of outreach and account for 80 percent of the active borrowers. The largest provider of mi-cro-credit is NRSP with 589 thousand active bor-rowers followed by KBL with 520 thousand bor-rowers while at third place is Akhuwat with 405 thousand as shown in Exhibit 2.3.
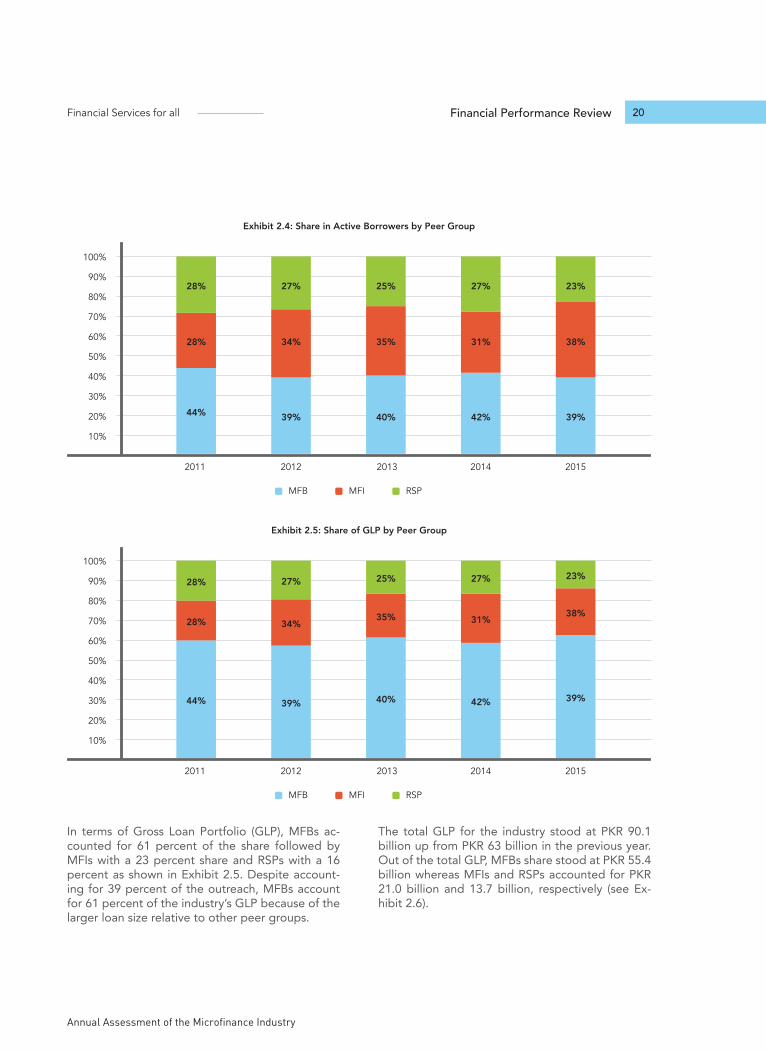
Among the peer groups MFBs continues to lead but their overall share declined from 42 percent in 2014 to 39 percent in 2015 as shown in Exhibit 2.4. In the same time period, the share of MFIs increased from
SCALE AND OUTREACH
Section 2 Financial Services for all
Pakistan Microfinance Review 2015
19
31 percent to 38 percent. This increase is mostly on the back of the growth in outreach witnessed by Akhuwat in the last one year. Despite the strong
performance of the RSPs, their share also declined from 27 percent to 23 percent in the last one year.
Exhibit 2.2: Growth in Number of Active Borrowers and GLP
0.50
1.00
1.50
2.00
2.50
3.00
3.50
4.00
Act
ive
Bor
row
ers
in M
illio
ns
2011 2012 2013 2014 2015
10
20
30
40
50
60
70
80
90
100
GLPActive Borrowers
NRSP
100 200 300 400 500 600
KBL
Akhuat
KF
TMFB
ASA-P
NRSP Bank
FMFB
TRDP
20142015
590492
521460
406236
247231
287227
263221
253194
177149
106 110
Active Borrowers in Thousands
Exhibit 2.3: Active Borrowers of Largest MFPs
Annual Assessment of the Microfinance Industry
Financial Services for all 20Financial Performance Review
In terms of Gross Loan Portfolio (GLP), MFBs ac-counted for 61 percent of the share followed by MFIs with a 23 percent share and RSPs with a 16 percent as shown in Exhibit 2.5. Despite account-ing for 39 percent of the outreach, MFBs account for 61 percent of the industry’s GLP because of the larger loan size relative to other peer groups.
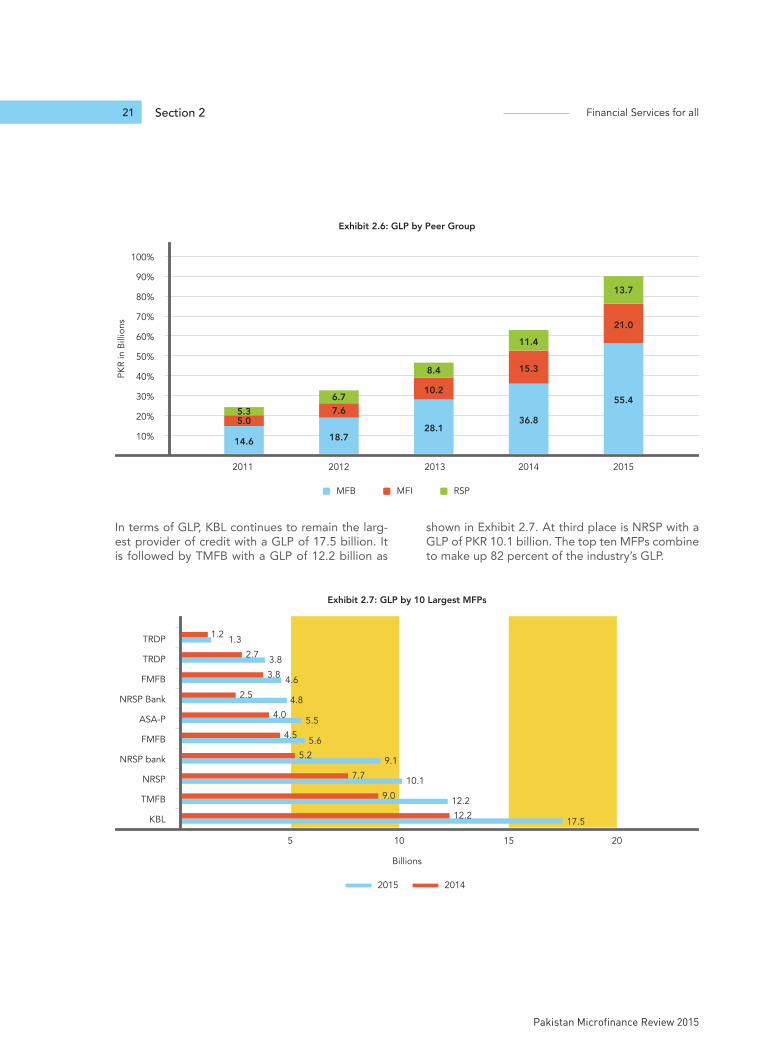
The total GLP for the industry stood at PKR 90.1 billion up from PKR 63 billion in the previous year. Out of the total GLP, MFBs share stood at PKR 55.4 billion whereas MFIs and RSPs accounted for PKR 21.0 billion and 13.7 billion, respectively (see Ex-hibit 2.6).
Exhibit 2.4: Share in Active Borrowers by Peer Group
10%
20%
30%
40%
50%
60%
70%
80%
90%
100%
2011
44%
28%
28%
2012
39%
34%
27%
2013
40%
35%
25%
2014
42%
31%
27%
2015
39%
38%
23%
MFB RSPMFI
Exhibit 2.5: Share of GLP by Peer Group
10%
20%
30%
40%
50%
60%
70%
80%
90%
100%
2011
44%
28%
28%
2012
39%
34%
27%
2013
40%
35%
25%
2014
42%
31%
27%
2015
39%
38%
23%
MFB RSPMFI
Section 2 Financial Services for all
Pakistan Microfinance Review 2015
21
Exhibit 2.6: GLP by Peer Group
10%
20%
30%
40%
50%
60%
70%
80%
90%
100%
2011
14.6
5.05.3
2012
18.7
7.66.7
2013
28.1
10.2
8.4
2014
36.8
15.3
11.4
2015
55.4
21.0
13.7
MFB RSPMFI
PKR
in B
illio
ns
In terms of GLP, KBL continues to remain the larg-est provider of credit with a GLP of 17.5 billion. It is followed by TMFB with a GLP of 12.2 billion as
shown in Exhibit 2.7. At third place is NRSP with a GLP of PKR 10.1 billion. The top ten MFPs combine to make up 82 percent of the industry’s GLP.
KBL
5 1510 20
TMFB
NRSP
NRSP bank
FMFB
ASA-P
NRSP Bank
FMFB
TRDP
TRDP
20142015
17.512.2
12.29.0
10.17.7
9.15.2
5.64.5
5.54.0
4.82.5
4.63.8
3.82.7
1.31.2
Billions
Exhibit 2.7: GLP by 10 Largest MFPs
Annual Assessment of the Microfinance Industry
Financial Services for all 22Financial Performance Review
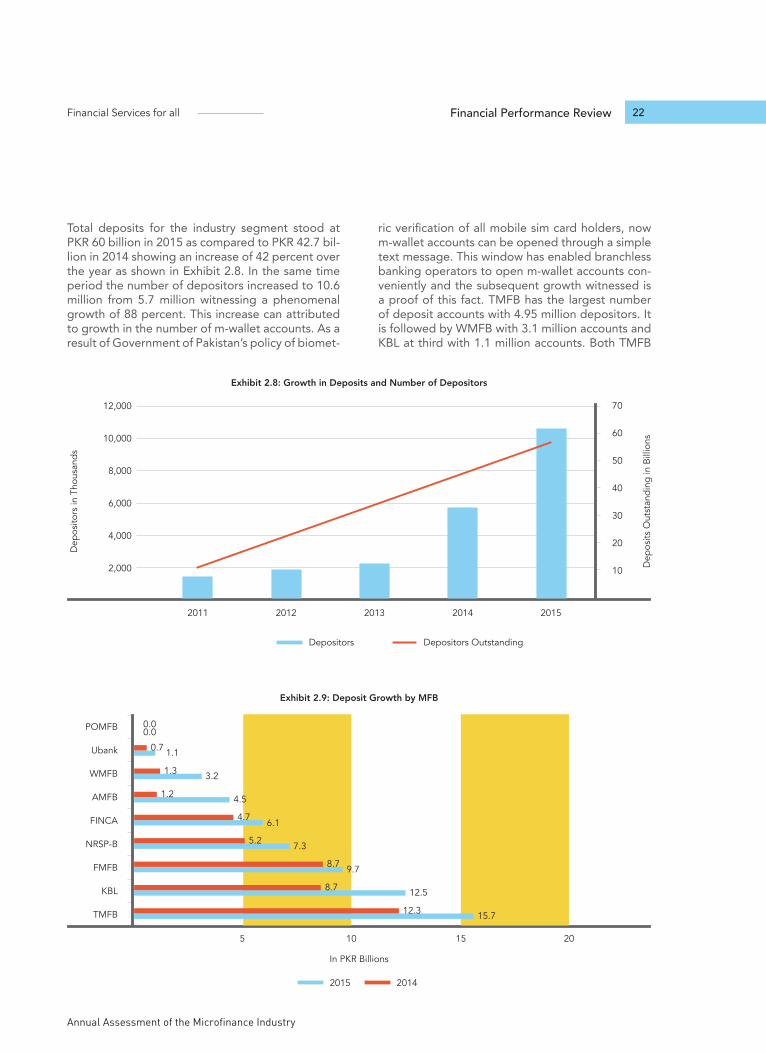
Total deposits for the industry segment stood at PKR 60 billion in 2015 as compared to PKR 42.7 bil-lion in 2014 showing an increase of 42 percent over the year as shown in Exhibit 2.8. In the same time period the number of depositors increased to 10.6 million from 5.7 million witnessing a phenomenal growth of 88 percent. This increase can attributed to growth in the number of m-wallet accounts. As a result of Government of Pakistan’s policy of biomet-
ric verification of all mobile sim card holders, now m-wallet accounts can be opened through a simple text message. This window has enabled branchless banking operators to open m-wallet accounts con-veniently and the subsequent growth witnessed is a proof of this fact. TMFB has the largest number of deposit accounts with 4.95 million depositors. It is followed by WMFB with 3.1 million accounts and KBL at third with 1.1 million accounts. Both TMFB
Exhibit 2.8: Growth in Deposits and Number of Depositors
2,000
4,000
6,000
8,000
10,000
12,000
Dep
osito
rs in
Tho
usan
ds
Dep
osits
Out
stan
ding
in B
illio
ns
2011 2012 2013 2014 2015
10
20
30
40
50
60
70
Depositors OutstandingDepositors
5 1510 20
TMFB
KBL
FMFB
NRSP-B
FINCA
AMFB
WMFB
Ubank
POMFB
20142015
15.712.3
12.58.7
9.78.7
7.35.2
6.14.7
4.51.2
3.21.3
1.10.7
0.00.0
In PKR Billions
Exhibit 2.9: Deposit Growth by MFB
Section 2 Financial Services for all
Pakistan Microfinance Review 2015
23
and WMFB have been allowed to open m-wallet accounts using USSD string and bulk of the deposit accounts are m-wallet accounts.
Overall, TMFB has the largest deposit base with PKR 15.6 billion among the MFBs up from 12.3 bil-lion in the previous year; followed by KBL with PKR 12.2 billion and FMFB at third place with PKR 9.96 billion as shown in Exhibit 2.9.
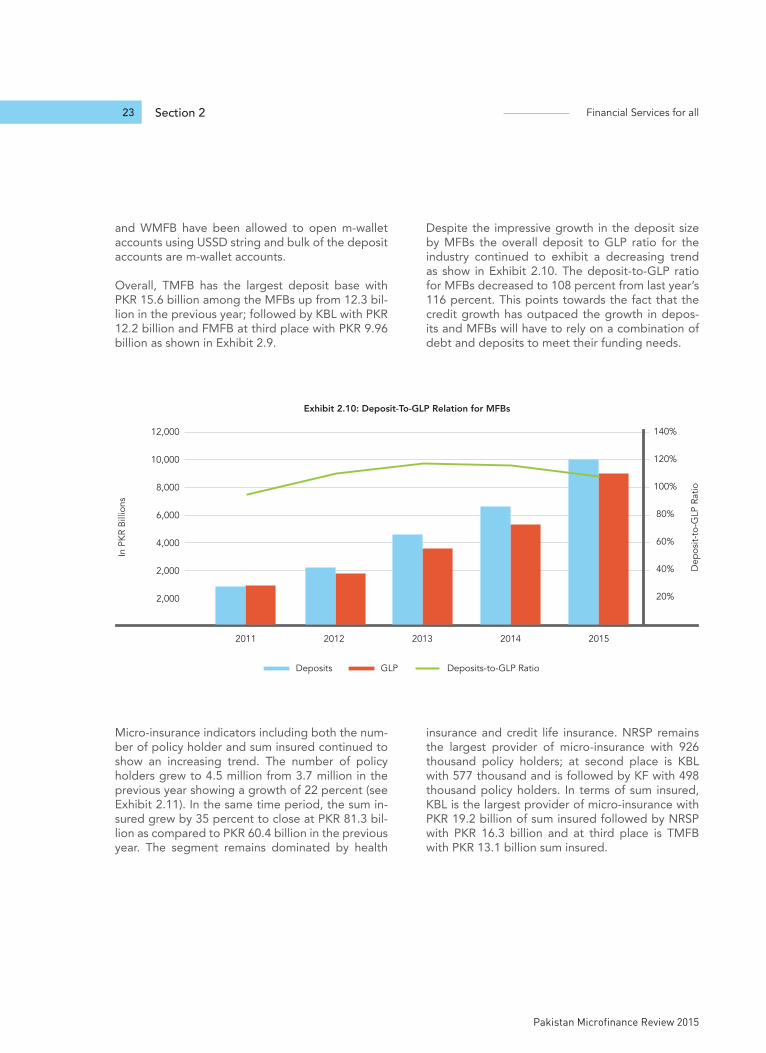
Despite the impressive growth in the deposit size by MFBs the overall deposit to GLP ratio for the industry continued to exhibit a decreasing trend as show in Exhibit 2.10. The deposit-to-GLP ratio for MFBs decreased to 108 percent from last year’s 116 percent. This points towards the fact that the credit growth has outpaced the growth in depos-its and MFBs will have to rely on a combination of debt and deposits to meet their funding needs.
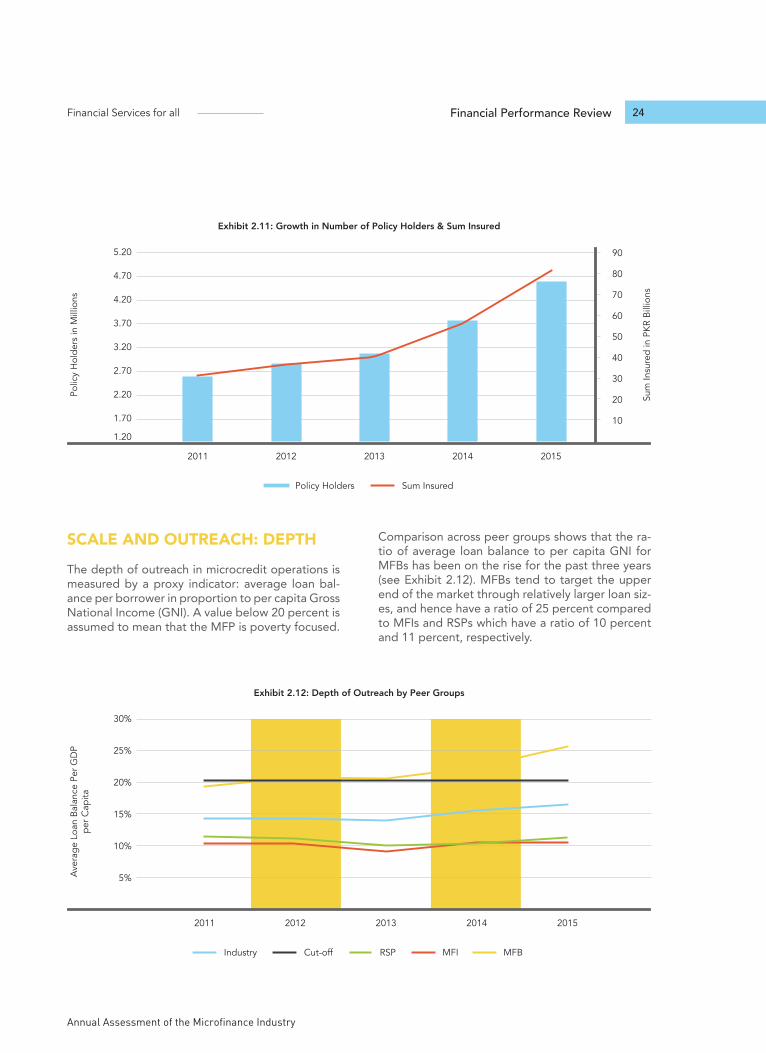
Micro-insurance indicators including both the num-ber of policy holder and sum insured continued to show an increasing trend. The number of policy holders grew to 4.5 million from 3.7 million in the previous year showing a growth of 22 percent (see Exhibit 2.11). In the same time period, the sum in-sured grew by 35 percent to close at PKR 81.3 bil-lion as compared to PKR 60.4 billion in the previous year. The segment remains dominated by health
insurance and credit life insurance. NRSP remains the largest provider of micro-insurance with 926 thousand policy holders; at second place is KBL with 577 thousand and is followed by KF with 498 thousand policy holders. In terms of sum insured, KBL is the largest provider of micro-insurance with PKR 19.2 billion of sum insured followed by NRSP with PKR 16.3 billion and at third place is TMFB with PKR 13.1 billion sum insured.
Exhibit 2.10: Deposit-To-GLP Relation for MFBs
2,000
2,000
4,000
6,000
8,000
10,000
12,000
In P
KR
Bill
ions
Dep
osit-
to-G
LP R
atio
2011 2012 2013 2014 2015
20%
40%
60%
80%
100%
120%
140%
GLP Deposits-to-GLP RatioDeposits
Annual Assessment of the Microfinance Industry
Financial Services for all 24Financial Performance Review
Exhibit 2.11: Growth in Number of Policy Holders & Sum Insured
2.70
1.70
2.20
1.20
3.20
3.70
4.20
4.70
5.20
Polic
y H
olde
rs in
Mill
ions
Sum
Insu
red
in P
KR
Bill
ions
2011 2012 2013 2014 2015
30
20
10
40
50
60
70
80
90
Sum InsuredPolicy Holders
Exhibit 2.12: Depth of Outreach by Peer Groups
10%
5%
15%
20%
25%
30%
Ave
rage
Loa
n B
alan
ce P
er G
DP
per C
apita
2011 2012 2013 2014 2015
Cut-off MFI MFBIndustry RSP
SCALE AND OUTREACH: DEPTH
The depth of outreach in microcredit operations is measured by a proxy indicator: average loan bal-ance per borrower in proportion to per capita Gross National Income (GNI). A value below 20 percent is assumed to mean that the MFP is poverty focused.
Comparison across peer groups shows that the ra-tio of average loan balance to per capita GNI for MFBs has been on the rise for the past three years (see Exhibit 2.12). MFBs tend to target the upper end of the market through relatively larger loan siz-es, and hence have a ratio of 25 percent compared to MFIs and RSPs which have a ratio of 10 percent and 11 percent, respectively.
Section 2 Financial Services for all
Pakistan Microfinance Review 2015
25
Here it must be kept in mind that low account size does not guarantee a lower income clientele nor does a higher loan size means that the MFPs are moving out of their target markets. Since, many of the MFPs use a graduation model of loan sizes, over time first time borrowers decline resulting in increasing of loan sizes. This situation holds true for MFPs in Pakistan which have large numbers of re-turning clients among its active borrowers. This is particularly true for MFBs who are upscaling loan sizes to cater to funding needs of micro-enterpris-es. Another reason can be the realization among practitioners that the loan sizes are unnecessarily conservative and increasing loan sizes is not related to catering for lower income segments. This is also
true for players in Pakistan as a number of them have lately recalibrated their loan sizes to keep up with the requirements of their clients and inflation.
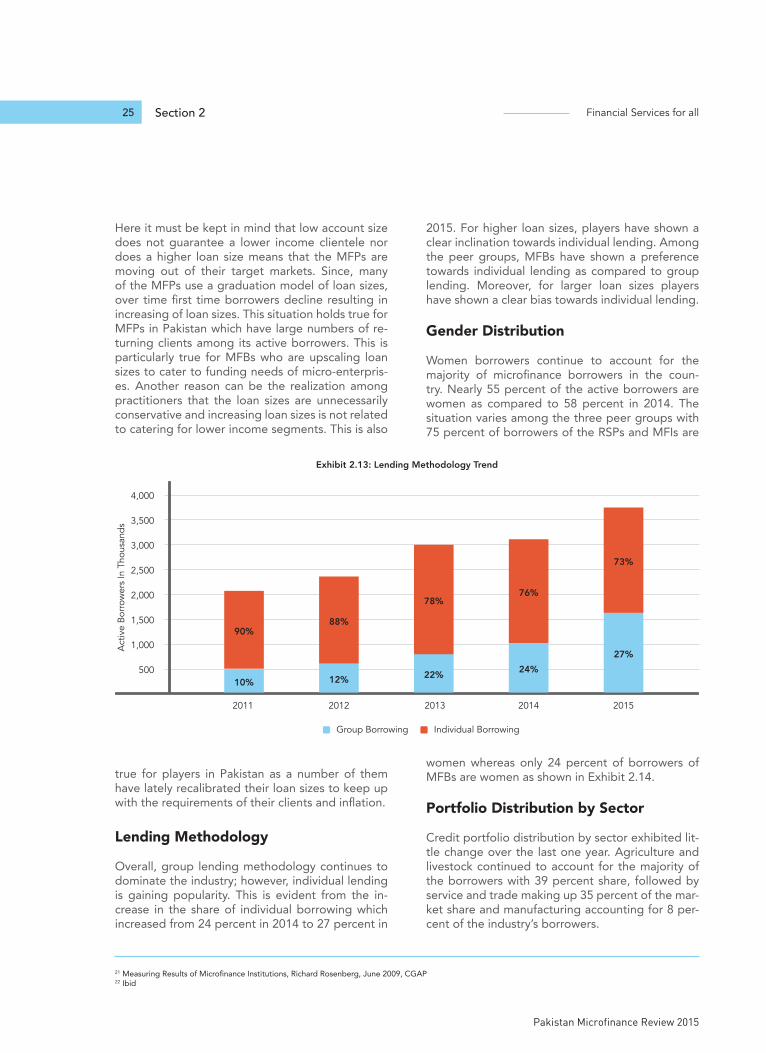
Lending Methodology
Overall, group lending methodology continues to dominate the industry; however, individual lending is gaining popularity. This is evident from the in-crease in the share of individual borrowing which increased from 24 percent in 2014 to 27 percent in
2015. For higher loan sizes, players have shown a clear inclination towards individual lending. Among the peer groups, MFBs have shown a preference towards individual lending as compared to group lending. Moreover, for larger loan sizes players have shown a clear bias towards individual lending.
Gender Distribution
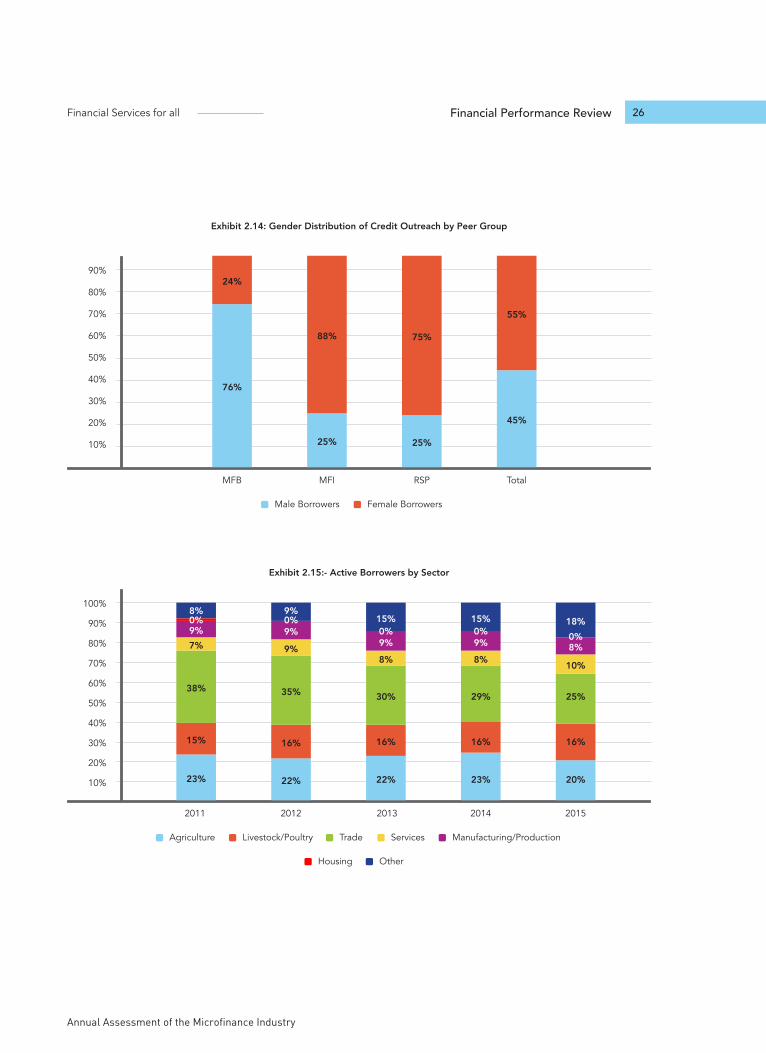
Women borrowers continue to account for the majority of microfinance borrowers in the coun-try. Nearly 55 percent of the active borrowers are women as compared to 58 percent in 2014. The situation varies among the three peer groups with 75 percent of borrowers of the RSPs and MFIs are
women whereas only 24 percent of borrowers of MFBs are women as shown in Exhibit 2.14.
Portfolio Distribution by Sector
Credit portfolio distribution by sector exhibited lit-tle change over the last one year. Agriculture and livestock continued to account for the majority of the borrowers with 39 percent share, followed by service and trade making up 35 percent of the mar-ket share and manufacturing accounting for 8 per-cent of the industry’s borrowers.
Exhibit 2.13: Lending Methodology Trend
500
1,000
1,500
2,000
2,500
3,000
3,500
4,000
2011
10%
90%
2012
12%
88%
2013
22%
78%
2014
24%
76%
2015
27%
73%
Group Borrowing Individual Borrowing
Act
ive
Bor
row
ers
In T
hous
ands
21 Measuring Results of Microfinance Institutions, Richard Rosenberg, June 2009, CGAP22 Ibid
Annual Assessment of the Microfinance Industry
Financial Services for all 26Financial Performance Review
Exhibit 2.14: Gender Distribution of Credit Outreach by Peer Group
10%
20%
30%
40%
50%
60%
70%
90%
80%
MFB
76%
24%
MFI
25%
88%
RSP
25%
75%
Total
45%
55%
Male Borrowers Female Borrowers
Exhibit 2.15:- Active Borrowers by Sector
10%
20%
30%
40%
50%
60%
70%
80%
90%
100%
2011
23%
38%
15%
9%0%8%
7%
2012 2013 2014 2015
Housing Other
Agriculture Trade Services Manufacturing/ProductionLivestock/Poultry
22%
35%
16%
9%
9%
9%
0%
22%
30%
16%
9%
15%
8%
0%
23%
29%
16%
9%
15%
8%
0%
20%
25%
16%
8%
18%
10%
0%
Section 2 Financial Services for all
Pakistan Microfinance Review 2015
27
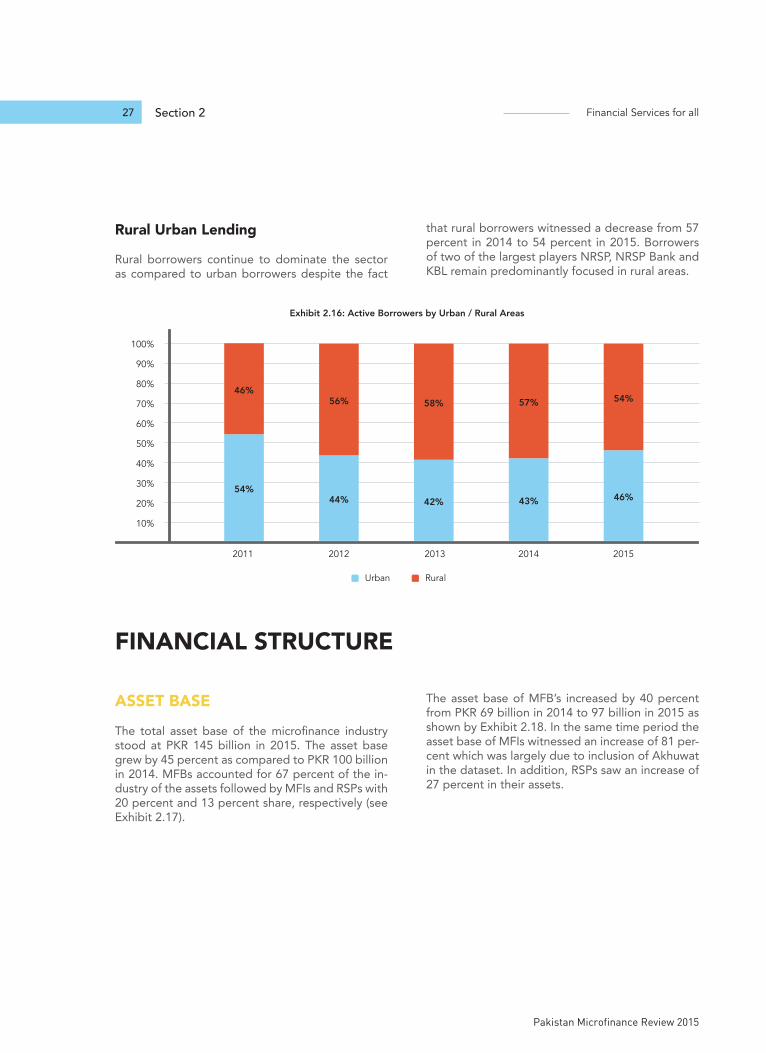
Rural Urban Lending
Rural borrowers continue to dominate the sector as compared to urban borrowers despite the fact
that rural borrowers witnessed a decrease from 57 percent in 2014 to 54 percent in 2015. Borrowers of two of the largest players NRSP, NRSP Bank and KBL remain predominantly focused in rural areas.
Exhibit 2.16: Active Borrowers by Urban / Rural Areas
10%
20%
30%
40%
50%
60%
70%
80%
90%
100%
2011
54%
46%
2012
44%
56%
2013
42%
58%
2014
43%
57%
2015
46%
54%
Urban Rural
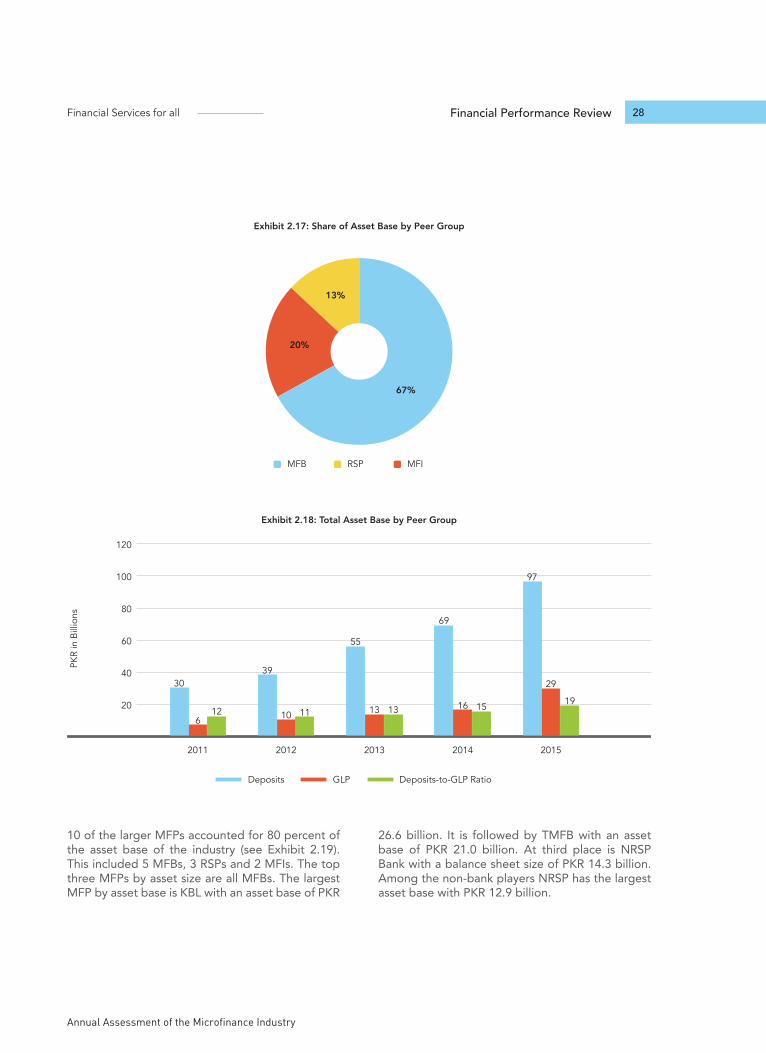
ASSET BASE
The total asset base of the microfinance industry stood at PKR 145 billion in 2015. The asset base grew by 45 percent as compared to PKR 100 billion in 2014. MFBs accounted for 67 percent of the in-dustry of the assets followed by MFIs and RSPs with 20 percent and 13 percent share, respectively (see Exhibit 2.17).
The asset base of MFB’s increased by 40 percent from PKR 69 billion in 2014 to 97 billion in 2015 as shown by Exhibit 2.18. In the same time period the asset base of MFIs witnessed an increase of 81 per-cent which was largely due to inclusion of Akhuwat in the dataset. In addition, RSPs saw an increase of 27 percent in their assets.
FINANCIAL STRUCTURE
Annual Assessment of the Microfinance Industry
Financial Services for all 28Financial Performance Review
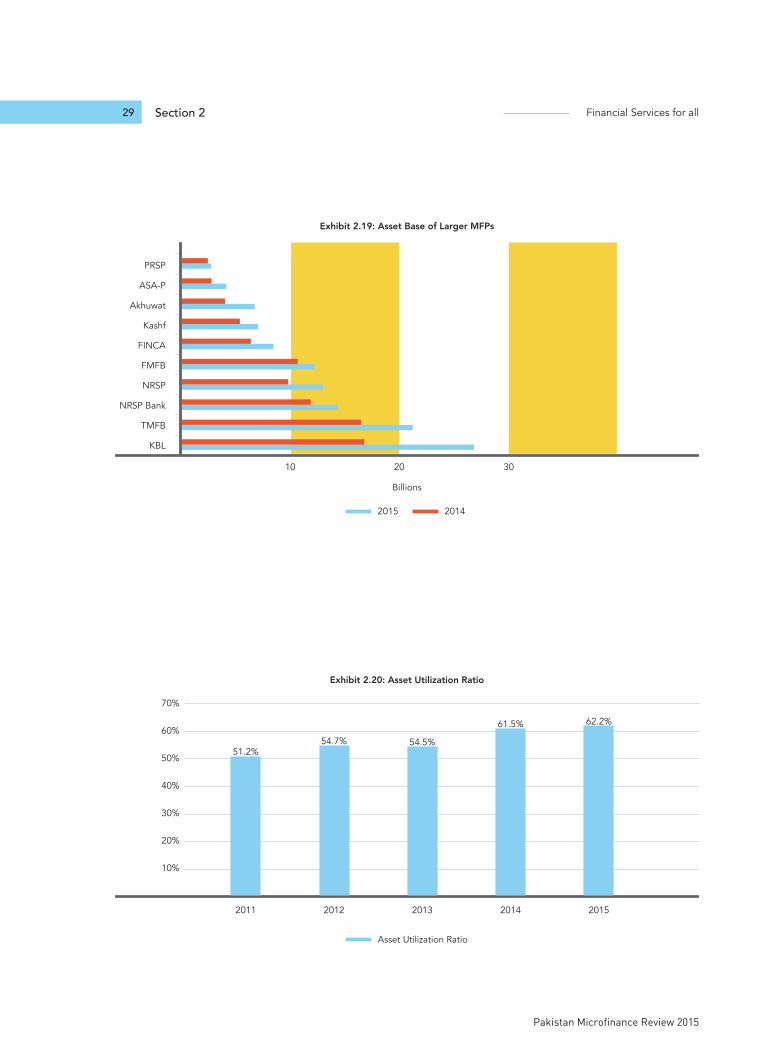
10 of the larger MFPs accounted for 80 percent of the asset base of the industry (see Exhibit 2.19). This included 5 MFBs, 3 RSPs and 2 MFIs. The top three MFPs by asset size are all MFBs. The largest MFP by asset base is KBL with an asset base of PKR
26.6 billion. It is followed by TMFB with an asset base of PKR 21.0 billion. At third place is NRSP Bank with a balance sheet size of PKR 14.3 billion. Among the non-bank players NRSP has the largest asset base with PKR 12.9 billion.
67%
13%
20%
MFB MFIRSP
Exhibit 2.17: Share of Asset Base by Peer Group
Exhibit 2.18: Total Asset Base by Peer Group
20
40
60
80
100
120
PKR
in B
illio
ns
2011 2012 2013 2014 2015
GLP Deposits-to-GLP RatioDeposits
39
10 11
55
13 13
97
29
19
69
16 15
30
612
Section 2 Financial Services for all
Pakistan Microfinance Review 2015
29
KBL
10 3020
TMFB
NRSP Bank
NRSP
FMFB
FINCA
Kashf
Akhuwat
ASA-P
PRSP
20142015
Billions
Exhibit 2.19: Asset Base of Larger MFPs
Exhibit 2.20: Asset Utilization Ratio
20%
10%
51.2%54.7% 54.5%
61.5% 62.2%
30%
40%
50%
60%
70%
2011 2012 2013 2014 2015
Asset Utilization Ratio
Annual Assessment of the Microfinance Industry
Financial Services for all 30Financial Performance Review
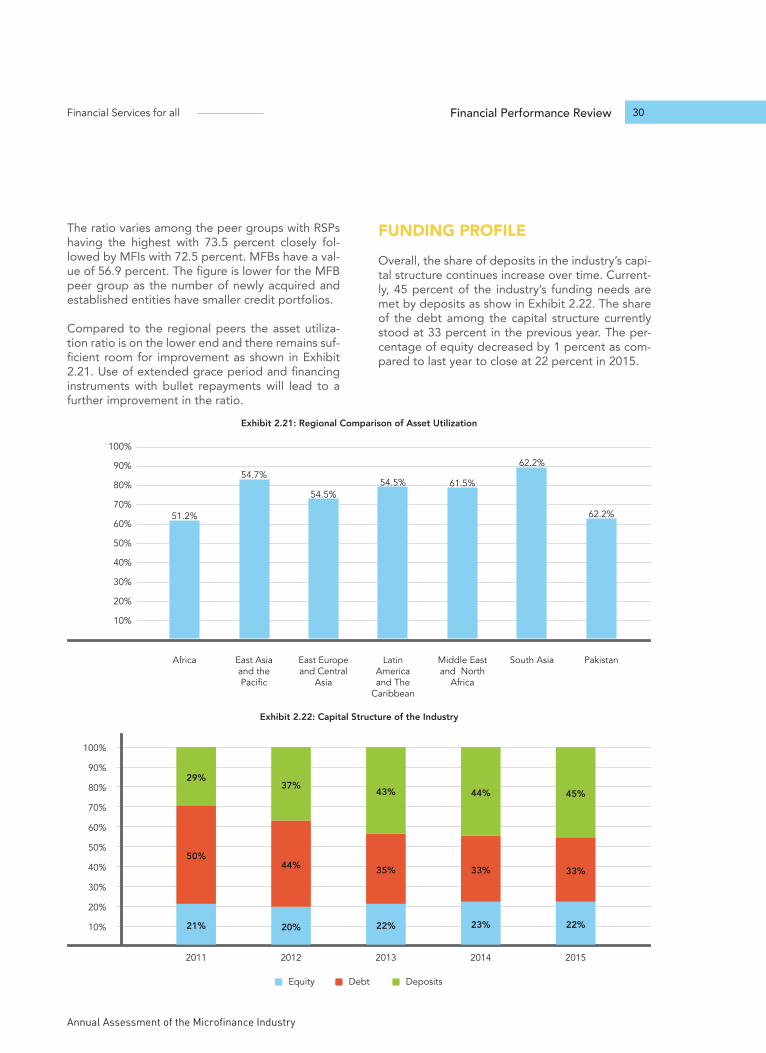
The ratio varies among the peer groups with RSPs having the highest with 73.5 percent closely fol-lowed by MFIs with 72.5 percent. MFBs have a val-ue of 56.9 percent. The figure is lower for the MFB peer group as the number of newly acquired and established entities have smaller credit portfolios.
Compared to the regional peers the asset utiliza-tion ratio is on the lower end and there remains suf-ficient room for improvement as shown in Exhibit 2.21. Use of extended grace period and financing instruments with bullet repayments will lead to a further improvement in the ratio.
FUNDING PROFILE
Overall, the share of deposits in the industry’s capi-tal structure continues increase over time. Current-ly, 45 percent of the industry’s funding needs are met by deposits as show in Exhibit 2.22. The share of the debt among the capital structure currently stood at 33 percent in the previous year. The per-centage of equity decreased by 1 percent as com-pared to last year to close at 22 percent in 2015.
Exhibit 2.21: Regional Comparison of Asset Utilization
50%
40%
30%
20%
10%
60%
70%
80%
90%
100%
Africa East Asia and the Pacific
East Europe and Central
Asia
Latin America and The
Caribbean
Middle East and North
Africa
South Asia Pakistan
51.2%
54.7%
54.5%54.5% 61.5%
62.2%
62.2%
Exhibit 2.22: Capital Structure of the Industry
10%
20%
30%
40%
50%
60%
70%
80%
90%
100%
2011
21%
50%
29%
2012
20%
44%
37%
2013
22%
35%
43%
2014
23%
33%
44%
2015
22%
33%
45%
Equity DepositsDebt
Section 2 Financial Services for all
Pakistan Microfinance Review 2015
31
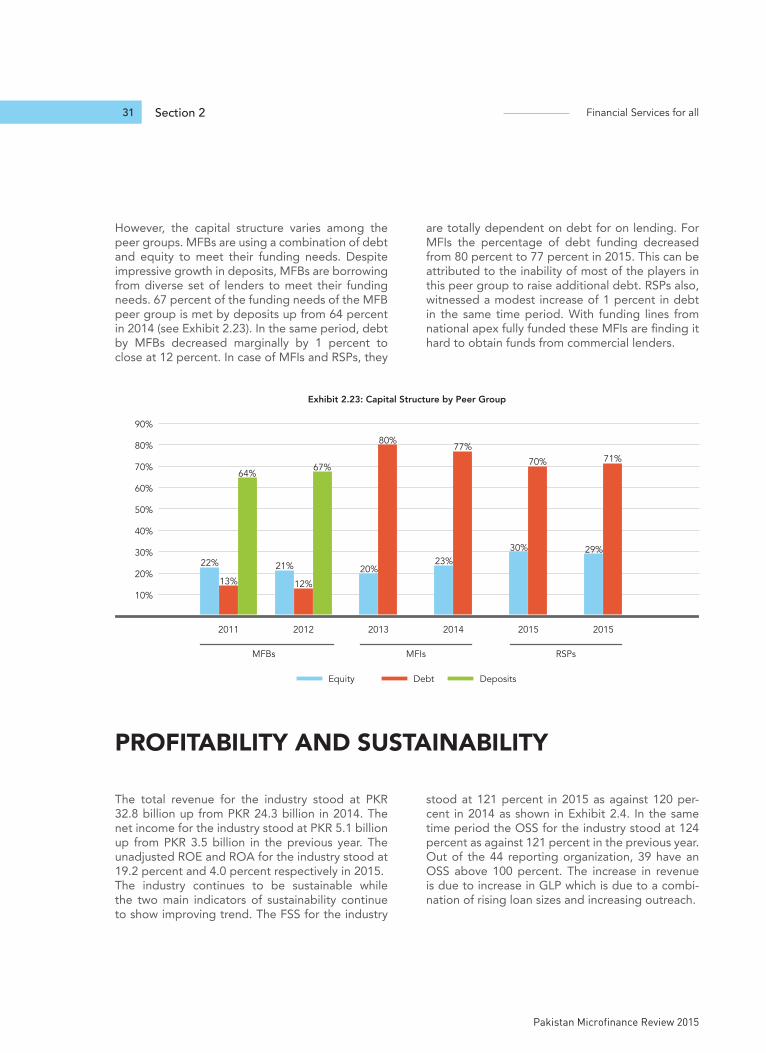
However, the capital structure varies among the peer groups. MFBs are using a combination of debt and equity to meet their funding needs. Despite impressive growth in deposits, MFBs are borrowing from diverse set of lenders to meet their funding needs. 67 percent of the funding needs of the MFB peer group is met by deposits up from 64 percent in 2014 (see Exhibit 2.23). In the same period, debt by MFBs decreased marginally by 1 percent to close at 12 percent. In case of MFIs and RSPs, they
are totally dependent on debt for on lending. For MFIs the percentage of debt funding decreased from 80 percent to 77 percent in 2015. This can be attributed to the inability of most of the players in this peer group to raise additional debt. RSPs also, witnessed a modest increase of 1 percent in debt in the same time period. With funding lines from national apex fully funded these MFIs are finding it hard to obtain funds from commercial lenders.
Exhibit 2.23: Capital Structure by Peer Group
10%
20%
30%
40%
50%
60%
70%
MFBs MFIs RSPs
80%
90%
2011 2012 2013 2014 2015 2015
Debt DepositsEquity
21%
12%
67%
20%
80%
30%
70%
29%
71%
23%
77%
22%
13%
64%
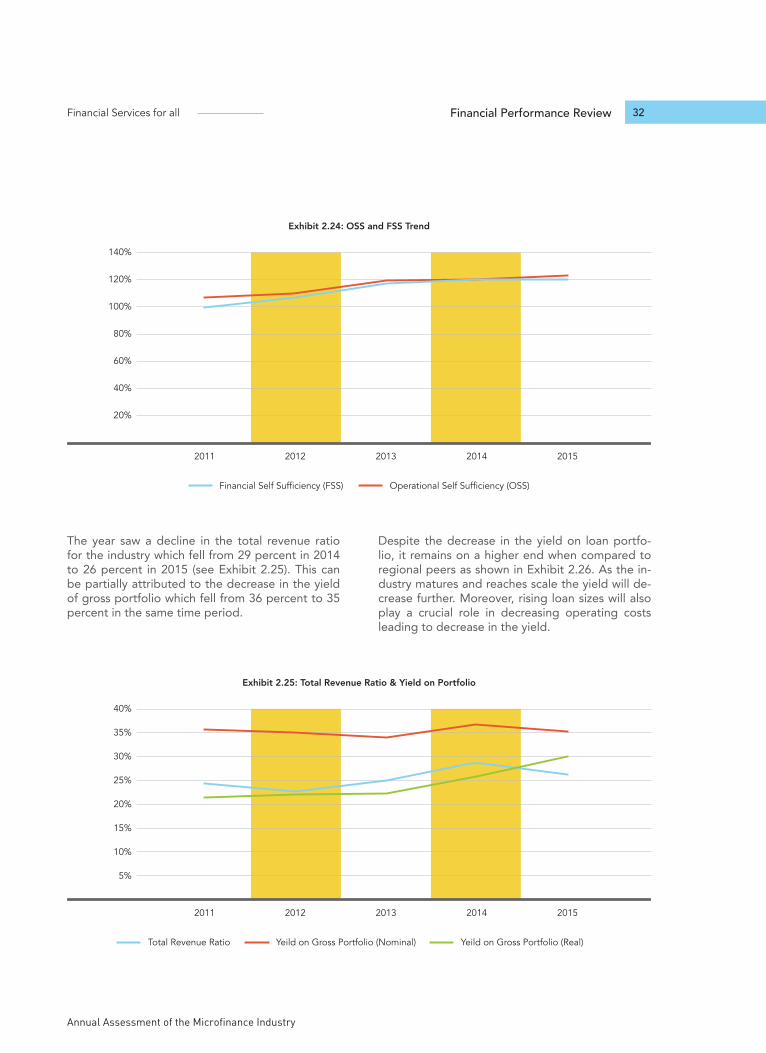
The total revenue for the industry stood at PKR 32.8 billion up from PKR 24.3 billion in 2014. The net income for the industry stood at PKR 5.1 billion up from PKR 3.5 billion in the previous year. The unadjusted ROE and ROA for the industry stood at 19.2 percent and 4.0 percent respectively in 2015. The industry continues to be sustainable while the two main indicators of sustainability continue to show improving trend. The FSS for the industry
stood at 121 percent in 2015 as against 120 per-cent in 2014 as shown in Exhibit 2.4. In the same time period the OSS for the industry stood at 124 percent as against 121 percent in the previous year. Out of the 44 reporting organization, 39 have an OSS above 100 percent. The increase in revenue is due to increase in GLP which is due to a combi-nation of rising loan sizes and increasing outreach.
PROFITABILITY AND SUSTAINABILITY
Annual Assessment of the Microfinance Industry
Financial Services for all 32Financial Performance Review
The year saw a decline in the total revenue ratio for the industry which fell from 29 percent in 2014 to 26 percent in 2015 (see Exhibit 2.25). This can be partially attributed to the decrease in the yield of gross portfolio which fell from 36 percent to 35 percent in the same time period.
Despite the decrease in the yield on loan portfo-lio, it remains on a higher end when compared to regional peers as shown in Exhibit 2.26. As the in-dustry matures and reaches scale the yield will de-crease further. Moreover, rising loan sizes will also play a crucial role in decreasing operating costs leading to decrease in the yield.
Exhibit 2.24: OSS and FSS Trend
60%
40%
20%
80%
100%
120%
140%
2011 2012 2013 2014 2015
Operational Self Sufficiency (OSS)Financial Self Sufficiency (FSS)
Exhibit 2.25: Total Revenue Ratio & Yield on Portfolio
20%
15%
5%
10%
25%
30%
35%
40%
2011 2012 2013 2014 2015
Yeild on Gross Portfolio (Nominal) Yeild on Gross Portfolio (Real)Total Revenue Ratio
Section 2 Financial Services for all
Pakistan Microfinance Review 2015
33
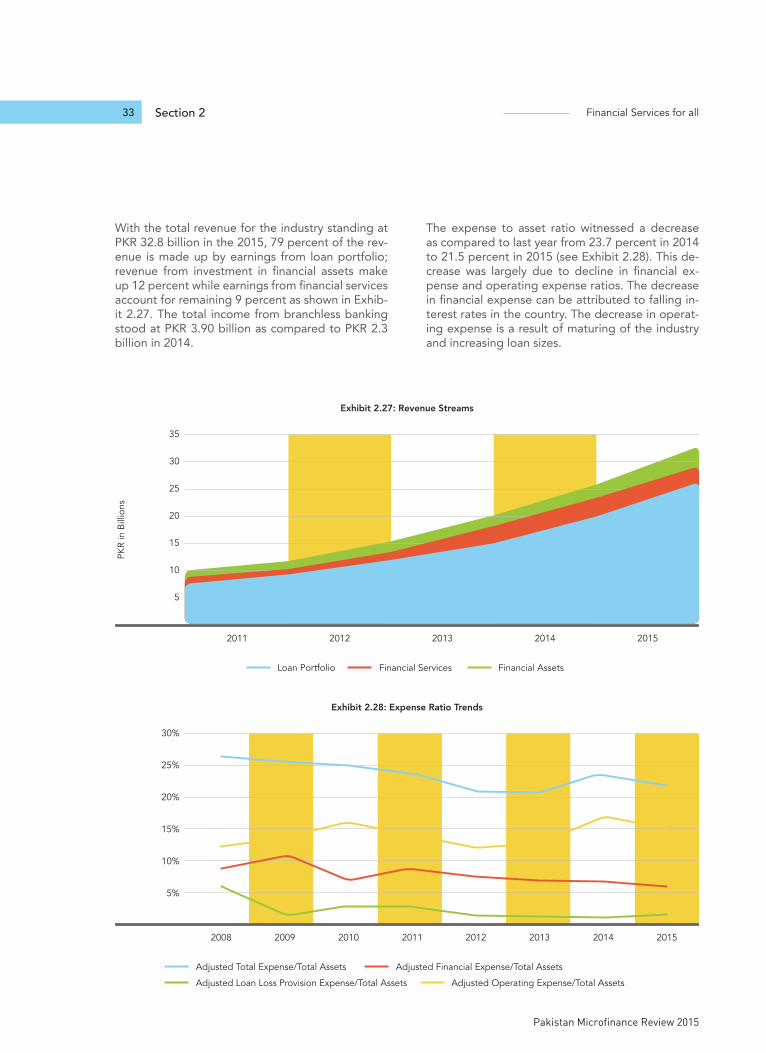
With the total revenue for the industry standing at PKR 32.8 billion in the 2015, 79 percent of the rev-enue is made up by earnings from loan portfolio; revenue from investment in financial assets make up 12 percent while earnings from financial services account for remaining 9 percent as shown in Exhib-it 2.27. The total income from branchless banking stood at PKR 3.90 billion as compared to PKR 2.3 billion in 2014.
The expense to asset ratio witnessed a decrease as compared to last year from 23.7 percent in 2014 to 21.5 percent in 2015 (see Exhibit 2.28). This de-crease was largely due to decline in financial ex-pense and operating expense ratios. The decrease in financial expense can be attributed to falling in-terest rates in the country. The decrease in operat-ing expense is a result of maturing of the industry and increasing loan sizes.
Exhibit 2.27: Revenue Streams
15
10
5
20
25
30
35
2011 2012 2013 2014 2015
Financial Services Financial AssetsLoan Portfolio
PKR
in B
illio
ns
Exhibit 2.28: Expense Ratio Trends
10%
5%
15%
20%
25%
30%
2008 20102009 2011 20132012 20152014
Adjusted Financial Expense/Total Assets
Adjusted Loan Loss Provision Expense/Total Assets Adjusted Operating Expense/Total Assets
Adjusted Total Expense/Total Assets
Annual Assessment of the Microfinance Industry
Financial Services for all 34Financial Performance Review
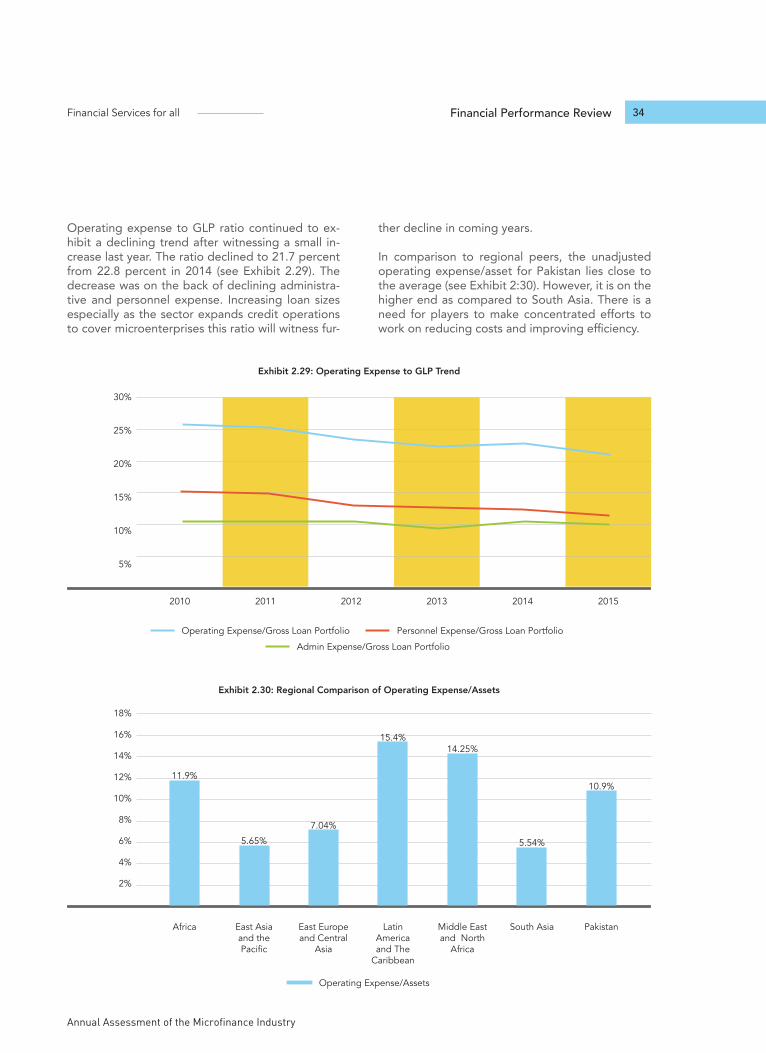
Operating expense to GLP ratio continued to ex-hibit a declining trend after witnessing a small in-crease last year. The ratio declined to 21.7 percent from 22.8 percent in 2014 (see Exhibit 2.29). The decrease was on the back of declining administra-tive and personnel expense. Increasing loan sizes especially as the sector expands credit operations to cover microenterprises this ratio will witness fur-
ther decline in coming years.
In comparison to regional peers, the unadjusted operating expense/asset for Pakistan lies close to the average (see Exhibit 2:30). However, it is on the higher end as compared to South Asia. There is a need for players to make concentrated efforts to work on reducing costs and improving efficiency.
Exhibit 2.29: Operating Expense to GLP Trend
20%
15%
5%
10%
25%
30%
2010 2011 2012 2013 2014 2015
Admin Expense/Gross Loan Portfolio
Operating Expense/Gross Loan Portfolio Personnel Expense/Gross Loan Portfolio
Exhibit 2.30: Regional Comparison of Operating Expense/Assets
8%
6%
2%
4%
10%
12%
14%
16%
18%
Africa East Asia and the Pacific
East Europe and Central
Asia
Latin America and The
Caribbean
Middle East and North
Africa
South Asia Pakistan
11.9%
5.65%
7.04%
15.4%14.25%
5.54%
10.9%
Operating Expense/Assets
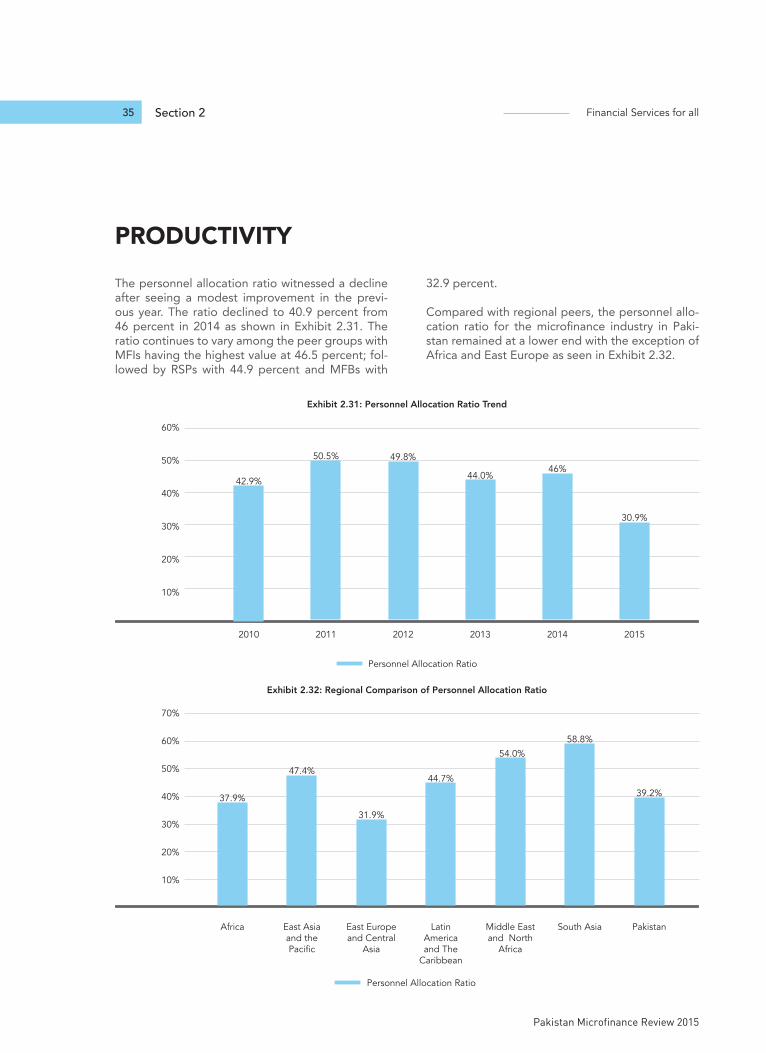
Section 2 Financial Services for all
Pakistan Microfinance Review 2015
35
The personnel allocation ratio witnessed a decline after seeing a modest improvement in the previ-ous year. The ratio declined to 40.9 percent from 46 percent in 2014 as shown in Exhibit 2.31. The ratio continues to vary among the peer groups with MFIs having the highest value at 46.5 percent; fol-lowed by RSPs with 44.9 percent and MFBs with
32.9 percent.
Compared with regional peers, the personnel allo-cation ratio for the microfinance industry in Paki-stan remained at a lower end with the exception of Africa and East Europe as seen in Exhibit 2.32.
PRODUCTIVITY
Exhibit 2.31: Personnel Allocation Ratio Trend
20%
10%
30%
40%
50% 50.5%
2011
42.9%
2010
49.8%
2012
44.0%
2013
46%
2014
30.9%
2015
Personnel Allocation Ratio
60%
Exhibit 2.32: Regional Comparison of Personnel Allocation Ratio
20%
10%
30%
40%
50%
60%
70%
Africa East Asia and the Pacific
East Europe and Central
Asia
Latin America and The
Caribbean
Middle East and North
Africa
South Asia Pakistan
37.9%
47.4%
31.9%
44.7%
54.0%
58.8%
39.2%
Personnel Allocation Ratio
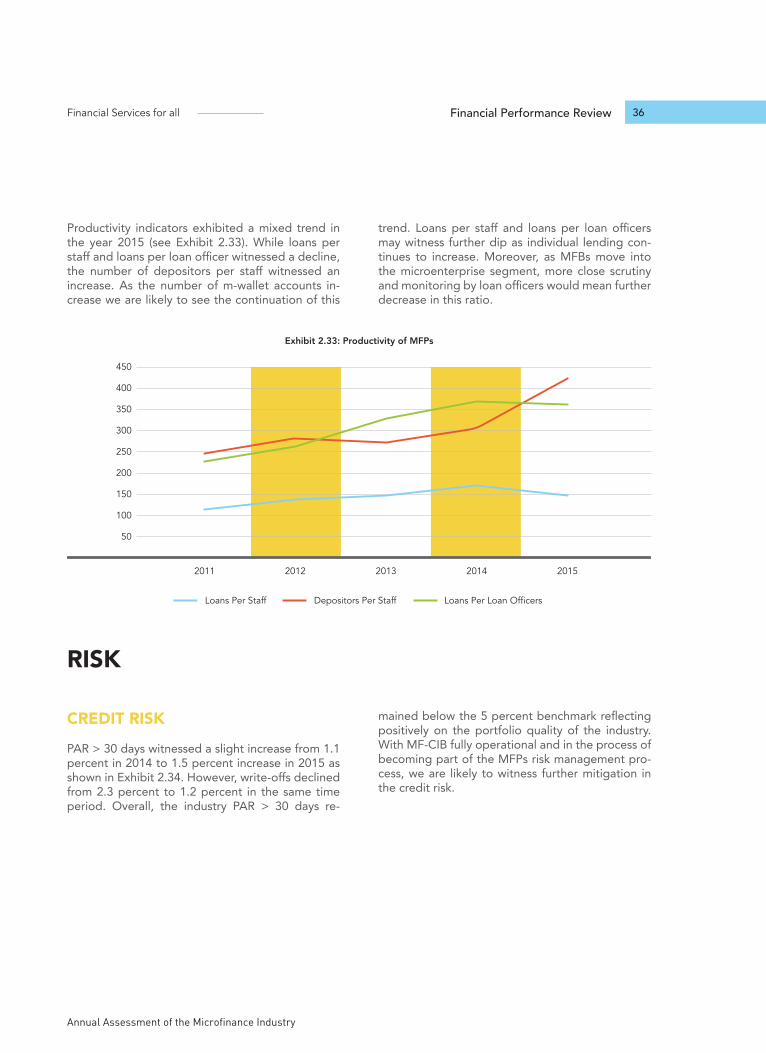
Annual Assessment of the Microfinance Industry
Financial Services for all 36Financial Performance Review
CREDIT RISK
PAR > 30 days witnessed a slight increase from 1.1 percent in 2014 to 1.5 percent increase in 2015 as shown in Exhibit 2.34. However, write-offs declined from 2.3 percent to 1.2 percent in the same time period. Overall, the industry PAR > 30 days re-
mained below the 5 percent benchmark reflecting positively on the portfolio quality of the industry. With MF-CIB fully operational and in the process of becoming part of the MFPs risk management pro-cess, we are likely to witness further mitigation in the credit risk.
Productivity indicators exhibited a mixed trend in the year 2015 (see Exhibit 2.33). While loans per staff and loans per loan officer witnessed a decline, the number of depositors per staff witnessed an increase. As the number of m-wallet accounts in-crease we are likely to see the continuation of this
trend. Loans per staff and loans per loan officers may witness further dip as individual lending con-tinues to increase. Moreover, as MFBs move into the microenterprise segment, more close scrutiny and monitoring by loan officers would mean further decrease in this ratio.
RISK
Exhibit 2.33: Productivity of MFPs
250
200
100
50
150
300
350
400
450
2011 2012 2013 2014 2015
Depositors Per Staff Loans Per Loan OfficersLoans Per Staff
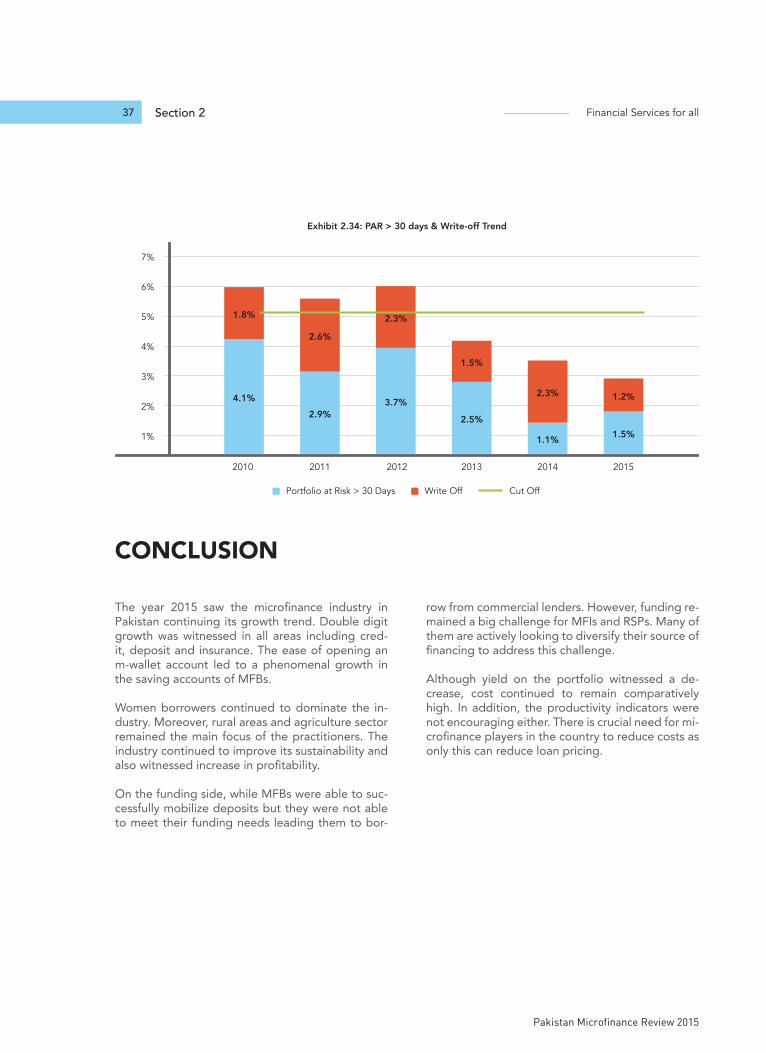
Section 2 Financial Services for all
Pakistan Microfinance Review 2015
37
Exhibit 2.34: PAR > 30 days & Write-off Trend
1%
2%
3%
4%
5%
6%
2010
4.1%
1.8%
2011
2.9%
2.6%
2012
3.7%
2.3%
2014
1.1%
2.3%
2015
1.5%
1.2%
2013
2.5%
1.5%
Cut OffPortfolio at Risk > 30 Days Write Off
7%
The year 2015 saw the microfinance industry in Pakistan continuing its growth trend. Double digit growth was witnessed in all areas including cred-it, deposit and insurance. The ease of opening an m-wallet account led to a phenomenal growth in the saving accounts of MFBs.
Women borrowers continued to dominate the in-dustry. Moreover, rural areas and agriculture sector remained the main focus of the practitioners. The industry continued to improve its sustainability and also witnessed increase in profitability.
On the funding side, while MFBs were able to suc-cessfully mobilize deposits but they were not able to meet their funding needs leading them to bor-
row from commercial lenders. However, funding re-mained a big challenge for MFIs and RSPs. Many of them are actively looking to diversify their source of financing to address this challenge.
Although yield on the portfolio witnessed a de-crease, cost continued to remain comparatively high. In addition, the productivity indicators were not encouraging either. There is crucial need for mi-crofinance players in the country to reduce costs as only this can reduce loan pricing.
CONCLUSION
PAK
ISTA
N M
ICR
OFI
NA
NC
E R
EV
IEW
201
5

Annual Assessment of the Microfinance Industry
Financial Services for all 38Financial Performance Review
PAK
ISTA
N M
ICR
OFI
NA
NC
E R
EV
IEW
201
5

Section 2 Financial Services for all
Pakistan Microfinance Review 2015
39
Annual Assessment of the Microfinance Industry
Financial Services for all 40Social Performance
SECTION 3
SOCIAL PERFORMANCE
Section 3 Financial Services for all
Pakistan Microfinance Review 2015
41
SOCIAL PERFORMANCE
The microfinance sector in Pakistan has shown an increasing focus on balancing social performance and financial sustainability among microfinance providers (MFPs). There is an understanding of mi-crofinance as a double-bottom line industry, where sustainability is not an end in itself, but rather a means to achieving social goals. These goals can differ; while some MFPs may have a vision of pov-erty alleviation or women and rural community em-powerment, others focus on increasing access to formal finance for the poor and low-income strata of the population. In all cases, it has become im-portant for MFPs to track their progress towards
achieving their respective social goals, using social performance indicators in the same way that finan-cial data is used to manage the financial bottom line.
The following section will outline key social perfor-mance indicators as monitored across the Pakistan microfinance landscape. We will attempt to analyze industry trends across various SP indicators, includ-ing social goals, poverty target, governance and human resource, diversity in financial and non-fi-nancial service provision, client protection, pricing norms and environment.
INTRODUCTION
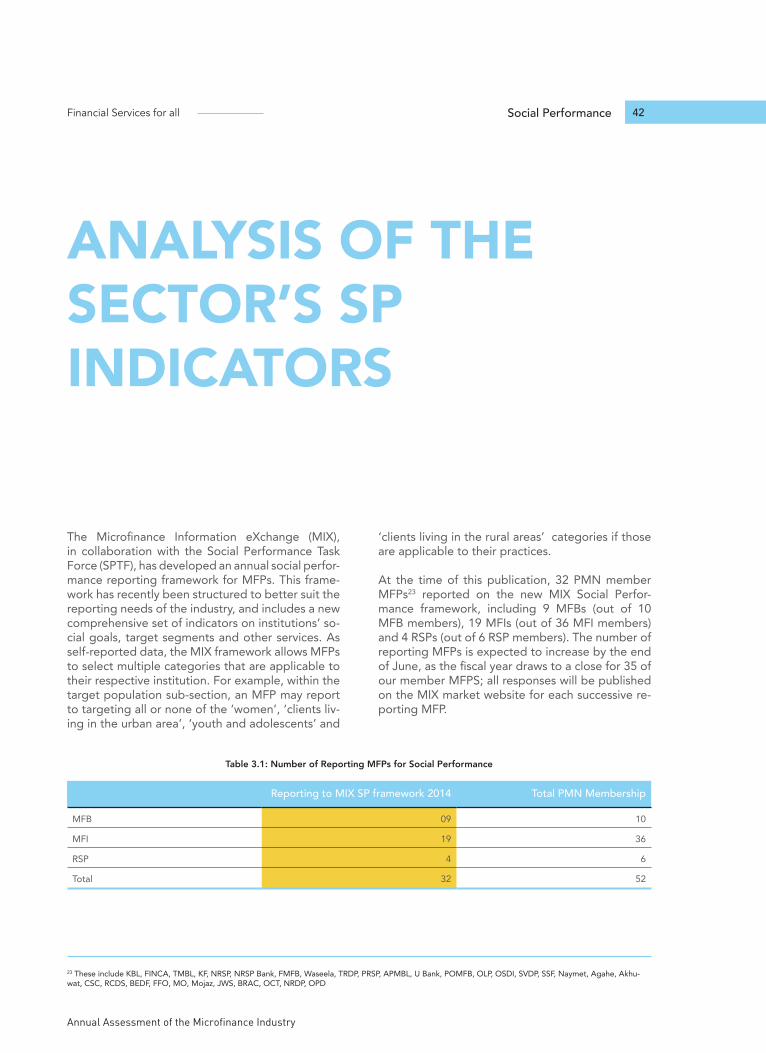
Annual Assessment of the Microfinance Industry
Financial Services for all 42Social Performance
SOCIAL PERFORMANCE
ANALYSIS OF THESECTOR’S SP INDICATORS
The Microfinance Information eXchange (MIX), in collaboration with the Social Performance Task Force (SPTF), has developed an annual social perfor-mance reporting framework for MFPs. This frame-work has recently been structured to better suit the reporting needs of the industry, and includes a new comprehensive set of indicators on institutions’ so-cial goals, target segments and other services. As self-reported data, the MIX framework allows MFPs to select multiple categories that are applicable to their respective institution. For example, within the target population sub-section, an MFP may report to targeting all or none of the ‘women’, ‘clients liv-ing in the urban area’, ‘youth and adolescents’ and
‘clients living in the rural areas’ categories if those are applicable to their practices.
At the time of this publication, 32 PMN member MFPs23 reported on the new MIX Social Perfor-mance framework, including 9 MFBs (out of 10 MFB members), 19 MFIs (out of 36 MFI members) and 4 RSPs (out of 6 RSP members). The number of reporting MFPs is expected to increase by the end of June, as the fiscal year draws to a close for 35 of our member MFPS; all responses will be published on the MIX market website for each successive re-porting MFP.
23 These include KBL, FINCA, TMBL, KF, NRSP, NRSP Bank, FMFB, Waseela, TRDP, PRSP, APMBL, U Bank, POMFB, OLP, OSDI, SVDP, SSF, Naymet, Agahe, Akhu-wat, CSC, RCDS, BEDF, FFO, MO, Mojaz, JWS, BRAC, OCT, NRDP, OPD
Reporting to MIX SP framework 2014 Total PMN Membership
MFB 09 10
MFI 19 36
RSP 4 6
Total 32 52
Table 3.1: Number of Reporting MFPs for Social Performance
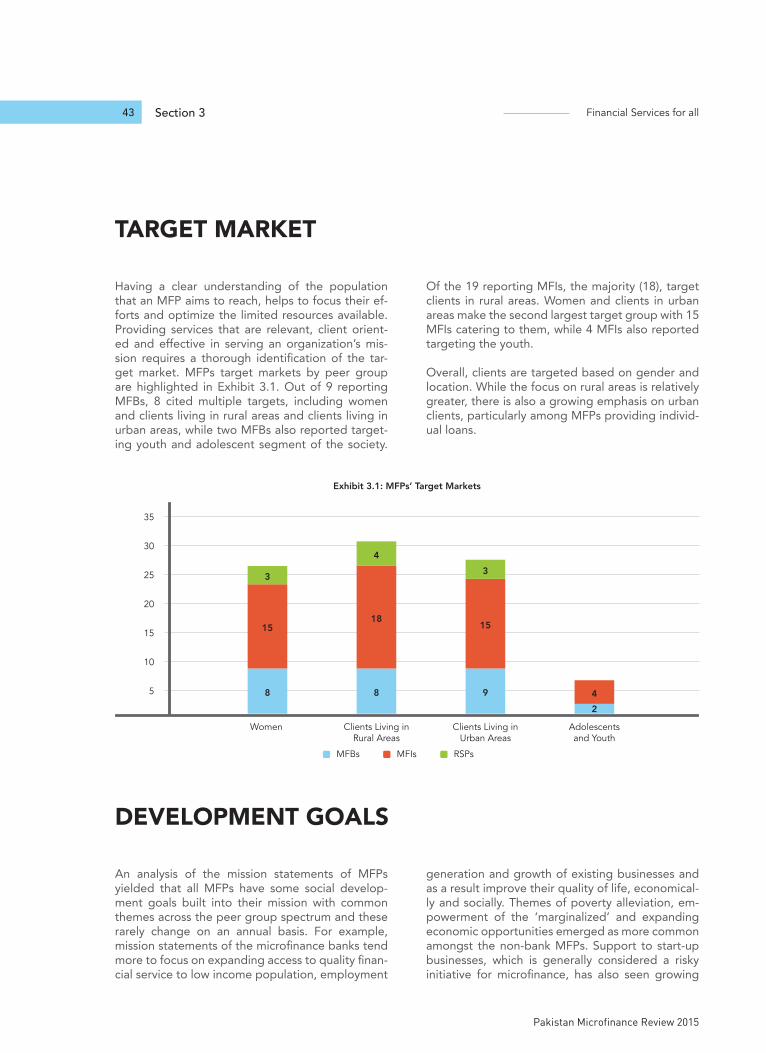
Section 3 Financial Services for all
Pakistan Microfinance Review 2015
43
Having a clear understanding of the population that an MFP aims to reach, helps to focus their ef-forts and optimize the limited resources available. Providing services that are relevant, client orient-ed and effective in serving an organization’s mis-sion requires a thorough identification of the tar-get market. MFPs target markets by peer group are highlighted in Exhibit 3.1. Out of 9 reporting MFBs, 8 cited multiple targets, including women and clients living in rural areas and clients living in urban areas, while two MFBs also reported target-ing youth and adolescent segment of the society.
Of the 19 reporting MFIs, the majority (18), target clients in rural areas. Women and clients in urban areas make the second largest target group with 15 MFIs catering to them, while 4 MFIs also reported targeting the youth.
Overall, clients are targeted based on gender and location. While the focus on rural areas is relatively greater, there is also a growing emphasis on urban clients, particularly among MFPs providing individ-ual loans.
An analysis of the mission statements of MFPs yielded that all MFPs have some social develop-ment goals built into their mission with common themes across the peer group spectrum and these rarely change on an annual basis. For example, mission statements of the microfinance banks tend more to focus on expanding access to quality finan-cial service to low income population, employment
generation and growth of existing businesses and as a result improve their quality of life, economical-ly and socially. Themes of poverty alleviation, em-powerment of the ‘marginalized’ and expanding economic opportunities emerged as more common amongst the non-bank MFPs. Support to start-up businesses, which is generally considered a risky initiative for microfinance, has also seen growing
TARGET MARKET
DEVELOPMENT GOALS
Exhibit 3.1: MFPs’ Target Markets
5
10
15
20
25
30
Women Clients Living in Rural Areas
Clients Living in Urban Areas
Adolescents and Youth
8
15
3
8
18
4
9
15
3
24
MFBs RSPsMFIs
35
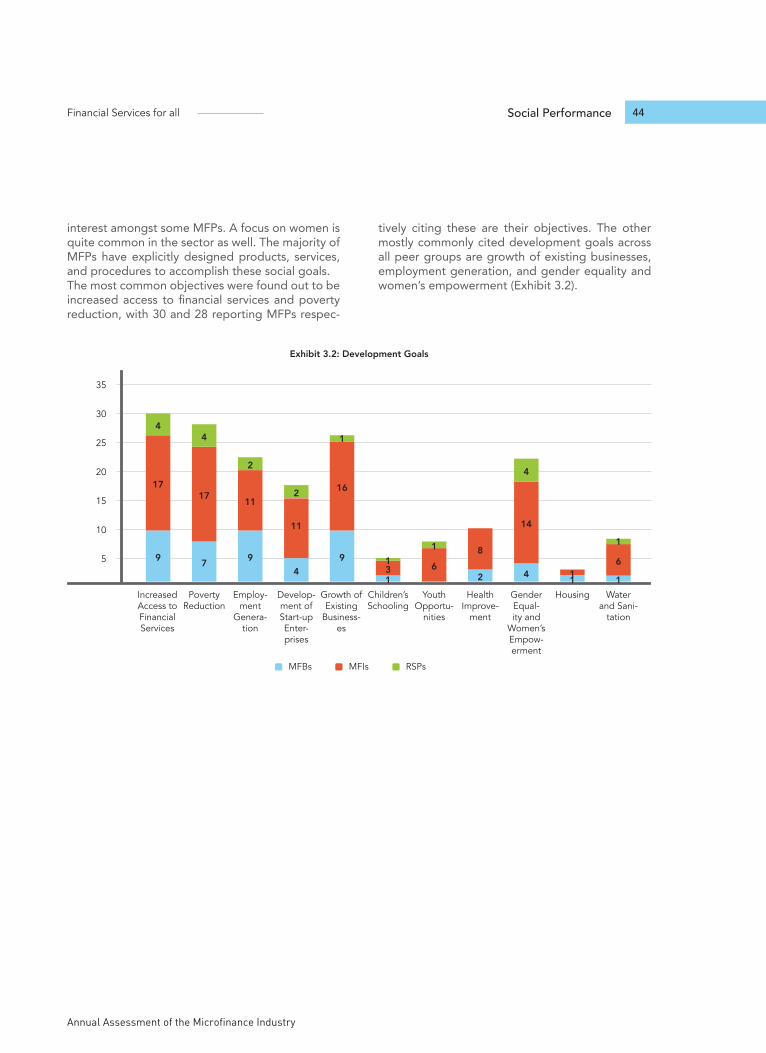
Annual Assessment of the Microfinance Industry
Financial Services for all 44Social Performance
interest amongst some MFPs. A focus on women is quite common in the sector as well. The majority of MFPs have explicitly designed products, services, and procedures to accomplish these social goals.The most common objectives were found out to be increased access to financial services and poverty reduction, with 30 and 28 reporting MFPs respec-
tively citing these are their objectives. The other mostly commonly cited development goals across all peer groups are growth of existing businesses, employment generation, and gender equality and women’s empowerment (Exhibit 3.2).
Exhibit 3.2: Development Goals
5
10
15
20
25
30
Increased Access to Financial Services
Growth of Existing
Business-es
Poverty Reduction
Children’s Schooling
Gender Equal-ity and
Women’s Empow-erment
Employ-ment
Genera-tion
Youth Opportu-
nities
HousingDevelop-ment of Start-up Enter-prises
Health Improve-
ment
Water and Sani-
tation
9 9
17 16
41
7
1 4
17
3
14
4
1
4
9
1
11
61
2
2
1
4 2 1
111
86
MFBs RSPsMFIs
35
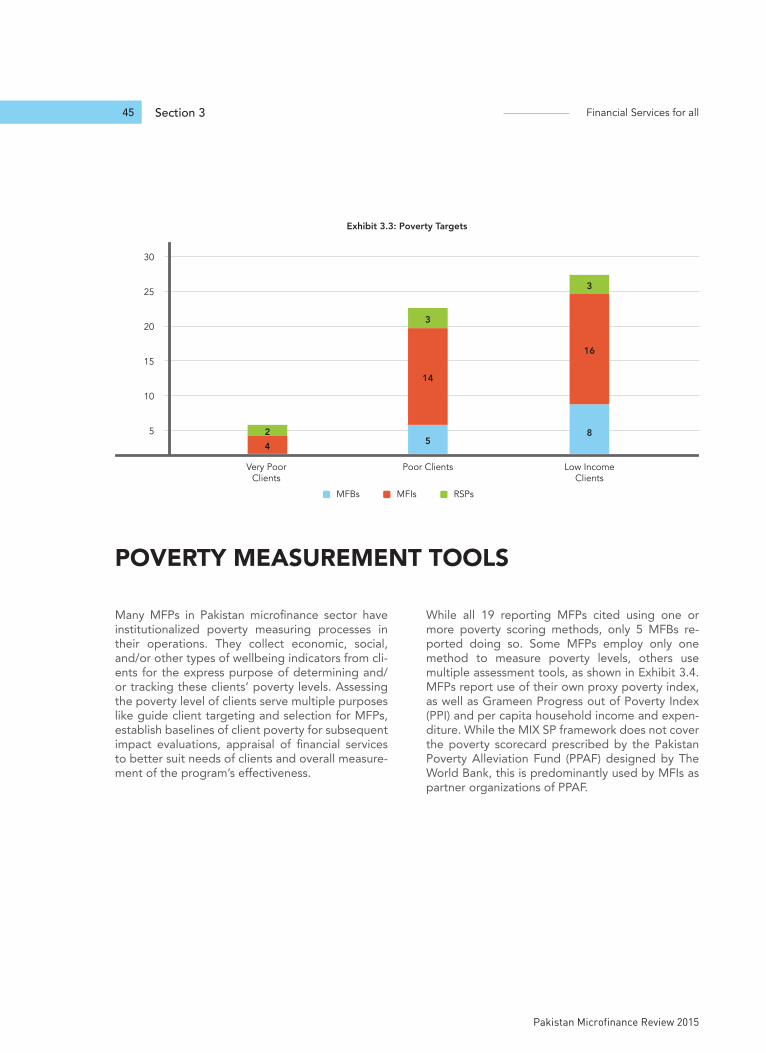
Section 3 Financial Services for all
Pakistan Microfinance Review 2015
45
Exhibit 3.3: Poverty Targets
5
10
15
20
25
Very Poor Clients
42
Poor Clients
5
14
3
Low Income Clients
8
16
3
MFBs RSPsMFIs
30
Many MFPs in Pakistan microfinance sector have institutionalized poverty measuring processes in their operations. They collect economic, social, and/or other types of wellbeing indicators from cli-ents for the express purpose of determining and/or tracking these clients’ poverty levels. Assessing the poverty level of clients serve multiple purposes like guide client targeting and selection for MFPs, establish baselines of client poverty for subsequent impact evaluations, appraisal of financial services to better suit needs of clients and overall measure-ment of the program’s effectiveness.
While all 19 reporting MFPs cited using one or more poverty scoring methods, only 5 MFBs re-ported doing so. Some MFPs employ only one method to measure poverty levels, others use multiple assessment tools, as shown in Exhibit 3.4. MFPs report use of their own proxy poverty index, as well as Grameen Progress out of Poverty Index (PPI) and per capita household income and expen-diture. While the MIX SP framework does not cover the poverty scorecard prescribed by the Pakistan Poverty Alleviation Fund (PPAF) designed by The World Bank, this is predominantly used by MFIs as partner organizations of PPAF.
POVERTY MEASUREMENT TOOLS
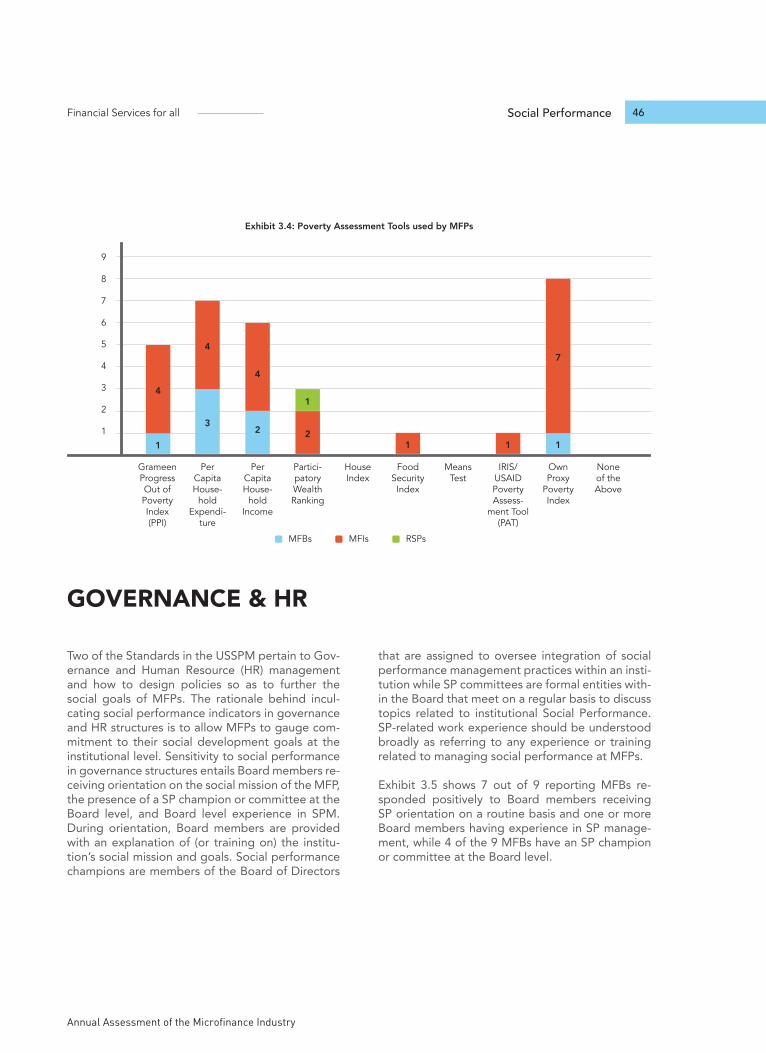
Annual Assessment of the Microfinance Industry
Financial Services for all 46Social Performance
Two of the Standards in the USSPM pertain to Gov-ernance and Human Resource (HR) management and how to design policies so as to further the social goals of MFPs. The rationale behind incul-cating social performance indicators in governance and HR structures is to allow MFPs to gauge com-mitment to their social development goals at the institutional level. Sensitivity to social performance in governance structures entails Board members re-ceiving orientation on the social mission of the MFP, the presence of a SP champion or committee at the Board level, and Board level experience in SPM. During orientation, Board members are provided with an explanation of (or training on) the institu-tion’s social mission and goals. Social performance champions are members of the Board of Directors
that are assigned to oversee integration of social performance management practices within an insti-tution while SP committees are formal entities with-in the Board that meet on a regular basis to discuss topics related to institutional Social Performance. SP-related work experience should be understood broadly as referring to any experience or training related to managing social performance at MFPs.
Exhibit 3.5 shows 7 out of 9 reporting MFBs re-sponded positively to Board members receiving SP orientation on a routine basis and one or more Board members having experience in SP manage-ment, while 4 of the 9 MFBs have an SP champion or committee at the Board level.
GOVERNANCE & HR
Exhibit 3.4: Poverty Assessment Tools used by MFPs
1
2
3
4
5
6
7
8
Grameen Progress Out of Poverty Index (PPI)
1
4
House Index
Per Capita House-
hold Expendi-
ture
3
4
Food Security Index
1
Own Proxy
Poverty Index
1
7
None of the Above
Per Capita House-
hold Income
2
4
Means Test
Partici-patory Wealth Ranking
1
2
IRIS/USAID Poverty Assess-
ment Tool (PAT)
1
MFBs RSPsMFIs
9
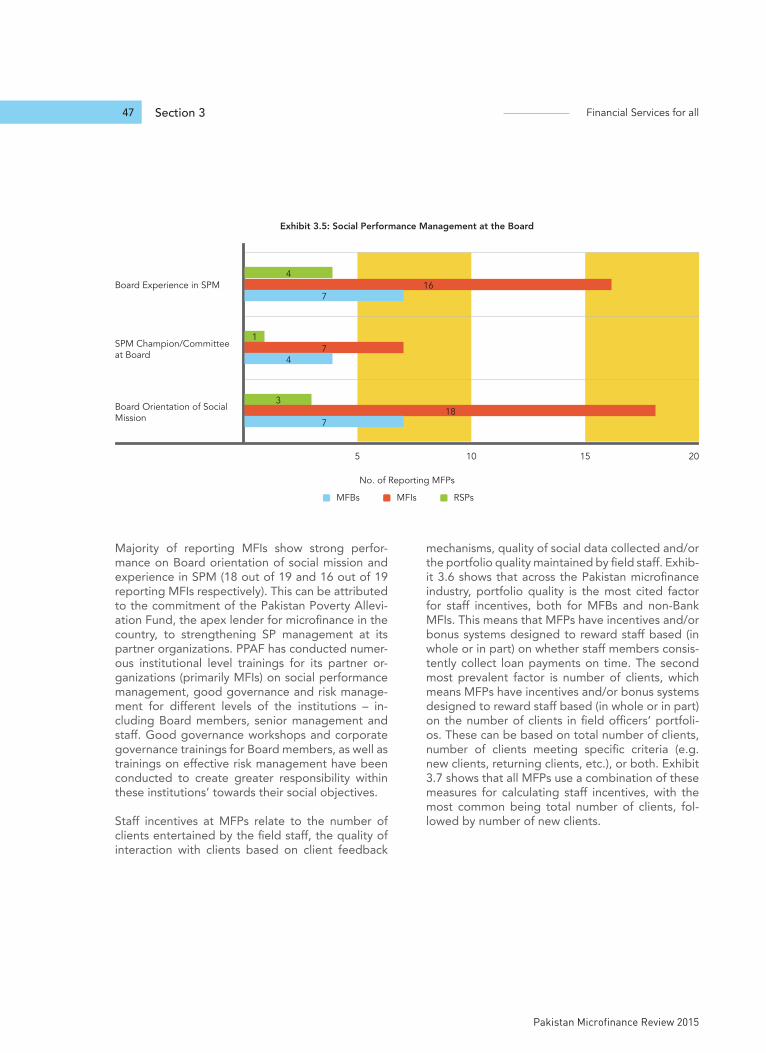
Section 3 Financial Services for all
Pakistan Microfinance Review 2015
47
Majority of reporting MFIs show strong perfor-mance on Board orientation of social mission and experience in SPM (18 out of 19 and 16 out of 19 reporting MFIs respectively). This can be attributed to the commitment of the Pakistan Poverty Allevi-ation Fund, the apex lender for microfinance in the country, to strengthening SP management at its partner organizations. PPAF has conducted numer-ous institutional level trainings for its partner or-ganizations (primarily MFIs) on social performance management, good governance and risk manage-ment for different levels of the institutions – in-cluding Board members, senior management and staff. Good governance workshops and corporate governance trainings for Board members, as well as trainings on effective risk management have been conducted to create greater responsibility within these institutions’ towards their social objectives.
Staff incentives at MFPs relate to the number of clients entertained by the field staff, the quality of interaction with clients based on client feedback
mechanisms, quality of social data collected and/or the portfolio quality maintained by field staff. Exhib-it 3.6 shows that across the Pakistan microfinance industry, portfolio quality is the most cited factor for staff incentives, both for MFBs and non-Bank MFIs. This means that MFPs have incentives and/or bonus systems designed to reward staff based (in whole or in part) on whether staff members consis-tently collect loan payments on time. The second most prevalent factor is number of clients, which means MFPs have incentives and/or bonus systems designed to reward staff based (in whole or in part) on the number of clients in field officers’ portfoli-os. These can be based on total number of clients, number of clients meeting specific criteria (e.g. new clients, returning clients, etc.), or both. Exhibit 3.7 shows that all MFPs use a combination of these measures for calculating staff incentives, with the most common being total number of clients, fol-lowed by number of new clients.
Exhibit 3.5: Social Performance Management at the Board
SPM Champion/Committee at Board
Board Orientation of Social Mission
Board Experience in SPM
5 10 15 20
416
7
74
318
7
1
MFBs RSPsMFIs
No. of Reporting MFPs
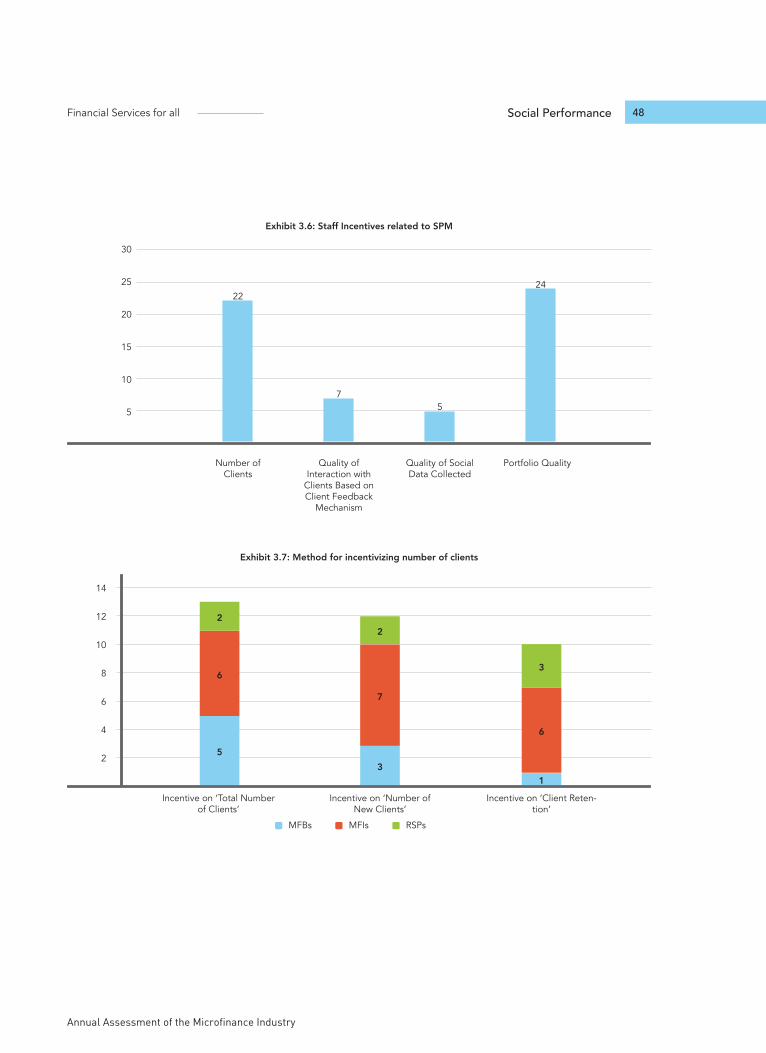
Annual Assessment of the Microfinance Industry
Financial Services for all 48Social Performance
Exhibit 3.6: Staff Incentives related to SPM
10
5
15
20
25
Number of Clients
Quality of Interaction with
Clients Based on Client Feedback
Mechanism
Quality of Social Data Collected
Portfolio Quality
75
24
30
22
Exhibit 3.7: Method for incentivizing number of clients
2
4
6
8
10
12
Incentive on ‘Total Number of Clients’
Incentive on ‘Number of New Clients’
Incentive on ‘Client Reten-tion’
6
2
53
7
2
1
6
3
MFBs RSPsMFIs
14
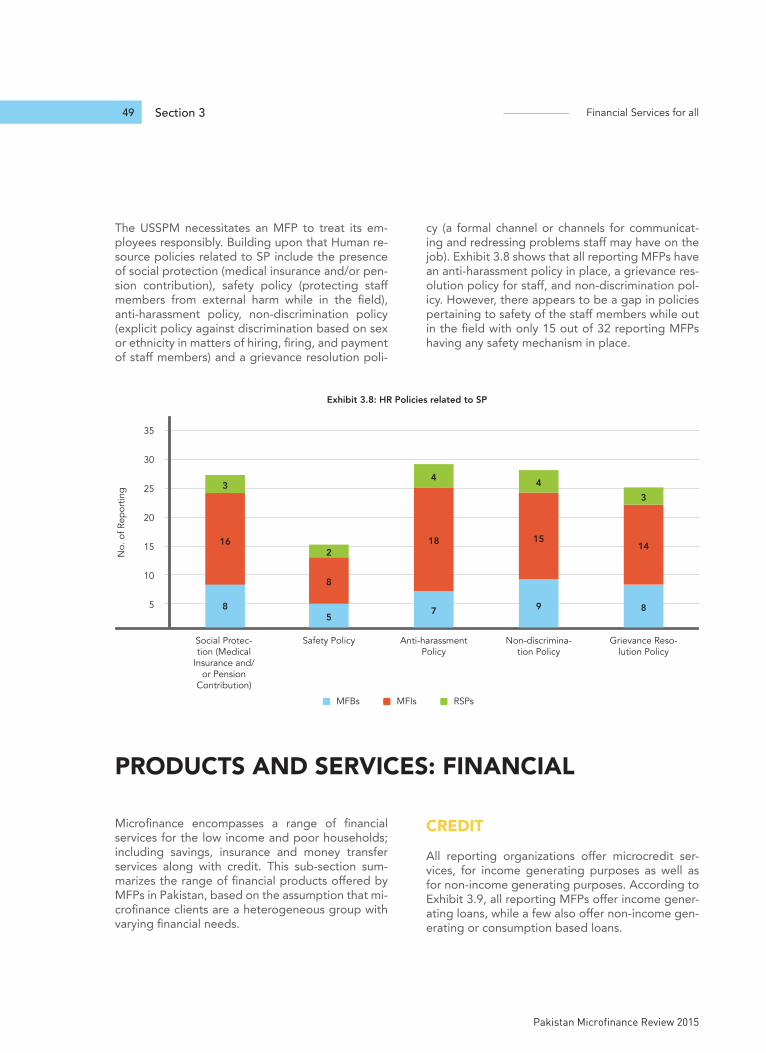
Section 3 Financial Services for all
Pakistan Microfinance Review 2015
49
The USSPM necessitates an MFP to treat its em-ployees responsibly. Building upon that Human re-source policies related to SP include the presence of social protection (medical insurance and/or pen-sion contribution), safety policy (protecting staff members from external harm while in the field), anti-harassment policy, non-discrimination policy (explicit policy against discrimination based on sex or ethnicity in matters of hiring, firing, and payment of staff members) and a grievance resolution poli-
cy (a formal channel or channels for communicat-ing and redressing problems staff may have on the job). Exhibit 3.8 shows that all reporting MFPs have an anti-harassment policy in place, a grievance res-olution policy for staff, and non-discrimination pol-icy. However, there appears to be a gap in policies pertaining to safety of the staff members while out in the field with only 15 out of 32 reporting MFPs having any safety mechanism in place.
Exhibit 3.8: HR Policies related to SP
5
10
15
20
25
30
Social Protec-tion (Medical
Insurance and/or Pension
Contribution)
8
16
3
Safety Policy
5
8
2
Anti-harassment Policy
7
18
4
Non-discrimina-tion Policy
9
15
4
Grievance Reso-lution Policy
8
14
3
MFBs RSPsMFIs
35
No.
of R
epor
ting
Microfinance encompasses a range of financial services for the low income and poor households; including savings, insurance and money transfer services along with credit. This sub-section sum-marizes the range of financial products offered by MFPs in Pakistan, based on the assumption that mi-crofinance clients are a heterogeneous group with varying financial needs.
CREDIT
All reporting organizations offer microcredit ser-vices, for income generating purposes as well as for non-income generating purposes. According to Exhibit 3.9, all reporting MFPs offer income gener-ating loans, while a few also offer non-income gen-erating or consumption based loans.
PRODUCTS AND SERVICES: FINANCIAL
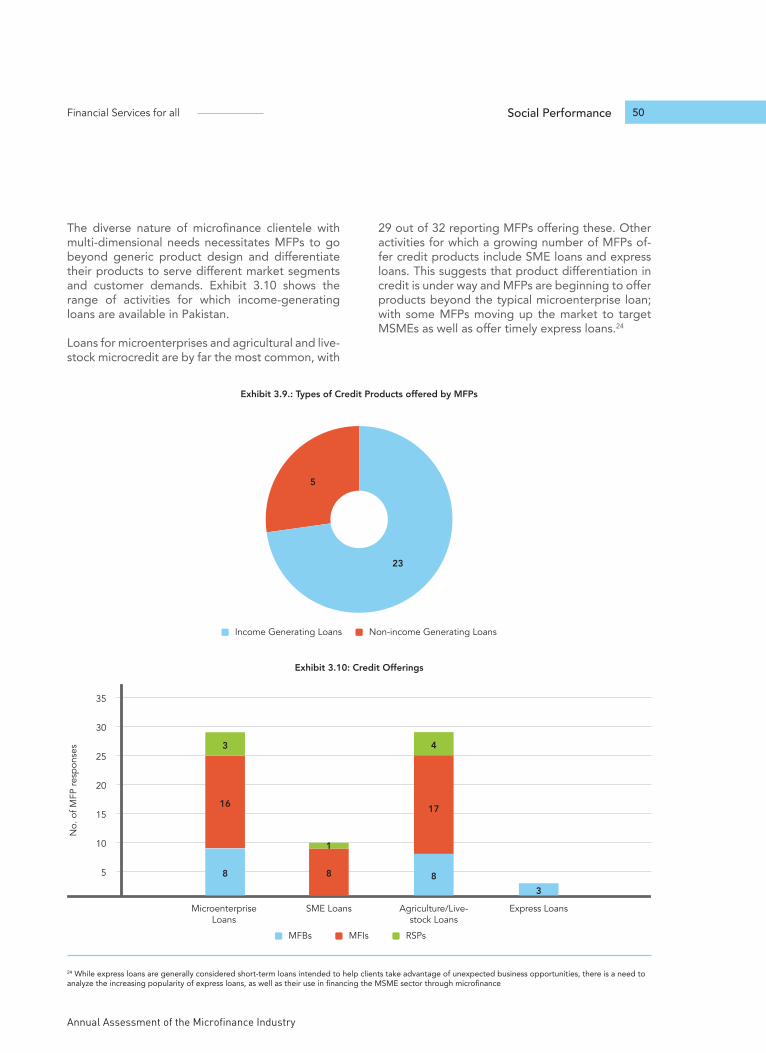
Annual Assessment of the Microfinance Industry
Financial Services for all 50Social Performance
The diverse nature of microfinance clientele with multi-dimensional needs necessitates MFPs to go beyond generic product design and differentiate their products to serve different market segments and customer demands. Exhibit 3.10 shows the range of activities for which income-generating loans are available in Pakistan.
Loans for microenterprises and agricultural and live-stock microcredit are by far the most common, with
29 out of 32 reporting MFPs offering these. Other activities for which a growing number of MFPs of-fer credit products include SME loans and express loans. This suggests that product differentiation in credit is under way and MFPs are beginning to offer products beyond the typical microenterprise loan; with some MFPs moving up the market to target MSMEs as well as offer timely express loans.24
23
5
Income Generating Loans Non-income Generating Loans
Exhibit 3.9.: Types of Credit Products offered by MFPs
24 While express loans are generally considered short-term loans intended to help clients take advantage of unexpected business opportunities, there is a need to analyze the increasing popularity of express loans, as well as their use in financing the MSME sector through microfinance
Exhibit 3.10: Credit Offerings
5
10
15
20
25
30
Microenterprise Loans
8
16
3
SME Loans
8
1
Agriculture/Live-stock Loans
8
17
4
Express Loans
3
MFBs RSPsMFIs
35
No.
of M
FP re
spon
ses
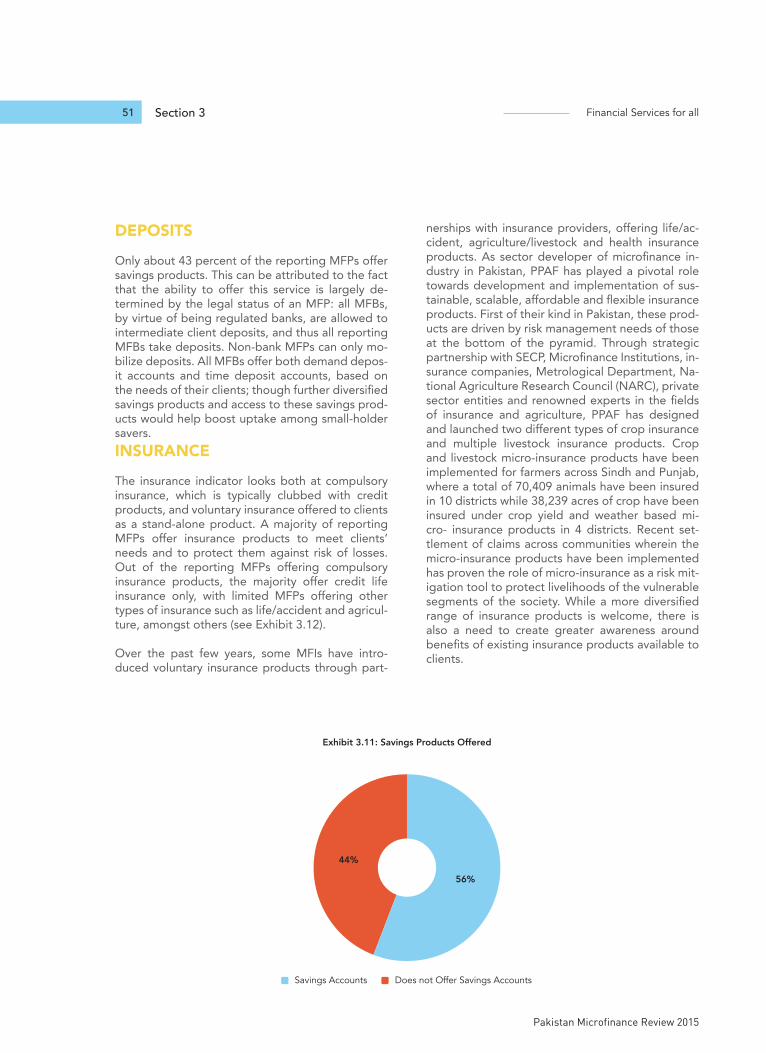
Section 3 Financial Services for all
Pakistan Microfinance Review 2015
51
DEPOSITS
Only about 43 percent of the reporting MFPs offer savings products. This can be attributed to the fact that the ability to offer this service is largely de-termined by the legal status of an MFP: all MFBs, by virtue of being regulated banks, are allowed to intermediate client deposits, and thus all reporting MFBs take deposits. Non-bank MFPs can only mo-bilize deposits. All MFBs offer both demand depos-it accounts and time deposit accounts, based on the needs of their clients; though further diversified savings products and access to these savings prod-ucts would help boost uptake among small-holder savers.INSURANCE
The insurance indicator looks both at compulsory insurance, which is typically clubbed with credit products, and voluntary insurance offered to clients as a stand-alone product. A majority of reporting MFPs offer insurance products to meet clients’ needs and to protect them against risk of losses. Out of the reporting MFPs offering compulsory insurance products, the majority offer credit life insurance only, with limited MFPs offering other types of insurance such as life/accident and agricul-ture, amongst others (see Exhibit 3.12).
Over the past few years, some MFIs have intro-duced voluntary insurance products through part-
nerships with insurance providers, offering life/ac-cident, agriculture/livestock and health insurance products. As sector developer of microfinance in-dustry in Pakistan, PPAF has played a pivotal role towards development and implementation of sus-tainable, scalable, affordable and flexible insurance products. First of their kind in Pakistan, these prod-ucts are driven by risk management needs of those at the bottom of the pyramid. Through strategic partnership with SECP, Microfinance Institutions, in-surance companies, Metrological Department, Na-tional Agriculture Research Council (NARC), private sector entities and renowned experts in the fields of insurance and agriculture, PPAF has designed and launched two different types of crop insurance and multiple livestock insurance products. Crop and livestock micro-insurance products have been implemented for farmers across Sindh and Punjab, where a total of 70,409 animals have been insured in 10 districts while 38,239 acres of crop have been insured under crop yield and weather based mi-cro- insurance products in 4 districts. Recent set-tlement of claims across communities wherein the micro-insurance products have been implemented has proven the role of micro-insurance as a risk mit-igation tool to protect livelihoods of the vulnerable segments of the society. While a more diversified range of insurance products is welcome, there is also a need to create greater awareness around benefits of existing insurance products available to clients.
56%
44%
Savings Accounts Does not Offer Savings Accounts
Exhibit 3.11: Savings Products Offered
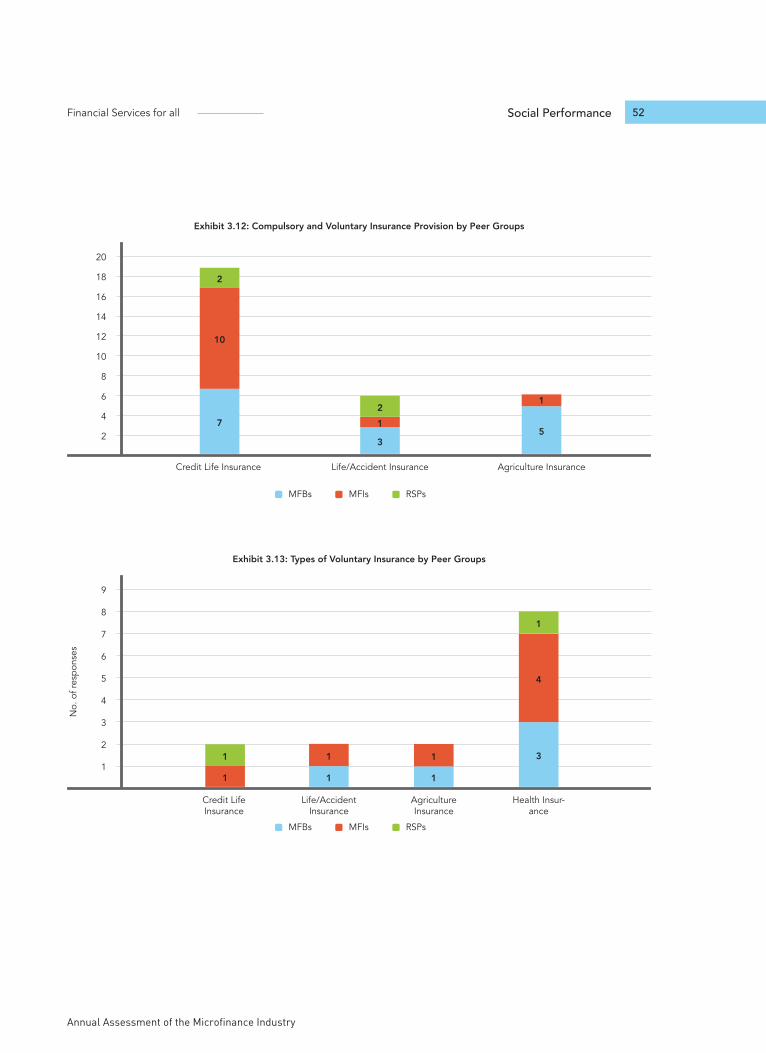
Annual Assessment of the Microfinance Industry
Financial Services for all 52Social Performance
Exhibit 3.12: Compulsory and Voluntary Insurance Provision by Peer Groups
2
4
6
8
12
10
16
14
Credit Life Insurance Life/Accident Insurance Agriculture Insurance
10
2
7
3
12
5
1
MFBs RSPsMFIs
20
18
Exhibit 3.13: Types of Voluntary Insurance by Peer Groups
1
2
3
4
5
8
7
6
Credit Life Insurance
1
1
Life/Accident Insurance
1
1
Agriculture Insurance
1
1
Health Insur-ance
3
4
1
MFBs RSPsMFIs
9
No.
of r
espo
nses
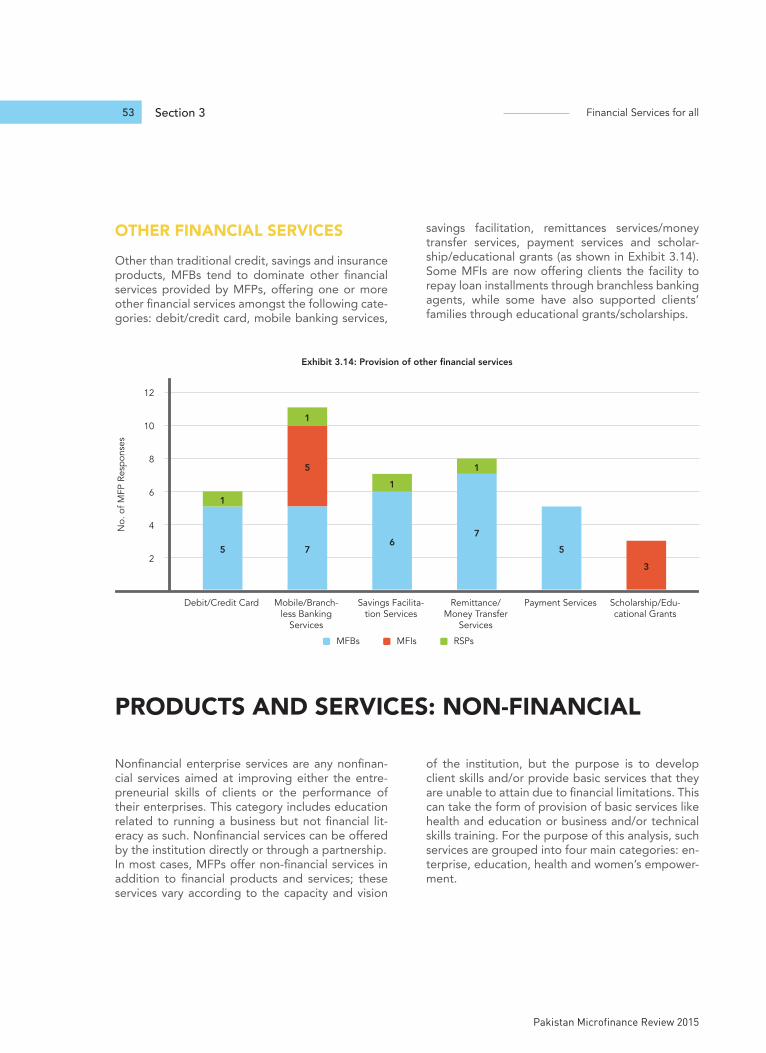
Section 3 Financial Services for all
Pakistan Microfinance Review 2015
53
OTHER FINANCIAL SERVICES
Other than traditional credit, savings and insurance products, MFBs tend to dominate other financial services provided by MFPs, offering one or more other financial services amongst the following cate-gories: debit/credit card, mobile banking services,
savings facilitation, remittances services/money transfer services, payment services and scholar-ship/educational grants (as shown in Exhibit 3.14). Some MFIs are now offering clients the facility to repay loan installments through branchless banking agents, while some have also supported clients’ families through educational grants/scholarships.
Exhibit 3.14: Provision of other financial services
2
4
6
8
10
Debit/Credit Card
1
5
Mobile/Branch-less Banking
Services
5
1
7
Savings Facilita-tion Services
1
6
Remittance/Money Transfer
Services
1
7
Payment Services
5
Scholarship/Edu-cational Grants
3
MFBs RSPsMFIs
12
No.
of M
FP R
espo
nses
Nonfinancial enterprise services are any nonfinan-cial services aimed at improving either the entre-preneurial skills of clients or the performance of their enterprises. This category includes education related to running a business but not financial lit-eracy as such. Nonfinancial services can be offered by the institution directly or through a partnership.In most cases, MFPs offer non-financial services in addition to financial products and services; these services vary according to the capacity and vision
of the institution, but the purpose is to develop client skills and/or provide basic services that they are unable to attain due to financial limitations. This can take the form of provision of basic services like health and education or business and/or technical skills training. For the purpose of this analysis, such services are grouped into four main categories: en-terprise, education, health and women’s empower-ment.
PRODUCTS AND SERVICES: NON-FINANCIAL
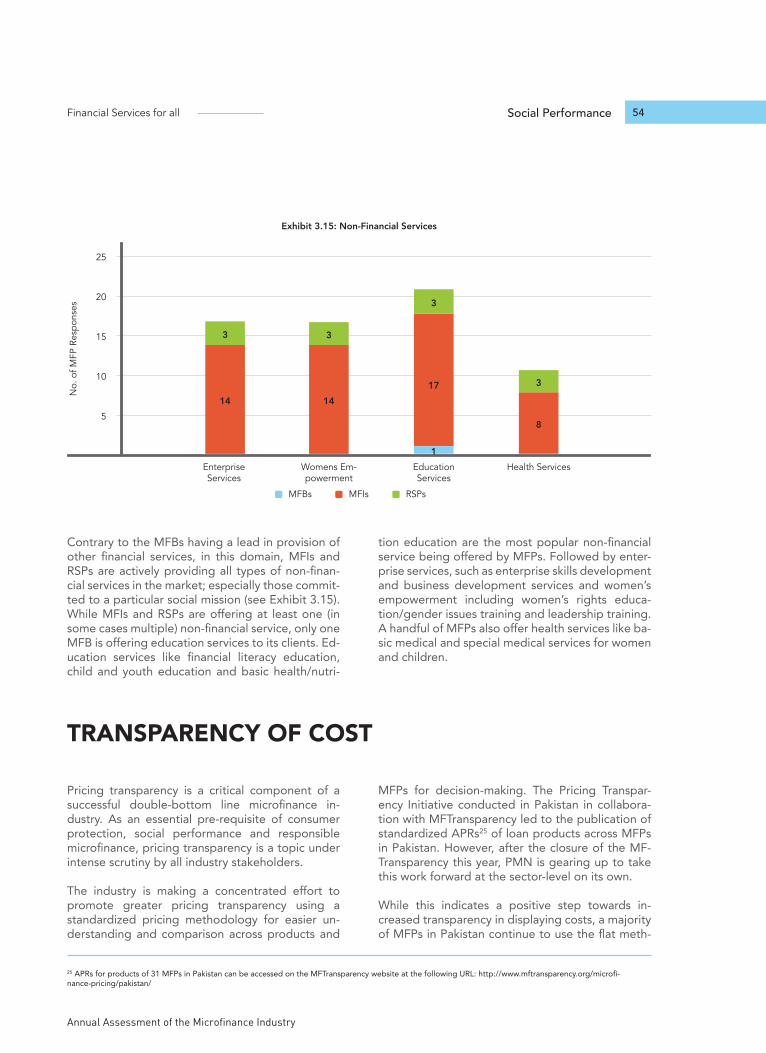
Annual Assessment of the Microfinance Industry
Financial Services for all 54Social Performance
Pricing transparency is a critical component of a successful double-bottom line microfinance in-dustry. As an essential pre-requisite of consumer protection, social performance and responsible microfinance, pricing transparency is a topic under intense scrutiny by all industry stakeholders.
The industry is making a concentrated effort to promote greater pricing transparency using a standardized pricing methodology for easier un-derstanding and comparison across products and
MFPs for decision-making. The Pricing Transpar-ency Initiative conducted in Pakistan in collabora-tion with MFTransparency led to the publication of standardized APRs25 of loan products across MFPs in Pakistan. However, after the closure of the MF-Transparency this year, PMN is gearing up to take this work forward at the sector-level on its own.
While this indicates a positive step towards in-creased transparency in displaying costs, a majority of MFPs in Pakistan continue to use the flat meth-
Contrary to the MFBs having a lead in provision of other financial services, in this domain, MFIs and RSPs are actively providing all types of non-finan-cial services in the market; especially those commit-ted to a particular social mission (see Exhibit 3.15). While MFIs and RSPs are offering at least one (in some cases multiple) non-financial service, only one MFB is offering education services to its clients. Ed-ucation services like financial literacy education, child and youth education and basic health/nutri-
tion education are the most popular non-financial service being offered by MFPs. Followed by enter-prise services, such as enterprise skills development and business development services and women’s empowerment including women’s rights educa-tion/gender issues training and leadership training. A handful of MFPs also offer health services like ba-sic medical and special medical services for women and children.
TRANSPARENCY OF COST
Exhibit 3.15: Non-Financial Services
5
10
15
20
Enterprise Services
14
3
Womens Em-powerment
14
Education Services
17
1
3
Health Services
8
3
MFBs RSPsMFIs
25
No.
of M
FP R
espo
nses
3
25 APRs for products of 31 MFPs in Pakistan can be accessed on the MFTransparency website at the following URL: http://www.mftransparency.org/microfi-nance-pricing/pakistan/
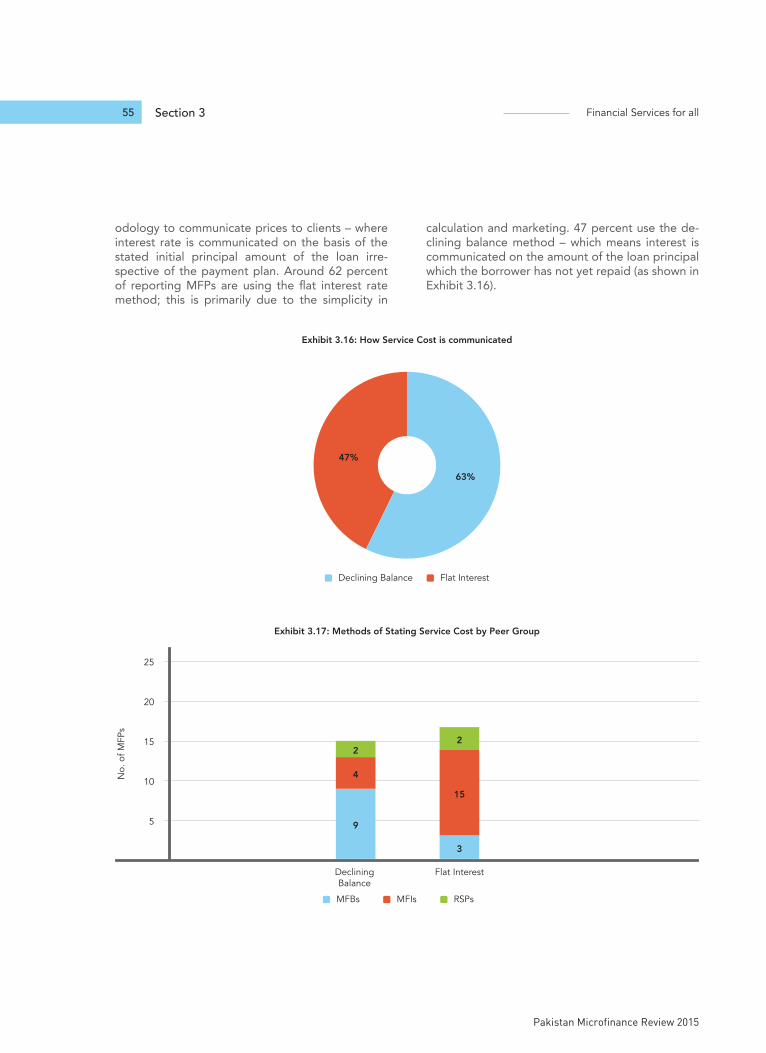
Section 3 Financial Services for all
Pakistan Microfinance Review 2015
55
odology to communicate prices to clients – where interest rate is communicated on the basis of the stated initial principal amount of the loan irre-spective of the payment plan. Around 62 percent of reporting MFPs are using the flat interest rate method; this is primarily due to the simplicity in
calculation and marketing. 47 percent use the de-clining balance method – which means interest is communicated on the amount of the loan principal which the borrower has not yet repaid (as shown in Exhibit 3.16).
63%
47%
Declining Balance Flat Interest
Exhibit 3.16: How Service Cost is communicated
Exhibit 3.17: Methods of Stating Service Cost by Peer Group
5
10
15
20
MFBs RSPsMFIs
25
No.
of M
FPs
Declining Balance
9
2
4
Flat Interest
15
3
2
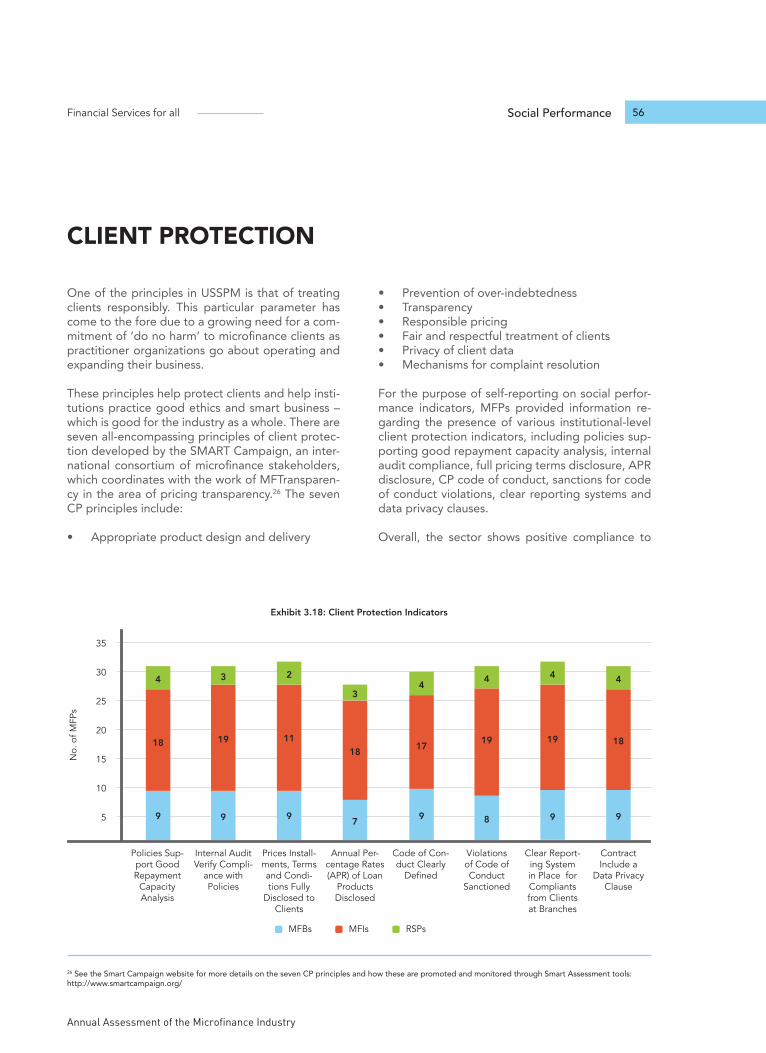
Annual Assessment of the Microfinance Industry
Financial Services for all 56Social Performance
One of the principles in USSPM is that of treating clients responsibly. This particular parameter has come to the fore due to a growing need for a com-mitment of ‘do no harm’ to microfinance clients as practitioner organizations go about operating and expanding their business.
These principles help protect clients and help insti-tutions practice good ethics and smart business – which is good for the industry as a whole. There are seven all-encompassing principles of client protec-tion developed by the SMART Campaign, an inter-national consortium of microfinance stakeholders, which coordinates with the work of MFTransparen-cy in the area of pricing transparency.26 The seven CP principles include:
• Appropriate product design and delivery
• Prevention of over-indebtedness• Transparency• Responsible pricing• Fair and respectful treatment of clients• Privacy of client data• Mechanisms for complaint resolution
For the purpose of self-reporting on social perfor-mance indicators, MFPs provided information re-garding the presence of various institutional-level client protection indicators, including policies sup-porting good repayment capacity analysis, internal audit compliance, full pricing terms disclosure, APR disclosure, CP code of conduct, sanctions for code of conduct violations, clear reporting systems and data privacy clauses.
Overall, the sector shows positive compliance to
CLIENT PROTECTION
Exhibit 3.18: Client Protection Indicators
5
10
15
20
25
30
MFBs RSPsMFIs
35
Policies Sup-port Good Repayment
Capacity Analysis
Internal Audit Verify Compli-
ance with Policies
Prices Install-ments, Terms and Condi-tions Fully
Disclosed to Clients
Annual Per-centage Rates (APR) of Loan
Products Disclosed
Code of Con-duct Clearly
Defined
Violations of Code of Conduct
Sanctioned
8
19
4
Clear Report-ing System in Place for Compliants from Clients at Branches
Contract Include a
Data Privacy Clause
9
18
4
9
17
4
9
19
3
9
11
2
19
9
4
3
7
18
9
18
4
No.
of M
FPs
26 See the Smart Campaign website for more details on the seven CP principles and how these are promoted and monitored through Smart Assessment tools: http://www.smartcampaign.org/
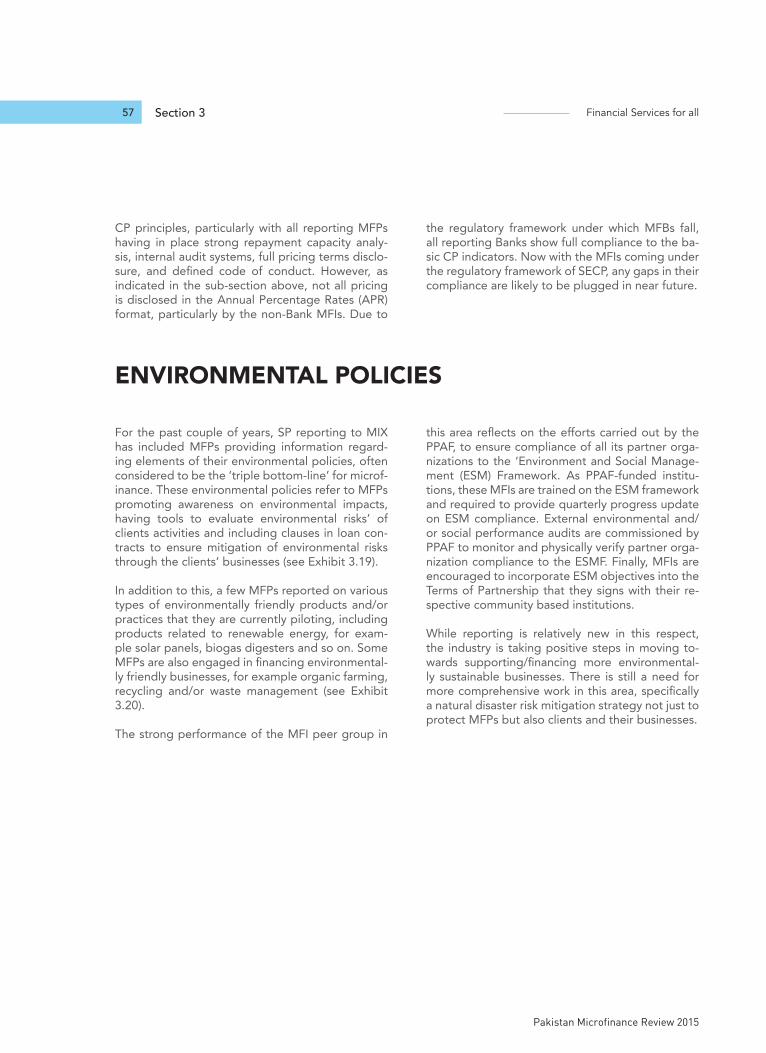
Section 3 Financial Services for all
Pakistan Microfinance Review 2015
57
CP principles, particularly with all reporting MFPs having in place strong repayment capacity analy-sis, internal audit systems, full pricing terms disclo-sure, and defined code of conduct. However, as indicated in the sub-section above, not all pricing is disclosed in the Annual Percentage Rates (APR) format, particularly by the non-Bank MFIs. Due to
the regulatory framework under which MFBs fall, all reporting Banks show full compliance to the ba-sic CP indicators. Now with the MFIs coming under the regulatory framework of SECP, any gaps in their compliance are likely to be plugged in near future.
For the past couple of years, SP reporting to MIX has included MFPs providing information regard-ing elements of their environmental policies, often considered to be the ‘triple bottom-line’ for microf-inance. These environmental policies refer to MFPs promoting awareness on environmental impacts, having tools to evaluate environmental risks’ of clients activities and including clauses in loan con-tracts to ensure mitigation of environmental risks through the clients’ businesses (see Exhibit 3.19).
In addition to this, a few MFPs reported on various types of environmentally friendly products and/or practices that they are currently piloting, including products related to renewable energy, for exam-ple solar panels, biogas digesters and so on. Some MFPs are also engaged in financing environmental-ly friendly businesses, for example organic farming, recycling and/or waste management (see Exhibit 3.20).
The strong performance of the MFI peer group in
this area reflects on the efforts carried out by the PPAF, to ensure compliance of all its partner orga-nizations to the ‘Environment and Social Manage-ment (ESM) Framework. As PPAF-funded institu-tions, these MFIs are trained on the ESM framework and required to provide quarterly progress update on ESM compliance. External environmental and/or social performance audits are commissioned by PPAF to monitor and physically verify partner orga-nization compliance to the ESMF. Finally, MFIs are encouraged to incorporate ESM objectives into the Terms of Partnership that they signs with their re-spective community based institutions.
While reporting is relatively new in this respect, the industry is taking positive steps in moving to-wards supporting/financing more environmental-ly sustainable businesses. There is still a need for more comprehensive work in this area, specifically a natural disaster risk mitigation strategy not just to protect MFPs but also clients and their businesses.
ENVIRONMENTAL POLICIES
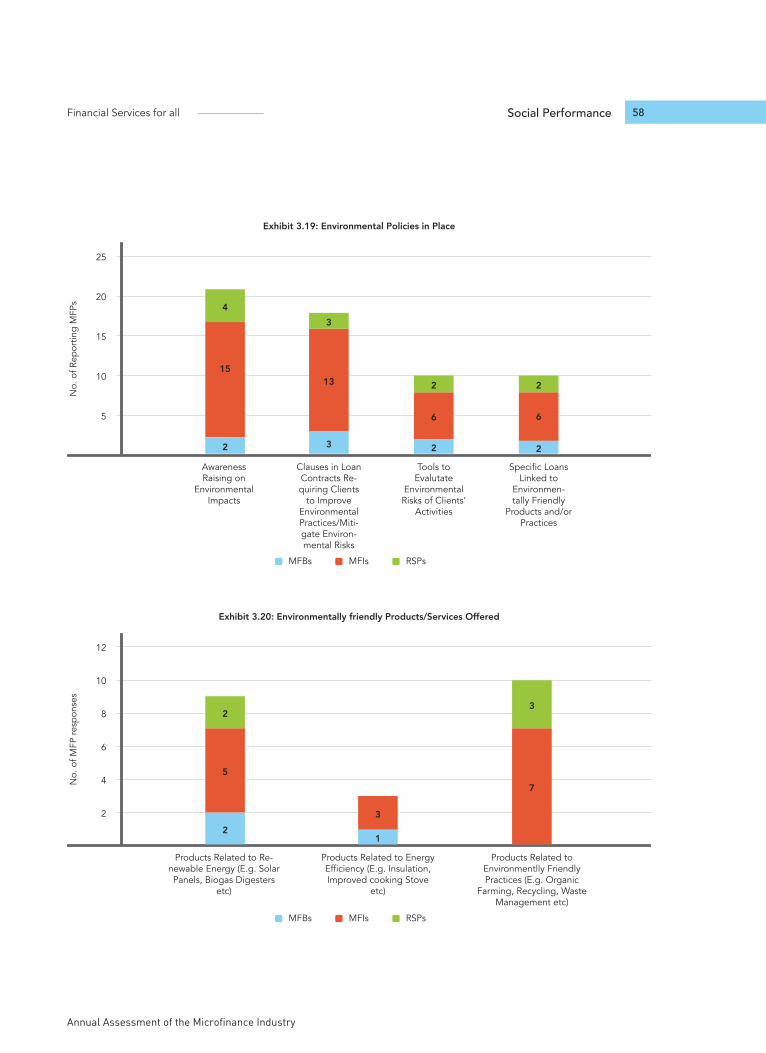
Annual Assessment of the Microfinance Industry
Financial Services for all 58Social Performance
Exhibit 3.19: Environmental Policies in Place
5
10
15
20
Awareness Raising on
Environmental Impacts
15
2
4
Clauses in Loan Contracts Re-quiring Clients
to Improve Environmental Practices/Miti-gate Environ-mental Risks
13
3
Tools to Evalutate
Environmental Risks of Clients’
Activities
6
2
2
Specific Loans Linked to
Environmen-tally Friendly
Products and/or Practices
6
2
2
MFBs RSPsMFIs
25
No.
of R
epor
ting
MFP
s
3
Exhibit 3.20: Environmentally friendly Products/Services Offered
2
4
6
8
Products Related to Re-newable Energy (E.g. Solar Panels, Biogas Digesters
etc)
Products Related to Energy Efficiency (E.g. Insulation, Improved cooking Stove
etc)
Products Related to Environmentlly Friendly Practices (E.g. Organic
Farming, Recycling, Waste Management etc)
5
2
2
7
3
MFBs RSPsMFIs
12
10
No.
of M
FP re
spon
ses
3
1

Section 3 Financial Services for all
Pakistan Microfinance Review 2015
59
Annual Assessment of the Microfinance Industry
Financial Services for all 60Challenges and Opportunities
SECTION 4
CHALLENGES AND OPPORTUNITIES
Section 4 Financial Services for all
Pakistan Microfinance Review 2015
61
CHALLENGES AND OPPORTUNITIES
Financial inclusion aims to extend financial services to all, irrespective of their income levels, at afford-able costs. With over half the world’s adult pop-ulation unbanked, global leaders and policy mak-ers have committed themselves to furthering the financial inclusion agenda. According to the World Bank, over 50 countries have publicly committed to financial inclusion strategies so far. According to empirical research, financial inclusion leads to economic growth and employment.27 Moreover, it leads to effective and efficient transfer of govern-ment social safety net payments.28 Also, financial innovation can not only lower transaction costs but also increase outreach resulting in development of new private sector business models such as low costs off-grid energy solutions for households.29
Keeping in view the state of financial inclusion in the country as mentioned in Section 1, the National Fi-nancial Inclusion Policy (NFIS) has been developed with the view of expanding access to finance in the country. The strategy aims to increase the number of adults having access to transaction or formal ac-
counts from 10 percent at present to 50 percent by 2020. The proportion of women having access to formal accounts would be increased from current 2.9 percent to 25 percent in the same time period. In addition, percentage of adults living within 5 km of financial touch points will be increased and finan-cials products tailored to meet the needs of SMEs will be encouraged.
The microfinance industry can play a pivotal role in providing access to financial services to the un-banked. Using their synergies with the branchless banking platforms, microfinance players can ex-tend financial services to the unbanked by utilizing digital channels. Moreover with women clients ac-counting for bulk of the clientele, practitioners can play an important role in reaching the NFIS target of 25 percent of women having formal accounts. In addition, MFPs are upscaling their loan sizes and gearing up to tap the lower end of SMEs.
In order to further the financial inclusion agenda in the country, PMN has developed a Microfinance
As the microfinance industry in Pakistan continues to grow and expand its footprint across the country, it faces a number of new challenges and opportunities. Some of these opportunities and challenges are discussed in this section.
ROLE OF MICROFINANCE IN FINANCIAL INCLUSION IN PAKISTAN
27 Financial Inclusion and Development: Recent Impact Evidence, Focus Note 92, CGAP, April 201428 Ibid 29 Ibid
Annual Assessment of the Microfinance Industry
Financial Services for all 62Challenges and Opportunities
As the microfinance industry has evolved and grown over the years, a need has been felt to safeguard the sustainability of the MFPs, ensure growth, fos-ter innovation and protect the rights of the clients at the base of the pyramid. With players having pro-gressed from providing just credit products to a full set of financial services and new players entering in the market, the need for regulating microfinance activities has increased. In addition, growing focus on consumer protection and responsible finance and global concerns regarding money laundering and terrorist financing have strengthened the case for regulation. Lastly, increasing interest of poli-cymakers in the financial inclusion sphere and the crucial role microfinance industry can play in reach-ing out to the unbanked has led to development of regulatory frameworks globally.
The recent launch of rules and regulations gov-erning non-bank microfinance providers (MFPs) by SECP is a watershed moment. This will now enable the mainstreaming of non-bank MFPs and create a level playing field in the industry. Pakistani microfi-nance industry over the years has grown to a stage where it has been felt that some regulation is ben-eficial rather than restrictive. Organized and willful defaults in Punjab in the last decade have highlight-ed the importance of institutional protection from external interference. Moreover, as the industry grows, the need for funding sources and access to commercial finance is imperative. A regulatory um-brella can prove to be catalyst for non-bank MFPs to generate investor interest and attract capital.
MFBs, regulated by SBP, have witnessed growth
and saw their market share increase as compared to non-bank MFPs. The segment has been able to diversify their funding sources and have been able to successfully obtain loans from commercial sourc-es, mobilize deposits and tap into capital markets. Moreover, a number of players intending to enter the industry either set up MFBs or acquired existing ones.
The new rules and regulation will allow the non-bank MFPs to grow and innovate. Non-bank play-ers which are currently working under multiple legal jurisdictions and ambiguous regulatory envi-ronment, the new regulations issued by SECP will enable them to work under single and strong reg-ulatory umbrella. In addition, they now have an op-tion to also operate as a for-profit entity which was previously not available to them.
In the short term, non-bank MFPs will be protect-ed from external interference and will be able to effectively mitigate reputational risk. In the long run, it will lead to improved standards of corporate governance, increase transparency and disclosure in the sector.
In addition, non-bank MFPs will be better able to raise capital and be able to diversify their sources of funding as investor unease regarding the ambigu-ous regulatory environment will be alleviated. New player intending to enter the industry will have op-tion to set up an MFB or a Non-Bank Microfinance Institute (NBMFI). In addition, consumer protection will be emphasized.
Growth Strategy which highlights the role that the sector can play in meeting the NFIS targets. As per the growth strategy, the sector aims to reach 10 million active borrowers by 2020 as well as 50 million depositors out of which 15 million will be m-wallet accounts. Out of the 10 million active bor-rowers, 4 million will be women borrowers. Insur-ance policy holders will increase to 11 million by 2020. It is hoped that the number of access points
will increase to 400,000 which will include branch-less banking agents, ATMs, POS terminals and brick and mortar branches.
The microfinance industry aims to achieve these ambitious targets by working on building a strong industry infrastructure, supportive regulatory envi-ronment and coopting government credit schemes.
MAINSTREAMING NON-BANK MICROFINANCE PLAYERS
Section 4 Financial Services for all
Pakistan Microfinance Review 2015
63
Over the past two decades, credit scoring has been transforming how financial institutions interact with their customers. In developed countries especially, financial institutions primarily rely on the predictive power of credit scoring models to make informed decisions about current and potential clients. In simple terms, credit scoring is a rating system that assigns weights to various characteristics of a bor-rower with the objective of forecasting future per-formance of the borrower. Credit scores can be de-veloped based on either qualitative or quantitative information on customer behavior characteristics.
For lenders in wealthy countries during the past decade, scoring has been one of the most import-ant sources of increased efficiency. Such lenders, however, score potential borrowers on the basis of comprehensive credit histories from credit bu-reaus, as well as on the experience and salary of the borrower in formal wage employment.30 In most in-stances, scoring focuses on the likelihood that the borrower will become delinquent, or be unable to make timely repayments.
It is important to mention here that credit scores rely on a vast amount of data, and an effective scor-ing system can only be developed if an institution possesses a comprehensive database. Data is col-lected on a range of factors related to the customer – largely their past credit behavior, income sources and socio-economic characteristics. Credit bureaus play a vital role in aggregating data on client’s cred-it behavior and it has been globally observed that credit scoring systems are mostly prevalent in mar-kets with strong credit bureaus.
Like commercial financial institutions, microfinance providers can also benefit by scoring current and prospective clients. Micro-lending is a costly en-deavor; labor intensive methods are used to assess loan applications and monitor defaulters. For large MFIs that are well run and possess adequate da-tabases, scoring can increase efficiency, outreach and sustainability by improving the time allocation of loan officers. Additionally, credit scoring can im-prove risk assessment and delinquency monitoring of bad clients, and can dramatically improve port-folio management for repeat customers.
The branchless banking sector in Pakistan has come a long way since its initial deployment in 2009. Originally launched as an over-the-counter service to effectively remit money and pay utility bills, the branchless banking sector, over the years, has been witnessing a gradual inclination towards mobile wallets. Evidence from around the globe identifies
that success of mobile wallets rests in its capacity to dissolve the conventional brick and mortar branch model to handheld devices with minimal agent in-volvement.
With the arrival of mobile money, the lower so-cio-economic segment of the society has been in-
The roll-out of the rules and regulations regard-ing non-bank MFPs at a time when NFIS has been launched will go a long away in reaching the policy maker’s goal in financial inclusion. With the neces-sary regulatory support and protection, non-bank
MFPs will be able to expand and reach scale while at the same time further the financial inclusion agenda in the country.
CREDIT SCORING
MOBILE WALLETS
30 Credit Scoring for Microfinance; can it Work? by Mark Schreiner
Annual Assessment of the Microfinance Industry
Financial Services for all 64Challenges and Opportunities
troduced to a new product and a channel that al-lows them to use text messages to store value in an account, convert cash in and out of the stored value account, and transfer value between users.
The revisions in the branchless banking regulations by State Bank of Pakistan have made it increasingly easy to open and operate a mobile wallet account. More importantly, the recent national SIM ver-ification drive under the supervision of PTA (Jan-April 2015) has ensured that every phone number is now linked to a biometrically verified Nation-al Identity Card Number; this rich data fulfills the know-your-customer (KYC) requirements for open-ing level 0 accounts and allows for remote account opening. In Pakistan, level 0 accounts are one of the three tiers of customer mobile wallet accounts: level 0, level 1 and level 2. Each level has progres-sively higher account and balance limits, and thus progressively more stringent KYC requirements.
The biometric verification initiative from PTA served as a launching pad for the mobile money market; the large scale installation of biometric de-vices at retailer level served as a front-end tool for customers to open m-wallets through branchless banking agents. Over a period of twelve months, the number of branchless banking accounts has increased from 4.7 million in September 2014 to 13.2 million in September 2015. Among the retail branchless banking players, Easypaisa has been a
dominant player in tapping mobile wallet account holders, whereas, Mobicash is also emerging as a key competitor with an aggressive account open-ing strategy to register the masses with its branch-less banking platform.
Moreover, the majority of the growth has been at the initial level 0 accounts (89%) with minimum KYC requirements and transaction limits. This shows that the industry is headed in the right direction of extending financial services to the unbanked. Hav-ing said this, the significant growth cannot be at-tributed solely to one factor. The branchless bank-ing industry has made noteworthy leaps in terms of diversification of product mix and provision of services. The sector cumulatively offers a diverse number of services from money transfer to bill pay-ments to insurance products.
Despite the recent growth in mobile wallets, over the counter transactions still compose a major chunk of the money in the branchless banking eco-system. OTC transactions accounted for 69 percent of the total transactions in terms of volume and 71 percent in terms of value as of September 2015. This trend points towards the possibilities that either the customers do not see enough value in these accounts due to lack of awareness or there is a scarcity of products such as credit provision or tailored savings schemes.
Microfinance Institutions around the globe are constantly evolving, expanding their operations beyond the traditional microcredit services by inculcating a range of specialized financial and non-financial services. This evolution is propelled by the philosophy that poverty is a multidimen-sional problem and cannot be eradicated by only provision of micro-credit. J. Sachs (2005) explicates that ‘poverty is caused by lack of capital and it fur-ther depletes human and natural capital thereby
expanding the trap of poverty’.31 Guided by this school of thought, MFIs are now turning their at-tention towards quality of life issues. Capitalizing on their already established relationship with the clients, MFIs are now working for improving their standards of living by providing access to better education, health and sociocultural amenities. In addition, many microfinance institutions are also extending risk management (insurance) services to their clients to protect both, the loan recipients and
EXPLORING NEW HORIZONS: SERVING NEW MARKETS
31 Sachs. Jeffery. 2005. The End of Poverty: Economic Possibilities of Our Time. Penguin Press

Section 4 Financial Services for all
Pakistan Microfinance Review 2015
65
lenders against accidents or calamities.32
To reiterate the earlier point, poverty entails more than the lack of bare necessities of life like food and shelter. It affects a person’s access and affordability of necessities like health, education for the young and vocational and skill improvement training for adults, utility services including electricity, water sanitation and telecommunication.
MFIs (Microfinance Institutions) can use their ex-isting client base that has discretionary income to provide them with additional financial services, which could be used to directly improve the client’s quality of life.33 After the delinquency crisis of 2008, Pakistani microfinance sector realized that custom-er focus cannot be compromised, and in addition to extending traditional micro-credit in a client-centric and transparent manner, overall consideration to the client wellbeing ought to be given.
This subsection highlights innovative products in health and education sector from around the globe, initiatives which can be replicated in the Pa-kistani context as well.
HEALTH AND MICROFINANCE
Of various lifecycle shocks that poor face, push-ing them further down the poverty trap, ill health makes up for one of the direst factors. Quite often poor clients of microfinance default on their pay-ments due to financial strain exerted by income loss and medical care expenditure after a serious health emergency. In a way, health is a poor man/woman’s first and foremost asset.34
If microfinance sector intends to achieve financial security of the poor, it is crucial to look into the issue of health security for the two are intertwined. Hence there is a need to look into health financ-ing including micro-insurance, flexible savings and emergency health loans for the microfinance cli-entele. Loans to access clean water and sanitation systems, or even mosquito nets considering the dengue epidemic in recent years, can lead to im-provement in the lives of the clients.
However, in a developing country like Pakistan, health loans and insurance alone is not sufficient for the access itself is an issue due to insufficient medical infrastructure in rural and peri-urban areas.
While microfinance sector cannot be a substitute for the health sector, microfinance institutions, across the globe and in Pakistan are taking up initiatives to plug the gaps in various ways. Some MFIs are educating the clients on a diverse array of health topics including preventable communicable diseas-es and maternal and child health. Some institutions carry out regular health camps or run health clinics while others are adopting more innovative models connecting their clients with healthcare providers through telemedicine.
While quite a few of PMN’s member MFIs are ex-tending health services to their clients in the form of basic health centers or specialized health camps, health education and insurance, there is much that can be done in this sector. Studying these health-microfinance models from across the bor-der and around the world, similar partnerships can be established between public and private sector health infrastructure, retail microfinance providers and donors is possible to solve the issue of access to affordable health services for the poor in Paki-stan while creating income generating ventures for entrepreneurial individuals.
FINANCE FOR LOW COST PRIVATE SCHOOLS (LCPS)
Another sector that presents tremendous business opportunities for the microfinance sector all the while serving to further sustainable development goals is that of low cost private schools (LCPS), a niche which falls within the SME sector owing to its characteristics. The past decade has seen a mush-room growth of low cost private schools in the country, both in urban and rural areas. The financ-ing of these schools has important implications not only for access to finance indicators, but also on the matter of access to education for the poor and low income segments.
32 Multidimensional Poverty and Expanding Role of Microfinance Institutions by Shabnam Lutafali and Faiza Khoja 33 Ibid34 Integrated Health and Microfinance in India: Harnessing the Strengths of Two Sectors to Improve Health and Alleviate Poverty (2012) by Freedom from Hunger and Microcredit Summit Campaign
Annual Assessment of the Microfinance Industry
Financial Services for all 66Challenges and Opportunities
BOX 3.1GLOBAL CASE STUDIES
Telemedicine Centers for Microfinance Clients Equitas, a Chennai based microfinance organization, has established “telemedicine centers” in three of its branch offices in partnership with Apollo Hospitals. Located in urban slums, the centers are staffed by nurses and stocked with medical testing equipment and a laptop with video-conferencing. Equitas’s microfinance clients (predomi-nantly women and their families) can schedule an appointment at the center and consult with a doctor through videoconferencing about symptoms and care. Center-based nurses take vitals such as blood pressure and heart-beat rate through equipment that transmits readings directly to the doctor and into a patient’s computerized medical file. The per-visit cost to the patient is 50 INR (.96 USD). Following the successful pilot, Equitas plans to scale the telemedicine centers to more of its 300 branches that provide financial services to over 1 million clients.
Microcredit for Franchised Micro-clinics Another innovative model which brings microfinance and health sector together for the betterment of its clientele is HealthStore Foundation’s Child and Family Wellness (CfW) shops; franchised micro-clinics and micro-pharma-cies in Kenya. CfW shops make use of franchising business model to solve the problem of last-mile distribution of health products and services.
CfW shops are small health clinics, typically in rural areas, that provide basic medical care for common and pre-ventable diseases. Run by formally trained providers like community health nurses and doctors who can provide high quality basic care, they’re an important channel for bringing diagnoses and treatment to remote areas. Seri-ous cases are transferred to nearby hospitals with secondary and tertiary care services through a referral system. Through Kiva Microfund, trained nurses and community health workers can avail small business loans to set up a micro-clinic in their localities (a typical CfW shops requires a start-up capital of USD 1700). All CfW shop owners are required to comply with CfW standards and procedures for which they receive an extensive training. Franchi-sees are charged a yearly fee to use the brand name and receive logistical support. So far, these systems have been successful in Kenya, India and across West Africa.
Similar to CfW micro-clinics, CfW micro-pharmacies are small-scale pharmacies, typically located in rural, remote areas. They help to ensure that essential medicines are delivered to these underserved people. By being part of a franchise, the franchisors ensure that the medicines they supply are of high quality and they provide franchisees with training in essential medications and treatments relevant to their local communities.
Franchising model for health provides an effective system for scaling quickly by placing the onus of expansion on outside entrepreneurial individuals. Franchisees are driven by the incentive of ownership, so they have an interest in making the pharmacies or clinics successful. Furthermore, the franchisor - the parent company has an interest in strictly enforcing compliance to franchise standards to protect their brand name. Many of these franchises operate under a hub and spoke model, where the micro-clinics and micro-pharmacies are connected to a regional office or hospital. This model ensures that the staff of the clinics is evaluated consistently according to standard-ized procedures, with a quality control mechanism and a direct referral system to a larger hospital in place. The hub and spoke model can be highly effective as long as the hubs are operating efficiently and ensuring that all of the spokes are getting the services they need.
Section 4 Financial Services for all
Pakistan Microfinance Review 2015
67
A 2014 research study commissioned by the Unit-ed Kingdom’s Department for International Devel-opment (DFID) estimated that the sector’s fund-ing needs exceeds PKR 77 billion for over 70,000 low cost private schools currently operating in the country. The amount and sources of initial invest-ment for these existing schools are typical of the SME sector, with a substantial number of low cost private schools having initial investments of less than PKR 300,000 sourced usually from personal savings and loans from family and friends.35
The LCPS market presents great potential for the MFPs to further their financial inclusion agendas as a specific sub-set of the MSME sector in the country. Several MFPs, especially the microfinance banks, have already begun taking steps that will enable them to reach out to the higher end of the microf-
inance market (the MSMEs) by creating enterprise loan products and employing the individual lending methodology for higher loan amounts. However, considering the size of the potential microfinance market within the LCPS sector, a sector-specific microcredit product or modify their existing micro-enterprise loans can be introduced, to effectively engage with the low cost private schools.
With an enabling microfinance landscape and regu-latory environment, and PMN’s willingness to work with its members, these untapped markets present a potential for MFPs to reach product scale and profitability though a sector-specific approach all the while furthering the national financial inclusion agenda and improving the quality of life of its cli-entele.
On August 3, 2016, the National Assembly passed the Deposit Protection Fund Act after a year and a half of rigorous debates. Under the Act, the De-posit Protection Corporation (DPC), a subsidiary owned by the State Bank of Pakistan (SBP) will be created, with the objective of compensating the depositors for losses incurred by them to the ex-tent of protected deposits in the event of failure of a member. All banks scheduled under Section 37 (2) of the State Bank of Pakistan Act, 1956, shall compulsorily be members of the Fund and liable to pay the prescribed premium, unless exempted or excluded by the Board.
Regardless of the number and size of various de-posits, the DPF shall provide protection up to an amount determined by it from time to time. The protected amount shall be inclusive of any interest accrued or return due as on the notification date by the SBP to the effect that normal operation of a member has been closed or suspended as a result of its insolvency or any judicial or regulatory action.Introduction of the Act is a welcome initiative and
will help improve the financial landscape in Paki-stan by leaps and bounds. Particularly when all im-portant stakeholders including Ministry of Finance, State Bank of Pakistan (SBP) and Securities & Ex-change of Commission (SECP) have committed to the goals of NFIS, the Deposit Protection Fund will enhance the trust and confidence of consumers in the banking sector. They will be more open to place their savings with the banking sector. In addition, it will wean them away from the informal sector and encourage them to use formal channels. However, there are a few considerations that need to be pondered upon as we move ahead. Although the Act covers the operational aspects of the Fund in a thorough manner, missing in the broad param-eters of the DPF is the definition of ‘protected de-posit’ which needs to be included to make it more effective. Another caveat is potential disputes on matters such as the determination of deposit amount and the premium due on such deposits from the protected bank. There should be a provi-sion and forum for the resolution of such disputes.
DEPOSIT PROTECTION FUND: MOVING TOWARDS A SECURE FINANCIAL LANDSCAPE
35 ‘Access to Finance for Low Cost Private Schools in Pakistan’, 2014.
Annual Assessment of the Microfinance Industry
Financial Services for all 68Challenges and Opportunities
In the past, microfinance has focused mostly on credit. Savings can be labelled as the forgotten half of microfinance. However, practitioners have real-ized the importance of savings and subsequently rolled out saving products. Savings serve as a major source of low cost funds for microfinance players. Moreover, it allows for expanding and deepening outreach as clients do not need credit service and prefer to save before availing credit.
Microfinance players in Pakistan also took the same path and were initially focused solely on credit. However, over the last five years, deposit mobiliza-tion by Microfinance Banks (MFBs) in Pakistan has witnessed an upward trend. A closer look shows that this growth has come on the back of the above market rates being offered by the banks and have attracted mostly high net worth clients and insti-tutional deposits. According to a study conducted by PMN, less than 20 percent of the depositors of the MFBs can be categorized as micro-savers. The rates offered by the MFBs have been at times more than twice that of the prevailing policy rate. However, this kind of deposit can be categorized as volatile and unlikely to be sustainable for the banks in the long-run.
MFBs have not been able to successfully tap retail and small depositors so far despite being a cheap-er and stable source of funds. One of the reason for this is that the saving products being offered are similar to ones being offered by the commercial banks. There is a need to modify existing products and develop new products that cater to the needs of the clients at the base of the pyramid. Identifying the needs of the clients and developing the right products can encourage a large chunk of the pop-ulation to move from informal methods of savings to formal channels.
Moreover, using branchless banking channels, de-posits can be mobilized in a cost effective and con-venient manner particularly in far flung and sparsely populated areas. The simplification of the account opening process recently will go a long way in pro-moting m-wallets as means of savings. However, despite the popularity of branchless banking in the country, m-wallets have yet to witness similar interest. There is a need to develop a supporting ecosystem and an incentive mechanism to enhance the usage of m-wallets.
Funding continues to remain a key challenge be-ing faced by the sector for a host of reasons. As an emerging industry, commercial lenders continue to remain hesitant to place funds with the industry. Heavy investment in government papers by com-mercial banks and absence of regulatory framework of non-bank MFIs has further compounded the sit-uation. In order to facilitate commercial lending to the sector, two credit guarantee schemes were ex-tended: one by the central bank, SBP, and the oth-er by the national apex, PPAF. As a result, bigger and more established players are now poised to avail clean credit lines based on their own financial strength. However, now with both facilities being
utilized and with the PPAF financial services group being transformed into a Microfinance Investment Vehicle (MIV), MFPs, particularly the mid-sized and smaller players, are looking towards diversifying their funding sources.
PMN’s Growth Strategy launched last year with an aim to reach 10 million active borrowers by 2020 forecasts a funding gap of over PKR 300 billion out of which PKR 200 billion is debt. It is highly unlikely that this sum shall be met by a single source. The industry will need to diversify its sources of funds in order to meet its increasing financing requirements. MFBs despite having witnessed substantial growth
DEPOSITS MOBILIZATION: UNTYING GORDIAN’S KNOT
FUNDING
Section 4 Financial Services for all
Pakistan Microfinance Review 2015
69
in their deposit base over the last few years have not been able to completely meet their funding needs from the savings and have felt the need to borrow. With loan sizes likely to increase as MFBs start lending to microenterprises, the funding needs of the banks are likely to go up. Keeping this in view, MFBs are not only borrowing from do-mestic commercial banks but also borrowing from international lenders and intend to tap debt capi-tal markets for funds. Being regulated entities and with a stable track record of borrowing from com-mercial sources within the country, MFBs are better poised to avail credit lines without the support of credit guarantees.
Non-Bank MFPs, which are dependent upon debt for on-lending, have witnessed their growth plans being adversely affected by the full utilization of
MCGF and PPAF funding lines especially the mid-sized and small players. Since only a handful had raised funds from commercial sources that too by using credit guarantees, many of these entities are finding it hard to diversify their funding sources. Lack of a regulatory umbrella had further aggravat-ed the situation. One option that is being actively explored by a number of entities is to borrow from international players. Although pricing remains a stumbling block, the absence of collateral require-ments like cash deposits, makes it an attractive op-tion. Practitioners are ready to pay a premium to get additional funds to meet their financing needs. It is hoped that now with the regulatory regime in place for non-bank MFPs and the formation of PMIC there will be better availability of funds for the industry.
Recognized globally for its regulatory and business environment, the microfinance sector in Pakistan has set its sight to reaching 10 million clients by year 2020 which would require an injection of USD 3 billion through debt, equity and deposits. Since its inception, PPAF has played a critical role both as a sector developer and as an apex wholesale lend-er. PPAF catalyzed financial deepening and expan-sion of microfinance services in the underserved areas of the country. It also encouraged innovation and testing of different lending methodologies and delivery mechanisms.
PPAF has been the largest source of wholesale funds for the sector and has disbursed more than USD 1.4 billion over the last 16 years and has fully deployed its funds through 40 partner organiza-
tion. In order to fuel the next phase of growth in the sector and meet the funding demands of the sector, PPAF, Department for International Devel-opment (DFID) through Karandaaz Pakistan and the German Development Bank KfW have joined hands to establish Pakistan Microfinance Invest-ment Company (PMIC).The new company is envi-sioned to have a commercial (for-profit) structure registered as an Investment Finance Company under SECP by being the first of its kind national level Microfinance Investment Vehicle (MIV) in the world. Moreover, PMIC is expected to attract suffi-cient funds from private and commercial sources to help the microfinance sector reach 8 million clients by 2018 and create employment opportunities for around half a million individuals.
SETTING UP OF PAKISTAN MICROFINANCE INVESTMENT COMPANY LIMITED (PMIC)
PAK
ISTA
N M
ICR
OFI
NA
NC
E R
EV
IEW
201
5

Annual Assessment of the Microfinance Industry
Financial Services for all 70Challenges and Opportunities
PAK
ISTA
N M
ICR
OFI
NA
NC
E R
EV
IEW
201
5

Section 4 Financial Services for all
Pakistan Microfinance Review 2015
71
Annual Assessment of the Microfinance Industry
Financial Services for all 72Annexures
ANNEXURES
ANNEXURES
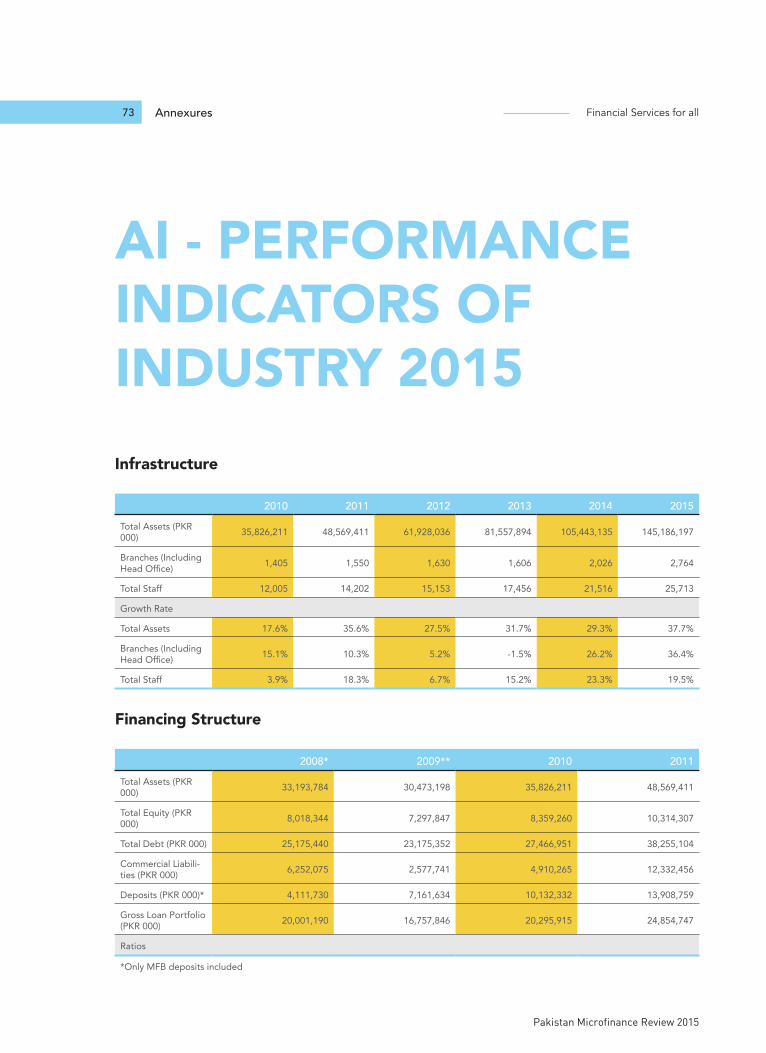
Annexures Financial Services for all
Pakistan Microfinance Review 2015
73
AI - PERFORMANCE INDICATORS OF INDUSTRY 2015Infrastructure
2010 2011 2012 2013 2014 2015Total Assets (PKR 000) 35,826,211 48,569,411 61,928,036 81,557,894 105,443,135 145,186,197
Branches (Including Head Office) 1,405 1,550 1,630 1,606 2,026 2,764
Total Staff 12,005 14,202 15,153 17,456 21,516 25,713
Growth Rate
Total Assets 17.6% 35.6% 27.5% 31.7% 29.3% 37.7%
Branches (Including Head Office) 15.1% 10.3% 5.2% -1.5% 26.2% 36.4%
Total Staff 3.9% 18.3% 6.7% 15.2% 23.3% 19.5%
Financing Structure
2008* 2009** 2010 2011Total Assets (PKR 000) 33,193,784 30,473,198 35,826,211 48,569,411
Total Equity (PKR 000) 8,018,344 7,297,847 8,359,260 10,314,307
Total Debt (PKR 000) 25,175,440 23,175,352 27,466,951 38,255,104
Commercial Liabili-ties (PKR 000) 6,252,075 2,577,741 4,910,265 12,332,456
Deposits (PKR 000)* 4,111,730 7,161,634 10,132,332 13,908,759
Gross Loan Portfolio (PKR 000) 20,001,190 16,757,846 20,295,915 24,854,747
Ratios
*Only MFB deposits included
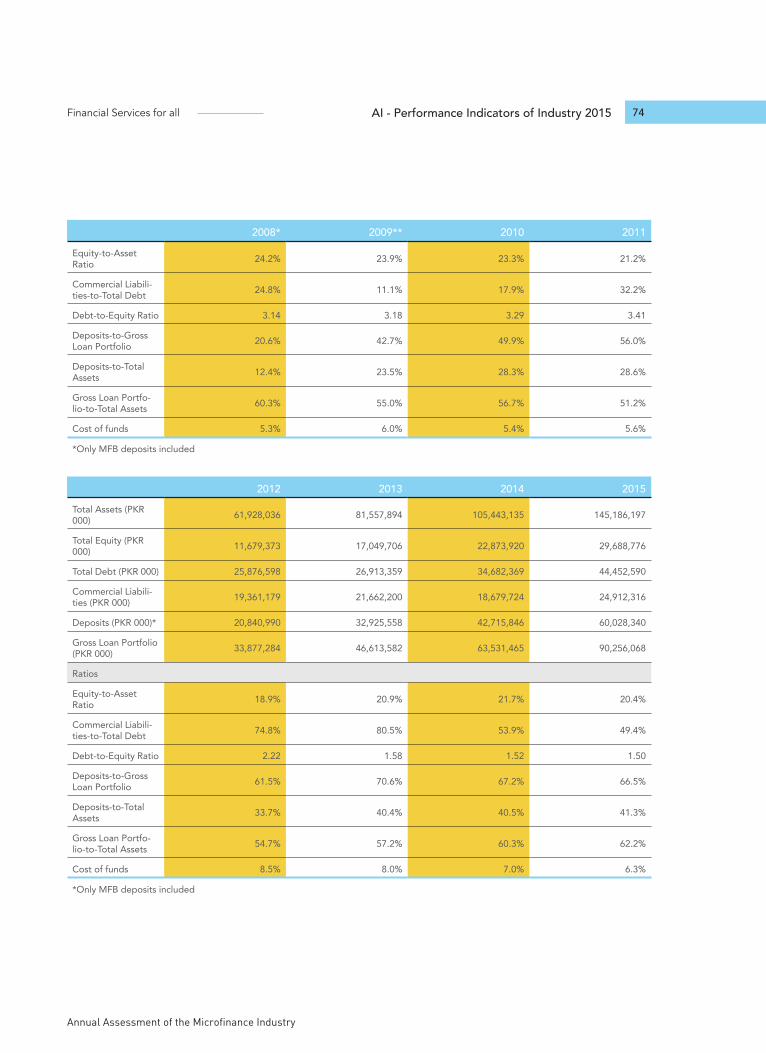
Annual Assessment of the Microfinance Industry
Financial Services for all 74AI - Performance Indicators of Industry 2015
2008* 2009** 2010 2011Equity-to-Asset Ratio 24.2% 23.9% 23.3% 21.2%
Commercial Liabili-ties-to-Total Debt 24.8% 11.1% 17.9% 32.2%
Debt-to-Equity Ratio 3.14 3.18 3.29 3.41
Deposits-to-Gross Loan Portfolio 20.6% 42.7% 49.9% 56.0%
Deposits-to-Total Assets 12.4% 23.5% 28.3% 28.6%
Gross Loan Portfo-lio-to-Total Assets 60.3% 55.0% 56.7% 51.2%
Cost of funds 5.3% 6.0% 5.4% 5.6%
*Only MFB deposits included
2012 2013 2014 2015Total Assets (PKR 000) 61,928,036 81,557,894 105,443,135 145,186,197
Total Equity (PKR 000) 11,679,373 17,049,706 22,873,920 29,688,776
Total Debt (PKR 000) 25,876,598 26,913,359 34,682,369 44,452,590
Commercial Liabili-ties (PKR 000) 19,361,179 21,662,200 18,679,724 24,912,316
Deposits (PKR 000)* 20,840,990 32,925,558 42,715,846 60,028,340
Gross Loan Portfolio (PKR 000) 33,877,284 46,613,582 63,531,465 90,256,068
Ratios
Equity-to-Asset Ratio 18.9% 20.9% 21.7% 20.4%
Commercial Liabili-ties-to-Total Debt 74.8% 80.5% 53.9% 49.4%
Debt-to-Equity Ratio 2.22 1.58 1.52 1.50
Deposits-to-Gross Loan Portfolio 61.5% 70.6% 67.2% 66.5%
Deposits-to-Total Assets 33.7% 40.4% 40.5% 41.3%
Gross Loan Portfo-lio-to-Total Assets 54.7% 57.2% 60.3% 62.2%
Cost of funds 8.5% 8.0% 7.0% 6.3%
*Only MFB deposits included
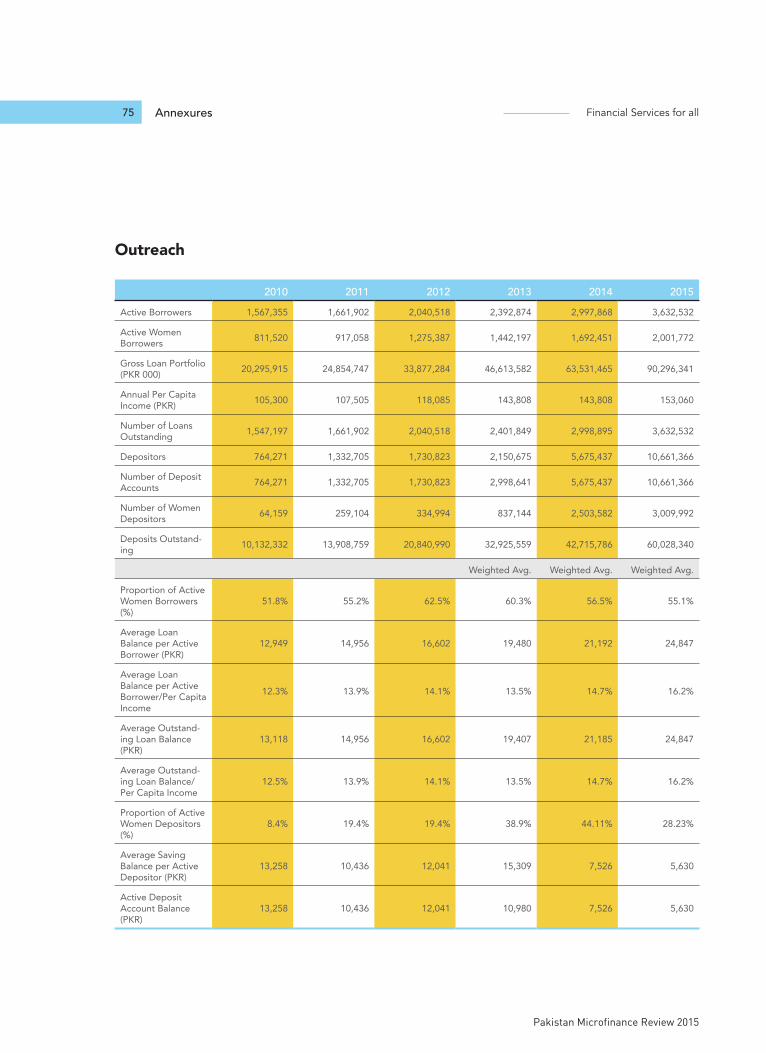
Annexures Financial Services for all
Pakistan Microfinance Review 2015
75
Outreach
2010 2011 2012 2013 2014 2015Active Borrowers 1,567,355 1,661,902 2,040,518 2,392,874 2,997,868 3,632,532
Active Women Borrowers 811,520 917,058 1,275,387 1,442,197 1,692,451 2,001,772
Gross Loan Portfolio (PKR 000) 20,295,915 24,854,747 33,877,284 46,613,582 63,531,465 90,296,341
Annual Per Capita Income (PKR) 105,300 107,505 118,085 143,808 143,808 153,060
Number of Loans Outstanding 1,547,197 1,661,902 2,040,518 2,401,849 2,998,895 3,632,532
Depositors 764,271 1,332,705 1,730,823 2,150,675 5,675,437 10,661,366
Number of Deposit Accounts 764,271 1,332,705 1,730,823 2,998,641 5,675,437 10,661,366
Number of Women Depositors 64,159 259,104 334,994 837,144 2,503,582 3,009,992
Deposits Outstand-ing 10,132,332 13,908,759 20,840,990 32,925,559 42,715,786 60,028,340
Weighted Avg. Weighted Avg. Weighted Avg.
Proportion of Active Women Borrowers (%)
51.8% 55.2% 62.5% 60.3% 56.5% 55.1%
Average Loan Balance per Active Borrower (PKR)
12,949 14,956 16,602 19,480 21,192 24,847
Average Loan Balance per Active Borrower/Per Capita Income
12.3% 13.9% 14.1% 13.5% 14.7% 16.2%
Average Outstand-ing Loan Balance (PKR)
13,118 14,956 16,602 19,407 21,185 24,847
Average Outstand-ing Loan Balance/Per Capita Income
12.5% 13.9% 14.1% 13.5% 14.7% 16.2%
Proportion of Active Women Depositors (%)
8.4% 19.4% 19.4% 38.9% 44.11% 28.23%
Average Saving Balance per Active Depositor (PKR)
13,258 10,436 12,041 15,309 7,526 5,630
Active Deposit Account Balance (PKR)
13,258 10,436 12,041 10,980 7,526 5,630

Annual Assessment of the Microfinance Industry
Financial Services for all 76AI - Performance Indicators of Industry 2015
Financial Performance
2006 2007* 2008* 2009** 2010Income from loan portfolio 1,493,902 2,746,985 4,202,506 4,352,648 6,122,154
Income from invest-ments 611,657 638,909 831,602 1,087,106 870,809
Income from other sources 16,517 32,347 80,552 975,335 528,457
Total revenue 2,122,076 3,418,241 5,114,660 6,415,089 7,521,420
Less : financial expense 460,666 876,871 1,556,375 1,820,037 2,016,795
Gross financial margin 1,661,410 2,541,370 3,558,285 4,595,052 5,504,624
Less: loan loss provi-sion expense 302,616 363,353 1,440,324 408,684 745,660
Net financial margin 1,358,794 2,178,018 2,117,962 4,186,368 4,758,964
Personnel expense 1,084,180 1,476,490 1,828,726 2,186,177 2,819,891
Admin expense 791,179 1,122,978 1,507,667 1,719,283 1,961,816
Less: operating expense 1,875,359 2,599,468 3,336,393 3,905,460 4,781,707
Other Non operat-ing expense
Net income before tax (516,566) (421,450) (1,218,432) 280,908 (22,742)
Provision for tax (22,401) 75,179 (1,001) 5,353 (7,047)
Net income/(loss) (494,164) (496,629) (1,217,431) 275,555 (15,696)
Adjusted Financial Expense on Bor-rowings
199,690 299,219 242,377 87,767 -
Inflation Adjustment Expense 351,898 417,278 669,689 1,318,219 -
Adjusted Loan Loss Provision Expense 545 64,590 11,699 - -
Total Adjustment Expense 552,132 781,087 923,765 1,405,987 -
Net Income/(Loss) After Adjustments (1,046,297) (1,277,716) (2,141,195) (1,889,736) (15,696)
Average total assets 15,646,074 20,055,650 27,996,183 29,363,269 30,399,088
Average total equity 5,509,135 6,115,580 7,177,338 7,006,506 7,854,713
Ratios weighted avg.
Adjusted Re-turn-on-Assets (6.7%) (6.4%) (7.6%) (3.3%) (0.1%)
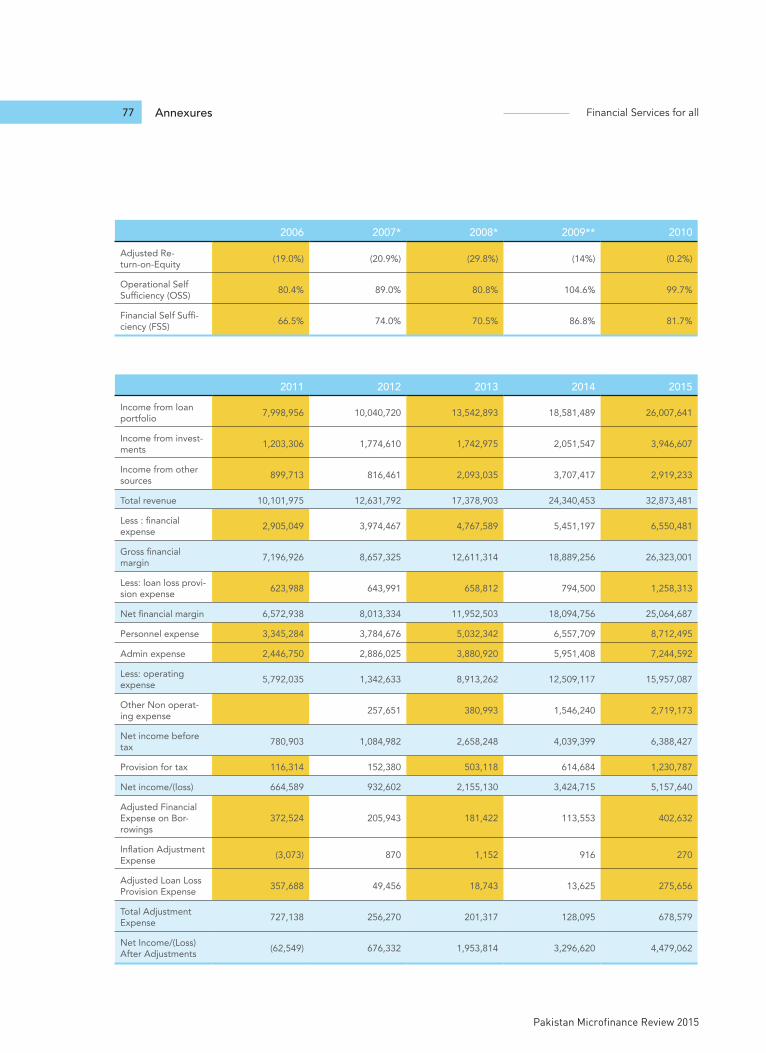
Annexures Financial Services for all
Pakistan Microfinance Review 2015
77
2006 2007* 2008* 2009** 2010Adjusted Re-turn-on-Equity (19.0%) (20.9%) (29.8%) (14%) (0.2%)
Operational Self Sufficiency (OSS) 80.4% 89.0% 80.8% 104.6% 99.7%
Financial Self Suffi-ciency (FSS) 66.5% 74.0% 70.5% 86.8% 81.7%
2011 2012 2013 2014 2015Income from loan portfolio 7,998,956 10,040,720 13,542,893 18,581,489 26,007,641
Income from invest-ments 1,203,306 1,774,610 1,742,975 2,051,547 3,946,607
Income from other sources 899,713 816,461 2,093,035 3,707,417 2,919,233
Total revenue 10,101,975 12,631,792 17,378,903 24,340,453 32,873,481
Less : financial expense 2,905,049 3,974,467 4,767,589 5,451,197 6,550,481
Gross financial margin 7,196,926 8,657,325 12,611,314 18,889,256 26,323,001
Less: loan loss provi-sion expense 623,988 643,991 658,812 794,500 1,258,313
Net financial margin 6,572,938 8,013,334 11,952,503 18,094,756 25,064,687
Personnel expense 3,345,284 3,784,676 5,032,342 6,557,709 8,712,495
Admin expense 2,446,750 2,886,025 3,880,920 5,951,408 7,244,592
Less: operating expense 5,792,035 1,342,633 8,913,262 12,509,117 15,957,087
Other Non operat-ing expense 257,651 380,993 1,546,240 2,719,173
Net income before tax 780,903 1,084,982 2,658,248 4,039,399 6,388,427
Provision for tax 116,314 152,380 503,118 614,684 1,230,787
Net income/(loss) 664,589 932,602 2,155,130 3,424,715 5,157,640
Adjusted Financial Expense on Bor-rowings
372,524 205,943 181,422 113,553 402,632
Inflation Adjustment Expense (3,073) 870 1,152 916 270
Adjusted Loan Loss Provision Expense 357,688 49,456 18,743 13,625 275,656
Total Adjustment Expense 727,138 256,270 201,317 128,095 678,579
Net Income/(Loss) After Adjustments (62,549) 676,332 1,953,814 3,296,620 4,479,062
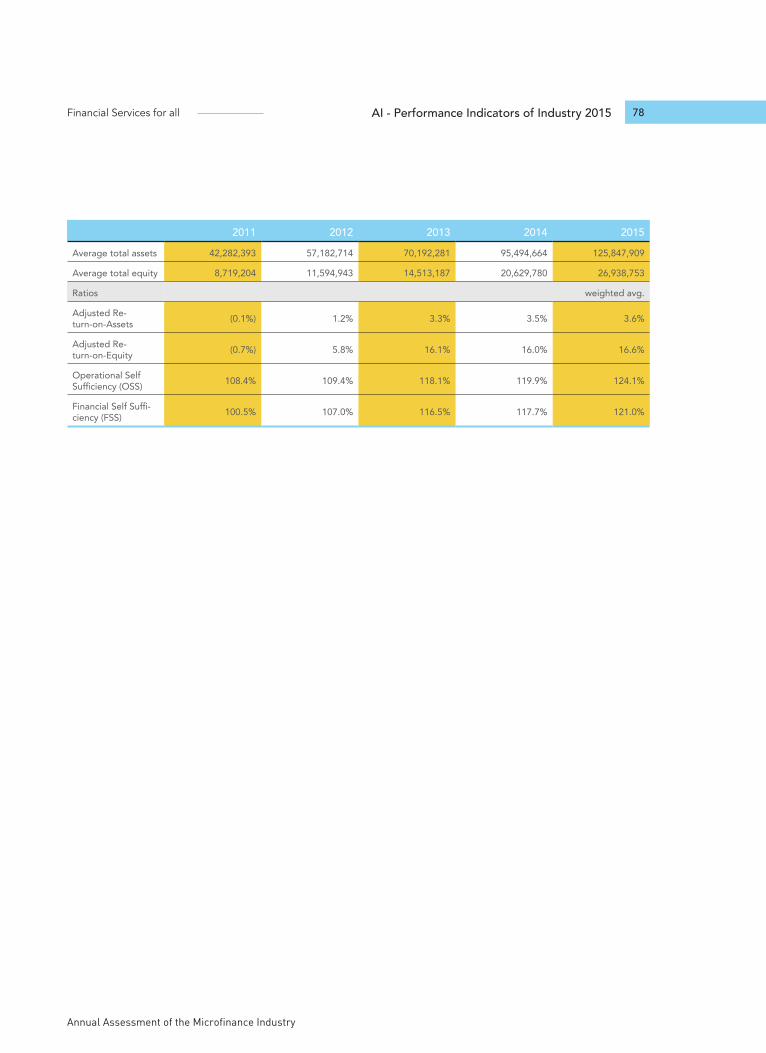
Annual Assessment of the Microfinance Industry
Financial Services for all 78AI - Performance Indicators of Industry 2015
2011 2012 2013 2014 2015Average total assets 42,282,393 57,182,714 70,192,281 95,494,664 125,847,909
Average total equity 8,719,204 11,594,943 14,513,187 20,629,780 26,938,753
Ratios weighted avg.
Adjusted Re-turn-on-Assets (0.1%) 1.2% 3.3% 3.5% 3.6%
Adjusted Re-turn-on-Equity (0.7%) 5.8% 16.1% 16.0% 16.6%
Operational Self Sufficiency (OSS) 108.4% 109.4% 118.1% 119.9% 124.1%
Financial Self Suffi-ciency (FSS) 100.5% 107.0% 116.5% 117.7% 121.0%
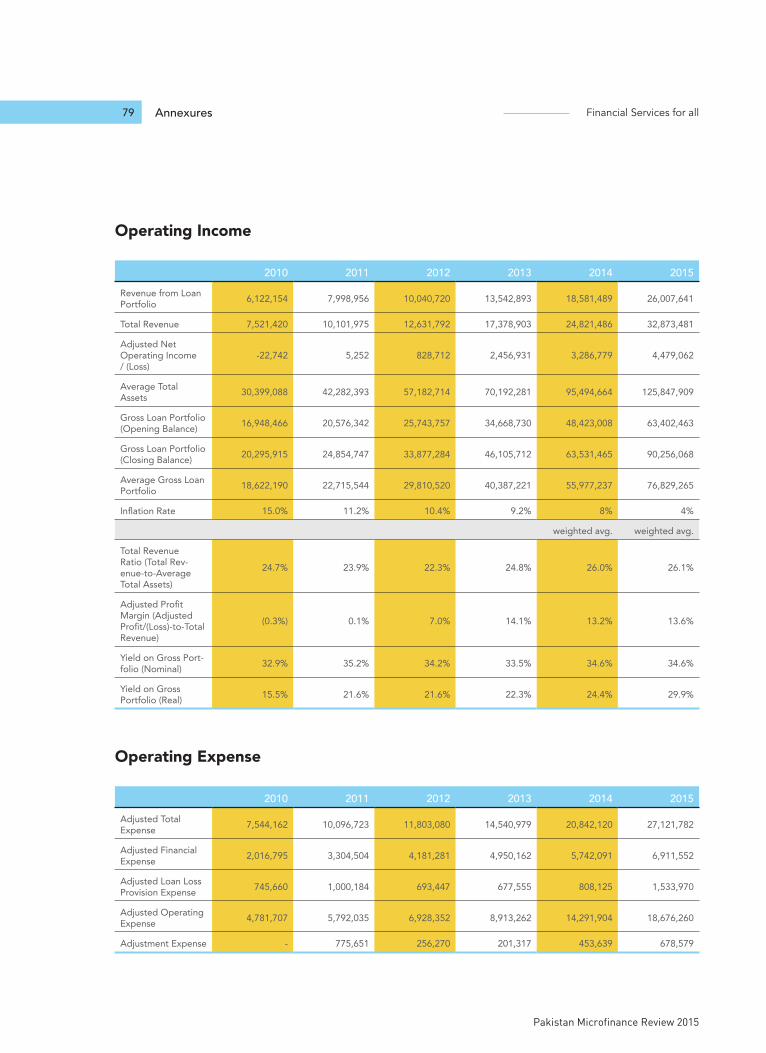
Annexures Financial Services for all
Pakistan Microfinance Review 2015
79
Operating Income
2010 2011 2012 2013 2014 2015Revenue from Loan Portfolio 6,122,154 7,998,956 10,040,720 13,542,893 18,581,489 26,007,641
Total Revenue 7,521,420 10,101,975 12,631,792 17,378,903 24,821,486 32,873,481
Adjusted Net Operating Income / (Loss)
-22,742 5,252 828,712 2,456,931 3,286,779 4,479,062
Average Total Assets 30,399,088 42,282,393 57,182,714 70,192,281 95,494,664 125,847,909
Gross Loan Portfolio (Opening Balance) 16,948,466 20,576,342 25,743,757 34,668,730 48,423,008 63,402,463
Gross Loan Portfolio (Closing Balance) 20,295,915 24,854,747 33,877,284 46,105,712 63,531,465 90,256,068
Average Gross Loan Portfolio 18,622,190 22,715,544 29,810,520 40,387,221 55,977,237 76,829,265
Inflation Rate 15.0% 11.2% 10.4% 9.2% 8% 4%
weighted avg. weighted avg.
Total Revenue Ratio (Total Rev-enue-to-Average Total Assets)
24.7% 23.9% 22.3% 24.8% 26.0% 26.1%
Adjusted Profit Margin (Adjusted Profit/(Loss)-to-Total Revenue)
(0.3%) 0.1% 7.0% 14.1% 13.2% 13.6%
Yield on Gross Port-folio (Nominal) 32.9% 35.2% 34.2% 33.5% 34.6% 34.6%
Yield on Gross Portfolio (Real) 15.5% 21.6% 21.6% 22.3% 24.4% 29.9%
Operating Expense
2010 2011 2012 2013 2014 2015Adjusted Total Expense 7,544,162 10,096,723 11,803,080 14,540,979 20,842,120 27,121,782
Adjusted Financial Expense 2,016,795 3,304,504 4,181,281 4,950,162 5,742,091 6,911,552
Adjusted Loan Loss Provision Expense 745,660 1,000,184 693,447 677,555 808,125 1,533,970
Adjusted Operating Expense 4,781,707 5,792,035 6,928,352 8,913,262 14,291,904 18,676,260
Adjustment Expense - 775,651 256,270 201,317 453,639 678,579
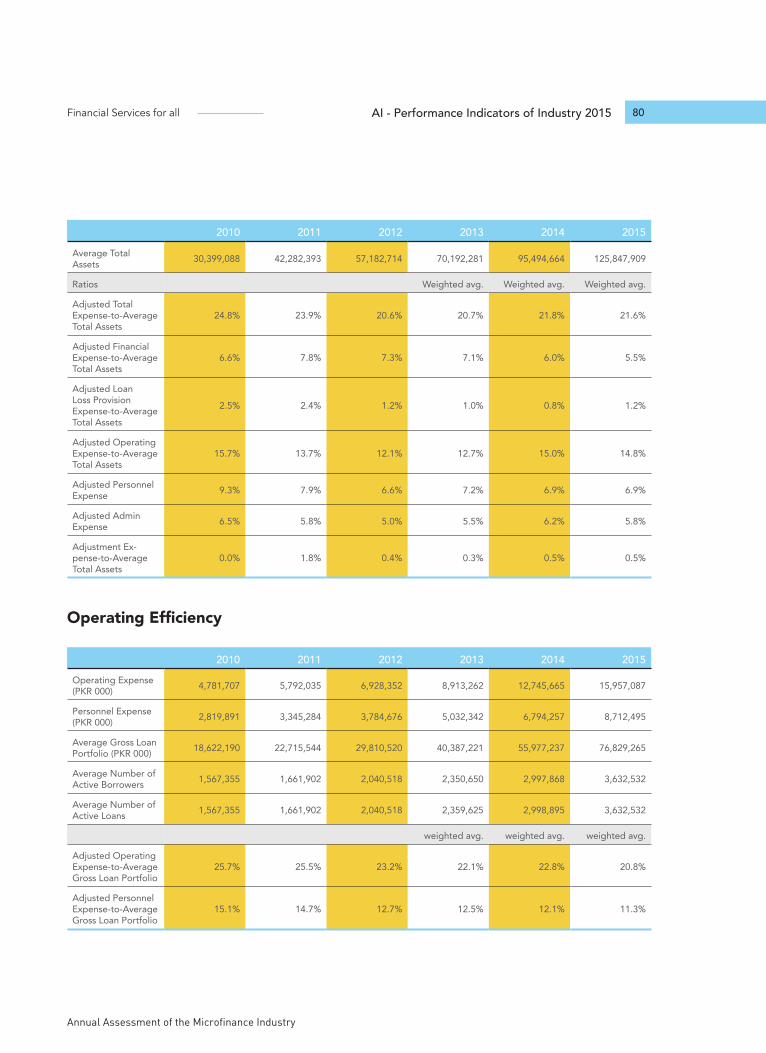
Annual Assessment of the Microfinance Industry
Financial Services for all 80AI - Performance Indicators of Industry 2015
2010 2011 2012 2013 2014 2015Average Total Assets 30,399,088 42,282,393 57,182,714 70,192,281 95,494,664 125,847,909
Ratios Weighted avg. Weighted avg. Weighted avg.
Adjusted Total Expense-to-Average Total Assets
24.8% 23.9% 20.6% 20.7% 21.8% 21.6%
Adjusted Financial Expense-to-Average Total Assets
6.6% 7.8% 7.3% 7.1% 6.0% 5.5%
Adjusted Loan Loss Provision Expense-to-Average Total Assets
2.5% 2.4% 1.2% 1.0% 0.8% 1.2%
Adjusted Operating Expense-to-Average Total Assets
15.7% 13.7% 12.1% 12.7% 15.0% 14.8%
Adjusted Personnel Expense 9.3% 7.9% 6.6% 7.2% 6.9% 6.9%
Adjusted Admin Expense 6.5% 5.8% 5.0% 5.5% 6.2% 5.8%
Adjustment Ex-pense-to-Average Total Assets
0.0% 1.8% 0.4% 0.3% 0.5% 0.5%
Operating Efficiency
2010 2011 2012 2013 2014 2015Operating Expense (PKR 000) 4,781,707 5,792,035 6,928,352 8,913,262 12,745,665 15,957,087
Personnel Expense (PKR 000) 2,819,891 3,345,284 3,784,676 5,032,342 6,794,257 8,712,495
Average Gross Loan Portfolio (PKR 000) 18,622,190 22,715,544 29,810,520 40,387,221 55,977,237 76,829,265
Average Number of Active Borrowers 1,567,355 1,661,902 2,040,518 2,350,650 2,997,868 3,632,532
Average Number of Active Loans 1,567,355 1,661,902 2,040,518 2,359,625 2,998,895 3,632,532
weighted avg. weighted avg. weighted avg.
Adjusted Operating Expense-to-Average Gross Loan Portfolio
25.7% 25.5% 23.2% 22.1% 22.8% 20.8%
Adjusted Personnel Expense-to-Average Gross Loan Portfolio
15.1% 14.7% 12.7% 12.5% 12.1% 11.3%

Annexures Financial Services for all
Pakistan Microfinance Review 2015
81
2010 2011 2012 2013 2014 2015Average Salary/Gross Domestic Product per Capita
2.23 2.19 2.12 2.00 2.2 2.2
Adjusted Cost per Borrower (PKR) 3,051 3,485 3,395 3,792 4,252 4,393
Adjusted Cost per Loan (PKR) 3,051 3,485 3,395 3,777 4,250 4,393
Productivity
2010 2011 2012 2013 2014 2015Number of Active Borrowers 1,567,355 1,661,902 2,040,518 2,255,126 2,997,868 3,632,532
Number of Active Loans 1,567,355 1,661,902 2,040,518 2,263,432 2,997,868 3,632,532
Number of Active Depositors 764,271 1,332,705 1,730,823 1,897,872 5,675,437 10,661,366
Number of Deposit Accounts 764,271 1,332,705 1,730,823 2,707,872 5,675,437 10,661,366
Total Staff 12,005 14,202 15,153 15,673 19,227 25,343
Total Loan Officers 5,148 7,165 7,541 6,892 8,801 9,923
weighted avg. weighted avg. weighted avg.
Borrowers per Staff 131 117 135 144 156 143
Loans per Staff 131 117 135 144 156 143
Borrowers per Loan Officer 304 232 271 327 341 366
Loans per Loan Officer 304 232 271 328 328 366
Depositors per Staff 64 94 114 121 295 421
Deposit Accounts per Staff 64 94 114 173 295 421
Personnel Allocation Ratio 42.9% 50.5% 49.8% 44.0% 45.8% 39.2%

Annual Assessment of the Microfinance Industry
Financial Services for all 82AI - Performance Indicators of Industry 2015
Risk
2010 2011 2012 2013 2014 2015Portfolio at Risk > 30 days 829,314 793,966 1,232,842 1,157,297 659,418 1,344,633
Portfolio at Risk > 90 days 577,972 516,623 1,020,316 932,166 379,637 792,864
Adjusted Loan Loss Reserve 733,338 623,988 759,621 708,355 1,189,884 1,488,025
Loan Written Off during Year 335,463 592,429 675,835 615,293 1,222,076 943,748
Gross Loan Portfolio 20,295,915 24,854,747 33,877,284 46,105,712 63,531,465 90,256,068
Average Gross Loan Portfolio 18,622,190 22,715,544 29,810,520 40,387,221 55,977,237 76,829,265
weighted avg. weighted avg. weighted avg.
Portfolio at Risk (>30)-to-Gross Loan Portfolio
4.1% 3.2% 3.6% 2.5% 1.0% 1.5%
Portfolio at Risk(>90)-to-Gross Loan Portfolio
2.8% 2.1% 3.0% 2.0% 0.6% 0.9%
Write Off-to-Av-erage Gross Loan Portfolio
1.8% 2.6% 2.3% 1.5% 2.2% 1.2%
Risk Coverage Ratio (Adjusted Loan Loss Reserve-to-Portfolio at Risk > 30 days)
88.4% 78.6% 61.6% 61.2% 180.4% 110.7%
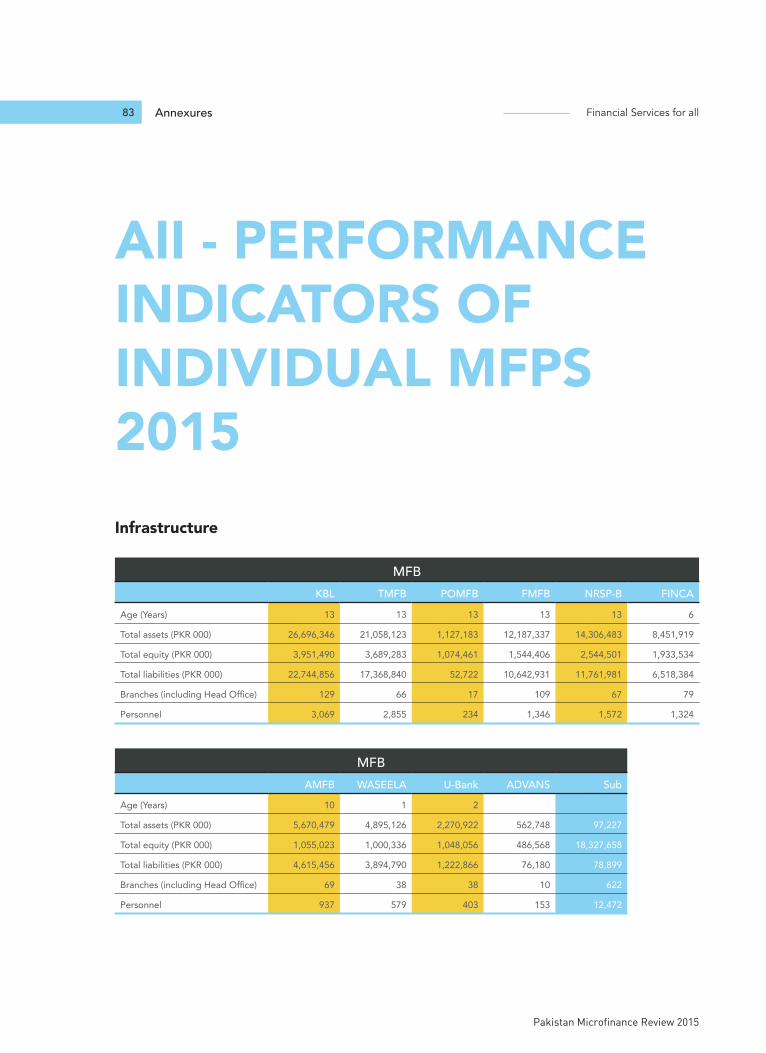
Annexures Financial Services for all
Pakistan Microfinance Review 2015
83
AII - PERFORMANCE INDICATORS OF INDIVIDUAL MFPS 2015Infrastructure
MFBKBL TMFB POMFB FMFB NRSP-B FINCA
Age (Years) 13 13 13 13 13 6
Total assets (PKR 000) 26,696,346 21,058,123 1,127,183 12,187,337 14,306,483 8,451,919
Total equity (PKR 000) 3,951,490 3,689,283 1,074,461 1,544,406 2,544,501 1,933,534
Total liabilities (PKR 000) 22,744,856 17,368,840 52,722 10,642,931 11,761,981 6,518,384
Branches (including Head Office) 129 66 17 109 67 79
Personnel 3,069 2,855 234 1,346 1,572 1,324
MFBAMFB WASEELA U-Bank ADVANS Sub
Age (Years) 10 1 2
Total assets (PKR 000) 5,670,479 4,895,126 2,270,922 562,748 97,227
Total equity (PKR 000) 1,055,023 1,000,336 1,048,056 486,568 18,327,658
Total liabilities (PKR 000) 4,615,456 3,894,790 1,222,866 76,180 78,899
Branches (including Head Office) 69 38 38 10 622
Personnel 937 579 403 153 12,472
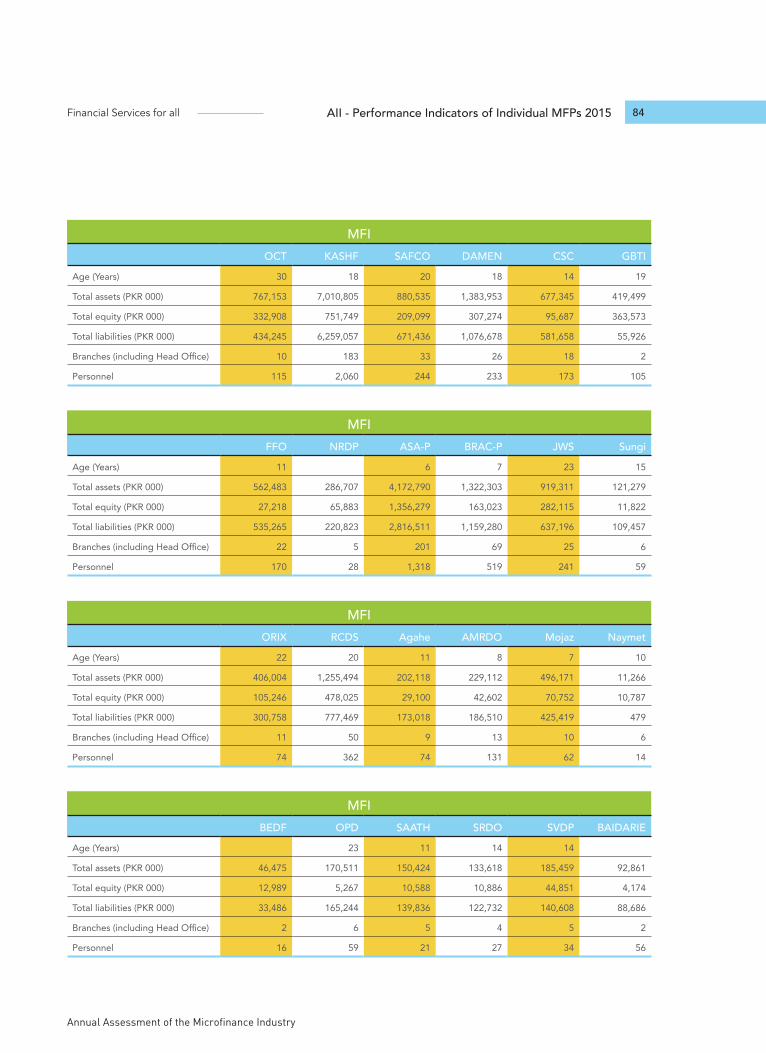
Annual Assessment of the Microfinance Industry
Financial Services for all 84AII - Performance Indicators of Individual MFPs 2015
MFIOCT KASHF SAFCO DAMEN CSC GBTI
Age (Years) 30 18 20 18 14 19
Total assets (PKR 000) 767,153 7,010,805 880,535 1,383,953 677,345 419,499
Total equity (PKR 000) 332,908 751,749 209,099 307,274 95,687 363,573
Total liabilities (PKR 000) 434,245 6,259,057 671,436 1,076,678 581,658 55,926
Branches (including Head Office) 10 183 33 26 18 2
Personnel 115 2,060 244 233 173 105
MFIFFO NRDP ASA-P BRAC-P JWS Sungi
Age (Years) 11 6 7 23 15
Total assets (PKR 000) 562,483 286,707 4,172,790 1,322,303 919,311 121,279
Total equity (PKR 000) 27,218 65,883 1,356,279 163,023 282,115 11,822
Total liabilities (PKR 000) 535,265 220,823 2,816,511 1,159,280 637,196 109,457
Branches (including Head Office) 22 5 201 69 25 6
Personnel 170 28 1,318 519 241 59
MFIORIX RCDS Agahe AMRDO Mojaz Naymet
Age (Years) 22 20 11 8 7 10
Total assets (PKR 000) 406,004 1,255,494 202,118 229,112 496,171 11,266
Total equity (PKR 000) 105,246 478,025 29,100 42,602 70,752 10,787
Total liabilities (PKR 000) 300,758 777,469 173,018 186,510 425,419 479
Branches (including Head Office) 11 50 9 13 10 6
Personnel 74 362 74 131 62 14
MFIBEDF OPD SAATH SRDO SVDP BAIDARIE
Age (Years) 23 11 14 14
Total assets (PKR 000) 46,475 170,511 150,424 133,618 185,459 92,861
Total equity (PKR 000) 12,989 5,267 10,588 10,886 44,851 4,174
Total liabilities (PKR 000) 33,486 165,244 139,836 122,732 140,608 88,686
Branches (including Head Office) 2 6 5 4 5 2
Personnel 16 59 21 27 34 56
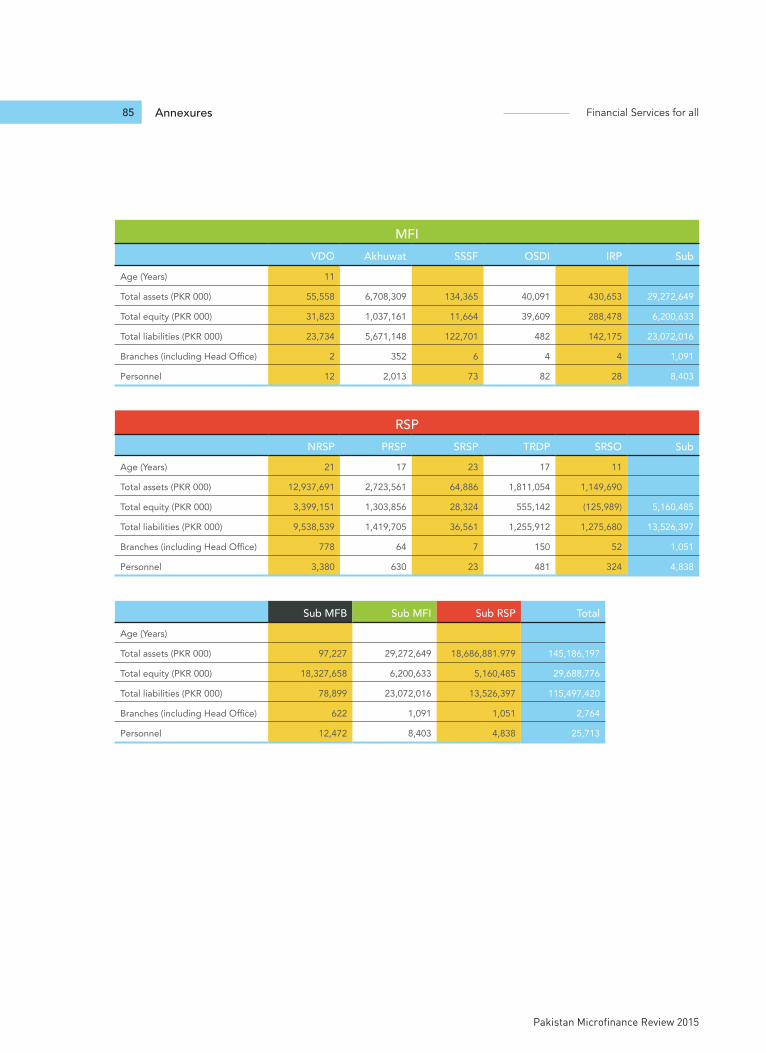
Annexures Financial Services for all
Pakistan Microfinance Review 2015
85
MFIVDO Akhuwat SSSF OSDI IRP Sub
Age (Years) 11
Total assets (PKR 000) 55,558 6,708,309 134,365 40,091 430,653 29,272,649
Total equity (PKR 000) 31,823 1,037,161 11,664 39,609 288,478 6,200,633
Total liabilities (PKR 000) 23,734 5,671,148 122,701 482 142,175 23,072,016
Branches (including Head Office) 2 352 6 4 4 1,091
Personnel 12 2,013 73 82 28 8,403
RSPNRSP PRSP SRSP TRDP SRSO Sub
Age (Years) 21 17 23 17 11
Total assets (PKR 000) 12,937,691 2,723,561 64,886 1,811,054 1,149,690
Total equity (PKR 000) 3,399,151 1,303,856 28,324 555,142 (125,989) 5,160,485
Total liabilities (PKR 000) 9,538,539 1,419,705 36,561 1,255,912 1,275,680 13,526,397
Branches (including Head Office) 778 64 7 150 52 1,051
Personnel 3,380 630 23 481 324 4,838
Sub MFB Sub MFI Sub RSP Total Age (Years)
Total assets (PKR 000) 97,227 29,272,649 18,686,881.979 145,186,197
Total equity (PKR 000) 18,327,658 6,200,633 5,160,485 29,688,776
Total liabilities (PKR 000) 78,899 23,072,016 13,526,397 115,497,420
Branches (including Head Office) 622 1,091 1,051 2,764
Personnel 12,472 8,403 4,838 25,713
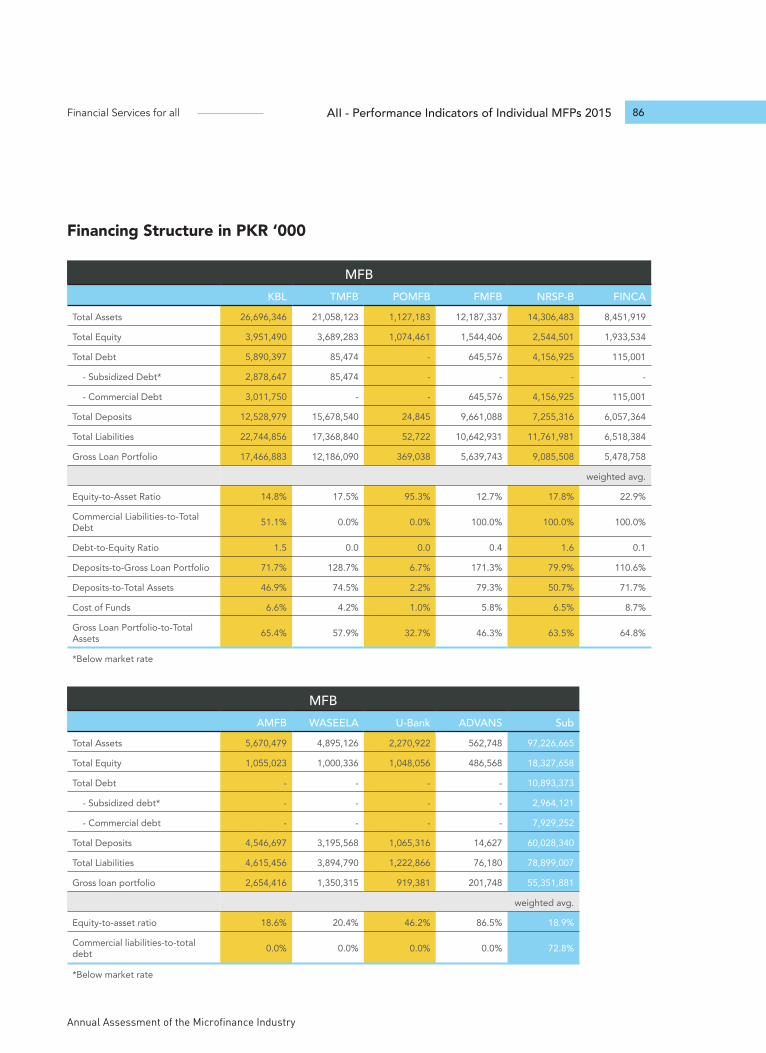
Annual Assessment of the Microfinance Industry
Financial Services for all 86AII - Performance Indicators of Individual MFPs 2015
Financing Structure in PKR ‘000
MFBKBL TMFB POMFB FMFB NRSP-B FINCA
Total Assets 26,696,346 21,058,123 1,127,183 12,187,337 14,306,483 8,451,919
Total Equity 3,951,490 3,689,283 1,074,461 1,544,406 2,544,501 1,933,534
Total Debt 5,890,397 85,474 - 645,576 4,156,925 115,001
- Subsidized Debt* 2,878,647 85,474 - - - -
- Commercial Debt 3,011,750 - - 645,576 4,156,925 115,001
Total Deposits 12,528,979 15,678,540 24,845 9,661,088 7,255,316 6,057,364
Total Liabilities 22,744,856 17,368,840 52,722 10,642,931 11,761,981 6,518,384
Gross Loan Portfolio 17,466,883 12,186,090 369,038 5,639,743 9,085,508 5,478,758
weighted avg.
Equity-to-Asset Ratio 14.8% 17.5% 95.3% 12.7% 17.8% 22.9%
Commercial Liabilities-to-Total Debt 51.1% 0.0% 0.0% 100.0% 100.0% 100.0%
Debt-to-Equity Ratio 1.5 0.0 0.0 0.4 1.6 0.1
Deposits-to-Gross Loan Portfolio 71.7% 128.7% 6.7% 171.3% 79.9% 110.6%
Deposits-to-Total Assets 46.9% 74.5% 2.2% 79.3% 50.7% 71.7%
Cost of Funds 6.6% 4.2% 1.0% 5.8% 6.5% 8.7%
Gross Loan Portfolio-to-Total Assets 65.4% 57.9% 32.7% 46.3% 63.5% 64.8%
*Below market rate
MFBAMFB WASEELA U-Bank ADVANS Sub
Total Assets 5,670,479 4,895,126 2,270,922 562,748 97,226,665
Total Equity 1,055,023 1,000,336 1,048,056 486,568 18,327,658
Total Debt - - - - 10,893,373
- Subsidized debt* - - - - 2,964,121
- Commercial debt - - - - 7,929,252
Total Deposits 4,546,697 3,195,568 1,065,316 14,627 60,028,340
Total Liabilities 4,615,456 3,894,790 1,222,866 76,180 78,899,007
Gross loan portfolio 2,654,416 1,350,315 919,381 201,748 55,351,881
weighted avg.
Equity-to-asset ratio 18.6% 20.4% 46.2% 86.5% 18.9%
Commercial liabilities-to-total debt 0.0% 0.0% 0.0% 0.0% 72.8%
*Below market rate
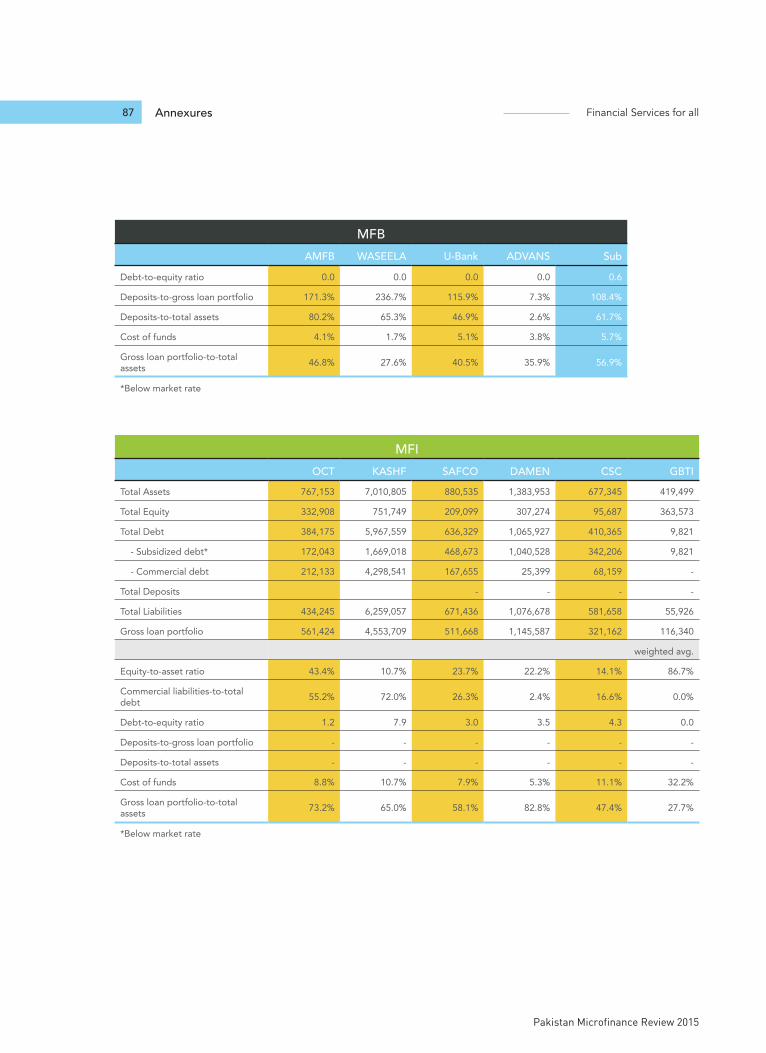
Annexures Financial Services for all
Pakistan Microfinance Review 2015
87
MFBAMFB WASEELA U-Bank ADVANS Sub
Debt-to-equity ratio 0.0 0.0 0.0 0.0 0.6
Deposits-to-gross loan portfolio 171.3% 236.7% 115.9% 7.3% 108.4%
Deposits-to-total assets 80.2% 65.3% 46.9% 2.6% 61.7%
Cost of funds 4.1% 1.7% 5.1% 3.8% 5.7%
Gross loan portfolio-to-total assets 46.8% 27.6% 40.5% 35.9% 56.9%
*Below market rate
MFIOCT KASHF SAFCO DAMEN CSC GBTI
Total Assets 767,153 7,010,805 880,535 1,383,953 677,345 419,499
Total Equity 332,908 751,749 209,099 307,274 95,687 363,573
Total Debt 384,175 5,967,559 636,329 1,065,927 410,365 9,821
- Subsidized debt* 172,043 1,669,018 468,673 1,040,528 342,206 9,821
- Commercial debt 212,133 4,298,541 167,655 25,399 68,159 -
Total Deposits - - - -
Total Liabilities 434,245 6,259,057 671,436 1,076,678 581,658 55,926
Gross loan portfolio 561,424 4,553,709 511,668 1,145,587 321,162 116,340
weighted avg.
Equity-to-asset ratio 43.4% 10.7% 23.7% 22.2% 14.1% 86.7%
Commercial liabilities-to-total debt 55.2% 72.0% 26.3% 2.4% 16.6% 0.0%
Debt-to-equity ratio 1.2 7.9 3.0 3.5 4.3 0.0
Deposits-to-gross loan portfolio - - - - - -
Deposits-to-total assets - - - - - -
Cost of funds 8.8% 10.7% 7.9% 5.3% 11.1% 32.2%
Gross loan portfolio-to-total assets 73.2% 65.0% 58.1% 82.8% 47.4% 27.7%
*Below market rate
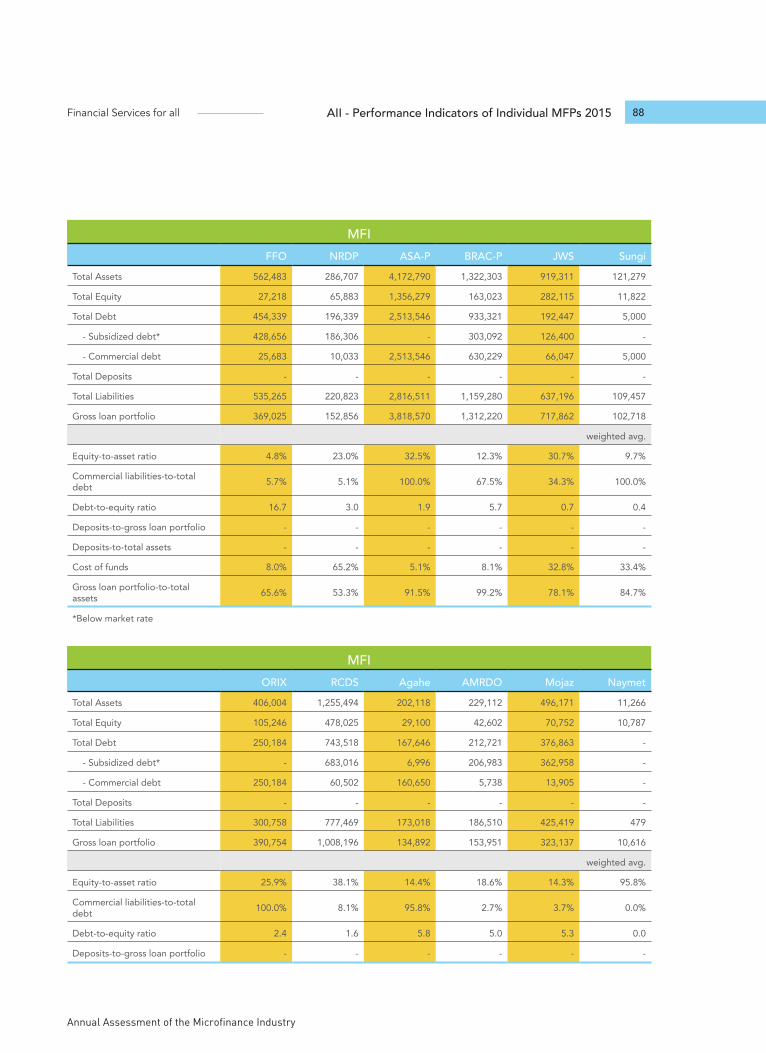
Annual Assessment of the Microfinance Industry
Financial Services for all 88AII - Performance Indicators of Individual MFPs 2015
MFIFFO NRDP ASA-P BRAC-P JWS Sungi
Total Assets 562,483 286,707 4,172,790 1,322,303 919,311 121,279
Total Equity 27,218 65,883 1,356,279 163,023 282,115 11,822
Total Debt 454,339 196,339 2,513,546 933,321 192,447 5,000
- Subsidized debt* 428,656 186,306 - 303,092 126,400 -
- Commercial debt 25,683 10,033 2,513,546 630,229 66,047 5,000
Total Deposits - - - - - -
Total Liabilities 535,265 220,823 2,816,511 1,159,280 637,196 109,457
Gross loan portfolio 369,025 152,856 3,818,570 1,312,220 717,862 102,718
weighted avg.
Equity-to-asset ratio 4.8% 23.0% 32.5% 12.3% 30.7% 9.7%
Commercial liabilities-to-total debt 5.7% 5.1% 100.0% 67.5% 34.3% 100.0%
Debt-to-equity ratio 16.7 3.0 1.9 5.7 0.7 0.4
Deposits-to-gross loan portfolio - - - - - -
Deposits-to-total assets - - - - - -
Cost of funds 8.0% 65.2% 5.1% 8.1% 32.8% 33.4%
Gross loan portfolio-to-total assets 65.6% 53.3% 91.5% 99.2% 78.1% 84.7%
*Below market rate
MFIORIX RCDS Agahe AMRDO Mojaz Naymet
Total Assets 406,004 1,255,494 202,118 229,112 496,171 11,266
Total Equity 105,246 478,025 29,100 42,602 70,752 10,787
Total Debt 250,184 743,518 167,646 212,721 376,863 -
- Subsidized debt* - 683,016 6,996 206,983 362,958 -
- Commercial debt 250,184 60,502 160,650 5,738 13,905 -
Total Deposits - - - - - -
Total Liabilities 300,758 777,469 173,018 186,510 425,419 479
Gross loan portfolio 390,754 1,008,196 134,892 153,951 323,137 10,616
weighted avg.
Equity-to-asset ratio 25.9% 38.1% 14.4% 18.6% 14.3% 95.8%
Commercial liabilities-to-total debt 100.0% 8.1% 95.8% 2.7% 3.7% 0.0%
Debt-to-equity ratio 2.4 1.6 5.8 5.0 5.3 0.0
Deposits-to-gross loan portfolio - - - - - -
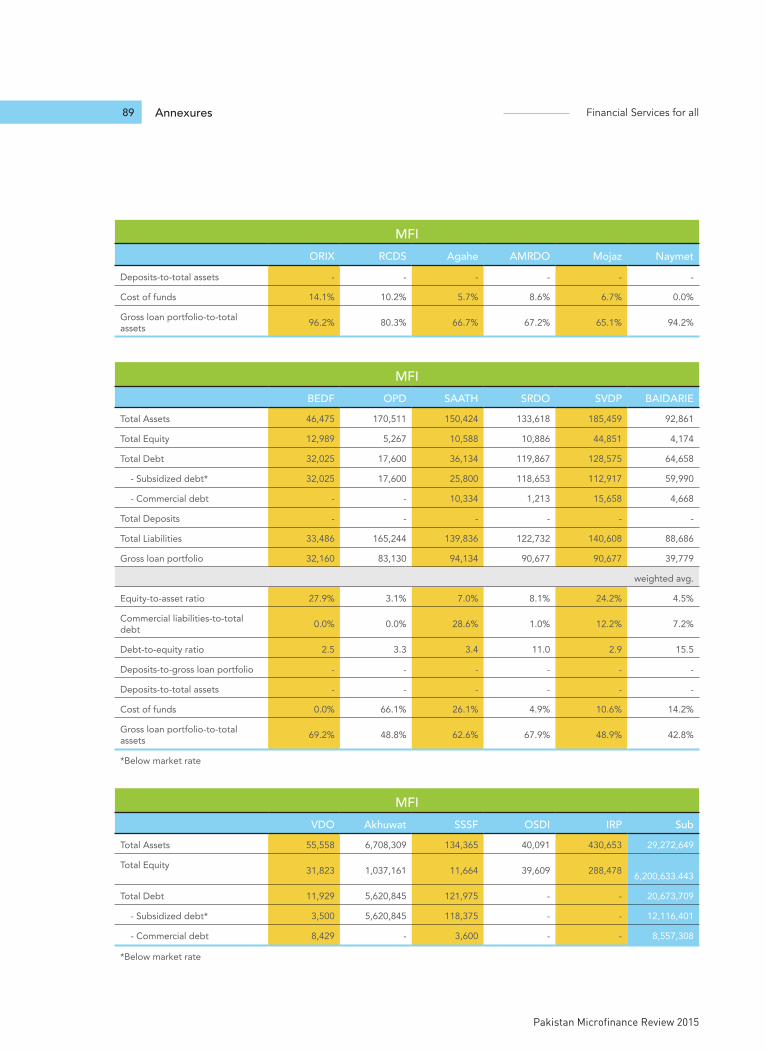
Annexures Financial Services for all
Pakistan Microfinance Review 2015
89
MFIORIX RCDS Agahe AMRDO Mojaz Naymet
Deposits-to-total assets - - - - - -
Cost of funds 14.1% 10.2% 5.7% 8.6% 6.7% 0.0%
Gross loan portfolio-to-total assets 96.2% 80.3% 66.7% 67.2% 65.1% 94.2%
MFIBEDF OPD SAATH SRDO SVDP BAIDARIE
Total Assets 46,475 170,511 150,424 133,618 185,459 92,861
Total Equity 12,989 5,267 10,588 10,886 44,851 4,174
Total Debt 32,025 17,600 36,134 119,867 128,575 64,658
- Subsidized debt* 32,025 17,600 25,800 118,653 112,917 59,990
- Commercial debt - - 10,334 1,213 15,658 4,668
Total Deposits - - - - - -
Total Liabilities 33,486 165,244 139,836 122,732 140,608 88,686
Gross loan portfolio 32,160 83,130 94,134 90,677 90,677 39,779
weighted avg.
Equity-to-asset ratio 27.9% 3.1% 7.0% 8.1% 24.2% 4.5%
Commercial liabilities-to-total debt 0.0% 0.0% 28.6% 1.0% 12.2% 7.2%
Debt-to-equity ratio 2.5 3.3 3.4 11.0 2.9 15.5
Deposits-to-gross loan portfolio - - - - - -
Deposits-to-total assets - - - - - -
Cost of funds 0.0% 66.1% 26.1% 4.9% 10.6% 14.2%
Gross loan portfolio-to-total assets 69.2% 48.8% 62.6% 67.9% 48.9% 42.8%
*Below market rate
MFIVDO Akhuwat SSSF OSDI IRP Sub
Total Assets 55,558 6,708,309 134,365 40,091 430,653 29,272,649
Total Equity 31,823 1,037,161 11,664 39,609 288,478 6,200,633.443
Total Debt 11,929 5,620,845 121,975 - - 20,673,709
- Subsidized debt* 3,500 5,620,845 118,375 - - 12,116,401
- Commercial debt 8,429 - 3,600 - - 8,557,308
*Below market rate
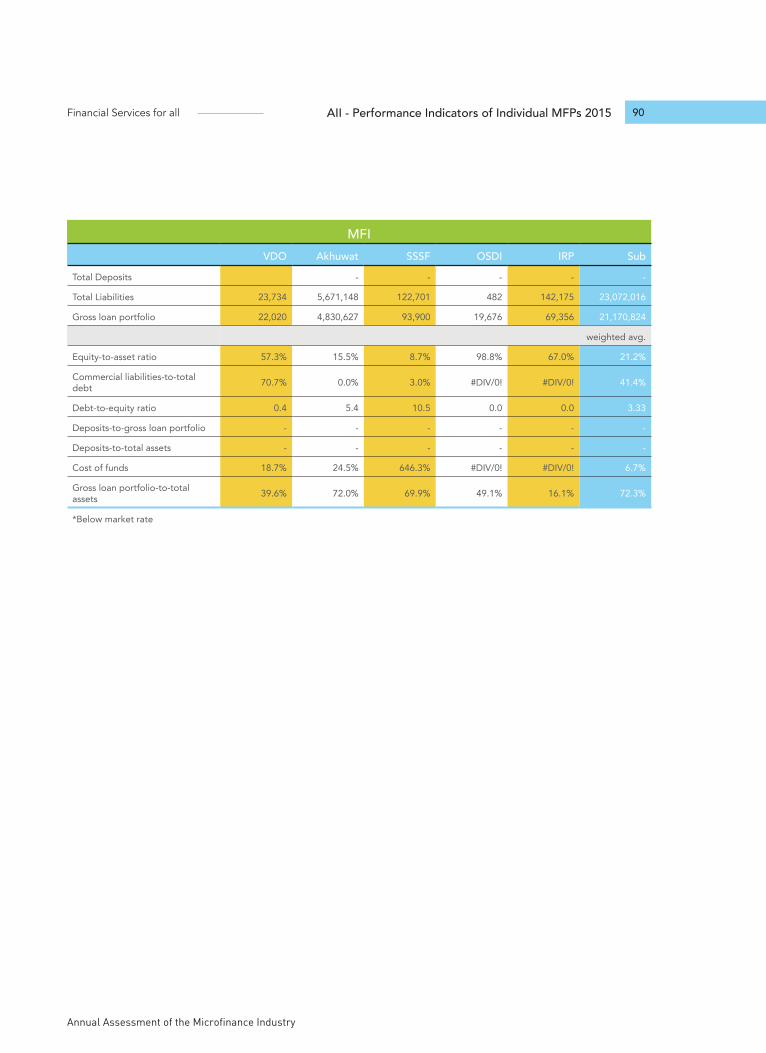
Annual Assessment of the Microfinance Industry
Financial Services for all 90AII - Performance Indicators of Individual MFPs 2015
MFIVDO Akhuwat SSSF OSDI IRP Sub
Total Deposits - - - - -
Total Liabilities 23,734 5,671,148 122,701 482 142,175 23,072,016
Gross loan portfolio 22,020 4,830,627 93,900 19,676 69,356 21,170,824
weighted avg.
Equity-to-asset ratio 57.3% 15.5% 8.7% 98.8% 67.0% 21.2%
Commercial liabilities-to-total debt 70.7% 0.0% 3.0% #DIV/0! #DIV/0! 41.4%
Debt-to-equity ratio 0.4 5.4 10.5 0.0 0.0 3.33
Deposits-to-gross loan portfolio - - - - - -
Deposits-to-total assets - - - - - -
Cost of funds 18.7% 24.5% 646.3% #DIV/0! #DIV/0! 6.7%
Gross loan portfolio-to-total assets 39.6% 72.0% 69.9% 49.1% 16.1% 72.3%
*Below market rate
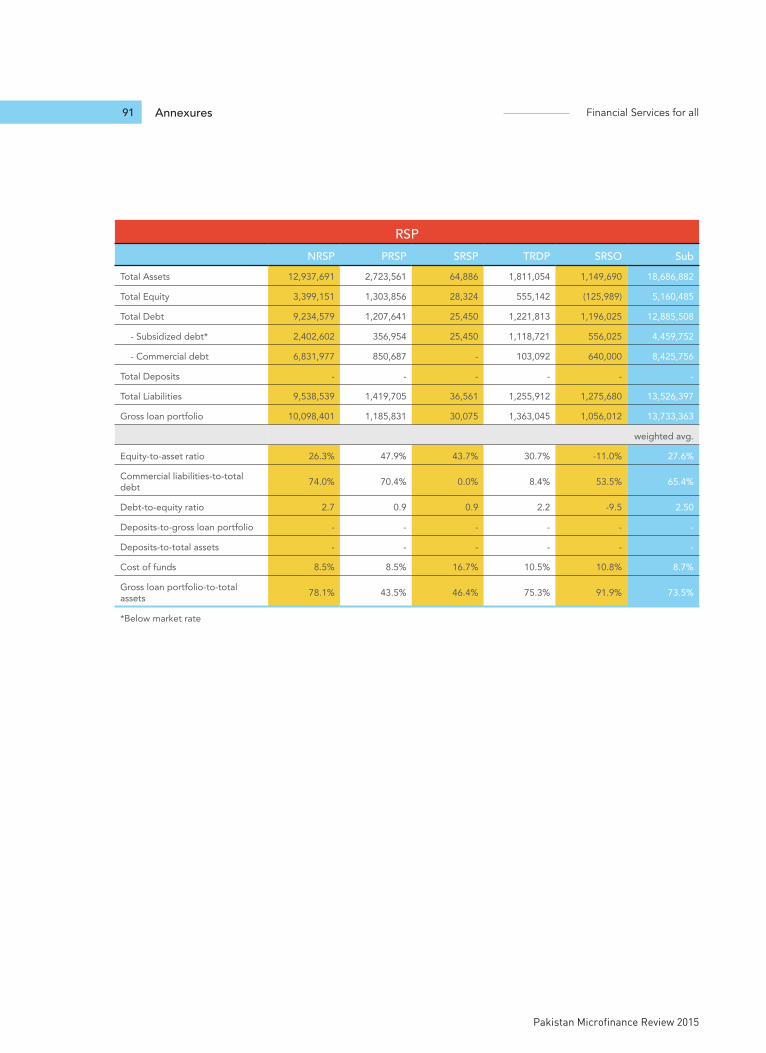
Annexures Financial Services for all
Pakistan Microfinance Review 2015
91
RSPNRSP PRSP SRSP TRDP SRSO Sub
Total Assets 12,937,691 2,723,561 64,886 1,811,054 1,149,690 18,686,882
Total Equity 3,399,151 1,303,856 28,324 555,142 (125,989) 5,160,485
Total Debt 9,234,579 1,207,641 25,450 1,221,813 1,196,025 12,885,508
- Subsidized debt* 2,402,602 356,954 25,450 1,118,721 556,025 4,459,752
- Commercial debt 6,831,977 850,687 - 103,092 640,000 8,425,756
Total Deposits - - - - - -
Total Liabilities 9,538,539 1,419,705 36,561 1,255,912 1,275,680 13,526,397
Gross loan portfolio 10,098,401 1,185,831 30,075 1,363,045 1,056,012 13,733,363
weighted avg.
Equity-to-asset ratio 26.3% 47.9% 43.7% 30.7% -11.0% 27.6%
Commercial liabilities-to-total debt 74.0% 70.4% 0.0% 8.4% 53.5% 65.4%
Debt-to-equity ratio 2.7 0.9 0.9 2.2 -9.5 2.50
Deposits-to-gross loan portfolio - - - - - -
Deposits-to-total assets - - - - - -
Cost of funds 8.5% 8.5% 16.7% 10.5% 10.8% 8.7%
Gross loan portfolio-to-total assets 78.1% 43.5% 46.4% 75.3% 91.9% 73.5%
*Below market rate
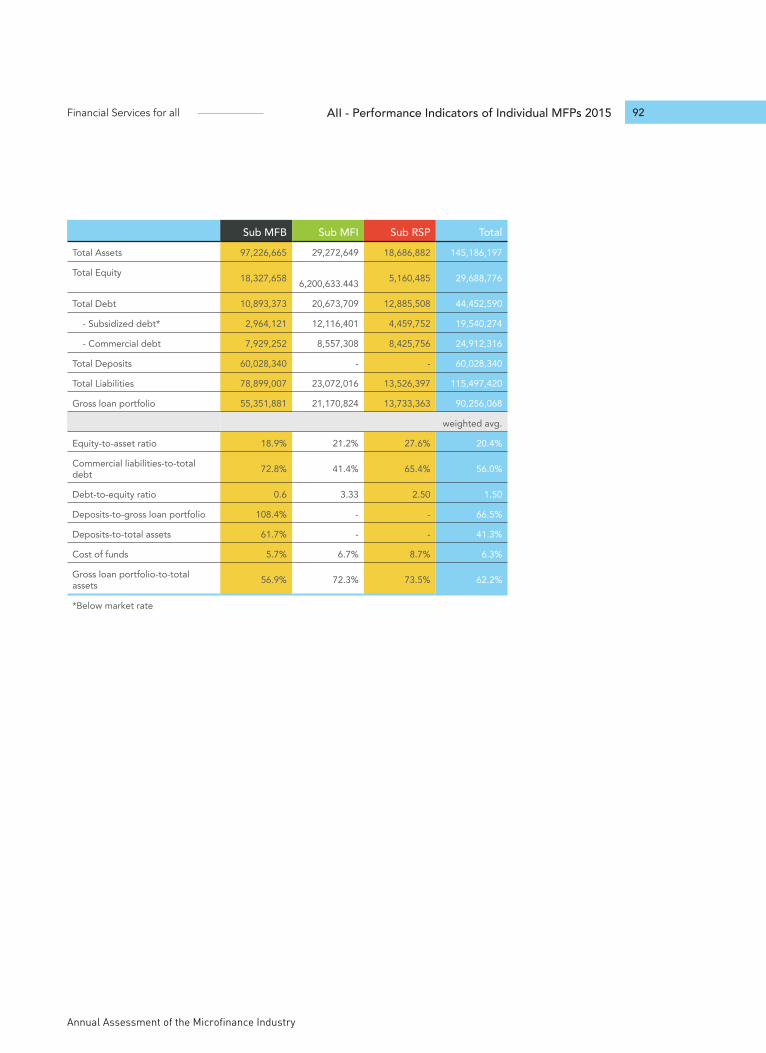
Annual Assessment of the Microfinance Industry
Financial Services for all 92AII - Performance Indicators of Individual MFPs 2015
Sub MFB Sub MFI Sub RSP TotalTotal Assets 97,226,665 29,272,649 18,686,882 145,186,197
Total Equity 18,327,658 6,200,633.443 5,160,485 29,688,776
Total Debt 10,893,373 20,673,709 12,885,508 44,452,590
- Subsidized debt* 2,964,121 12,116,401 4,459,752 19,540,274
- Commercial debt 7,929,252 8,557,308 8,425,756 24,912,316
Total Deposits 60,028,340 - - 60,028,340
Total Liabilities 78,899,007 23,072,016 13,526,397 115,497,420
Gross loan portfolio 55,351,881 21,170,824 13,733,363 90,256,068
weighted avg.
Equity-to-asset ratio 18.9% 21.2% 27.6% 20.4%
Commercial liabilities-to-total debt 72.8% 41.4% 65.4% 56.0%
Debt-to-equity ratio 0.6 3.33 2.50 1.50
Deposits-to-gross loan portfolio 108.4% - - 66.5%
Deposits-to-total assets 61.7% - - 41.3%
Cost of funds 5.7% 6.7% 8.7% 6.3%
Gross loan portfolio-to-total assets 56.9% 72.3% 73.5% 62.2%
*Below market rate

Annexures Financial Services for all
Pakistan Microfinance Review 2015
93
Outreach
MFBKBL TMFB POMFB FMFB NRSP-B FINCA
Active Borrowers 520,743 287,285 16,334 177,228 258,444 89,550
Active Women Borrowers 130,941 99,724 7,940 61,991 27,749 4,326
Gross Loan Portfolio (PKR 000) 17,466,883 12,186,090 369,038 5,639,743 9,085,508 5,478,758
Annual Per Capita Income (PKR) 153,060 153,060 153,060 153,060 153,060 153,060
Number of Loans Outstanding 520,743 287,285 16,334 177,228 258,444 89,550
Depositors 1,128,901 4,958,736 17,235 296,248 515,321 382,031
Number of Deposit Accounts 1,128,901 4,958,736 17,235 296,248 515,321 382,031
Number of Women Depositors 277,809 2,218,427 11,757 80,767 67,093 15,024
Deposits Outstanding (PKR 000) 12,528,979 15,678,540 24,845 9,661,088 7,255,316 6,057,364
weighted avg.
Proportion of Active Women Borrowers (%) 25.1% 34.7% 48.6% 35.0% 10.7% 4.8%
Average Loan Balance per Active Borrower (PKR) 33,542 42,418 22,593 31,822 35,155 61,181
Average Loan Balance per Active Borrower/Per Capita Income 21.9% 27.7% 14.8% 20.8% 23.0% 40.0%
Average Outstanding Loan Balance (PKR) 33,542 42,418 22,593 31,822 35,155 61,181
Average Outstanding Loan Bal-ance/Per Capita Income 21.9% 27.7% 14.8% 20.8% 23.0% 40.0%
Proportion of Active Women Depositors (%) 24.6% 44.7% 68.2% 27.3% 13.0% 3.9%
Average Saving Balance per Active Depositor (PKR) 11,098 3,162 1,442 32,611 14,079 15,856
Active Deposit Account Balance (PKR) 11,098 3,162 1,442 32,611 14,079 15,856
MFBAMFB WASEELA U-Bank ADVANS Sub
Active Borrowers 21,614 27,218 22,254 2,972 1,423,642
Active Women Borrowers 3,545 3,244 3,272 666 343,398
Gross Loan Portfolio (PKR 000) 2,654,416 1,350,315 919,381 201,748 55,351,881
Annual Per Capita Income (PKR) 153,060 153,060 153,060 153,060 153,060
Number of Loans outstanding 21,614 27,218 22,254 2,972 1,423,642
Depositors 76,925 3,126,752 153,039 6,178 10,661,366
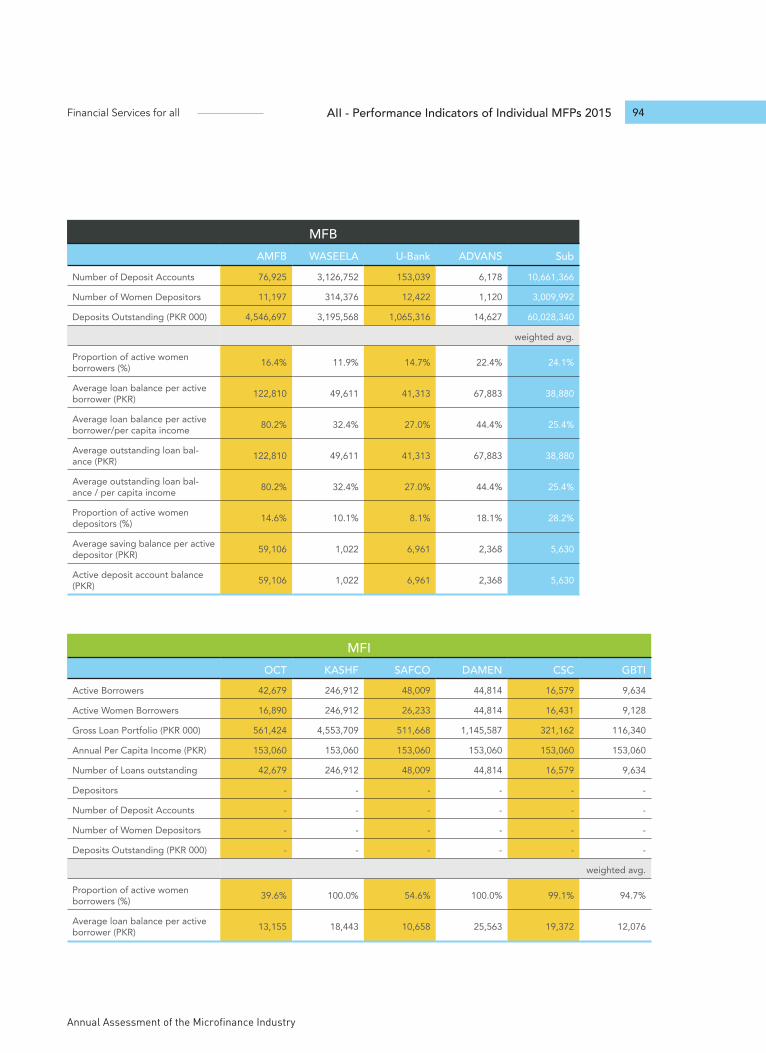
Annual Assessment of the Microfinance Industry
Financial Services for all 94AII - Performance Indicators of Individual MFPs 2015
MFBAMFB WASEELA U-Bank ADVANS Sub
Number of Deposit Accounts 76,925 3,126,752 153,039 6,178 10,661,366
Number of Women Depositors 11,197 314,376 12,422 1,120 3,009,992
Deposits Outstanding (PKR 000) 4,546,697 3,195,568 1,065,316 14,627 60,028,340
weighted avg.
Proportion of active women borrowers (%) 16.4% 11.9% 14.7% 22.4% 24.1%
Average loan balance per active borrower (PKR) 122,810 49,611 41,313 67,883 38,880
Average loan balance per active borrower/per capita income 80.2% 32.4% 27.0% 44.4% 25.4%
Average outstanding loan bal-ance (PKR) 122,810 49,611 41,313 67,883 38,880
Average outstanding loan bal-ance / per capita income 80.2% 32.4% 27.0% 44.4% 25.4%
Proportion of active women depositors (%) 14.6% 10.1% 8.1% 18.1% 28.2%
Average saving balance per active depositor (PKR) 59,106 1,022 6,961 2,368 5,630
Active deposit account balance (PKR) 59,106 1,022 6,961 2,368 5,630
MFIOCT KASHF SAFCO DAMEN CSC GBTI
Active Borrowers 42,679 246,912 48,009 44,814 16,579 9,634
Active Women Borrowers 16,890 246,912 26,233 44,814 16,431 9,128
Gross Loan Portfolio (PKR 000) 561,424 4,553,709 511,668 1,145,587 321,162 116,340
Annual Per Capita Income (PKR) 153,060 153,060 153,060 153,060 153,060 153,060
Number of Loans outstanding 42,679 246,912 48,009 44,814 16,579 9,634
Depositors - - - - - -
Number of Deposit Accounts - - - - - -
Number of Women Depositors - - - - - -
Deposits Outstanding (PKR 000) - - - - - -
weighted avg.
Proportion of active women borrowers (%) 39.6% 100.0% 54.6% 100.0% 99.1% 94.7%
Average loan balance per active borrower (PKR) 13,155 18,443 10,658 25,563 19,372 12,076
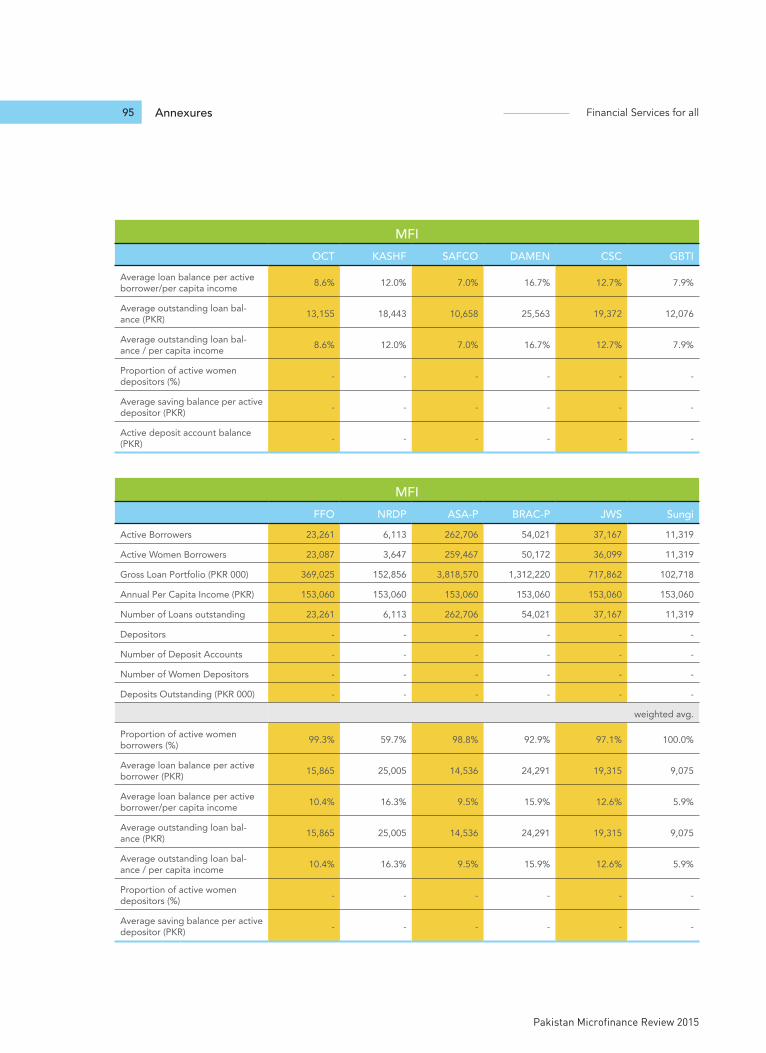
Annexures Financial Services for all
Pakistan Microfinance Review 2015
95
MFIOCT KASHF SAFCO DAMEN CSC GBTI
Average loan balance per active borrower/per capita income 8.6% 12.0% 7.0% 16.7% 12.7% 7.9%
Average outstanding loan bal-ance (PKR) 13,155 18,443 10,658 25,563 19,372 12,076
Average outstanding loan bal-ance / per capita income 8.6% 12.0% 7.0% 16.7% 12.7% 7.9%
Proportion of active women depositors (%) - - - - - -
Average saving balance per active depositor (PKR) - - - - - -
Active deposit account balance (PKR) - - - - - -
MFIFFO NRDP ASA-P BRAC-P JWS Sungi
Active Borrowers 23,261 6,113 262,706 54,021 37,167 11,319
Active Women Borrowers 23,087 3,647 259,467 50,172 36,099 11,319
Gross Loan Portfolio (PKR 000) 369,025 152,856 3,818,570 1,312,220 717,862 102,718
Annual Per Capita Income (PKR) 153,060 153,060 153,060 153,060 153,060 153,060
Number of Loans outstanding 23,261 6,113 262,706 54,021 37,167 11,319
Depositors - - - - - -
Number of Deposit Accounts - - - - - -
Number of Women Depositors - - - - - -
Deposits Outstanding (PKR 000) - - - - - -
weighted avg.
Proportion of active women borrowers (%) 99.3% 59.7% 98.8% 92.9% 97.1% 100.0%
Average loan balance per active borrower (PKR) 15,865 25,005 14,536 24,291 19,315 9,075
Average loan balance per active borrower/per capita income 10.4% 16.3% 9.5% 15.9% 12.6% 5.9%
Average outstanding loan bal-ance (PKR) 15,865 25,005 14,536 24,291 19,315 9,075
Average outstanding loan bal-ance / per capita income 10.4% 16.3% 9.5% 15.9% 12.6% 5.9%
Proportion of active women depositors (%) - - - - - -
Average saving balance per active depositor (PKR) - - - - - -
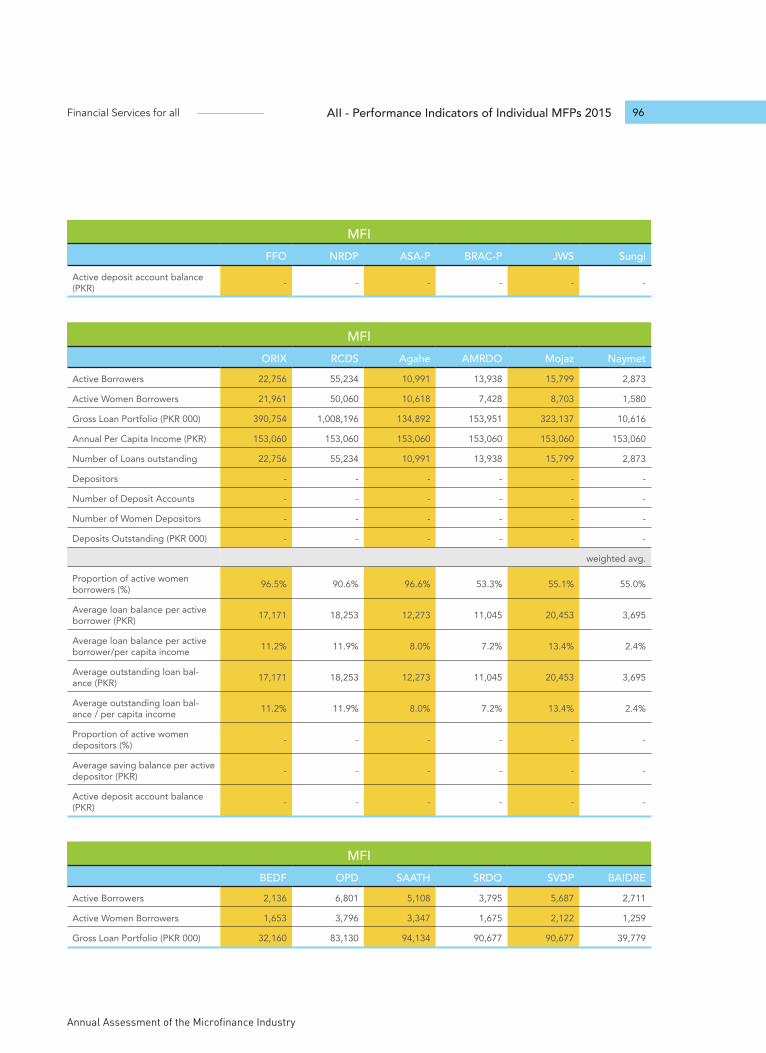
Annual Assessment of the Microfinance Industry
Financial Services for all 96AII - Performance Indicators of Individual MFPs 2015
MFIFFO NRDP ASA-P BRAC-P JWS Sungi
Active deposit account balance (PKR) - - - - - -
MFIORIX RCDS Agahe AMRDO Mojaz Naymet
Active Borrowers 22,756 55,234 10,991 13,938 15,799 2,873
Active Women Borrowers 21,961 50,060 10,618 7,428 8,703 1,580
Gross Loan Portfolio (PKR 000) 390,754 1,008,196 134,892 153,951 323,137 10,616
Annual Per Capita Income (PKR) 153,060 153,060 153,060 153,060 153,060 153,060
Number of Loans outstanding 22,756 55,234 10,991 13,938 15,799 2,873
Depositors - - - - - -
Number of Deposit Accounts - - - - - -
Number of Women Depositors - - - - - -
Deposits Outstanding (PKR 000) - - - - - -
weighted avg.
Proportion of active women borrowers (%) 96.5% 90.6% 96.6% 53.3% 55.1% 55.0%
Average loan balance per active borrower (PKR) 17,171 18,253 12,273 11,045 20,453 3,695
Average loan balance per active borrower/per capita income 11.2% 11.9% 8.0% 7.2% 13.4% 2.4%
Average outstanding loan bal-ance (PKR) 17,171 18,253 12,273 11,045 20,453 3,695
Average outstanding loan bal-ance / per capita income 11.2% 11.9% 8.0% 7.2% 13.4% 2.4%
Proportion of active women depositors (%) - - - - - -
Average saving balance per active depositor (PKR) - - - - - -
Active deposit account balance (PKR) - - - - - -
MFIBEDF OPD SAATH SRDO SVDP BAIDRE
Active Borrowers 2,136 6,801 5,108 3,795 5,687 2,711
Active Women Borrowers 1,653 3,796 3,347 1,675 2,122 1,259
Gross Loan Portfolio (PKR 000) 32,160 83,130 94,134 90,677 90,677 39,779
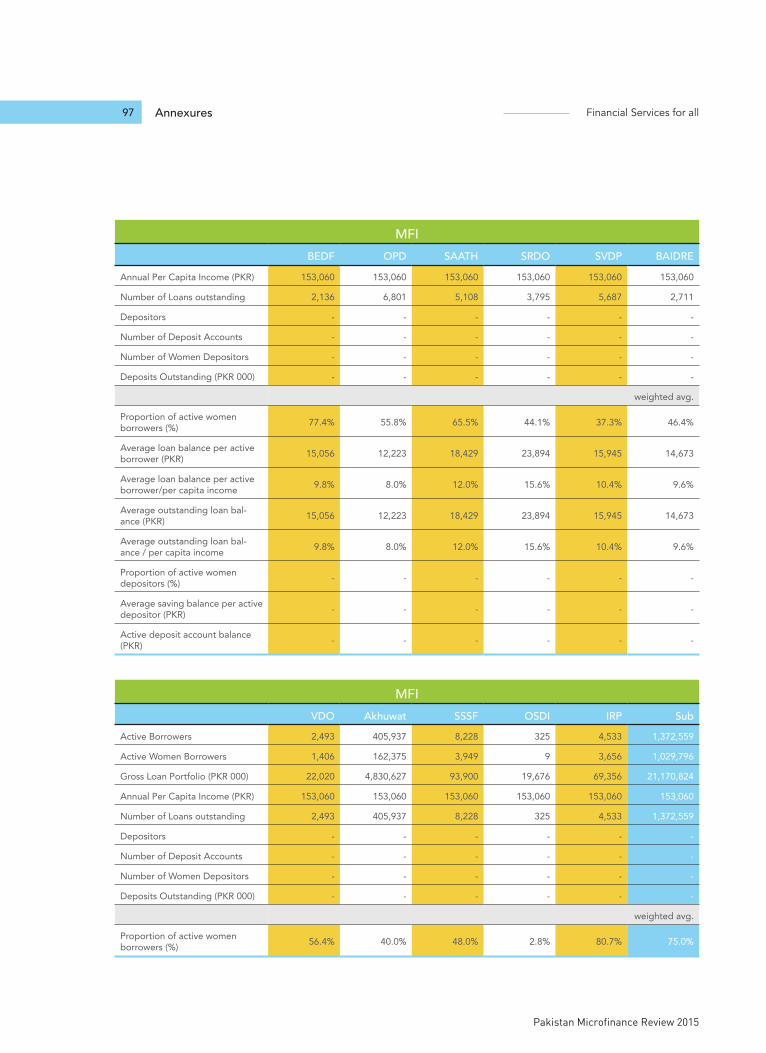
Annexures Financial Services for all
Pakistan Microfinance Review 2015
97
MFIBEDF OPD SAATH SRDO SVDP BAIDRE
Annual Per Capita Income (PKR) 153,060 153,060 153,060 153,060 153,060 153,060
Number of Loans outstanding 2,136 6,801 5,108 3,795 5,687 2,711
Depositors - - - - - -
Number of Deposit Accounts - - - - - -
Number of Women Depositors - - - - - -
Deposits Outstanding (PKR 000) - - - - - -
weighted avg.
Proportion of active women borrowers (%) 77.4% 55.8% 65.5% 44.1% 37.3% 46.4%
Average loan balance per active borrower (PKR) 15,056 12,223 18,429 23,894 15,945 14,673
Average loan balance per active borrower/per capita income 9.8% 8.0% 12.0% 15.6% 10.4% 9.6%
Average outstanding loan bal-ance (PKR) 15,056 12,223 18,429 23,894 15,945 14,673
Average outstanding loan bal-ance / per capita income 9.8% 8.0% 12.0% 15.6% 10.4% 9.6%
Proportion of active women depositors (%) - - - - - -
Average saving balance per active depositor (PKR) - - - - - -
Active deposit account balance (PKR) - - - - - -
MFIVDO Akhuwat SSSF OSDI IRP Sub
Active Borrowers 2,493 405,937 8,228 325 4,533 1,372,559
Active Women Borrowers 1,406 162,375 3,949 9 3,656 1,029,796
Gross Loan Portfolio (PKR 000) 22,020 4,830,627 93,900 19,676 69,356 21,170,824
Annual Per Capita Income (PKR) 153,060 153,060 153,060 153,060 153,060 153,060
Number of Loans outstanding 2,493 405,937 8,228 325 4,533 1,372,559
Depositors - - - - - -
Number of Deposit Accounts - - - - - -
Number of Women Depositors - - - - - -
Deposits Outstanding (PKR 000) - - - - - -
weighted avg.
Proportion of active women borrowers (%) 56.4% 40.0% 48.0% 2.8% 80.7% 75.0%
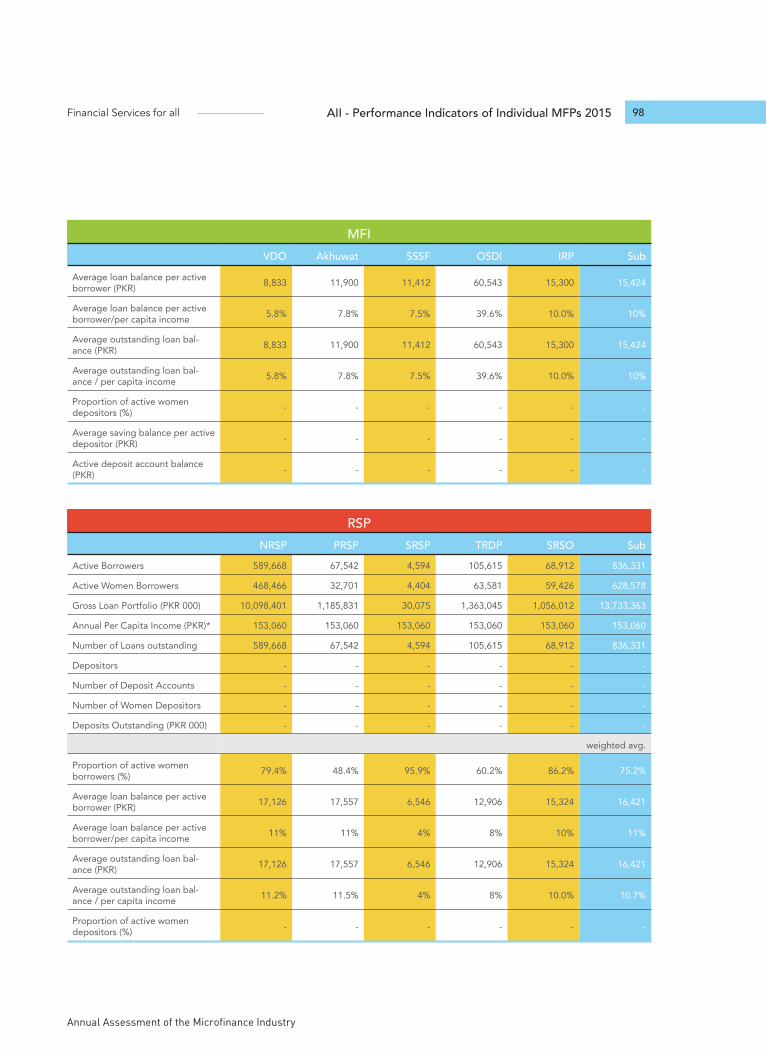
Annual Assessment of the Microfinance Industry
Financial Services for all 98AII - Performance Indicators of Individual MFPs 2015
MFIVDO Akhuwat SSSF OSDI IRP Sub
Average loan balance per active borrower (PKR) 8,833 11,900 11,412 60,543 15,300 15,424
Average loan balance per active borrower/per capita income 5.8% 7.8% 7.5% 39.6% 10.0% 10%
Average outstanding loan bal-ance (PKR) 8,833 11,900 11,412 60,543 15,300 15,424
Average outstanding loan bal-ance / per capita income 5.8% 7.8% 7.5% 39.6% 10.0% 10%
Proportion of active women depositors (%) - - - - - -
Average saving balance per active depositor (PKR) - - - - - -
Active deposit account balance (PKR) - - - - - -
RSPNRSP PRSP SRSP TRDP SRSO Sub
Active Borrowers 589,668 67,542 4,594 105,615 68,912 836,331
Active Women Borrowers 468,466 32,701 4,404 63,581 59,426 628,578
Gross Loan Portfolio (PKR 000) 10,098,401 1,185,831 30,075 1,363,045 1,056,012 13,733,363
Annual Per Capita Income (PKR)* 153,060 153,060 153,060 153,060 153,060 153,060
Number of Loans outstanding 589,668 67,542 4,594 105,615 68,912 836,331
Depositors - - - - - -
Number of Deposit Accounts - - - - - -
Number of Women Depositors - - - - - -
Deposits Outstanding (PKR 000) - - - - - -
weighted avg.
Proportion of active women borrowers (%) 79.4% 48.4% 95.9% 60.2% 86.2% 75.2%
Average loan balance per active borrower (PKR) 17,126 17,557 6,546 12,906 15,324 16,421
Average loan balance per active borrower/per capita income 11% 11% 4% 8% 10% 11%
Average outstanding loan bal-ance (PKR) 17,126 17,557 6,546 12,906 15,324 16,421
Average outstanding loan bal-ance / per capita income 11.2% 11.5% 4% 8% 10.0% 10.7%
Proportion of active women depositors (%) - - - - - -
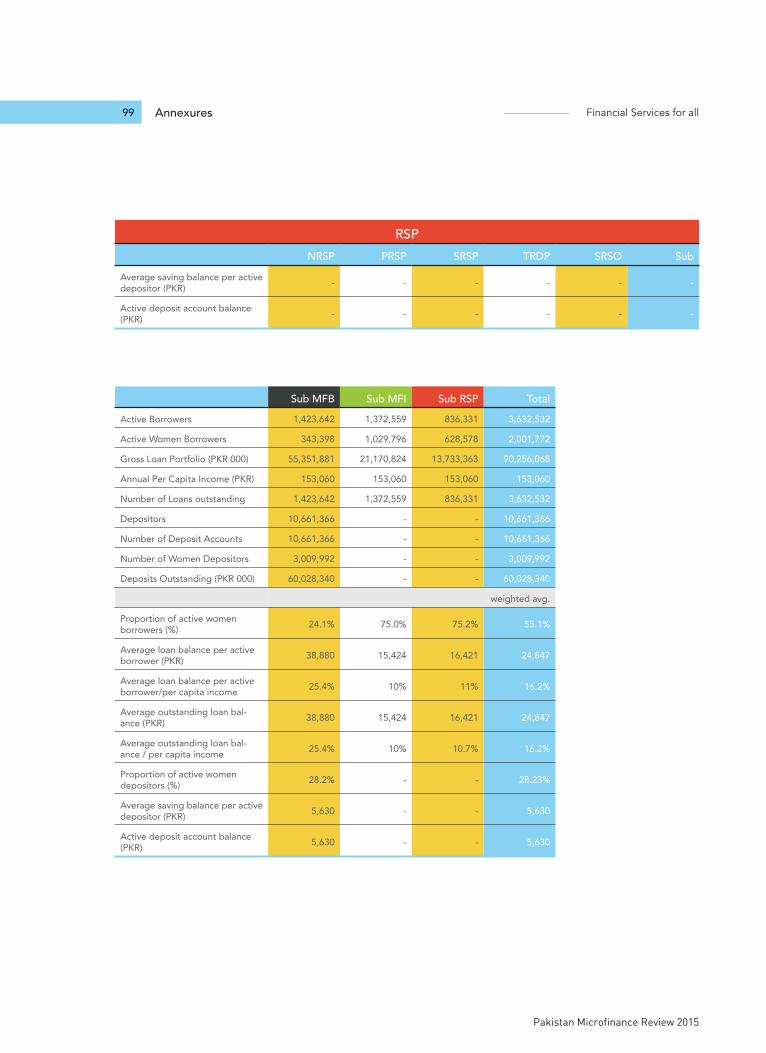
Annexures Financial Services for all
Pakistan Microfinance Review 2015
99
RSPNRSP PRSP SRSP TRDP SRSO Sub
Average saving balance per active depositor (PKR) - - - - - -
Active deposit account balance (PKR) - - - - - -
Sub MFB Sub MFI Sub RSP TotalActive Borrowers 1,423,642 1,372,559 836,331 3,632,532
Active Women Borrowers 343,398 1,029,796 628,578 2,001,772
Gross Loan Portfolio (PKR 000) 55,351,881 21,170,824 13,733,363 90,256,068
Annual Per Capita Income (PKR) 153,060 153,060 153,060 153,060
Number of Loans outstanding 1,423,642 1,372,559 836,331 3,632,532
Depositors 10,661,366 - - 10,661,366
Number of Deposit Accounts 10,661,366 - - 10,661,366
Number of Women Depositors 3,009,992 - - 3,009,992
Deposits Outstanding (PKR 000) 60,028,340 - - 60,028,340
weighted avg.
Proportion of active women borrowers (%) 24.1% 75.0% 75.2% 55.1%
Average loan balance per active borrower (PKR) 38,880 15,424 16,421 24,847
Average loan balance per active borrower/per capita income 25.4% 10% 11% 16.2%
Average outstanding loan bal-ance (PKR) 38,880 15,424 16,421 24,847
Average outstanding loan bal-ance / per capita income 25.4% 10% 10.7% 16.2%
Proportion of active women depositors (%) 28.2% - - 28.23%
Average saving balance per active depositor (PKR) 5,630 - - 5,630
Active deposit account balance (PKR) 5,630 - - 5,630
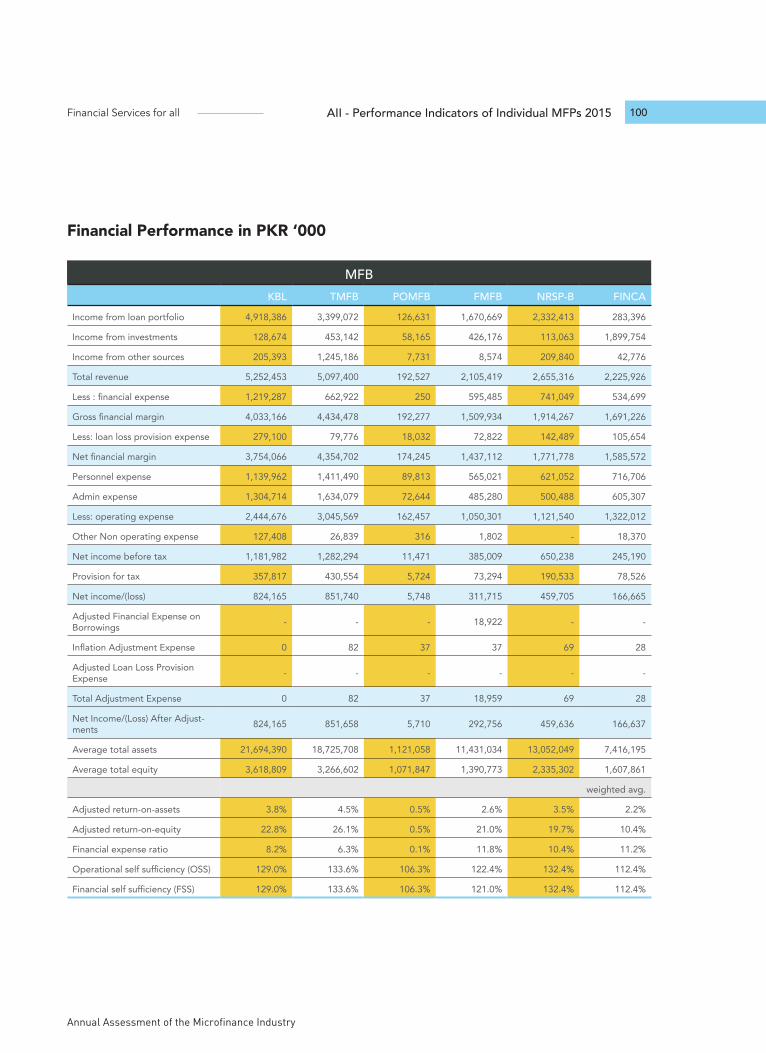
Annual Assessment of the Microfinance Industry
Financial Services for all 100AII - Performance Indicators of Individual MFPs 2015
Financial Performance in PKR ‘000
MFBKBL TMFB POMFB FMFB NRSP-B FINCA
Income from loan portfolio 4,918,386 3,399,072 126,631 1,670,669 2,332,413 283,396
Income from investments 128,674 453,142 58,165 426,176 113,063 1,899,754
Income from other sources 205,393 1,245,186 7,731 8,574 209,840 42,776
Total revenue 5,252,453 5,097,400 192,527 2,105,419 2,655,316 2,225,926
Less : financial expense 1,219,287 662,922 250 595,485 741,049 534,699
Gross financial margin 4,033,166 4,434,478 192,277 1,509,934 1,914,267 1,691,226
Less: loan loss provision expense 279,100 79,776 18,032 72,822 142,489 105,654
Net financial margin 3,754,066 4,354,702 174,245 1,437,112 1,771,778 1,585,572
Personnel expense 1,139,962 1,411,490 89,813 565,021 621,052 716,706
Admin expense 1,304,714 1,634,079 72,644 485,280 500,488 605,307
Less: operating expense 2,444,676 3,045,569 162,457 1,050,301 1,121,540 1,322,012
Other Non operating expense 127,408 26,839 316 1,802 - 18,370
Net income before tax 1,181,982 1,282,294 11,471 385,009 650,238 245,190
Provision for tax 357,817 430,554 5,724 73,294 190,533 78,526
Net income/(loss) 824,165 851,740 5,748 311,715 459,705 166,665
Adjusted Financial Expense on Borrowings - - - 18,922 - -
Inflation Adjustment Expense 0 82 37 37 69 28
Adjusted Loan Loss Provision Expense - - - - - -
Total Adjustment Expense 0 82 37 18,959 69 28
Net Income/(Loss) After Adjust-ments 824,165 851,658 5,710 292,756 459,636 166,637
Average total assets 21,694,390 18,725,708 1,121,058 11,431,034 13,052,049 7,416,195
Average total equity 3,618,809 3,266,602 1,071,847 1,390,773 2,335,302 1,607,861
weighted avg.
Adjusted return-on-assets 3.8% 4.5% 0.5% 2.6% 3.5% 2.2%
Adjusted return-on-equity 22.8% 26.1% 0.5% 21.0% 19.7% 10.4%
Financial expense ratio 8.2% 6.3% 0.1% 11.8% 10.4% 11.2%
Operational self sufficiency (OSS) 129.0% 133.6% 106.3% 122.4% 132.4% 112.4%
Financial self sufficiency (FSS) 129.0% 133.6% 106.3% 121.0% 132.4% 112.4%
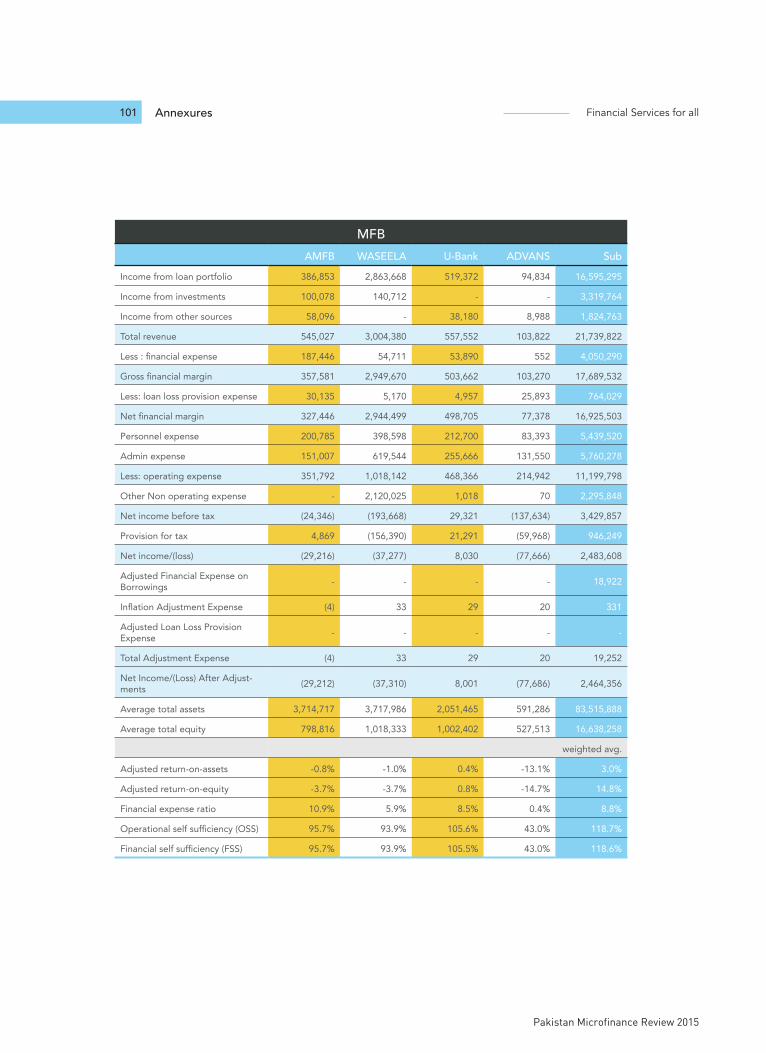
Annexures Financial Services for all
Pakistan Microfinance Review 2015
101
MFBAMFB WASEELA U-Bank ADVANS Sub
Income from loan portfolio 386,853 2,863,668 519,372 94,834 16,595,295
Income from investments 100,078 140,712 - - 3,319,764
Income from other sources 58,096 - 38,180 8,988 1,824,763
Total revenue 545,027 3,004,380 557,552 103,822 21,739,822
Less : financial expense 187,446 54,711 53,890 552 4,050,290
Gross financial margin 357,581 2,949,670 503,662 103,270 17,689,532
Less: loan loss provision expense 30,135 5,170 4,957 25,893 764,029
Net financial margin 327,446 2,944,499 498,705 77,378 16,925,503
Personnel expense 200,785 398,598 212,700 83,393 5,439,520
Admin expense 151,007 619,544 255,666 131,550 5,760,278
Less: operating expense 351,792 1,018,142 468,366 214,942 11,199,798
Other Non operating expense - 2,120,025 1,018 70 2,295,848
Net income before tax (24,346) (193,668) 29,321 (137,634) 3,429,857
Provision for tax 4,869 (156,390) 21,291 (59,968) 946,249
Net income/(loss) (29,216) (37,277) 8,030 (77,666) 2,483,608
Adjusted Financial Expense on Borrowings - - - - 18,922
Inflation Adjustment Expense (4) 33 29 20 331
Adjusted Loan Loss Provision Expense - - - - -
Total Adjustment Expense (4) 33 29 20 19,252
Net Income/(Loss) After Adjust-ments (29,212) (37,310) 8,001 (77,686) 2,464,356
Average total assets 3,714,717 3,717,986 2,051,465 591,286 83,515,888
Average total equity 798,816 1,018,333 1,002,402 527,513 16,638,258
weighted avg.
Adjusted return-on-assets -0.8% -1.0% 0.4% -13.1% 3.0%
Adjusted return-on-equity -3.7% -3.7% 0.8% -14.7% 14.8%
Financial expense ratio 10.9% 5.9% 8.5% 0.4% 8.8%
Operational self sufficiency (OSS) 95.7% 93.9% 105.6% 43.0% 118.7%
Financial self sufficiency (FSS) 95.7% 93.9% 105.5% 43.0% 118.6%
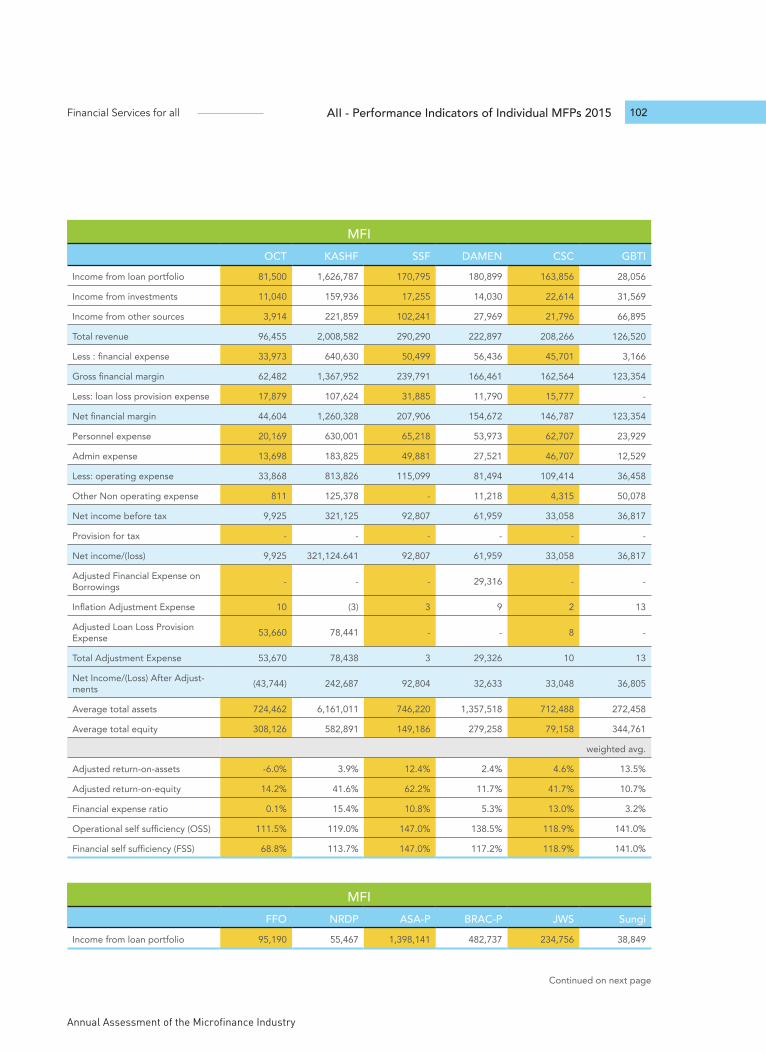
Annual Assessment of the Microfinance Industry
Financial Services for all 102AII - Performance Indicators of Individual MFPs 2015
MFIOCT KASHF SSF DAMEN CSC GBTI
Income from loan portfolio 81,500 1,626,787 170,795 180,899 163,856 28,056
Income from investments 11,040 159,936 17,255 14,030 22,614 31,569
Income from other sources 3,914 221,859 102,241 27,969 21,796 66,895
Total revenue 96,455 2,008,582 290,290 222,897 208,266 126,520
Less : financial expense 33,973 640,630 50,499 56,436 45,701 3,166
Gross financial margin 62,482 1,367,952 239,791 166,461 162,564 123,354
Less: loan loss provision expense 17,879 107,624 31,885 11,790 15,777 -
Net financial margin 44,604 1,260,328 207,906 154,672 146,787 123,354
Personnel expense 20,169 630,001 65,218 53,973 62,707 23,929
Admin expense 13,698 183,825 49,881 27,521 46,707 12,529
Less: operating expense 33,868 813,826 115,099 81,494 109,414 36,458
Other Non operating expense 811 125,378 - 11,218 4,315 50,078
Net income before tax 9,925 321,125 92,807 61,959 33,058 36,817
Provision for tax - - - - - -
Net income/(loss) 9,925 321,124.641 92,807 61,959 33,058 36,817
Adjusted Financial Expense on Borrowings - - - 29,316 - -
Inflation Adjustment Expense 10 (3) 3 9 2 13
Adjusted Loan Loss Provision Expense 53,660 78,441 - - 8 -
Total Adjustment Expense 53,670 78,438 3 29,326 10 13
Net Income/(Loss) After Adjust-ments (43,744) 242,687 92,804 32,633 33,048 36,805
Average total assets 724,462 6,161,011 746,220 1,357,518 712,488 272,458
Average total equity 308,126 582,891 149,186 279,258 79,158 344,761
weighted avg.
Adjusted return-on-assets -6.0% 3.9% 12.4% 2.4% 4.6% 13.5%
Adjusted return-on-equity 14.2% 41.6% 62.2% 11.7% 41.7% 10.7%
Financial expense ratio 0.1% 15.4% 10.8% 5.3% 13.0% 3.2%
Operational self sufficiency (OSS) 111.5% 119.0% 147.0% 138.5% 118.9% 141.0%
Financial self sufficiency (FSS) 68.8% 113.7% 147.0% 117.2% 118.9% 141.0%
MFIFFO NRDP ASA-P BRAC-P JWS Sungi
Income from loan portfolio 95,190 55,467 1,398,141 482,737 234,756 38,849
Continued on next page
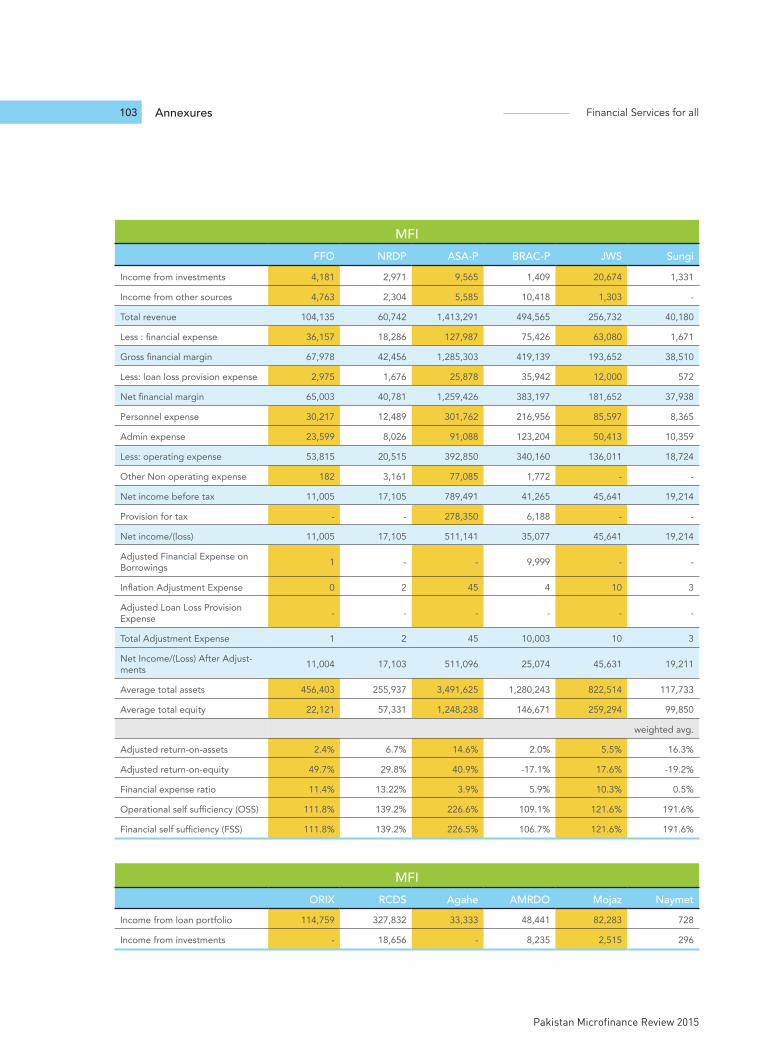
Annexures Financial Services for all
Pakistan Microfinance Review 2015
103
MFIFFO NRDP ASA-P BRAC-P JWS Sungi
Income from investments 4,181 2,971 9,565 1,409 20,674 1,331
Income from other sources 4,763 2,304 5,585 10,418 1,303 -
Total revenue 104,135 60,742 1,413,291 494,565 256,732 40,180
Less : financial expense 36,157 18,286 127,987 75,426 63,080 1,671
Gross financial margin 67,978 42,456 1,285,303 419,139 193,652 38,510
Less: loan loss provision expense 2,975 1,676 25,878 35,942 12,000 572
Net financial margin 65,003 40,781 1,259,426 383,197 181,652 37,938
Personnel expense 30,217 12,489 301,762 216,956 85,597 8,365
Admin expense 23,599 8,026 91,088 123,204 50,413 10,359
Less: operating expense 53,815 20,515 392,850 340,160 136,011 18,724
Other Non operating expense 182 3,161 77,085 1,772 - -
Net income before tax 11,005 17,105 789,491 41,265 45,641 19,214
Provision for tax - - 278,350 6,188 - -
Net income/(loss) 11,005 17,105 511,141 35,077 45,641 19,214
Adjusted Financial Expense on Borrowings 1 - - 9,999 - -
Inflation Adjustment Expense 0 2 45 4 10 3
Adjusted Loan Loss Provision Expense - - - - - -
Total Adjustment Expense 1 2 45 10,003 10 3
Net Income/(Loss) After Adjust-ments 11,004 17,103 511,096 25,074 45,631 19,211
Average total assets 456,403 255,937 3,491,625 1,280,243 822,514 117,733
Average total equity 22,121 57,331 1,248,238 146,671 259,294 99,850
weighted avg.
Adjusted return-on-assets 2.4% 6.7% 14.6% 2.0% 5.5% 16.3%
Adjusted return-on-equity 49.7% 29.8% 40.9% -17.1% 17.6% -19.2%
Financial expense ratio 11.4% 13.22% 3.9% 5.9% 10.3% 0.5%
Operational self sufficiency (OSS) 111.8% 139.2% 226.6% 109.1% 121.6% 191.6%
Financial self sufficiency (FSS) 111.8% 139.2% 226.5% 106.7% 121.6% 191.6%
MFIORIX RCDS Agahe AMRDO Mojaz Naymet
Income from loan portfolio 114,759 327,832 33,333 48,441 82,283 728
Income from investments - 18,656 - 8,235 2,515 296
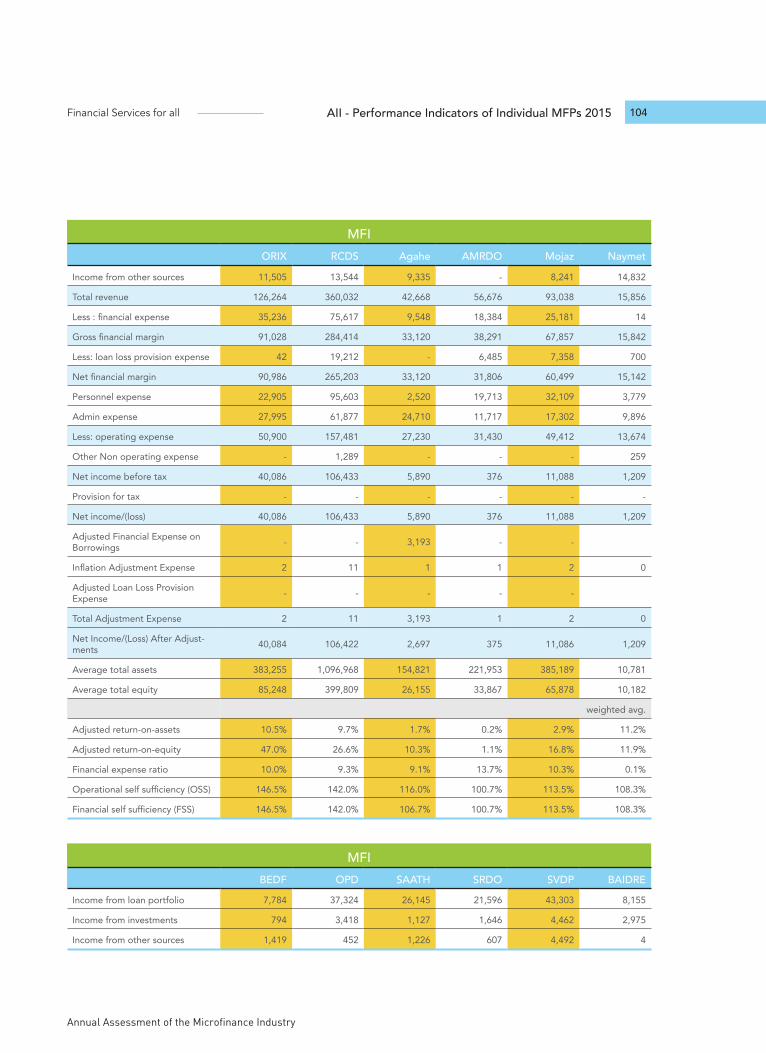
Annual Assessment of the Microfinance Industry
Financial Services for all 104AII - Performance Indicators of Individual MFPs 2015
MFIORIX RCDS Agahe AMRDO Mojaz Naymet
Income from other sources 11,505 13,544 9,335 - 8,241 14,832
Total revenue 126,264 360,032 42,668 56,676 93,038 15,856
Less : financial expense 35,236 75,617 9,548 18,384 25,181 14
Gross financial margin 91,028 284,414 33,120 38,291 67,857 15,842
Less: loan loss provision expense 42 19,212 - 6,485 7,358 700
Net financial margin 90,986 265,203 33,120 31,806 60,499 15,142
Personnel expense 22,905 95,603 2,520 19,713 32,109 3,779
Admin expense 27,995 61,877 24,710 11,717 17,302 9,896
Less: operating expense 50,900 157,481 27,230 31,430 49,412 13,674
Other Non operating expense - 1,289 - - - 259
Net income before tax 40,086 106,433 5,890 376 11,088 1,209
Provision for tax - - - - - -
Net income/(loss) 40,086 106,433 5,890 376 11,088 1,209
Adjusted Financial Expense on Borrowings - - 3,193 - -
Inflation Adjustment Expense 2 11 1 1 2 0
Adjusted Loan Loss Provision Expense - - - - -
Total Adjustment Expense 2 11 3,193 1 2 0
Net Income/(Loss) After Adjust-ments 40,084 106,422 2,697 375 11,086 1,209
Average total assets 383,255 1,096,968 154,821 221,953 385,189 10,781
Average total equity 85,248 399,809 26,155 33,867 65,878 10,182
weighted avg.
Adjusted return-on-assets 10.5% 9.7% 1.7% 0.2% 2.9% 11.2%
Adjusted return-on-equity 47.0% 26.6% 10.3% 1.1% 16.8% 11.9%
Financial expense ratio 10.0% 9.3% 9.1% 13.7% 10.3% 0.1%
Operational self sufficiency (OSS) 146.5% 142.0% 116.0% 100.7% 113.5% 108.3%
Financial self sufficiency (FSS) 146.5% 142.0% 106.7% 100.7% 113.5% 108.3%
MFIBEDF OPD SAATH SRDO SVDP BAIDRE
Income from loan portfolio 7,784 37,324 26,145 21,596 43,303 8,155
Income from investments 794 3,418 1,127 1,646 4,462 2,975
Income from other sources 1,419 452 1,226 607 4,492 4
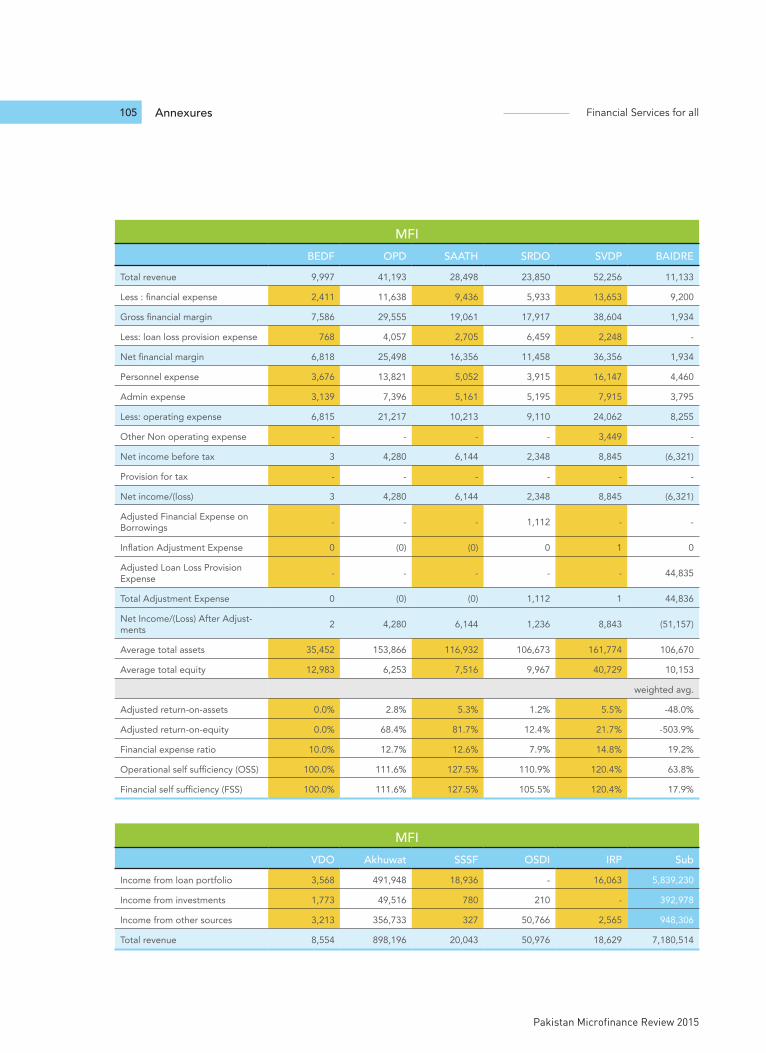
Annexures Financial Services for all
Pakistan Microfinance Review 2015
105
MFIBEDF OPD SAATH SRDO SVDP BAIDRE
Total revenue 9,997 41,193 28,498 23,850 52,256 11,133
Less : financial expense 2,411 11,638 9,436 5,933 13,653 9,200
Gross financial margin 7,586 29,555 19,061 17,917 38,604 1,934
Less: loan loss provision expense 768 4,057 2,705 6,459 2,248 -
Net financial margin 6,818 25,498 16,356 11,458 36,356 1,934
Personnel expense 3,676 13,821 5,052 3,915 16,147 4,460
Admin expense 3,139 7,396 5,161 5,195 7,915 3,795
Less: operating expense 6,815 21,217 10,213 9,110 24,062 8,255
Other Non operating expense - - - - 3,449 -
Net income before tax 3 4,280 6,144 2,348 8,845 (6,321)
Provision for tax - - - - - -
Net income/(loss) 3 4,280 6,144 2,348 8,845 (6,321)
Adjusted Financial Expense on Borrowings - - - 1,112 - -
Inflation Adjustment Expense 0 (0) (0) 0 1 0
Adjusted Loan Loss Provision Expense - - - - - 44,835
Total Adjustment Expense 0 (0) (0) 1,112 1 44,836
Net Income/(Loss) After Adjust-ments 2 4,280 6,144 1,236 8,843 (51,157)
Average total assets 35,452 153,866 116,932 106,673 161,774 106,670
Average total equity 12,983 6,253 7,516 9,967 40,729 10,153
weighted avg.
Adjusted return-on-assets 0.0% 2.8% 5.3% 1.2% 5.5% -48.0%
Adjusted return-on-equity 0.0% 68.4% 81.7% 12.4% 21.7% -503.9%
Financial expense ratio 10.0% 12.7% 12.6% 7.9% 14.8% 19.2%
Operational self sufficiency (OSS) 100.0% 111.6% 127.5% 110.9% 120.4% 63.8%
Financial self sufficiency (FSS) 100.0% 111.6% 127.5% 105.5% 120.4% 17.9%
MFIVDO Akhuwat SSSF OSDI IRP Sub
Income from loan portfolio 3,568 491,948 18,936 - 16,063 5,839,230
Income from investments 1,773 49,516 780 210 - 392,978
Income from other sources 3,213 356,733 327 50,766 2,565 948,306
Total revenue 8,554 898,196 20,043 50,976 18,629 7,180,514
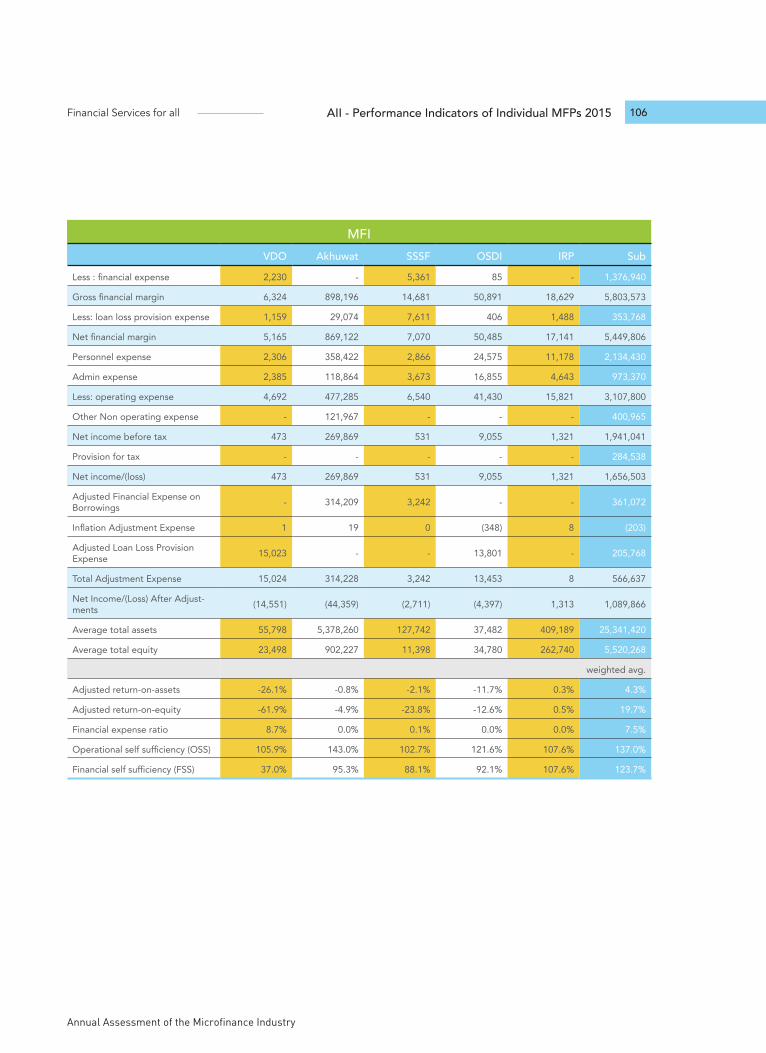
Annual Assessment of the Microfinance Industry
Financial Services for all 106AII - Performance Indicators of Individual MFPs 2015
MFIVDO Akhuwat SSSF OSDI IRP Sub
Less : financial expense 2,230 - 5,361 85 - 1,376,940
Gross financial margin 6,324 898,196 14,681 50,891 18,629 5,803,573
Less: loan loss provision expense 1,159 29,074 7,611 406 1,488 353,768
Net financial margin 5,165 869,122 7,070 50,485 17,141 5,449,806
Personnel expense 2,306 358,422 2,866 24,575 11,178 2,134,430
Admin expense 2,385 118,864 3,673 16,855 4,643 973,370
Less: operating expense 4,692 477,285 6,540 41,430 15,821 3,107,800
Other Non operating expense - 121,967 - - - 400,965
Net income before tax 473 269,869 531 9,055 1,321 1,941,041
Provision for tax - - - - - 284,538
Net income/(loss) 473 269,869 531 9,055 1,321 1,656,503
Adjusted Financial Expense on Borrowings - 314,209 3,242 - - 361,072
Inflation Adjustment Expense 1 19 0 (348) 8 (203)
Adjusted Loan Loss Provision Expense 15,023 - - 13,801 - 205,768
Total Adjustment Expense 15,024 314,228 3,242 13,453 8 566,637
Net Income/(Loss) After Adjust-ments (14,551) (44,359) (2,711) (4,397) 1,313 1,089,866
Average total assets 55,798 5,378,260 127,742 37,482 409,189 25,341,420
Average total equity 23,498 902,227 11,398 34,780 262,740 5,520,268
weighted avg.
Adjusted return-on-assets -26.1% -0.8% -2.1% -11.7% 0.3% 4.3%
Adjusted return-on-equity -61.9% -4.9% -23.8% -12.6% 0.5% 19.7%
Financial expense ratio 8.7% 0.0% 0.1% 0.0% 0.0% 7.5%
Operational self sufficiency (OSS) 105.9% 143.0% 102.7% 121.6% 107.6% 137.0%
Financial self sufficiency (FSS) 37.0% 95.3% 88.1% 92.1% 107.6% 123.7%
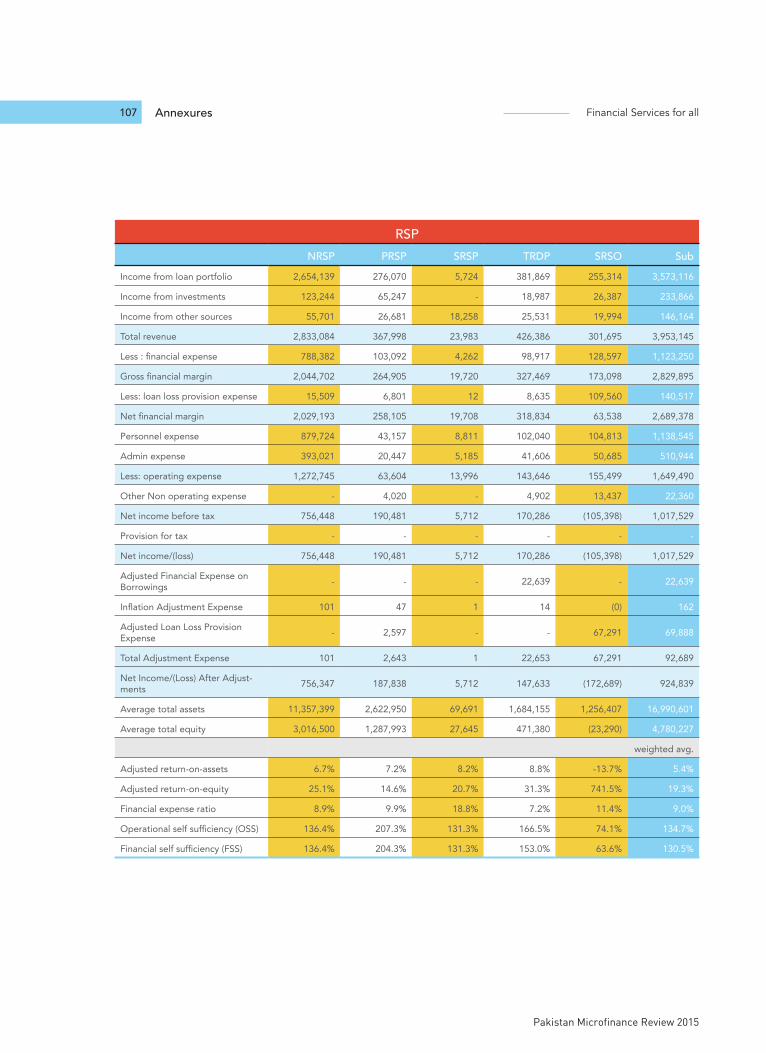
Annexures Financial Services for all
Pakistan Microfinance Review 2015
107
RSPNRSP PRSP SRSP TRDP SRSO Sub
Income from loan portfolio 2,654,139 276,070 5,724 381,869 255,314 3,573,116
Income from investments 123,244 65,247 - 18,987 26,387 233,866
Income from other sources 55,701 26,681 18,258 25,531 19,994 146,164
Total revenue 2,833,084 367,998 23,983 426,386 301,695 3,953,145
Less : financial expense 788,382 103,092 4,262 98,917 128,597 1,123,250
Gross financial margin 2,044,702 264,905 19,720 327,469 173,098 2,829,895
Less: loan loss provision expense 15,509 6,801 12 8,635 109,560 140,517
Net financial margin 2,029,193 258,105 19,708 318,834 63,538 2,689,378
Personnel expense 879,724 43,157 8,811 102,040 104,813 1,138,545
Admin expense 393,021 20,447 5,185 41,606 50,685 510,944
Less: operating expense 1,272,745 63,604 13,996 143,646 155,499 1,649,490
Other Non operating expense - 4,020 - 4,902 13,437 22,360
Net income before tax 756,448 190,481 5,712 170,286 (105,398) 1,017,529
Provision for tax - - - - - -
Net income/(loss) 756,448 190,481 5,712 170,286 (105,398) 1,017,529
Adjusted Financial Expense on Borrowings - - - 22,639 - 22,639
Inflation Adjustment Expense 101 47 1 14 (0) 162
Adjusted Loan Loss Provision Expense - 2,597 - - 67,291 69,888
Total Adjustment Expense 101 2,643 1 22,653 67,291 92,689
Net Income/(Loss) After Adjust-ments 756,347 187,838 5,712 147,633 (172,689) 924,839
Average total assets 11,357,399 2,622,950 69,691 1,684,155 1,256,407 16,990,601
Average total equity 3,016,500 1,287,993 27,645 471,380 (23,290) 4,780,227
weighted avg.
Adjusted return-on-assets 6.7% 7.2% 8.2% 8.8% -13.7% 5.4%
Adjusted return-on-equity 25.1% 14.6% 20.7% 31.3% 741.5% 19.3%
Financial expense ratio 8.9% 9.9% 18.8% 7.2% 11.4% 9.0%
Operational self sufficiency (OSS) 136.4% 207.3% 131.3% 166.5% 74.1% 134.7%
Financial self sufficiency (FSS) 136.4% 204.3% 131.3% 153.0% 63.6% 130.5%
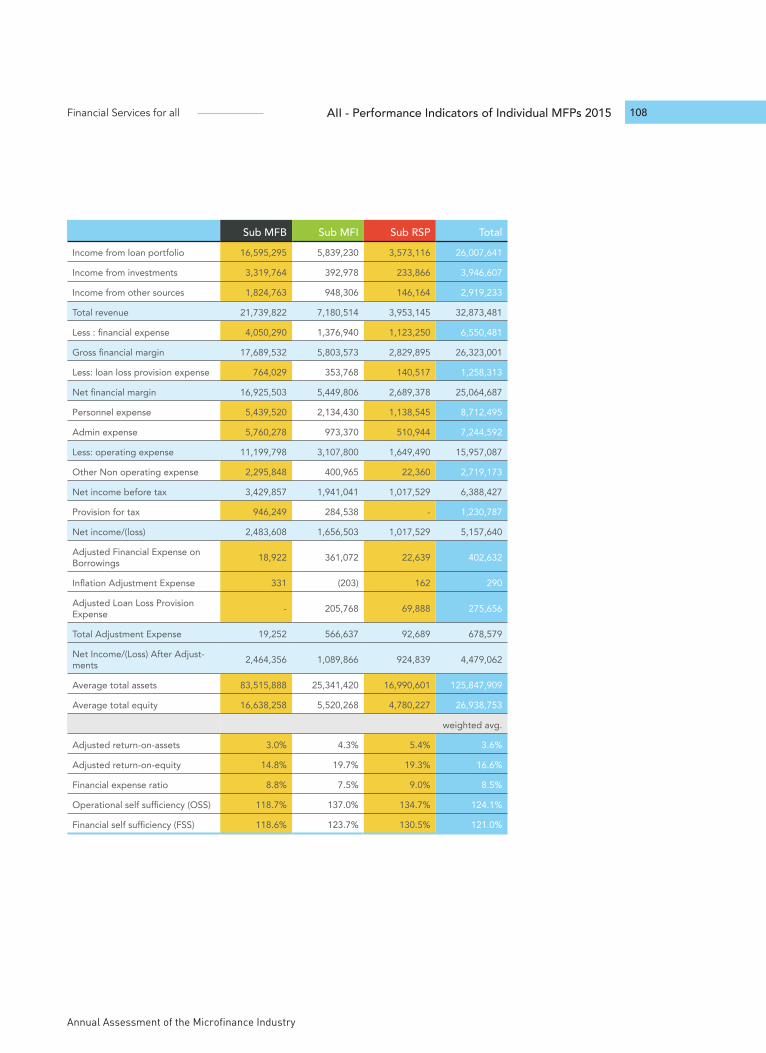
Annual Assessment of the Microfinance Industry
Financial Services for all 108AII - Performance Indicators of Individual MFPs 2015
Sub MFB Sub MFI Sub RSP TotalIncome from loan portfolio 16,595,295 5,839,230 3,573,116 26,007,641
Income from investments 3,319,764 392,978 233,866 3,946,607
Income from other sources 1,824,763 948,306 146,164 2,919,233
Total revenue 21,739,822 7,180,514 3,953,145 32,873,481
Less : financial expense 4,050,290 1,376,940 1,123,250 6,550,481
Gross financial margin 17,689,532 5,803,573 2,829,895 26,323,001
Less: loan loss provision expense 764,029 353,768 140,517 1,258,313
Net financial margin 16,925,503 5,449,806 2,689,378 25,064,687
Personnel expense 5,439,520 2,134,430 1,138,545 8,712,495
Admin expense 5,760,278 973,370 510,944 7,244,592
Less: operating expense 11,199,798 3,107,800 1,649,490 15,957,087
Other Non operating expense 2,295,848 400,965 22,360 2,719,173
Net income before tax 3,429,857 1,941,041 1,017,529 6,388,427
Provision for tax 946,249 284,538 - 1,230,787
Net income/(loss) 2,483,608 1,656,503 1,017,529 5,157,640
Adjusted Financial Expense on Borrowings 18,922 361,072 22,639 402,632
Inflation Adjustment Expense 331 (203) 162 290
Adjusted Loan Loss Provision Expense - 205,768 69,888 275,656
Total Adjustment Expense 19,252 566,637 92,689 678,579
Net Income/(Loss) After Adjust-ments 2,464,356 1,089,866 924,839 4,479,062
Average total assets 83,515,888 25,341,420 16,990,601 125,847,909
Average total equity 16,638,258 5,520,268 4,780,227 26,938,753
weighted avg.
Adjusted return-on-assets 3.0% 4.3% 5.4% 3.6%
Adjusted return-on-equity 14.8% 19.7% 19.3% 16.6%
Financial expense ratio 8.8% 7.5% 9.0% 8.5%
Operational self sufficiency (OSS) 118.7% 137.0% 134.7% 124.1%
Financial self sufficiency (FSS) 118.6% 123.7% 130.5% 121.0%
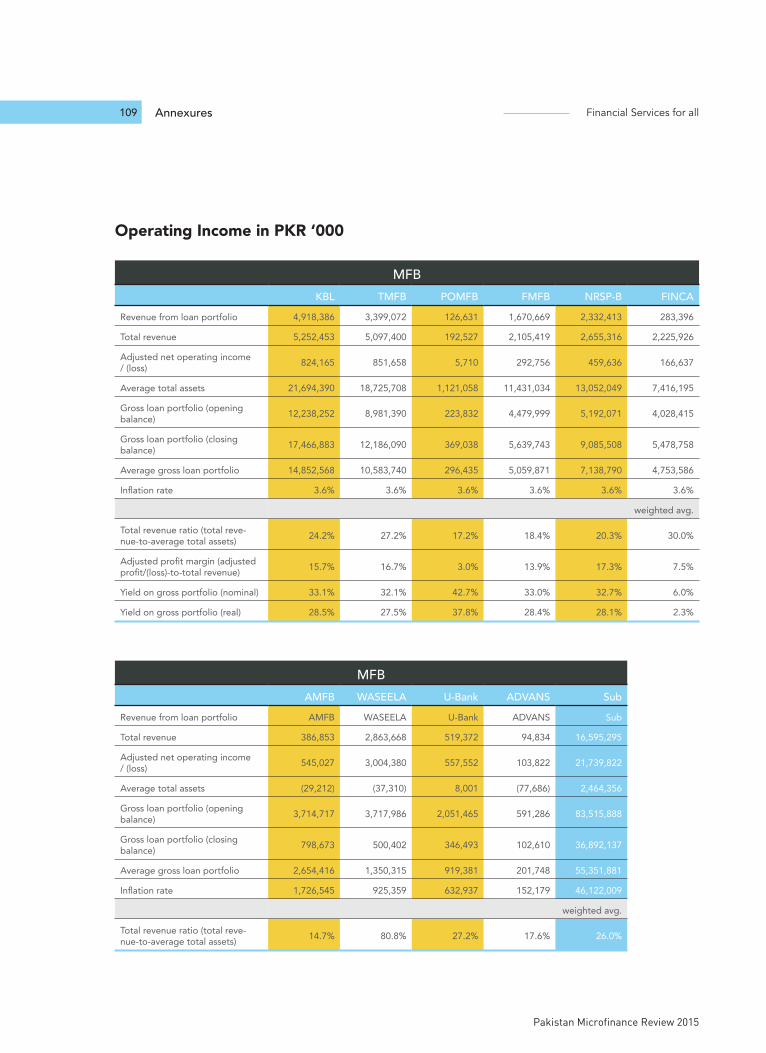
Annexures Financial Services for all
Pakistan Microfinance Review 2015
109
Operating Income in PKR ‘000
MFBKBL TMFB POMFB FMFB NRSP-B FINCA
Revenue from loan portfolio 4,918,386 3,399,072 126,631 1,670,669 2,332,413 283,396
Total revenue 5,252,453 5,097,400 192,527 2,105,419 2,655,316 2,225,926
Adjusted net operating income / (loss) 824,165 851,658 5,710 292,756 459,636 166,637
Average total assets 21,694,390 18,725,708 1,121,058 11,431,034 13,052,049 7,416,195
Gross loan portfolio (opening balance) 12,238,252 8,981,390 223,832 4,479,999 5,192,071 4,028,415
Gross loan portfolio (closing balance) 17,466,883 12,186,090 369,038 5,639,743 9,085,508 5,478,758
Average gross loan portfolio 14,852,568 10,583,740 296,435 5,059,871 7,138,790 4,753,586
Inflation rate 3.6% 3.6% 3.6% 3.6% 3.6% 3.6%
weighted avg.
Total revenue ratio (total reve-nue-to-average total assets) 24.2% 27.2% 17.2% 18.4% 20.3% 30.0%
Adjusted profit margin (adjusted profit/(loss)-to-total revenue) 15.7% 16.7% 3.0% 13.9% 17.3% 7.5%
Yield on gross portfolio (nominal) 33.1% 32.1% 42.7% 33.0% 32.7% 6.0%
Yield on gross portfolio (real) 28.5% 27.5% 37.8% 28.4% 28.1% 2.3%
MFBAMFB WASEELA U-Bank ADVANS Sub
Revenue from loan portfolio AMFB WASEELA U-Bank ADVANS Sub
Total revenue 386,853 2,863,668 519,372 94,834 16,595,295
Adjusted net operating income / (loss) 545,027 3,004,380 557,552 103,822 21,739,822
Average total assets (29,212) (37,310) 8,001 (77,686) 2,464,356
Gross loan portfolio (opening balance) 3,714,717 3,717,986 2,051,465 591,286 83,515,888
Gross loan portfolio (closing balance) 798,673 500,402 346,493 102,610 36,892,137
Average gross loan portfolio 2,654,416 1,350,315 919,381 201,748 55,351,881
Inflation rate 1,726,545 925,359 632,937 152,179 46,122,009
weighted avg.
Total revenue ratio (total reve-nue-to-average total assets) 14.7% 80.8% 27.2% 17.6% 26.0%
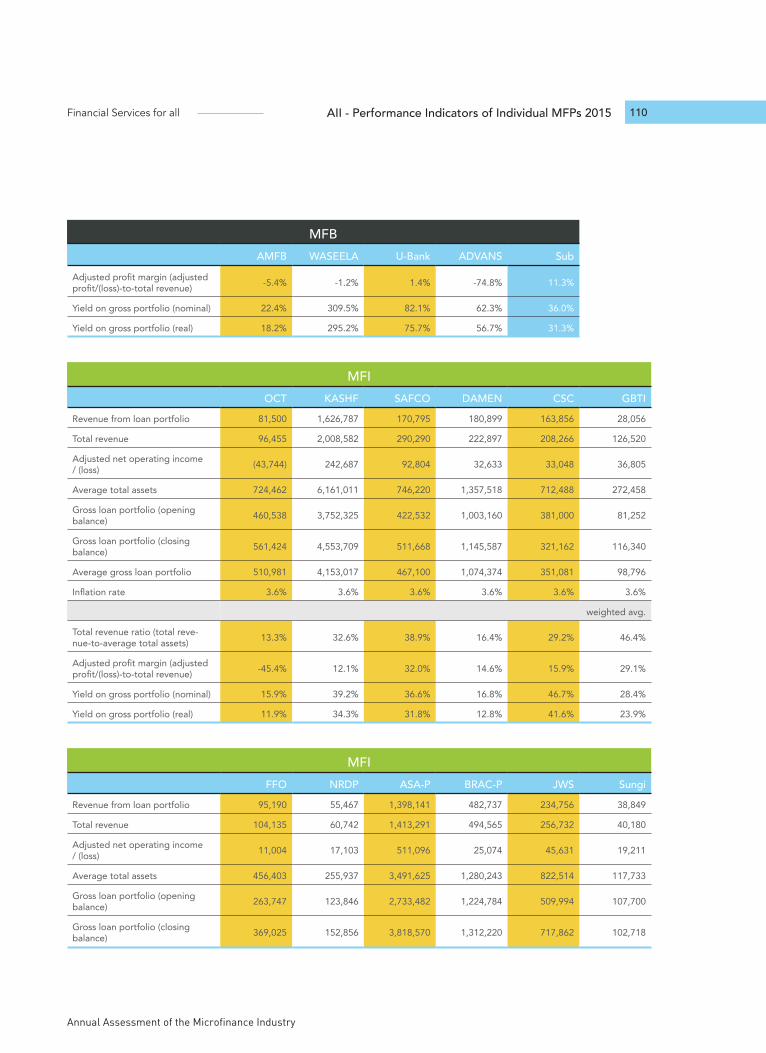
Annual Assessment of the Microfinance Industry
Financial Services for all 110AII - Performance Indicators of Individual MFPs 2015
MFBAMFB WASEELA U-Bank ADVANS Sub
Adjusted profit margin (adjusted profit/(loss)-to-total revenue) -5.4% -1.2% 1.4% -74.8% 11.3%
Yield on gross portfolio (nominal) 22.4% 309.5% 82.1% 62.3% 36.0%
Yield on gross portfolio (real) 18.2% 295.2% 75.7% 56.7% 31.3%
MFIOCT KASHF SAFCO DAMEN CSC GBTI
Revenue from loan portfolio 81,500 1,626,787 170,795 180,899 163,856 28,056
Total revenue 96,455 2,008,582 290,290 222,897 208,266 126,520
Adjusted net operating income / (loss) (43,744) 242,687 92,804 32,633 33,048 36,805
Average total assets 724,462 6,161,011 746,220 1,357,518 712,488 272,458
Gross loan portfolio (opening balance) 460,538 3,752,325 422,532 1,003,160 381,000 81,252
Gross loan portfolio (closing balance) 561,424 4,553,709 511,668 1,145,587 321,162 116,340
Average gross loan portfolio 510,981 4,153,017 467,100 1,074,374 351,081 98,796
Inflation rate 3.6% 3.6% 3.6% 3.6% 3.6% 3.6%
weighted avg.
Total revenue ratio (total reve-nue-to-average total assets) 13.3% 32.6% 38.9% 16.4% 29.2% 46.4%
Adjusted profit margin (adjusted profit/(loss)-to-total revenue) -45.4% 12.1% 32.0% 14.6% 15.9% 29.1%
Yield on gross portfolio (nominal) 15.9% 39.2% 36.6% 16.8% 46.7% 28.4%
Yield on gross portfolio (real) 11.9% 34.3% 31.8% 12.8% 41.6% 23.9%
MFIFFO NRDP ASA-P BRAC-P JWS Sungi
Revenue from loan portfolio 95,190 55,467 1,398,141 482,737 234,756 38,849
Total revenue 104,135 60,742 1,413,291 494,565 256,732 40,180
Adjusted net operating income / (loss) 11,004 17,103 511,096 25,074 45,631 19,211
Average total assets 456,403 255,937 3,491,625 1,280,243 822,514 117,733
Gross loan portfolio (opening balance) 263,747 123,846 2,733,482 1,224,784 509,994 107,700
Gross loan portfolio (closing balance) 369,025 152,856 3,818,570 1,312,220 717,862 102,718
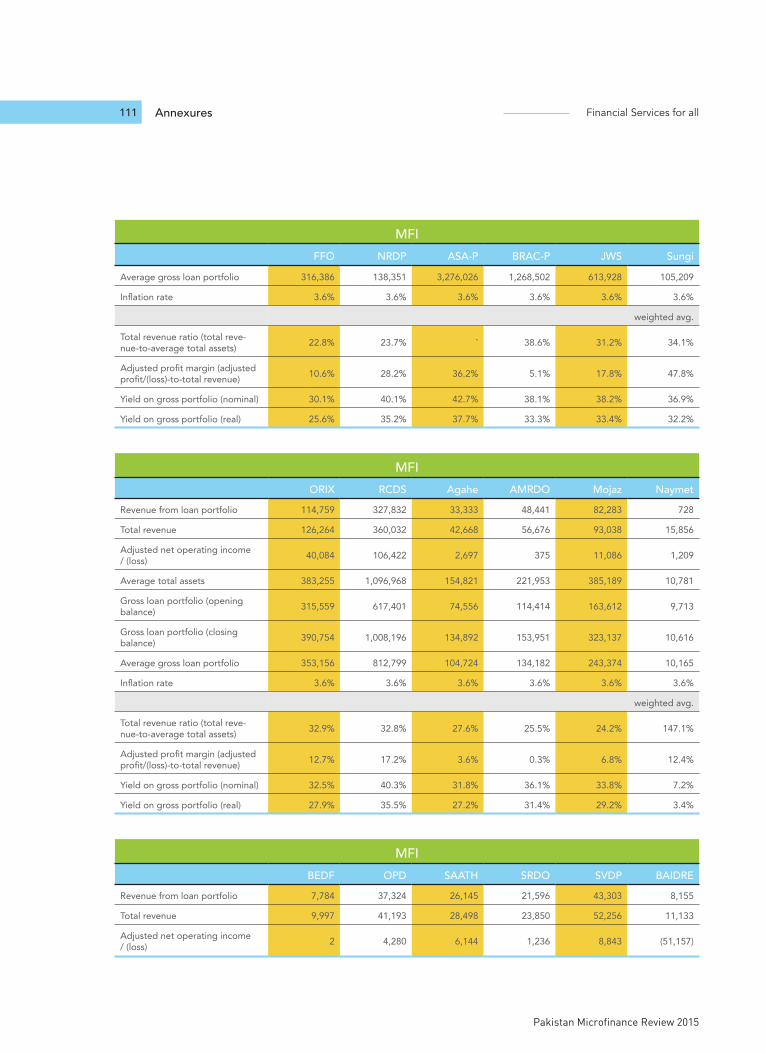
Annexures Financial Services for all
Pakistan Microfinance Review 2015
111
MFIFFO NRDP ASA-P BRAC-P JWS Sungi
Average gross loan portfolio 316,386 138,351 3,276,026 1,268,502 613,928 105,209
Inflation rate 3.6% 3.6% 3.6% 3.6% 3.6% 3.6%
weighted avg.
Total revenue ratio (total reve-nue-to-average total assets) 22.8% 23.7% ` 38.6% 31.2% 34.1%
Adjusted profit margin (adjusted profit/(loss)-to-total revenue) 10.6% 28.2% 36.2% 5.1% 17.8% 47.8%
Yield on gross portfolio (nominal) 30.1% 40.1% 42.7% 38.1% 38.2% 36.9%
Yield on gross portfolio (real) 25.6% 35.2% 37.7% 33.3% 33.4% 32.2%
MFIORIX RCDS Agahe AMRDO Mojaz Naymet
Revenue from loan portfolio 114,759 327,832 33,333 48,441 82,283 728
Total revenue 126,264 360,032 42,668 56,676 93,038 15,856
Adjusted net operating income / (loss) 40,084 106,422 2,697 375 11,086 1,209
Average total assets 383,255 1,096,968 154,821 221,953 385,189 10,781
Gross loan portfolio (opening balance) 315,559 617,401 74,556 114,414 163,612 9,713
Gross loan portfolio (closing balance) 390,754 1,008,196 134,892 153,951 323,137 10,616
Average gross loan portfolio 353,156 812,799 104,724 134,182 243,374 10,165
Inflation rate 3.6% 3.6% 3.6% 3.6% 3.6% 3.6%
weighted avg.
Total revenue ratio (total reve-nue-to-average total assets) 32.9% 32.8% 27.6% 25.5% 24.2% 147.1%
Adjusted profit margin (adjusted profit/(loss)-to-total revenue) 12.7% 17.2% 3.6% 0.3% 6.8% 12.4%
Yield on gross portfolio (nominal) 32.5% 40.3% 31.8% 36.1% 33.8% 7.2%
Yield on gross portfolio (real) 27.9% 35.5% 27.2% 31.4% 29.2% 3.4%
MFIBEDF OPD SAATH SRDO SVDP BAIDRE
Revenue from loan portfolio 7,784 37,324 26,145 21,596 43,303 8,155
Total revenue 9,997 41,193 28,498 23,850 52,256 11,133
Adjusted net operating income / (loss) 2 4,280 6,144 1,236 8,843 (51,157)
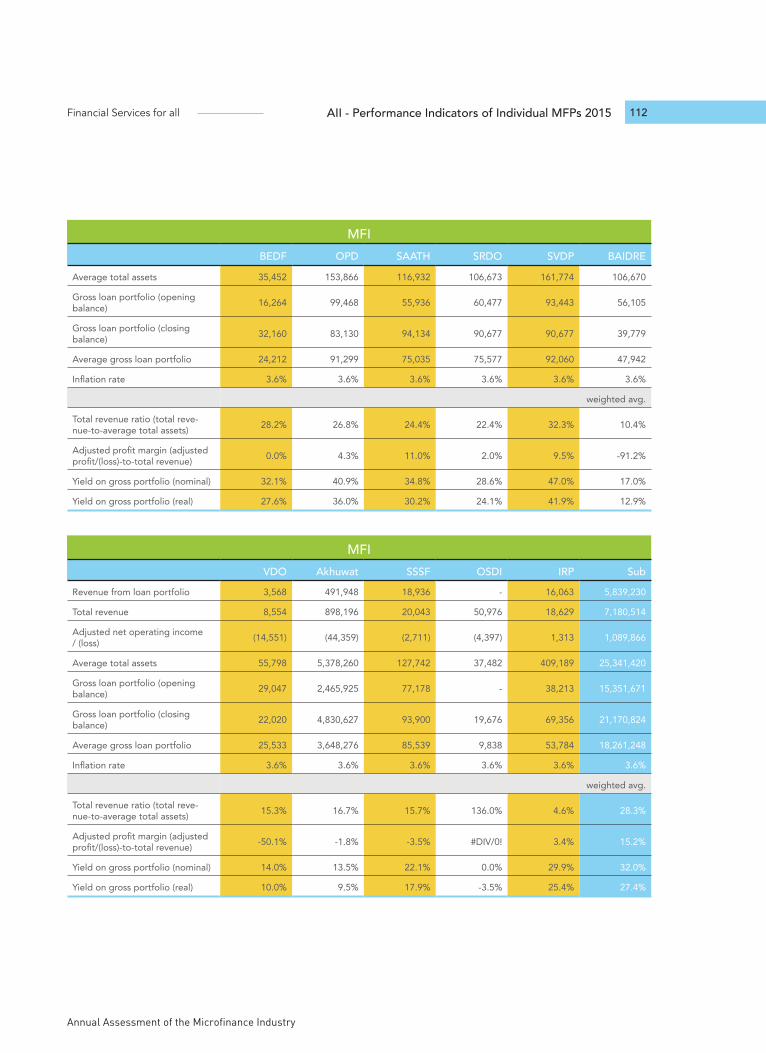
Annual Assessment of the Microfinance Industry
Financial Services for all 112AII - Performance Indicators of Individual MFPs 2015
MFIBEDF OPD SAATH SRDO SVDP BAIDRE
Average total assets 35,452 153,866 116,932 106,673 161,774 106,670
Gross loan portfolio (opening balance) 16,264 99,468 55,936 60,477 93,443 56,105
Gross loan portfolio (closing balance) 32,160 83,130 94,134 90,677 90,677 39,779
Average gross loan portfolio 24,212 91,299 75,035 75,577 92,060 47,942
Inflation rate 3.6% 3.6% 3.6% 3.6% 3.6% 3.6%
weighted avg.
Total revenue ratio (total reve-nue-to-average total assets) 28.2% 26.8% 24.4% 22.4% 32.3% 10.4%
Adjusted profit margin (adjusted profit/(loss)-to-total revenue) 0.0% 4.3% 11.0% 2.0% 9.5% -91.2%
Yield on gross portfolio (nominal) 32.1% 40.9% 34.8% 28.6% 47.0% 17.0%
Yield on gross portfolio (real) 27.6% 36.0% 30.2% 24.1% 41.9% 12.9%
MFIVDO Akhuwat SSSF OSDI IRP Sub
Revenue from loan portfolio 3,568 491,948 18,936 - 16,063 5,839,230
Total revenue 8,554 898,196 20,043 50,976 18,629 7,180,514
Adjusted net operating income / (loss) (14,551) (44,359) (2,711) (4,397) 1,313 1,089,866
Average total assets 55,798 5,378,260 127,742 37,482 409,189 25,341,420
Gross loan portfolio (opening balance) 29,047 2,465,925 77,178 - 38,213 15,351,671
Gross loan portfolio (closing balance) 22,020 4,830,627 93,900 19,676 69,356 21,170,824
Average gross loan portfolio 25,533 3,648,276 85,539 9,838 53,784 18,261,248
Inflation rate 3.6% 3.6% 3.6% 3.6% 3.6% 3.6%
weighted avg.
Total revenue ratio (total reve-nue-to-average total assets) 15.3% 16.7% 15.7% 136.0% 4.6% 28.3%
Adjusted profit margin (adjusted profit/(loss)-to-total revenue) -50.1% -1.8% -3.5% #DIV/0! 3.4% 15.2%
Yield on gross portfolio (nominal) 14.0% 13.5% 22.1% 0.0% 29.9% 32.0%
Yield on gross portfolio (real) 10.0% 9.5% 17.9% -3.5% 25.4% 27.4%

Annexures Financial Services for all
Pakistan Microfinance Review 2015
113
RSPNRSP PRSP SRSP TRDP SRSO Sub
Revenue from loan portfolio 2,654,139 276,070 5,724 381,869 255,314 3,573,116
Total revenue 2,833,084 367,998 23,983 426,386 301,695 3,953,145
Adjusted net operating income / (loss) 756,347 187,838 5,712 147,633 (172,689) 924,839
Average total assets 11,357,399 2,622,950 69,691 1,684,155 1,256,407 16,990,601
Gross loan portfolio (opening balance) 7,653,444 903,664 15,315 1,376,726 1,209,504 11,158,653
Gross loan portfolio (closing balance) 10,098,401 1,185,831 30,075 1,363,045 1,056,012 13,733,363
Average gross loan portfolio 8,875,922 1,044,748 22,695 1,369,885 1,132,758 12,446,008
Inflation rate 3.6% 3.6% 3.6% 3.6% 3.6% 3.6%
weighted avg.
Total revenue ratio (total reve-nue-to-average total assets) 24.9% 14.0% 34.4% 25.3% 24.0% 23.3%
Adjusted profit margin (adjusted profit/(loss)-to-total revenue) 26.7% 51.0% 23.8% 34.6% -57.2% 23.4%
Yield on gross portfolio (nominal) 29.9% 26.4% 25.2% 27.9% 22.5% 28.7%
Yield on gross portfolio (real) 25.4% 22.0% 20.9% 23.4% 18.3% 24.2%
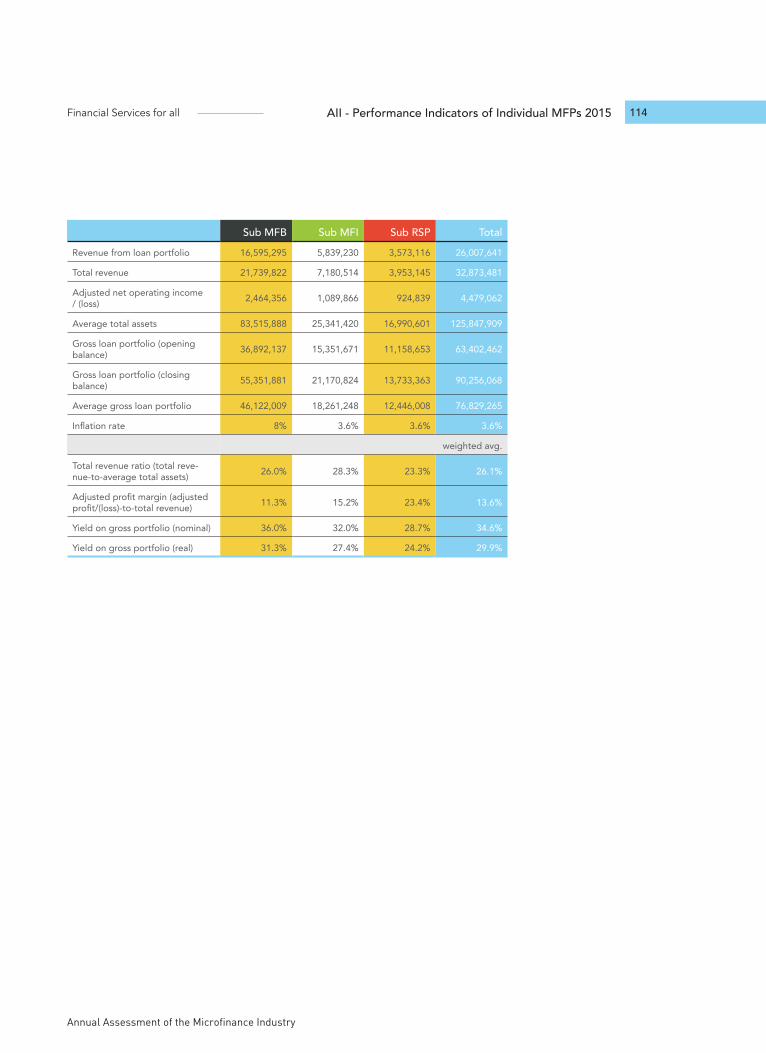
Annual Assessment of the Microfinance Industry
Financial Services for all 114AII - Performance Indicators of Individual MFPs 2015
Sub MFB Sub MFI Sub RSP TotalRevenue from loan portfolio 16,595,295 5,839,230 3,573,116 26,007,641
Total revenue 21,739,822 7,180,514 3,953,145 32,873,481
Adjusted net operating income / (loss) 2,464,356 1,089,866 924,839 4,479,062
Average total assets 83,515,888 25,341,420 16,990,601 125,847,909
Gross loan portfolio (opening balance) 36,892,137 15,351,671 11,158,653 63,402,462
Gross loan portfolio (closing balance) 55,351,881 21,170,824 13,733,363 90,256,068
Average gross loan portfolio 46,122,009 18,261,248 12,446,008 76,829,265
Inflation rate 8% 3.6% 3.6% 3.6%
weighted avg.
Total revenue ratio (total reve-nue-to-average total assets) 26.0% 28.3% 23.3% 26.1%
Adjusted profit margin (adjusted profit/(loss)-to-total revenue) 11.3% 15.2% 23.4% 13.6%
Yield on gross portfolio (nominal) 36.0% 32.0% 28.7% 34.6%
Yield on gross portfolio (real) 31.3% 27.4% 24.2% 29.9%
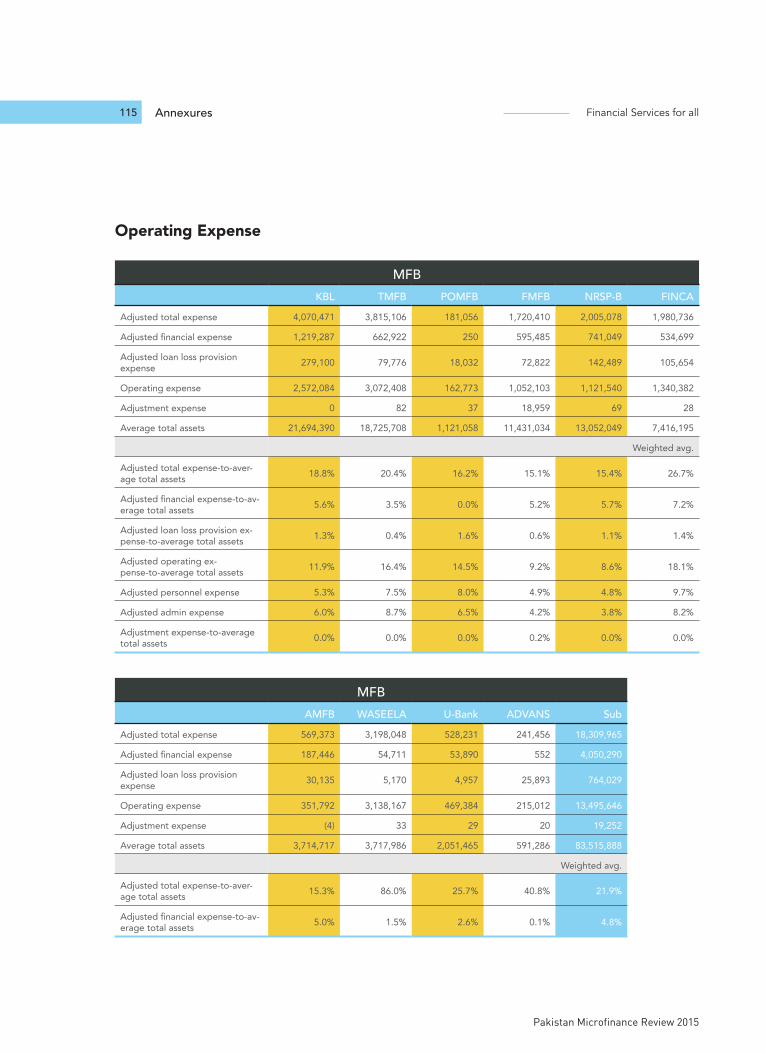
Annexures Financial Services for all
Pakistan Microfinance Review 2015
115
Operating Expense
MFBKBL TMFB POMFB FMFB NRSP-B FINCA
Adjusted total expense 4,070,471 3,815,106 181,056 1,720,410 2,005,078 1,980,736
Adjusted financial expense 1,219,287 662,922 250 595,485 741,049 534,699
Adjusted loan loss provision expense 279,100 79,776 18,032 72,822 142,489 105,654
Operating expense 2,572,084 3,072,408 162,773 1,052,103 1,121,540 1,340,382
Adjustment expense 0 82 37 18,959 69 28
Average total assets 21,694,390 18,725,708 1,121,058 11,431,034 13,052,049 7,416,195
Weighted avg.
Adjusted total expense-to-aver-age total assets 18.8% 20.4% 16.2% 15.1% 15.4% 26.7%
Adjusted financial expense-to-av-erage total assets 5.6% 3.5% 0.0% 5.2% 5.7% 7.2%
Adjusted loan loss provision ex-pense-to-average total assets 1.3% 0.4% 1.6% 0.6% 1.1% 1.4%
Adjusted operating ex-pense-to-average total assets 11.9% 16.4% 14.5% 9.2% 8.6% 18.1%
Adjusted personnel expense 5.3% 7.5% 8.0% 4.9% 4.8% 9.7%
Adjusted admin expense 6.0% 8.7% 6.5% 4.2% 3.8% 8.2%
Adjustment expense-to-average total assets 0.0% 0.0% 0.0% 0.2% 0.0% 0.0%
MFBAMFB WASEELA U-Bank ADVANS Sub
Adjusted total expense 569,373 3,198,048 528,231 241,456 18,309,965
Adjusted financial expense 187,446 54,711 53,890 552 4,050,290
Adjusted loan loss provision expense 30,135 5,170 4,957 25,893 764,029
Operating expense 351,792 3,138,167 469,384 215,012 13,495,646
Adjustment expense (4) 33 29 20 19,252
Average total assets 3,714,717 3,717,986 2,051,465 591,286 83,515,888
Weighted avg.
Adjusted total expense-to-aver-age total assets 15.3% 86.0% 25.7% 40.8% 21.9%
Adjusted financial expense-to-av-erage total assets 5.0% 1.5% 2.6% 0.1% 4.8%
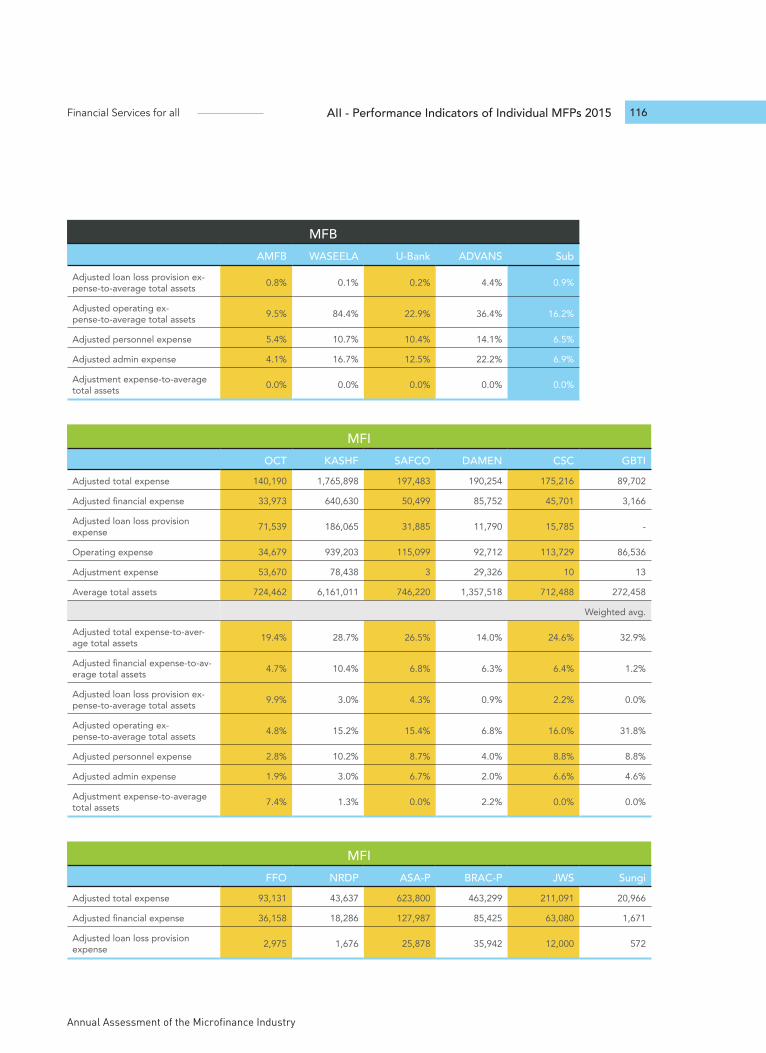
Annual Assessment of the Microfinance Industry
Financial Services for all 116AII - Performance Indicators of Individual MFPs 2015
MFBAMFB WASEELA U-Bank ADVANS Sub
Adjusted loan loss provision ex-pense-to-average total assets 0.8% 0.1% 0.2% 4.4% 0.9%
Adjusted operating ex-pense-to-average total assets 9.5% 84.4% 22.9% 36.4% 16.2%
Adjusted personnel expense 5.4% 10.7% 10.4% 14.1% 6.5%
Adjusted admin expense 4.1% 16.7% 12.5% 22.2% 6.9%
Adjustment expense-to-average total assets 0.0% 0.0% 0.0% 0.0% 0.0%
MFIOCT KASHF SAFCO DAMEN CSC GBTI
Adjusted total expense 140,190 1,765,898 197,483 190,254 175,216 89,702
Adjusted financial expense 33,973 640,630 50,499 85,752 45,701 3,166
Adjusted loan loss provision expense 71,539 186,065 31,885 11,790 15,785 -
Operating expense 34,679 939,203 115,099 92,712 113,729 86,536
Adjustment expense 53,670 78,438 3 29,326 10 13
Average total assets 724,462 6,161,011 746,220 1,357,518 712,488 272,458
Weighted avg.
Adjusted total expense-to-aver-age total assets 19.4% 28.7% 26.5% 14.0% 24.6% 32.9%
Adjusted financial expense-to-av-erage total assets 4.7% 10.4% 6.8% 6.3% 6.4% 1.2%
Adjusted loan loss provision ex-pense-to-average total assets 9.9% 3.0% 4.3% 0.9% 2.2% 0.0%
Adjusted operating ex-pense-to-average total assets 4.8% 15.2% 15.4% 6.8% 16.0% 31.8%
Adjusted personnel expense 2.8% 10.2% 8.7% 4.0% 8.8% 8.8%
Adjusted admin expense 1.9% 3.0% 6.7% 2.0% 6.6% 4.6%
Adjustment expense-to-average total assets 7.4% 1.3% 0.0% 2.2% 0.0% 0.0%
MFIFFO NRDP ASA-P BRAC-P JWS Sungi
Adjusted total expense 93,131 43,637 623,800 463,299 211,091 20,966
Adjusted financial expense 36,158 18,286 127,987 85,425 63,080 1,671
Adjusted loan loss provision expense 2,975 1,676 25,878 35,942 12,000 572
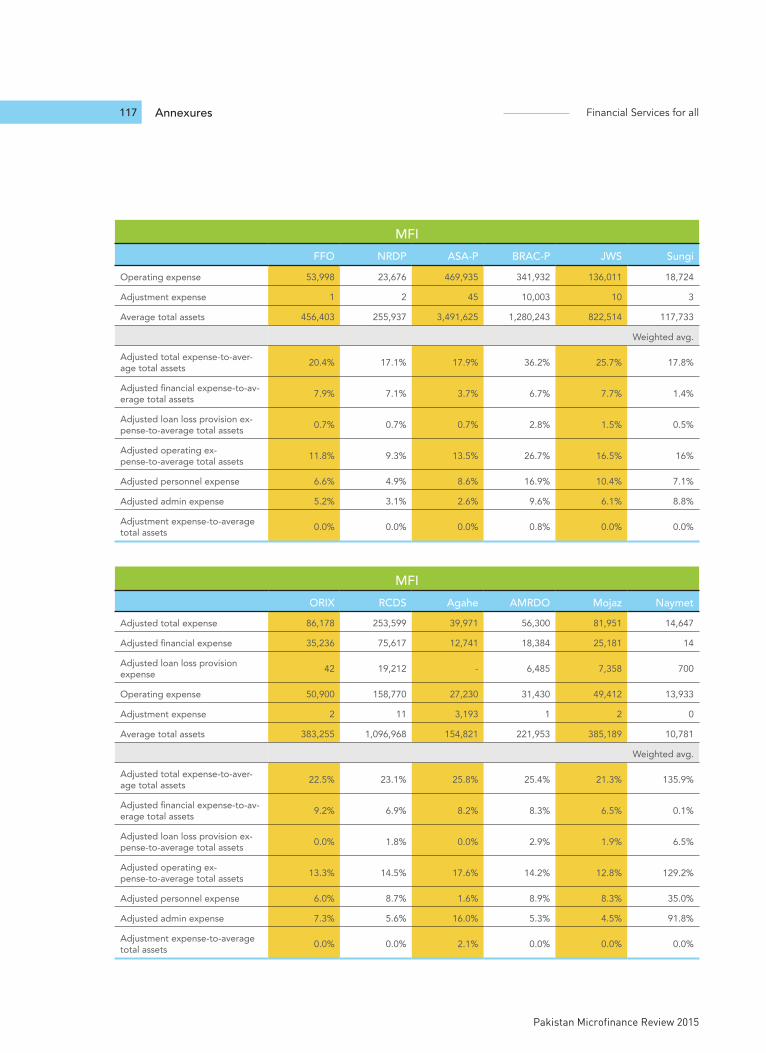
Annexures Financial Services for all
Pakistan Microfinance Review 2015
117
MFIFFO NRDP ASA-P BRAC-P JWS Sungi
Operating expense 53,998 23,676 469,935 341,932 136,011 18,724
Adjustment expense 1 2 45 10,003 10 3
Average total assets 456,403 255,937 3,491,625 1,280,243 822,514 117,733
Weighted avg.
Adjusted total expense-to-aver-age total assets 20.4% 17.1% 17.9% 36.2% 25.7% 17.8%
Adjusted financial expense-to-av-erage total assets 7.9% 7.1% 3.7% 6.7% 7.7% 1.4%
Adjusted loan loss provision ex-pense-to-average total assets 0.7% 0.7% 0.7% 2.8% 1.5% 0.5%
Adjusted operating ex-pense-to-average total assets 11.8% 9.3% 13.5% 26.7% 16.5% 16%
Adjusted personnel expense 6.6% 4.9% 8.6% 16.9% 10.4% 7.1%
Adjusted admin expense 5.2% 3.1% 2.6% 9.6% 6.1% 8.8%
Adjustment expense-to-average total assets 0.0% 0.0% 0.0% 0.8% 0.0% 0.0%
MFIORIX RCDS Agahe AMRDO Mojaz Naymet
Adjusted total expense 86,178 253,599 39,971 56,300 81,951 14,647
Adjusted financial expense 35,236 75,617 12,741 18,384 25,181 14
Adjusted loan loss provision expense 42 19,212 - 6,485 7,358 700
Operating expense 50,900 158,770 27,230 31,430 49,412 13,933
Adjustment expense 2 11 3,193 1 2 0
Average total assets 383,255 1,096,968 154,821 221,953 385,189 10,781
Weighted avg.
Adjusted total expense-to-aver-age total assets 22.5% 23.1% 25.8% 25.4% 21.3% 135.9%
Adjusted financial expense-to-av-erage total assets 9.2% 6.9% 8.2% 8.3% 6.5% 0.1%
Adjusted loan loss provision ex-pense-to-average total assets 0.0% 1.8% 0.0% 2.9% 1.9% 6.5%
Adjusted operating ex-pense-to-average total assets 13.3% 14.5% 17.6% 14.2% 12.8% 129.2%
Adjusted personnel expense 6.0% 8.7% 1.6% 8.9% 8.3% 35.0%
Adjusted admin expense 7.3% 5.6% 16.0% 5.3% 4.5% 91.8%
Adjustment expense-to-average total assets 0.0% 0.0% 2.1% 0.0% 0.0% 0.0%
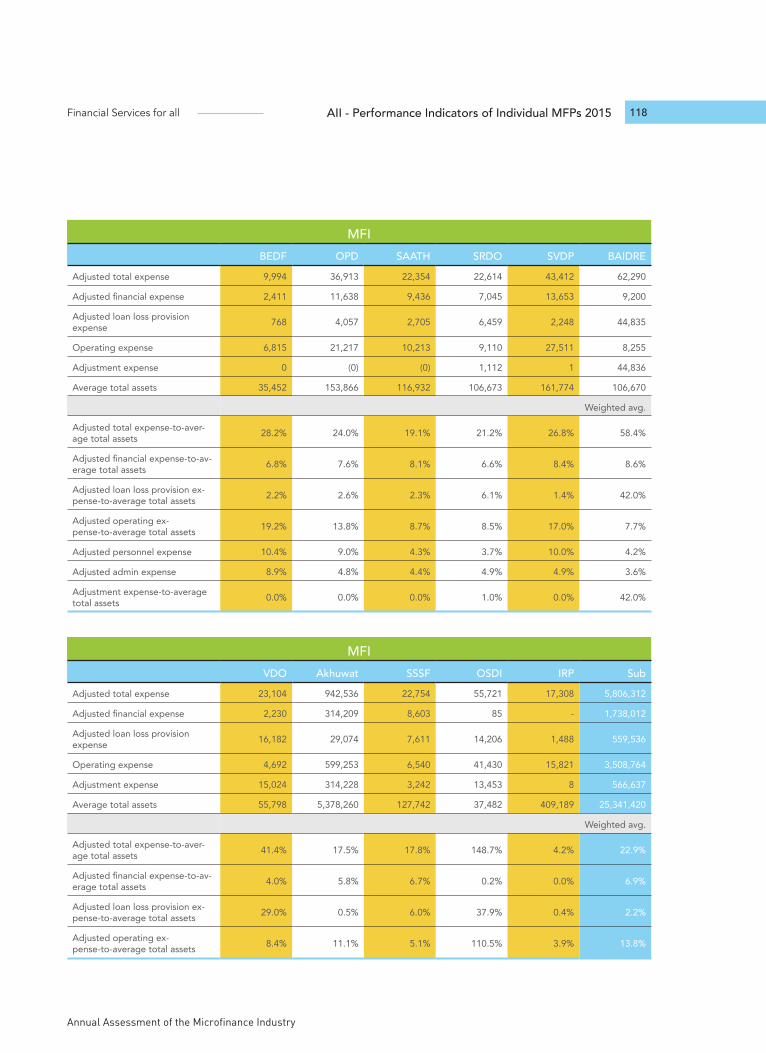
Annual Assessment of the Microfinance Industry
Financial Services for all 118AII - Performance Indicators of Individual MFPs 2015
MFIBEDF OPD SAATH SRDO SVDP BAIDRE
Adjusted total expense 9,994 36,913 22,354 22,614 43,412 62,290
Adjusted financial expense 2,411 11,638 9,436 7,045 13,653 9,200
Adjusted loan loss provision expense 768 4,057 2,705 6,459 2,248 44,835
Operating expense 6,815 21,217 10,213 9,110 27,511 8,255
Adjustment expense 0 (0) (0) 1,112 1 44,836
Average total assets 35,452 153,866 116,932 106,673 161,774 106,670
Weighted avg.
Adjusted total expense-to-aver-age total assets 28.2% 24.0% 19.1% 21.2% 26.8% 58.4%
Adjusted financial expense-to-av-erage total assets 6.8% 7.6% 8.1% 6.6% 8.4% 8.6%
Adjusted loan loss provision ex-pense-to-average total assets 2.2% 2.6% 2.3% 6.1% 1.4% 42.0%
Adjusted operating ex-pense-to-average total assets 19.2% 13.8% 8.7% 8.5% 17.0% 7.7%
Adjusted personnel expense 10.4% 9.0% 4.3% 3.7% 10.0% 4.2%
Adjusted admin expense 8.9% 4.8% 4.4% 4.9% 4.9% 3.6%
Adjustment expense-to-average total assets 0.0% 0.0% 0.0% 1.0% 0.0% 42.0%
MFIVDO Akhuwat SSSF OSDI IRP Sub
Adjusted total expense 23,104 942,536 22,754 55,721 17,308 5,806,312
Adjusted financial expense 2,230 314,209 8,603 85 - 1,738,012
Adjusted loan loss provision expense 16,182 29,074 7,611 14,206 1,488 559,536
Operating expense 4,692 599,253 6,540 41,430 15,821 3,508,764
Adjustment expense 15,024 314,228 3,242 13,453 8 566,637
Average total assets 55,798 5,378,260 127,742 37,482 409,189 25,341,420
Weighted avg.
Adjusted total expense-to-aver-age total assets 41.4% 17.5% 17.8% 148.7% 4.2% 22.9%
Adjusted financial expense-to-av-erage total assets 4.0% 5.8% 6.7% 0.2% 0.0% 6.9%
Adjusted loan loss provision ex-pense-to-average total assets 29.0% 0.5% 6.0% 37.9% 0.4% 2.2%
Adjusted operating ex-pense-to-average total assets 8.4% 11.1% 5.1% 110.5% 3.9% 13.8%

Annexures Financial Services for all
Pakistan Microfinance Review 2015
119
MFIVDO Akhuwat SSSF OSDI IRP Sub
Adjusted personnel expense 4.1% 6.7% 2.2% 65.6% 2.7% 8.4%
Adjusted admin expense 4.3% 2.2% 2.9% 45.0% 1.1% 3.8%
Adjustment expense-to-average total assets 26.9% 5.8% 2.5% 35.9% 0.0% 2.2%
RSPNRSP PRSP SRSP TRDP SRSO Sub
Adjusted total expense 2,076,636 180,114 18,270 256,101 474,384 3,005,505
Adjusted financial expense 788,382 103,092 4,262 98,917 128,597 1,123,250
Adjusted loan loss provision expense 15,509 9,397 12 8,635 176,852 210,405
Operating expense 1,272,745 67,624 13,996 148,549 168,936 1,671,849
Adjustment expense 101 2,643 1 22,653 67,291 92,689
Average total assets 11,357,399 2,622,950 69,691 1,684,155 1,256,407 16,990,601
Weighted avg.
Adjusted total expense-to-aver-age total assets 18.3% 6.9% 26.2% 15.2% 37.8% 17.7%
Adjusted financial expense-to-av-erage total assets 6.9% 3.9% 6.1% 5.9% 10.2% 6.6%
Adjusted loan loss provision ex-pense-to-average total assets 0.1% 0.4% 0.0% 0.5% 14.1% 1.2%
Adjusted operating ex-pense-to-average total assets 11.2% 2.6% 20.1% 8.8% 13.4% 9.8%
Adjusted personnel expense 7.7% 1.6% 12.6% 6.1% 8.3% 6.7%
Adjusted admin expense 3.5% 0.8% 7.4% 2.5% 4.0% 3.0%
Adjustment expense-to-average total assets 0.0% 0.1% 0.0% 1.3% 5.4% 0.5%

Annual Assessment of the Microfinance Industry
Financial Services for all 120AII - Performance Indicators of Individual MFPs 2015
Sub MFB Sub MFI Sub RSP TotalAdjusted total expense 18,309,965 5,806,312 3,005,505 27,121,782
Adjusted financial expense 4,050,290 1,738,012 1,123,250 6,911,552
Adjusted loan loss provision expense 764,029 559,536 210,405 1,533,970
Operating expense 13,495,646 3,508,764 1,671,849 18,676,260
Adjustment expense 19,252 566,637 92,689 678,579
Average total assets 83,515,888 25,341,420 16,990,601 125,847,909
Weighted avg.
Adjusted total expense-to-aver-age total assets 21.9% 22.9% 17.7% 21.6%
Adjusted financial expense-to-av-erage total assets 4.8% 6.9% 6.6% 5.5%
Adjusted loan loss provision ex-pense-to-average total assets 0.9% 2.2% 1.2% 1.2%
Adjusted operating ex-pense-to-average total assets 16.2% 13.8% 9.8% 14.8%
Adjusted personnel expense 6.5% 8.4% 6.7% 6.9%
Adjusted admin expense 6.9% 3.8% 3.0% 5.8%
Adjustment expense-to-average total assets 0.0% 2.2% 0.5% 0.5%
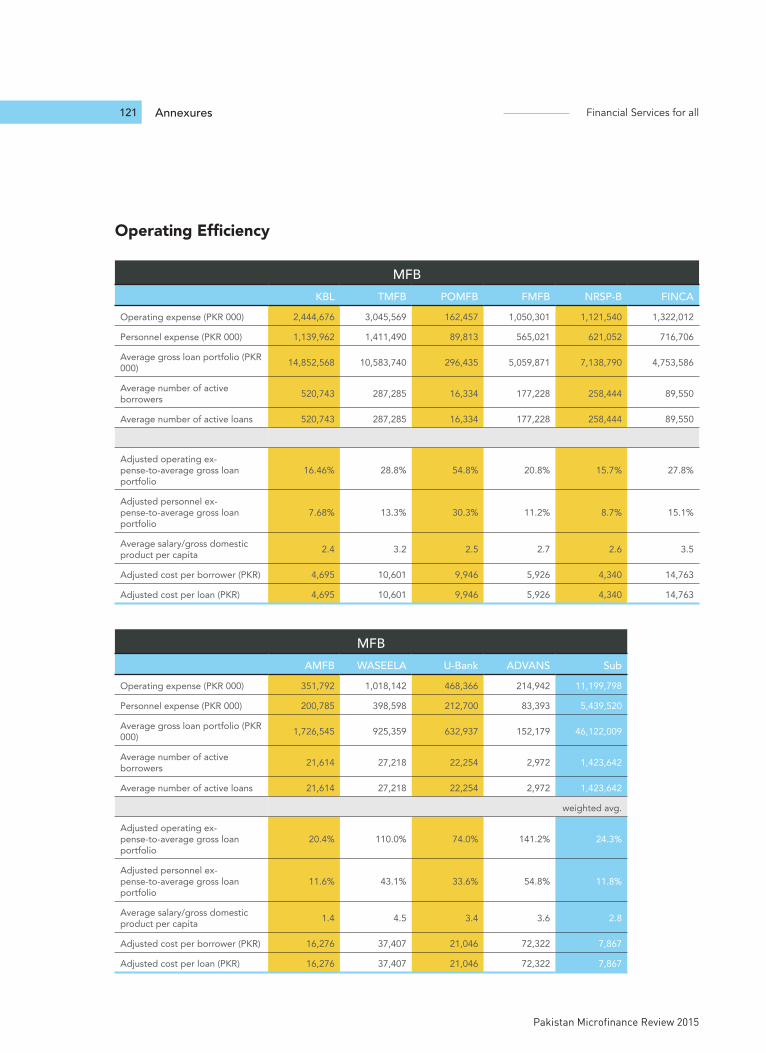
Annexures Financial Services for all
Pakistan Microfinance Review 2015
121
Operating Efficiency
MFBKBL TMFB POMFB FMFB NRSP-B FINCA
Operating expense (PKR 000) 2,444,676 3,045,569 162,457 1,050,301 1,121,540 1,322,012
Personnel expense (PKR 000) 1,139,962 1,411,490 89,813 565,021 621,052 716,706
Average gross loan portfolio (PKR 000) 14,852,568 10,583,740 296,435 5,059,871 7,138,790 4,753,586
Average number of active borrowers 520,743 287,285 16,334 177,228 258,444 89,550
Average number of active loans 520,743 287,285 16,334 177,228 258,444 89,550
Adjusted operating ex-pense-to-average gross loan portfolio
16.46% 28.8% 54.8% 20.8% 15.7% 27.8%
Adjusted personnel ex-pense-to-average gross loan portfolio
7.68% 13.3% 30.3% 11.2% 8.7% 15.1%
Average salary/gross domestic product per capita 2.4 3.2 2.5 2.7 2.6 3.5
Adjusted cost per borrower (PKR) 4,695 10,601 9,946 5,926 4,340 14,763
Adjusted cost per loan (PKR) 4,695 10,601 9,946 5,926 4,340 14,763
MFBAMFB WASEELA U-Bank ADVANS Sub
Operating expense (PKR 000) 351,792 1,018,142 468,366 214,942 11,199,798
Personnel expense (PKR 000) 200,785 398,598 212,700 83,393 5,439,520
Average gross loan portfolio (PKR 000) 1,726,545 925,359 632,937 152,179 46,122,009
Average number of active borrowers 21,614 27,218 22,254 2,972 1,423,642
Average number of active loans 21,614 27,218 22,254 2,972 1,423,642
weighted avg.
Adjusted operating ex-pense-to-average gross loan portfolio
20.4% 110.0% 74.0% 141.2% 24.3%
Adjusted personnel ex-pense-to-average gross loan portfolio
11.6% 43.1% 33.6% 54.8% 11.8%
Average salary/gross domestic product per capita 1.4 4.5 3.4 3.6 2.8
Adjusted cost per borrower (PKR) 16,276 37,407 21,046 72,322 7,867
Adjusted cost per loan (PKR) 16,276 37,407 21,046 72,322 7,867

Annual Assessment of the Microfinance Industry
Financial Services for all 122AII - Performance Indicators of Individual MFPs 2015
MFIOCT KASHF SAFCO DAMEN CSC GBTI
Operating expense (PKR 000) 33,868 813,826 115,099 81,494 109,414 36,458
Personnel expense (PKR 000) 20,169 630,001 65,218 53,973 62,707 23,929
Average gross loan portfolio (PKR 000) 510,981 4,153,017 467,100 1,074,374 351,081 98,796
Average number of active borrowers 42,679 246,912 48,009 44,814 16,579 9,634
Average number of active loans 42,679 246,912 48,009 44,814 16,579 9,634
weighted avg.
Adjusted operating ex-pense-to-average gross loan portfolio
6.6% 19.6% 24.6% 7.6% 31.2% 36.9%
Adjusted personnel ex-pense-to-average gross loan portfolio
3.9% 15.2% 14.0% 5.0% 17.9% 24.2%
Average salary/gross domestic product per capita 1.1 2.0 1.7 1.5 2.4 1.5
Adjusted cost per borrower (PKR) 794 3,296 2,397 1,818 6,600 3,784
Adjusted cost per loan (PKR) 794 3,296 2,397 1,818 6,600 3,784
MFIFFO NRDP ASA-P BRAC-P JWS Sungi
Operating expense (PKR 000) 53,815 20,515 392,850 340,160 136,011 18,724
Personnel expense (PKR 000) 30,217 12,489 301,762 216,956 85,597 8,365
Average gross loan portfolio (PKR 000) 316,386 138,351 3,276,026 1,268,502 613,928 105,209
Average number of active borrowers 23,261 6,113 262,706 54,021 37,167 11,319
Average number of active loans 23,261 6,113 262,706 54,021 37,167 11,319
weighted avg.
Adjusted operating ex-pense-to-average gross loan portfolio
17.0% 14.8% 12.0% 26.8% 22.2% 17.8%
Adjusted personnel ex-pense-to-average gross loan portfolio
9.6% 9.0% 9.2% 17.1% 13.9% 8.0%
Average salary/gross domestic product per capita 1.2 2.9 1.5 2.7 2.3 0.9
Adjusted cost per borrower (PKR) 2,314 3,356 1,495 6,297 3,659 1,654
Adjusted cost per loan (PKR) 2,314 3,356 1,495 6,297 3,659 1,654
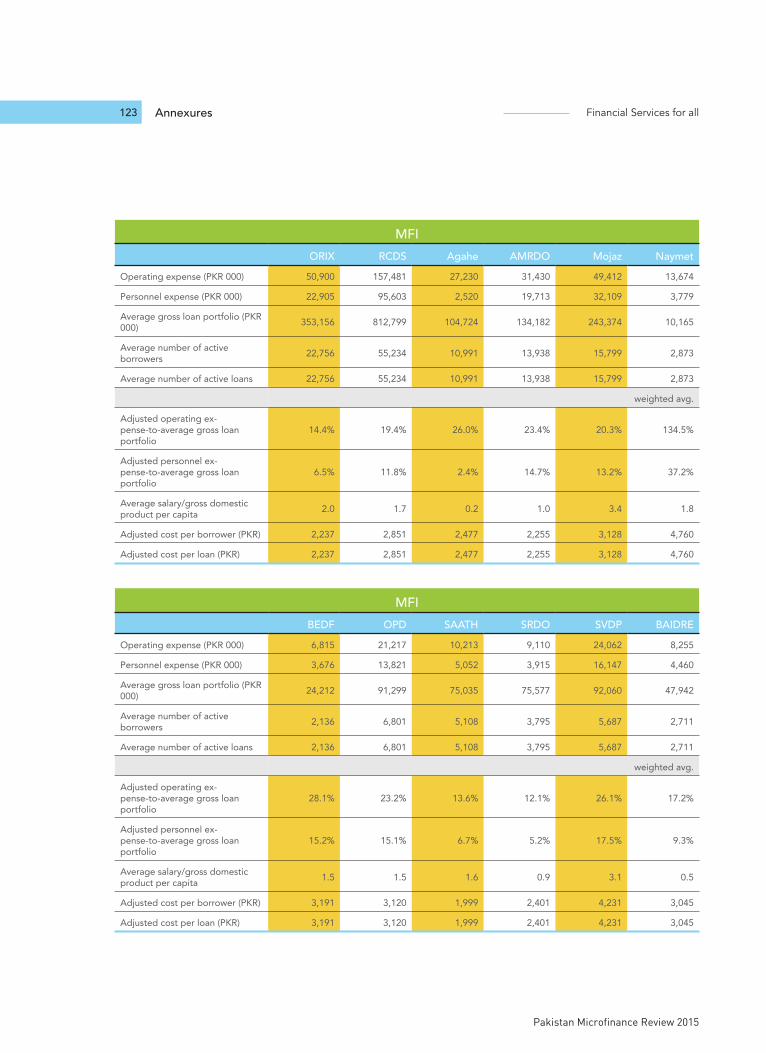
Annexures Financial Services for all
Pakistan Microfinance Review 2015
123
MFIORIX RCDS Agahe AMRDO Mojaz Naymet
Operating expense (PKR 000) 50,900 157,481 27,230 31,430 49,412 13,674
Personnel expense (PKR 000) 22,905 95,603 2,520 19,713 32,109 3,779
Average gross loan portfolio (PKR 000) 353,156 812,799 104,724 134,182 243,374 10,165
Average number of active borrowers 22,756 55,234 10,991 13,938 15,799 2,873
Average number of active loans 22,756 55,234 10,991 13,938 15,799 2,873
weighted avg.
Adjusted operating ex-pense-to-average gross loan portfolio
14.4% 19.4% 26.0% 23.4% 20.3% 134.5%
Adjusted personnel ex-pense-to-average gross loan portfolio
6.5% 11.8% 2.4% 14.7% 13.2% 37.2%
Average salary/gross domestic product per capita 2.0 1.7 0.2 1.0 3.4 1.8
Adjusted cost per borrower (PKR) 2,237 2,851 2,477 2,255 3,128 4,760
Adjusted cost per loan (PKR) 2,237 2,851 2,477 2,255 3,128 4,760
MFIBEDF OPD SAATH SRDO SVDP BAIDRE
Operating expense (PKR 000) 6,815 21,217 10,213 9,110 24,062 8,255
Personnel expense (PKR 000) 3,676 13,821 5,052 3,915 16,147 4,460
Average gross loan portfolio (PKR 000) 24,212 91,299 75,035 75,577 92,060 47,942
Average number of active borrowers 2,136 6,801 5,108 3,795 5,687 2,711
Average number of active loans 2,136 6,801 5,108 3,795 5,687 2,711
weighted avg.
Adjusted operating ex-pense-to-average gross loan portfolio
28.1% 23.2% 13.6% 12.1% 26.1% 17.2%
Adjusted personnel ex-pense-to-average gross loan portfolio
15.2% 15.1% 6.7% 5.2% 17.5% 9.3%
Average salary/gross domestic product per capita 1.5 1.5 1.6 0.9 3.1 0.5
Adjusted cost per borrower (PKR) 3,191 3,120 1,999 2,401 4,231 3,045
Adjusted cost per loan (PKR) 3,191 3,120 1,999 2,401 4,231 3,045
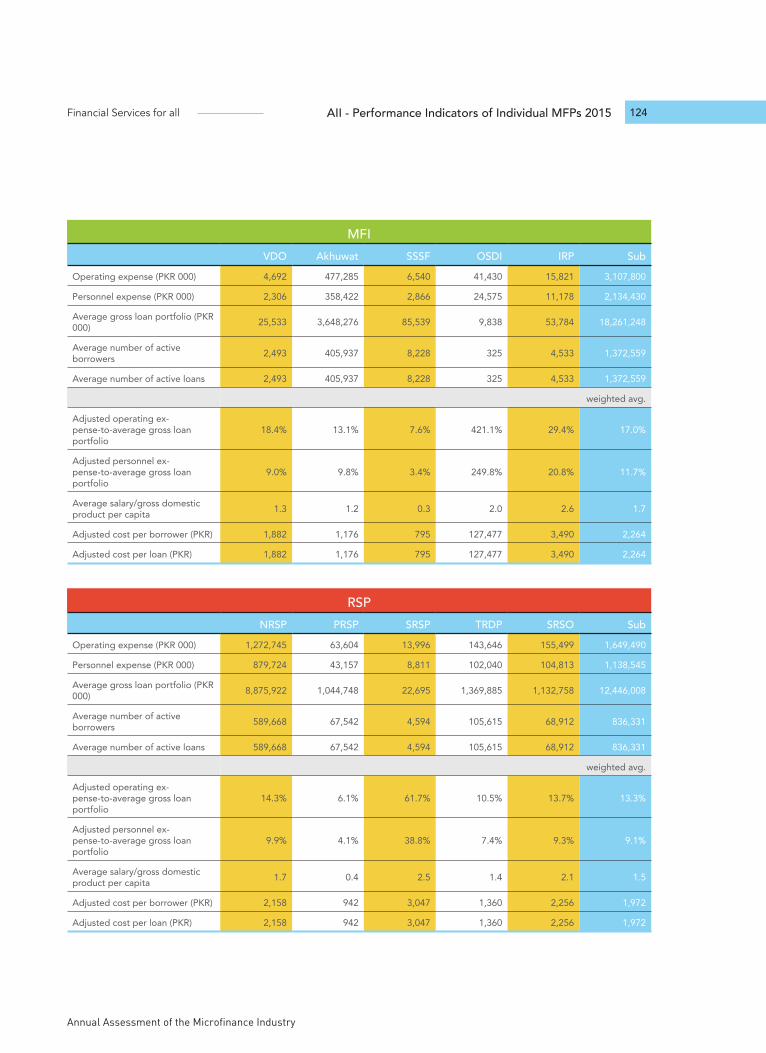
Annual Assessment of the Microfinance Industry
Financial Services for all 124AII - Performance Indicators of Individual MFPs 2015
MFIVDO Akhuwat SSSF OSDI IRP Sub
Operating expense (PKR 000) 4,692 477,285 6,540 41,430 15,821 3,107,800
Personnel expense (PKR 000) 2,306 358,422 2,866 24,575 11,178 2,134,430
Average gross loan portfolio (PKR 000) 25,533 3,648,276 85,539 9,838 53,784 18,261,248
Average number of active borrowers 2,493 405,937 8,228 325 4,533 1,372,559
Average number of active loans 2,493 405,937 8,228 325 4,533 1,372,559
weighted avg.
Adjusted operating ex-pense-to-average gross loan portfolio
18.4% 13.1% 7.6% 421.1% 29.4% 17.0%
Adjusted personnel ex-pense-to-average gross loan portfolio
9.0% 9.8% 3.4% 249.8% 20.8% 11.7%
Average salary/gross domestic product per capita 1.3 1.2 0.3 2.0 2.6 1.7
Adjusted cost per borrower (PKR) 1,882 1,176 795 127,477 3,490 2,264
Adjusted cost per loan (PKR) 1,882 1,176 795 127,477 3,490 2,264
RSPNRSP PRSP SRSP TRDP SRSO Sub
Operating expense (PKR 000) 1,272,745 63,604 13,996 143,646 155,499 1,649,490
Personnel expense (PKR 000) 879,724 43,157 8,811 102,040 104,813 1,138,545
Average gross loan portfolio (PKR 000) 8,875,922 1,044,748 22,695 1,369,885 1,132,758 12,446,008
Average number of active borrowers 589,668 67,542 4,594 105,615 68,912 836,331
Average number of active loans 589,668 67,542 4,594 105,615 68,912 836,331
weighted avg.
Adjusted operating ex-pense-to-average gross loan portfolio
14.3% 6.1% 61.7% 10.5% 13.7% 13.3%
Adjusted personnel ex-pense-to-average gross loan portfolio
9.9% 4.1% 38.8% 7.4% 9.3% 9.1%
Average salary/gross domestic product per capita 1.7 0.4 2.5 1.4 2.1 1.5
Adjusted cost per borrower (PKR) 2,158 942 3,047 1,360 2,256 1,972
Adjusted cost per loan (PKR) 2,158 942 3,047 1,360 2,256 1,972
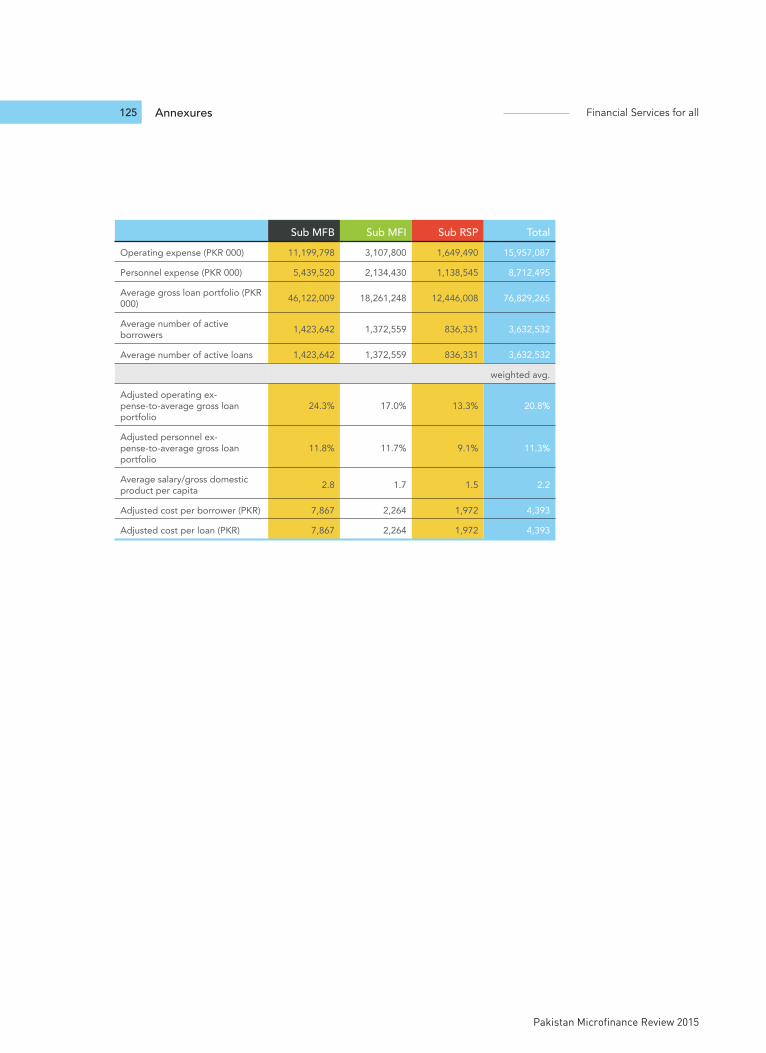
Annexures Financial Services for all
Pakistan Microfinance Review 2015
125
Sub MFB Sub MFI Sub RSP TotalOperating expense (PKR 000) 11,199,798 3,107,800 1,649,490 15,957,087
Personnel expense (PKR 000) 5,439,520 2,134,430 1,138,545 8,712,495
Average gross loan portfolio (PKR 000) 46,122,009 18,261,248 12,446,008 76,829,265
Average number of active borrowers 1,423,642 1,372,559 836,331 3,632,532
Average number of active loans 1,423,642 1,372,559 836,331 3,632,532
weighted avg.
Adjusted operating ex-pense-to-average gross loan portfolio
24.3% 17.0% 13.3% 20.8%
Adjusted personnel ex-pense-to-average gross loan portfolio
11.8% 11.7% 9.1% 11.3%
Average salary/gross domestic product per capita 2.8 1.7 1.5 2.2
Adjusted cost per borrower (PKR) 7,867 2,264 1,972 4,393
Adjusted cost per loan (PKR) 7,867 2,264 1,972 4,393
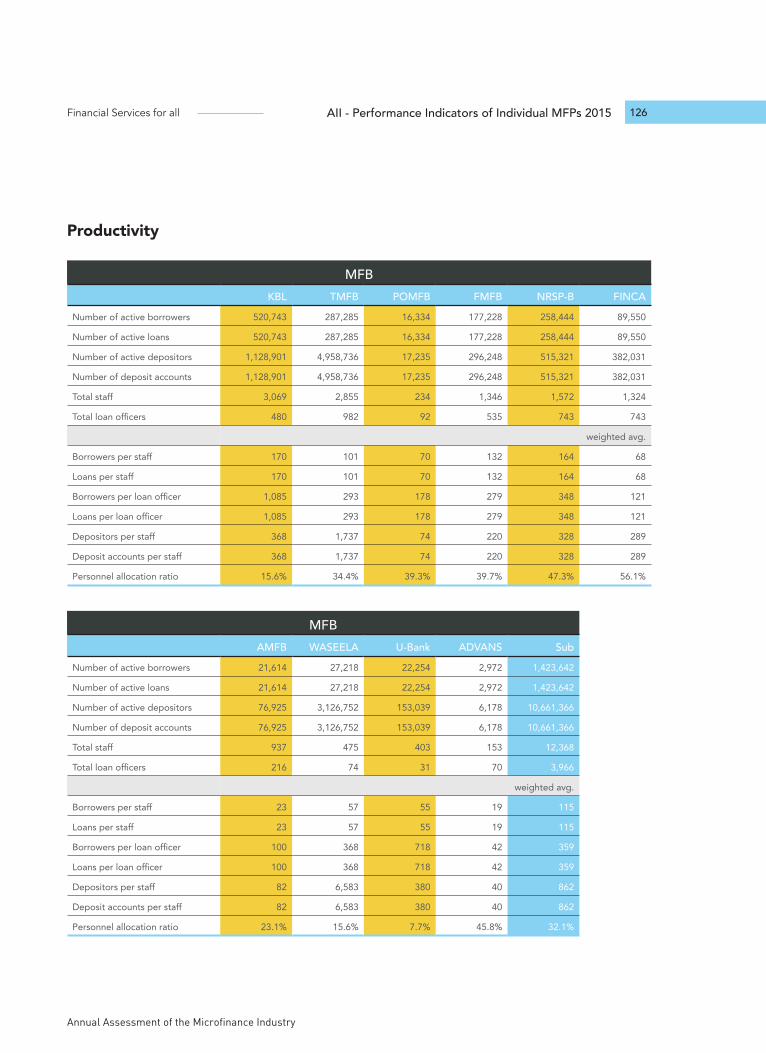
Annual Assessment of the Microfinance Industry
Financial Services for all 126AII - Performance Indicators of Individual MFPs 2015
Productivity
MFBKBL TMFB POMFB FMFB NRSP-B FINCA
Number of active borrowers 520,743 287,285 16,334 177,228 258,444 89,550
Number of active loans 520,743 287,285 16,334 177,228 258,444 89,550
Number of active depositors 1,128,901 4,958,736 17,235 296,248 515,321 382,031
Number of deposit accounts 1,128,901 4,958,736 17,235 296,248 515,321 382,031
Total staff 3,069 2,855 234 1,346 1,572 1,324
Total loan officers 480 982 92 535 743 743
weighted avg.
Borrowers per staff 170 101 70 132 164 68
Loans per staff 170 101 70 132 164 68
Borrowers per loan officer 1,085 293 178 279 348 121
Loans per loan officer 1,085 293 178 279 348 121
Depositors per staff 368 1,737 74 220 328 289
Deposit accounts per staff 368 1,737 74 220 328 289
Personnel allocation ratio 15.6% 34.4% 39.3% 39.7% 47.3% 56.1%
MFBAMFB WASEELA U-Bank ADVANS Sub
Number of active borrowers 21,614 27,218 22,254 2,972 1,423,642
Number of active loans 21,614 27,218 22,254 2,972 1,423,642
Number of active depositors 76,925 3,126,752 153,039 6,178 10,661,366
Number of deposit accounts 76,925 3,126,752 153,039 6,178 10,661,366
Total staff 937 475 403 153 12,368
Total loan officers 216 74 31 70 3,966
weighted avg.
Borrowers per staff 23 57 55 19 115
Loans per staff 23 57 55 19 115
Borrowers per loan officer 100 368 718 42 359
Loans per loan officer 100 368 718 42 359
Depositors per staff 82 6,583 380 40 862
Deposit accounts per staff 82 6,583 380 40 862
Personnel allocation ratio 23.1% 15.6% 7.7% 45.8% 32.1%
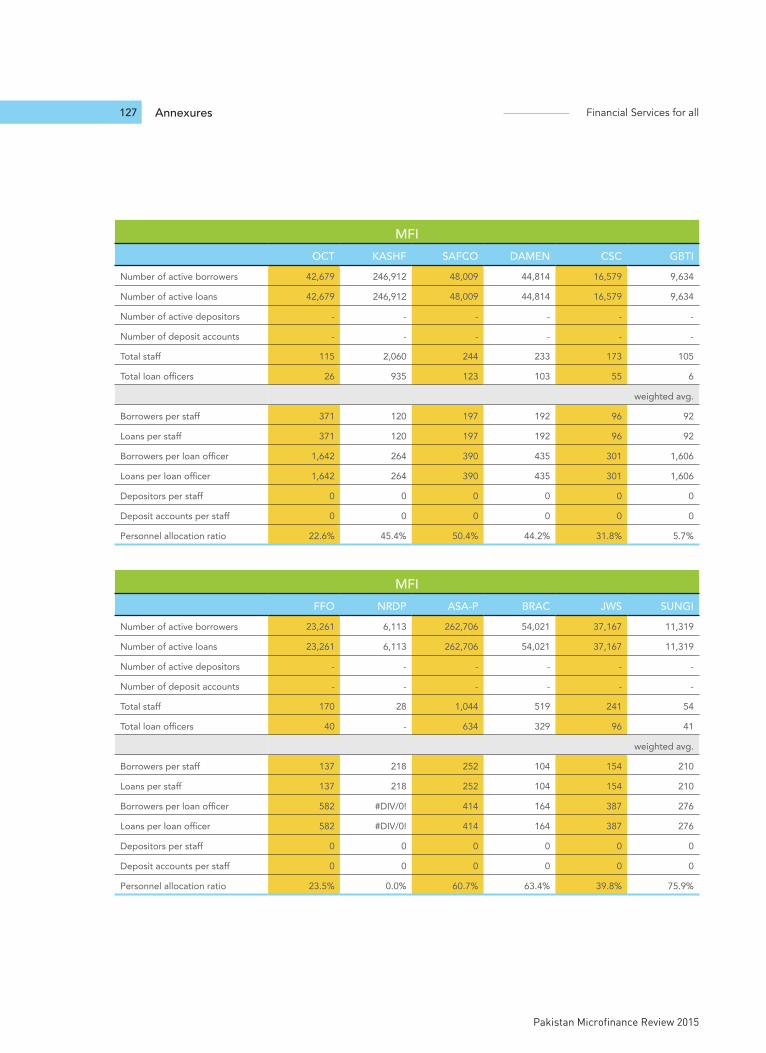
Annexures Financial Services for all
Pakistan Microfinance Review 2015
127
MFIOCT KASHF SAFCO DAMEN CSC GBTI
Number of active borrowers 42,679 246,912 48,009 44,814 16,579 9,634
Number of active loans 42,679 246,912 48,009 44,814 16,579 9,634
Number of active depositors - - - - - -
Number of deposit accounts - - - - - -
Total staff 115 2,060 244 233 173 105
Total loan officers 26 935 123 103 55 6
weighted avg.
Borrowers per staff 371 120 197 192 96 92
Loans per staff 371 120 197 192 96 92
Borrowers per loan officer 1,642 264 390 435 301 1,606
Loans per loan officer 1,642 264 390 435 301 1,606
Depositors per staff 0 0 0 0 0 0
Deposit accounts per staff 0 0 0 0 0 0
Personnel allocation ratio 22.6% 45.4% 50.4% 44.2% 31.8% 5.7%
MFIFFO NRDP ASA-P BRAC JWS SUNGI
Number of active borrowers 23,261 6,113 262,706 54,021 37,167 11,319
Number of active loans 23,261 6,113 262,706 54,021 37,167 11,319
Number of active depositors - - - - - -
Number of deposit accounts - - - - - -
Total staff 170 28 1,044 519 241 54
Total loan officers 40 - 634 329 96 41
weighted avg.
Borrowers per staff 137 218 252 104 154 210
Loans per staff 137 218 252 104 154 210
Borrowers per loan officer 582 #DIV/0! 414 164 387 276
Loans per loan officer 582 #DIV/0! 414 164 387 276
Depositors per staff 0 0 0 0 0 0
Deposit accounts per staff 0 0 0 0 0 0
Personnel allocation ratio 23.5% 0.0% 60.7% 63.4% 39.8% 75.9%
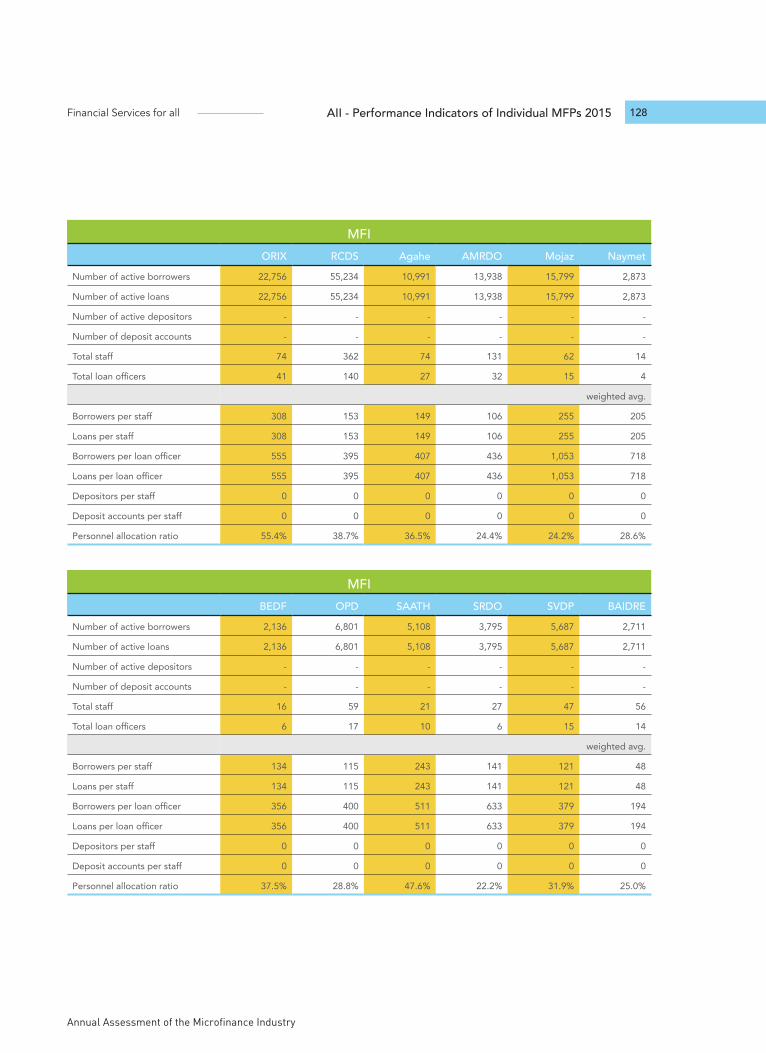
Annual Assessment of the Microfinance Industry
Financial Services for all 128AII - Performance Indicators of Individual MFPs 2015
MFIORIX RCDS Agahe AMRDO Mojaz Naymet
Number of active borrowers 22,756 55,234 10,991 13,938 15,799 2,873
Number of active loans 22,756 55,234 10,991 13,938 15,799 2,873
Number of active depositors - - - - - -
Number of deposit accounts - - - - - -
Total staff 74 362 74 131 62 14
Total loan officers 41 140 27 32 15 4
weighted avg.
Borrowers per staff 308 153 149 106 255 205
Loans per staff 308 153 149 106 255 205
Borrowers per loan officer 555 395 407 436 1,053 718
Loans per loan officer 555 395 407 436 1,053 718
Depositors per staff 0 0 0 0 0 0
Deposit accounts per staff 0 0 0 0 0 0
Personnel allocation ratio 55.4% 38.7% 36.5% 24.4% 24.2% 28.6%
MFIBEDF OPD SAATH SRDO SVDP BAIDRE
Number of active borrowers 2,136 6,801 5,108 3,795 5,687 2,711
Number of active loans 2,136 6,801 5,108 3,795 5,687 2,711
Number of active depositors - - - - - -
Number of deposit accounts - - - - - -
Total staff 16 59 21 27 47 56
Total loan officers 6 17 10 6 15 14
weighted avg.
Borrowers per staff 134 115 243 141 121 48
Loans per staff 134 115 243 141 121 48
Borrowers per loan officer 356 400 511 633 379 194
Loans per loan officer 356 400 511 633 379 194
Depositors per staff 0 0 0 0 0 0
Deposit accounts per staff 0 0 0 0 0 0
Personnel allocation ratio 37.5% 28.8% 47.6% 22.2% 31.9% 25.0%
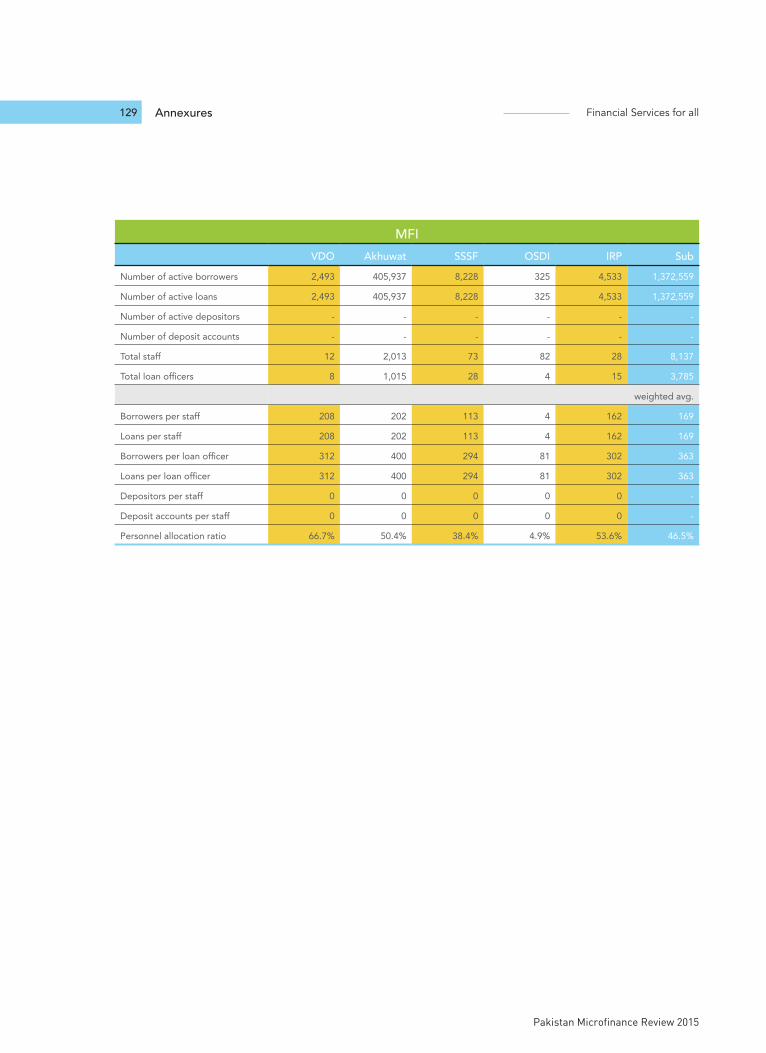
Annexures Financial Services for all
Pakistan Microfinance Review 2015
129
MFIVDO Akhuwat SSSF OSDI IRP Sub
Number of active borrowers 2,493 405,937 8,228 325 4,533 1,372,559
Number of active loans 2,493 405,937 8,228 325 4,533 1,372,559
Number of active depositors - - - - - -
Number of deposit accounts - - - - - -
Total staff 12 2,013 73 82 28 8,137
Total loan officers 8 1,015 28 4 15 3,785
weighted avg.
Borrowers per staff 208 202 113 4 162 169
Loans per staff 208 202 113 4 162 169
Borrowers per loan officer 312 400 294 81 302 363
Loans per loan officer 312 400 294 81 302 363
Depositors per staff 0 0 0 0 0 -
Deposit accounts per staff 0 0 0 0 0 -
Personnel allocation ratio 66.7% 50.4% 38.4% 4.9% 53.6% 46.5%
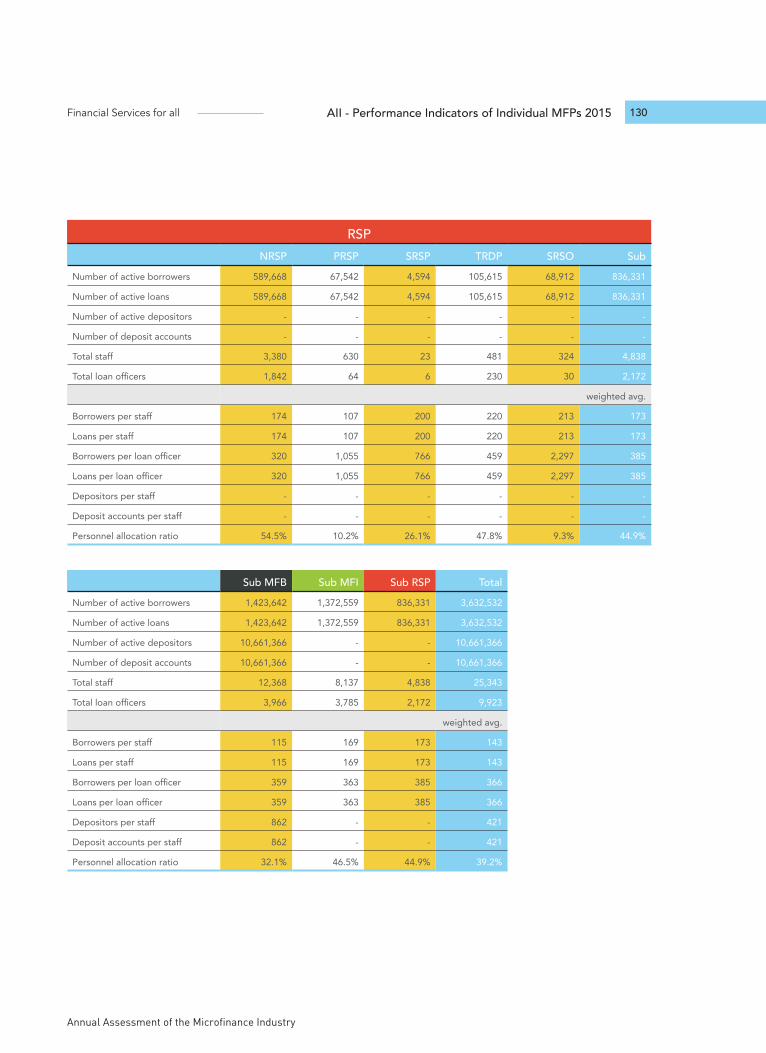
Annual Assessment of the Microfinance Industry
Financial Services for all 130AII - Performance Indicators of Individual MFPs 2015
RSPNRSP PRSP SRSP TRDP SRSO Sub
Number of active borrowers 589,668 67,542 4,594 105,615 68,912 836,331
Number of active loans 589,668 67,542 4,594 105,615 68,912 836,331
Number of active depositors - - - - - -
Number of deposit accounts - - - - - -
Total staff 3,380 630 23 481 324 4,838
Total loan officers 1,842 64 6 230 30 2,172
weighted avg.
Borrowers per staff 174 107 200 220 213 173
Loans per staff 174 107 200 220 213 173
Borrowers per loan officer 320 1,055 766 459 2,297 385
Loans per loan officer 320 1,055 766 459 2,297 385
Depositors per staff - - - - - -
Deposit accounts per staff - - - - - -
Personnel allocation ratio 54.5% 10.2% 26.1% 47.8% 9.3% 44.9%
Sub MFB Sub MFI Sub RSP TotalNumber of active borrowers 1,423,642 1,372,559 836,331 3,632,532
Number of active loans 1,423,642 1,372,559 836,331 3,632,532
Number of active depositors 10,661,366 - - 10,661,366
Number of deposit accounts 10,661,366 - - 10,661,366
Total staff 12,368 8,137 4,838 25,343
Total loan officers 3,966 3,785 2,172 9,923
weighted avg.
Borrowers per staff 115 169 173 143
Loans per staff 115 169 173 143
Borrowers per loan officer 359 363 385 366
Loans per loan officer 359 363 385 366
Depositors per staff 862 - - 421
Deposit accounts per staff 862 - - 421
Personnel allocation ratio 32.1% 46.5% 44.9% 39.2%
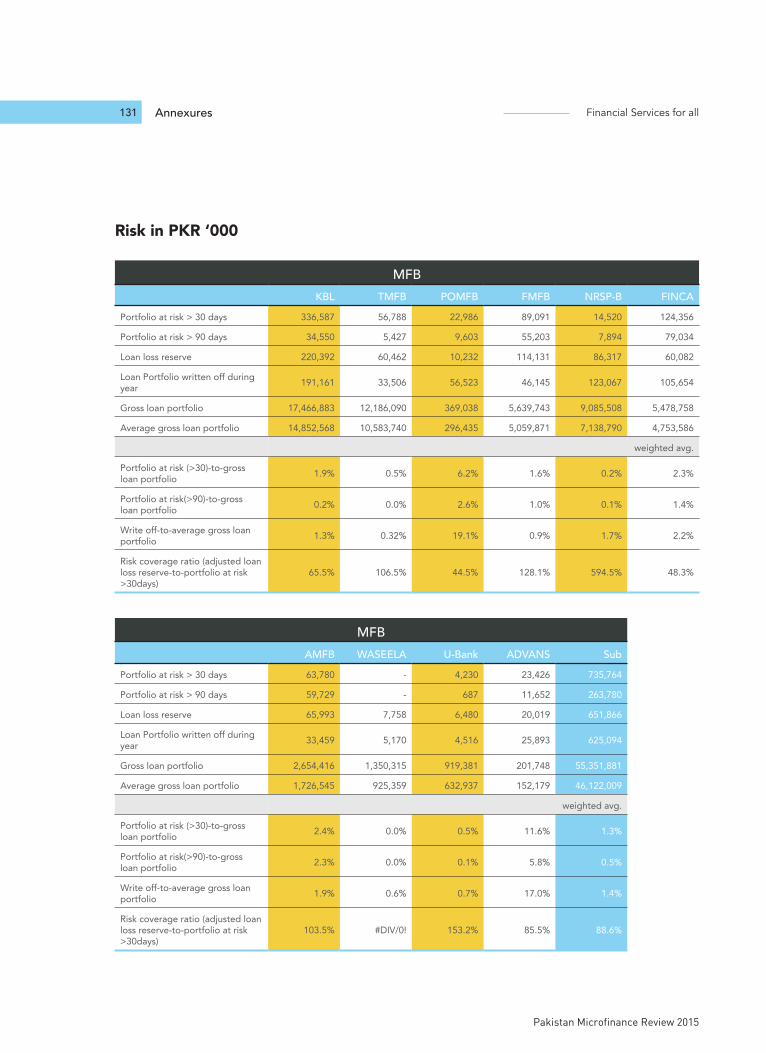
Annexures Financial Services for all
Pakistan Microfinance Review 2015
131
Risk in PKR ‘000
MFBKBL TMFB POMFB FMFB NRSP-B FINCA
Portfolio at risk > 30 days 336,587 56,788 22,986 89,091 14,520 124,356
Portfolio at risk > 90 days 34,550 5,427 9,603 55,203 7,894 79,034
Loan loss reserve 220,392 60,462 10,232 114,131 86,317 60,082
Loan Portfolio written off during year 191,161 33,506 56,523 46,145 123,067 105,654
Gross loan portfolio 17,466,883 12,186,090 369,038 5,639,743 9,085,508 5,478,758
Average gross loan portfolio 14,852,568 10,583,740 296,435 5,059,871 7,138,790 4,753,586
weighted avg.
Portfolio at risk (>30)-to-gross loan portfolio 1.9% 0.5% 6.2% 1.6% 0.2% 2.3%
Portfolio at risk(>90)-to-gross loan portfolio 0.2% 0.0% 2.6% 1.0% 0.1% 1.4%
Write off-to-average gross loan portfolio 1.3% 0.32% 19.1% 0.9% 1.7% 2.2%
Risk coverage ratio (adjusted loan loss reserve-to-portfolio at risk >30days)
65.5% 106.5% 44.5% 128.1% 594.5% 48.3%
MFBAMFB WASEELA U-Bank ADVANS Sub
Portfolio at risk > 30 days 63,780 - 4,230 23,426 735,764
Portfolio at risk > 90 days 59,729 - 687 11,652 263,780
Loan loss reserve 65,993 7,758 6,480 20,019 651,866
Loan Portfolio written off during year 33,459 5,170 4,516 25,893 625,094
Gross loan portfolio 2,654,416 1,350,315 919,381 201,748 55,351,881
Average gross loan portfolio 1,726,545 925,359 632,937 152,179 46,122,009
weighted avg.
Portfolio at risk (>30)-to-gross loan portfolio 2.4% 0.0% 0.5% 11.6% 1.3%
Portfolio at risk(>90)-to-gross loan portfolio 2.3% 0.0% 0.1% 5.8% 0.5%
Write off-to-average gross loan portfolio 1.9% 0.6% 0.7% 17.0% 1.4%
Risk coverage ratio (adjusted loan loss reserve-to-portfolio at risk >30days)
103.5% #DIV/0! 153.2% 85.5% 88.6%
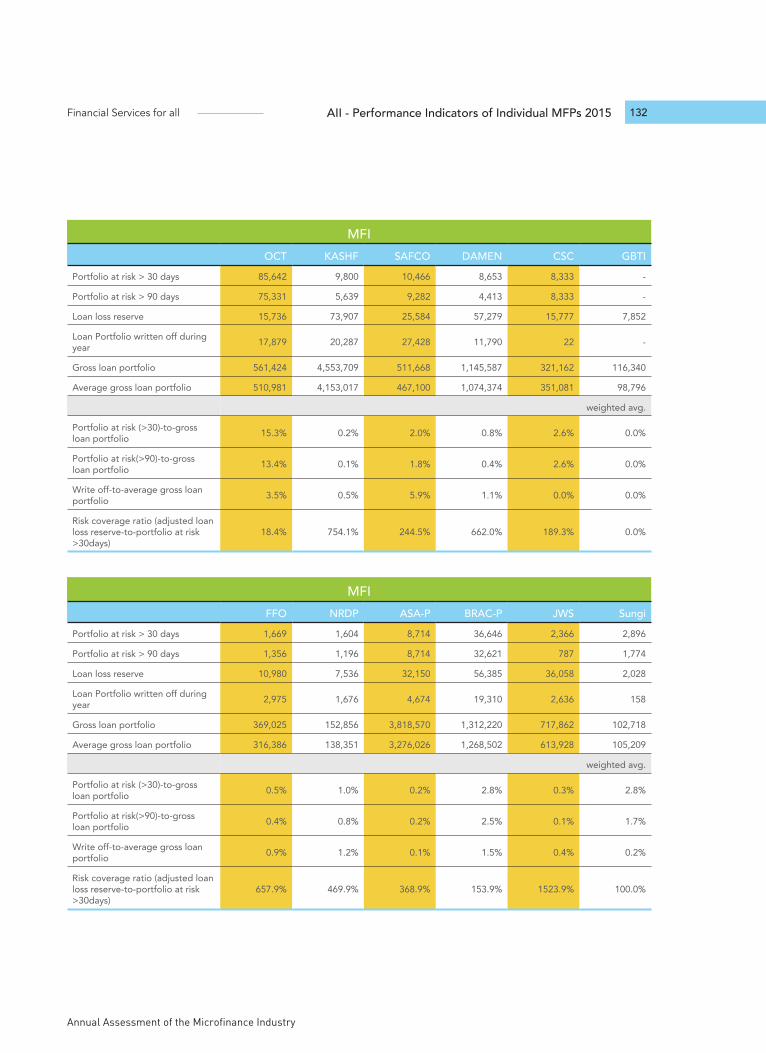
Annual Assessment of the Microfinance Industry
Financial Services for all 132AII - Performance Indicators of Individual MFPs 2015
MFIOCT KASHF SAFCO DAMEN CSC GBTI
Portfolio at risk > 30 days 85,642 9,800 10,466 8,653 8,333 -
Portfolio at risk > 90 days 75,331 5,639 9,282 4,413 8,333 -
Loan loss reserve 15,736 73,907 25,584 57,279 15,777 7,852
Loan Portfolio written off during year 17,879 20,287 27,428 11,790 22 -
Gross loan portfolio 561,424 4,553,709 511,668 1,145,587 321,162 116,340
Average gross loan portfolio 510,981 4,153,017 467,100 1,074,374 351,081 98,796
weighted avg.
Portfolio at risk (>30)-to-gross loan portfolio 15.3% 0.2% 2.0% 0.8% 2.6% 0.0%
Portfolio at risk(>90)-to-gross loan portfolio 13.4% 0.1% 1.8% 0.4% 2.6% 0.0%
Write off-to-average gross loan portfolio 3.5% 0.5% 5.9% 1.1% 0.0% 0.0%
Risk coverage ratio (adjusted loan loss reserve-to-portfolio at risk >30days)
18.4% 754.1% 244.5% 662.0% 189.3% 0.0%
MFIFFO NRDP ASA-P BRAC-P JWS Sungi
Portfolio at risk > 30 days 1,669 1,604 8,714 36,646 2,366 2,896
Portfolio at risk > 90 days 1,356 1,196 8,714 32,621 787 1,774
Loan loss reserve 10,980 7,536 32,150 56,385 36,058 2,028
Loan Portfolio written off during year 2,975 1,676 4,674 19,310 2,636 158
Gross loan portfolio 369,025 152,856 3,818,570 1,312,220 717,862 102,718
Average gross loan portfolio 316,386 138,351 3,276,026 1,268,502 613,928 105,209
weighted avg.
Portfolio at risk (>30)-to-gross loan portfolio 0.5% 1.0% 0.2% 2.8% 0.3% 2.8%
Portfolio at risk(>90)-to-gross loan portfolio 0.4% 0.8% 0.2% 2.5% 0.1% 1.7%
Write off-to-average gross loan portfolio 0.9% 1.2% 0.1% 1.5% 0.4% 0.2%
Risk coverage ratio (adjusted loan loss reserve-to-portfolio at risk >30days)
657.9% 469.9% 368.9% 153.9% 1523.9% 100.0%
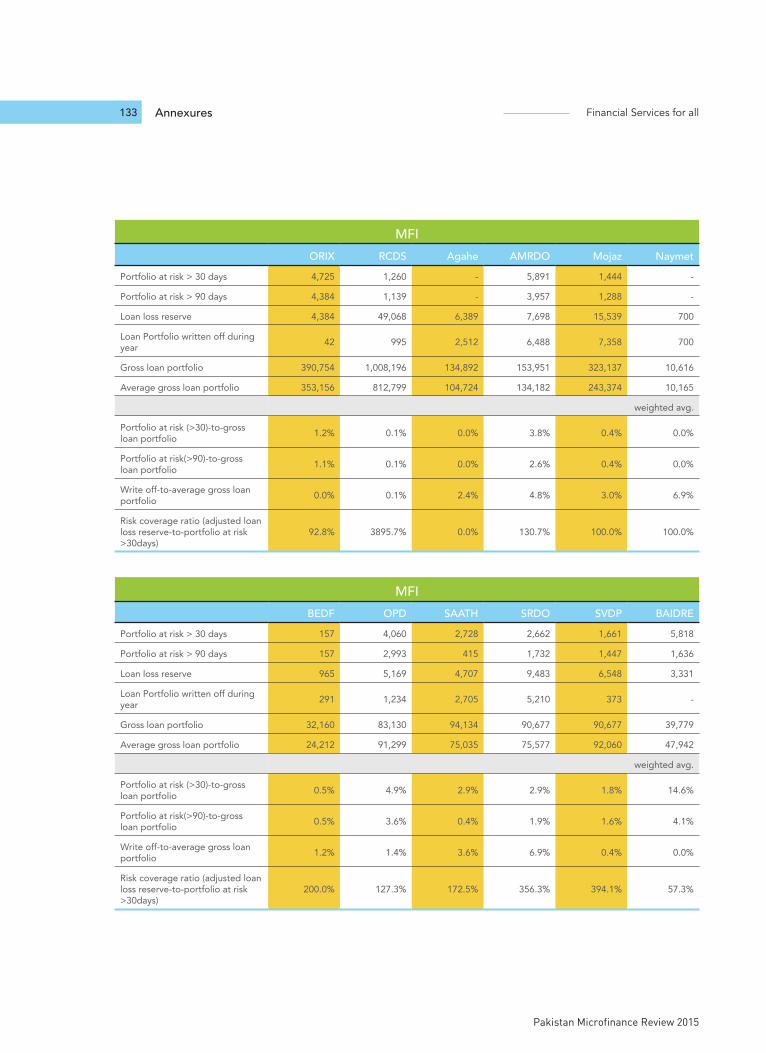
Annexures Financial Services for all
Pakistan Microfinance Review 2015
133
MFIORIX RCDS Agahe AMRDO Mojaz Naymet
Portfolio at risk > 30 days 4,725 1,260 - 5,891 1,444 -
Portfolio at risk > 90 days 4,384 1,139 - 3,957 1,288 -
Loan loss reserve 4,384 49,068 6,389 7,698 15,539 700
Loan Portfolio written off during year 42 995 2,512 6,488 7,358 700
Gross loan portfolio 390,754 1,008,196 134,892 153,951 323,137 10,616
Average gross loan portfolio 353,156 812,799 104,724 134,182 243,374 10,165
weighted avg.
Portfolio at risk (>30)-to-gross loan portfolio 1.2% 0.1% 0.0% 3.8% 0.4% 0.0%
Portfolio at risk(>90)-to-gross loan portfolio 1.1% 0.1% 0.0% 2.6% 0.4% 0.0%
Write off-to-average gross loan portfolio 0.0% 0.1% 2.4% 4.8% 3.0% 6.9%
Risk coverage ratio (adjusted loan loss reserve-to-portfolio at risk >30days)
92.8% 3895.7% 0.0% 130.7% 100.0% 100.0%
MFIBEDF OPD SAATH SRDO SVDP BAIDRE
Portfolio at risk > 30 days 157 4,060 2,728 2,662 1,661 5,818
Portfolio at risk > 90 days 157 2,993 415 1,732 1,447 1,636
Loan loss reserve 965 5,169 4,707 9,483 6,548 3,331
Loan Portfolio written off during year 291 1,234 2,705 5,210 373 -
Gross loan portfolio 32,160 83,130 94,134 90,677 90,677 39,779
Average gross loan portfolio 24,212 91,299 75,035 75,577 92,060 47,942
weighted avg.
Portfolio at risk (>30)-to-gross loan portfolio 0.5% 4.9% 2.9% 2.9% 1.8% 14.6%
Portfolio at risk(>90)-to-gross loan portfolio 0.5% 3.6% 0.4% 1.9% 1.6% 4.1%
Write off-to-average gross loan portfolio 1.2% 1.4% 3.6% 6.9% 0.4% 0.0%
Risk coverage ratio (adjusted loan loss reserve-to-portfolio at risk >30days)
200.0% 127.3% 172.5% 356.3% 394.1% 57.3%
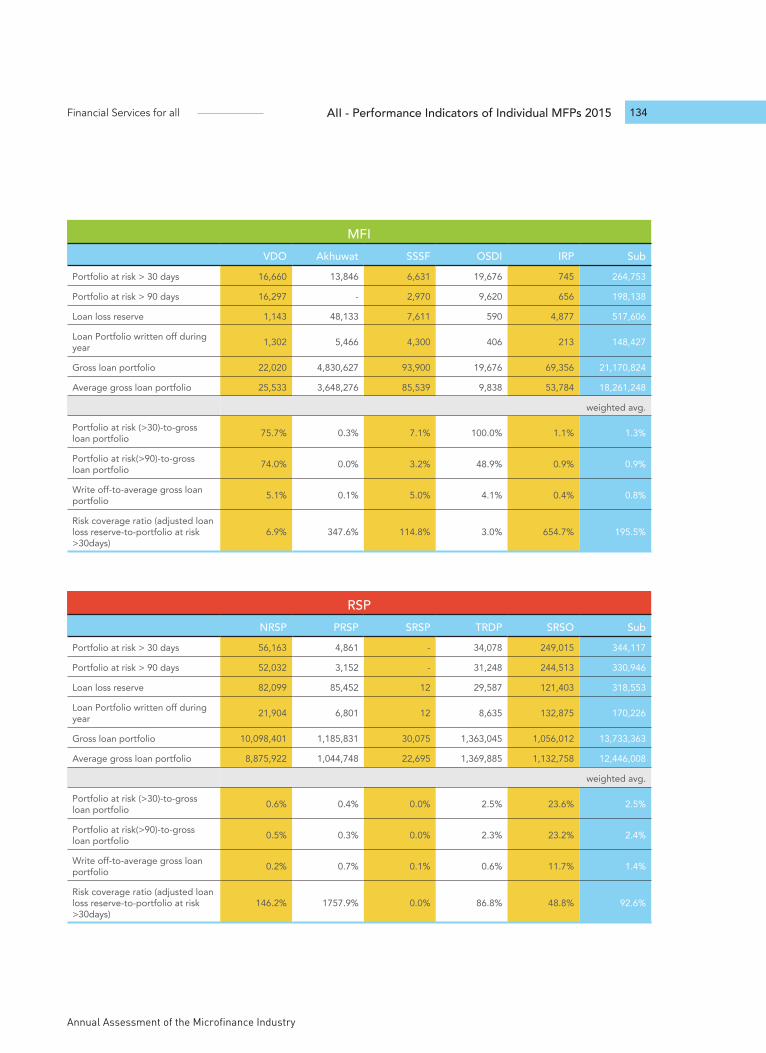
Annual Assessment of the Microfinance Industry
Financial Services for all 134AII - Performance Indicators of Individual MFPs 2015
MFIVDO Akhuwat SSSF OSDI IRP Sub
Portfolio at risk > 30 days 16,660 13,846 6,631 19,676 745 264,753
Portfolio at risk > 90 days 16,297 - 2,970 9,620 656 198,138
Loan loss reserve 1,143 48,133 7,611 590 4,877 517,606
Loan Portfolio written off during year 1,302 5,466 4,300 406 213 148,427
Gross loan portfolio 22,020 4,830,627 93,900 19,676 69,356 21,170,824
Average gross loan portfolio 25,533 3,648,276 85,539 9,838 53,784 18,261,248
weighted avg.
Portfolio at risk (>30)-to-gross loan portfolio 75.7% 0.3% 7.1% 100.0% 1.1% 1.3%
Portfolio at risk(>90)-to-gross loan portfolio 74.0% 0.0% 3.2% 48.9% 0.9% 0.9%
Write off-to-average gross loan portfolio 5.1% 0.1% 5.0% 4.1% 0.4% 0.8%
Risk coverage ratio (adjusted loan loss reserve-to-portfolio at risk >30days)
6.9% 347.6% 114.8% 3.0% 654.7% 195.5%
RSPNRSP PRSP SRSP TRDP SRSO Sub
Portfolio at risk > 30 days 56,163 4,861 - 34,078 249,015 344,117
Portfolio at risk > 90 days 52,032 3,152 - 31,248 244,513 330,946
Loan loss reserve 82,099 85,452 12 29,587 121,403 318,553
Loan Portfolio written off during year 21,904 6,801 12 8,635 132,875 170,226
Gross loan portfolio 10,098,401 1,185,831 30,075 1,363,045 1,056,012 13,733,363
Average gross loan portfolio 8,875,922 1,044,748 22,695 1,369,885 1,132,758 12,446,008
weighted avg.
Portfolio at risk (>30)-to-gross loan portfolio 0.6% 0.4% 0.0% 2.5% 23.6% 2.5%
Portfolio at risk(>90)-to-gross loan portfolio 0.5% 0.3% 0.0% 2.3% 23.2% 2.4%
Write off-to-average gross loan portfolio 0.2% 0.7% 0.1% 0.6% 11.7% 1.4%
Risk coverage ratio (adjusted loan loss reserve-to-portfolio at risk >30days)
146.2% 1757.9% 0.0% 86.8% 48.8% 92.6%
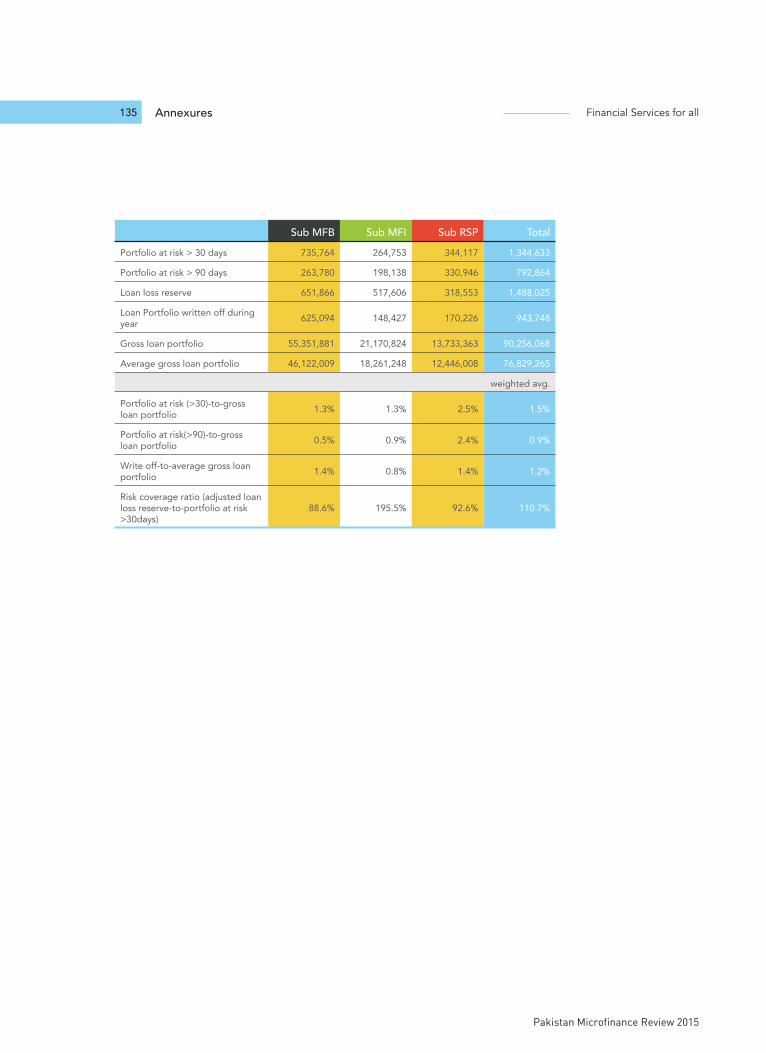
Annexures Financial Services for all
Pakistan Microfinance Review 2015
135
Sub MFB Sub MFI Sub RSP TotalPortfolio at risk > 30 days 735,764 264,753 344,117 1,344,633
Portfolio at risk > 90 days 263,780 198,138 330,946 792,864
Loan loss reserve 651,866 517,606 318,553 1,488,025
Loan Portfolio written off during year 625,094 148,427 170,226 943,748
Gross loan portfolio 55,351,881 21,170,824 13,733,363 90,256,068
Average gross loan portfolio 46,122,009 18,261,248 12,446,008 76,829,265
weighted avg.
Portfolio at risk (>30)-to-gross loan portfolio 1.3% 1.3% 2.5% 1.5%
Portfolio at risk(>90)-to-gross loan portfolio 0.5% 0.9% 2.4% 0.9%
Write off-to-average gross loan portfolio 1.4% 0.8% 1.4% 1.2%
Risk coverage ratio (adjusted loan loss reserve-to-portfolio at risk >30days)
88.6% 195.5% 92.6% 110.7%
PAK
ISTA
N M
ICR
OFI
NA
NC
E R
EV
IEW
201
5

Annual Assessment of the Microfinance Industry
Financial Services for all 136AII - Performance Indicators of Individual MFPs 2015
PAK
ISTA
N M
ICR
OFI
NA
NC
E R
EV
IEW
201
5


F I N A N C I A L S E R V I C E S F O R A L L
Pakistan Microfinance Network
Third Floor, Plot No. 12-3/2, Mandir Square, G-8/1 Markaz, IslamabadTel: +92 51 2266214-17, Fax: +92 51 2266218
www.pmn.org.pk


