Vadose Zone Journal | Advancing Critical Zone Science
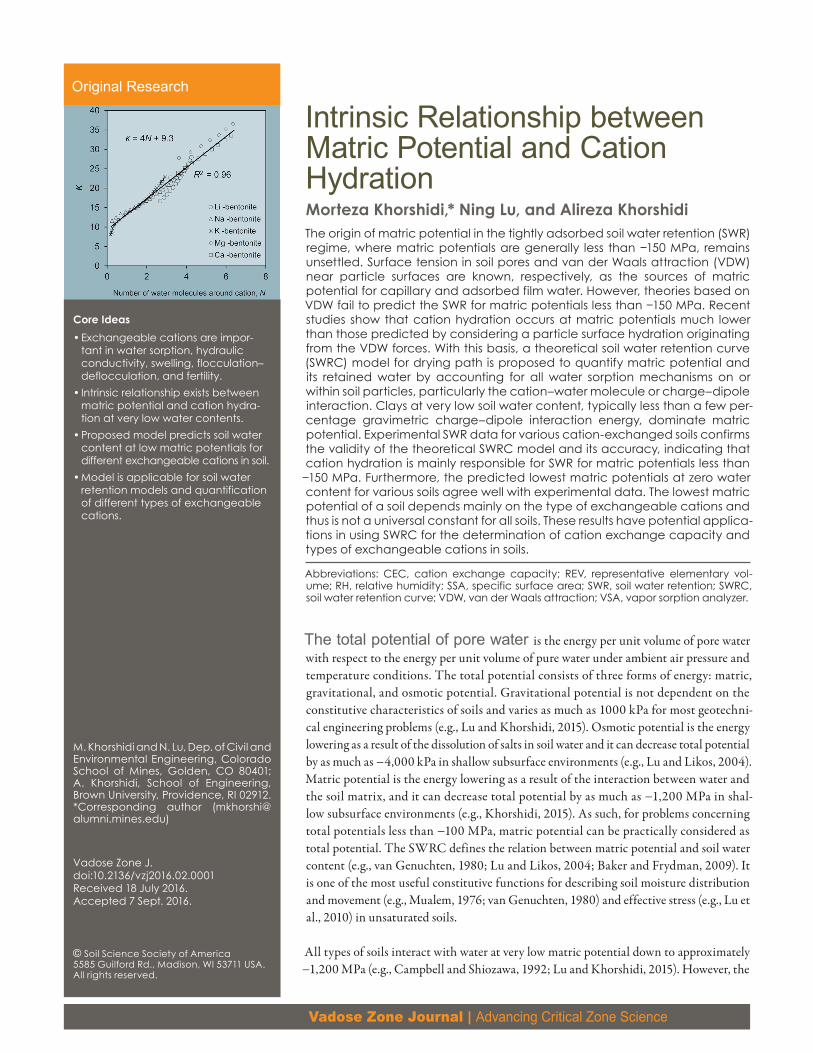
Intrinsic Relationship between Matric Potential and Cation HydrationMorteza Khorshidi,* Ning Lu, and Alireza KhorshidiThe origin of matric potential in the tightly adsorbed soil water retention (SWR) regime, where matric potentials are generally less than −150 MPa, remains unsettled. Surface tension in soil pores and van der Waals attraction (VDW) near particle surfaces are known, respectively, as the sources of matric potential for capillary and adsorbed film water. However, theories based on VDW fail to predict the SWR for matric potentials less than −150 MPa. Recent studies show that cation hydration occurs at matric potentials much lower than those predicted by considering a particle surface hydration originating from the VDW forces. With this basis, a theoretical soil water retention curve (SWRC) model for drying path is proposed to quantify matric potential and its retained water by accounting for all water sorption mechanisms on or within soil particles, particularly the cation–water molecule or charge–dipole interaction. Clays at very low soil water content, typically less than a few per-centage gravimetric charge–dipole interaction energy, dominate matric potential. Experimental SWR data for various cation-exchanged soils confirms the validity of the theoretical SWRC model and its accuracy, indicating that cation hydration is mainly responsible for SWR for matric potentials less than
−150 MPa. Furthermore, the predicted lowest matric potentials at zero water content for various soils agree well with experimental data. The lowest matric potential of a soil depends mainly on the type of exchangeable cations and thus is not a universal constant for all soils. These results have potential applica-tions in using SWRC for the determination of cation exchange capacity and types of exchangeable cations in soils.
Abbreviations: CEC, cation exchange capacity; REV, representative elementary vol-ume; RH, relative humidity; SSA, specific surface area; SWR, soil water retention; SWRC, soil water retention curve; VDW, van der Waals attraction; VSA, vapor sorption analyzer.
The total potential of pore water is the energy per unit volume of pore water with respect to the energy per unit volume of pure water under ambient air pressure and temperature conditions. The total potential consists of three forms of energy: matric, gravitational, and osmotic potential. Gravitational potential is not dependent on the constitutive characteristics of soils and varies as much as 1000 kPa for most geotechni-cal engineering problems (e.g., Lu and Khorshidi, 2015). Osmotic potential is the energy lowering as a result of the dissolution of salts in soil water and it can decrease total potential by as much as −4,000 kPa in shallow subsurface environments (e.g., Lu and Likos, 2004). Matric potential is the energy lowering as a result of the interaction between water and the soil matrix, and it can decrease total potential by as much as −1,200 MPa in shal-low subsurface environments (e.g., Khorshidi, 2015). As such, for problems concerning total potentials less than −100 MPa, matric potential can be practically considered as total potential. The SWRC defines the relation between matric potential and soil water content (e.g., van Genuchten, 1980; Lu and Likos, 2004; Baker and Frydman, 2009). It is one of the most useful constitutive functions for describing soil moisture distribution and movement (e.g., Mualem, 1976; van Genuchten, 1980) and effective stress (e.g., Lu et al., 2010) in unsaturated soils.
All types of soils interact with water at very low matric potential down to approximately −1,200 MPa (e.g., Campbell and Shiozawa, 1992; Lu and Khorshidi, 2015). However, the
Core Ideas• Exchangeable cations are impor-
tant in water sorption, hydraulic conductivity, swelling, flocculation–deflocculation, and fertility.
• Intrinsic relationship exists between matric potential and cation hydra-tion at very low water contents.
• Proposed model predicts soil water content at low matric potentials for different exchangeable cations in soil.
• Model is applicable for soil water retention models and quantification of different types of exchangeable cations.
M. Khorshidi and N. Lu, Dep. of Civil and Environmental Engineering, Colorado School of Mines, Golden, CO 80401; A. Khorshidi, School of Engineering, Brown University, Providence, RI 02912. *Corresponding author ([email protected])
Vadose Zone J. doi:10.2136/vzj2016.02.0001Received 18 July 2016. Accepted 7 Sept. 2016.
Original Research
© Soil Science Society of America 5585 Guilford Rd., Madison, WI 53711 USA.All rights reserved.
VZJ | Advancing Critical Zone Science p. 2 of 12
ability to retain water at very low matric potential, generally less than −100 MPa, varies greatly from soil to soil. For instance, the gravimetric water content at given low matric potential of −100 MPa can be much less than 1% in coarse-grained soils like Ottawa sand, whereas it can be as much as 25% in montmorillonite clay (Likos and Lu, 2006). We define the range of very low matric potentials in this study as −150 MPa as the upper bound with a lower bound of −1,200 MPa. Despite substantial effort to develop SWRC models for the entire matric potential range (e.g., Lebeau and Konrad, 2010; Jensen et Al., 2015; Lu, 2016), the SWR relation over the very low matric potential range is still poorly defined primarily because of the lack of understanding of soil water interaction mechanisms and quantitative theories for the SWRC.
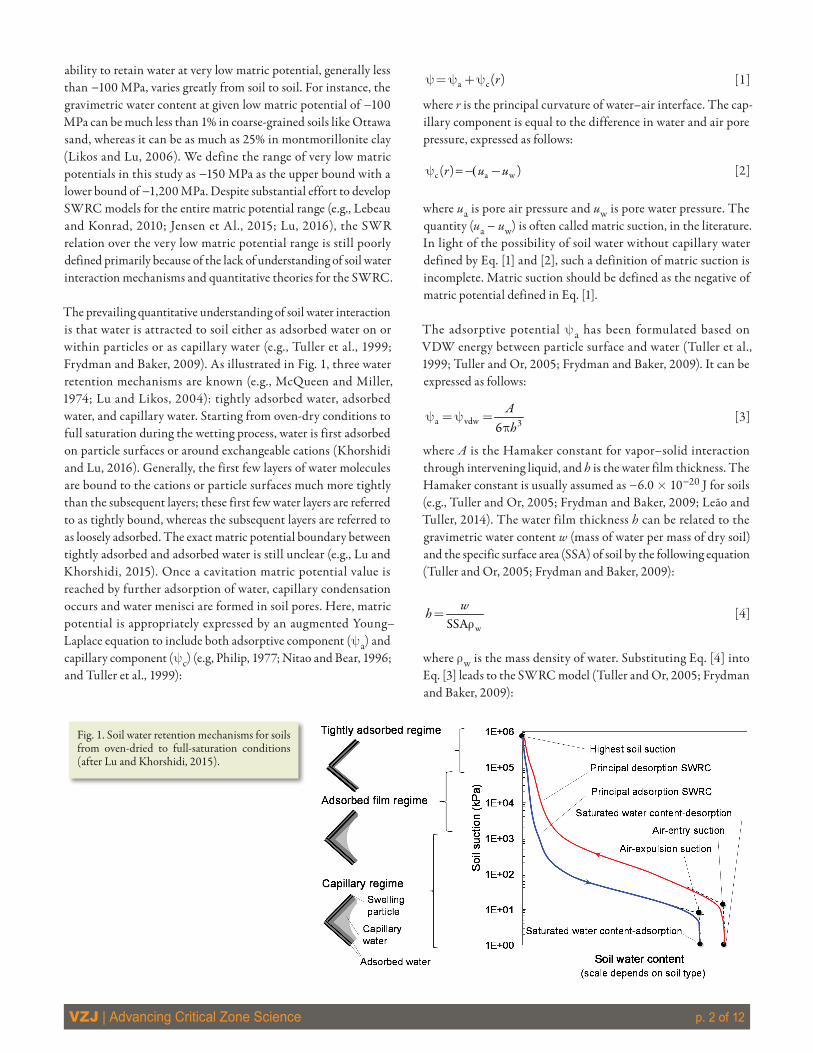
The prevailing quantitative understanding of soil water interaction is that water is attracted to soil either as adsorbed water on or within particles or as capillary water (e.g., Tuller et al., 1999; Frydman and Baker, 2009). As illustrated in Fig. 1, three water retention mechanisms are known (e.g., McQueen and Miller, 1974; Lu and Likos, 2004): tightly adsorbed water, adsorbed water, and capillary water. Starting from oven-dry conditions to full saturation during the wetting process, water is first adsorbed on particle surfaces or around exchangeable cations (Khorshidi and Lu, 2016). Generally, the first few layers of water molecules are bound to the cations or particle surfaces much more tightly than the subsequent layers; these first few water layers are referred to as tightly bound, whereas the subsequent layers are referred to as loosely adsorbed. The exact matric potential boundary between tightly adsorbed and adsorbed water is still unclear (e.g., Lu and Khorshidi, 2015). Once a cavitation matric potential value is reached by further adsorption of water, capillary condensation occurs and water menisci are formed in soil pores. Here, matric potential is appropriately expressed by an augmented Young–Laplace equation to include both adsorptive component (ya) and capillary component (yc) (e.g, Philip, 1977; Nitao and Bear, 1996; and Tuller et al., 1999):
a c ( )ry=y +y [1]
where r is the principal curvature of water–air interface. The cap-illary component is equal to the difference in water and air pore pressure, expressed as follows:
c a w( ) )r u uy -= −( [2]
where ua is pore air pressure and uw is pore water pressure. The quantity (ua − uw) is often called matric suction, in the literature. In light of the possibility of soil water without capillary water defined by Eq. [1] and [2], such a definition of matric suction is incomplete. Matric suction should be defined as the negative of matric potential defined in Eq. [1].
The adsorptive potential y a has been formulated based on VDW energy between particle surface and water (Tuller et al., 1999; Tuller and Or, 2005; Frydman and Baker, 2009). It can be expressed as follows:
a vdw 36Ah
y =y =p
[3]
where A is the Hamaker constant for vapor–solid interaction through intervening liquid, and h is the water film thickness. The Hamaker constant is usually assumed as −6.0 ´ 10−20 J for soils (e.g., Tuller and Or, 2005; Frydman and Baker, 2009; Leão and Tuller, 2014). The water film thickness h can be related to the gravimetric water content w (mass of water per mass of dry soil) and the specific surface area (SSA) of soil by the following equation (Tuller and Or, 2005; Frydman and Baker, 2009):
wSSAwh=r
[4]
where rw is the mass density of water. Substituting Eq. [4] into Eq. [3] leads to the SWRC model (Tuller and Or, 2005; Frydman and Baker, 2009):
Fig. 1. Soil water retention mechanisms for soils from oven-dried to full-saturation conditions (after Lu and Khorshidi, 2015).
VZJ | Advancing Critical Zone Science p. 3 of 12
3w
a vdw 3(SSA )
6A
wr
y =y =p
[5]
The above SWRC model typically describes SWR behavior down to matric potential of between −200 and −300 MPa. Below this range of matric potential values, large discrepancies (one to several orders of magnitude) between measured SWR data and SWRC models are evident. Frydman and Baker (2009) showed that mea-surements from kaolin and montmorillonite soils depart up to orders of magnitude from the theoretical predictions (using Eq. [5]) in the range of relative humidity (RH) between 5 and 30%, indicating that VDW might not be dominant. Tuller and Or (2005) recommended to use the above equation for soils with SSA >200 m2 g−1 (generally nonexpansive soils). Furthermore, Leão and Tuller (2014) derived an equation to calculate SSA as a fitting parameter for various nonexpansive soils using soil water sorption isotherms and Eq. [5]. Comparison between the measured soil water sorption isotherms and the predicted isotherms using the cal-culated SSA values reveals orders of magnitude deviation between predicted and measured isotherms at very low matric potentials (as discussed in Leão and Tuller, 2014). These observations imply that at very low matric potential range, particle surface hydration might not be the controlling factor. As shown below, another type of hydration (cation hydration) may play an important role in the adsorption of water for matric potentials less than −200 MPa or matric suctions >200 MPa.
During water adsorption on soil, hydration can occur at two loca-tions: on exchangeable cation and on the interlayer particle surface (e.g., Xu et al., 2010; Lu and Khorshidi, 2015; Khorshidi and Lu, 2016). Several studies have indicated that the cation hydration mechanism dominates during water sorption at very low matric potentials (e.g., Quirk, 1955; Hu et al., 1995; Prost et al., 1998; Laird, 1999; Sposito, 2008; Xu et al., 2010). It was also shown that by normalizing the water content of soils by their cation exchange capacity (CEC), a unified curve at low RH range is obtained, dem-onstrating the substantial effect of cations on water adsorption (e.g., Woodruff and Revil, 2011; Revil and Lu, 2013). Recently, Khorshidi and Lu (2016) demonstrated quantitatively that prior to particle surface hydration, water molecules are first adsorbed by exchangeable cations in their hydration shell until the number of water molecules reaches the cation hydration number. They confirmed this notion by comparing the water content computed based on soil CEC and cation hydration number with the water contents obtained by two independent methods derived based on the measured water sorption isotherms. Therefore, the definition of matric potential at very high matric suction needs to be recon-ceptualized and reformulated.
According to the previously described findings, neglecting the impact of cation hydration on matric potential may not be accurate at very low water content in soil. The objectives of this study are to (i) distinguish the impact of different water retention mechanisms
on matric potential and their operating ranges and (ii) derive a SWRC model suitable to describe matric potential in the very low range. As a corollary of the model, the matric potential at zero water content for any soil can be defined and quantified.
6Theoretical and Experimental MethodsThermodynamic Energy for Soil Water Retention at Low Water ContentThermodynamics is used to define state variables controlling the multiphase transfer in porous media (e.g., Hassanizadeh and Gray, 1979; 1980; Sposito and Chu, 1981; 1982) and to identify and define forms of energy changes in the process of interest. Matric potential in soil can be defined as “the amount of work that must be done per unit quantity of pure water to transport reversibly and isothermally to the soil water at a considered point, an infinitesimal quantity of water from a reference pool” (Nitao and Bear, 1996):
w T,PG Vy=¶ ¶ [6]
where Vw is volume of soil water and G is defined as the Gibbs free energy for water retention (e.g., Nye and Tinker, 1977). For systems with constant temperature and pressure conditions, Gibbs free energy is a convenient representation of energy to define matric potential (e.g., Nitao and Bear, 1996). Matric potential can also be interpreted as the transferable or reversible energy per unit volume of water (e.g., Lu and Likos, 2004; Baker and Frydman, 2009).
Under the transferable or reversible energy concept defined by Gibbs free energy, several types of transferable work acting on water molecules during water sorption on a soil have been identi-fied and formulated in the existing thermodynamic theories for unsaturated soil systems (e.g., Sposito and Chu, 1981; Iwata and Tabuchi, 1988). Below are synopses of the energy forms relevant to the three soil water retention regimes shown in Fig. 1 in the order from high to low matric potentials.
1. Surface tension work Ts dA, where Ts and A are surface tension and interfacial area between air and water in soil volume, respectively. This form of energy is the most widely used in the literature for unsaturated soil problems; nearly all studies, whether implicitly or explicitly, consider surface tension as the major form of energy in unsaturated soils no matter what types of soils. However, as illustrated in Fig. 1, surface tension is only important in the capillary water retention regime.
2. Temperature work S dT, where S is the entropy defining the heat energy change per unit temperature, and T is the temperature in Kelvin. If a system is considered to be in local thermodynamic equilibrium, then this term can be ignored, as the Gibbs energy is identical to the chemical potential or total potential within
VZJ | Advancing Critical Zone Science p. 4 of 12
a given representative elementary volume (REV) of soil. This is assumed in this study.
3. Van der Waals force field work (¶Uvdw/¶h) dh, where Uvdw is the van der Waals potential interaction energy between particle surface and a layer of water, and h is the distance of water layer from particle surface. This work operates within the adsorbed film regime shown in Fig. 1 and has been a focus of some recent studies (e.g., Nitao and Bear, 1996; Tuller et al., 1999).
4. Compression work VwdP within a REV, where Vw is the volume of water within an REV, and P is the pressure, which could be from either external or internal. The mechanism of matric potential from an external stress is called overburden effect in the literature (e.g., Coleman and Croney, 1952; Philip, 1969; Groenevelt and Bolt, 1972; Iwata and Tabuchi, 1988), and it is poorly understood. It is most pronounced in clayey soils but has negligible effect in sandy soils. Since in most geotechnical systems the overburden or load is less than a few thousands of kPa, the induced increase in matric potential is no more than 1000 kPa; it can be ignored for matric potentials varying within the tightly adsorbed regime shown in Fig. 1. While the internal pressure has been conceptually proposed for some years in soil physics (e.g., Sposito, 1972; Iwata and Tabuchi, 1988), only recently has it been proposed as the cause for hydraulic hysteresis in the tightly adsorbed water retention regime shown in Fig. 1 (Lu and Khorshidi, 2015). This work includes energies of cation and water molecule interaction and cation, water molecule, and intercrystalline particle surface interaction. The cation and water molecule interaction will be the focus of this study.
5. Electrical field work (Vw/(4p)) [(D/ e ) − D] dD, where D is the electric displacement, and e is the partial dielectric constant of the medium. It literally includes the electrostatic energy from the true charges of the particle surface, the elastic energy caused by the electric field, and the interaction energies between dipoles (water molecules) and surface charges between dipoles and polarized charges generated at the boundary between particle surface and dipole molecules and between dipole and dipoles. This work is most pronounced in the tightly adsorbed regime and it will be considered in this study. It is important to note that both D and depend on Vw.
The above five forms of matric potential can be expressed in the differential form of the Gibbs free energy:
vdw ww ext s c d t
d
d d d d d d4
GU V DV P S T T A h u N D Dh -
=
æ ö¶ ÷ç- + + + + - ÷ç ÷çè ø¶ p e
[7]
where Pext is the external pressure or load, and the internal pressure as a result of the cation hydration work is taken into account by multiplying the interaction energy uc−d between one cation and one water molecule to the number of water molecules Nt in a unit mass of soil. The matric potential from the internal pressure of
cation–water–particle surface is not considered, as it is the reason for hydraulic hysteresis along the wetting path (Lu and Khorshidi, 2015). Thus, the SWR data and model here are for the drying state. The VDW work here corresponds to the conditions where layers of water molecules are formed on the entire particle surface. For the case of very low water content, where a monolayer of water has not fully formed, the VDW contribution may be obtained by multiplying Nt to the interaction energy uvdw between the particle surface and one water molecule. Therefore, Eq. [7] for very low water content is as follows:
ww ext s vdw t c d t
d
d d d d d d4
GV DV P S T T A u N u N D D-
=
æ ö÷ç- + + + + - ÷ç ÷çè øp e
[8]
Assuming constant pressure and temperature condition during water sorption, the first two terms on the right hand side of the above equation can be ignored. In addition, the surface tension is not important in the tightly adsorbed water retention regime, as there is no curved interface between water and air (no capillary water exists). Hence, Eq. [8] is reduced to the following:
wvdw t c d td d d d
4V DG u N u N D D-
æ ö÷ç= + + - ÷ç ÷çè øp e [9]
Each unit layer within the crystalline structure can be considered as a planar surface made up of repeating units. Therefore, the attractive VDW energy between particle surface and one water molecule is calculated by the following (Israelachvili, 2011):
vdw 3( )6Cu hh
p r=- [10]
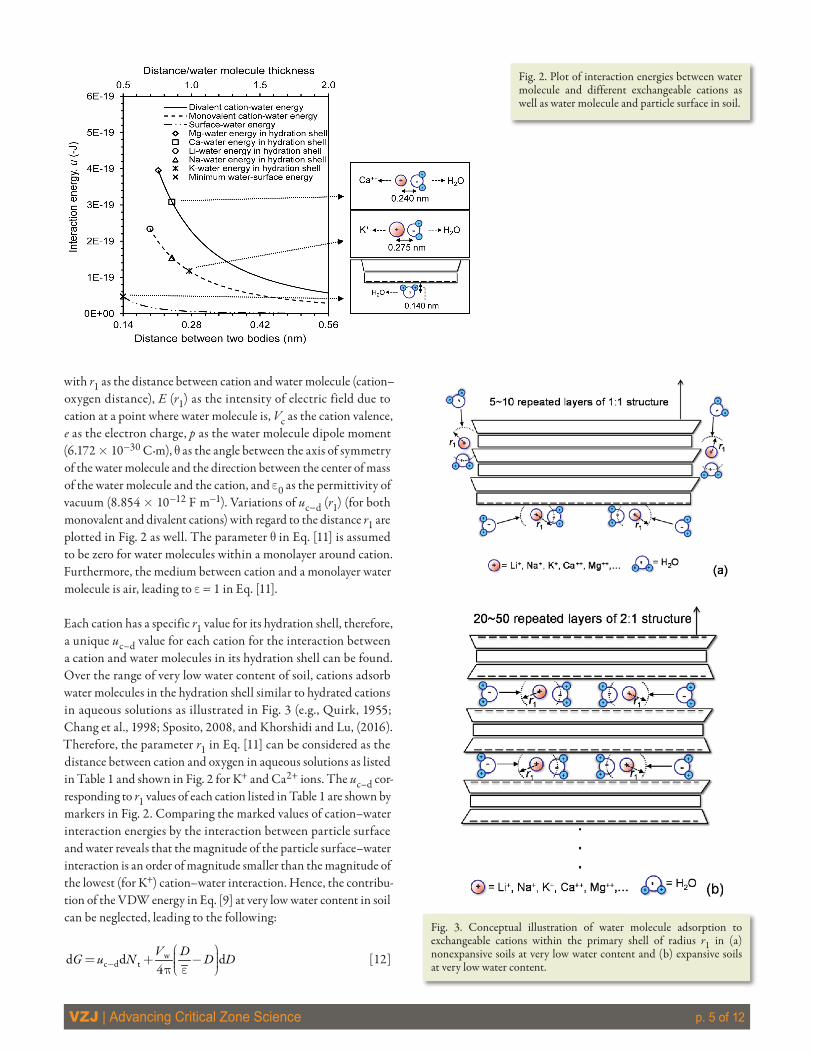
where C is the VDW energy coefficient (10−77 J m6), r is the number density of soil molecules, and h is the distance between the water molecule and the particle surface. The variation of uvdw vs. h is plotted in Fig. 2. The plot is obtained using r = 2.47 ´ 1028 m−3, which corresponds to a Hamaker constant of −6.0 ´ 10−20 J (Israelachvili, 2011) to represent the maximum possible interac-tion between water molecule and particle surface. The curve starts at the lowest distance 0.14 nm, which is half of the thickness of a monolayer of water (e.g., Moore and Reynolds, 1997; Mitchell and Soga, 2005).
Quantification of the interaction energy between cation and water molecules in soil is rarely addressed. To that end, water molecule can be considered as a dipole with one side (oxygen atom) attracting electrons more than the other side (hydrogen atoms). Thus, the interaction between a cation and a water mol-ecule can be obtained by charge–dipole interaction energy (uc–d) given by (Israelachvili, 2011):
cc d 1 1 2
0 1
( ) cos( ) ( ) cos
4V e p
u r E r pr-
q=- q=-
pe e [11]
VZJ | Advancing Critical Zone Science p. 5 of 12
with r1 as the distance between cation and water molecule (cation–oxygen distance), E (r1) as the intensity of electric field due to cation at a point where water molecule is, Vc as the cation valence, e as the electron charge, p as the water molecule dipole moment (6.172 ´ 10−30 C·m), q as the angle between the axis of symmetry of the water molecule and the direction between the center of mass of the water molecule and the cation, and e0 as the permittivity of vacuum (8.854 ´ 10−12 F m−1). Variations of uc−d (r1) (for both monovalent and divalent cations) with regard to the distance r1 are plotted in Fig. 2 as well. The parameter q in Eq. [11] is assumed to be zero for water molecules within a monolayer around cation. Furthermore, the medium between cation and a monolayer water molecule is air, leading to e = 1 in Eq. [11].
Each cation has a specific r1 value for its hydration shell, therefore, a unique uc–d value for each cation for the interaction between a cation and water molecules in its hydration shell can be found. Over the range of very low water content of soil, cations adsorb water molecules in the hydration shell similar to hydrated cations in aqueous solutions as illustrated in Fig. 3 (e.g., Quirk, 1955; Chang et al., 1998; Sposito, 2008, and Khorshidi and Lu, (2016). Therefore, the parameter r1 in Eq. [11] can be considered as the distance between cation and oxygen in aqueous solutions as listed in Table 1 and shown in Fig. 2 for K+ and Ca2+ ions. The uc–d cor-responding to r1 values of each cation listed in Table 1 are shown by markers in Fig. 2. Comparing the marked values of cation–water interaction energies by the interaction between particle surface and water reveals that the magnitude of the particle surface–water interaction is an order of magnitude smaller than the magnitude of the lowest (for K+) cation–water interaction. Hence, the contribu-tion of the VDW energy in Eq. [9] at very low water content in soil can be neglected, leading to the following:
wc d td d d
4V DG u N D D-
æ ö÷ç= + - ÷ç ÷çè øp e [12]
Fig. 2. Plot of interaction energies between water molecule and different exchangeable cations as well as water molecule and particle surface in soil.
Fig. 3. Conceptual illustration of water molecule adsorption to exchangeable cations within the primary shell of radius r1 in (a) nonexpansive soils at very low water content and (b) expansive soils at very low water content.
VZJ | Advancing Critical Zone Science p. 6 of 12
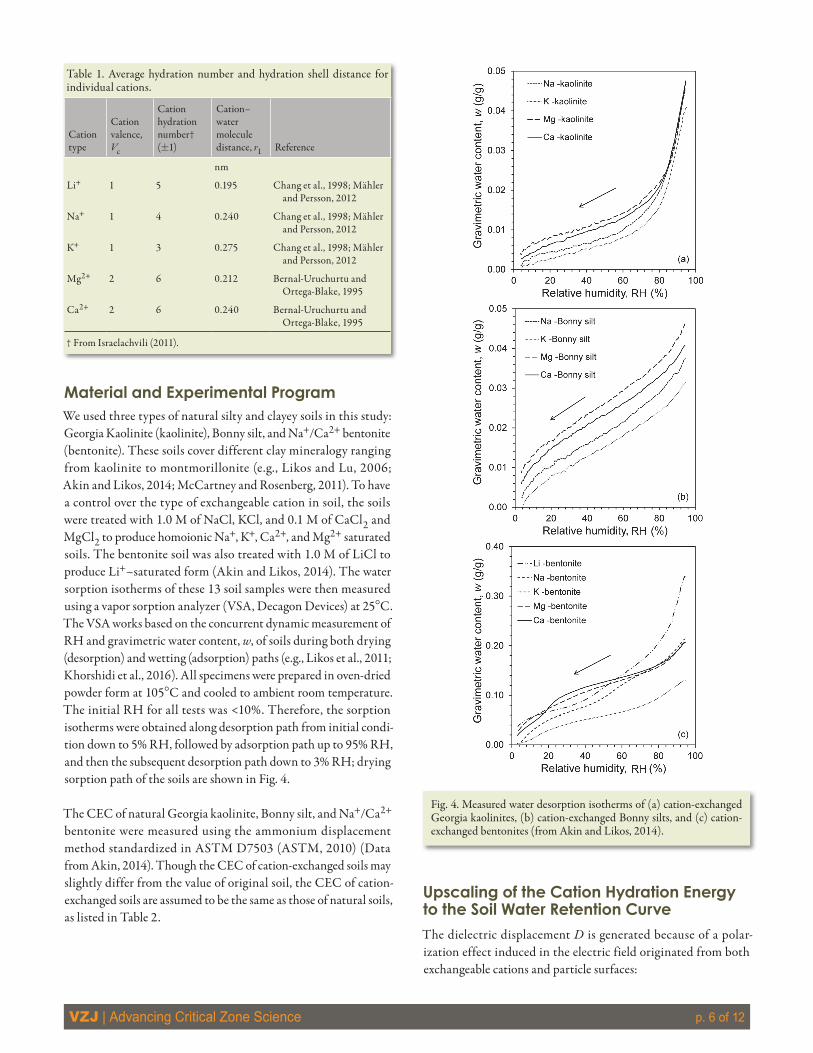
Material and Experimental ProgramWe used three types of natural silty and clayey soils in this study: Georgia Kaolinite (kaolinite), Bonny silt, and Na+/Ca2+ bentonite (bentonite). These soils cover different clay mineralogy ranging from kaolinite to montmorillonite (e.g., Likos and Lu, 2006; Akin and Likos, 2014; McCartney and Rosenberg, 2011). To have a control over the type of exchangeable cation in soil, the soils were treated with 1.0 M of NaCl, KCl, and 0.1 M of CaCl2 and MgCl2 to produce homoionic Na+, K+, Ca2+, and Mg2+ saturated soils. The bentonite soil was also treated with 1.0 M of LiCl to produce Li+–saturated form (Akin and Likos, 2014). The water sorption isotherms of these 13 soil samples were then measured using a vapor sorption analyzer (VSA, Decagon Devices) at 25°C. The VSA works based on the concurrent dynamic measurement of RH and gravimetric water content, w, of soils during both drying (desorption) and wetting (adsorption) paths (e.g., Likos et al., 2011; Khorshidi et al., 2016). All specimens were prepared in oven-dried powder form at 105°C and cooled to ambient room temperature. The initial RH for all tests was <10%. Therefore, the sorption isotherms were obtained along desorption path from initial condi-tion down to 5% RH, followed by adsorption path up to 95% RH, and then the subsequent desorption path down to 3% RH; drying sorption path of the soils are shown in Fig. 4.
The CEC of natural Georgia kaolinite, Bonny silt, and Na+/Ca2+ bentonite were measured using the ammonium displacement method standardized in ASTM D7503 (ASTM, 2010) (Data from Akin, 2014). Though the CEC of cation-exchanged soils may slightly differ from the value of original soil, the CEC of cation-exchanged soils are assumed to be the same as those of natural soils, as listed in Table 2.
Upscaling of the Cation Hydration Energy to the Soil Water Retention CurveThe dielectric displacement D is generated because of a polar-ization effect induced in the electric field originated from both exchangeable cations and particle surfaces:
Table 1. Average hydration number and hydration shell distance for individual cations.
Cation type
Cation valence, Vc
Cation hydration number† (±1)
Cation–water molecule distance, r1 Reference
nm
Li+ 1 5 0.195 Chang et al., 1998; Mähler and Persson, 2012
Na+ 1 4 0.240 Chang et al., 1998; Mähler and Persson, 2012
K+ 1 3 0.275 Chang et al., 1998; Mähler and Persson, 2012
Mg2+ 2 6 0.212 Bernal-Uruchurtu and Ortega-Blake, 1995
Ca2+ 2 6 0.240 Bernal-Uruchurtu and Ortega-Blake, 1995
† From Israelachvili (2011).
Fig. 4. Measured water desorption isotherms of (a) cation-exchanged Georgia kaolinites, (b) cation-exchanged Bonny silts, and (c) cation-exchanged bentonites (from Akin and Likos, 2014).
VZJ | Advancing Critical Zone Science p. 7 of 12
D E ¢= e [13]
where E¢ is the intensity of electric field from both cations and par-ticle surfaces. The total charge of electronegative particle surfaces and that of cations have the same values. Therefore, the electric field E¢ induced by both cations and particle surfaces and the elec-tric field E induced by cations only, are proportional:
E E¢=a [14]
where a is a constant. Subsequently, D can be expressed as follows using Eq. [11] for q = 0, Eq. [13], and Eq. [14]:
c duD
p-ea
=- [15]
By substituting D from the above equation into Eq. [12], we have the following:
2w
c d t 2(1 )
d d d4
VG u Np-
æ öa e -e ÷ç ÷ç= + e÷ç ÷÷ç pè ø [16]
The number of water molecules Nt can be determined based on either gravimetric water content, w and molar mass of water (ww) or Vw and molar volume of water (vw) as follows:
wt A A
w w
w VN N Nw v
= = [17]
where NA is Avogadro’s number (6.022 ´ 1023). The differential free energy changes given by Eq. [16] should then be integrated to find the total change of the Gibbs free energy. Finally, the matric potential as defined by Eq. [6] is derived as follows:
w( ) 2A w w
c d 2w w A w 0
d d (1 )1 d
d d 4
VG N v VuV v N V p
e
-
æ ö÷a e -eç ÷ç= + e÷ç ÷ç ÷p ÷çè øò [18a]
or:
Ac d
w w
d 1dG NuV v-=
k [18b]
w( ) 2w w
2A w 0
1 d (1 )1 d
d 4
Vv VN V p
eæ ö÷a e -eç ÷ç= + e÷ç ÷ç ÷k p ÷çè øò [19]
The adsorptive component of matric potential ya for very high matric suctions can be arrived at by substituting Eq. [18b] into Eq. [6] and using Eq. [11] to upscale uc–d:
c Aa 2
w0 1
( ) cos 14V e p N
vrq
y =-kpe e
[20]
Feeding the values of known parameters mentioned following Eq. [11] into Eq. [20] gives the following:
10 ca 2
13 10
Vr
-y =- ´k
[21]
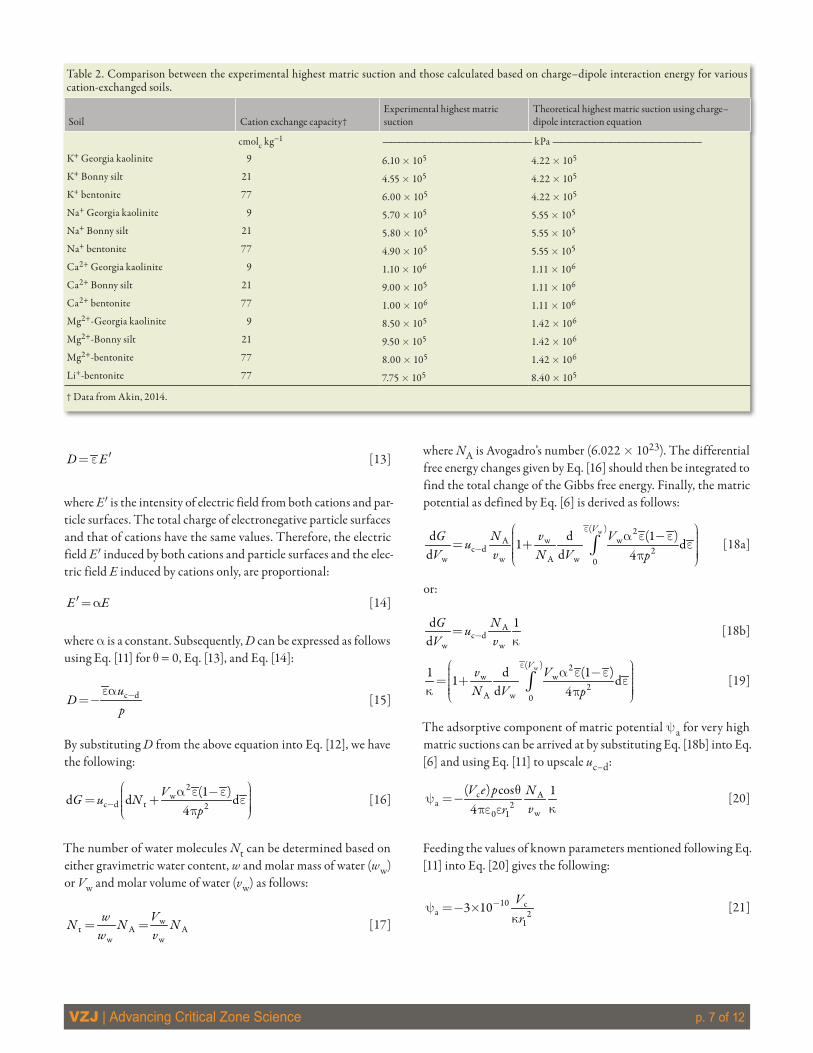
Table 2. Comparison between the experimental highest matric suction and those calculated based on charge–dipole interaction energy for various cation-exchanged soils.
Soil Cation exchange capacity†Experimental highest matric suction
Theoretical highest matric suction using charge–dipole interaction equation
cmolc kg−1 —————————————————— kPa ——————————————————
K+ Georgia kaolinite 9 6.10 ´ 105 4.22 ´ 105
K+ Bonny silt 21 4.55 ´ 105 4.22 ´ 105
K+ bentonite 77 6.00 ´ 105 4.22 ´ 105
Na+ Georgia kaolinite 9 5.70 ´ 105 5.55 ´ 105
Na+ Bonny silt 21 5.80 ´ 105 5.55 ´ 105
Na+ bentonite 77 4.90 ´ 105 5.55 ´ 105
Ca2+ Georgia kaolinite 9 1.10 ´ 106 1.11 ´ 106
Ca2+ Bonny silt 21 9.00 ´ 105 1.11 ´ 106
Ca2+ bentonite 77 1.00 ´ 106 1.11 ´ 106
Mg2+-Georgia kaolinite 9 8.50 ´ 105 1.42 ´ 106
Mg2+-Bonny silt 21 9.50 ´ 105 1.42 ´ 106
Mg2+-bentonite 77 8.00 ´ 105 1.42 ´ 106
Li+-bentonite 77 7.75 ´ 105 8.40 ´ 105
† Data from Akin, 2014.

VZJ | Advancing Critical Zone Science p. 8 of 12
where the units of y and r1 are Pascal (N m−2) and meter, respec-tively. Equation [21] quantifies the matric potential at very low water content.
The term 1/k in Eq. [21] contains an integral over a soil’s REV that may be calculated analytically through applications of some aver-aging techniques such as homogenization and theory of mixture. The integral depends on the volume of soil water REV Vw through e . Specifically, k depends on the volume of water in soil, that is,
the number of water molecules around cations (N) and much less so on other factors such as types of exchangeable cations and clay minerals. Further assumptions such as pore structure and particle distribution are needed to obtain analytical form of the 1/k term. Alternatively, the dependence of k on water content can be quanti-fied experimentally as follows.
To quantify the parameter k in Eq. [21], water sorption isotherms of different cation-exchanged bentonites (from Akin and Likos, 2014) are used to fit with Eq. [21] to back-calculate the parameter k . The relationship between the parameters k and the number of water molecules around each cation N is shown in Fig. 5. The N value can be calculated from the gravimetric water content, w, of soil water sorption isotherm for homoionic soils by (Khorshidi and Lu, 2016):
c
wCECV wN
w= [22]
Strikingly, a unified curve is observed for the relation between the parameters k and N for all soils with different types of cations. As illustrated in Fig. 5, the unified relation between k and N at 25°C is as follows:
4 9.3Nk= + [23]
The above equation implies that the parameter k only depends on the number of water molecules around each cation regardless of the type of cation.
By substituting N from Eq. [22] into Eq. [23] and following sub-stitution of the resultant into the Eq. [21], an explicit relation between matric potential and gravimetric water content of soil at very low matric potentials at 25°C is identified as follows:
10c w
a 21 c w
3 10 CEC(4 9.3 CEC)
V wr V w w
-
y=y =-+
× [24]
Equation [24] is the SWRC model for water content of soil ranging from zero up to the monolayer cation hydration (wmc). The wmc is the calculated w in Eq. [22] when the hydration number of a cation (listed in Table 1) is used for the parameter N (Khorshidi and Lu, 2016). The proposed equation for quantification of matric potential at very high matric suctions is validated by other soils, as described below.
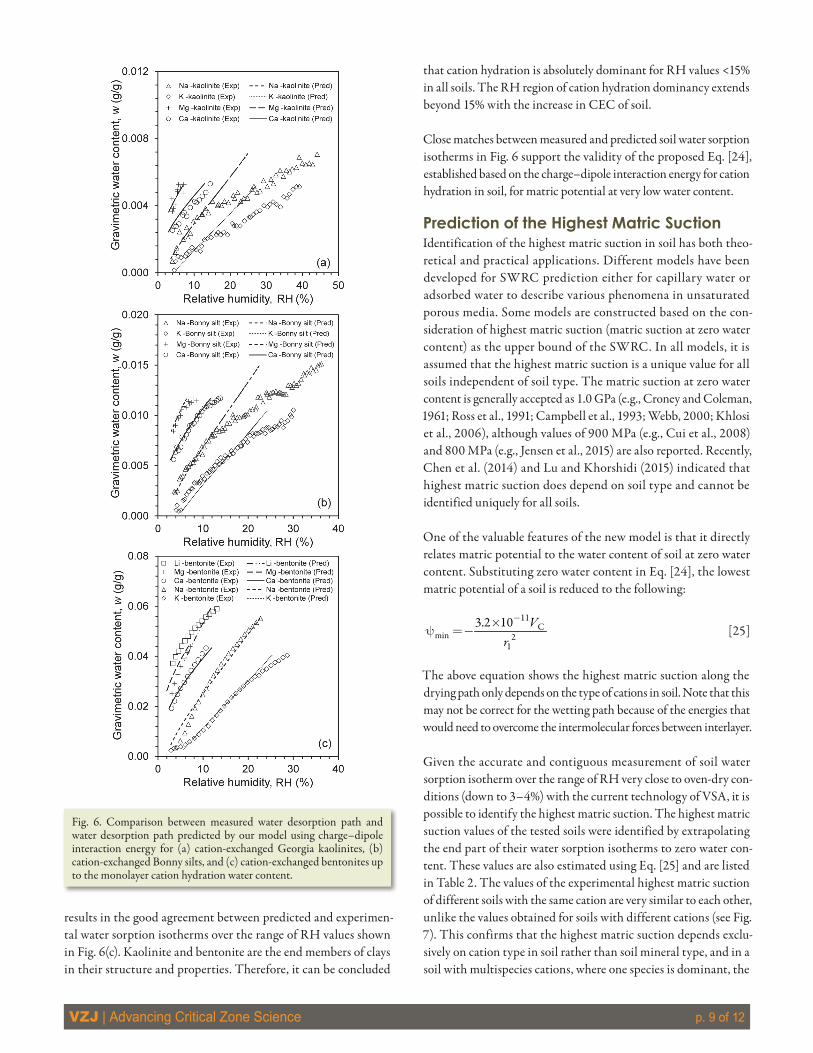
6ResultsExperimental Validation of the Proposed Soil Water Retention Curve ModelTo assess the applicability of Eq. [24] to predict water sorption isotherms of various soils, eight other homoionic soil samples were studied. Using CEC values from Table 2 and Vc and r1 values from Table 1, the predicted water sorption isotherms using Eq. [24] are plotted and compared with the measured isotherms in Fig. 6. Close matches between the measured and predicted water sorption iso-therms are observed. Figure 6(a) also reveals that there is a gradual increase in the difference between the water contents of predicted and measured isotherms of monovalent Georgia kaolinite (and to a lesser degree for monovalent Bonny silt as shown in Fig. 6[b]) soils as the RH increases. The effect of the particle surface hydra-tion mechanism on matric potential gradually increases as water content increases. The adsorption energy of the particle surface on water molecules is less than that from the cation. Therefore, the isotherms predicted based on cation hydration show a greater amount of water content than the measured isotherms, and the discrepancy increases with the increase of RH. Nonexpansive soils (such as Georgia kaolinite) possess a low amount of exchangeable cations, hence, the portion of water adsorbed on particle surface becomes comparable with cation hydration water as water content increases. The cation hydration mechanism still dominates for RH values less than ~15%.
In bentonite soils, because of the high amount of exchangeable cations, the amount of cation hydration water is much greater than the amount of water adsorbed on particle surface. This
Fig. 5. Relationship between parameter k and number of water molecules around each cation (N) for five homoionic cation-exchanged bentonites.
VZJ | Advancing Critical Zone Science p. 9 of 12
results in the good agreement between predicted and experimen-tal water sorption isotherms over the range of RH values shown in Fig. 6(c). Kaolinite and bentonite are the end members of clays in their structure and properties. Therefore, it can be concluded
that cation hydration is absolutely dominant for RH values <15% in all soils. The RH region of cation hydration dominancy extends beyond 15% with the increase in CEC of soil.
Close matches between measured and predicted soil water sorption isotherms in Fig. 6 support the validity of the proposed Eq. [24], established based on the charge–dipole interaction energy for cation hydration in soil, for matric potential at very low water content.
Prediction of the Highest Matric SuctionIdentification of the highest matric suction in soil has both theo-retical and practical applications. Different models have been developed for SWRC prediction either for capillary water or adsorbed water to describe various phenomena in unsaturated porous media. Some models are constructed based on the con-sideration of highest matric suction (matric suction at zero water content) as the upper bound of the SWRC. In all models, it is assumed that the highest matric suction is a unique value for all soils independent of soil type. The matric suction at zero water content is generally accepted as 1.0 GPa (e.g., Croney and Coleman, 1961; Ross et al., 1991; Campbell et al., 1993; Webb, 2000; Khlosi et al., 2006), although values of 900 MPa (e.g., Cui et al., 2008) and 800 MPa (e.g., Jensen et al., 2015) are also reported. Recently, Chen et al. (2014) and Lu and Khorshidi (2015) indicated that highest matric suction does depend on soil type and cannot be identified uniquely for all soils.
One of the valuable features of the new model is that it directly relates matric potential to the water content of soil at zero water content. Substituting zero water content in Eq. [24], the lowest matric potential of a soil is reduced to the following:
11C
min 21
3.2 10 Vr
-´y =- [25]
The above equation shows the highest matric suction along the drying path only depends on the type of cations in soil. Note that this may not be correct for the wetting path because of the energies that would need to overcome the intermolecular forces between interlayer.
Given the accurate and contiguous measurement of soil water sorption isotherm over the range of RH very close to oven-dry con-ditions (down to 3–4%) with the current technology of VSA, it is possible to identify the highest matric suction. The highest matric suction values of the tested soils were identified by extrapolating the end part of their water sorption isotherms to zero water con-tent. These values are also estimated using Eq. [25] and are listed in Table 2. The values of the experimental highest matric suction of different soils with the same cation are very similar to each other, unlike the values obtained for soils with different cations (see Fig. 7). This confirms that the highest matric suction depends exclu-sively on cation type in soil rather than soil mineral type, and in a soil with multispecies cations, where one species is dominant, the
Fig. 6. Comparison between measured water desorption path and water desorption path predicted by our model using charge–dipole interaction energy for (a) cation-exchanged Georgia kaolinites, (b) cation-exchanged Bonny silts, and (c) cation-exchanged bentonites up to the monolayer cation hydration water content.
VZJ | Advancing Critical Zone Science p. 10 of 12
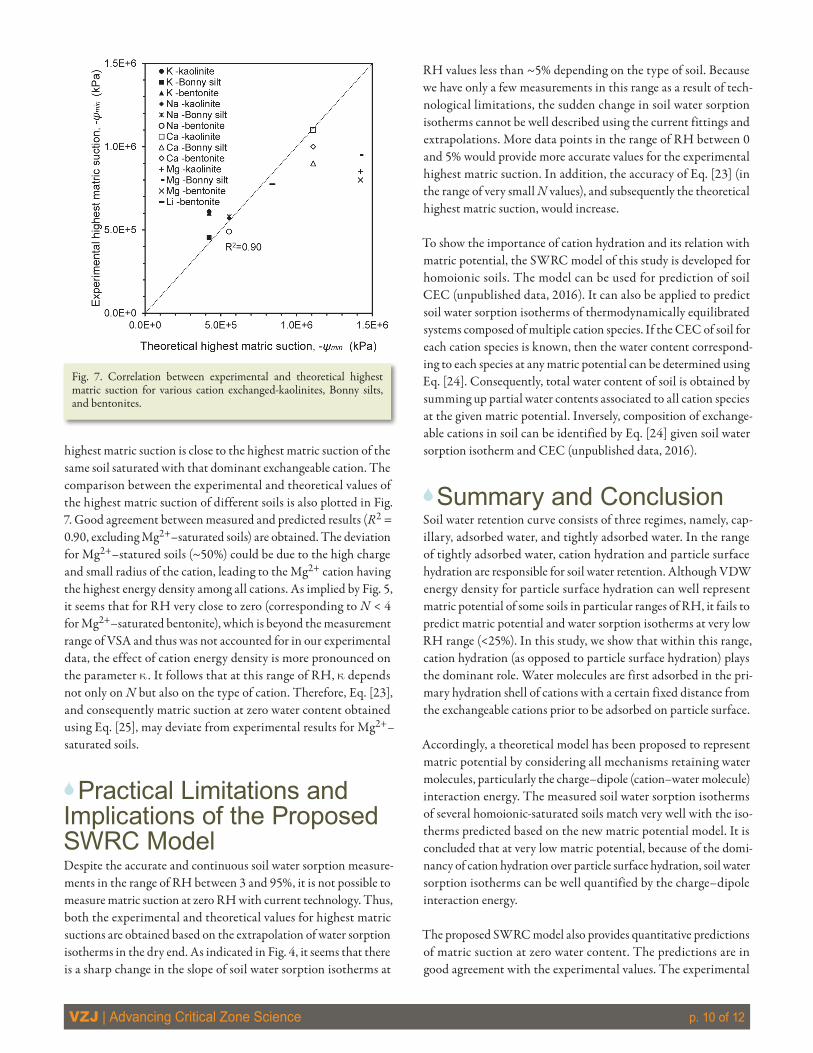
highest matric suction is close to the highest matric suction of the same soil saturated with that dominant exchangeable cation. The comparison between the experimental and theoretical values of the highest matric suction of different soils is also plotted in Fig. 7. Good agreement between measured and predicted results (R2 = 0.90, excluding Mg2+–saturated soils) are obtained. The deviation for Mg2+–statured soils (~50%) could be due to the high charge and small radius of the cation, leading to the Mg2+ cation having the highest energy density among all cations. As implied by Fig. 5, it seems that for RH very close to zero (corresponding to N < 4 for Mg2+–saturated bentonite), which is beyond the measurement range of VSA and thus was not accounted for in our experimental data, the effect of cation energy density is more pronounced on the parameter k . It follows that at this range of RH, k depends not only on N but also on the type of cation. Therefore, Eq. [23], and consequently matric suction at zero water content obtained using Eq. [25], may deviate from experimental results for Mg2+–saturated soils.
6Practical Limitations and Implications of the Proposed SWRC ModelDespite the accurate and continuous soil water sorption measure-ments in the range of RH between 3 and 95%, it is not possible to measure matric suction at zero RH with current technology. Thus, both the experimental and theoretical values for highest matric suctions are obtained based on the extrapolation of water sorption isotherms in the dry end. As indicated in Fig. 4, it seems that there is a sharp change in the slope of soil water sorption isotherms at
RH values less than ~5% depending on the type of soil. Because we have only a few measurements in this range as a result of tech-nological limitations, the sudden change in soil water sorption isotherms cannot be well described using the current fittings and extrapolations. More data points in the range of RH between 0 and 5% would provide more accurate values for the experimental highest matric suction. In addition, the accuracy of Eq. [23] (in the range of very small N values), and subsequently the theoretical highest matric suction, would increase.
To show the importance of cation hydration and its relation with matric potential, the SWRC model of this study is developed for homoionic soils. The model can be used for prediction of soil CEC (unpublished data, 2016). It can also be applied to predict soil water sorption isotherms of thermodynamically equilibrated systems composed of multiple cation species. If the CEC of soil for each cation species is known, then the water content correspond-ing to each species at any matric potential can be determined using Eq. [24]. Consequently, total water content of soil is obtained by summing up partial water contents associated to all cation species at the given matric potential. Inversely, composition of exchange-able cations in soil can be identified by Eq. [24] given soil water sorption isotherm and CEC (unpublished data, 2016).
6Summary and ConclusionSoil water retention curve consists of three regimes, namely, cap-illary, adsorbed water, and tightly adsorbed water. In the range of tightly adsorbed water, cation hydration and particle surface hydration are responsible for soil water retention. Although VDW energy density for particle surface hydration can well represent matric potential of some soils in particular ranges of RH, it fails to predict matric potential and water sorption isotherms at very low RH range (<25%). In this study, we show that within this range, cation hydration (as opposed to particle surface hydration) plays the dominant role. Water molecules are first adsorbed in the pri-mary hydration shell of cations with a certain fixed distance from the exchangeable cations prior to be adsorbed on particle surface.
Accordingly, a theoretical model has been proposed to represent matric potential by considering all mechanisms retaining water molecules, particularly the charge–dipole (cation–water molecule) interaction energy. The measured soil water sorption isotherms of several homoionic-saturated soils match very well with the iso-therms predicted based on the new matric potential model. It is concluded that at very low matric potential, because of the domi-nancy of cation hydration over particle surface hydration, soil water sorption isotherms can be well quantified by the charge–dipole interaction energy.
The proposed SWRC model also provides quantitative predictions of matric suction at zero water content. The predictions are in good agreement with the experimental values. The experimental
Fig. 7. Correlation between experimental and theoretical highest matric suction for various cation exchanged-kaolinites, Bonny silts, and bentonites.
VZJ | Advancing Critical Zone Science p. 11 of 12
highest matric suction values for different soils vary between 455 and 1100 MPa. It is found that different types of soils saturated with the same mono-cation have very close values of the highest matric suction, indicating that the highest matric suction is mainly controlled by type of cation and not much so by type of mineral. It is concluded that the highest matric suction is not universal for all soils and depends on type of exchangeable cations of soil.
One important conclusion from the conceptualization of water retention regimes and their corresponding energy magnitudes is that the constitutive theories describing mechanical and hydraulic behavior of unsaturated silty and clayey soils should not just con-sider surface tension but also consider VDW and cation hydration energies. This has not been shown previously using existing theories.
AcknowledgmentsThis research is funded by a grant from the National Science Foundation (NSF CMMI 1233063).
ReferencesAkin, I.D. 2014. Clay surface properties by water vapor sorption methods.
M.S. thesis. University of Wisconsin–Madison, Dep. of Civil and Environmental Engineering.
Akin, I.D., and W.L. Likos. 2014. Specific surface area of clay using water vapor and EGME sorption methods. Geotech. Test. J. 37:1–12. doi:10.1520/GTJ20140064
ASTM. 2010. ASTM Standard D7503: Standard test method for measuring exchange complex and cation exchange capacity of inorganic fine-grained soils. ASTM Int., West Conshohocken, PA. doi:10.1520/D7503-10
Baker, R., and S. Frydman. 2009. Unsaturated soil mechanics: Critical review of physical foundations. Eng. Geol. 106:26–39. doi:10.1016/j.enggeo.2009.02.010
Bernal-Uruchurtu, M.I., and I. Ortega-Blake. 1995. A refined Monte Carlo study of Mg2+ and Ca2+ hydration. J. Chem. Phys. 103:1588–1598. doi:10.1063/1.469781
Campbell, G.S., J.D. Jungbauer, S. Shiozawa, and R.D. Hungerford. 1993. A one-parameter equation for water sorption isotherms of soils. Soil Sci. 156:302–305. doi:10.1097/00010694-199311000-00002
Campbell, G.S., and S. Shiozawa. 1992. Prediction of hydraulic properties of soils using particle-size distribution and bulk density data. In: M.Th. van Genuchten, F.J. Leij, and L.J. Lund, editors, Indirect methods for estimating the hydraulic properties of unsaturated soils: Proc. Int. Workshop on Indirect Methods for Estimating the Hydraulic Properties of Unsaturated Soils, Riverside, California, 11–13 Oct. 1989. US Salinity Lab., ARS, and USDA. p. 317–328.
Chang, F.R.C., N.T. Skipper, K. Refson, J.A. Greathouse, and G. Sposito. 1998. Interlayer molecular structure and dynamics in Li-, Na-, and K-montmorillonite-water systems. ACS Symposium Series 715:88-106.
Chen, C., K. Hu, E. Arthur, and T. Ren. 2014. Modeling soil water retention curves in the dry range using the hygroscopic water content. Vadose Zone J. 13. doi:10.2136/vzj2014.06.0062
Coleman, J.D., and D. Croney. 1952. The estimation of the vertical moisture distribution with depth in unsaturated cohesive soils. Report RN/1709/JDC. Ministry of Science and Technology, Dep. of Scientific and Industrial Research, New Delhi, India .
Croney, D., and J.D. Coleman. 1961. Pore pressure and suction in soil. Proc. of Conference on Pore Pressure and Suction in Soils. Inst. Civil Eng. Butterworth & Co. Ltd, London, UK. p. 31–37.
Cui, Y.J., A.M. Tang, A.T. Mantho, and E.D. Laure. 2008. Monitoring field soil suction using a miniature tensiometer. Geotech. Test. J. 31:472–477.
Frydman, S., and R. Baker. 2009. Theoretical soil-water characteristic curves based on adsorption, cavitation, and a double porosity model. Int. J. Geomech. 9:250–257. doi:10.1061/(ASCE)1532-3641(2009)9:6(250)
Groenevelt, P.H., and G.H. Bolt. 1972. Water retention in soil. Soil Sci. 113:238–245. doi:10.1097/00010694-197204000-00003
Hassanizadeh, M., and W.G. Gray. 1979. General conservation equations for multiphase systems: 2. Mass momenta, energy and
entropy equations. Adv. Water Resour. 2:191–203. doi:10.1016/0309-1708(79)90035-6
Hassanizadeh, M., and W.G. Gray. 1980. General conservation equations for multiphase systems: 3. Constitutive theory for porous media flow. Adv. Water Resour. 3:25–40. doi:10.1016/0309-1708(80)90016-0
Hu, J., X.D. Xiao, D.F. Ogletree, and M. Salmeron. 1995. Imaging the condensation and evaporation of molecularly thin films of water with nanometer resolution. Science 268:267–269. doi:10.1126/science.268.5208.267
Israelachvili, J.N. 2011. Intermolecular and surface forces. Chapter 4, 3rd edition, Elsevier, Amsterdam.
Iwata, S., and T. Tabuchi. 1988. Soil-water interactions: Mechanisms and applications. Marcel Dekker Inc., New York.
Jensen, D.K., M. Tuller, I.W. de Jonge, E. Arthur, and P. Moldrup. 2015. A new two-stage approach for predicting the soil water characteristic from saturation to oven-dryness. J. Hydrol. 521:498–507. doi:10.1016/j.jhydrol.2014.12.018
Khlosi, M., W.M. Cornelis, D. Gabriels, and G. Sin. 2006. Simple modification to describe the soil water retention curve between saturation and oven dryness. Water Resour. Res. 42. doi:10.1029/2005WR004699
Khorshidi, M. 2015. Soil-water interaction at high soil suction. Ph.D. diss. Colorado School of Mines, Dep. of Civil and Environmental Engineering. Golden, CO.
Khorshidi, M., and N. Lu. 2016. Soil water retention-based methodology for classification of expansive soils. Proceeding of Geo-Chicago 2016, Chicago, IL. 14–18 Aug. J. Geotech. Geoenviron. Eng. 2016:865–873. doi:10.1061/9780784480144.086
Khorshidi, M., and N. Lu. 2016. Intrinsic relation between soil water retention and cation exchange capacity. Submitted to J. Geotech. Geoenviron. Eng. (in press).
Khorshidi, M., N. Lu, I.D. Akin, and W.J. Likos. 2016. Intrinsic relation between specific surface area and soil water retention. J. Geotech. Geoenviron. Eng. doi:10.1061/(ASCE)GT.1943-5606.0001572
Laird, D.A. 1999. Layer charge influences on the hydration of expandable 2:1 phyllosilicates. Clays Clay Miner. 47:630–636. doi:10.1346/CCMN.1999.0470509
Leão, T.P., and M. Tuller. 2014. Relating soil specific surface area, water film thickness, and water vapor adsorption. Water Resour. Res. doi:10.1002/2013WR014941
Lebeau, M., and J.M. Konrad. 2010. A new capillary and thin film flow model for predicting the hydraulic conductivity of unsaturated porous media. Water Resour. Res. 46. doi:10.1029/2010WR009092
Likos, W.J., and N. Lu. 2006. Pore-scale analysis of bulk volume change from crystalline interlayer swelling in Na+-and Ca2+–smectite. Clays Clay Miner. 54:515–528. doi:10.1346/CCMN.2006.0540412
Likos, W.J., N. Lu, and W. Wenzel. 2011. Performance of a dynamic dew point method for moisture isotherms of clays. Geotech. Test. J. 34:373–382.
Lu, N. 2016. Generalized soil water retention equation for adsorption and capillarity. J. Geotech. Geoenviron. Eng. 142. doi:10.1061/(ASCE)GT.1943-5606.0001524
Lu, N., J.W. Godt, and D.T. Wu. 2010. A closed-form equation for effective stress in unsaturated soils. Water Resour. Res. 46. doi:10.1029/2009WR008646
Lu, N., and M. Khorshidi. 2015. Mechanisms for soil-water retention and hysteresis at high suction range. J. Geotech. Geoenviron. Eng. 141. doi:10.1061/(ASCE)GT.1943-5606.0001325
Lu, N., and W.J. Likos. 2004. Unsaturated soil mechanics. John Wiley & Sons, New York.
Mähler, J., and I. Persson. 2012. A study of the hydration of the alkali metal ions in aqueous solution. Inorg. Chem. 51:425–438. doi:10.1021/ic2018693
McCartney, J.S., and J.E. Rosenberg. 2011. Impact of heat exchange on the axial capacity of thermoactive foundations. GeoFrontiers, Dallas, TX.
McQueen, I.S., and R.F. Miller. 1974. Approximating soil moisture characteristics from limited data: Empirical evidence and tentative model. Water Resour. Res. 10:521–527. doi:10.1029/WR010i003p00521
Mitchell, J.K., and K. Soga. 2005. Fundamentals of soil behavior. John Wiley & Sons, New York.
Moore, D.M., and R.C. Reynolds. 1997. X-ray diffraction and the identification and analysis of clay minerals. 2nd ed., Oxford Univ. Press, London.
Mualem, Y. 1976. A new model for predicting the hydraulic conductivity of unsaturated porous media. Water Resour. Res. 12:513–522. doi:10.1029/WR012i003p00513
VZJ | Advancing Critical Zone Science p. 12 of 12
Nitao, J.J., and J. Bear. 1996. Potentials and their role in transport in porous media. Water Resour. Res. 32:225–250. doi:10.1029/95WR02715
Nye, P.H., and P.B. Tinker. 1977. Solute movement in the soil-root system. Blackwell Scientific Publications, Oxford.
Philip, J.R. 1969. Hydrostatics and hydrodynamics in swelling soils. Water Resour. Res. 5:1070–1077. doi:10.1029/WR005i005p01070
Philip, J.R. 1977. Unitary approach to capillary condensation and adsorption. J. Chem. Phys. 66:5069–5075. doi:10.1063/1.433814
Prost, R., A. Benchara, and E. Huard. 1998. State and location of water adsorbed on clay minerals: Consequences of the hydration and swelling-shrinkage phenomena. Clays Clay Miner. 46:117–131. doi:10.1346/CCMN.1998.0460201
Quirk, J.P. 1955. Significance of surface areas calculated from water vapour sorption isotherms by use of the B.E.T. equation. Soil Sci. 80:423–430. doi:10.1097/00010694-195512000-00001
Revil, A., and N. Lu. 2013. Unified water sorption and desorption isotherms for clayey porous materials. Water Resour. Res. 49:5685–5699. doi:10.1002/wrcr.20426
Ross, P.J., J. Williams, and K.L. Bristow. 1991. Equation for extending water‐retention curves to dryness. Soil Sci. Soc. Am. J. 55:923–927. doi:10.2136/sssaj1991.03615995005500040004x
Sposito, G. 1972. Thermodynamics of swelling clay–water systems. Soil Sci. 114:243–249. doi:10.1097/00010694-197210000-00001
Sposito, G. 2008. The chemistry of soils. 2nd ed., Oxford Univ. Press, New York.
Sposito, G., and S.Y. Chu. 1981. The statistical mechanical theory of groundwater flow. Water Resour. Res. 17:885–892. doi:10.1029/WR017i004p00885
Sposito, G., and S.Y. Chu. 1982. Internal energy balance and the Richards equation. Soil Sci. Soc. Am. J. 46:889–893. doi:10.2136/sssaj1982.03615995004600050001x
Tuller, M., and D. Or. 2005. Water films and scaling of soil characteristic curves at low water contents. Water Resour. Res. 41. doi:10.1029/2005WR004142
Tuller, M., D. Or, and L.M. Dudley. 1999. Adsorption and capillary condensation in porous media: Liquid retention and interfacial configurations in angular pores. Water Resour. Res. 35:1949–1964. doi:10.1029/1999WR900098
van Genuchten, M.Th. 1980. A closed-form equation for predicting the hydraulic conductivity of unsaturated soils. Soil Sci. Soc. Am. J. 44:892–898. doi:10.2136/sssaj1980.03615995004400050002x
Webb, S.W. 2000. A simple extension of two-phase characteristic curves to include the dry region. Water Resour. Res. 36:1425–1430. doi:10.1029/2000WR900057
Woodruff, W.F., and A. Revil. 2011. CEC-normalized clay–water sorption isotherm. Water Resour. Res. 47. doi:10.1029/2011WR010919
Xu, K., P. Cao, and J.R. Heath. 2010. Graphene visualizes the first water adlayers on mica at ambient conditions. Science 329:1188–1191. doi:10.1126/science.1192907


