
300 GLOBALORGANISATIONS
REVEAL THE FUTURE OF APPLICATION SUPPORT & MAINTENANCE

02
Survey participantsThe research project involved interviewing Executives from 300 Large Enterprises from the UK (150 participants) and US (150 participants). The interviews were conducted between October and November 2013.
The focus of the research was to understand the profile, priorities and strategic intent of these organisations when it came to Application Support & Maintenance (ASM). The organisations surveyed were required to have at least 1,000 employees.
A research report from HCL
examining the impact of
current ASM practices across
300 large enterprises
Demographic profile of project participants
31%
Number ofEmployees
Globally
34%
35%
3001-5000 Employees Globally
5000+ Employees Globally
1001-3000 Employees Globally

03
Executive summary• Organisations are spending 68% of their IT budget on run the business (RTB) activities; 31% of
organisations are spending 80% on RTB• ASM accounts for 38% of large organisations’ overall IT budget each year, with 83% stating the cost of
maintaining and supporting applications was increasing year-on-year• 87% of organisations see budgetary pressure impacting their ability to innovate with 83% saying they
need to reduce RTB costs in order innovate more• 81% of organisations say only a small number of applications generate a disproportionally high number
of tickets• The majority or organisations think that their in-house teams and/or outsourcer could be more
innovative when it comes to delivering ASM• Only 14% of organisations have mapped business benefit from IT• Through a 30% cost reduction in ASM Global 2000 organizations could free upto $6.8 billion of
working capital
Spiralling ASM costs in the face of reducing IT budgets
Software and applications are increasingly dominating the corporate IT landscape, playing an increasingly pivotal role in enabling companies to launch new services and derive competitive advantage. Despite the huge buzz around cloud and SaaS (Software-as-a-Service), the vast majority of organisations (87%) believe on-premise applications are here to stay; therefore their ongoing support and maintenance remains essential.
06%
0% 2%
Sect
or
4% 6% 8% 10% 12% 14% 16%
Healthcare (public)11% Healthcare (private)
12% Other commercial sector13% Government & civil service
15% Other public sector15% Manufacturing15% Retail, distribution & transport15% Financial Services

Our survey reveals that currently ASM (covering incident resolution, service/change requests and day-to-day application management) accounts for 38% of large organisations’ overall IT budget each year. Based on the IT expenditure of Global 2000 companies this equates to $11.3 million per organisation annually. Furthermore, 83% of respondents stated that the cost of maintaining and supporting these applications was increasing year on year, while over the last 12 months organisations have on average seen a 29% increase in support tickets for ASM. For those organisations that primarily outsource their ASM function, they in fact saw a 32% increase in support tickets. This is a clear indication that many organisations are struggling to meet users’ heightened expectations of application performance, which in turn is leading to an ever increasing number of support tickets.
04
Do you think on premise applications are here to stay?
YES87%
13%NO
What percentage of your overall IT budget is spent
on ASM each year?
Approximately 10%
%agerespondents
38.47%
Approximately 20%Approximately 30%Approximately 40%Approximately 50%Approximately 60%Approximately 70%Over 70% (please specify)Average percentage of annual IT budget spent on ASM each year
3%13%26%26%20%9%3%0%

Is your ASM cost increasing year on year?
YES83%
17%NO
05
%agerespondents
31.70%
68.30%Average percentage of annual IT budget spent on RTB
Average percentage of annual IT budget spent on CTB
0%7%24%36%20%8%5%
100% RTB90% / 10%80% / 20%70% / 30%60% / 40%50% / 50%Less than 50% RTB
What percentage of your annual IT budget is spent on running the business (RTB) compared to innovation and
development projects that are designed to change the
business (CTB)?

45% of respondents believed that while their IT running costs had been steady, annual budget decreases meant they were unable to take enough cost from IT to invest in change the business (CTB) initiatives. A further 30% stated that their IT costs had in fact been increasing, which was leading to a higher RTB v CTB ratio. Against this backdrop it is hardly surprising that 87% of respondents believed that budgetary pressures were hindering their ability to undertake the innovation and development projects that could transform their business. For many CIOs this is a considerable challenge; where previously business transformation initiatives were only a small part of their overall activity, it is now a key part of their role.
In our survey, the majority of respondents (83%) stated it was priority for them to reduce the proportion of their organisation’s IT budget on running the business; so that they can invest more on transforming the business through innovative technology projects. At the same time, CIOs are concerned that hammering down RTB costs by too much and too quickly, could have a negative impact on overall business performance. However, it is clear that ASM is a cost centre that can be reduced while at the same delivering greater value to the business. Yet a worrying 86% of respondents indicated that they didn’t expect their existing ASM function (whether in-house, outsourced or combined) to deliver any costs savings in the next three years.
06
06%
15%
30%
49%
IT running costs have been decreasing due to scientific programs like
Lean implementation which is having a positive
effect on CTB spend.
IT running costs have been decreasing but we can sense a decrease in quality of service being provided
IT running costs have been increasiing every year leading to a higher RTB to CTB ratio
IT running costs have been steady but with budgets decreasing every year morebudget is required

Is it a priority for you to reduce the proportion of
your organisation's IT budget on running the
business, so that you can invest more in transforming
the business through innovative technology
projects?
Do you expect any cost saving from your own or
outsourced ASM function in the next 3 years?
YES83%
17%NO
YES86%
14%NO
07

In today’s era, with the need to drive greater efficiencies and business value from IT, organisations can no longer allow their ASM function to stagnate. These figures show that the commonly accepted rule that ASM will consume a significant proportion of the IT budget no longer stacks up. Through a 30% cost reduction in ASM Global 2000 organizations could free up to $6.8 billion of working capital
In-house vs. outsourced ASM functionWhen it comes to who actually undertakes ASM in an organisation, our survey revealed a number of different approaches. 45% of respondents stated that ASM was primarily undertaken in-house, while 17% said they outsourced the function. The remaining 38% stated that ASM was undertaken by both an in-house team and an outsourcer.
One of the biggest barriers towards reducing ASM costs is a reluctance to disrupt the current status quo. As an industry, ASM hasn’t needed to innovate as contracts are typically renewed non-competitively every three to five years. This continual revenue stream for outsourcers has meant it hasn’t been in their interests to modernise or propose a new model for ASM. Of those organisations that outsourced part or all of its ASM function, more than three-quarters (78%) believed that their outsourcer could be more innovative in delivering ASM but was reluctant to do so because it might result in reduced work and revenue. Furthermore, 72% of respondents believed that their outsourcer tries to keep the level of support tickets high to ensure their revenues are not reduced.
08
17%
38%
45%
ASM is primarily indertaken by an outsourcer
ASM is undertaken by both our in-house team and an outsourcer
ASM is primarily undertaken by an in-house team

Do you believe that your outsourcer could be more
innovative in delivering ASM but is reluctant to do so because it might result
in reduced work and revenue?
Do you believe that your outsourcer tries to keep the level of support tickets high
to ensure that to ensure their revenues are not
reduced. ?
YES78%
22%NO
YES72%
28%NO
09

Lack of innovation isn’t just restricted to the outsourcer; our survey reveals that of those organisations that undertake ASM in-house, 92% believe their team could be more innovative in transforming the model of ASM. This illustrates that many in-house teams remain concerned that by making improvements to ASM they could be doing themselves out of a job, rather than thinking about how their skills could be deployed elsewhere in the business.
For those organisations that have outsourced, our survey revealed that it has taken them nearly two years to see tangible benefits from outsourcing ASM. With IT having to evolve at a rapid rate to become more aligned with business needs and deliver tangible results in the form of cost reduction and revenue growth, it can no longer afford to support approaches that don’t quickly deliver tangible benefits. These figures show that the traditional approach to ASM is a hindrance to the goals of a new lean, performance-driven IT department.
10
Do you believe that your ASM team could be more innovative in transforming the model of ASM?
YES92%
08%NO
From when you outsourced ASM, how long did it take before you saw tangible
improvements in the performance of ASM?
Approximately 6 monthsTotal
38.47%
Approximately 1 yearApproximately 2 yearsApproximately 3 yearsApproximately 4 yearsApproximately 5 years
Average time taken to see tangibleImprovements in ASM performance (year)
11%20%35%16%8%0%9%We’ve not seen any tangible Improvements

Traditional approaches to ASM are inefficient and too reactive
When asked about their IT operations, a significant number of respondents (34%) said it needed streamlining, and that the focus is on ITIL processes and implementing IT SLAs. A further 26% saw IT as a cost centre, where the major focus is taking out operational cost. For those organisations where their ASM function in primarily undertaken by an outsourcer, nearly half (47%) believed their IT operations needed streamlining. This highlights inefficiencies with the current ASM process for many organisations.
Only 14% of organisations said they mapped the business benefit of IT. This indicates many organisations are still working to IT-led rather than business-led KPIs, and an overall a lack of business and IT alignment.
11
Which of the following best descibes IT in your organisation?
14%
25%
26%Business benefits from IT are well mapped,
delivering IT as a service to the business?
IT is mature operationally and is now focusing on business alignment with business SLAs
IT is a cost centre - operational cost take out is a major focus
34%IT operations need streamlining - Focus is on ITIL processes and implementing IT SLAs

A lack of visibility and control is a significant challenge for the majority of organisations. 92% of respondents said they found out about most IT issues and problems impacting end users through calls to the helpdesk/service desk. Furthermore, when asked about how applications are supported and maintained across their organisation, just over two-thirds of all respondents (67%) stated that their ASM function is inflexible in terms of supporting business expansion and is not providing continuous improvement. Interestingly, this figure rises to 86% when asking those organisations where ASM is primarily undertaken by an outsourcer. This illustrates that for the vast majority of organisations, ASM is reactive and focused on firefighting; as opposed to being proactive and keeping businesses on the front foot.
Indeed, when asked if they believe traditional ASM processes are inefficient, 83% of respondents agreed. Typically this has been due to ASM teams dealing with and resolving application incidents on a case-by-case basis rather than using an industrialised and consistent solution. As a result, every time an error occurs the ASM team is required to start from scratch in order to roll out a solution; which is extremely inefficient considering that on average, only 1 incident in every 5 is new.
Do you believe that traditional ASM processes are inefficient?
YES83%
17%NO
12
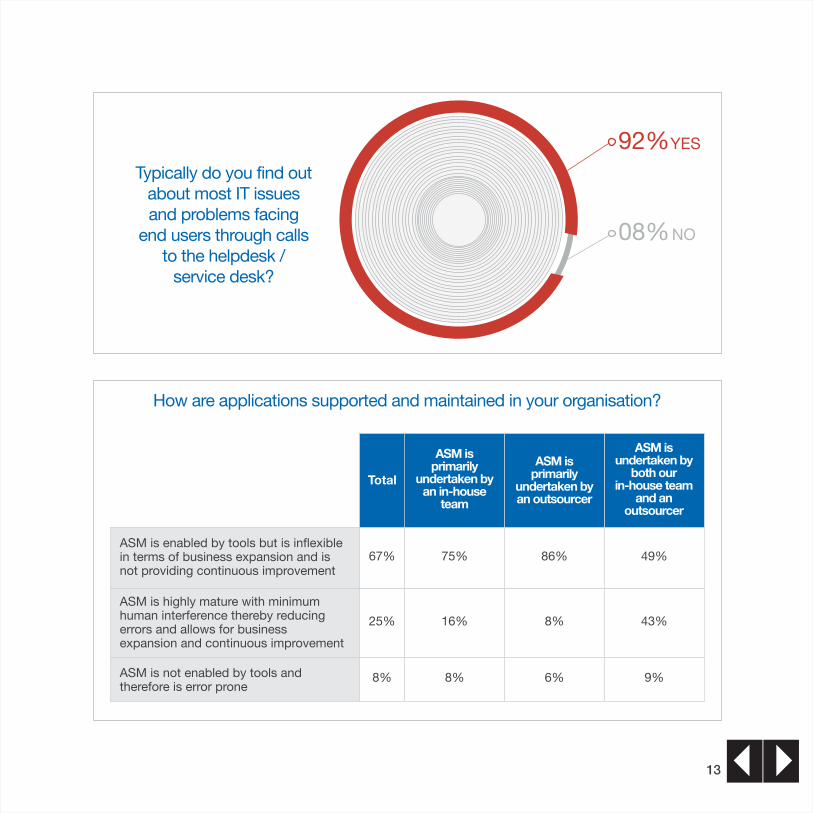
How are applications supported and maintained in your organisation?
Typically do you find out about most IT issues and problems facing
end users through calls to the helpdesk /
service desk?
YES92%
08%NO
13
Total
ASM is enabled by tools but is inflexible in terms of business expansion and is not providing continuous improvement
ASM is undertaken by
both our in-house team
and an outsourcer
ASM is primarily
undertaken by an outsourcer
ASM is primarily
undertaken by an in-house
team
ASM is highly mature with minimum human interference thereby reducing errors and allows for business expansion and continuous improvement
ASM is not enabled by tools and therefore is error prone
67% 75%
16%
8%
86%
8%
6%
49%
43%
9%
25%
8%

Application silos remain
For most organisations, the ASM function continues to be aligned to particular applications as opposed to the business. So rather than having a team focused on supply chain management or e-commerce, organisations will have individual support teams for major applications such as Oracle, SAP, trading systems etc. Our survey revealed that 81% of organisations organised their ASM function around these application silos. This is symptomatic of IT working to IT-led KPIs aimed at helping the business ‘keep the lights on’ rather than looking at how the skills of the ASM team can be utilised for business transformation.
As the number of applications within the business grows and the landscape becomes more complex, this siloed approach is starting to make IT rigid and reactive at a time when the demands on it are greater than ever. 90% of respondents said they receive complaints from the business about application problems and service requests not being dealt with quickly enough.
14
Do you have individual support teams for your major applications such as Oracle, SAP, trading systems etc?
YES81%
19%NO

The majority of respondents (81%) stated that a small number of applications created a disproportionately high number of ASM tickets. However, with IT landscapes becoming more complex; where applications are interconnected, third-party services being used and application components supporting wider business processes, it is much more difficult for time-pressured ASM teams to identify and resolve the root cause of specific incidents. Indeed, 91% of respondents said that root-cause analysis for application related problems and incidents was taking longer due to the increasingly complex nature of the IT landscape.
Do you find that you will get complaints from the business about applications problems and service requests not being
dealt with quickly enough?
15
YES90%
10%NO

Do you agree that root cause analysis for application related
problems and incidents is taking longer due to the
increasingly complex nature of the IT landscape?
YES91%
09%NO
16
Do you agree that you have a small number of applications that create a disproportionally high
number of ASM tickets?"
YES81%
19%NO

Business & IT alignment remains a challenge
Business and IT alignment continues to be debated in a significant number of organisations. With demands from the business growing and becoming increasingly varied, it is often difficult for IT to prioritise dealing with application problems and/or service requests. Our survey shows that for the majority of respondents (88%), prioritising problem and service requests is a headache. At the same time, with IT underpinning an increasing number of business functions, 90% of respondents said that resource and skills restraints were making it a challenge to align business and IT objectives.
17
Do you sometimes find prioritising problem and service requests a headache?
YES88%
12%NO

YES90%
10%NO
Against this backdrop, it can be difficult for organisations to measure the true business impact of their ASM function. 43% of respondents claim to use business focused KPIs (e.g. a reduction in order to delivery time or an increase in customer acquisition), yet when asked what the primary metrics to measure the effectiveness of their ASM operation are, 87% stated it was application availability, response and problem resolution times. In fact, when the sample is broken down to focus solely on those organisations where ASM is outsourced, less than a quarter (24%) stated they used business-focused KPIs.
18
Do you think resource and skills restraints are making it a challenge to align business and IT objectives?

Which of the following metrics do you collect and use to measure your in-house and outsourced ASM function?
Total
Mean time to resolution (MTR)
Productivity of ASM team
Application uptime
Reduction in high severity tickets
ASM is undertaken by
both our in-house team and an outsourcer
ASM is primarily
undertaken by an outsourcer
ASM is primarily undertaken by
an in-house team
Business focused KPI's (for example, a reduction in order to delivery time for an online retailer or an increase in customer acquisition for an insurance company)
74% 65%
39%
86%
24%
78%
67% 67% 43% 77%
63% 60% 53% 70%
51% 45% 39% 64%
57%43%
Do you use application availability, response times
and problem resolution times as the primary
metrics to measure the effectiveness of your ASM
operation?
19
YES87%
13%NO

At a time when CIOs are being asked to change the business, the traditional IT-KPI focused approach towards ASM is fast becoming outdated. CIOs need to be able to drive costs out of their operations, while at the same time driving business performance.
Encouragingly, 91% of respondents believe that ASM can have an impact on improving business performance; however this figure drops to 78% where the function is undertaken by an outsourcer. Whether ASM is outsourced, undertaken in-house or by a combination of the two, it is clear in that an alternative approach is required.
ALT ASM™ – Proactively reducing ASM while impacting business performanceRecognizing that support, maintenance and business value are not mutually exclusive marks a new start for IT sourcing models. Unlike traditional ASM, ALT ASM™ seeks to drive efficiencies at a fundamental level using proactive ticket resolution, LEAN principles, pre-built self-healing solutions, self-funded application portfolio optimization and a business aligned target operation model. The goal of ALT ASM™ is to create a zero ticket application landscape.
With that it is focused on impacting business performance through business process to IT landscape linkage and being targeted on business process KPIs. This is a game changing and bold approach for a
Do you believe that ASM can have an impact on improving business performance?
Total
Yes
No
ASM is undertaken by
both our in-house team and an outsourcer
ASM is primarily
undertaken by an outsourcer
ASM is primarily undertaken by
an in-house team
91% 93% 78% 94%
9% 7% 22% 6%
20

Ticket resolution focused
Traditional ASM - Industry Practice
Focus on “Keeping the lights on”
Non consultative approach to transformation
Limited ability to support a dynamically changing business demand
Limited visibility in service delivery
Proactive Workload Reduction
Alternative ASM
Focus on Business Advantage
Proactively Impacting IT Agility
Reduced risk with a flexible egagement
Transparent Engagement
21
function or sector of the IT industry that hasn't evolved for the last decade. ALT ASM™ aims to create Alternative solutions to five problems CIOs face in applications outsourcing:
Proactive Workload ReductionCIOs so far have been only presented with the cost savings achieved through offshoring and savings delivered as part of the defined contract. To help CIOs see other alternatives, HCL has created a paradigm shift in applications outsourcing through its ALT ASM™ proposition. It is derived from our strategy of a shift from ticket resolution to ticket removal. ALT ASM™ aims to deliver unprecedented Visibility, a faster resolution Velocity and generate Value, by bringing together a host of its IP, processes and fundamentally approaching IT with a Business Process first, Technology second mind-set. If we understand the business process, we understand the impact of an upstream failure on a downstream process. This knowledge helps anticipate and focus resolution efforts irrespective of the “priority” assigned to a ticket.
Focus on Business Advantage There is a need to change how we deliver and what we target as part of our SLAs. An ASM engagement in technology led silos is inefficient in terms of its resource use and is akin to a “horse with blinders”. HCL has designed a Business Function Aligned Target Operating Model in which the engagement units headed by client service managers are aligned to the various functions of the client. This creates an

For further information, http://microsite.hcltech.com/altasm/
22
organization that is focused on achieving business objectives. Along with this ALT ASM™ uses HCL’s proprietary tool Prizm™ to map the business process to the IT landscape. This enables the ASM engagement to generate ideas that can impact the business. Another tool used is ProVantage™ which monitors the Business KPIs and their linkage with IT KPIs. The final step is taking Business KPIs as SLAs. This aligns the goals of the business and IT creating Business Advantage.
Proactively Impacting AgilityTransformation of IT landscape starts at the time of transition with the mapping of the IT Landscape to the Business processes using HCL’s Application Optimization tool Prizm™. This creates a culture of continuous improvement from the word go. With that we reinvest 3% of the total contract value in the form of transformation consulting assignments which result in transformation opportunities being identified. These opportunities can be realized with the unlocked capital resulting from optimization derived from ALT ASM™ and are in the form of Application Portfolio Optimization, Application Modernization and Cloud Enablement.
Flexibility in service delivery and resourcingAn ASM engagement, which is not flexible enough to provide for additional trained resources in case of an urgent need, puts the client at risk rising from business fluctuations. Understanding this challenge, HCL offers clients a flexible staffing model which provides run-the-business (RTB)-trained resources whenever there is a need, as part of ALT ASM™. Inversely resources required for change-the-business (CTB) activities can be sourced from ASM. Our Business-Aligned Target Operating Model (TOM) results in a highly cross-skilled workforce and thus we are able to provide resources that are completely aware of the company’s business process and are able to impact CTB activities in the right way. Flexible delivery is achieved through the modularized Business Aligned TOM where in case of a business expansion a new business aligned track is easily created.
Transparent EngagementWhen it comes to creating visibility for the customer through strong collaboration models, advanced reporting tools with frequent updates and clear role articulation for greater accountability, we look at Managed Services. ALT ASM™ creates a transparent engagement through a 24X7 visibility dashboard, Multi-Vendor governance framework, Business Process to IT landscape visibility and business process KPI monitoring. It creates visibility at all three levels of Business, IT and Governance.


