Ophthalmology Therapeutics Market in Asia-Pacific to 2019 High Unmet Need and Moderate Short Term Prospects Focus Attention on Early Stage Activity
GBI Research Report Guidance
© GBI Research. This is a licensed product and is not to be photocopied GBIHC308MR / Published OCT 2013 Page 2
GBI Research Report Guidance
Chapter two provides an introduction to ophthalmology therapeutic indications of glaucoma and DES, including epidemiology, symptoms, etiology, pathophysiology, diagnosis, disease classification and determination of disease severity, and treatment.
Chapter three is the GBI Research Report Guidance
Chapter four provides an overview of the product profiles for seven key marketed products for glaucoma and DES.
Chapter five analyses the glaucoma and DES pipeline, detailing, among other parameters, drug distribution by phase, molecule type and mechanism of action. The chapter also profiles four promising drug candidates in the pipeline.
Chapter six provides market forecast to 2019 for APAC markets (India, Australia, China and Japan), and includes prevalence population, Annual Cost of Therapy (ACoT) and a market size forecast, along with drivers and barriers for the ophthalmology market.
Chapter seven provides a strategic consolidation analysis, including major co-development and licensing deals.
© GBI Research. This is a licensed product and is not to be photocopied GBIHC308MR / Published OCT 2013
Page 3
Ophthalmology Therapeutics Market in Asia-Pacific – Executive Summary
Ophthalmology Therapeutics Market in Asia-Pacific – Executive Summary
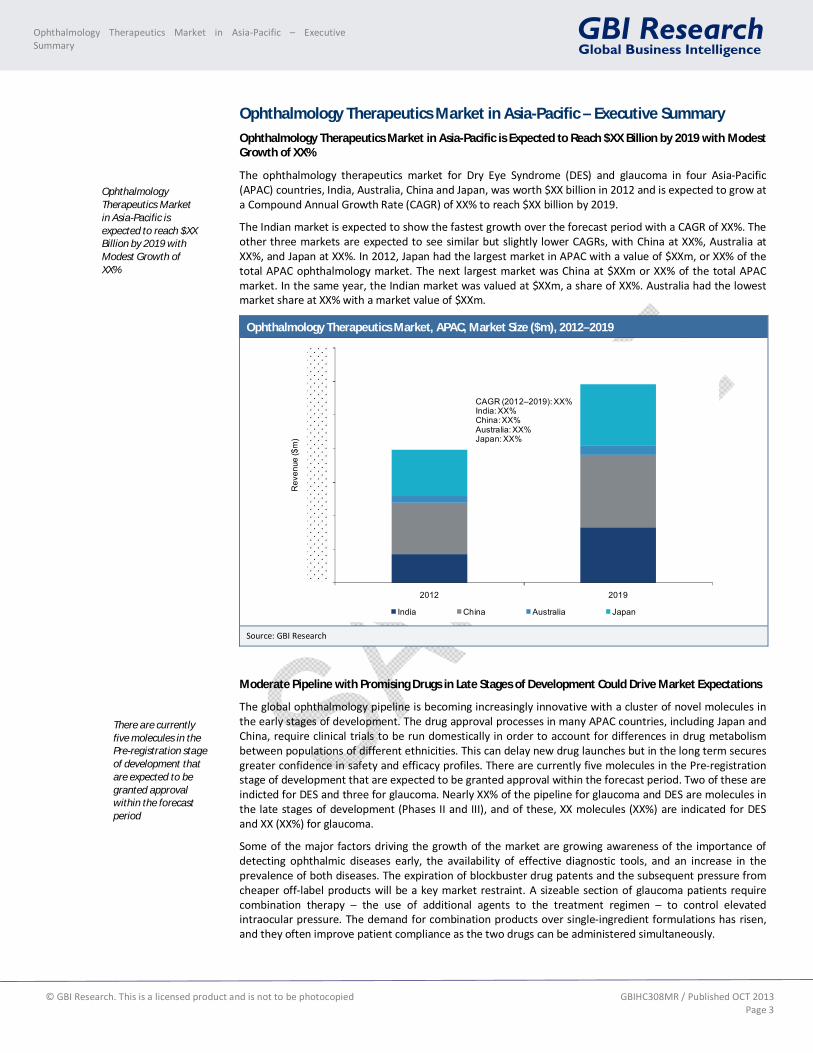
Ophthalmology Therapeutics Market in Asia-Pacific is Expected to Reach $XX Billion by 2019 with Modest Growth of XX%
The ophthalmology therapeutics market for Dry Eye Syndrome (DES) and glaucoma in four Asia-Pacific (APAC) countries, India, Australia, China and Japan, was worth $XX billion in 2012 and is expected to grow at a Compound Annual Growth Rate (CAGR) of XX% to reach $XX billion by 2019.
The Indian market is expected to show the fastest growth over the forecast period with a CAGR of XX%. The other three markets are expected to see similar but slightly lower CAGRs, with China at XX%, Australia at XX%, and Japan at XX%. In 2012, Japan had the largest market in APAC with a value of $XXm, or XX% of the total APAC ophthalmology market. The next largest market was China at $XXm or XX% of the total APAC market. In the same year, the Indian market was valued at $XXm, a share of XX%. Australia had the lowest market share at XX% with a market value of $XXm.
Ophthalmology Therapeutics Market, APAC, Market Size ($m), 2012–2019
2012 2019
Rev
enue
($m
)
India China Australia Japan
CAGR (2012–2019): XX%India: XX%China: XX%Australia: XX% Japan: XX%
Source: GBI Research
Moderate Pipeline with Promising Drugs in Late Stages of Development Could Drive Market Expectations
The global ophthalmology pipeline is becoming increasingly innovative with a cluster of novel molecules in the early stages of development. The drug approval processes in many APAC countries, including Japan and China, require clinical trials to be run domestically in order to account for differences in drug metabolism between populations of different ethnicities. This can delay new drug launches but in the long term secures greater confidence in safety and efficacy profiles. There are currently five molecules in the Pre-registration stage of development that are expected to be granted approval within the forecast period. Two of these are indicted for DES and three for glaucoma. Nearly XX% of the pipeline for glaucoma and DES are molecules in the late stages of development (Phases II and III), and of these, XX molecules (XX%) are indicated for DES and XX (XX%) for glaucoma.
Some of the major factors driving the growth of the market are growing awareness of the importance of detecting ophthalmic diseases early, the availability of effective diagnostic tools, and an increase in the prevalence of both diseases. The expiration of blockbuster drug patents and the subsequent pressure from cheaper off-label products will be a key market restraint. A sizeable section of glaucoma patients require combination therapy – the use of additional agents to the treatment regimen – to control elevated intraocular pressure. The demand for combination products over single-ingredient formulations has risen, and they often improve patient compliance as the two drugs can be administered simultaneously.
Ophthalmology Therapeutics Market in Asia-Pacific is expected to reach $XX Billion by 2019 with Modest Growth of XX%
There are currently five molecules in the Pre-registration stage of development that are expected to be granted approval within the forecast period
© GBI Research. This is a licensed product and is not to be photocopied GBIHC308MR / Published OCT 2013
Page 5
Table of Contents
1 Table of Contents
1 Table of Contents ................................................................................................................................. 5 1.1 List of Tables ............................................................................................................................. 8 1.2 List of Figures............................................................................................................................ 9
2 Ophthalmology Therapeutics Market in Asia-Pacific – Introduction ......................................................10 2.1 Dry Eye Syndrome....................................................................................................................10
2.1.1 Classification ....................................................................................................................10 2.1.2 Symptoms ........................................................................................................................10 2.1.3 Etiology ...........................................................................................................................10 2.1.4 Pathophysiology...............................................................................................................11 2.1.5 Diagnosis .........................................................................................................................12 2.1.6 Epidemiology ...................................................................................................................13 2.1.7 Prognosis .........................................................................................................................14 2.1.8 Treatment Options ...........................................................................................................14
2.2 Glaucoma ................................................................................................................................15 2.2.1 Classification ....................................................................................................................15 2.2.2 Symptoms ........................................................................................................................16 2.2.3 Etiology ...........................................................................................................................16 2.2.4 Pathophysiology...............................................................................................................17 2.2.5 Diagnosis .........................................................................................................................18 2.2.6 Epidemiology ...................................................................................................................19 2.2.7 Prognosis .........................................................................................................................19 2.2.8 Treatment Options ...........................................................................................................20
3 Ophthalmology Therapeutics Market in Asia-Pacific – Marketed Products (Global) ...............................21 3.1 Dry Eye Syndrome....................................................................................................................21 3.2 Glaucoma ................................................................................................................................21 3.3 Key Marketed Products ............................................................................................................22
3.3.1 Restasis ...........................................................................................................................22 3.3.2 Systane ............................................................................................................................23 3.3.3 Diquas .............................................................................................................................24 3.3.4 Mucosta ..........................................................................................................................25 3.3.5 Hyalein ............................................................................................................................26 3.3.6 Lumigan...........................................................................................................................27 3.3.7 Alphagan/Alphagan P ......................................................................................................28
4 Ophthalmology Therapeutics Market in Asia-Pacific – Pipeline Analysis ................................................29 4.1 Dry Eye Syndrome Pipeline.......................................................................................................29
4.1.1 Overall Pipeline ................................................................................................................29 4.1.2 Pipeline Analysis by Molecule Type ...................................................................................31 4.1.3 Pipeline Analysis by Mechanism of Action .........................................................................32
4.2 Glaucoma Pipeline ...................................................................................................................34 4.2.1 Overall Pipeline ................................................................................................................34 4.2.2 Pipeline Analysis by Molecule Type ...................................................................................35 4.2.3 Pipeline Analysis by Mechanism of Action .........................................................................36
4.3 Promising Drug Candidates in the Pipeline ................................................................................38 4.3.1 CF-101 .............................................................................................................................38 4.3.2 MIM-D3 ...........................................................................................................................38 4.3.3 SAR-1118 .........................................................................................................................38 4.3.4 DE-111 .............................................................................................................................39
5 Ophthalmology Therapeutics Market in Asia-Pacific – Market Forecast to 2018 ....................................40 5.1 APAC Market ...........................................................................................................................40
5.1.1 Treatment Usage Patterns................................................................................................40
© GBI Research. This is a licensed product and is not to be photocopied GBIHC308MR / Published OCT 2013
Page 6
Table of Contents
5.1.2 Annual Cost of Therapy ....................................................................................................40 5.1.3 Market Size ......................................................................................................................40
5.2 India ........................................................................................................................................42 5.2.1 Treatment Usage Patterns................................................................................................42 5.2.2 Annual Cost of Therapy ....................................................................................................42 5.2.3 Market Size ......................................................................................................................42
5.3 Australia ..................................................................................................................................44 5.3.1 Treatment Usage Patterns................................................................................................44 5.3.2 Annual Cost of Therapy ....................................................................................................44 5.3.3 Market Size ......................................................................................................................44
5.4 China .......................................................................................................................................46 5.4.1 Treatment Usage Patterns................................................................................................46 5.4.2 Annual Cost of Therapy ....................................................................................................46 5.4.3 Market Size ......................................................................................................................46
5.5 Japan .......................................................................................................................................48 5.5.1 Treatment Usage Patterns................................................................................................48 5.5.2 Annual Cost of Therapy ....................................................................................................48 5.5.3 Market Size ......................................................................................................................48
5.6 Drivers and Barriers .................................................................................................................50 5.6.1 Drivers .............................................................................................................................50 5.6.2 Barriers ............................................................................................................................51
6 Ophthalmology Therapeutics Market in Asia-Pacific – Deals and Strategic Consolidations (Global) ........52 6.1 Deals Analysis ..........................................................................................................................52 6.2 Major Co-Development Deals...................................................................................................53
6.2.1 NicOx Signs Research Agreement with Pfizer .....................................................................54 6.2.2 Acucela Enters into Co-Development Agreement with Otsuka Pharma for Rebamipide .......54 6.2.3 Akorn Enters into Agreement with Azad Pharma ...............................................................54
6.3 Major Licensing Deals ..............................................................................................................55 6.3.1 NicOx Enters into Worldwide Licensing Agreement with Bausch & Lomb ............................56 6.3.2 Quark Pharma Amends Licensing Agreement with Pfizer for PF-655 ..................................56 6.3.3 Asterand Enters into Licensing Agreement with Allergan ...................................................56
7 Ophthalmology Therapeutics Market in Asia-Pacific – Appendix ...........................................................57 7.1 All Pipeline Drugs by Phase ......................................................................................................57
7.1.1 Discovery .........................................................................................................................57 7.1.2 Preclinical ........................................................................................................................57 7.1.3 IND/CTA-filed ...................................................................................................................59 7.1.4 Phase I .............................................................................................................................59 7.1.5 Phase II ............................................................................................................................60 7.1.6 Phase III ...........................................................................................................................61 7.1.7 Pre-registration ................................................................................................................61 7.1.8 Undisclosed......................................................................................................................62
7.2 Market Forecasts to 2019 ........................................................................................................62 7.2.1 APAC ...............................................................................................................................62 7.2.2 Australia ..........................................................................................................................63 7.2.3 China ...............................................................................................................................63 7.2.4 India ................................................................................................................................64 7.2.5 Japan ...............................................................................................................................65
7.3 Market Definitions ...................................................................................................................65 7.4 Abbreviations ..........................................................................................................................65 7.5 Sources....................................................................................................................................67 7.6 Research Methodology ............................................................................................................68
7.6.1 Coverage .........................................................................................................................68

© GBI Research. This is a licensed product and is not to be photocopied GBIHC308MR / Published OCT 2013
Page 7
Table of Contents
7.6.2 Secondary Research .........................................................................................................69 7.6.3 Primary Research .............................................................................................................69 7.6.4 Therapeutic Landscape .....................................................................................................70 7.6.5 Geographical Landscape ..................................................................................................72 7.6.6 Pipeline Analysis...............................................................................................................72
7.7 Expert Panel Validation ............................................................................................................72 7.8 Contact Us ...............................................................................................................................72 7.9 Disclaimer................................................................................................................................73
© GBI Research. This is a licensed product and is not to be photocopied GBIHC308MR / Published OCT 2013
Page 8
Table of Contents
1.1 List of Tables
Table 1: Ophthalmology Therapeutics Market, Categories of Dry Eye Treatment, 2011 ..........................14 Table 2: Ophthalmology Therapeutics Market, Treatment Recommendations for Dry Eye Syndrome by
Disease Severity Level, 2011 ....................................................................................................15 Table 3: Ophthalmology Therapeutics Market, Medicines for Lowering Eye Pressure, 2013 ...................20 Table 4: Ophthalmology Therapeutics Market, Global, Pipeline (Discovery), 2013..................................57 Table 5: Ophthalmology Therapeutics Market, Global, Pipeline (Preclinical), 2013 .................................58 Table 6: Ophthalmology Therapeutics Market, Global, Pipeline (IND/CTA-filed), 2013 ...........................59 Table 7: Ophthalmology Therapeutics Market, Global, Pipeline (Phase I), 2013 .....................................59 Table 8: Ophthalmology Therapeutics Market, Global, Pipeline (Phase II), 2013.....................................60 Table 9: Ophthalmology Therapeutics Market, Global, Pipeline (Phase III), 2013....................................61 Table 10: Ophthalmology Therapeutics Market, Global, Pipeline (Pre-registration), 2013 ........................61 Table 11: Ophthalmology Therapeutics Market, Global, Pipeline (Undisclosed), 2012 ..............................62 Table 12: Ophthalmology Therapeutics Market APAC, Dry Eye Syndrome, Market Forecast, 2012–2019 ..62 Table 13: Ophthalmology Therapeutics Market, APAC, Glaucoma, Market Forecast, 2012–2019 ..............62 Table 14: Ophthalmology Therapeutics Market, Australia, Dry Eye Syndrome, Market Forecast,
2012–2019 .............................................................................................................................63 Table 15: Ophthalmology Therapeutics Market, Australia, Glaucoma, Market Forecast, 2012–2019 ........63 Table 16: Ophthalmology Therapeutics Market, China, Dry Eye Syndrome, Market Forecast, 2012–2019 63 Table 17: Ophthalmology Therapeutics Market, China, Glaucoma, Market Forecast, 2012–2019 .............64 Table 18: Ophthalmology Therapeutics Market, India, Dry Eye Syndrome, Market Forecast, 2012–2019 .64 Table 19: Ophthalmology Therapeutics Market, India, Glaucoma, Market Forecast, 2012–2019 ..............64 Table 20: Ophthalmology Therapeutics Market, Japan, Dry Eye Syndrome, Market Forecast, 2012–2019 65 Table 21: Ophthalmology Therapeutics Market, Japan, Glaucoma, Market Forecast, 2012–2019 .............65
© GBI Research. This is a licensed product and is not to be photocopied GBIHC308MR / Published OCT 2013
Page 9
Table of Contents
1.2 List of Figures
Figure 1: Ophthalmology Therapeutics Market, Global, Sales of Restasis ($m), 2006–2012 .....................22 Figure 2: Ophthalmology Therapeutics Market, Global, Sales of Diquas ($m), 2010–2012 .......................24 Figure 3: Ophthalmology Therapeutics Market, Global, Sales of Mucosta ($m), 2009–2012 ....................25 Figure 4: Ophthalmology Therapeutics Market, Global, Sales of Hyalein ($m), 2009–2012 ......................26 Figure 5: Ophthalmology Therapeutics Market, Global, Sales of Lumigan ($m), 2006–2012 .....................27 Figure 6: Ophthalmology Therapeutics Market, Global, Sales of Alphagan/Alphagan P ($m), 2006–2012 28 Figure 7: Ophthalmology Therapeutics Market, Global, Dry Eye Syndrome, Pipeline (%), 2013 ................30 Figure 8: Ophthalmology Therapeutics Market, Global, Dry Eye Syndrome, Pipeline by Molecule Type,
2013 .......................................................................................................................................31 Figure 9: Ophthalmology Therapeutics Market, Global, Dry Eye Syndrome, Pipeline by Mechanism of
Action, 2012 ...........................................................................................................................33 Figure 10: Ophthalmology Therapeutics Market, Global, Glaucoma, Pipeline, 2013 ..................................34 Figure 11: Ophthalmology Therapeutics Market, Global, Glaucoma, Pipeline by Molecule Type, 2013.......35 Figure 12: Ophthalmology Therapeutics Market, Global, Glaucoma, Pipeline by Mechanism of Action, 2013
...............................................................................................................................................37 Figure 13: Ophthalmology Therapeutics Market, APAC, Market Size ($m), 2012–2019 ..............................41 Figure 14: Ophthalmology Therapeutics Market, India, Market Size ($m), 2012–2019 ..............................43 Figure 15: Ophthalmology Therapeutics Market, Australia, Market Size ($m), 2012–2019 ........................45 Figure 16: Ophthalmology Therapeutics Market, China, Market Size ($m), 2012–2019 .............................47 Figure 17: Ophthalmology Therapeutics Market, Japan, Market Size ($m), 2012–2019 .............................49 Figure 18: Ophthalmology Therapeutics Market, Global, Deals, 2006–2013 ..............................................52 Figure 19: Ophthalmology Therapeutics Market, Global, Co-Development Deals, 2006–2013 ...................53 Figure 20: Ophthalmology Therapeutics Market, Global, Licensing Deals, 2006–2013 ...............................55 Figure 21: GBI Research Market Forecasting Model .................................................................................71
© GBI Research. This is a licensed product and is not to be photocopied GBIHC308MR / Published OCT 2013
Page 10
Ophthalmology Therapeutics Market in Asia-Pacific – Introduction
2 Ophthalmology Therapeutics Market in Asia-Pacific – Introduction
The ophthalmology therapeutics Asia-Pacific (APAC) market to 2019 report includes market estimations for 2012 and market forecast until 2019 for two indications: glaucoma and Dry Eye Syndrome (DES) in the four countries in the APAC region: India, Australia, China, and Japan. The treatment population for these two indications combined amounted to an estimated XX in 2012, and is expected to register modest growth to reach XX in 2019 growing at a Compound Annual Growth Rate (CAGR) of XX%.
2.1 Dry Eye Syndrome
2.1.1 Classification
DES is classified according to a variety of signs and symptoms, which are broken down into three levels of severity: mild, moderate, and severe. Whereas this classification system emphasizes symptoms over signs, due to the progressive nature of the disease, the symptoms often overlap within each level of severity. Mild DES sufferers experience symptoms of irritation, itching, burning, soreness, or sporadic blurred vision (AAOPPP Guidelines, 2011). Symptoms and clinical signs often do not correlate in these patients, so diagnosis is difficult and requires repeated observation. Patients with moderate DES complain of increased discomfort and frequency of symptoms, as well as more consistent visual disturbances. In patients with severe DES, problems with visual function become more consistent.
2.1.2 Symptoms
DES, also known as keratoconjunctivitis sicca, is a common disorder of the eye which occurs due to lack of sufficient moisture and lubrication on the tear film. Once symptoms manifest, they begin to worsen as the disease progresses or the severity of the symptoms increases. Most patients with mild DES experience irritation, without any long-term effects. Symptoms begin with aching, gritty, scratchy, sore, burning, or watery eyes, along with a foreign body sensation. As patients progress to severe DES or leave the mild-to-moderate forms untreated, symptoms can worsen to include sensitivity to light, blurred or fluctuating vision, structural damage, or even loss of vision. Activities or conditions that reduce the rate of blinking from prolonged use of the eyes can make symptoms worse. These activities include use of a computer, driving, watching television, and reading. Environmental conditions that exacerbate dry-eye symptoms include dusty, windy, smoky, dry, high-altitude, or air-conditioned areas. When the dry-eye is very mild, or it is prior to the occurrence of significant ocular changes, the diagnosis is often based on the assessment of patient symptoms and external conditions, and not on clinical findings.
2.1.3 Etiology
DES is a multifactorial disease of the eye caused by dryness, decreased tear production, or increased tear film evaporation. It is caused by a disturbance in any component of the Lacrimal Functional Unit (LFU), leading to alterations in the volume, composition, distribution, or clearance of the tear film (Knop et al., 2011).
Various autoimmune diseases, such as primary Sjögren’s syndrome, hyperthyroidism, Rheumatoid Arthritis (RA), or lupus can also lead to DES. Incomplete closure of the eyelids, eyelid disease, deficiency of the tear-producing glands and vitamin-A deficiency are other causes.
Based on two major etiologic categories, DES can be classified as follows;
Aqueous-Deficient Dry Eye (ADDE): ADDE, also known as Lacrimal Tear-Deficient Dry Eye (LTDDE), is characterized by a lack of aqueous tear secretion by the lacrimal glands due to lacrimal acinar dysfunction. Inadequate production of tears as a part of the natural aging process leads to DES. In women, DES occurs especially during menopause, which includes hormonal changes. It can be classified as either Sjögren or non-Sjögren, depending on the pre-existing conditions in the patient population. Primary Sjögren’s syndrome is a rare chronic autoimmune disorder in which a person’s white blood cells attack the lacrimal and parotid glands, which are both crucial to production of moisture. The inflammatory reaction seen in this disorder is a result of the infiltration of lymphocytes, monocytes, and plasma cells into the exocrine glands, thus resulting in the deterioration of these glands. A patient is classified as having secondary Sjögren’s syndrome when there is an underlying autoimmune disorder such as RA, systemic lupus erythematosus, or scleroderma; and presents with a dry mouth and dry eyes as a result (Lemp and Geerling, 2011).
© GBI Research. This is a licensed product and is not to be photocopied GBIHC308MR / Published OCT 2013
Page 29
Ophthalmology Therapeutics Market in Asia-Pacific – Pipeline Analysis
4 Ophthalmology Therapeutics Market in Asia-Pacific – Pipeline Analysis
4.1 Dry Eye Syndrome Pipeline
4.1.1 Overall Pipeline
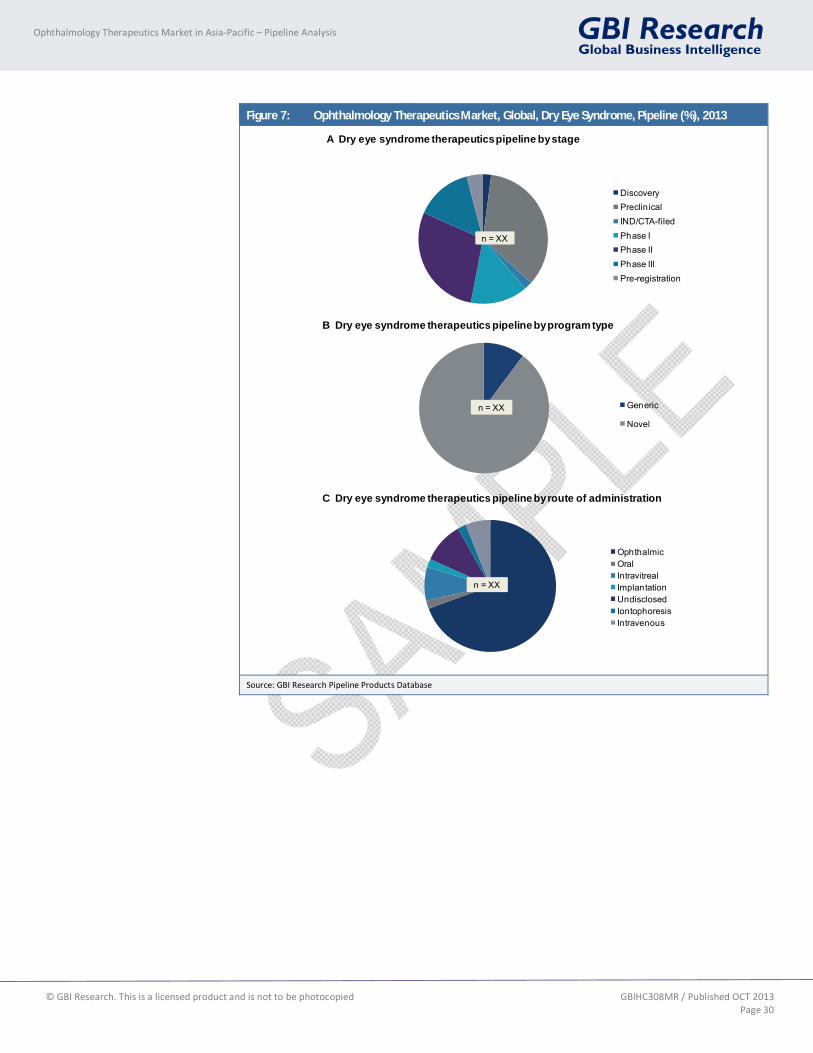
The current developmental pipeline for DES drugs is becoming increasingly innovative with XX drug candidates in various stages of clinical development. Most of the novel molecules are in the early stages. From a total of XX pipeline products in active development, XX% are in Phase I, XX% in Phase II, XX% are in Phase III and XX% are in the preclinical stage (Figure 7, Panel A). A significant proportion (XX%) of pipeline products in the clinical stages of development are novel, whereas only XX% are generic (Figure 7, Panel B). The route of administration of a majority of pipeline drugs is ophthalmic (XX%), which is followed by intravitreal (XX%) and intravenous (XX%) routes of administration. The share of all other routes of administration is displayed in (Figure 7, Panel C).
A significant proportion of pipeline products in the clinical stages of development are small molecules. It represents XX% of the overall pipeline irrespective of the stage of development which is followed by protein and monoclonal antibody with XX% each (Figure 8, Panel A). In each phase, the pipeline encompasses a diverse range of molecules that act upon various signaling targets. The individual molecular targets that currently dominate the DES pipeline are enzyme modulators followed by calcineurin inhibitor, receptor agonists and TNF inhibitor.
A series of tables containing an exhaustive list of all pipeline molecules, along with their respective companies and molecular targets is available in the appendix, with a separate table for each stage of development.
From a total of XX pipeline products in active development for Dry Eye Syndrome, XX% are in Phase I, XX% in Phase II, XX% are in Phase III and XX% are in the preclinical stage
© GBI Research. This is a licensed product and is not to be photocopied GBIHC308MR / Published OCT 2013
Page 30
Ophthalmology Therapeutics Market in Asia-Pacific – Pipeline Analysis
Figure 7: Ophthalmology Therapeutics Market, Global, Dry Eye Syndrome, Pipeline (%), 2013
B Dry eye syndrome therapeutics pipeline by program type
C Dry eye syndrome therapeutics pipeline by route of administration
A Dry eye syndrome therapeutics pipeline by stage
Generic
Novel
n = XX
OphthalmicOralIntravitrealImplantationUndisclosedIontophoresisIntravenous
n = XX
DiscoveryPreclinicalIND/CTA-filedPhase IPhase IIPhase IIIPre-registration
n = XX
Source: GBI Research Pipeline Products Database
© GBI Research. This is a licensed product and is not to be photocopied GBIHC308MR / Published OCT 2013
Page 32
Ophthalmology Therapeutics Market in Asia-Pacific – Pipeline Analysis
4.1.3 Pipeline Analysis by Mechanism of Action
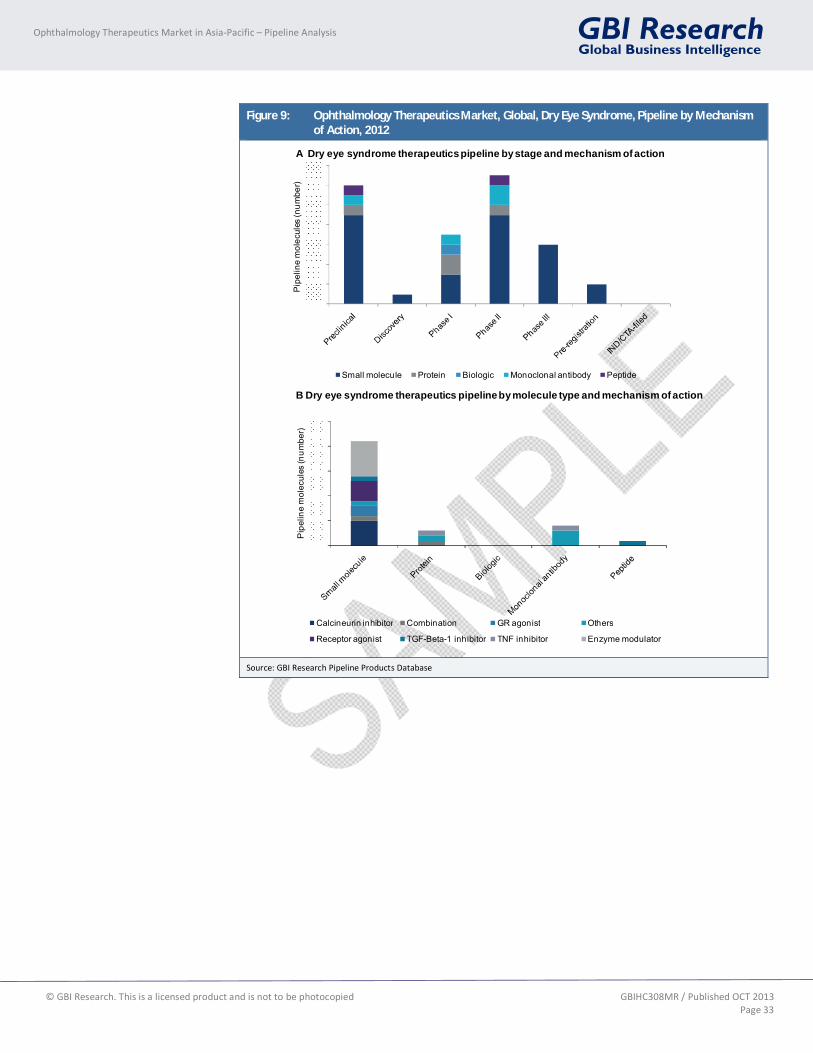
Enzyme modulators (XX%), calcineurin inhibitors (XX%) and receptor agonists (XX%) account for the highest shares of the DES pipeline (Figure 9, Panel A). Six of seven drugs in Phase III of development consists are small molecules out of which one each are receptor agonist, calcineurin inhibitor and growth receptor agonist.
Phase II pipeline drugs are dominated by enzyme modulators with five molecules which is followed by receptor agonists and combination products both with XX% and having two drugs in each category. The Phase I pipeline drugs are dominated by calcineurin inhibitors with two molecules in pipeline (XX%) (Figure 9, Panel B). All the molecules under enzyme modulators are small molecules. Similarly, all the molecules which are calcineurin inhibitors and receptor agonists are also small molecules whereas the TNF inhibitors have one molecule each in proteins and monoclonal antibodies and TGF-Beta-1 Inhibitor having one small molecule and one peptide (Figure 9, Panel B).
Apart from the categories mentioned above, the mechanism of action of other drug candidates is diverse. The mechanisms of action that fall under the others category are Interleukin-1 (IL-1) Receptor Antagonist, Chemokine (C-C Motif) Receptor 11 (CCR11. Eotaxin-1) Antagonist, Lymphocyte Function-Associated Antigen 1 (LFA-1) Antagonist, Cyclophilin A Inhibitors, Vascular Endothelial Growth Factor C (VEGF-C) Inhibitor. The mechanisms of action falling under the combination category are a combination of Lipopolysaccharide (LPS) Antagonist and Nuclear Factor Kappa B (NFkB) Inhibitor and combination of Transient Receptor Potential Vanilloid 1 (TRPV-1) Receptor (Capsaicin Receptor or Vanilloid Receptor 1) Antagonist.
© GBI Research. This is a licensed product and is not to be photocopied GBIHC308MR / Published OCT 2013
Page 33
Ophthalmology Therapeutics Market in Asia-Pacific – Pipeline Analysis
Figure 9: Ophthalmology Therapeutics Market, Global, Dry Eye Syndrome, Pipeline by Mechanism of Action, 2012
A Dry eye syndrome therapeutics pipeline by stage and mechanism of action
B Dry eye syndrome therapeutics pipelineby molecule type and mechanism of action
Pip
elin
e m
olec
ules
(num
ber)
Small molecule Protein Biologic Monoclonal antibody Peptide
Pip
elin
e m
olec
ules
(num
ber)
Calcineurin inhibitor Combination GR agonist Others
Receptor agonist TGF-Beta-1 inhibitor TNF inhibitor Enzyme modulator
Source: GBI Research Pipeline Products Database
© GBI Research. This is a licensed product and is not to be photocopied GBIHC308MR / Published OCT 2013
Page 57
Ophthalmology Therapeutics Market in Asia-Pacific – Appendix
7 Ophthalmology Therapeutics Market in Asia-Pacific – Appendix
7.1 All Pipeline Drugs by Phase
7.1.1 Discovery
Table 4: Ophthalmology Therapeutics Market, Global, Pipeline (Discovery), 2013
Product name Company Indication Stage of development
Source: GBI Research Pipeline Products Database
© GBI Research. This is a licensed product and is not to be photocopied GBIHC308MR / Published OCT 2013
Page 58
Ophthalmology Therapeutics Market in Asia-Pacific – Appendix
7.1.2 Preclinical
Table 5: Ophthalmology Therapeutics Market, Global, Pipeline (Preclinical), 2013
Product name Company Indication Stage of development
Source: GBI Research Pipeline Products Database
© GBI Research. This is a licensed product and is not to be photocopied GBIHC308MR / Published OCT 2013
Page 59
Ophthalmology Therapeutics Market in Asia-Pacific – Appendix
7.1.3 IND/CTA-filed
Table 6: Ophthalmology Therapeutics Market, Global, Pipeline (IND/CTA-filed), 2013
Product name Company Indication Stage of development
Source: GBI Research Pipeline Products Database
7.1.4 Phase I
Table 7: Ophthalmology Therapeutics Market, Global, Pipeline (Phase I), 2013
Product name Company Indication Stage of development
Source: GBI Research Pipeline Products Database
© GBI Research. This is a licensed product and is not to be photocopied GBIHC308MR / Published OCT 2013
Page 60
Ophthalmology Therapeutics Market in Asia-Pacific – Appendix
7.1.5 Phase II
Table 8: Ophthalmology Therapeutics Market, Global, Pipeline (Phase II), 2013
Product name Company Indication Stage of development
Source: GBI Research Pipeline Products Database
© GBI Research. This is a licensed product and is not to be photocopied GBIHC308MR / Published OCT 2013
Page 61
Ophthalmology Therapeutics Market in Asia-Pacific – Appendix
7.1.6 Phase III
Table 9: Ophthalmology Therapeutics Market, Global, Pipeline (Phase III), 2013
Product name Company Indication Stage of development
Source: GBI Research Pipeline Products Database
7.1.7 Pre-registration
Table 10: Ophthalmology Therapeutics Market, Global, Pipeline (Pre-registration), 2013
Product name Company Indication Stage of development
Source: GBI Research Pipeline Products Database
© GBI Research. This is a licensed product and is not to be photocopied GBIHC308MR / Published OCT 2013
Page 62
Ophthalmology Therapeutics Market in Asia-Pacific – Appendix
7.1.8 Undisclosed
Table 11: Ophthalmology Therapeutics Market, Global, Pipeline (Undisclosed), 2012
Product name Company Indication Stage of development
Source: GBI Research Pipeline Products Database
7.2 Market Forecasts to 2019
7.2.1 APAC
7.2.1.1 Dry Eye Syndrome
Table 12: Ophthalmology Therapeutics Market APAC, Dry Eye Syndrome, Market Forecast, 2012–2019
Year 2012 2013 2014 2015 2016 2017 2018 2019 CAGR (%)
Prevalence population (million)
Prescription population (million)
ACoT ($)
Revenue ($m)
Source: GBI Research
7.2.1.2 Glaucoma
Table 13: Ophthalmology Therapeutics Market, APAC, Glaucoma, Market Forecast, 2012–2019
Year 2012 2013 2014 2015 2016 2017 2018 2019 CAGR (%)
Prevalence population (million)
Prescription population (million)
ACoT ($)
Revenue ($m)
Source: GBI Research
© GBI Research. This is a licensed product and is not to be photocopied GBIHC308MR / Published OCT 2013
Page 63
Ophthalmology Therapeutics Market in Asia-Pacific – Appendix
7.2.2 Australia
7.2.2.1 Dry Eye Syndrome
Table 14: Ophthalmology Therapeutics Market, Australia, Dry Eye Syndrome, Market Forecast, 2012–2019
Year 2012 2013 2014 2015 2016 2017 2018 2019 CAGR (%)
Prevalence population (‘000)
Prescription population (‘000)
ACoT ($)
Revenue ($m)
Source: GBI Research
7.2.2.2 Glaucoma
Table 15: Ophthalmology Therapeutics Market, Australia, Glaucoma, Market Forecast, 2012–2019
Year 2012 2013 2014 2015 2016 2017 2018 2019 CAGR (%)
Prevalence population (‘000)
Prescription population (‘000)
ACoT ($)
Revenue ($m)
Source: GBI Research
7.2.3 China
7.2.3.1 Dry Eye Syndrome
Table 16: Ophthalmology Therapeutics Market, China, Dry Eye Syndrome, Market Forecast, 2012–2019
Year 2012 2013 2014 2015 2016 2017 2018 2019 CAGR (%)
Prevalence population (million)
Prescription population (million)
ACoT ($)
Revenue ($m)
Source: GBI Research
© GBI Research. This is a licensed product and is not to be photocopied GBIHC308MR / Published OCT 2013
Page 64
Ophthalmology Therapeutics Market in Asia-Pacific – Appendix
7.2.3.2 Glaucoma
Table 17: Ophthalmology Therapeutics Market, China, Glaucoma, Market Forecast, 2012–2019
Year 2012 2013 2014 2015 2016 2017 2018 2019 CAGR (%)
Prevalence population (million)
Prescription population (million)
ACoT ($)
Revenue ($m)
Source: GBI Research
7.2.4 India
7.2.4.1 Dry Eye Syndrome
Table 18: Ophthalmology Therapeutics Market, India, Dry Eye Syndrome, Market Forecast, 2012–2019
Year
Prevalence population (million)
Prescription population (million)
ACoT ($)
Revenue ($m)
Source: GBI Research
7.2.4.2 Glaucoma
Table 19: Ophthalmology Therapeutics Market, India, Glaucoma, Market Forecast, 2012–2019
Year 2012 2013 2014 2015 2016 2017 2018 2019 CAGR (%)
Prevalence population (million)
Prescription population (million)
ACoT ($)
Revenue ($m)
Source: GBI Research
© GBI Research. This is a licensed product and is not to be photocopied GBIHC308MR / Published OCT 2013
Page 65
Ophthalmology Therapeutics Market in Asia-Pacific – Appendix
7.2.5 Japan
7.2.5.1 Dry Eye Syndrome
Table 20: Ophthalmology Therapeutics Market, Japan, Dry Eye Syndrome, Market Forecast, 2012–2019
Year 2012 2013 2014 2015 2016 2017 2018 2019 CAGR (%)
Prevalence population (million)
Prescription population (million)
ACoT ($)
Revenue ($m)
Source: GBI Research
7.2.5.2 Glaucoma
Table 21: Ophthalmology Therapeutics Market, Japan, Glaucoma, Market Forecast, 2012–2019
Year 2012 2013 2014 2015 2016 2017 2018 2019 CAGR (%)
Prevalence population (million)
Prescription population (million)
ACoT ($)
Revenue ($m)
Source: GBI Research
7.3 Market Definitions
The report covers the market forecast for the Asia-Pacific (APAC) region, comprising Australia, China, India and Japan.
The prevalence population is the estimated number of people at any given point of time who are affected by DES or glaucoma.
The prescription rate is the percentage of the patients suffering from DES or glaucoma that has been prescribed pharmacological treatments.
The prescription population refers to the number of people receiving pharmacological treatment.
7.4 Abbreviations
11-Beta-HSD1: 11 Beta-Hydroxysteroid Dehydrogenase Type 1
A3AR: A3 Adenosine Receptor
AAO: American Academy of Ophthalmology
AAOPPP: American Academy of Ophthalmology, Preferred Practice Patterns
ACG: Angle-Closure Glaucoma
ADDE: Aqueous-Deficient Dry Eye
ANDA: Abbreviated New Drug Application
AOA: American Optometric Association
APAC: Asia-Pacific
ATP: Adenosine Triphosphate
CAGR: Compound Annual Growth Rate
© GBI Research. This is a licensed product and is not to be photocopied GBIHC308MR / Published OCT 2013
Page 66
Ophthalmology Therapeutics Market in Asia-Pacific – Appendix
CB1: Cannabinoid Receptor Type 1
CCR11: Chemokine (C-C Motif) Receptor 11
CF: Cystic Fibrosis
DES: Dry Eye Syndrome
EDE: Evaporative Dry Eye
FDA: Food and Drug Administration
GR: Growth Receptor
GSH: Glutathione
HA: Hyaluronic Acid
IL-1α: Interleukin-1α
IND/CTA: Investigational New Drug/Clinical Trial Application
IOP: Intraocular Pressure
IRS1: Insulin Receptor Substrate 1
LFA-1: Lymphocyte Function-Associated Antigen 1
LFU: Lacrimal Functional Unit
LIMK1: LIM Domain Kinase 1
LPS: Lipopolysaccharide
LTDDE: Lacrimal Tear-Deficient Dry Eye
mAChR: Muscarinic Acetylcholine Receptor
MAP: Mitogen-Activated Protein
MD: Multi Dose
MGD: Meibomian Gland Dysfunction
MmHg: Millimeters of Mercury
MMP: Matrix Metalloproteinases
NAT: Noradrenaline Transporter
NEI VFQ-25: National Eye Institute Visual Function Questionnaire-25
NET: Norepinephrine Transporter
NFkB: Nuclear Factor Kappa B
NGF: Nerve Growth Factor
NO: Nitric Oxide
OA: Osteoarthritis
OAG: Open-Angle Glaucoma
OSDI: Ocular Surface Disease Index
OTC: Over-The Counter
PEG 400: Polyethylene Glycol 400
PLC: Phospholipase C-ß
Redox: Reduction-Oxidation
© GBI Research. This is a licensed product and is not to be photocopied GBIHC308MR / Published OCT 2013
Page 67
Ophthalmology Therapeutics Market in Asia-Pacific – Appendix
RGC: Retinal Ganglion Cell
ROS: Reactive Oxygen Species
sGC: Soluble Guanylate Cyclase
TFBUT: Tear Film Breakup Time
TGF-Beta-1: Transforming Growth Factor- Beta-1
TNF-α: Tumor Necrosis Factor-α
TRIPS: Trade Related Aspects of Intellectual Property Rights
TRPV-1: Transient Receptor Potential Vanilloid 1
UD: Unit Dose
VEGF: Vascular Endothelial Growth Factor
WHO: World Health Organization
7.5 Sources
AOA (2001). AOA Optometric Clinical Practice Guidelines (Care of the Patient with Primary Angle Closure Glaucoma (CPG5). American Optometric Association. Available from: http://www.aoa.org/optometrists/tools-and-resources/clinical-practice-guidelines [Accessed on September 6, 2013]
AOA (2010). AOA Optometric Clinical Practice Guidelines (Care of the Patient with Open Angle Glaucoma (CPG9). American Optometric Association. Available from: http://www.aoa.org/optometrists/tools-and-resources/clinical-practice-guidelines [Accessed on September 6, 2013]
Davis L (2003). Women Over 50: Dry Eyes in the House Disorder More Common in Women Age 75 and Older. Available from: http://women.webmd.com/news/20030812/women-over-50-dry-eyes-in-house. [Accessed September 6, 2013].
DEWS (2007). Definition and Classification of Dry Eye. Report of the Diagnosis and Classification Subcommittee of the Dry Eye WorkShop. The Ocular Surface; 5: 75–92.
Glaucoma Research Foundation (2012). Understand Your Glaucoma Diagnosis. Glaucoma Research Foundation. Available from: http://www.glaucoma.org/treatment/understand-your-glaucoma-diagnosis.php [Accessed on September 6, 2013]
Glaucoma Research Foundation (2010). Glaucoma Worldwide: A Growing Concern. Glaucoma Research Foundation. Available from: http://www.glaucoma.org/gleams/glaucoma-worldwide-a-growing-concern.php [Accessed on September 6, 2013]
Quigley HA and Broman AT (2006). The number of people with glaucoma worldwide in 2010 and 2020. British Journal of Ophthalmology; 90(3): 262–267.
Knop E, et al. (2011). The international workshop on meibomian gland dysfunction: report of the subcommittee on anatomy, physiology, and pathophysiology of the meibomian gland. Investigative Ophthalmology & Visual Science; 52(4): 1938–1978.
Li DQ, et al. (2004). Stimulation of matrix metalloproteinases by hyperosmolarity via a JNK pathway in human corneal epithelial cells. Investigative Ophthalmology & Visual Science; 45: 4302–4311.
Lemp MA and Geerling G (2011). Distinguishing Evaporative from Aqueous Deficient Dry Eye. Cataract & Refractive Surgery Today Europe. December 2011.
Lemp MA, et al. (2011). Tear osmolarity in the diagnosis and management of dry eye disease. American Journal of Ophthalmology; 151(5): 792–798.
Miljanović B, et al. (2007). Impact of dry eye syndrome on vision-related quality of life. American Journal of Ophthalmology; 143: 409–415.
© GBI Research. This is a licensed product and is not to be photocopied GBIHC308MR / Published OCT 2013
Page 68
Ophthalmology Therapeutics Market in Asia-Pacific – Appendix
Perry HD (2008). Dry eye disease: pathophysiology, classification, and diagnosis. American Journal of Managed Care; 14: 79–87.
Sahai A and Malik P (2005). Dry eye: prevalence and attributable risk factors in a hospital based population. Indian Journal of Ophthalmology; 53: 87–91.
Sall K, et al. (2000). Two multicenter, randomized studies of the efficacy and safety of cyclosporine ophthalmic emulsion in moderate to severe dry eye disease. CsA Phase 3 Study Group. Ophthalmology; 107: 631–639.
Sacca SC (2006a). Glaucomatous outflow pathway and oxidative stress. Available from: http://www.v2020la.org/pub/PUBLICATIONS_BY_TOPICS/Glaucoma/Glaucomatous....pdf
Sacca SC (2006b). Glaucomatous outflow pathway and oxidative stress. Available from: http://www.v2020la.org/pub/PUBLICATIONS_BY_TOPICS/Glaucoma/Glaucomatous....pdf
Sacca SC, et al. (2005) Oxidative DNA damage in the human trabecular meshwork: clinical correlation in patients with primary open-angle glaucoma. Archives of Ophthalmology; 123(4): 458–463.
Schaumberg DA, et al. (2002a). Epidemiology of dry eye syndrome. Advances in Experimental Medicine and Biology; 506: 989–998
Schaumberg DA, et al. (2002b). Epidemiology of dry eye syndrome. Advances in Experimental Medicine and Biology; 506: 989–998
Shimazaki J, et al. (1995). Ocular surface changes and discomfort in patients with meibomian gland dysfunction. Archives of Ophthalmology; 113: 1266–1270.
US DHHS (2013). Treatments for Open-Angle Glaucoma: A Review of the Research for Adults. US Department of Health and Human Services. Available from: http://effectivehealthcare.ahrq.gov/search-for-guides-reviews-and-reports/?pageaction=displayproduct&productID=1395&ECem=130214 [Accessed on September 6, 2013]
Wilson SE (2003). Inflammation: a unifying theory for the origin of dry eye syndrome. Managed Care; 12(suppl 12): 14–19.
WHO (2012). Glaucoma is second leading cause of blindness globally. Available from: http://www.who.int/bulletin/volumes/82/11/feature1104/en/index.html [Accessed on September 6, 2013]
7.6 Research Methodology
GBI Research’s dedicated research and analysis teams consist of experienced professionals with marketing, market research and consulting backgrounds in the pharmaceutical industry, as well as advanced statistical expertise.
GBI Research adheres to the codes of practice of the Market Research Society (www.mrs.org.uk) and the Strategic and Competitive Intelligence Professionals (www.scip.org).
All GBI Research databases are continuously updated and revised.
7.6.1 Coverage
The objective of updating GBI Research coverage is to ensure that it represents the most up-to-date vision of the industry possible.
Changes to the industry taxonomy are built on the basis of extensive research of company, association and competitor sources.
Company coverage is based on three key factors: market capitalization, revenues and media attention/innovation/market potential.
An exhaustive search of 56 member exchanges is conducted and companies are prioritized on the basis of their market capitalization.
© GBI Research. This is a licensed product and is not to be photocopied GBIHC308MR / Published OCT 2013
Page 69
Ophthalmology Therapeutics Market in Asia-Pacific – Appendix
The estimated revenues of all major companies, including private and governmental, are gathered and used to prioritize coverage.
Companies which are making the news, or which are of particular interest due to their innovative approach, are prioritized.
GBI Research aims to cover all major news events and deals in the pharmaceutical industry, updated on a daily basis.
The coverage is further streamlined and strengthened with additional inputs from GBI Research’s expert panel (see below).
7.6.2 Secondary Research
The research process begins with exhaustive secondary research on internal and external sources to source qualitative and quantitative information relating to each market.
The secondary research sources that are typically referred to include, but are not limited to:
Company websites, annual reports, financial reports, broker reports, investor presentations and SEC filings
Industry trade journals, scientific journals and other technical literature
Internal and external proprietary databases
Relevant patent and regulatory databases
National government documents, statistical databases and market reports
Procedure registries
News articles, press releases and web-casts specific to the companies operating in the market
7.6.3 Primary Research
GBI Research conducts hundreds of primary interviews each year with industry participants and commentators in order to validate its data and analysis. A typical research interview fulfills the following functions:
It provides first-hand information on the market size, market trends, growth trends, competitive landscape and future outlook.
It helps in validating and strengthening the secondary research findings.
It further develops the analysis team’s expertise and market understanding.
Primary research involves email and telephone interviews as well as face-to-face interviews for each market, category, segment and sub-segment across geographies.
The participants who typically take part in such a process include, but are not limited to:
Industry participants: CEOs, VPs, marketing/product managers, market intelligence managers and national sales managers
Hospital stores, laboratories, pharmacies, distributors and paramedics
Outside experts: Investment bankers, valuation experts, research analysts specializing in specific medical equipment markets
Key opinion leaders: Physicians and surgeons specializing in different therapeutic areas corresponding to different kinds of medical equipment.
© GBI Research. This is a licensed product and is not to be photocopied GBIHC308MR / Published OCT 2013
Page 70
Ophthalmology Therapeutics Market in Asia-Pacific – Appendix
7.6.4 Therapeutic Landscape
Revenues for each indication, geography-wise, are arrived at by utilizing the GBI Research market forecasting model. The global revenue for each indication is the sum value of revenues of all seven regions.
The annual cost of therapy for each indication is arrived at by considering the cost of the drugs, dosage of the drugs and the duration of the therapy.
The generic share of the market for each indication is obtained by calculating the prescription share for generic drugs and the respective cost of treatment.
The treatment usage pattern which includes quantitative data on the diseased population, treatment-seeking population, diagnosed population and treated population for an indication, is arrived at by referring to various sources as mentioned below.
GBI Research uses the epidemiology-based treatment flow model to forecast market size for therapeutic indications.
Epidemiology-Based Forecasting
The forecasting model used at GBI Research makes use of epidemiology data gathered from research publications and primary interviews with physicians to represent the treatment flow patterns for individual diseases and therapies. The market for any disease segment is directly proportional to the volume of units sold and the price per unit.
Sales = Volume of Units sold X Price per Unit
The volume of units sold is calculated on the average dosage regimen for that disease, duration of treatment and number of patients who are prescribed drug treatment (prescription population). Prescription population is calculated as the percentage of population diagnosed with a disease (diagnosis population). Diagnosis population is the population diagnosed with a disease expressed as a percentage of the population that is seeking treatment (treatment-seeking population). Prevalence of a disease (diseased population) is the percentage of the total population who suffer from a disease/condition.
Data on the treatment seeking rate, diagnosis rate and prescription rate, if unavailable from research publications, are gathered from interviews with physicians and are used to estimate the patient volumes for the disease under consideration. Therapy uptake and compliance data are fitted in the forecasting model to account for patient switching and compliance behavior.
To account for differences in patient affordability of drugs across various geographies, macroeconomic data such as inflation and GDP; and healthcare indicators such as healthcare spending, insurance coverage and average income per individual are used.
Annual cost of therapy is calculated using product purchase frequency and the average price of the therapy. Product purchase frequency is calculated from the dosage data available for the therapies and drug prices are gathered from public sources.
The epidemiology-based forecasting model uses a bottom-up methodology and it makes use of estimations in the absence of data from research publications. Such estimations may result in a final market value which is different from the actual value. To correct this ‘gap’ the forecasting model uses ‘triangulation’ with the help of base year sales data (from company annual reports, internal and external databases) and sales estimations.
Analogous Forecasting Methodology
Analogous forecasting methodology is used to account for the introduction of new products, patent expiries of branded products and subsequent introduction of generics. Historic data for new product launches and generics penetration are used to arrive at robust forecasts. Increase or decrease of prevalence rates, treatment seeking rate, diagnosis rate and prescription rate are fitted into the forecasting model to estimate market growth rate.
The proprietary model enables GBI Research to account for the impact of individual drivers and restraints in the growth of the market. The year of impact and the extent of impact are quantified in the forecasting model to provide close-to-accurate data sets.
© GBI Research. This is a licensed product and is not to be photocopied GBIHC308MR / Published OCT 2013
Page 71
Ophthalmology Therapeutics Market in Asia-Pacific – Appendix
Diseased Population
The diseased population for any indication is the prevalence. The prevalence rates are usually obtained from various journals, online publications, sources such as the World Health Organization (WHO) or associations and foundation websites for that particular disease.
Prescription Population
For any disease, multiple treatment options exist. For example, in cancer treatment various treatment options such as surgery, radiation therapy and drug therapy are available. The prescription population is defined as the number of patients who are prescribed drug therapy. This is calculated as a percentage of the diagnosis population. The prescription population is primarily driven by the age at which the disease is diagnosed, the disease stage, patient health and the cost of drug treatment.
7.6.4.1 Market Size by Geography
The treatment usage pattern and annual cost of therapy in each country has been factored in while deriving the individual country market size.
Forecasting Model for Therapeutic Areas
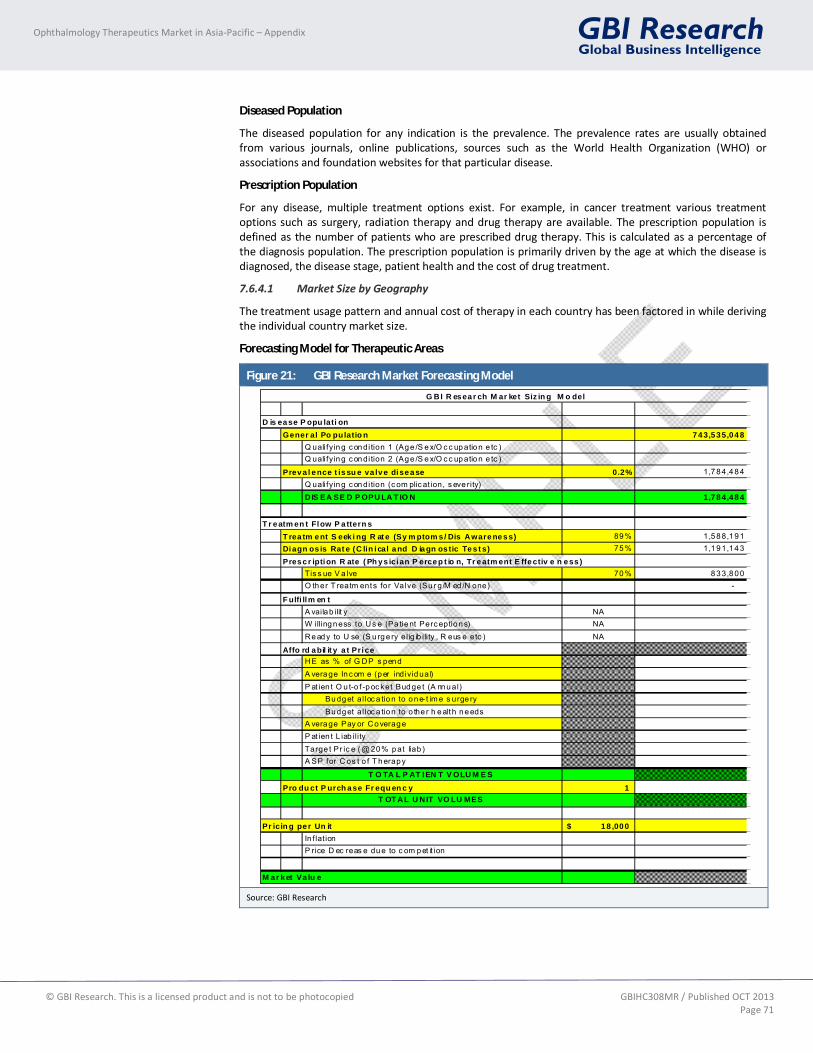
Figure 21: GBI Research Market Forecasting Model
D is ease P opu lati onGener al Po pulatio n 743,535,048
Q uali fying c ondi tion 1 (Age /S ex/O c c upation e tc )Q uali fying c ondi tion 2 (Age /S ex/O c c upation e tc )
Preva l ence t issu e va lve disease 0.2% 1,784,484 Q uali fying c ondi tion (c om plic ation, s eve rity)DIS EA SE D P OPU LA T IO N 1,784,484
T r eatm en t Flow P a ttern sT rea tm ent S eek i ng R at e (Sy m ptom s / Dis Awareness) 89% 1,588,191 Diagn os is Rat e (C lin ical and D iagn os tic Tes t s) 75% 1,191,143
Prescr iption R ate ( Ph ys ician P ercep t io n, Tr eatm ent E ffectiv e n ess )Tis s ue V a lve 70% 833,800 O ther T reatm ents for Valve (Su r g/M ed /N one) -
F ulfi llm en tA vailab ilit y NAW illingness to Us e (Pa tient Perc eptions) NAReady to U se (S u rge ry elig ib ility , R eus e etc ) NA
Affo rd abil it y a t PriceHE as % of G DP s pendA verage Inc om e (per individua l)P at ien t O u t-o f -poc ket Budge t (A nnual)
Budget al loc a tion to one-t im e s urge ryBudget al loc a tion to o the r h ealth needs
A verage Pay or CoverageP at ien t L iab ilityTarge t Pr ic e ( @ 20% pat liab )A SP for C os t o f T herapy
T O TA L P AT IEN T V OLU M E SPro du ct P urch ase Fr equ en c y 1
T OT AL U NIT VO LU MES
Pr icin g per Un it 18 ,000$ In f lat ionP rice D ec reas e due to c om pet it ion
M ar ket Va lu e
G BI R esear ch M ar ket Siz in g M o del
Source: GBI Research
© GBI Research. This is a licensed product and is not to be photocopied GBIHC308MR / Published OCT 2013
Page 72
Ophthalmology Therapeutics Market in Asia-Pacific – Appendix
The above figure represents a typical forecasting model followed in GBI Research. As discussed previously, the model is built on the treatment flow patterns. The model starts with the general population, then diseased population as a percentage of the general population and then follows the treatment seeking population as a percentage of the diseased population and diagnosed population as a percentage of the treatment seeking population. Finally, the total volume of units sold is calculated by multiplying the treated population by the average dosage per year per patient.
7.6.5 Geographical Landscape
GBI Research has analyzed four geographies: Australia, India, China and Japan. The total market size for each country is provided which is the sum value of the market sizes of all the indications for that particular country. The maximum and minimum estimated market sizes are then provided by adjusting all variables expected to impact upon the market during the forecast period in order to provide the best and worst-case scenarios.
Articles from research journals and agency publications such as Ophthalmology, National Institute of Health and ClinicalTrials.gov are the source of data for the estimation of market size and making forecasts.
7.6.6 Pipeline Analysis
This section provides a list of molecules at various stages in the pipeline for various indications. The list is sourced from internal database and validated for the accuracy of phase and mechanism of action at ClinicalTrials.gov and company websites. The section also includes a list of promising molecules which is narrowed down based on the results of the clinical trials at various stages and the novelty of mechanism of action. A heat map, sourced from relevant clinical trials, is provided to compare these products to one another in addition to currently marketed products. The latest press releases issued by the company and news reports are also the source of information for the status of the molecule in the pipeline. This list of pipeline molecules, in conjunction with a list of ongoing and completed clinical trials, is analyzed in this section, and a full breakdown of pipeline molecules and clinical trials by Phase, molecule type and molecular target is provided.
7.7 Expert Panel Validation
GBI Research uses a panel of experts to cross-verify its databases and forecasts.
GBI Research expert panel comprises marketing managers, product specialists, international sales managers from pharmaceutical companies, academics from research universities and key opinion leaders from hospitals.
Historic data and forecasts are relayed to GBI Research’s expert panel for feedback and are adjusted in accordance with their feedback.

© GBI Research. This is a licensed product and is not to be photocopied GBIHC308MR / Published OCT 2013
Page 73
Ophthalmology Therapeutics Market in Asia-Pacific – Appendix
7.9 Disclaimer
All Rights Reserved.
No part of this publication may be reproduced, stored in a retrieval system or transmitted in any form by any means, electronic, mechanical, photocopying, recording or otherwise, without the prior permission of the publisher, GBI Research.


