New Inuliolytic Fungus: Molecular Identification and Statistical
Optimization of Its Inulinase Secretion for Bioethanol Production
from Helianthus Tuberosus
Mohammad Magdy El-Metwally1
, WesamEldin Ismail Ali Saber2 and Samia Abd Allah AbdAl-
Aziz3
1Department of Botany and microbiology, Faculty of Science, Damanhour University, Egypt
2Microbial Activity Unit, Department of Microbiology, Soils and Water and Environment Research
Institute, Agricultural Research Center, Giza, Egypt. 3Department of Nucleic Acids Research, Genetic Engineering and Biotechnology Research Institute, City for
Scientific Research and Technology Applications, Alexandria, Egypt.
Abstract. New inulinolytic fungus was identified as Talaromyces purpureogenus KJ584844, and
investigated for maximum hydrolysis of inulin of Helianthus tuberosus tubers. NH4Cl and yeast extract were
found to be significant in inulinase production based on Plackett-Burman matrix, which increased the
inulinase production by 3.59-fold. The interaction between both variables was optimized based on central
composite design, with 2.35 fold increase in the enzyme activity (166.13 U g-1
tubers) after only 3 d of
incubation. The sugary material resulted (0.823 g g-1
tubers) from the hydrolytic action of the inulinolytic
fungus was subjected to bioethanol production by Saccharomyces cerevisae. A total ethanol yield of 0.367 g
per g tubers was recovered. This fungus is not previously reported as inulinolytic fungus, although its high
efficiency, additional optimization studies is needed for over secretion of inulinase to maximize the
hydrolytic efficiency of tubers into sugary materials, which is the building block for bioethanol production.
Keywords: talaromyces purpureogenus, inulinase; molecular identification; central composite design;
bioethanol
1. Introduction
Biomass is a hidden form of energy and can be used instead of fossil fuels but the true challenge based
on the way by which we increase the impact of biomass utilization and conversion to available form of
energy source. In this article the selection of H. tuberosus based on its high tolerance as it can grow under
annual precipitation ranging from 31 to 282 cm, with suitable average temperature range of 6.3 - 26.6°C, and
pH of 4.5 to 8.2 with no or minimal fertilizer requirement [1].
Like sugar beet, H. tuberosus produces sugars in the above ground and stores them in the roots and
tubers. The tubers consist of 75–79% water, 2–3% proteins, and 15–16% carbohydrates, of which inulin
constitute 80% or more. Inulin is a polyfructan consists of linear chains of β-2, 1-linked D-fructofuranose
molecules terminated by a glucose residue through a sucrose-type linkage at the reducing end [2]. Such
inulin source has recently received attention as a renewable raw material for fructose syrup production and
ethanol biosynthesis as well as acetone and butanol [3]. It's too hardly and costly to do that without inulinase,
which targeting the hydrolases of β-2, 1 linkage of inulin cleaving it into fructose and glucose.
Depending on their mode of action, microbial inulinases are classified into, 1) endoinulinases (2, 1- β-
D-fructan fructanohydrolase; EC 3.2.1.7), which breaking bonds between fructose units inside the inulin
Corresponding author. Tel.: +2 01003956536 E-mail address: [email protected]
International Proceedings of Chemical, Biological and Environmental Engineering, Vol. 99 (2016)
DOI: 10.7763/IPCBEE. 2016. V99. 2
7
polymer to produce oligosaccharides, and 2) exo-inulinases (β-D-fructohydrolase; EC 3.2.1 .80), which
producesingle fructose units from the non-reducing end of the inulin molecule [4]-[6].
Fungi are the best source for commercial production of inulinases because of their easy cultivation and
high yields of the enzyme especially in solid state fermentation (SSF). SSF has many preferences to
submerged fermentation (SmF) for microbial enzyme production including: superior productivities, lower
operating costs, less demands for contamination control, cheaper fermentation media, good and higher
oxygen supplementation, simpler equipment and control systems and lower energy consumption[7].
The statistical and mathematical approaches have several advantages in the microbial enzymes
production, of which the design of Plackett-Burman introduces efficient method for screening and selection
among large numbers of tested variables without testing their interaction, the interrelationship among the
effective variables could be determined latter using response surface methodology (RSM). Central composite
design (CCD) is one of the popular designs of RSM used for such purpose. It provides statistical modeling
for understanding the interactions among the process parameters at varying levels and in calculating the
optimal level of each parameter for maximization of a given target [8].
Most studies on inulinase production utilize yeasts as the microbial model, on the other hand
optimization of SSF medium for the production of inulinase by fungi on tubers of H. tuberosus are limited,
and its application in bioethanol production are also rare. In this article, we expanded our knowledge by
adding a new molecularly identified inulinase-producing fungus. The SSF technique and the statistical CCD
were used to maximize the productivity of inulinase on tubers of H. tuberosus, the hydrolysate resulted from
the catalytic action of inulinase was applied in the bioethanol production.
2. Materials and Methods
2.1. Tubers of Helianthus Tuberosus
Healthy clean tubers of H. tuberosus were obtained from the Horticulture research station, Agricultural
Research Center, Egypt (+7m altitude, 30° 11" latitude and 28° 26" longitude), during the summer growing
seasons of 2015. The tubers were cool-dried and grinded; the resulted powder was used as a solid-state for
the fermentation process.
2.2. Fungal Isolate
The fungus was isolated previously from deteriorated textile sample and showed reasonable inulinase
activity among other isolates in primary screening test on inulin agar plates. The fungus was preserved at
4 °C on slants of Czapek agar medium after incubated at 28±2 °C for 7 days, and sub-cultured monthly.
2.3. Molecular Identification of the Fungus
Isolation, amplification and molecular sequencing of Inter Transcribed Spacer (ITS) of the fungal DNA
was carried out. The genomic DNA of the fungus was extracted according to the procedure of Lee and
Taylor (1990) [9] with some modifications as follows; after 10 days of culture growth on PDA medium, the
mycelia were collected and frozen with liquid nitrogen, then grounded with sterilized mortar-pestle and kept
in 1.5 ml micro tube, to which equal amount of extraction buffer (50 mMTris-HCl, pH 7.5, 50 mM EDTA,
pH 8 and 1% sarkosyl) was added and incubated at 65 °C for 30 min. After incubation, same amount of PCI
(25 ml phenol: 24 ml chloroform: 1 ml isoamyl-alcohol) was added, vortexed and centrifuged at 4 °C, 10
min, 12000 rpm. Only the supernatant of upper part was taken in 1.5 ml micro tube, to which 1000 μl of 99.9%
alcohol was added and centrifuged at 4 °C, 5 min, 12000 rpm. In this case, the supernatant was removed, and
added 500 μl of 70% alcohol with precipitated DNA, vortexed and centrifuged at 4 °C, 5 min, 12000 rpm.
Again supernatant was removed and waited until residual alcohol evaporated. Finally, 500 μl of sterilized
distilled water was added. DNA concentration was measured using spectrophotometer [10].
The ITS region of the rDNA of the isolated fungus was amplified by polymerase chain reaction (PCR)
using universal primers ITS1 (5'-TCCGTAGGTGAACCTGCG-3') and ITS4 (5'-
TCCTCCGCTTATTGATATGC-3') according to (White et al., 1990) [11]. Amplification reaction was
performed in a total volume of 20 μl containing 10× PCR buffer 2 μl, dNTP 1.6 μl, 0.5 μl of each primer, 0.2
μl ofTaq polymerase, 1μl of genomic DNA and 14.2 μl of sterilized distilled water. PCR reaction was
8
performed using thermal cycler (Eppendorf Thermal Cycler) with an initial denaturation stage of 5 minutes
at 95 °C, followed by 35 cycles of denaturation for 30 seconds at 94 °C, annealing for 30 seconds at 52 °C,
extension for 1 minute at 72 °C and a final extension for 10 minutes at 72 °C. Amplification products were
electrophoresed on 1.5% agarose gel with a 1,3 kb DNA ladder as marker and purified using PCR
purification kit FERMENTAS K 0701 and finally sequenced using the ABI PRISM dye cycle sequencing
ready kit (PerkinElmer) and an ABI PRISM377 sequencer according to the manufacturers protocol (USA)
using the forward ITS primer. DNA sequencing and chain terminating inhibitors was achieved as described
by Sanger et al. (1977) [12]. ITS sequence was submitted, deposited and aligned into GenBank to obtain
similarities of the target sequence and the closely related fungi sequences.
The evolutionary distances were computed using the Maximum Composite Likelihood method [13] and
are in the units of the number of base substitutions per site. All positions containing gaps and missing data
were eliminated from the dataset (Complete deletion option). Phylogenetic analyses were conducted in
MEGA5 [14].
2.4. Setting up Plackett-Burman Matrix
The solid-state fermentation medium of the fractional factorial Plackett-Burman design was performed
on the different variables of the solid-state fermentation medium for screening and determination the
important variables for inulinase production. One gram of cold-dried and grind powder of H. tuberosus
tubers was added to 100 ml flask and moistened by 2 ml of basal salt solution various levels of the tested
variables. The SSF media were then autoclaved at 121 °C for 20 min. and inoculated with the different
inoculum rate as illustrated in the design matrix of the tested variables (Table 1).
The effect of each variable was estimated as the difference between both averages of measurements
made at the high level and at the low level. Unless otherwise stated, after 4 days of fermentation at 28 ºC, 10
volumes of distilled water containing 0.25% brej35, as a surfactant, was added to the fermented medium and
the contents were agitated for 30 minutes at 200 rev.min-1
on a rotary shaker at room temperature. Samples
were then; centrifuged at 5000 rev.min-1
for 10 min and the supernatant were used as source of inulinase.
2.5. The Central Composite Design
Interaction between significant fermentation variables affecting inulinase production by Talaromyces
purpureogenus KJ584844 were optimized using the full Central Composite Design (CCD). Two significant
variables (NH4Cl and yeast extract) were assigned based upon Plackett-Burman experiment. The pH of the
basal salt solution (5.8) and the spore concentration (505×103) were adjusted at the center points. The other
medium components were excluded from the fermentation medium. Both of the significant variable (NH4Cl
and yeast extract) were examined at the center point and an axial point located at α = 1.414 from the design
center in each direction on each axis, resulting 5 levels for each variable. The actual and code levels are
shown in Table (2). The observations of the two factors were fitted to the second order polynomial quadratic
model, i.e. 𝑌 = 𝛽0 + ∑𝛽𝑖𝑋𝑖 + ∑𝛽𝑖𝑗𝑋𝑖𝑋𝑗 + 𝛽𝑖𝑖𝑋𝑖2
Where; Ү is the predicted inulinase, β0 model constant, Xi, and Xj independent variables; βi, is linear
coefficients; βij, is cross product coefficients and βii is the quadratic coefficients. After modeling, the
theoretical calculated values of both variables were experimentally validated in triplicate to ensure the
adequacy of the proposed model.
2.6. Assay of Inulinase Activity
The reaction mixture of inulinase activity contained 1 ml of 0.25% (w/v) inulin in 0.2 M sodium acetate
buffer (pH 4.8) plus 100 μl of the enzyme solution. Incubation was performed at 50°C for 20 min. After
incubation, the tubes were kept in a boiling water bath for 10 min to inactivate the enzyme. The control was
also assayed and subtracted for each treatment to ensure that the inactivation of the enzyme in boiling water
did not itself cause any abiotic or thermal hydrolysis of inulin substrate, the total reducing sugars liberated
were measured by the method of Miller (1959) [15]. One inulinase unit was defined as the amount of enzyme
liberating one micromole of fructose equivalent per minute per gram. The amount of reducing sugars was
estimated by comparison with a calibration curves made with fructose.
9
2.7. Fermentation for Bioethanol Production
Considering the optimum conditions from the previous optimization trials, a bulk of fermented sugary
material was prepared, to be biologically converted into bioethanol production by the yeast strain
Saccharomyces cerevisiae RTL543 (kindly provided from the Mycology lab, Department of Botany and
microbiology, Faculty of Science, Damanhur University, Egypt).
The tested sugary material was supplemented with nitrogen and phosphorus as follow; KH2PO4 0.1%,
(NH4)2SO4 0.5%, MgSO4.7H2O 0.05%, and yeast extract 0.1%. The pH of the medium was adjusted to 5.0.
Then, the prepared sugary syrup was putted in the fermentor followed by the yeast inoculum and incubated
at 30 ºC. The appropriate air flow was provided through port that entered through the top of the fermentor
(for about 2h) to allow the yeast to begin growing and reproducing. Samples were extracted from the
fermentor every 1h therefore to measure the changes in temperature, pH and density of the solution. When a
two followed similar results were obtained the fermentation process was stopped. The fermentation broth
was obtained in order to measure the ethanol and remaining sugar concentrations [16].
2.8. Statistical Design and Analysis
The design and statistical analysis of variance (ANOVA) were performed using the statistical
software packages Minitab (version 17, Minitab Inc., U.S.A.) for Plackett-Burman. Whereas,
Design Expert (version 7, State-Ease, U.S.A.) was used to build and analyze the CCD. Runs were
performed in triplicates and the average of data was calculated. All comparisons were carried out at
probability (P) level < 0.05.
3. Results and Discussion
3.1. Identification of the New Inulinolytic Fungus
3.1.1. Morphological identification
On Czapek yeast extract agar at 25 °C and after 7 d the fungal colony diameter is 20–25 mm,
moderately deep, sulcate; margins very narrow (0.5–1 mm); mycelium white and red; floccose in texture;
sporulation moderately dense; conidia green; exudate absent, soluble pigment typically bright red; reverse
coloration dark brown to violet brown.
3.1.2. Molecular identification
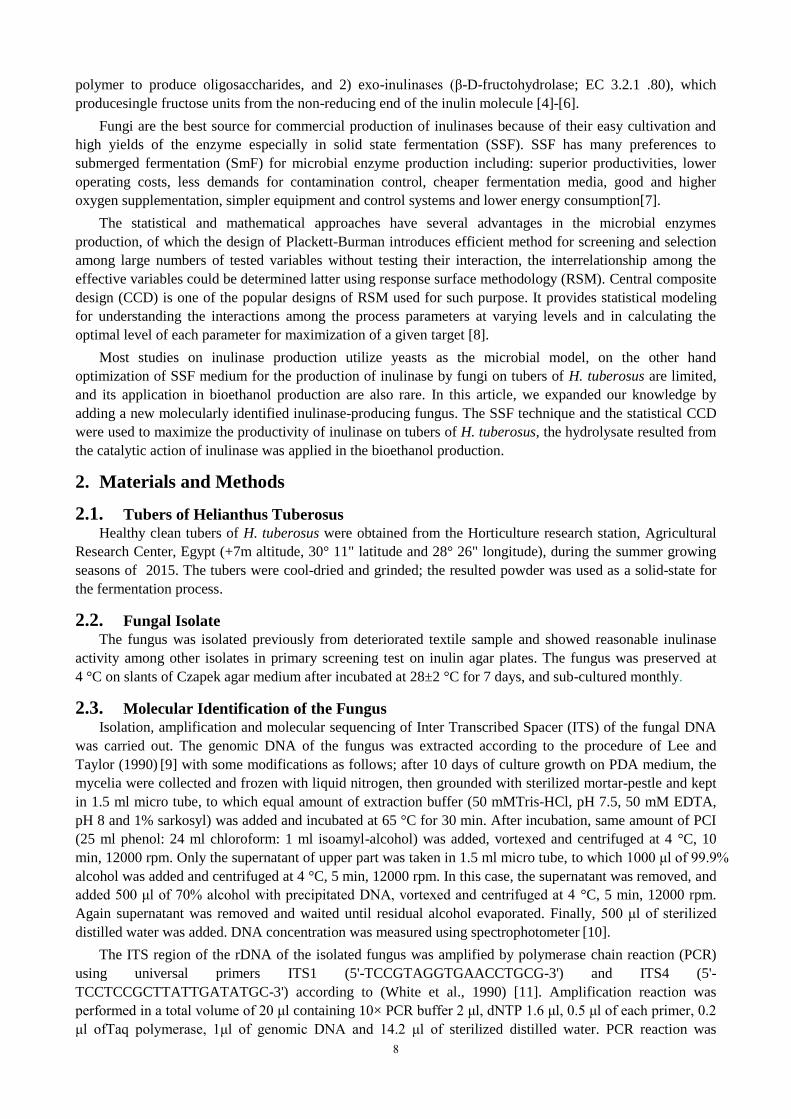
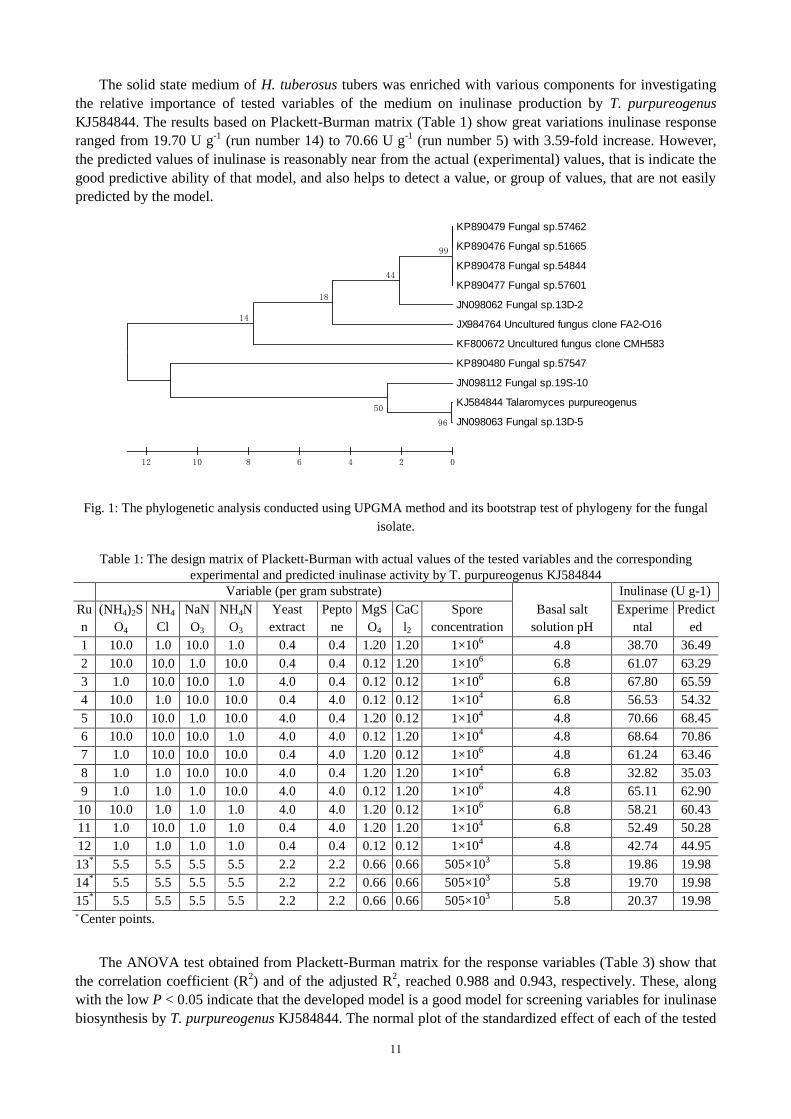
The molecular identification was carried to confirm the identification of the new fungal isolate. The Inter
Transcribed Spacer region of rDNA was amplified using ITS1 and ITS4 regions, amplified product size was
of range 600 bp. ITS sequence was submitted to NCBI GenBank Database under the accession number KJ
584844. The optimal tree with the sum of branch length equal to 53.71865592 is shown (Fig. 1). The
percentage of replicate trees, in which the associated taxa clustered together in the bootstrap test (500
replicates) are shown next to the branches. The tree is drawn to scale, with branch lengths in the same units
as those of the evolutionary distances used to infer the phylogenetic tree. The evolutionary distances were
computed using the Maximum Composite Likelihood method and are in the units of the number of base
substitutions per site. All positions containing gaps and missing data were eliminated from the dataset. Based
on the morphological and molecular identification, the fungal isolate was found to be Talaromyces
purpureogenus with the accession number of KJ584844.
This is the first report on this new source as inulinase producer, and may be added to the family of
inulinase filamentous fungi as other Penicillia and Aspergllia, which recorded the main sources for
commercial production of inulinase, because of their easy cultivation and high yields of the enzyme,
especially under SSF conditions [17]. Selection of SSF as the technique of fermentation, based on many
reports revealed several advantages in comparison to liquid fermentation [18].
3.1.3. Selection of the medium components using Plackett-Burman design
In developing a fermentation process for inulinase production, the optimization of cultivation conditions
and selection of appropriate nutrient additives to H. tuberosus tubers in the most favorable concentrations
representing the backbone of bioconversion process due to their impact on the economic feasibility of the
process.
10
The solid state medium of H. tuberosus tubers was enriched with various components for investigating
the relative importance of tested variables of the medium on inulinase production by T. purpureogenus
KJ584844. The results based on Plackett-Burman matrix (Table 1) show great variations inulinase response
ranged from 19.70 U g-1
(run number 14) to 70.66 U g-1
(run number 5) with 3.59-fold increase. However,
the predicted values of inulinase is reasonably near from the actual (experimental) values, that is indicate the
good predictive ability of that model, and also helps to detect a value, or group of values, that are not easily
predicted by the model.
Fig. 1: The phylogenetic analysis conducted using UPGMA method and its bootstrap test of phylogeny for the fungal
isolate.
Table 1: The design matrix of Plackett-Burman with actual values of the tested variables and the corresponding
experimental and predicted inulinase activity by T. purpureogenus KJ584844
Variable (per gram substrate)
Basal salt
solution pH
Inulinase (U g-1)
Ru
n
(NH4)2S
O4
NH4
Cl
NaN
O3
NH4N
O3
Yeast
extract
Pepto
ne
MgS
O4
CaC
l2
Spore
concentration
Experime
ntal
Predict
ed
1 10.0 1.0 10.0 1.0 0.4 0.4 1.20 1.20 1×10⁶ 4.8 38.70 36.49
2 10.0 10.0 1.0 10.0 0.4 0.4 0.12 1.20 1×10⁶ 6.8 61.07 63.29
3 1.0 10.0 10.0 1.0 4.0 0.4 0.12 0.12 1×10⁶ 6.8 67.80 65.59
4 10.0 1.0 10.0 10.0 0.4 4.0 0.12 0.12 1×10⁴ 6.8 56.53 54.32
5 10.0 10.0 1.0 10.0 4.0 0.4 1.20 0.12 1×10⁴ 4.8 70.66 68.45
6 10.0 10.0 10.0 1.0 4.0 4.0 0.12 1.20 1×10⁴ 4.8 68.64 70.86
7 1.0 10.0 10.0 10.0 0.4 4.0 1.20 0.12 1×10⁶ 4.8 61.24 63.46
8 1.0 1.0 10.0 10.0 4.0 0.4 1.20 1.20 1×10⁴ 6.8 32.82 35.03
9 1.0 1.0 1.0 10.0 4.0 4.0 0.12 1.20 1×10⁶ 4.8 65.11 62.90
10 10.0 1.0 1.0 1.0 4.0 4.0 1.20 0.12 1×10⁶ 6.8 58.21 60.43
11 1.0 10.0 1.0 1.0 0.4 4.0 1.20 1.20 1×10⁴ 6.8 52.49 50.28
12 1.0 1.0 1.0 1.0 0.4 0.4 0.12 0.12 1×10⁴ 4.8 42.74 44.95
13* 5.5 5.5 5.5 5.5 2.2 2.2 0.66 0.66 505×10
3 5.8 19.86 19.98
14* 5.5 5.5 5.5 5.5 2.2 2.2 0.66 0.66 505×10
3 5.8 19.70 19.98
15* 5.5 5.5 5.5 5.5 2.2 2.2 0.66 0.66 505×10
3 5.8 20.37 19.98
* Center points.
The ANOVA test obtained from Plackett-Burman matrix for the response variables (Table 3) show that
the correlation coefficient (R2) and of the adjusted R
2, reached 0.988 and 0.943, respectively. These, along
with the low P < 0.05 indicate that the developed model is a good model for screening variables for inulinase
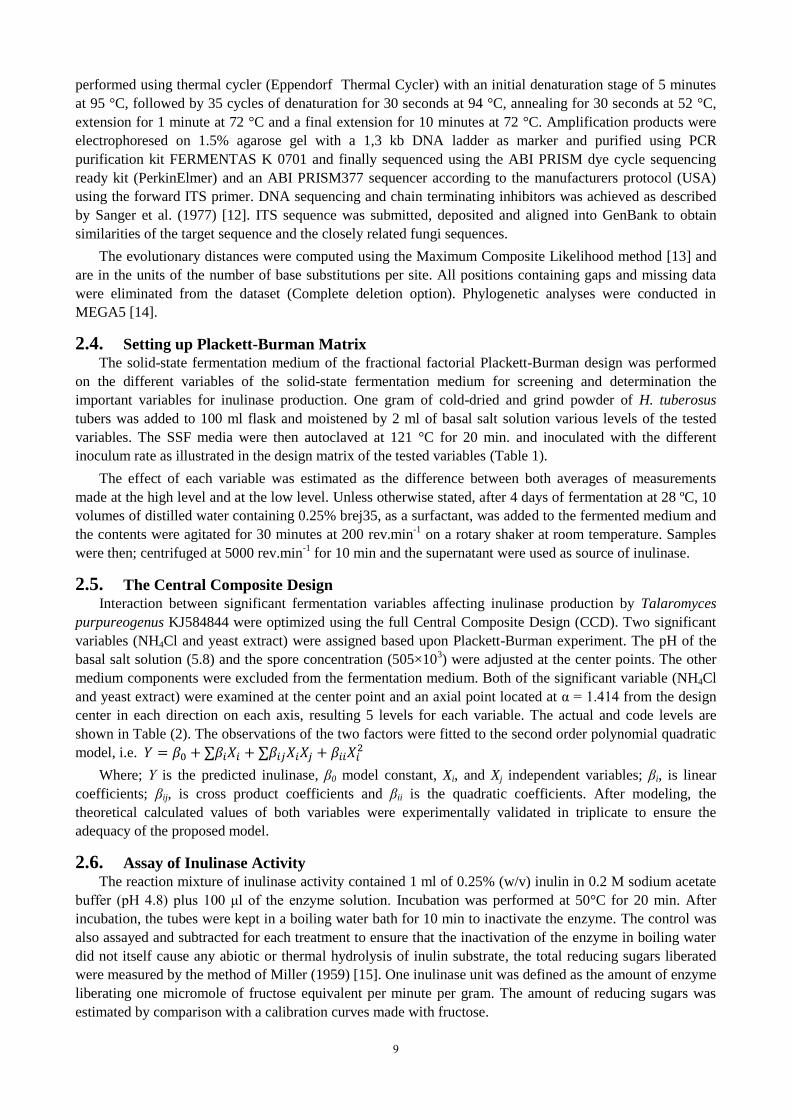
biosynthesis by T. purpureogenus KJ584844. The normal plot of the standardized effect of each of the tested
KP890479 Fungal sp.57462
KP890476 Fungal sp.51665
KP890478 Fungal sp.54844
KP890477 Fungal sp.57601
JN098062 Fungal sp.13D-2
JX984764 Uncultured fungus clone FA2-O16
KF800672 Uncultured fungus clone CMH583
KP890480 Fungal sp.57547
JN098112 Fungal sp.19S-10
KJ584844 Talaromyces purpureogenus
JN098063 Fungal sp.13D-5
99
96
44
50
18
14
024681012
11
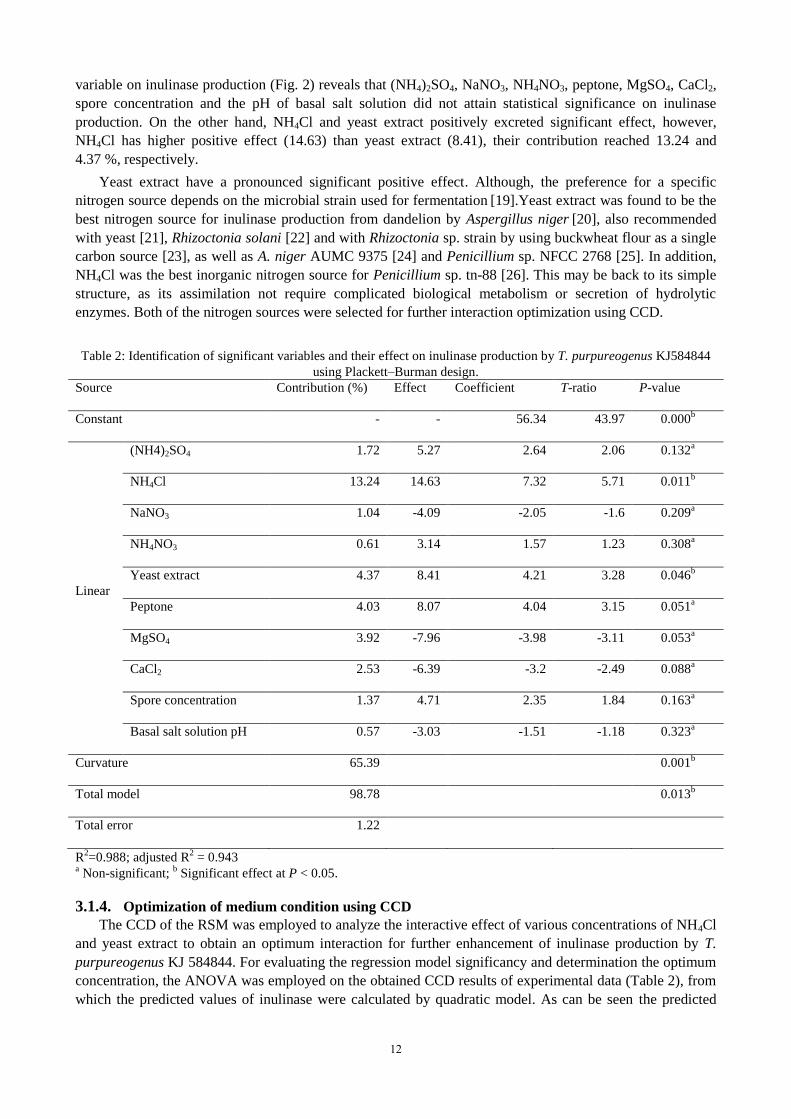
variable on inulinase production (Fig. 2) reveals that (NH4)2SO4, NaNO3, NH4NO3, peptone, MgSO4, CaCl2,
spore concentration and the pH of basal salt solution did not attain statistical significance on inulinase
production. On the other hand, NH4Cl and yeast extract positively excreted significant effect, however,
NH4Cl has higher positive effect (14.63) than yeast extract (8.41), their contribution reached 13.24 and
4.37 %, respectively.
Yeast extract have a pronounced significant positive effect. Although, the preference for a specific
nitrogen source depends on the microbial strain used for fermentation [19].Yeast extract was found to be the
best nitrogen source for inulinase production from dandelion by Aspergillus niger [20], also recommended
with yeast [21], Rhizoctonia solani [22] and with Rhizoctonia sp. strain by using buckwheat flour as a single
carbon source [23], as well as A. niger AUMC 9375 [24] and Penicillium sp. NFCC 2768 [25]. In addition,
NH4Cl was the best inorganic nitrogen source for Penicillium sp. tn-88 [26]. This may be back to its simple
structure, as its assimilation not require complicated biological metabolism or secretion of hydrolytic
enzymes. Both of the nitrogen sources were selected for further interaction optimization using CCD.
Table 2: Identification of significant variables and their effect on inulinase production by T. purpureogenus KJ584844
using Plackett–Burman design.
Source Contribution (%) Effect Coefficient T-ratio P-value
Constant - - 56.34 43.97 0.000b
Linear
(NH4)2SO4 1.72 5.27 2.64 2.06 0.132a
NH4Cl 13.24 14.63 7.32 5.71 0.011b
NaNO3 1.04 -4.09 -2.05 -1.6 0.209a
NH4NO3 0.61 3.14 1.57 1.23 0.308a
Yeast extract 4.37 8.41 4.21 3.28 0.046b
Peptone 4.03 8.07 4.04 3.15 0.051a
MgSO4 3.92 -7.96 -3.98 -3.11 0.053a
CaCl2 2.53 -6.39 -3.2 -2.49 0.088a
Spore concentration 1.37 4.71 2.35 1.84 0.163a
Basal salt solution pH 0.57 -3.03 -1.51 -1.18 0.323a
Curvature 65.39
0.001b
Total model 98.78
0.013b
Total error 1.22
R2=0.988; adjusted R
2 = 0.943
a Non-significant;
b Significant effect at P < 0.05.
3.1.4. Optimization of medium condition using CCD
The CCD of the RSM was employed to analyze the interactive effect of various concentrations of NH4Cl
and yeast extract to obtain an optimum interaction for further enhancement of inulinase production by T.
purpureogenus KJ 584844. For evaluating the regression model significancy and determination the optimum
concentration, the ANOVA was employed on the obtained CCD results of experimental data (Table 2), from
which the predicted values of inulinase were calculated by quadratic model. As can be seen the predicted
12
values of inulinase are very close to their corresponding actual values, representing the accuracy of such
model in the prediction situation.
The ANOVA (Table 4) of the quadratic model shows high F-value of 56.93 and very low (0.0001) P-
value indicating the high significance of the model. Moreover, the mathematical model is very reliable with a
R2, adjusted-R
2 and predicted-R
2 values of 0.976, 0.959 and 0.902, respectively. The closer the various R
2
values to 1, the better is the fit of the model to experimental data. Another indication to the adequacy of the
model is non-significant lack of fit (P-value = 0.447), which is a prerequisite for the fit of the overall model.
The signal to noise ratio was measured by adequate precision (20.53), in which the ratio greater than 4 is
desirable that indicates an adequate signal, so this model can be used to navigate the design space.
Fig. 2: Normal plot of the standardized effect of each of the tested variable on T. purpureogenus KJ584844 inulinase
production
Table 3: Experimental conditions in uncoded and coded variables of the central composite design and the corresponding
actual and predicted inulinase responses secreted by T. purpureogenus KJ584844
Run
Uncoded (mg/g substrate) Coded Inulinase (U g-1
)
NH4Cl Yeast extract NH4Cl Yeast extract Experimental Predicted
1 9 3 -1 -1 100.00 97.18
2 11 3 1 -1 125.53 120.63
3 9 5 -1 1 137.80 138.55
4 11 5 1 1 148.87 147.54
5 8.59 4 -1.414 0 124.47 125.07
6 11.41 4 1.414 0 144.47 148.01
7 10 2.59 0 -1.414 86.67 91.27
8 10 5.41 0 1.414 140.00 139.55
9* 10 4 0 0 161.00 156.24
10* 10 4 0 0 155.53 156.24
11* 10 4 0 0 159.33 156.24
12* 10 4 0 0 149.13 156.24
13* 10 4 0 0 156.20 156.24
* Center points.
Individually, the P-values were also used as a tool to check the significance of the coefficient of each,
term which, in turn are necessary to understand the pattern of mutual interactions between the test variables.
The smaller the magnitude of P, the more significant is the corresponding coefficient. Values of P less than
0.05 indicates model terms to be significant. Among the test individual models used in the study, the
corresponding P-values suggest that the interaction between NH4Cl and yeast extract is the only not
6420-2-4
99
95
90
80
70
60
50
40
30
20
10
5
1
K pH
A (NH4)2SO4
B NH4Cl
C NaNO3
D NH4NO3
E Yeast extract
F Peptone
G MgSO4
H CaCl2
J Spore
Factor Name
Standardized Effect
Pe
rce
nt
Not Signif icant
Signif icant
Effect Type
K
J
H
G
F
E
D
C
B
A
13
significant model, whereas the other models are significant ones. By analysis of the experimental data, the
quadratic model equation in terms of actual factors was as follows;
Inulinase (U/g)
= −1449.38 + 219.56 × NH4Cl + 216.56 × yeast extract − 3.62 × NH4Cl
× yeast extract − 9.85 × (NH4Cl)2 − 20.42 × (yeast extract)2
Table 4: Analysis of variance for response surface model of CCD for inulinase production by T. purpureogenus
KJ584844
Source of variance Sum of squares Degree of freedom Mean square F-value P-value
Model 6174.57 5 1234.91 56.93 <0.0001b
NH4Cl 526.25 1 526.25 24.26 0.0017b
Yeast extract 2331.01 1 2331.01 107.45 <0.0001b
NH4Cl×Yeast extract 52.32 1 52.32 2.41 0.1644a
(NH4Cl)2 674.82 1 674.82 31.11 0.0008
b
(Yeast extract)2 2899.52 1 2899.52 133.66 <0.0001
b
Residual 151.85 7 21.69
Lack of fit 68.62 3 22.87 1.10 0.4465a
Pure error 83.23 4 20.81
Corrected total 6326.42 12
a Indicates non-significant and
b indicates significant at the level 95%; R
2 (coefficient of determination) = 0.976;
adjusted-R2 = 0.959; predicted-R
2 =0.902; CV (coefficient of variation) = 3.39%; adequate precision = 20.53;
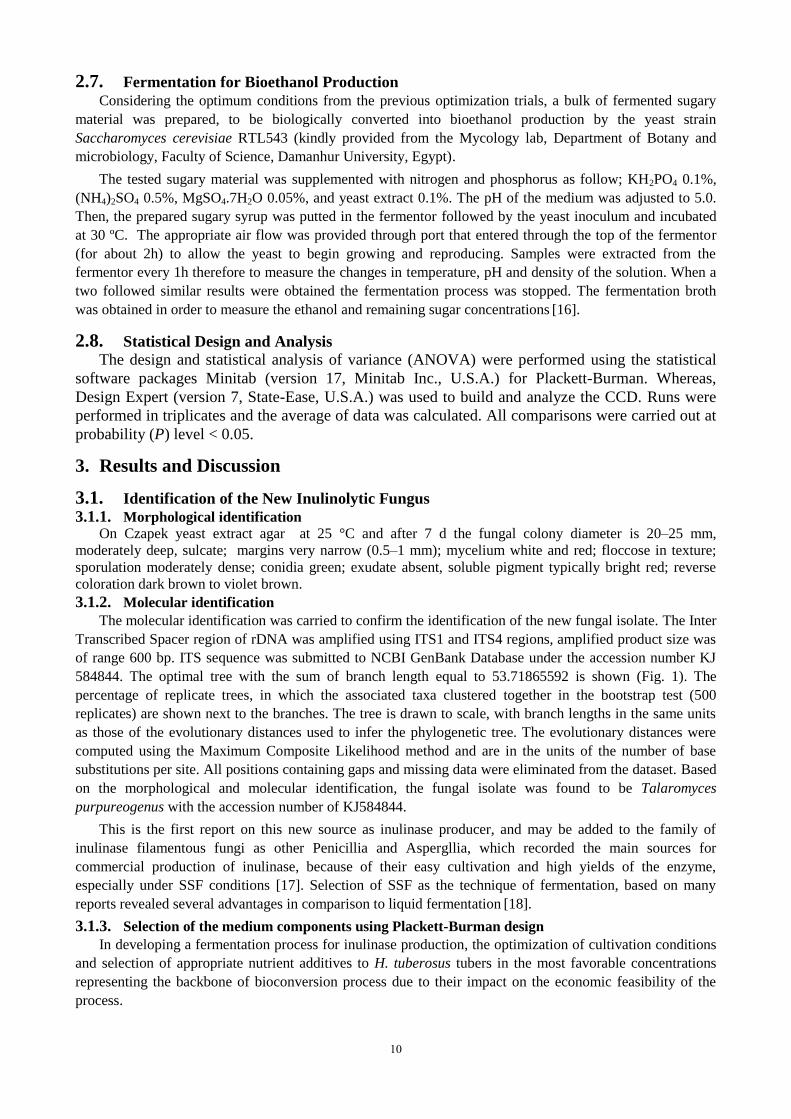
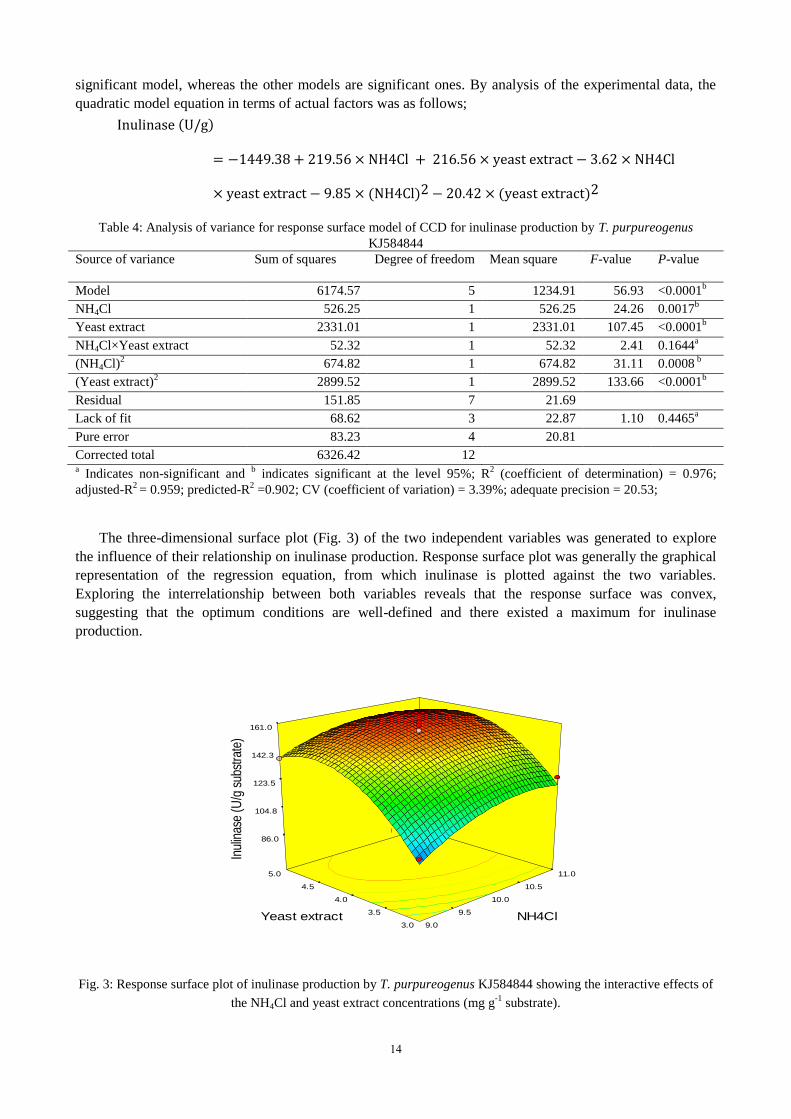
The three-dimensional surface plot (Fig. 3) of the two independent variables was generated to explore
the influence of their relationship on inulinase production. Response surface plot was generally the graphical
representation of the regression equation, from which inulinase is plotted against the two variables.
Exploring the interrelationship between both variables reveals that the response surface was convex,
suggesting that the optimum conditions are well-defined and there existed a maximum for inulinase
production.
Fig. 3: Response surface plot of inulinase production by T. purpureogenus KJ584844 showing the interactive effects of
the NH4Cl and yeast extract concentrations (mg g-1
substrate).
9.0
9.5
10.0
10.5
11.0
3.0
3.5
4.0
4.5
5.0
86.0
104.8
123.5
142.3
161.0
Inu
linas
e (U
/g s
ubst
rate
)
NH4Cl Yeast extract
14
Many of the previous studies used classical optimization methods based on varying one factor at a time
[27], [28]. In the other hand, using statistical optimization, i.e. Plackett-Burman design and central composite
design is shortening the fermentation time and increase the inulinase productivity, our inulinase production
optimization by CCD on T. purpureogenus KJ584844 is another example for the advantages of such
statistical optimization procedures.
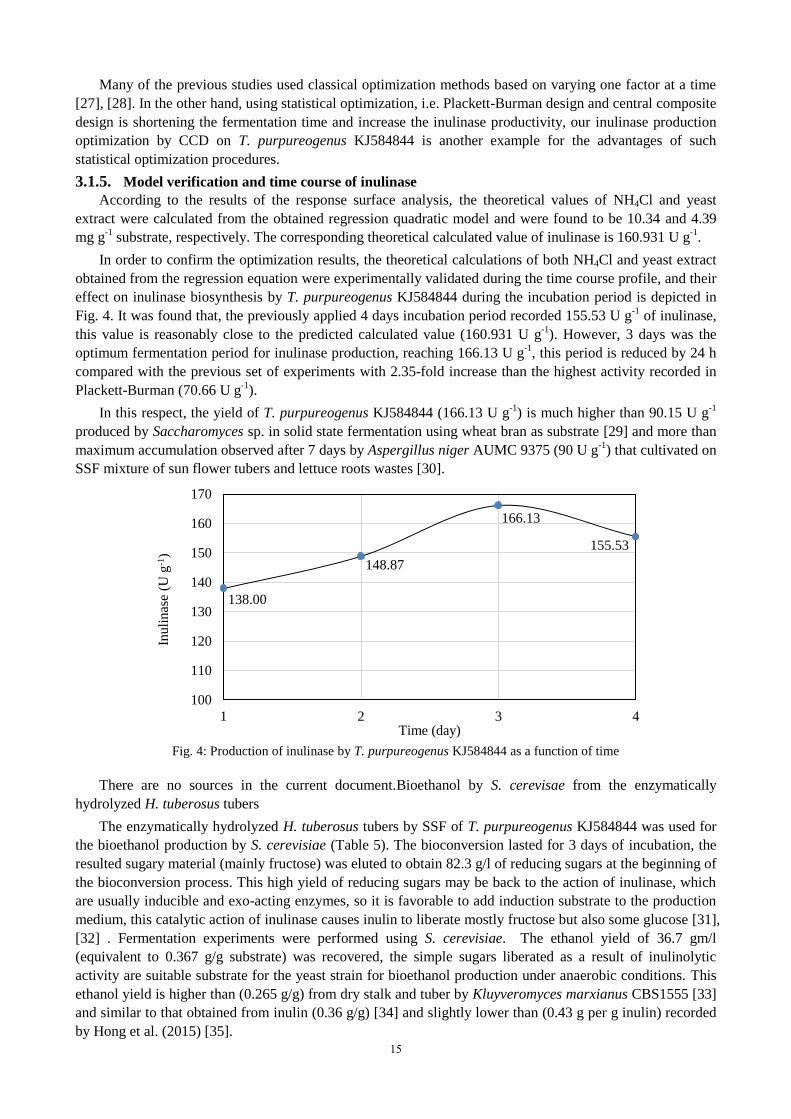
3.1.5. Model verification and time course of inulinase
According to the results of the response surface analysis, the theoretical values of NH4Cl and yeast
extract were calculated from the obtained regression quadratic model and were found to be 10.34 and 4.39
mg g-1
substrate, respectively. The corresponding theoretical calculated value of inulinase is 160.931 U g-1
.
In order to confirm the optimization results, the theoretical calculations of both NH4Cl and yeast extract
obtained from the regression equation were experimentally validated during the time course profile, and their
effect on inulinase biosynthesis by T. purpureogenus KJ584844 during the incubation period is depicted in
Fig. 4. It was found that, the previously applied 4 days incubation period recorded 155.53 U g-1
of inulinase,
this value is reasonably close to the predicted calculated value (160.931 U g-1
). However, 3 days was the
optimum fermentation period for inulinase production, reaching 166.13 U g-1
, this period is reduced by 24 h
compared with the previous set of experiments with 2.35-fold increase than the highest activity recorded in
Plackett-Burman (70.66 U g-1
).
In this respect, the yield of T. purpureogenus KJ584844 (166.13 U g-1
) is much higher than 90.15 U g-1
produced by Saccharomyces sp. in solid state fermentation using wheat bran as substrate [29] and more than
maximum accumulation observed after 7 days by Aspergillus niger AUMC 9375 (90 U g-1
) that cultivated on
SSF mixture of sun flower tubers and lettuce roots wastes [30].
Fig. 4: Production of inulinase by T. purpureogenus KJ584844 as a function of time
There are no sources in the current document.Bioethanol by S. cerevisae from the enzymatically
hydrolyzed H. tuberosus tubers
The enzymatically hydrolyzed H. tuberosus tubers by SSF of T. purpureogenus KJ584844 was used for
the bioethanol production by S. cerevisiae (Table 5). The bioconversion lasted for 3 days of incubation, the
resulted sugary material (mainly fructose) was eluted to obtain 82.3 g/l of reducing sugars at the beginning of
the bioconversion process. This high yield of reducing sugars may be back to the action of inulinase, which
are usually inducible and exo-acting enzymes, so it is favorable to add induction substrate to the production
medium, this catalytic action of inulinase causes inulin to liberate mostly fructose but also some glucose [31],
[32] . Fermentation experiments were performed using S. cerevisiae. The ethanol yield of 36.7 gm/l
(equivalent to 0.367 g/g substrate) was recovered, the simple sugars liberated as a result of inulinolytic
activity are suitable substrate for the yeast strain for bioethanol production under anaerobic conditions. This
ethanol yield is higher than (0.265 g/g) from dry stalk and tuber by Kluyveromyces marxianus CBS1555 [33]
and similar to that obtained from inulin (0.36 g/g) [34] and slightly lower than (0.43 g per g inulin) recorded
by Hong et al. (2015) [35].
138.00
148.87
166.13
155.53
100
110
120
130
140
150
160
170
1 2 3 4
Inuli
nas
e (U
g-1
)
Time (day)
15
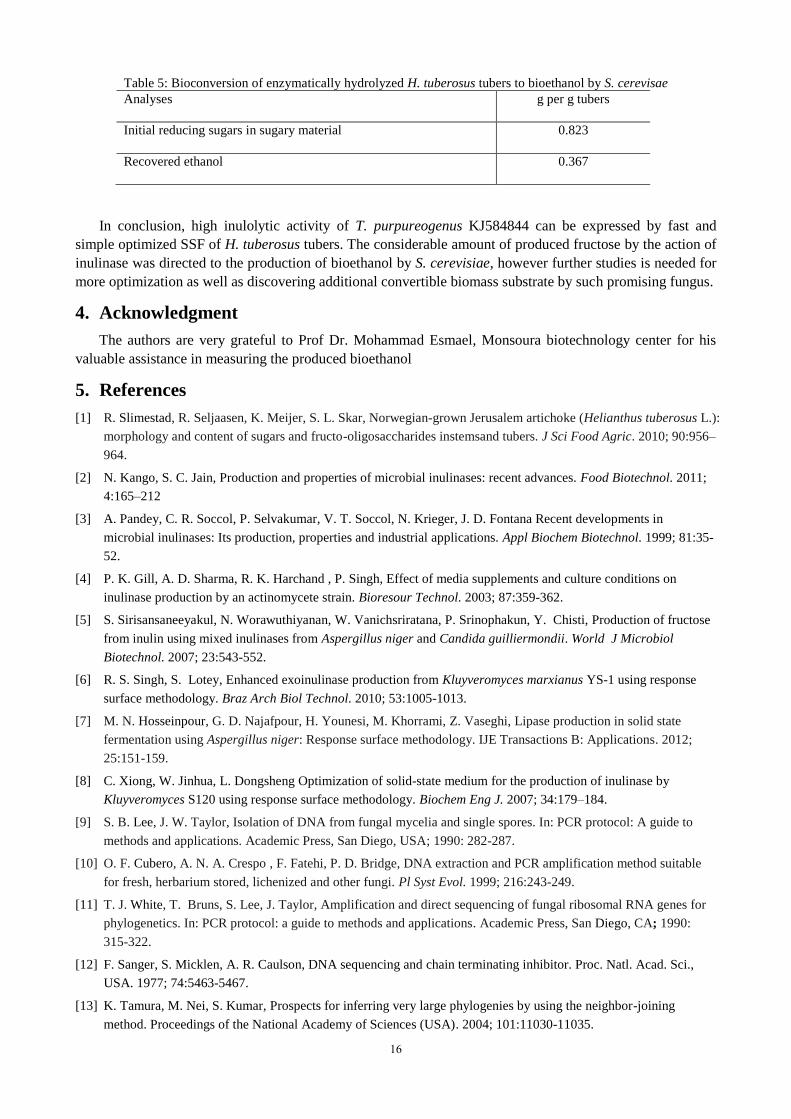
Table 5: Bioconversion of enzymatically hydrolyzed H. tuberosus tubers to bioethanol by S. cerevisae
Analyses g per g tubers
Initial reducing sugars in sugary material 0.823
Recovered ethanol 0.367
In conclusion, high inulolytic activity of T. purpureogenus KJ584844 can be expressed by fast and
simple optimized SSF of H. tuberosus tubers. The considerable amount of produced fructose by the action of
inulinase was directed to the production of bioethanol by S. cerevisiae, however further studies is needed for
more optimization as well as discovering additional convertible biomass substrate by such promising fungus.
4. Acknowledgment
The authors are very grateful to Prof Dr. Mohammad Esmael, Monsoura biotechnology center for his
valuable assistance in measuring the produced bioethanol
5. References
[1] R. Slimestad, R. Seljaasen, K. Meijer, S. L. Skar, Norwegian-grown Jerusalem artichoke (Helianthus tuberosus L.):
morphology and content of sugars and fructo-oligosaccharides instemsand tubers. J Sci Food Agric. 2010; 90:956–
964.
[2] N. Kango, S. C. Jain, Production and properties of microbial inulinases: recent advances. Food Biotechnol. 2011;
4:165–212
[3] A. Pandey, C. R. Soccol, P. Selvakumar, V. T. Soccol, N. Krieger, J. D. Fontana Recent developments in
microbial inulinases: Its production, properties and industrial applications. Appl Biochem Biotechnol. 1999; 81:35-
52.
[4] P. K. Gill, A. D. Sharma, R. K. Harchand , P. Singh, Effect of media supplements and culture conditions on
inulinase production by an actinomycete strain. Bioresour Technol. 2003; 87:359-362.
[5] S. Sirisansaneeyakul, N. Worawuthiyanan, W. Vanichsriratana, P. Srinophakun, Y. Chisti, Production of fructose
from inulin using mixed inulinases from Aspergillus niger and Candida guilliermondii. World J Microbiol
Biotechnol. 2007; 23:543-552.
[6] R. S. Singh, S. Lotey, Enhanced exoinulinase production from Kluyveromyces marxianus YS-1 using response
surface methodology. Braz Arch Biol Technol. 2010; 53:1005-1013.
[7] M. N. Hosseinpour, G. D. Najafpour, H. Younesi, M. Khorrami, Z. Vaseghi, Lipase production in solid state
fermentation using Aspergillus niger: Response surface methodology. IJE Transactions B: Applications. 2012;
25:151-159.
[8] C. Xiong, W. Jinhua, L. Dongsheng Optimization of solid-state medium for the production of inulinase by
Kluyveromyces S120 using response surface methodology. Biochem Eng J. 2007; 34:179–184.
[9] S. B. Lee, J. W. Taylor, Isolation of DNA from fungal mycelia and single spores. In: PCR protocol: A guide to
methods and applications. Academic Press, San Diego, USA; 1990: 282-287.
[10] O. F. Cubero, A. N. A. Crespo , F. Fatehi, P. D. Bridge, DNA extraction and PCR amplification method suitable
for fresh, herbarium stored, lichenized and other fungi. Pl Syst Evol. 1999; 216:243-249.
[11] T. J. White, T. Bruns, S. Lee, J. Taylor, Amplification and direct sequencing of fungal ribosomal RNA genes for
phylogenetics. In: PCR protocol: a guide to methods and applications. Academic Press, San Diego, CA; 1990:
315-322.
[12] F. Sanger, S. Micklen, A. R. Caulson, DNA sequencing and chain terminating inhibitor. Proc. Natl. Acad. Sci.,
USA. 1977; 74:5463-5467.
[13] K. Tamura, M. Nei, S. Kumar, Prospects for inferring very large phylogenies by using the neighbor-joining
method. Proceedings of the National Academy of Sciences (USA). 2004; 101:11030-11035.
16
[14] K. Tamura, J. Dudley, M. Nei, S. Kumar, MEGA4: Molecular Evolutionary Genetics Analysis (MEGA) software
version 4.0. Mol Biol Evol. 2007; 24:1596-1599.
[15] G. L. Miller, Use of dinitrosalicylic acid reagent for determination of reducing sugars. Anal. Chem. 1959; 31:426-
428.
[16] A. U. M. Caputi, T. Brown, Spectrophotometric determination of ethanol in wine. Am J Enol Vitic. 1968; 19:160-
65.
[17] L. M. Gao, Z. M. Chi, J. Sheng, L. Wang, J. Li, F. Gong, Inulinase-producing marine yeasts: evaluation of their
diversity and inulin hydrolysis by their crude enzymes. Microbiol Ecol. 2007; 54:722–729.
[18] A. Pandey, C. R. Soccol, J. A. Rodriguez-Leon, P. Nigam, Solid State Fermentation in Biotechnology:
Fundamentals and Applications. Asia Tech Publishers INC., New Delhi; 2001; 63-80
[19] N. Kaur, A. D. Sharma, Production, optimization and characterization of extracellular invertase by an
actinomycete strain. J Sci Ind Res. 2005; 64:515–519.
[20] N. Kango, Production of inulinase using tap roots of dandelion (Taraxacum officinale) by Aspergillus niger. J
Food Eng. 2008; 85:473–478.
[21] L. Guo, J. Z. F. Hu, D. D. Ryu Bao, J. Consolidated Bioprocessing of Highly Concentrated Jerusalem Artichoke
Tubers for Simultaneous Saccharification and Ethanol Fermentation. Biotechnol Bioeng. 2013; 110:2606–2615.
[22] F. Ertan, T. Aktac, A. C. Kaboglu, F. Ekinci, E. Bakar, Determination of optimum cultivation conditions on the
production of inulinase from Rhizoctonia solanis. Pak J Biol Sci. 2003; 6:1386–1388.
[23] C. N. Bonciu , O. Constantin, G. Bahrim, Increase in extracellular inulinase production for a new Rhizoctonia ssp.
strain by using buckwheat (Fagopyrum esculentum) flour as a single carbon source. Lett Appl Microbiol. 2012;
55:195–201
[24] M. M. Housseiny, Production of an Endoinulinase from Aspergillus niger AUMC 9375 by solid state fermentation
of agricultural wastes, with purification and characterization of the free and mmobilized enzyme. J Microbiol.
2014; 52:389–398.
[25] H. K. Rawat, C. H. Sumat, N. Kango, Production and properties of inulinase from Penicillium sp. NFCC 2768
grown on inulin-rich vegetal infusions. Biocatal Biotransfor. 2015; 33:61–68.
[26] T. Nakamura, A. Shitara, S. Matsuda, T. Matsuo, K. Suikom, Production, purification and properties of
endoinulinase of Penicillium sp.tn-88 that liberates inulotrioses. J Ferment Bioeng. 1997; 84:313–318.
[27] G. S. Nyanhongo, J. Gomes, G. Gübitz , R. Zvauya, J. S. Read, W. Steiner, Production of laccase by a newly
isolated strain of Trametes modesta. Bioresour Technol. 2002; 84:259–263.
[28] S. B. Bankar, M. V. Bule, R. S. Singhal, L. Ananthanarayan, Optimization of Aspergillus niger fermentation for
the production of glucose oxidase. Food Bioprocess Tech. 2009; 2:344–352.
[29] A. A. Onilude, I. F. Fadaunsi, E. O. Garuba, Inulinase production by Saccharomyces sp. in solid state
fermentation using wheat bran as substrate. Ann Microbiol. 2012; 62:843–848.
[30] M. M. Housseiny, Production of an Endoinulinase from Aspergillus niger AUMC 9375 by solid state fermentation
of agricultural wastes, with purification and characterization of the free and mmobilized enzyme. J Microbiol.
2014; 52:389–398.
[31] W. I. A. Saber, N. E. El-Naggar, Optimization of fermentation conditions for the biosynthesis of inulinase by the
new source; Aspergillus tamarii and hydrolysis of some inulin containing agro-wastes. Biotechnology. 2009;
8:425-433.
[32] R. S. Singh, S. Lotey, Enhanced exoinulinase production from Kluyveromyces marxianus YS-1 using response
surface methodology. Braz Arch Biol Technol. 2010; 53:1005-1013.
[33] K. Seonghun, J. M. Park, C. H. Kim, Ethanol Production Using Whole Plant Biomass of Helianthus tuberosus by
Kluyveromyces marxianus CBS1555. Appl Biochem Biotechnol. 2013; 169:1531–1545
[34] S. H. Lim, J. M. Ryu, H. Lee, J. H. Jeon, D. E. Sok, E. S. Choi, Ethanol fermentation from Helianthus tuberosus
powder using Saccharomyces cerevisiae KCCM50549 without pretreatment for inulin hydrolysis. Bioresour
Technol. 2011; 102:2109–2111.
17
[35] S. J. Hong, H. J. Kim, J. W. Kim, D. H. Lee, J. H. Seo, Optimizing promoters and secretory signal sequences for
producing ethanol from inulin by recombinant Saccharomyces cerevisiae carrying Kluyveromyces marxianus
inulinase. Bioprocess Biosyst Eng. 2015; 38:263–272.
18


