Download - Network modularity promotes cooperation
Journal of Theoretical Biology 324 (2013) 103–108
Contents lists available at SciVerse ScienceDirect
Journal of Theoretical Biology
0022-51
http://d
journal homepage: www.elsevier.com/locate/yjtbi
Letter to Editor
Network modularity promotes cooperation
a r t i c l e i n f o
Keywords:
Evolution
Game theory
Social network
93/$ - see front matter & 2012 Elsevier Ltd. A
x.doi.org/10.1016/j.jtbi.2012.12.012
a b s t r a c t
Cooperation in animals and humans is widely observed even if evolutionary biology theories predict
the evolution of selfish individuals. Previous game theory models have shown that cooperation can
evolve when the game takes place in a structured population such as a social network because it limits
interactions between individuals. Modularity, the natural division of a network into groups, is a key
characteristic of all social networks but the influence of this crucial social feature on the evolution of
cooperation has never been investigated. Here, we provide novel pieces of evidence that network
modularity promotes the evolution of cooperation in 2-person prisoner’s dilemma games. By simulat-
ing games on social networks of different structures, we show that modularity shapes interactions
between individuals favouring the evolution of cooperation. Modularity provides a simple mechanism
for the evolution of cooperation without having to invoke complicated mechanisms such as reputation
or punishment, or requiring genetic similarity among individuals. Thus, cooperation can evolve over
wider social contexts than previously reported.
& 2012 Elsevier Ltd. All rights reserved.
1. Introduction
Cooperation in animals and human is widely observed (Hill,2002; Clutton-Brock, 2009; Dufour et al., 2009; Awata et al., 2010)even if evolutionary biology theories predict the evolution ofselfish individuals (Darwin, 1859). The prisoner’s dilemma gamehas been repeatedly used to model cooperation in populations ofselfish individuals (Rapoport and Chammah, 1965; Trivers, 1971;Axelrod and Hamilton, 1981). In the prisoner’s dilemma game,players have a choice between cooperation and defection. Eachplayer receives a pay-off depending on his choice and the choiceof the other player in the game. The highest pay-off for a player isachieved by defecting regardless of the decision of the otherplayer (Rapoport and Chammah, 1965; Trivers, 1971). However,the total pay-off for the two players is the highest when they bothcooperate (Rapoport and Chammah, 1965; Trivers, 1971). As thecost of the cooperative action increases in relation to its benefit,the percentage of cooperators in a population decreases (Hauertand Doebeli, 2004).
Cooperation can evolve in a game context when players do notinteract randomly, i.e. when their population is structured(Nowak and May, 1992; Ohtsuki et al., 2006). While in thetraditional game players are equally likely to meet with otherplayers (Axelrod and Hamilton, 1981), animals and humans livein structured populations in which their associations are notrandom (Underwood, 1981; Pepper et al., 1999; Newman, 2001;Lusseau, 2003; Croft et al., 2004). Computer simulations ofcooperation games on lattices or networks have demonstratedthat cooperation can evolve in structured populations whencooperators interact more frequently with each other than withdefectors, and share the benefits of mutual cooperation (Rapoportand Chammah, 1965; Trivers, 1971). Some games were simulatedon networks in which individuals could interact at different rateswith others by controlling the frequency distribution of the
ll rights reserved.
number of partners individuals had (Wu et al., 2010; Cao et al.,2011).
Modularity is a simple feature of all biological networks thatinfluences heterogeneity in contacts between nodes in a network(Ravasz et al., 2002; Kashtan and Alon, 2005; Whitehead andLusseau, 2012). Modularity describes the separation of networksinto clusters and the degree with which those clusters interact,and can be estimated using a modularity coefficient (Q) rangingfrom 0 to 1 (Appendix A). A Q close to 1 indicates a network witha strong clustered structure in which interactions of individualsbelonging to different clusters do not occur (Newman, 2006).Modularity can emerge without complicated rules of interactions(e.g. network motif, Milo et al., 2002; hierarchical organisation,Barabasi et al., 2003) but simply from network nodes (individualsin our case) living in varying environments. For example, foodavailability or predator presence might affect individual interac-tions (Stanford, 1995; Heithaus and Dill, 2002). In addition,individual’s characteristics such as sex, age, and conditions canshape the way individuals interact with each other (Berman,1982; McPherson et al., 2001; Ruckstuhl, 2007; Marcoux et al.,2010). Modularity is a key characteristic of social networktopology that is not influenced by previously simulated networkfeatures (Reichardt and Bornholdt, 2007; Cao et al., 2011) butplays a key role in enabling the social behaviours of individuals(Sueur et al., 2011; Whitehead and Lusseau, 2012). This measurecaptures a key feature of social networks composed of differentsocial units or communities (Girvan and Newman, 2002; Pallaet al., 2005; Lusseau et al., 2006). Networks with high modularityshould favour the evolution of cooperation (Voelkl and Kasper,2009) because cooperation in animals tends to occur amongindividuals of the same social unit (Clutton-Brock et al., 2001;Awata et al., 2010).
Even though network modularity can provide a measure ofpopulation’s structure, the two concepts are different. Measures of
Letter to Editor / Journal of Theoretical Biology 324 (2013) 103–108104
population structure can be spatial, genetic or social (e.g. Hinde,1976; Weir and Cockerham, 1984; Slatkin, 1987; Bohonak, 1999).In spatial and genetic structure, interactions between individualsare often modelled homogeneously, i.e. individuals interact withall individuals within their group and do not interact withindividuals outside their group, or if they do, the rate of interac-tion is assumed to be equal among all groups (Killingback et al.,2006; Vainstein et al., 2007; Smaldino and Schank, 2012). Whilemodularity might also arise from spatial or genetic structure, itallows us to model population structure more realistically.Modularity is a continuous measure; interactions between indi-viduals vary continuously; individuals do not exclusively interactwith individuals within their group and do not have to interactwith all individuals in their group. In addition, the rate ofinteraction between groups is not the same for all groups(Newman and Girvan, 2004; Newman, 2006). Variation in therates of association between members of a population, measuredby association indices, also create structure in a population(Hinde, 1976; Whitehead, 1995; Bejder et al., 1998). Associationindices can be binary or continuous, and are used to buildsociograms and social networks (Lusseau, 2003; Whitehead,1999; Croft et al., 2011). Different metrics are computed from
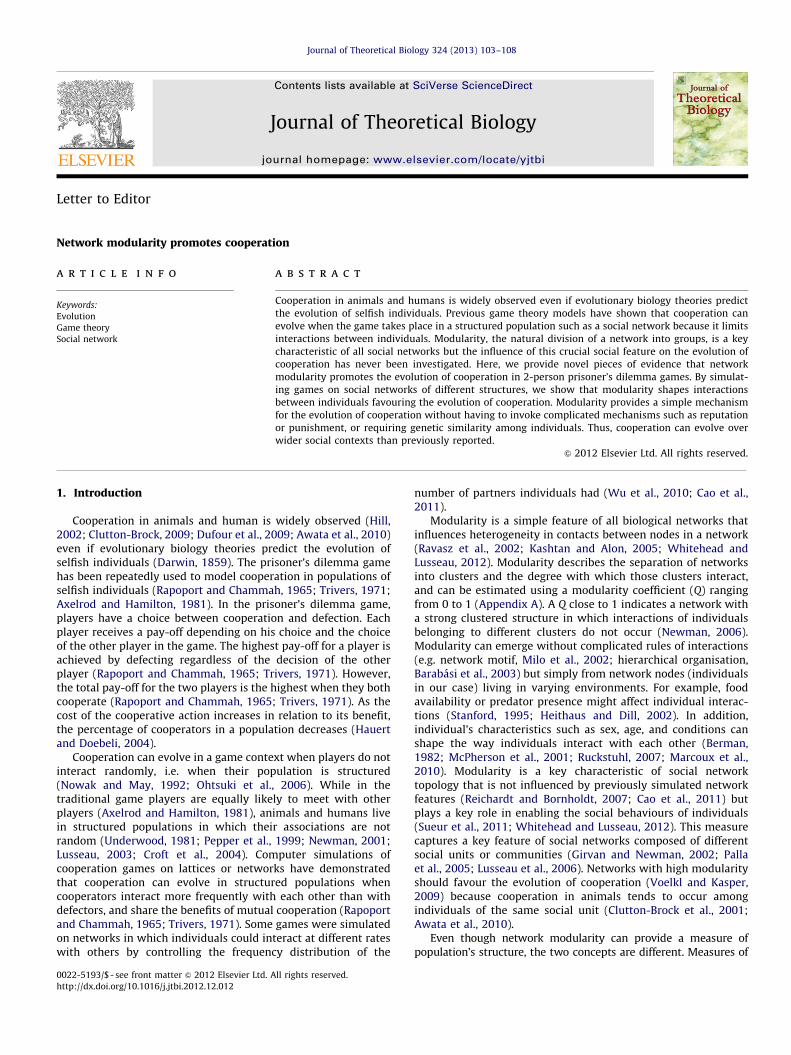
Fig. 1. Examples of weighted networks of 50 players (cooperators are represented by blu
(b) and (d) high modularity of 0.62. Networks (a) and (b) show the initial distribution
cooperators and defectors at the end of 6000 rounds of 2-person prisoner’s dilemma
modularity conditions of (b) and (d) limited interactions between players, which allowe
color in this figure legend, the reader is referred to the web version of this article.)
the association indices to describe the social structure of apopulation (e.g. Whitehead and Dufault, 1999) and modularityis one of them.
2. Material and methods
Given the importance of modularity in social networks, weexplored how it influences the evolution of cooperation in the2-person prisoner’s dilemma game. We simulated games onweighted networks with varying modularity (Whitehead andLusseau, 2012) in which vertices represented players and edgesrepresented the associations between them (Fig. 1). For mostanalyses, network size was set to 100 players but the sensitivityof outcomes to network sizes was also evaluated by simulatinggames on network of size ranging from 20 to 500 (for details, seeAppendix A). In addition, the effects of cluster size (from 2 to 33)and cost-to-benefit ratios (from 0.1 to 0.9) were examined(Appendix A). Games started with an equal number of coopera-tors and defectors, randomly located in the network. A playerentered a game with all its neighbours that had an associationhigher than a threshold value set at the beginning of each
e circles and defectors by red squares) with (a) and (c) low modularity of 0.12; and
of cooperators and defectors in the networks; (c) and (d) show the distribution of
games played with a threshold of 0.4 and a cost-to-benefit ratio of 0.2. The high
d for the evolution clusters of cooperators. (For interpretation of the references to
Letter to Editor / Journal of Theoretical Biology 324 (2013) 103–108 105
simulation. We used threshold values ranging from 0.1 to 0.9(Appendix A) to make our simulations comparable with pre-viously published studies in which the association betweenindividuals was binary (not weighted: Ohtsuki et al., 2006;Nowak et al., 2010; Allen et al., 2012). The evolutionary dynamicsfollowed the ’’death–birth’’ update rule (Ohtsuki et al., 2006). Weran each simulation for 6000 rounds because this number ofrounds was sufficient to reach equilibrium (Appendix B). Thepercentage of cooperators was averaged for the last 1000 simula-tions. Results shown represent the average of 100 repetitions forall different parameter combinations (for more details about themethods, see Appendix A).
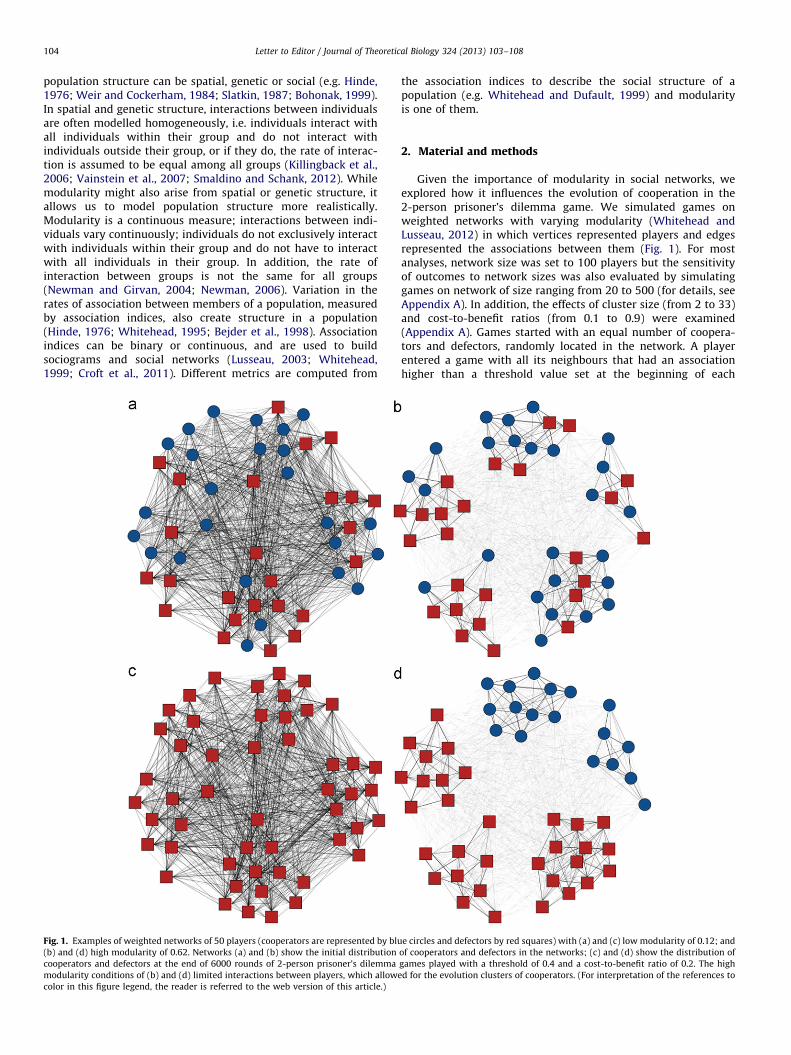
Fig. 3. Maximum cost-to-benefit ratio for cooperation to exist at the end of
2-person prisoner’s dilemma games with networks of varying modularity and
cluster sizes. For any particular cluster size, increased modularity allowed
cooperation to evolve at higher cost-to-benefit ratios. Note that it was not possible
to create networks of high modularity for large cluster sizes.
3. Results
Cooperation evolved in networks with high modularitybecause clusters of cooperators could emerge in such networks.The percentage of cooperators becoming fixed in the populationafter the iterative games increased with modularity (Fig. 2).Cooperation could not evolve for modularity values close to zeroexcept for high threshold values (Fig. 2). Increasing the thresholdvalue above which two players enter in a game increased thefrequency of cooperators (Fig. 2). Modularity did not affect thepercentage of cooperators for modularity values above 0.4 (Fig. 2).
The cost-to-benefit ratio (c/b) of the pay-off associated with agame is also crucial for the evolution of cooperation since a highcost of cooperation relative to benefit inhibits cooperation(Hauert and Doebeli, 2004). In our simulation, cooperation couldevolve in games with high cost-to-benefit ratio by increasing thesocial network modularity (Fig. 3). For an equal cluster size, anincrease in modularity, especially from 0 to 0.2, allowed for theevolution of cooperation with higher cost relative to benefit. Thus,modularity relaxed the condition under which cooperation couldevolve.
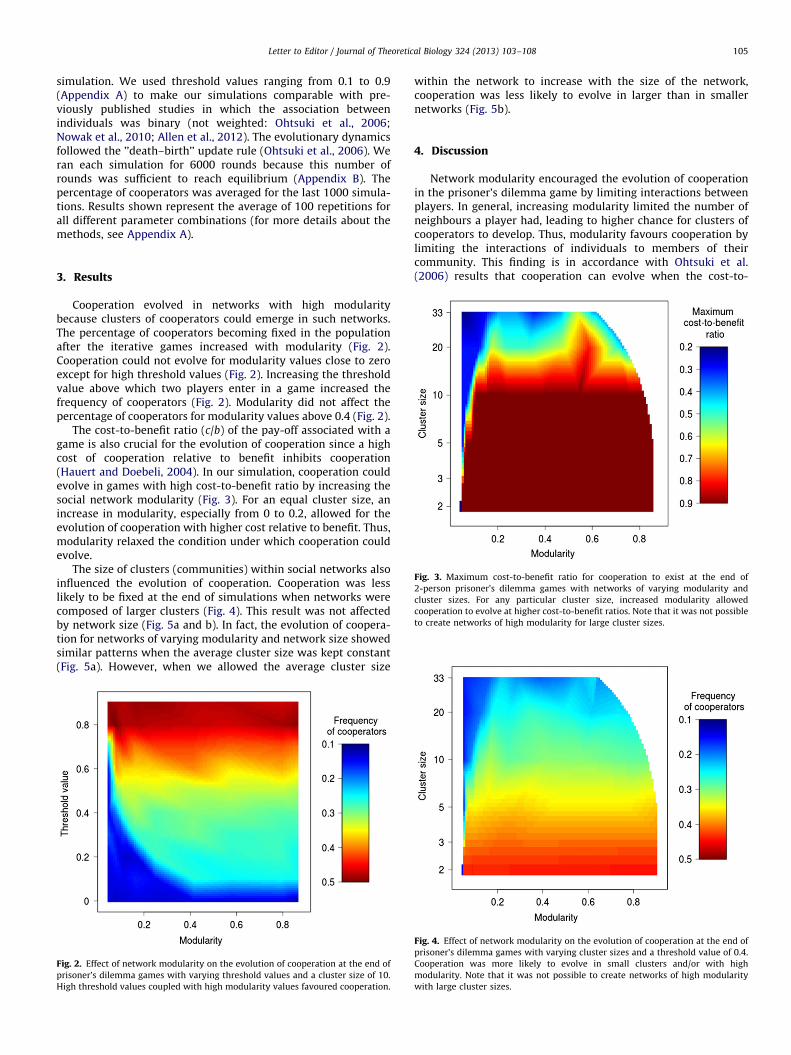
The size of clusters (communities) within social networks alsoinfluenced the evolution of cooperation. Cooperation was lesslikely to be fixed at the end of simulations when networks werecomposed of larger clusters (Fig. 4). This result was not affectedby network size (Fig. 5a and b). In fact, the evolution of coopera-tion for networks of varying modularity and network size showedsimilar patterns when the average cluster size was kept constant(Fig. 5a). However, when we allowed the average cluster size
Fig. 2. Effect of network modularity on the evolution of cooperation at the end of
prisoner’s dilemma games with varying threshold values and a cluster size of 10.
High threshold values coupled with high modularity values favoured cooperation.
within the network to increase with the size of the network,cooperation was less likely to evolve in larger than in smallernetworks (Fig. 5b).
4. Discussion
Network modularity encouraged the evolution of cooperationin the prisoner’s dilemma game by limiting interactions betweenplayers. In general, increasing modularity limited the number ofneighbours a player had, leading to higher chance for clusters ofcooperators to develop. Thus, modularity favours cooperation bylimiting the interactions of individuals to members of theircommunity. This finding is in accordance with Ohtsuki et al.(2006) results that cooperation can evolve when the cost-to-
Fig. 4. Effect of network modularity on the evolution of cooperation at the end of
prisoner’s dilemma games with varying cluster sizes and a threshold value of 0.4.
Cooperation was more likely to evolve in small clusters and/or with high
modularity. Note that it was not possible to create networks of high modularity
with large cluster sizes.
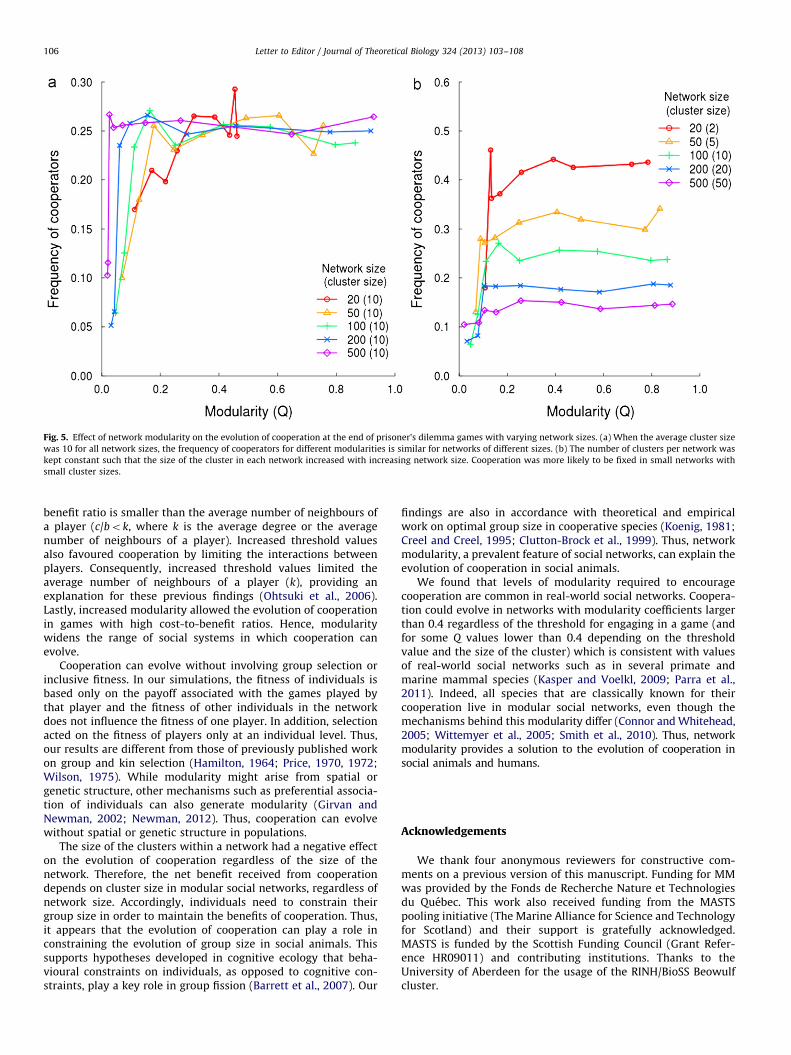
Fig. 5. Effect of network modularity on the evolution of cooperation at the end of prisoner’s dilemma games with varying network sizes. (a) When the average cluster size
was 10 for all network sizes, the frequency of cooperators for different modularities is similar for networks of different sizes. (b) The number of clusters per network was
kept constant such that the size of the cluster in each network increased with increasing network size. Cooperation was more likely to be fixed in small networks with
small cluster sizes.
Letter to Editor / Journal of Theoretical Biology 324 (2013) 103–108106
benefit ratio is smaller than the average number of neighbours ofa player (c/bok, where k is the average degree or the averagenumber of neighbours of a player). Increased threshold valuesalso favoured cooperation by limiting the interactions betweenplayers. Consequently, increased threshold values limited theaverage number of neighbours of a player (k), providing anexplanation for these previous findings (Ohtsuki et al., 2006).Lastly, increased modularity allowed the evolution of cooperationin games with high cost-to-benefit ratios. Hence, modularitywidens the range of social systems in which cooperation canevolve.
Cooperation can evolve without involving group selection orinclusive fitness. In our simulations, the fitness of individuals isbased only on the payoff associated with the games played bythat player and the fitness of other individuals in the networkdoes not influence the fitness of one player. In addition, selectionacted on the fitness of players only at an individual level. Thus,our results are different from those of previously published workon group and kin selection (Hamilton, 1964; Price, 1970, 1972;Wilson, 1975). While modularity might arise from spatial orgenetic structure, other mechanisms such as preferential associa-tion of individuals can also generate modularity (Girvan andNewman, 2002; Newman, 2012). Thus, cooperation can evolvewithout spatial or genetic structure in populations.
The size of the clusters within a network had a negative effecton the evolution of cooperation regardless of the size of thenetwork. Therefore, the net benefit received from cooperationdepends on cluster size in modular social networks, regardless ofnetwork size. Accordingly, individuals need to constrain theirgroup size in order to maintain the benefits of cooperation. Thus,it appears that the evolution of cooperation can play a role inconstraining the evolution of group size in social animals. Thissupports hypotheses developed in cognitive ecology that beha-vioural constraints on individuals, as opposed to cognitive con-straints, play a key role in group fission (Barrett et al., 2007). Our
findings are also in accordance with theoretical and empiricalwork on optimal group size in cooperative species (Koenig, 1981;Creel and Creel, 1995; Clutton-Brock et al., 1999). Thus, networkmodularity, a prevalent feature of social networks, can explain theevolution of cooperation in social animals.
We found that levels of modularity required to encouragecooperation are common in real-world social networks. Coopera-tion could evolve in networks with modularity coefficients largerthan 0.4 regardless of the threshold for engaging in a game (andfor some Q values lower than 0.4 depending on the thresholdvalue and the size of the cluster) which is consistent with valuesof real-world social networks such as in several primate andmarine mammal species (Kasper and Voelkl, 2009; Parra et al.,2011). Indeed, all species that are classically known for theircooperation live in modular social networks, even though themechanisms behind this modularity differ (Connor and Whitehead,2005; Wittemyer et al., 2005; Smith et al., 2010). Thus, networkmodularity provides a solution to the evolution of cooperation insocial animals and humans.
Acknowledgements
We thank four anonymous reviewers for constructive com-ments on a previous version of this manuscript. Funding for MMwas provided by the Fonds de Recherche Nature et Technologiesdu Quebec. This work also received funding from the MASTSpooling initiative (The Marine Alliance for Science and Technologyfor Scotland) and their support is gratefully acknowledged.MASTS is funded by the Scottish Funding Council (Grant Refer-ence HR09011) and contributing institutions. Thanks to theUniversity of Aberdeen for the usage of the RINH/BioSS Beowulfcluster.
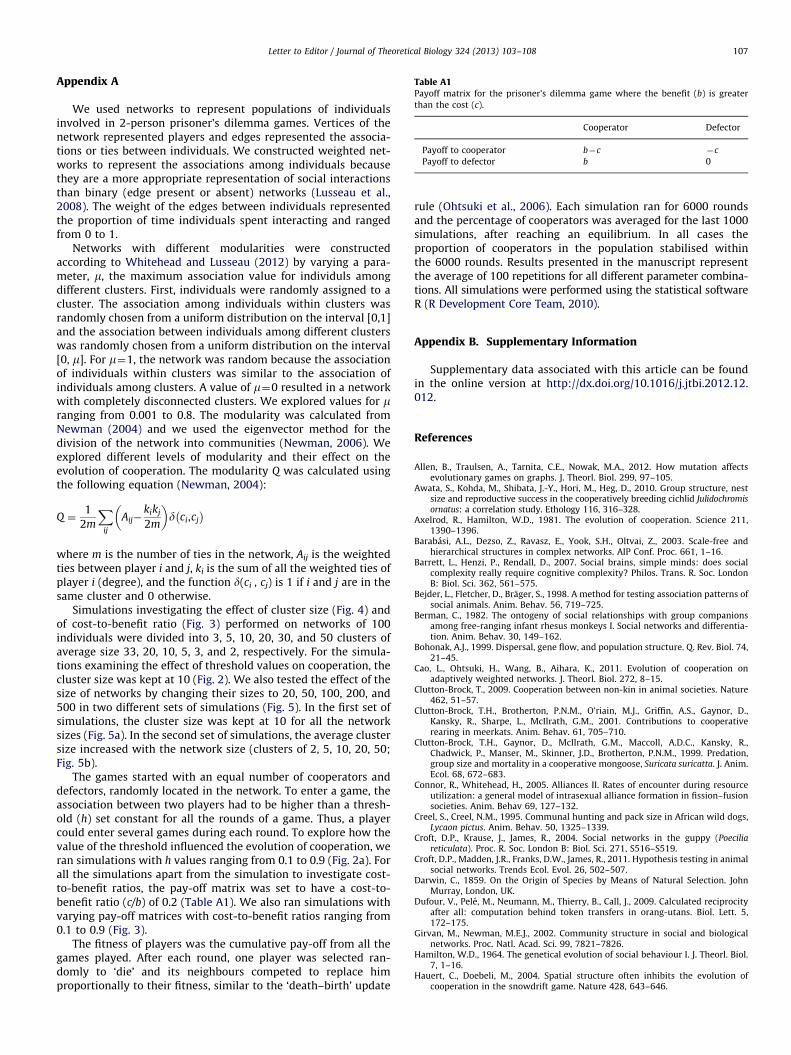
Table A1Payoff matrix for the prisoner’s dilemma game where the benefit (b) is greater
than the cost (c).
Cooperator Defector
Payoff to cooperator b�c �c
Payoff to defector b 0
Letter to Editor / Journal of Theoretical Biology 324 (2013) 103–108 107
Appendix A
We used networks to represent populations of individualsinvolved in 2-person prisoner’s dilemma games. Vertices of thenetwork represented players and edges represented the associa-tions or ties between individuals. We constructed weighted net-works to represent the associations among individuals becausethey are a more appropriate representation of social interactionsthan binary (edge present or absent) networks (Lusseau et al.,2008). The weight of the edges between individuals representedthe proportion of time individuals spent interacting and rangedfrom 0 to 1.
Networks with different modularities were constructedaccording to Whitehead and Lusseau (2012) by varying a para-meter, m, the maximum association value for individuls amongdifferent clusters. First, individuals were randomly assigned to acluster. The association among individuals within clusters wasrandomly chosen from a uniform distribution on the interval [0,1]and the association between individuals among different clusterswas randomly chosen from a uniform distribution on the interval[0, m]. For m¼1, the network was random because the associationof individuals within clusters was similar to the association ofindividuals among clusters. A value of m¼0 resulted in a networkwith completely disconnected clusters. We explored values for mranging from 0.001 to 0.8. The modularity was calculated fromNewman (2004) and we used the eigenvector method for thedivision of the network into communities (Newman, 2006). Weexplored different levels of modularity and their effect on theevolution of cooperation. The modularity Q was calculated usingthe following equation (Newman, 2004):
Q ¼1
2m
Xij
Aij�kikj
2m
� �d ci,cj
� �
where m is the number of ties in the network, Aij is the weightedties between player i and j, ki is the sum of all the weighted ties ofplayer i (degree), and the function d(ci , cj) is 1 if i and j are in thesame cluster and 0 otherwise.
Simulations investigating the effect of cluster size (Fig. 4) andof cost-to-benefit ratio (Fig. 3) performed on networks of 100individuals were divided into 3, 5, 10, 20, 30, and 50 clusters ofaverage size 33, 20, 10, 5, 3, and 2, respectively. For the simula-tions examining the effect of threshold values on cooperation, thecluster size was kept at 10 (Fig. 2). We also tested the effect of thesize of networks by changing their sizes to 20, 50, 100, 200, and500 in two different sets of simulations (Fig. 5). In the first set ofsimulations, the cluster size was kept at 10 for all the networksizes (Fig. 5a). In the second set of simulations, the average clustersize increased with the network size (clusters of 2, 5, 10, 20, 50;Fig. 5b).
The games started with an equal number of cooperators anddefectors, randomly located in the network. To enter a game, theassociation between two players had to be higher than a thresh-old (h) set constant for all the rounds of a game. Thus, a playercould enter several games during each round. To explore how thevalue of the threshold influenced the evolution of cooperation, weran simulations with h values ranging from 0.1 to 0.9 (Fig. 2a). Forall the simulations apart from the simulation to investigate cost-to-benefit ratios, the pay-off matrix was set to have a cost-to-benefit ratio (c/b) of 0.2 (Table A1). We also ran simulations withvarying pay-off matrices with cost-to-benefit ratios ranging from0.1 to 0.9 (Fig. 3).
The fitness of players was the cumulative pay-off from all thegames played. After each round, one player was selected ran-domly to ‘die’ and its neighbours competed to replace himproportionally to their fitness, similar to the ‘death–birth’ update
rule (Ohtsuki et al., 2006). Each simulation ran for 6000 roundsand the percentage of cooperators was averaged for the last 1000simulations, after reaching an equilibrium. In all cases theproportion of cooperators in the population stabilised withinthe 6000 rounds. Results presented in the manuscript representthe average of 100 repetitions for all different parameter combina-tions. All simulations were performed using the statistical softwareR (R Development Core Team, 2010).
Appendix B. Supplementary Information
Supplementary data associated with this article can be foundin the online version at http://dx.doi.org/10.1016/j.jtbi.2012.12.012.
References
Allen, B., Traulsen, A., Tarnita, C.E., Nowak, M.A., 2012. How mutation affectsevolutionary games on graphs. J. Theorl. Biol. 299, 97–105.
Awata, S., Kohda, M., Shibata, J.-Y., Hori, M., Heg, D., 2010. Group structure, nestsize and reproductive success in the cooperatively breeding cichlid Julidochromisornatus: a correlation study. Ethology 116, 316–328.
Axelrod, R., Hamilton, W.D., 1981. The evolution of cooperation. Science 211,1390–1396.
Barabasi, A.L., Dezso, Z., Ravasz, E., Yook, S.H., Oltvai, Z., 2003. Scale-free andhierarchical structures in complex networks. AIP Conf. Proc. 661, 1–16.
Barrett, L., Henzi, P., Rendall, D., 2007. Social brains, simple minds: does socialcomplexity really require cognitive complexity? Philos. Trans. R. Soc. LondonB: Biol. Sci. 362, 561–575.
Bejder, L., Fletcher, D., Brager, S., 1998. A method for testing association patterns ofsocial animals. Anim. Behav. 56, 719–725.
Berman, C., 1982. The ontogeny of social relationships with group companionsamong free-ranging infant rhesus monkeys I. Social networks and differentia-tion. Anim. Behav. 30, 149–162.
Bohonak, A.J., 1999. Dispersal, gene flow, and population structure. Q. Rev. Biol. 74,21–45.
Cao, L., Ohtsuki, H., Wang, B., Aihara, K., 2011. Evolution of cooperation onadaptively weighted networks. J. Theorl. Biol. 272, 8–15.
Clutton-Brock, T., 2009. Cooperation between non-kin in animal societies. Nature462, 51–57.
Clutton-Brock, T.H., Brotherton, P.N.M., O’riain, M.J., Griffin, A.S., Gaynor, D.,Kansky, R., Sharpe, L., McIlrath, G.M., 2001. Contributions to cooperativerearing in meerkats. Anim. Behav. 61, 705–710.
Clutton-Brock, T.H., Gaynor, D., McIlrath, G.M., Maccoll, A.D.C., Kansky, R.,Chadwick, P., Manser, M., Skinner, J.D., Brotherton, P.N.M., 1999. Predation,group size and mortality in a cooperative mongoose, Suricata suricatta. J. Anim.Ecol. 68, 672–683.
Connor, R., Whitehead, H., 2005. Alliances II. Rates of encounter during resourceutilization: a general model of intrasexual alliance formation in fission–fusionsocieties. Anim. Behav 69, 127–132.
Creel, S., Creel, N.M., 1995. Communal hunting and pack size in African wild dogs,Lycaon pictus. Anim. Behav. 50, 1325–1339.
Croft, D.P., Krause, J., James, R., 2004. Social networks in the guppy (Poeciliareticulata). Proc. R. Soc. London B: Biol. Sci. 271, S516–S519.
Croft, D.P., Madden, J.R., Franks, D.W., James, R., 2011. Hypothesis testing in animalsocial networks. Trends Ecol. Evol. 26, 502–507.
Darwin, C., 1859. On the Origin of Species by Means of Natural Selection. JohnMurray, London, UK.
Dufour, V., Pele, M., Neumann, M., Thierry, B., Call, J., 2009. Calculated reciprocityafter all: computation behind token transfers in orang-utans. Biol. Lett. 5,172–175.
Girvan, M., Newman, M.E.J., 2002. Community structure in social and biologicalnetworks. Proc. Natl. Acad. Sci. 99, 7821–7826.
Hamilton, W.D., 1964. The genetical evolution of social behaviour I. J. Theorl. Biol.7, 1–16.
Hauert, C., Doebeli, M., 2004. Spatial structure often inhibits the evolution ofcooperation in the snowdrift game. Nature 428, 643–646.
Letter to Editor / Journal of Theoretical Biology 324 (2013) 103–108108
Heithaus, M.R., Dill, L.M., 2002. Food availability and tiger shark predation riskinfluence bottlenose dolphin habitat use. Ecology 83, 480–491.
Hill, K., 2002. Altruistic cooperation during foraging by the Ache, and the evolvedhuman predisposition to cooperate. Hum. Nat. 13, 105–128.
Hinde, R.A., 1976. Interactions, relationships and social structure. Man 11, 1–17.Kashtan, N., Alon, U., 2005. Spontaneous evolution of modularity and network
motifs. Proc. Natl. Acad. Sci. 102, 13773–13778.Kasper, C., Voelkl, B., 2009. A social network analysis of primate groups. Primates
50, 343–356.Killingback, T., Bieri, J., Flatt, T., 2006. Evolution in group-structured populations
can resolve the tragedy of the commons. Proc. R. Soc. B 273, 1477–1481.Koenig, W., 1981. Reproductive success, group size, and the evolution of coopera-
tive breeding in the acorn woodpecker. Am. Nat. 117, 421–443.Lusseau, D., 2003. The emergent properties of a dolphin social network. Proc. R.
Soc. London B 270, S186–S188.Lusseau, D., Wilson, B., Hammond, P.S., Grellier, K., Durban, J.W., Parsons, K.M.,
Barton, T.R., Thompson, P.M., 2006. Quantifying the influence of sociality onpopulation structure in bottlenose dolphins. J. Anim. Ecol. 75, 14–24.
Lusseau, D., Whitehead, H., Gero, S., 2008. Incorporating uncertainty into the studyof animal social networks. Anim. Behav. 75, 1809–1815.
Marcoux, M., Larocque, G., Auger-Methe, M., Dutilleul, P., Humphries, M.M., 2010.Statistical analysis of animal observations and associated marks distributed intime using Ripley’s functions. Anim. Behav. 80, 329–337.
McPherson, M., Smith-Lovin, L., Cook, J.M., 2001. Birds of a feather: homophily insocial networks. Annu. Rev. Sociol. 27, 415–444.
Milo, R., Shen-Orr, S., Itzkovitz, S., Kashtan, N., Chklovskii, D., Alon, U., 2002.Network motifs: simple building blocks of complex networks. Science 298,824–827.
Newman, M., Girvan, M., 2004. Finding and evaluating community structure innetworks. Phys. Rev. E, 69.
Newman, M.E.J., 2004. Analysis of weighted networks. Phys. Rev. E 70, 056131.Newman, M.E.J., 2001. The structure of scientific collaboration networks. Proc.
Natl. Acad. Sci. 98, 404–409.Newman, M.E.J., 2006. Modularity and community structure in networks. Proc.
Natl. Acad. Sci. 103, 8577–8582.Newman, M.E.J., 2012. Communities, modules and large-scale structure in networks.
Nat. Phys. 8, 25–31.Nowak, M.A., May, R.M., 1992. Evolutionary games and spatial chaos. Nature 359,
826–829.Nowak, M.A., Tarnita, C.E., Antal, T., 2010. Evolutionary dynamics in structured
populations. Philos. Trans. R. Soc. London B: Biol. Sci. 365, 19–30.Ohtsuki, H., Hauert, C., Lieberman, E., Nowak, M.A., 2006. A simple rule for the
evolution of cooperation on graphs and social networks. Nature 441, 502–505.Palla, G., Derenyi, I., Farkas, I., Vicsek, T., 2005. Uncovering the overlapping
community structure of complex networks in nature and society. Nature435, 814–818.
Parra, G.J., Corkeron, P.J., Arnold, P., 2011. Grouping and fission–fusion dynamics inAustralian snubfin and Indo-Pacific humpback dolphins. Anim. Behav. 82,1423–1433.
Pepper, J.W., Mitani, J.C., Watts, D.P., 1999. General gregariousness and specificsocial preferences among wild chimpanzees. Int. J. Primatol. 20, 613–632.
Price, G.R., 1970. Selection and covariance. Nature 227, 520–521.Price, G.R., 1972. Extension of covariance selection mathematics. Ann. Hum. Genet.
35, 485–490.R. Development Core Team, 2010. R: A Language and Environment for Statistical
Computing.Rapoport, A., Chammah, A.M., 1965. Prisoner’s Dilemma. The University of
Michigan Press, Ann Arbor.
Ravasz, E., Somera, A.L., Mongru, D.A., Oltvai, Z.N., Barabasi, A.-L., 2002. Hierarch-ical organisation of modularity in metabolic networks. Science 297,1551–1555.
Reichardt, J., Bornholdt, S., 2007. Partitioning and modularity of graphs witharbitrary degree distribution. Phys. Rev. E 76, 015102.
Ruckstuhl, K.E., 2007. Sexual segregation in vertebrates: proximate and ultimatecauses. Integr. Comp. Biol. 47, 245–257.
Slatkin, M., 1987. Gene flow and the geographic structure of natural populations.Science 236, 787–792.
Smaldino, P.E., Schank, J.C., 2012. Movement patterns, social dynamics, and theevolution of cooperation. Theor. Popul. Biol. 82, 48–58.
Smith, J.E., Van Horn, R.C., Powning, K.S., Cole, A.R., Graham, K.E., Memenis, S.K.,Holekamp, K.E., 2010. Evolutionary forces favoring intragroup coalitionsamong spotted hyenas and other animals. Behav. Ecol. 21, 284–303.
Stanford, C.B., 1995. The influence of chimpanzee predation on group size andanti-predator behaviour in red colobus monkeys. Anim. Behav. 49, 577–587.
Sueur, C., Jacobs, A., Amblard, F., Petit, O., King, A.J., 2011. How can social networkanalysis improve the study of primate behavior? Am. J. Primatol. 71, 1–17.
Trivers, R., 1971. The evolution of reciprocal altruism. Q. Rev. Biol. 46, 35–57.Underwood, R., 1981. Companion preference in an eland herd. Afr. J. Ecol. 19,
341–354.Vainstein, M.H., Silva, A.T., Arenzon, J.J., 2007. Does mobility decrease coopera-
tion? J. Theorl. Biol. 244, 722–728.Voelkl, B., Kasper, C., 2009. Social structure of primate interaction networks
facilitates the emergence of cooperation. Biol. Lett. 5, 462–464.Weir, B.S., Cockerham, C.C., 1984. Estimating F-statistics for the analysis of
population structure. Evolution 38, 1358–1370.Whitehead, H., Lusseau, D., 2012. Animal social networks as substrate for cultural
behavioural diversity. J. Theor. Biol. 294, 19–28.Whitehead, H., 1995. Investigating structure and temporal scale in social organi-
zations using identified individuals. Behav. Ecol. 6, 199–208.Whitehead, H., 1999. SOCPROG programs: analysing animal social structures.
Behav. Ecol. Sociobiol. 63, 765–778.Whitehead, H., Dufault, S., 1999. Techniques for analyzing vertebrate social
structure using identified individuals: review and recommendations. Adv.Stud. Behav. 28, 33–74.
Wilson, D.S., 1975. A theory of group selection. Proc. Natl. Acad. Sci. 72, 143–146.Wittemyer, G., Douglas-Hamilton, I., Getz, W.M., 2005. The socioecology of
elephants: analysis of the processes creating multitiered social structures.Anim. Behav. 69, 1357–1371.
Wu, B., Zhou, D., Fu, F., Luo, Q., Wang, L., Traulsen, A., 2010. Evolution ofcooperation on stochastic dynamical networks. PLoS ONE 5, e11187.
Marianne Marcoux n, David LusseauInstitute of Biological and Environmental Sciences, Zoology Building,
Tillydrone Avenue, University of Aberdeen, Aberdeen AB24 2TZ,
Scotland, United Kingdom
E-mail address: [email protected] (M. Marcoux)
Received 9 July 2012
Available online 19 December 2012
n Corresponding author. Tel.: þ44 1224 272789; fax: þ44 1224 272396.


