Monthly Market Review Asia Pacific | February 2018Global economy:
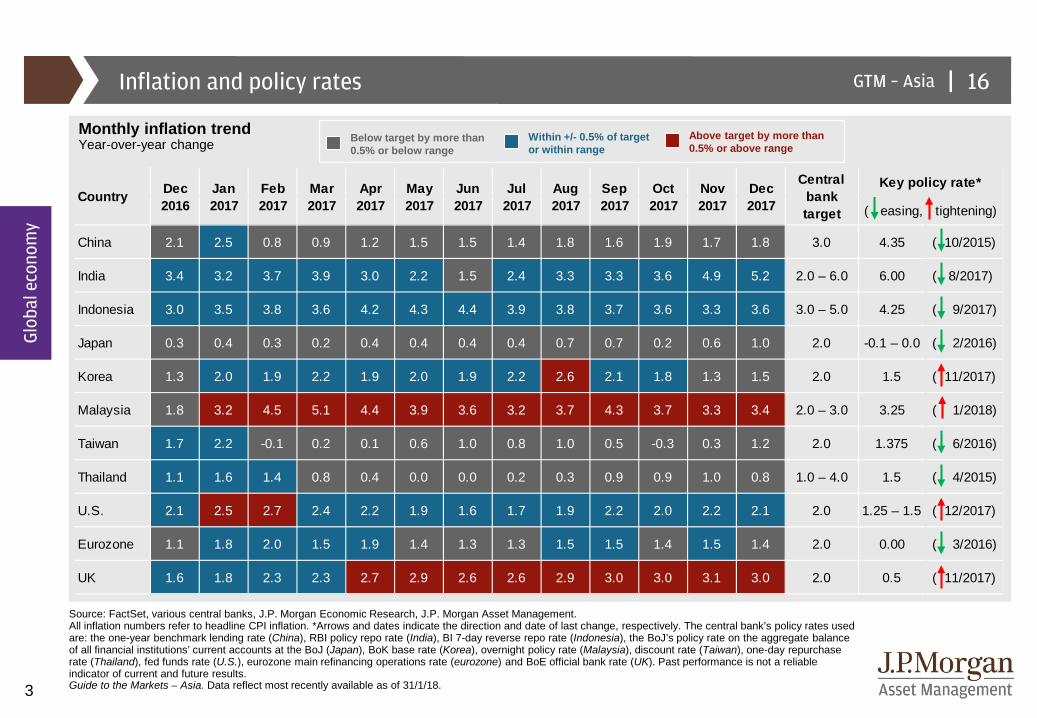
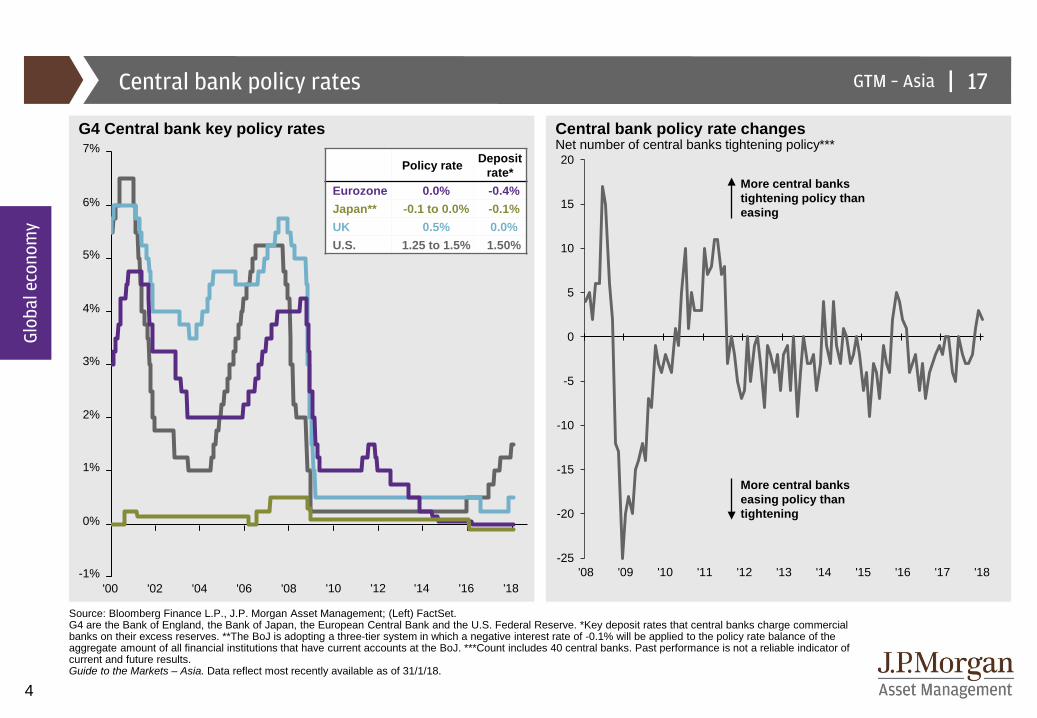
• The Federal Reserve (Fed) left interest rates unchanged in a range of 1.25%-1.50%, as expected, at Janet Yellen’s final meeting as chair. The market has almost fully priced in our expected three hikes for 2018, with 90% probability of a 25bps rate hike at the March meeting, a total of 70bps by end-2018 and a total of 100bps by end-2019. Meanwhile, the Bank of Japan (BoJ) and European Central Bank (ECB) both chose to maintain their current policy stance to support further economic growth. (GTMA P. 18, 26)
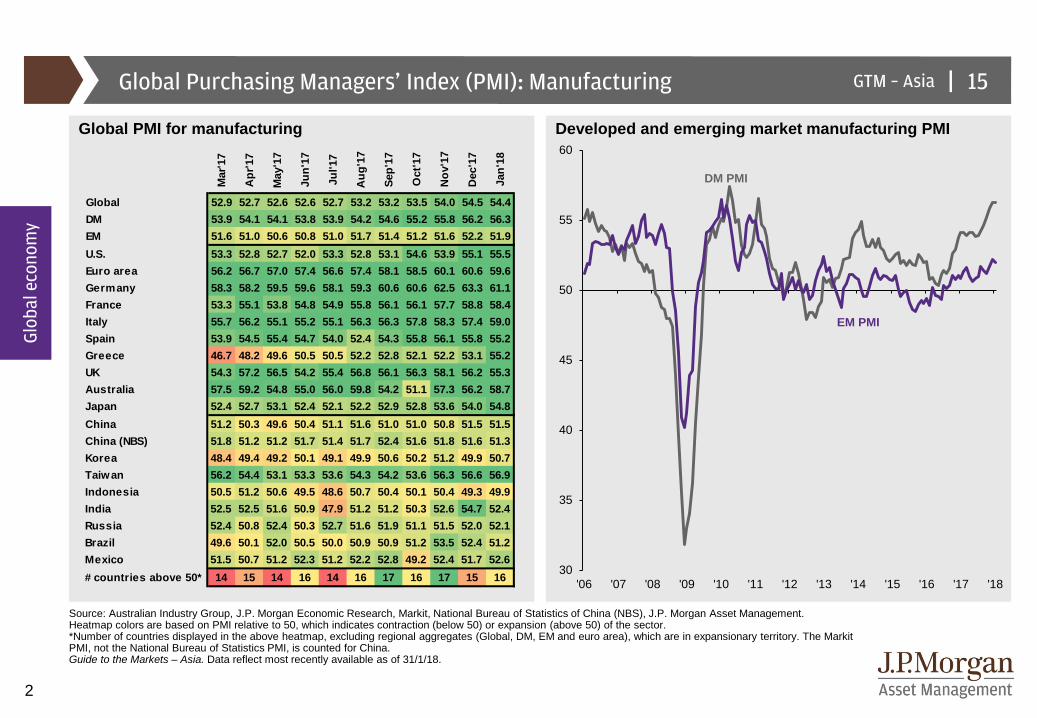
• Global economic growth momentum stayed robust with the International Monetary Fund upgrading its 2018 global growth forecast to 3.9% from 3.7%, the fastest pace in seven years. The latest Global Manufacturing Purchasing Managers' Index (PMI) echoes a similar message as Global Manufacturing PMI remained elevated at 54.4. (GTMA P. 15)
Equities:
• The global equities market started the year strong with the MSCI All Country Index up 5.4% in January. This marks the 16th consecutive month of positive returns for the equity market. U.S. equities (S&P +5.7%) notched higher on the back of risk-on investor sentiment and higher earnings expectations for 2018. Emerging Markets (MSCI EM +6.8%) outperformed Developed Markets (MSCI World +5.3%) in the month, supported by sustained earnings momentum in conjunction with a weaker U.S. dollar. (GTMA P. 29, 38)
• The Asian equities market edged higher with the MSCI Asia Pacific ex-Japan index up 6.7% for January. The rally was primarily contributed to strong performance from China (+12.5%), Taiwan (+7.6%) and Thailand (+4.3%). Positive earnings growth and ongoing export recovery should continue to support market sentiment. (GTMA P. 30, 38)
Fixed income:
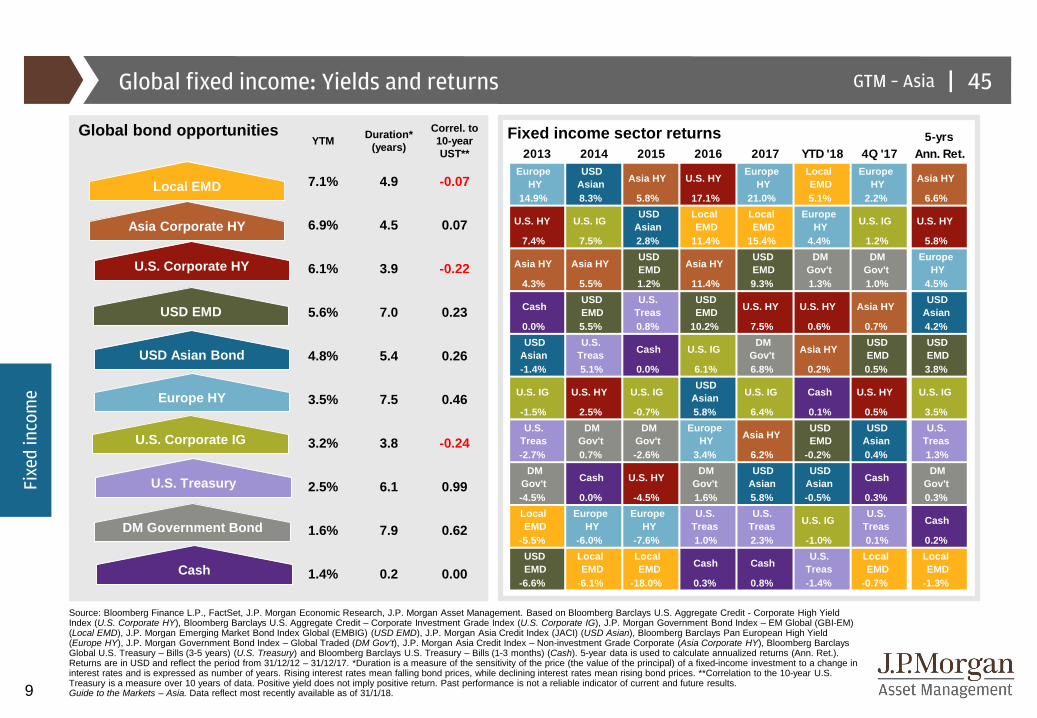
• U.S. 10-year Treasury yields ended January at a multi-year high of 2.7%, supported by continued strength in the general macroeconomic backdrop. The Fed held steady at its latest policy meeting, but continued to signal the possibility of higher rates in March. With the Fed, Bank of England and ECB all signaling their desire to reduce stimulus and normalize interest rates gradually, much market scrutiny will be placed on the pace of their moves. (GTMA P. 45)
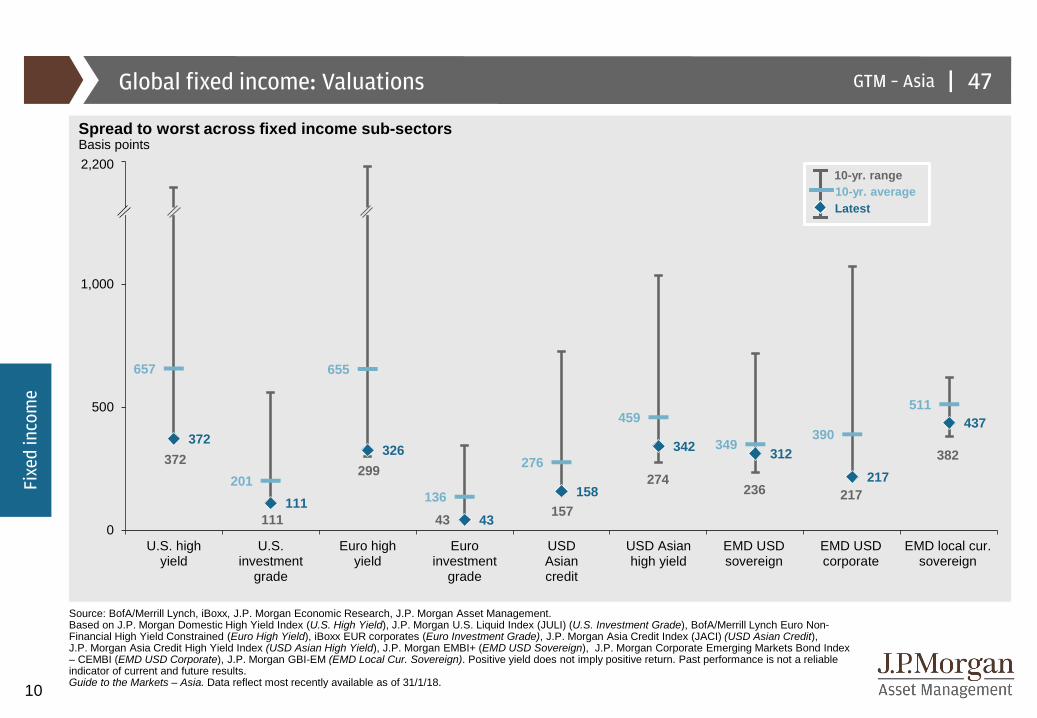
• Local currency EM debt significantly outperformed hard currency EM debt on a weaker U.S. dollar, while U.S. high yield credit spreads tightened further to 372bps. (GTMA P. 45, 47)
Other assets:
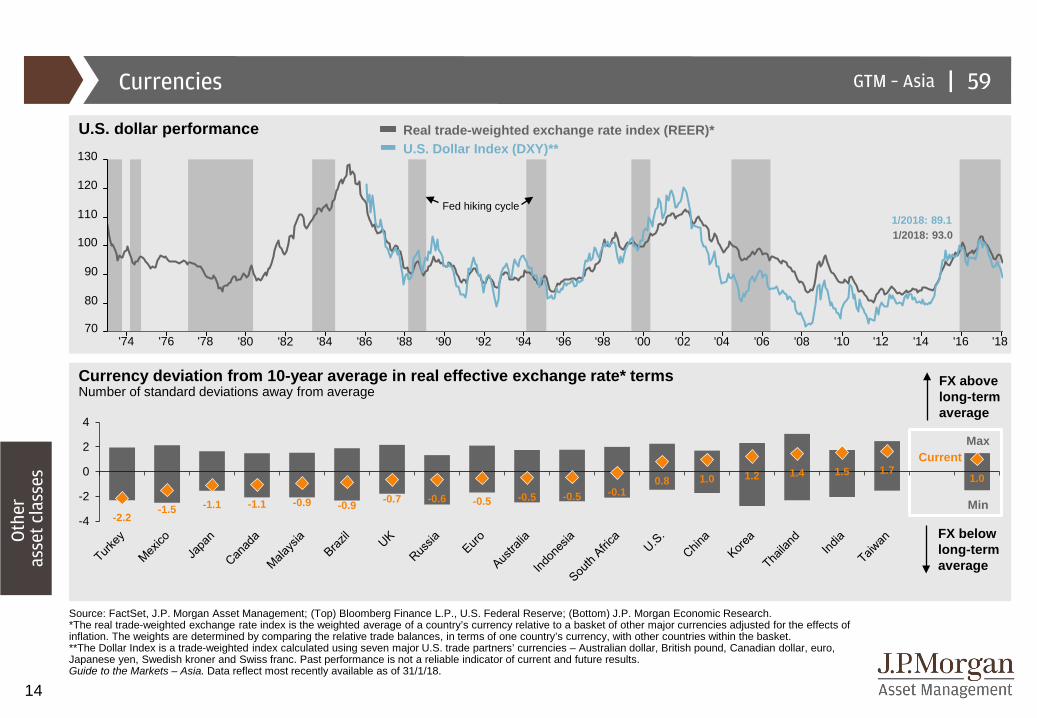
• The U.S. dollar index weakened further in the first month of 2018. The decline has been helped along by U.S. government's comments on U.S. dollar strength, strong relative performance in growth numbers from the rest of the world and uncertainty over U.S. trade policy. Of the major currencies in the Asia region, only the Philippine peso weakened against the U.S dollar over January. The DXY trade-weighted index ended January down 3.2% from December. (GTMA P. 59)
• Oil prices remained in recovery on the back of stronger demand growth and the continuation of the Organization of the Petroleum Exporting Countries (OPEC) production agreement. Other factors, such as U.S. dollar weakness, have most likely intensified support for oil prices. West Texas Intermediate (WTI) oil ended January up 7.1%, at slightly under USD65pb after passing USD66pb during the month. Brent crude prices ended with a 3.2% gain. The outlook for oil will depend on whether OPEC and its allies will increase production or if U.S. shale production will flood the markets with excess supply. (GTMA P. 61)
|GTM – Asia 2
2
Glob
al e
cono
my
Global Purchasing Managers’ Index (PMI): Manufacturing
Source: Australian Industry Group, J.P. Morgan Economic Research, Markit, National Bureau of Statistics of China (NBS), J.P. Morgan Asset Management.Heatmap colors are based on PMI relative to 50, which indicates contraction (below 50) or expansion (above 50) of the sector. *Number of countries displayed in the above heatmap, excluding regional aggregates (Global, DM, EM and euro area), which are in expansionary territory. The MarkitPMI, not the National Bureau of Statistics PMI, is counted for China.Guide to the Markets – Asia. Data reflect most recently available as of 31/1/18.
Global PMI for manufacturing Developed and emerging market manufacturing PMI
DM PMI
EM PMI
Mar
'17
Apr
'17
May
'17
Jun'
17
Jul'1
7
Aug
'17
Sep'
17
Oct
'17
Nov
'17
Dec
'17
Jan'
18
Global 52.9 52.7 52.6 52.6 52.7 53.2 53.2 53.5 54.0 54.5 54.4DM 53.9 54.1 54.1 53.8 53.9 54.2 54.6 55.2 55.8 56.2 56.3EM 51.6 51.0 50.6 50.8 51.0 51.7 51.4 51.2 51.6 52.2 51.9U.S. 53.3 52.8 52.7 52.0 53.3 52.8 53.1 54.6 53.9 55.1 55.5Euro area 56.2 56.7 57.0 57.4 56.6 57.4 58.1 58.5 60.1 60.6 59.6Germany 58.3 58.2 59.5 59.6 58.1 59.3 60.6 60.6 62.5 63.3 61.1France 53.3 55.1 53.8 54.8 54.9 55.8 56.1 56.1 57.7 58.8 58.4Italy 55.7 56.2 55.1 55.2 55.1 56.3 56.3 57.8 58.3 57.4 59.0Spain 53.9 54.5 55.4 54.7 54.0 52.4 54.3 55.8 56.1 55.8 55.2Greece 46.7 48.2 49.6 50.5 50.5 52.2 52.8 52.1 52.2 53.1 55.2UK 54.3 57.2 56.5 54.2 55.4 56.8 56.1 56.3 58.1 56.2 55.3Australia 57.5 59.2 54.8 55.0 56.0 59.8 54.2 51.1 57.3 56.2 58.7Japan 52.4 52.7 53.1 52.4 52.1 52.2 52.9 52.8 53.6 54.0 54.8China 51.2 50.3 49.6 50.4 51.1 51.6 51.0 51.0 50.8 51.5 51.5China (NBS) 51.8 51.2 51.2 51.7 51.4 51.7 52.4 51.6 51.8 51.6 51.3Korea 48.4 49.4 49.2 50.1 49.1 49.9 50.6 50.2 51.2 49.9 50.7Taiwan 56.2 54.4 53.1 53.3 53.6 54.3 54.2 53.6 56.3 56.6 56.9Indonesia 50.5 51.2 50.6 49.5 48.6 50.7 50.4 50.1 50.4 49.3 49.9India 52.5 52.5 51.6 50.9 47.9 51.2 51.2 50.3 52.6 54.7 52.4Russia 52.4 50.8 52.4 50.3 52.7 51.6 51.9 51.1 51.5 52.0 52.1Brazil 49.6 50.1 52.0 50.5 50.0 50.9 50.9 51.2 53.5 52.4 51.2Mexico 51.5 50.7 51.2 52.3 51.2 52.2 52.8 49.2 52.4 51.7 52.6# countries above 50* 14 15 14 16 14 16 17 16 17 15 16 30
35
40
45
50
55
60
'06 '07 '08 '09 '10 '11 '12 '13 '14 '15 '16 '17 '18
15
|GTM – Asia 3
3
Glob
al e
cono
my
Inflation and policy rates
Source: FactSet, various central banks, J.P. Morgan Economic Research, J.P. Morgan Asset Management.All inflation numbers refer to headline CPI inflation. *Arrows and dates indicate the direction and date of last change, respectively. The central bank’s policy rates used are: the one-year benchmark lending rate (China), RBI policy repo rate (India), BI 7-day reverse repo rate (Indonesia), the BoJ’s policy rate on the aggregate balance of all financial institutions’ current accounts at the BoJ (Japan), BoK base rate (Korea), overnight policy rate (Malaysia), discount rate (Taiwan), one-day repurchase rate (Thailand), fed funds rate (U.S.), eurozone main refinancing operations rate (eurozone) and BoE official bank rate (UK). Past performance is not a reliable indicator of current and future results.Guide to the Markets – Asia. Data reflect most recently available as of 31/1/18.
Monthly inflation trendYear-over-year change Below target by more than
0.5% or below range Within +/- 0.5% of target or within range
Above target by more than 0.5% or above range
Dec Jan Feb Mar Apr May Jun Jul Aug Sep Oct Nov Dec2016 2017 2017 2017 2017 2017 2017 2017 2017 2017 2017 2017 2017
China 2.1 2.5 0.8 0.9 1.2 1.5 1.5 1.4 1.8 1.6 1.9 1.7 1.8 3.0 4.35 ( 10/2015)
India 3.4 3.2 3.7 3.9 3.0 2.2 1.5 2.4 3.3 3.3 3.6 4.9 5.2 2.0 – 6.0 6.00 ( 8/2017)
Indonesia 3.0 3.5 3.8 3.6 4.2 4.3 4.4 3.9 3.8 3.7 3.6 3.3 3.6 3.0 – 5.0 4.25 ( 9/2017)
Japan 0.3 0.4 0.3 0.2 0.4 0.4 0.4 0.4 0.7 0.7 0.2 0.6 1.0 2.0 -0.1 – 0.0 ( 2/2016)
Korea 1.3 2.0 1.9 2.2 1.9 2.0 1.9 2.2 2.6 2.1 1.8 1.3 1.5 2.0 1.5 ( 11/2017)
Malaysia 1.8 3.2 4.5 5.1 4.4 3.9 3.6 3.2 3.7 4.3 3.7 3.3 3.4 2.0 – 3.0 3.25 ( 1/2018)
Taiwan 1.7 2.2 -0.1 0.2 0.1 0.6 1.0 0.8 1.0 0.5 -0.3 0.3 1.2 2.0 1.375 ( 6/2016)
Thailand 1.1 1.6 1.4 0.8 0.4 0.0 0.0 0.2 0.3 0.9 0.9 1.0 0.8 1.0 – 4.0 1.5 ( 4/2015)
U.S. 2.1 2.5 2.7 2.4 2.2 1.9 1.6 1.7 1.9 2.2 2.0 2.2 2.1 2.0 1.25 – 1.5 ( 12/2017)
Eurozone 1.1 1.8 2.0 1.5 1.9 1.4 1.3 1.3 1.5 1.5 1.4 1.5 1.4 2.0 0.00 ( 3/2016)
UK 1.6 1.8 2.3 2.3 2.7 2.9 2.6 2.6 2.9 3.0 3.0 3.1 3.0 2.0 0.5 ( 11/2017)
Centralbanktarget ( easing, tightening)
Key policy rate*Country
16
|GTM – Asia 4
4
Glob
al e
cono
my
'00 '02 '04 '06 '08 '10 '12 '14 '16 '18-1%
0%
1%
2%
3%
4%
5%
6%
7%
Central bank policy rates
Source: Bloomberg Finance L.P., J.P. Morgan Asset Management; (Left) FactSet. G4 are the Bank of England, the Bank of Japan, the European Central Bank and the U.S. Federal Reserve. *Key deposit rates that central banks charge commercial banks on their excess reserves. **The BoJ is adopting a three-tier system in which a negative interest rate of -0.1% will be applied to the policy rate balance of the aggregate amount of all financial institutions that have current accounts at the BoJ. ***Count includes 40 central banks. Past performance is not a reliable indicator of current and future results.Guide to the Markets – Asia. Data reflect most recently available as of 31/1/18.
G4 Central bank key policy rates Central bank policy rate changesNet number of central banks tightening policy***
Policy rate Deposit rate*
Eurozone 0.0% -0.4%Japan** -0.1 to 0.0% -0.1%UK 0.5% 0.0%U.S. 1.25 to 1.5% 1.50%
More central banks tightening policy than easing
More central banks easing policy than tightening
-25
-20
-15
-10
-5
0
5
10
15
20
'08 '09 '10 '11 '12 '13 '14 '15 '16 '17 '18
17
|GTM – Asia 5
5
Glob
al e
cono
my
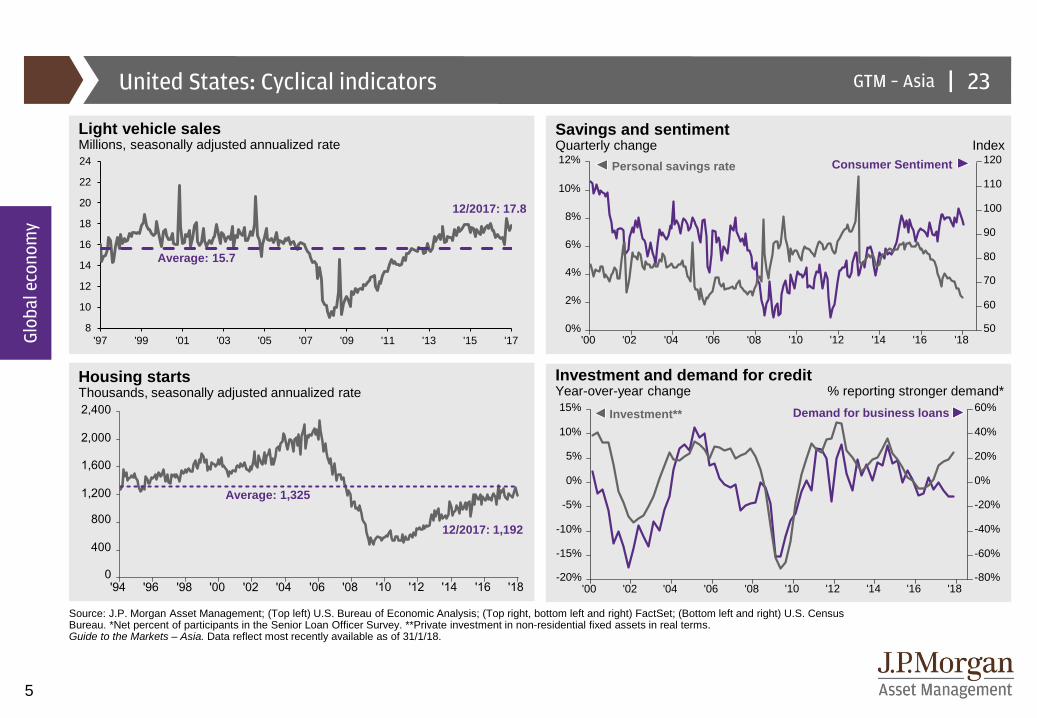
United States: Cyclical indicators
Investment and demand for creditYear-over-year change % reporting stronger demand*
Housing starts Thousands, seasonally adjusted annualized rate
Savings and sentimentQuarterly change Index
'94 '96 '98 '00 '02 '04 '06 '08 '10 '12 '14 '16 '180
400
800
1,200
1,600
2,000
2,400
12/2017: 1,192
Average: 1,325
Personal savings rate Consumer Sentiment
'00 '02 '04 '06 '08 '10 '12 '14 '16 '18-80%
-60%
-40%
-20%
0%
20%
40%
60%
-20%
-15%
-10%
-5%
0%
5%
10%
15% Investment** Demand for business loans
Source: J.P. Morgan Asset Management; (Top left) U.S. Bureau of Economic Analysis; (Top right, bottom left and right) FactSet; (Bottom left and right) U.S. Census Bureau. *Net percent of participants in the Senior Loan Officer Survey. **Private investment in non-residential fixed assets in real terms. Guide to the Markets – Asia. Data reflect most recently available as of 31/1/18.
'00 '02 '04 '06 '08 '10 '12 '14 '16 '1850
60
70
80
90
100
110
120
0%
2%
4%
6%
8%
10%
12%
Light vehicle salesMillions, seasonally adjusted annualized rate
12/2017: 17.8
Average: 15.7
8
10
12
14
16
18
20
22
24
'97 '99 '01 '03 '05 '07 '09 '11 '13 '15 '17
23
|GTM – Asia 6
6
Equi
ties
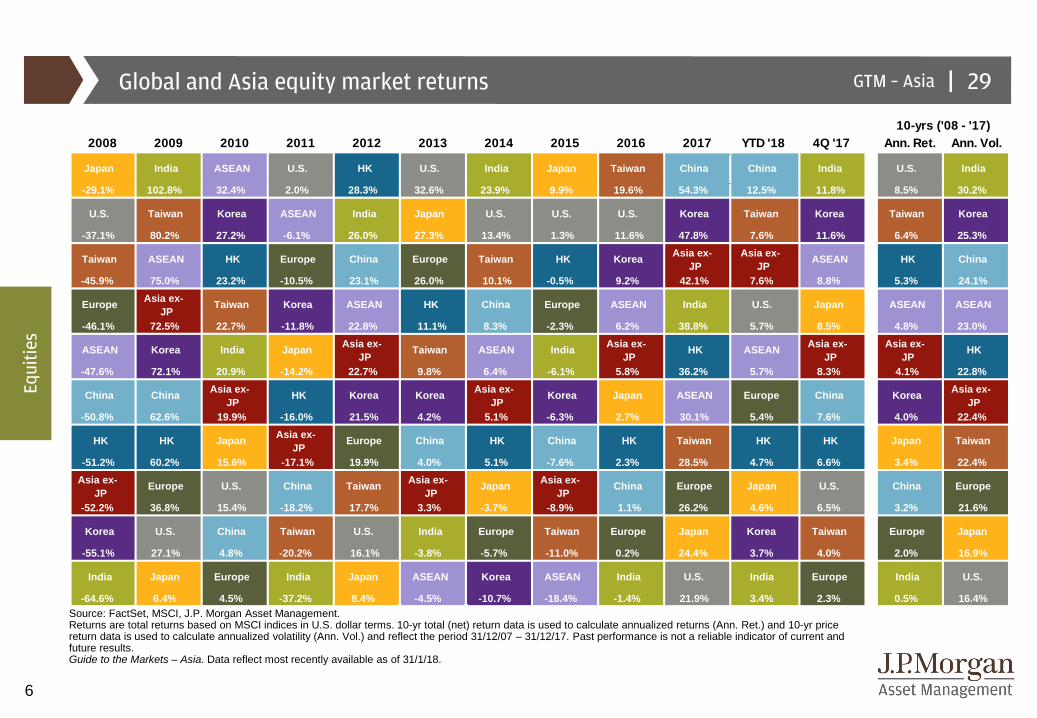
Global and Asia equity market returns
Source: FactSet, MSCI, J.P. Morgan Asset Management.Returns are total returns based on MSCI indices in U.S. dollar terms. 10-yr total (net) return data is used to calculate annualized returns (Ann. Ret.) and 10-yr price return data is used to calculate annualized volatility (Ann. Vol.) and reflect the period 31/12/07 – 31/12/17. Past performance is not a reliable indicator of current and future results.Guide to the Markets – Asia. Data reflect most recently available as of 31/1/18.
2008 2009 2010 2011 2012 2013 2014 2015 2016 2017 YTD '18 4Q '17 Ann. Ret. Ann. Vol.
Japan India ASEAN U.S. HK U.S. India Japan Taiwan China China India U.S. India
-29.1% 102.8% 32.4% 2.0% 28.3% 32.6% 23.9% 9.9% 19.6% 54.3% 12.5% 11.8% 8.5% 30.2%
U.S. Taiwan Korea ASEAN India Japan U.S. U.S. U.S. Korea Taiwan Korea Taiwan Korea
-37.1% 80.2% 27.2% -6.1% 26.0% 27.3% 13.4% 1.3% 11.6% 47.8% 7.6% 11.6% 6.4% 25.3%
Taiwan ASEAN HK Europe China Europe Taiwan HK Korea Asia ex-JP
Asia ex-JP
ASEAN HK China
-45.9% 75.0% 23.2% -10.5% 23.1% 26.0% 10.1% -0.5% 9.2% 42.1% 7.6% 8.8% 5.3% 24.1%
Europe Asia ex-JP
Taiwan Korea ASEAN HK China Europe ASEAN India U.S. Japan ASEAN ASEAN
-46.1% 72.5% 22.7% -11.8% 22.8% 11.1% 8.3% -2.3% 6.2% 38.8% 5.7% 8.5% 4.8% 23.0%
ASEAN Korea India Japan Asia ex-JP
Taiwan ASEAN India Asia ex-JP
HK ASEAN Asia ex-JP
Asia ex-JP
HK
-47.6% 72.1% 20.9% -14.2% 22.7% 9.8% 6.4% -6.1% 5.8% 36.2% 5.7% 8.3% 4.1% 22.8%
China China Asia ex-JP
HK Korea Korea Asia ex-JP
Korea Japan ASEAN Europe China Korea Asia ex-JP
-50.8% 62.6% 19.9% -16.0% 21.5% 4.2% 5.1% -6.3% 2.7% 30.1% 5.4% 7.6% 4.0% 22.4%
HK HK Japan Asia ex-JP
Europe China HK China HK Taiwan HK HK Japan Taiwan
-51.2% 60.2% 15.6% -17.1% 19.9% 4.0% 5.1% -7.6% 2.3% 28.5% 4.7% 6.6% 3.4% 22.4%Asia ex-
JPEurope U.S. China Taiwan Asia ex-
JPJapan Asia ex-
JPChina Europe Japan U.S. China Europe
-52.2% 36.8% 15.4% -18.2% 17.7% 3.3% -3.7% -8.9% 1.1% 26.2% 4.6% 6.5% 3.2% 21.6%
Korea U.S. China Taiwan U.S. India Europe Taiwan Europe Japan Korea Taiwan Europe Japan
-55.1% 27.1% 4.8% -20.2% 16.1% -3.8% -5.7% -11.0% 0.2% 24.4% 3.7% 4.0% 2.0% 16.9%
India Japan Europe India Japan ASEAN Korea ASEAN India U.S. India Europe India U.S.
-64.6% 6.4% 4.5% -37.2% 8.4% -4.5% -10.7% -18.4% -1.4% 21.9% 3.4% 2.3% 0.5% 16.4%
10-yrs ('08 - '17)
29
|GTM – Asia 7
7
Equi
ties
'09 '10 '11 '12 '13 '14 '15 '16 '17 '1820
40
60
80
100
120
140
160
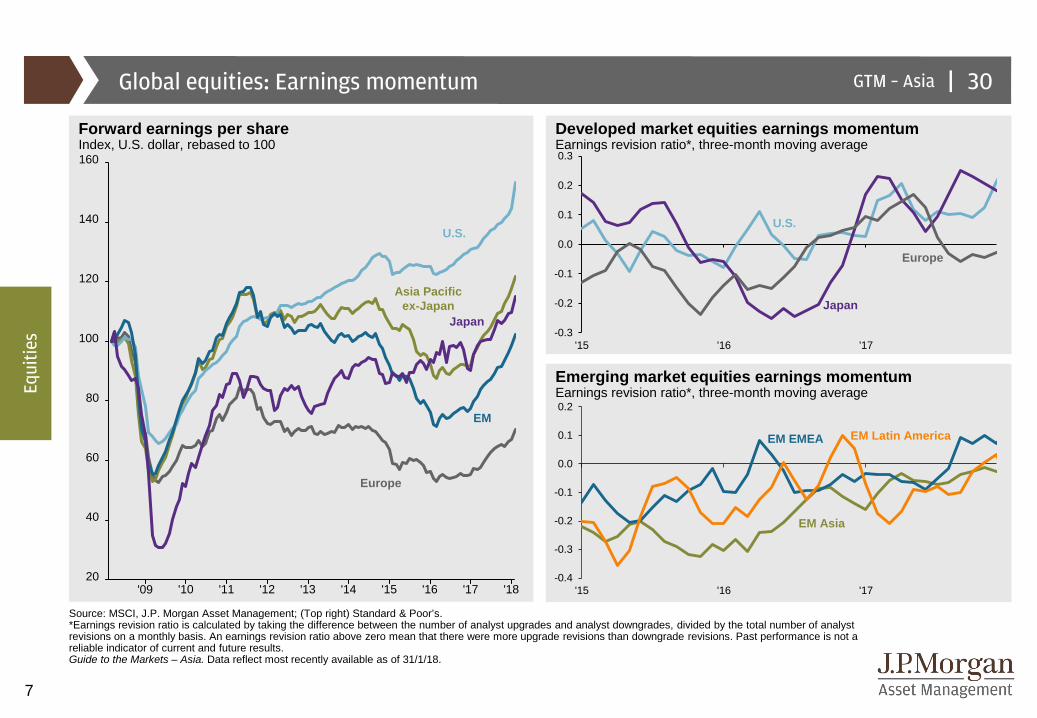
Developed market equities earnings momentumEarnings revision ratio*, three-month moving average
Global equities: Earnings momentum
Source: MSCI, J.P. Morgan Asset Management; (Top right) Standard & Poor’s. *Earnings revision ratio is calculated by taking the difference between the number of analyst upgrades and analyst downgrades, divided by the total number of analyst revisions on a monthly basis. An earnings revision ratio above zero mean that there were more upgrade revisions than downgrade revisions. Past performance is not a reliable indicator of current and future results.Guide to the Markets – Asia. Data reflect most recently available as of 31/1/18.
Forward earnings per shareIndex, U.S. dollar, rebased to 100
Emerging market equities earnings momentumEarnings revision ratio*, three-month moving average
Asia Pacific ex-Japan
Europe
Japan
U.S.
EM
EM Asia
EM EMEA EM Latin America
-0.3
-0.2
-0.1
0.0
0.1
0.2
0.3
'15 '16 '17
Japan
U.S.
Europe
-0.4
-0.3
-0.2
-0.1
0.0
0.1
0.2
'15 '16 '17
30
|GTM – Asia 8
8
Equi
ties
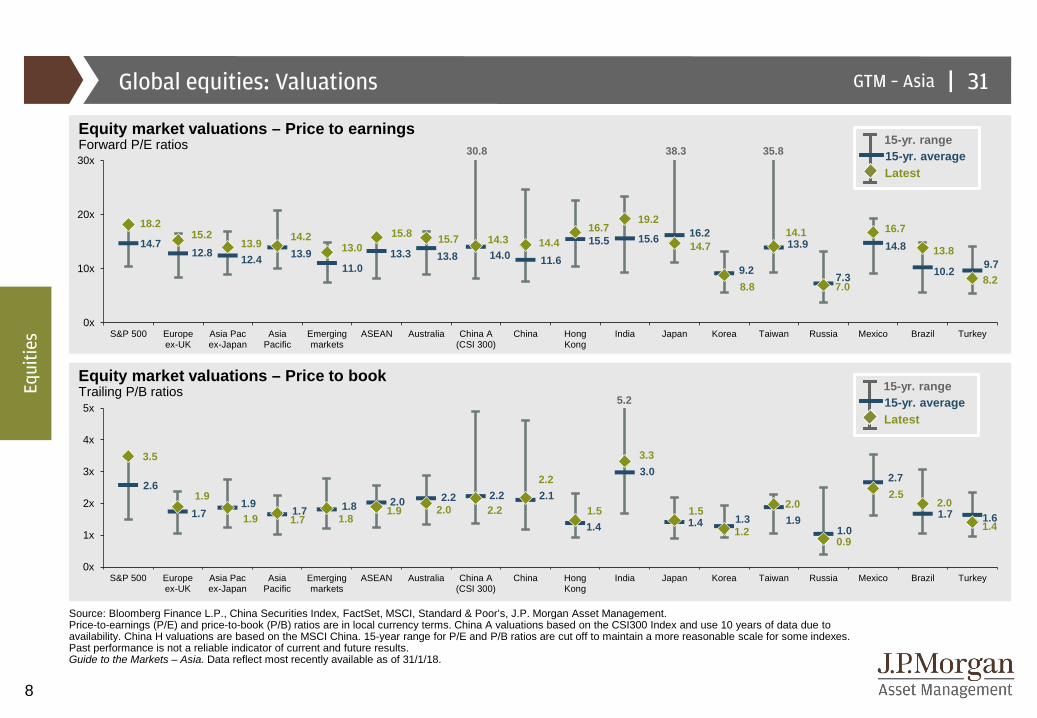
Global equities: Valuations
Source: Bloomberg Finance L.P., China Securities Index, FactSet, MSCI, Standard & Poor’s, J.P. Morgan Asset Management.Price-to-earnings (P/E) and price-to-book (P/B) ratios are in local currency terms. China A valuations based on the CSI300 Index and use 10 years of data due to availability. China H valuations are based on the MSCI China. 15-year range for P/E and P/B ratios are cut off to maintain a more reasonable scale for some indexes. Past performance is not a reliable indicator of current and future results. Guide to the Markets – Asia. Data reflect most recently available as of 31/1/18.
Equity market valuations – Price to bookTrailing P/B ratios
Equity market valuations – Price to earningsForward P/E ratios
15-yr. averageLatest
15-yr. range38.3 35.830.8
15-yr. averageLatest
15-yr. range5.2
14.712.8 12.4 13.9
11.013.3 13.8 14.0 11.6
15.5 15.6 16.2
9.2
13.9
7.3
14.8
10.2 9.7
18.215.2
13.9 14.213.0
15.8 15.7 14.3 14.416.7
19.2
14.7
8.8
14.1
7.0
16.7
13.8
8.2
0x
10x
20x
30x
S&P 500 Europeex-UK
Asia Pacex-Japan
AsiaPacific
Emergingmarkets
ASEAN Australia China A(CSI 300)
China HongKong
India Japan Korea Taiwan Russia Mexico Brazil Turkey
2.6
1.71.9
1.7 1.8 2.0 2.2 2.2 2.1
1.4
3.0
1.4 1.3 1.91.0
2.7
1.7 1.6
3.5
1.9
1.9 1.7 1.81.9 2.0 2.2
2.2
1.5
3.3
1.5
1.2
2.0
0.9
2.52.0
1.4
0x
1x
2x
3x
4x
5x
S&P 500 Europeex-UK
Asia Pacex-Japan
AsiaPacific
Emergingmarkets
ASEAN Australia China A(CSI 300)
China HongKong
India Japan Korea Taiwan Russia Mexico Brazil Turkey
31
|GTM – Asia 9
9
Fixe
d in
com
e
Global fixed income: Yields and returns
Source: Bloomberg Finance L.P., FactSet, J.P. Morgan Economic Research, J.P. Morgan Asset Management. Based on Bloomberg Barclays U.S. Aggregate Credit - Corporate High Yield Index (U.S. Corporate HY), Bloomberg Barclays U.S. Aggregate Credit – Corporate Investment Grade Index (U.S. Corporate IG), J.P. Morgan Government Bond Index – EM Global (GBI-EM) (Local EMD), J.P. Morgan Emerging Market Bond Index Global (EMBIG) (USD EMD), J.P. Morgan Asia Credit Index (JACI) (USD Asian), Bloomberg Barclays Pan European High Yield (Europe HY), J.P. Morgan Government Bond Index – Global Traded (DM Gov’t), J.P. Morgan Asia Credit Index – Non-investment Grade Corporate (Asia Corporate HY), Bloomberg Barclays Global U.S. Treasury – Bills (3-5 years) (U.S. Treasury) and Bloomberg Barclays U.S. Treasury – Bills (1-3 months) (Cash). 5-year data is used to calculate annualized returns (Ann. Ret.). Returns are in USD and reflect the period from 31/12/12 – 31/12/17. *Duration is a measure of the sensitivity of the price (the value of the principal) of a fixed-income investment to a change in interest rates and is expressed as number of years. Rising interest rates mean falling bond prices, while declining interest rates mean rising bond prices. **Correlation to the 10-year U.S. Treasury is a measure over 10 years of data. Positive yield does not imply positive return. Past performance is not a reliable indicator of current and future results.Guide to the Markets – Asia. Data reflect most recently available as of 31/1/18.
USD EMD
Global bond opportunities
Local EMD
U.S. Corporate IG
USD Asian Bond
DM Government Bond
Asia Corporate HY
U.S. Treasury
Cash
Fixed income sector returns
U.S. Corporate HY
Europe HY
YTM Duration* (years)
Correl. to 10-yearUST**
7.1% 4.9 -0.07
6.9% 4.5 0.07
6.1% 3.9 -0.22
5.6% 7.0 0.23
4.8% 5.4 0.26
3.5% 7.5 0.46
3.2% 3.8 -0.24
2.5% 6.1 0.99
1.6% 7.9 0.62
1.4% 0.2 0.00
5-yrs2013 2014 2015 2016 2017 YTD '18 4Q '17 Ann. Ret.
Europe HY
USD Asian Asia HY U.S. HY
Europe HY
Local EMD
Europe HY Asia HY
14.9% 8.3% 5.8% 17.1% 21.0% 5.1% 2.2% 6.6%
U.S. HY U.S. IGUSD
AsianLocal EMD
Local EMD
Europe HY U.S. IG U.S. HY
7.4% 7.5% 2.8% 11.4% 15.4% 4.4% 1.2% 5.8%
Asia HY Asia HYUSDEMD Asia HY
USDEMD
DM Gov't
DM Gov't
Europe HY
4.3% 5.5% 1.2% 11.4% 9.3% 1.3% 1.0% 4.5%
CashUSDEMD
U.S.Treas
USDEMD U.S. HY U.S. HY Asia HY
USD Asian
0.0% 5.5% 0.8% 10.2% 7.5% 0.6% 0.7% 4.2%USD
AsianU.S.
Treas Cash U.S. IGDM
Gov't Asia HYUSDEMD
USDEMD
-1.4% 5.1% 0.0% 6.1% 6.8% 0.2% 0.5% 3.8%
U.S. IG U.S. HY U.S. IGUSD
Asian U.S. IG Cash U.S. HY U.S. IG
-1.5% 2.5% -0.7% 5.8% 6.4% 0.1% 0.5% 3.5%U.S.
TreasDM
Gov'tDM
Gov'tEurope
HY Asia HYUSDEMD
USD Asian
U.S.Treas
-2.7% 0.7% -2.6% 3.4% 6.2% -0.2% 0.4% 1.3%DM
Gov't Cash U.S. HYDM
Gov'tUSD
AsianUSD
Asian CashDM
Gov't-4.5% 0.0% -4.5% 1.6% 5.8% -0.5% 0.3% 0.3%Local EMD
Europe HY
Europe HY
U.S.Treas
U.S.Treas U.S. IG
U.S.Treas Cash
-5.5% -6.0% -7.6% 1.0% 2.3% -1.0% 0.1% 0.2%USDEMD
Local EMD
Local EMD Cash Cash
U.S.Treas
Local EMD
Local EMD
-6.6% -6.1% -18.0% 0.3% 0.8% -1.4% -0.7% -1.3%
45
|GTM – Asia 10
10
Fixe
d in
com
e
Global fixed income: Valuations
Source: BofA/Merrill Lynch, iBoxx, J.P. Morgan Economic Research, J.P. Morgan Asset Management.Based on J.P. Morgan Domestic High Yield Index (U.S. High Yield), J.P. Morgan U.S. Liquid Index (JULI) (U.S. Investment Grade), BofA/Merrill Lynch Euro Non-Financial High Yield Constrained (Euro High Yield), iBoxx EUR corporates (Euro Investment Grade), J.P. Morgan Asia Credit Index (JACI) (USD Asian Credit), J.P. Morgan Asia Credit High Yield Index (USD Asian High Yield), J.P. Morgan EMBI+ (EMD USD Sovereign), J.P. Morgan Corporate Emerging Markets Bond Index – CEMBI (EMD USD Corporate), J.P. Morgan GBI-EM (EMD Local Cur. Sovereign). Positive yield does not imply positive return. Past performance is not a reliable indicator of current and future results.Guide to the Markets – Asia. Data reflect most recently available as of 31/1/18.
Spread to worst across fixed income sub-sectorsBasis points
10-yr. averageLatest
10-yr. range
657
201
655
136
276
459
349390
511
372
111
326
43
158
342 312
217
437
0
500
1,000
1,500
U.S. highyield
U.S.investment
grade
Euro highyield
Euroinvestment
grade
USDAsiancredit
USD Asianhigh yield
EMD USDsovereign
EMD USDcorporate
EMD local cur.sovereign
2,200
372
111
299
43 157
274236 217
382
47
|GTM – Asia 11
11
Fixe
d in
com
e
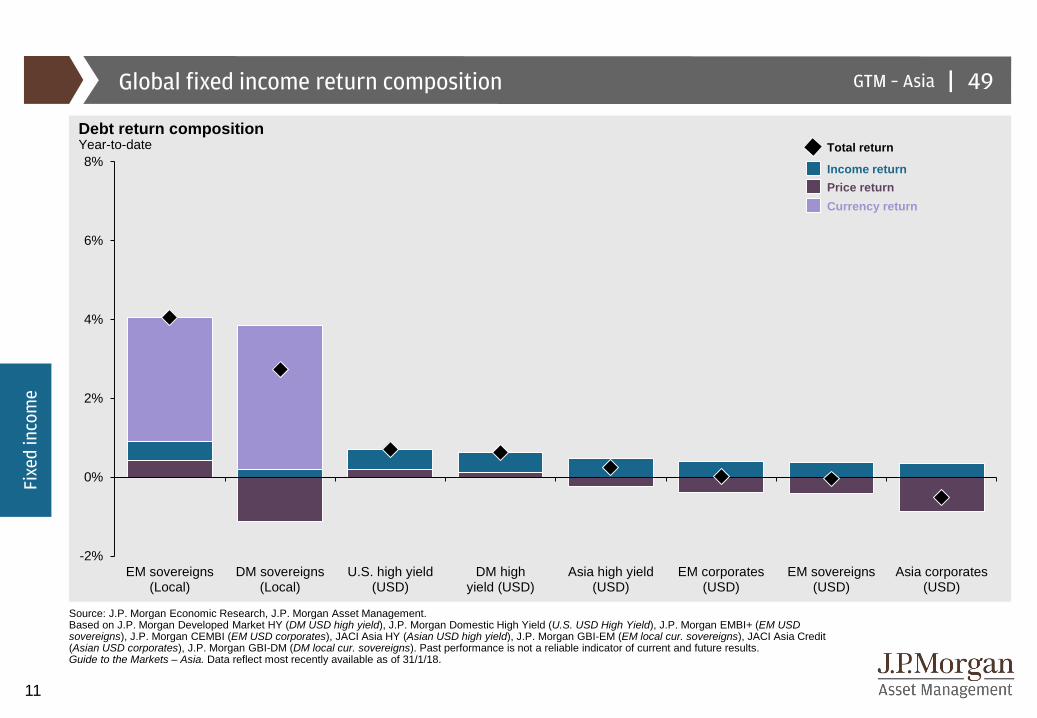
Global fixed income return composition
Source: J.P. Morgan Economic Research, J.P. Morgan Asset Management.Based on J.P. Morgan Developed Market HY (DM USD high yield), J.P. Morgan Domestic High Yield (U.S. USD High Yield), J.P. Morgan EMBI+ (EM USD sovereigns), J.P. Morgan CEMBI (EM USD corporates), JACI Asia HY (Asian USD high yield), J.P. Morgan GBI-EM (EM local cur. sovereigns), JACI Asia Credit (Asian USD corporates), J.P. Morgan GBI-DM (DM local cur. sovereigns). Past performance is not a reliable indicator of current and future results.Guide to the Markets – Asia. Data reflect most recently available as of 31/1/18.
Debt return compositionYear-to-date
Income returnPrice returnCurrency return
Total return
-2%
0%
2%
4%
6%
8%
EM sovereigns(Local)
DM sovereigns(Local)
U.S. high yield(USD)
DM highyield (USD)
Asia high yield(USD)
EM corporates(USD)
EM sovereigns(USD)
Asia corporates(USD)
49
|GTM – Asia 12
12
Fixe
d in
com
e
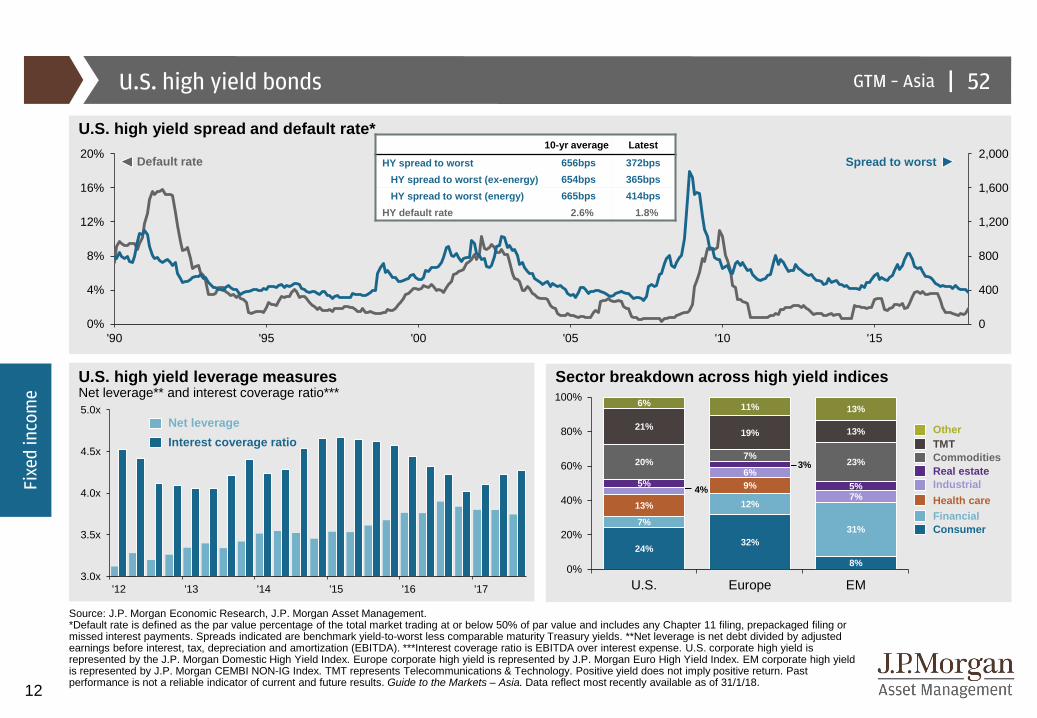
U.S. high yield bonds
Source: J.P. Morgan Economic Research, J.P. Morgan Asset Management. *Default rate is defined as the par value percentage of the total market trading at or below 50% of par value and includes any Chapter 11 filing, prepackaged filing or missed interest payments. Spreads indicated are benchmark yield-to-worst less comparable maturity Treasury yields. **Net leverage is net debt divided by adjusted earnings before interest, tax, depreciation and amortization (EBITDA). ***Interest coverage ratio is EBITDA over interest expense. U.S. corporate high yield is represented by the J.P. Morgan Domestic High Yield Index. Europe corporate high yield is represented by J.P. Morgan Euro High Yield Index. EM corporate high yield is represented by J.P. Morgan CEMBI NON-IG Index. TMT represents Telecommunications & Technology. Positive yield does not imply positive return. Past performance is not a reliable indicator of current and future results. Guide to the Markets – Asia. Data reflect most recently available as of 31/1/18.
U.S. high yield leverage measuresNet leverage** and interest coverage ratio***
Sector breakdown across high yield indices
U.S. high yield spread and default rate*10-yr average Latest
HY spread to worst 656bps 372bpsHY spread to worst (ex-energy) 654bps 365bpsHY spread to worst (energy) 665bps 414bps
HY default rate 2.6% 1.8%
Net leverageInterest coverage ratio
Default rate Spread to worst
Commodities
OtherTMT
Health careIndustrialReal estate
ConsumerFinancial
3.0x
3.5x
4.0x
4.5x
5.0x
'12 '13 '14 '15 '16 '17
24%32%
8%
7%
12%
31%
13%
9%4%
6%
7%5%
3%
5%
20% 7% 23%
21% 19% 13%
6% 11% 13%
0%
20%
40%
60%
80%
100%
U.S. Europe EM
0
400
800
1,200
1,600
2,000
0%
4%
8%
12%
16%
20%
'90 '95 '00 '05 '10 '15
52
|GTM – Asia 13
13
Oth
er
asse
t cla
sses
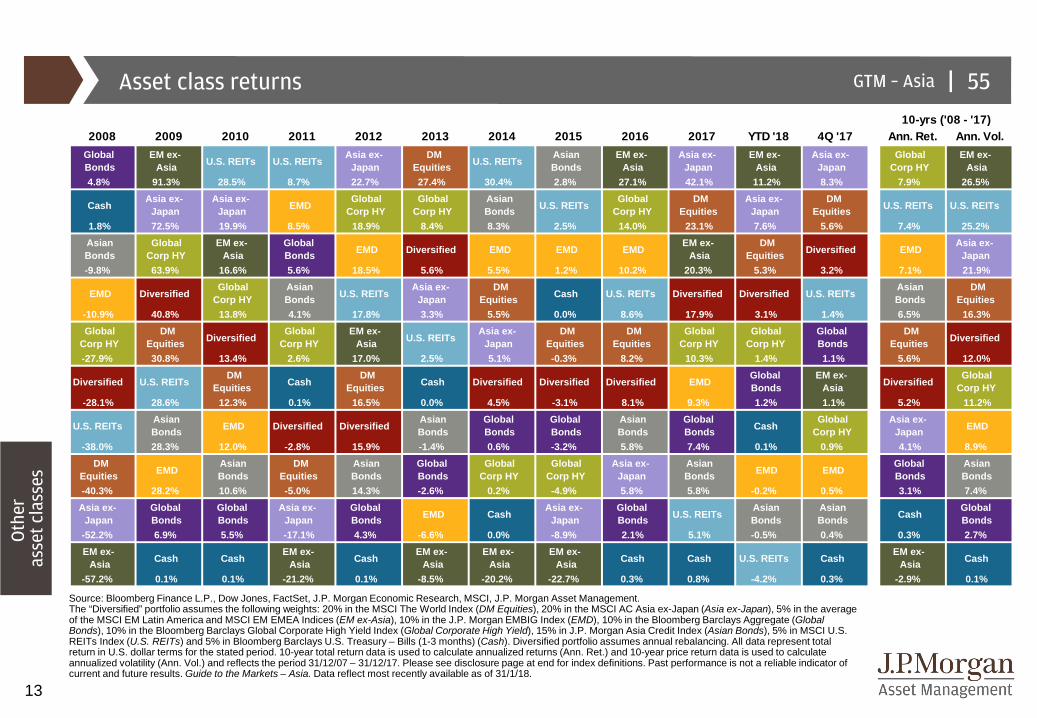
Asset class returns
Source: Bloomberg Finance L.P., Dow Jones, FactSet, J.P. Morgan Economic Research, MSCI, J.P. Morgan Asset Management. The “Diversified” portfolio assumes the following weights: 20% in the MSCI The World Index (DM Equities), 20% in the MSCI AC Asia ex-Japan (Asia ex-Japan), 5% in the average of the MSCI EM Latin America and MSCI EM EMEA Indices (EM ex-Asia), 10% in the J.P. Morgan EMBIG Index (EMD), 10% in the Bloomberg Barclays Aggregate (Global Bonds), 10% in the Bloomberg Barclays Global Corporate High Yield Index (Global Corporate High Yield), 15% in J.P. Morgan Asia Credit Index (Asian Bonds), 5% in MSCI U.S. REITs Index (U.S. REITs) and 5% in Bloomberg Barclays U.S. Treasury – Bills (1-3 months) (Cash). Diversified portfolio assumes annual rebalancing. All data represent total return in U.S. dollar terms for the stated period. 10-year total return data is used to calculate annualized returns (Ann. Ret.) and 10-year price return data is used to calculate annualized volatility (Ann. Vol.) and reflects the period 31/12/07 – 31/12/17. Please see disclosure page at end for index definitions. Past performance is not a reliable indicator of current and future results. Guide to the Markets – Asia. Data reflect most recently available as of 31/1/18.
2008 2009 2010 2011 2012 2013 2014 2015 2016 2017 YTD '18 4Q '17 Ann. Ret. Ann. Vol.Global Bonds
EM ex-Asia U.S. REITs U.S. REITs
Asia ex-Japan
DM Equities U.S. REITs
Asian Bonds
EM ex-Asia
Asia ex-Japan
EM ex-Asia
Asia ex-Japan
Global Corp HY
EM ex-Asia
4.8% 91.3% 28.5% 8.7% 22.7% 27.4% 30.4% 2.8% 27.1% 42.1% 11.2% 8.3% 7.9% 26.5%
CashAsia ex-
JapanAsia ex-
Japan EMDGlobal
Corp HYGlobal
Corp HYAsian Bonds U.S. REITs
Global Corp HY
DM Equities
Asia ex-Japan
DM Equities U.S. REITs U.S. REITs
1.8% 72.5% 19.9% 8.5% 18.9% 8.4% 8.3% 2.5% 14.0% 23.1% 7.6% 5.6% 7.4% 25.2%Asian Bonds
Global Corp HY
EM ex-Asia
Global Bonds EMD Diversified EMD EMD EMD
EM ex-Asia
DM Equities Diversified EMD
Asia ex-Japan
-9.8% 63.9% 16.6% 5.6% 18.5% 5.6% 5.5% 1.2% 10.2% 20.3% 5.3% 3.2% 7.1% 21.9%
EMD DiversifiedGlobal
Corp HYAsian Bonds U.S. REITs
Asia ex-Japan
DM Equities Cash U.S. REITs Diversified Diversified U.S. REITs
Asian Bonds
DM Equities
-10.9% 40.8% 13.8% 4.1% 17.8% 3.3% 5.5% 0.0% 8.6% 17.9% 3.1% 1.4% 6.5% 16.3%Global
Corp HYDM
Equities DiversifiedGlobal
Corp HYEM ex-
Asia U.S. REITsAsia ex-
JapanDM
EquitiesDM
EquitiesGlobal
Corp HYGlobal
Corp HYGlobal Bonds
DM Equities Diversified
-27.9% 30.8% 13.4% 2.6% 17.0% 2.5% 5.1% -0.3% 8.2% 10.3% 1.4% 1.1% 5.6% 12.0%
Diversified U.S. REITsDM
Equities CashDM
Equities Cash Diversified Diversified Diversified EMDGlobal Bonds
EM ex-Asia Diversified
Global Corp HY
-28.1% 28.6% 12.3% 0.1% 16.5% 0.0% 4.5% -3.1% 8.1% 9.3% 1.2% 1.1% 5.2% 11.2%
U.S. REITsAsian Bonds EMD Diversified Diversified
Asian Bonds
Global Bonds
Global Bonds
Asian Bonds
Global Bonds Cash
Global Corp HY
Asia ex-Japan EMD
-38.0% 28.3% 12.0% -2.8% 15.9% -1.4% 0.6% -3.2% 5.8% 7.4% 0.1% 0.9% 4.1% 8.9%DM
Equities EMDAsian Bonds
DM Equities
Asian Bonds
Global Bonds
Global Corp HY
Global Corp HY
Asia ex-Japan
Asian Bonds EMD EMD
Global Bonds
Asian Bonds
-40.3% 28.2% 10.6% -5.0% 14.3% -2.6% 0.2% -4.9% 5.8% 5.8% -0.2% 0.5% 3.1% 7.4%Asia ex-
JapanGlobal Bonds
Global Bonds
Asia ex-Japan
Global Bonds EMD Cash
Asia ex-Japan
Global Bonds U.S. REITs
Asian Bonds
Asian Bonds Cash
Global Bonds
-52.2% 6.9% 5.5% -17.1% 4.3% -6.6% 0.0% -8.9% 2.1% 5.1% -0.5% 0.4% 0.3% 2.7%EM ex-
Asia Cash CashEM ex-
Asia CashEM ex-
AsiaEM ex-
AsiaEM ex-
Asia Cash Cash U.S. REITs CashEM ex-
Asia Cash
-57.2% 0.1% 0.1% -21.2% 0.1% -8.5% -20.2% -22.7% 0.3% 0.8% -4.2% 0.3% -2.9% 0.1%
10-yrs ('08 - '17)
55
|GTM – Asia 14
14
Oth
er
asse
t cla
sses
'74 '76 '78 '80 '82 '84 '86 '88 '90 '92 '94 '96 '98 '00 '02 '04 '06 '08 '10 '12 '14 '16 '1870
80
90
100
110
120
130
Currencies
Currency deviation from 10-year average in real effective exchange rate* termsNumber of standard deviations away from average
U.S. dollar performanceU.S. Dollar Index (DXY)**Real trade-weighted exchange rate index (REER)*
1/2018: 89.1 1/2018: 93.0
FX above long-term average
FX belowlong-term average
CurrentMax
Min
Fed hiking cycle
Source: FactSet, J.P. Morgan Asset Management; (Top) Bloomberg Finance L.P., U.S. Federal Reserve; (Bottom) J.P. Morgan Economic Research.*The real trade-weighted exchange rate index is the weighted average of a country’s currency relative to a basket of other major currencies adjusted for the effects of inflation. The weights are determined by comparing the relative trade balances, in terms of one country’s currency, with other countries within the basket. **The Dollar Index is a trade-weighted index calculated using seven major U.S. trade partners’ currencies – Australian dollar, British pound, Canadian dollar, euro, Japanese yen, Swedish kroner and Swiss franc. Past performance is not a reliable indicator of current and future results.Guide to the Markets – Asia. Data reflect most recently available as of 31/1/18.
-2.2-1.5 -1.1 -1.1 -0.9 -0.9 -0.7 -0.6 -0.5 -0.5 -0.5 -0.1
0.8 1.0 1.2 1.4 1.5 1.71.0
-4
-2
0
2
4
59
15
J.P. Morgan Asset Management: Index DefinitionsAll indexes are unmanaged and an individual cannot invest directly in an index. Index returns do not include fees or expenses. The S&P 500 Index is widely regarded as the best single gauge of the U.S. equities market. This world-renowned index includes a representative sample of 500 leading companies in leading industries of the U.S. economy. Although the S&P 500 Index focuses on the large-cap segment of the market, with approximately 75% coverage of U.S. equities, it is also an ideal proxy for the total market. An investor cannot invest directly in an index. The Tokyo Stock Price Index ('TOPIX') is a composite index of all common stocks listed on the First Section of Tokyo Stock Exchange (TSE).The index is basically a measure of the changes in aggregate market value of TSE common stocks. The base for the index is the aggregate market value of its component stocks as of the close on January 4, 1968. The aggregate market value is calculated by multiplying the number of listed shares of each component stock by its price and totaling the products derived there from.The Bombay Exchange Sensitive Index (‘SENSEX), first compiled in 1986, was calculated on a "Market Capitalization-Weighted" methodology of 30 component stocks representing large, well-established and financially sound companies across key sectors. The base year of SENSEX was taken as 1978-79. SENSEX today is widely reported in both domestic and international markets through print as well as electronic media. It is scientifically designed and is based on globally accepted construction and review methodology. Since September 1, 2003, SENSEX is being calculated on a free-float market capitalization methodology.The Korea Composite Stock Price Index (‘KOSPI) is market capitalization based index on all common stocks listed on the Stock Market Division of the Korea Exchange (KRX) and excludes preferred stocks. The stock price index is calculated using the actual price traded on the market and not the “base price” used for market management such as establishment of price change limits. When no market price is available for issues that are not being traded or have halted trading, the latest closing price is used. KOSPI was a assigned a base index of 100 set to January 4, 1980.The China Shenzhen Composite Index is an actual market-cap weighted index that tracks the stock performance of all the A-share and B-share lists on Shenzhen Stock Exchange. The index was developed on April 3, 1991 with a base price of 100. The Euro Stoxx 600 Index represents large, mid and small capitalization companies across 18 European countries.The MSCI® EAFE (Europe, Australia, Far East) Net Index is recognized as the pre-eminent benchmark in the United States to measure international equity performance. It comprises 21 MSCI country indexes, representing the developed markets outside of North America. The MSCI Emerging Markets IndexSM is a free float-adjusted market capitalization index that is designed to measure equity market performance in the global emerging markets. As of June 2007, the MSCI Emerging Markets Index consisted of the following 25 emerging market country indices: Argentina, Brazil, Chile, China, Colombia, Czech Republic, Egypt, Hungary, India, Indonesia, Israel, Jordan, Korea, Malaysia, Mexico, Morocco, Pakistan, Peru, Philippines, Poland, Russia, South Africa, Taiwan, Thailand, and Turkey.The MSCI ACWI (All Country World Index) Index is a free float-adjusted market capitalization weighted index that is designed to measure the equity market performance of developed and emerging markets. As of June 2009 the MSCI ACWI consisted of 45 country indices comprising 23 developed and 22 emerging market country indices.The following MSCI Total Return IndicesSM are calculated with gross dividends:This series approximates the maximum possible dividend reinvestment. The amount reinvested is the dividend distributed to individuals resident in the country of the company, but does not include tax credits.The MSCI Europe IndexSM is a free float-adjusted market capitalization index that is designed to measure developed market equity performance in Europe. As of June 2007, the MSCI Europe Index consisted of the following 16 developed market country indices: Austria, Belgium, Denmark, Finland, France, Germany, Greece, Ireland, Italy, the Netherlands, Norway, Portugal, Spain, Sweden, Switzerland and the United Kingdom. The MSCI Pacific IndexSM is a free float-adjusted market capitalization index that is designed to measure equity market performance in the Pacific region. As of June 2007, the MSCI Pacific Index consisted of the following 5 Developed Market countries: Australia, Hong Kong, Japan, New Zealand, and Singapore.
The MSCI Europe ex UK IndexSM is a free float-adjusted market capitalization weighted index that is designed to measure the equity market performance of the developed markets in Europe, excluding the United Kingdom. The MSCI Europe ex UK Index consists of the following 15 developed market country indices: Austria, Belgium, Denmark, Finland, France, Germany, Greece, Ireland, Italy, the Netherlands, Norway, Portugal, Spain, Sweden, and Switzerland.The MSCI Pacific ex Japan IndexSM is a free float-adjusted market capitalization index that is designed to measure equity market performance in the Pacific region, excluding Japan. As of June 2007, the MSCI Pacific Index consisted of the following 4 Developed Market countries: Australia, Hong Kong, New Zealand, and Singapore. The MSCI USA IndexSM is designed to measure the performance of the large and mid cap segments of the U.S. market. With 586 constituents, the index covers approximately 84% of the free float-adjusted market capitalization in the U.S.. The MSCI USA Index was launched on Dec ember 31, 1969.The MSCI China IndexSM captures large and mid cap representation across China H shares, B shares, Red chips and P chips. With 148 constituents, the index covers about 84% of this China equity universe. The MSCI China Index was launched on December 31, 1992.The MSCI Indonesia IndexSM is designed to measure the performance of the large and mid cap segments of the Indonesian market. With 25 constituents, the index covers about 84% of the Indonesian equity universe. The MSCI Indonesia Index was launched on December 31, 1990.The MSCI Korea IndexSM is designed to measure the performance of the large and mid cap segments of the South Korean market. With 105 constituents, the index covers about 84% of the Korean equity universe. The MSCI Korea Index was launched on December 31, 1989.The MSCI India IndexSM is designed to measure the performance of the large and mid cap segments of the Indian market. With 71 constituents, the index covers about 84% of the Indian equity universe. The MSCI India Index was launched on December 31, 1993.The MSCI Japan IndexSM is designed to measure the performance of the large and mid cap segments of the Japan market. With 315 constituents, the index covers approximately 84% of the free float-adjusted market capitalization in Japan. The MSCI Japan Index was launched on December 31, 1969.The MSCI Hong Kong IndexSM is designed to measure the performance of the large and mid cap segments of the Hong Kong market. With 42 constituents, the index covers approximately 84% of the free float-adjusted market capitalization of the Hong Kong equity universe. The MSCI Hong Kong Index was launched on December 31, 1972.The MSCI Taiwan IndexSM is designed to measure the performance of the large and mid cap segments of the Taiwan market. With 113 constituents, the index covers approximately 84% of the free float-adjusted market capitalization in Taiwan. The MSCI Taiwan Index was launched on December 31, 1989.The MSCI Environmental, Social and Governance (ESG) Universal Indices are designed to address the needs of asset owners who may look to enhance their exposure to ESG while maintaining a broad and diversified universe to invest in. By re-weighting free-float market cap weights based upon certain ESG metrics tilting away from free-float market cap weights, the indices enhance exposure to those companies that demonstrate both a higher MSCI ESG Rating and a positive ESG trend, while maintaining a broad and diversified investment universe.
16
West Texas Intermediate (WTI) is the underlying commodity for the New York Mercantile Exchange's oil futures contracts. The Bloomberg Commodity Index is calculated on an excess return basis and reflects commodity futures price movements. The index rebalances annually weighted 2/3 by trading volume and 1/3 by world production and weight-caps are applied at the commodity, sector and group level for diversification. Roll period typically occurs from 6th-10th business day based on the roll schedule.The Bloomberg Commodity Subindexes represent commodity groups and sectors, as well as single commodities, that make up the Bloomberg Commodity Index. The subindexes track exchange-traded futures of physical commodities, and the commodity groups and sectors, like in the case of the broad index, are weighted to account for economic significance and market liquidity. The various subindexes include Agriculture, Energy, Livestock, Grains, Industrial Metals, Precious Metals and Softs.The Bloomberg Barclays High Yield Index covers the universe of fixed rate, non-investment grade debt. Pay-in-kind (PIK) bonds, Eurobonds, and debt issues from countries designated as emerging markets (e.g., Argentina, Brazil, Venezuela, etc.) are excluded, but Canadian and global bonds (SEC registered) of issuers in non-EMG countries are included. Original issue zeroes, step-up coupon structures, and 144-As are also included.The Bloomberg Barclays 1-3 Month U.S. Treasury Bill Index includes all publicly issued zero-coupon U.S. Treasury Bills that have a remaining maturity of less than 3 months and more than 1 month, are rated investment grade, and have $250 million or more of outstanding face value. In addition, the securities must be denominated in U.S. dollars and must be fixed rate and non convertible.The Bloomberg Barclays Corporate Bond Index is the Corporate component of the U.S. Credit index.The Bloomberg Barclays TIPS Index consists of Inflation-Protection securities issued by the U.S. Treasury.The J.P. Morgan EMBI Global Index includes U.S. dollar denominated Brady bonds, Eurobonds, traded loans and local market debt instruments issued by sovereign and quasi-sovereign entities.The J.P. Morgan GBI-EM Global Diversified consists of regularly traded, liquid fixed-rate, domestic currency government bonds to which international investors can gain exposure. The weightings among the countries are more evenly distributed within this index.The J.P. Morgan Corporate Emerging Markets Bond Index (CEMBI): The CEMBI tracks total returns of US dollar-denominated debt instruments issued by corporate entities in Emerging Markets countries, and consists of an investable universe of corporate bonds.The J.P. Morgan Domestic High Yield Index is designed to mirror the investable universe of the U.S. dollar domestic high yield corporate debt market.The VIX-CBOE Volatility Index measures market expectations of near-term volatility conveyed by S&P 500 Index (SPX) option prices. The MOVE-Merrill Lynch Option Volatility Index is a blended implied normal volatility for constant one-month at-the-money options on U.S. Treasuries.
Price to forward earnings is a measure of the price-to-earnings ratio (P/E) using forecasted earnings. Price to book value compares a stock's market value to its book value. Price to cash flow is a measure of the market's expectations of a firm's future financial health. Price to dividends is the ratio of the price of a share on a stock exchange to the dividends per share paid in the previous year, used as a measure of a company's potential as an investment.Bonds are subject to interest rate risks. Bond prices generally fall when interest rates rise.The price of equity securities may rise, or fall because of changes in the broad market or changes in a company’s financial condition, sometimes rapidly or unpredictably. These price movements may result from factors affecting individual companies, sectors or industries, or the securities market as a whole, such as changes in economic or political conditions. Equity securities are subject to “stock market risk” meaning that stock prices in general may decline over short or extended periods of time.Small-capitalization investing typically carries more risk than investing in well-established "blue-chip" companies since smaller companies generally have a higher risk of failure. Historically, smaller companies' stock has experienced a greater degree of market volatility than the average stock.Mid-capitalization investing typically carries more risk than investing in well-established "blue-chip" companies. Historically, mid-cap companies' stock has experienced a greater degree of market volatility than the average stock.Real estate investments may be subject to a higher degree of market risk because of concentration in a specific industry, sector or geographical sector. Real estate investments may be subject to risks including, but not limited to, declines in the value of real estate, risks related to general and economic conditions, changes in the value of the underlying property owned by the trust and defaults by borrower.International investing involves a greater degree of risk and increased volatility. Changes in currency exchange rates and differences in accounting and taxation policies can raise or lower returns. Also, some markets may not be as politically and economically stable as other nations. Investments in emerging markets can be more volatile. The normal risks of international investing are heightened when investing in emerging markets. In addition, the small size of securities markets and the low trading volume may lead to a lack of liquidity, which leads to increased volatility. Also, emerging markets may not provide adequate legal protection for private or foreign investment or private property.Investments in commodities may have greater volatility than investments in traditional securities, particularly if the instruments involve leverage. The value of commodity-linked derivative instruments may be affected by changes in overall market movements, commodity index volatility, changes in interest rates, or factors affecting a particular industry or commodity, such as drought, floods, weather, livestock disease, embargoes, tariffs and international economic, political and regulatory developments. Use of leveraged commodity-linked derivatives creates an opportunity for increased return but, at the same time, creates the possibility for greater loss.Derivatives may be riskier than other types of investments because they may be more sensitive to changes in economic or market conditions than other types of investments and could result in losses that significantly exceed the original investment. The use of derivatives may not be successful, resulting in investment losses, and the cost of such strategies may reduce investment returns.There is no guarantee that the use of long and short positions will succeed in limiting an investor's exposure to domestic stock market movements, capitalization, sector swings or other risk factors. Investing using long and short selling strategies may have higher portfolio turnover rates. Short selling involves certain risks, including additional costs associated with covering short positions and a possibility of unlimited loss on certain short sale positions.
J.P. Morgan Asset Management: Index Definitions, Risks and Disclosures
Monthly Market ReviewThe Market Insights program provides comprehensive data and commentary on global markets without reference to products. Designed as a tool to help clients understand the markets and support investment decision-making, the program explores the implications of current economic data and changing market conditions.
For the purposes of MiFID II, the JPM Market Insights and Portfolio Insights programmes are marketing communications and are not in scope for any MiFID II / MiFIR requirements specifically related to investment research. Furthermore, the J.P. Morgan Asset Management Market Insights and Portfolio Insights programmes, as non-independent research, have not been prepared in accordance with legal requirements designed to promote the independence of investment research, nor are they subject to any prohibition on dealing ahead of the dissemination of investment research.
This document is a general communication being provided for informational purposes only. It is educational in nature and not designed to be taken as advice or a recommendation for any specific investment product, strategy, plan feature or other purpose in any jurisdiction, nor is it a commitment from J.P. Morgan Asset Management or any of its subsidiaries to participate in any of the transactions mentioned herein. Any examples used are generic, hypothetical and for illustration purposes only. This material does not contain sufficient information to support an investment decision and it should not be relied upon by you in evaluating the merits of investing in any securities or products. In addition, users should make an independent assessment of the legal, regulatory, tax, credit, and accounting implications and determine, together with their own professional advisers, if any investment mentioned herein is believed to be suitable to their personal goals. Investors should ensure that they obtain all available relevant information before making any investment. Any forecasts, figures, opinions or investment techniques and strategies set out are for information purposes only, based on certain assumptions and current market conditions and are subject to change without prior notice. All information presented herein is considered to be accurate at the time of production, but no warranty of accuracy is given and no liability in respect of any error or omission is accepted. It should be noted that investment involves risks, the value of investments and the income from them may fluctuate in accordance with market conditions and taxation agreements and investors may not get back the full amount invested. Both past performance and yields are not a reliable indicator of current and future results.
J.P. Morgan Asset Management is the brand for the asset management business of JPMorgan Chase & Co. and its affiliates worldwide. This communication is issued by the following entities: in theUnited Kingdom by JPMorgan Asset Management (UK) Limited, which is authorized and regulated by the Financial Conduct Authority; in other European jurisdictions by JPMorgan Asset Management(Europe) S.à r.l.; in Hong Kong by JF Asset Management Limited, or JPMorgan Funds (Asia) Limited, or JPMorgan Asset Management Real Assets (Asia) Limited; in Singapore by JPMorgan Asset Management (Singapore) Limited (Co. Reg. No. 197601586K), or JPMorgan Asset Management Real Assets (Singapore) Pte Ltd (Co. Reg. No. 201120355E); in Taiwan by JPMorgan Asset Management (Taiwan) Limited; in Japan by JPMorgan Asset Management (Japan) Limited which is a member of the Investment Trusts Association, Japan, the Japan Investment Advisers Association, Type II Financial Instruments Firms Association and the Japan Securities Dealers Association and is regulated by the Financial Services Agency (registration number “Kanto Local Finance Bureau (Financial Instruments Firm) No. 330”); in Korea by JPMorgan Asset Management (Korea) Company Limited; in Australia to wholesale clients only as defined in section 761A and 761G of the Corporations Act 2001 (Cth) by JPMorgan Asset Management (Australia) Limited (ABN 55143832080) (AFSL 376919); in Brazil by Banco J.P. Morgan S.A.; in Canada for institutional clients’ use only by JPMorgan Asset Management (Canada) Inc., and in the United States by JPMorgan Distribution Services Inc. and J.P. Morgan Institutional Investments, Inc., both members of FINRA/SIPC.; and J.P. Morgan Investment Management Inc.
In APAC, distribution is for Hong Kong, Taiwan, Japan and Singapore. For all other countries in APAC, to intended recipients only.
Copyright 2018 JPMorgan Chase & Co. All rights reserved.
Material ID: 0903c02a8206cfc0
Asia Pacific | February 2018


