Monitoring Animal Welfare at Dutch dairy farms
Gerrit Hegen
Veterinarian, herd health advisor
www.deboerenveearts.nl
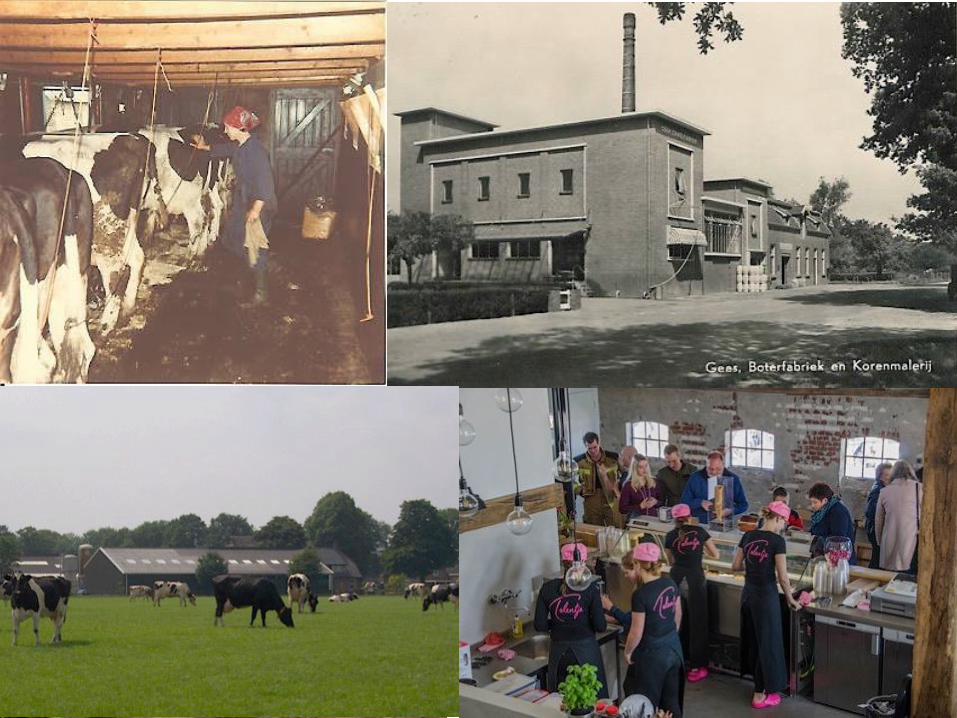
A brief history….
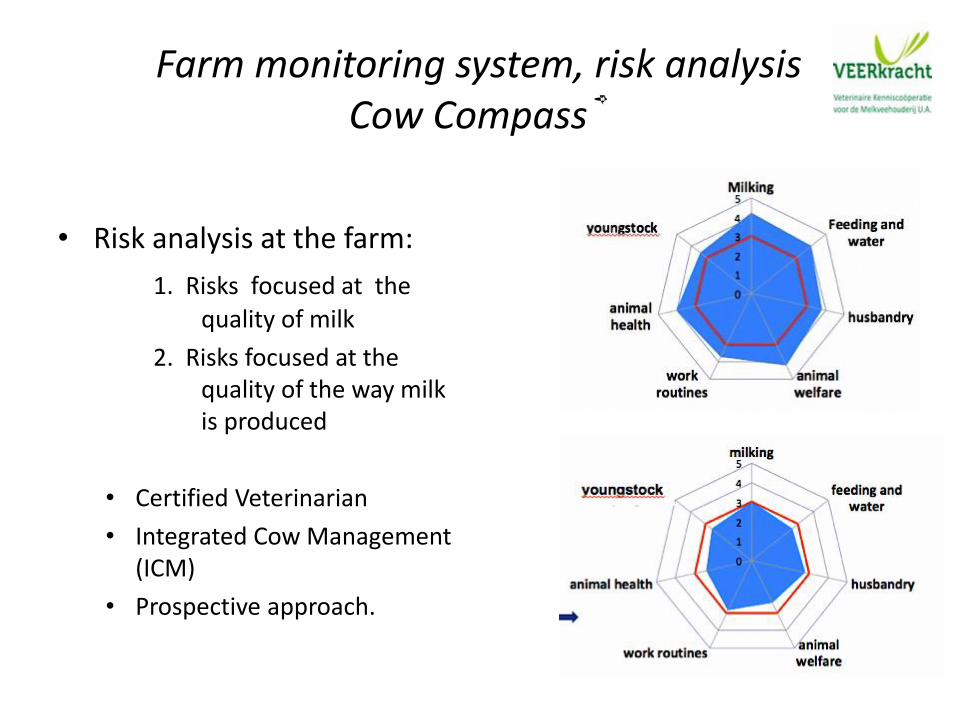
Farm monitoring system, risk analysisCow Compass®
• Risk analysis at the farm:
1. Risks focused at the
quality of milk
2. Risks focused at the quality of the way milk is produced
• Certified Veterinarian
• Integrated Cow Management (ICM)
• Prospective approach.
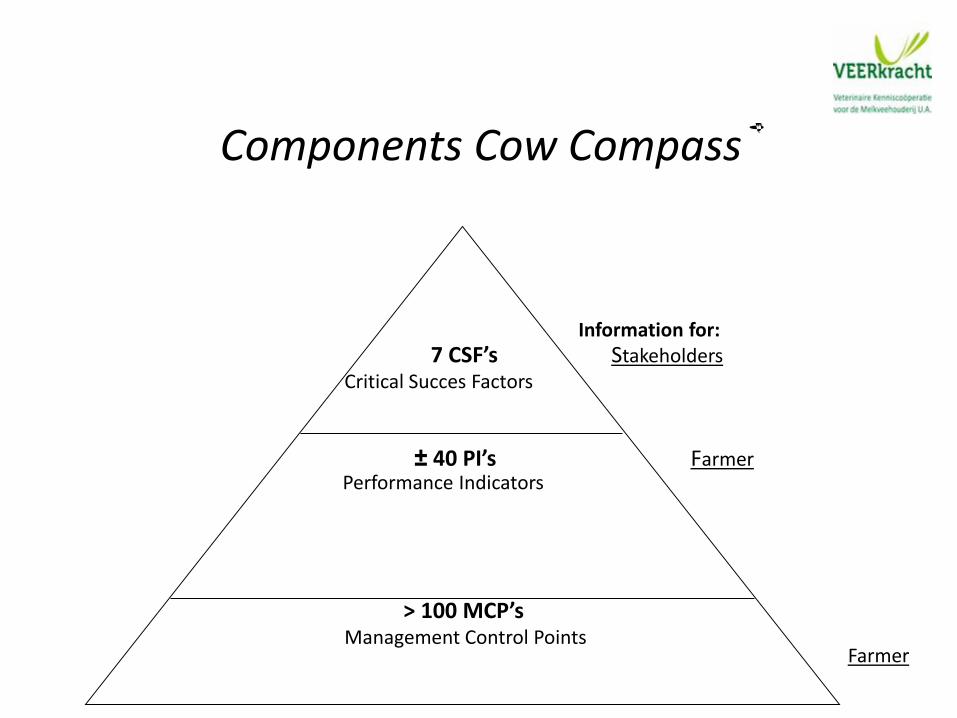
Components Cow Compass®
Information for:7 CSF’s Stakeholders
Critical Succes Factors
± 40 PI’s FarmerPerformance Indicators
> 100 MCP’sManagement Control Points
Farmer
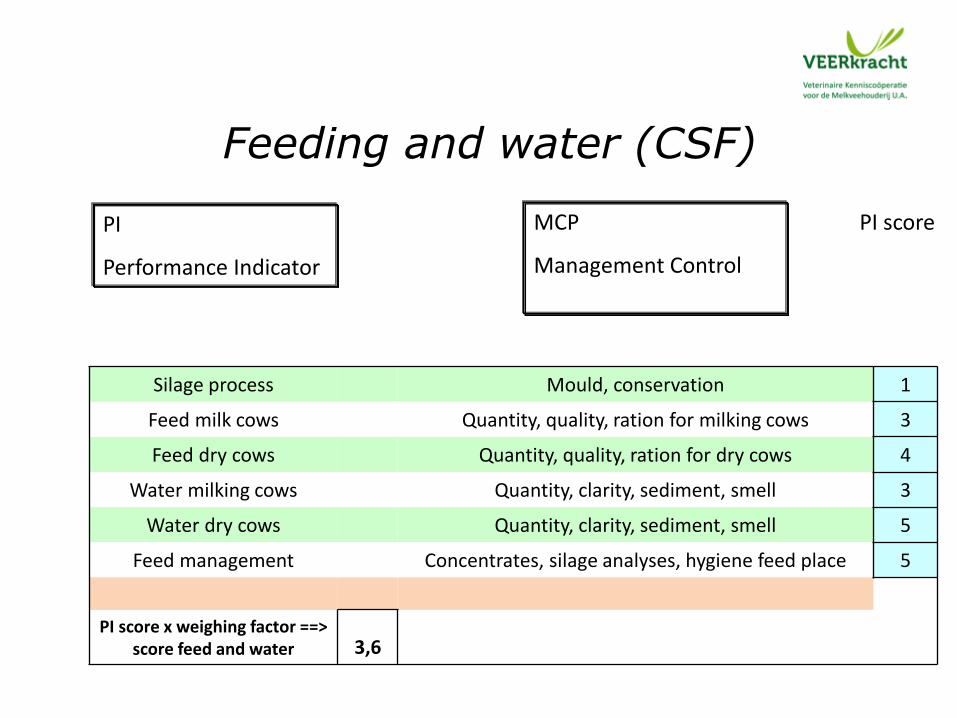
Feeding and water (CSF)
PI
Performance Indicator
MCP
Management Control Point
Silage process Mould, conservation 1
Feed milk cows Quantity, quality, ration for milking cows 3
Feed dry cows Quantity, quality, ration for dry cows 4
Water milking cows Quantity, clarity, sediment, smell 3
Water dry cows Quantity, clarity, sediment, smell 5
Feed management Concentrates, silage analyses, hygiene feed place 5
PI score x weighing factor ==> score feed and water 3,6
PI score
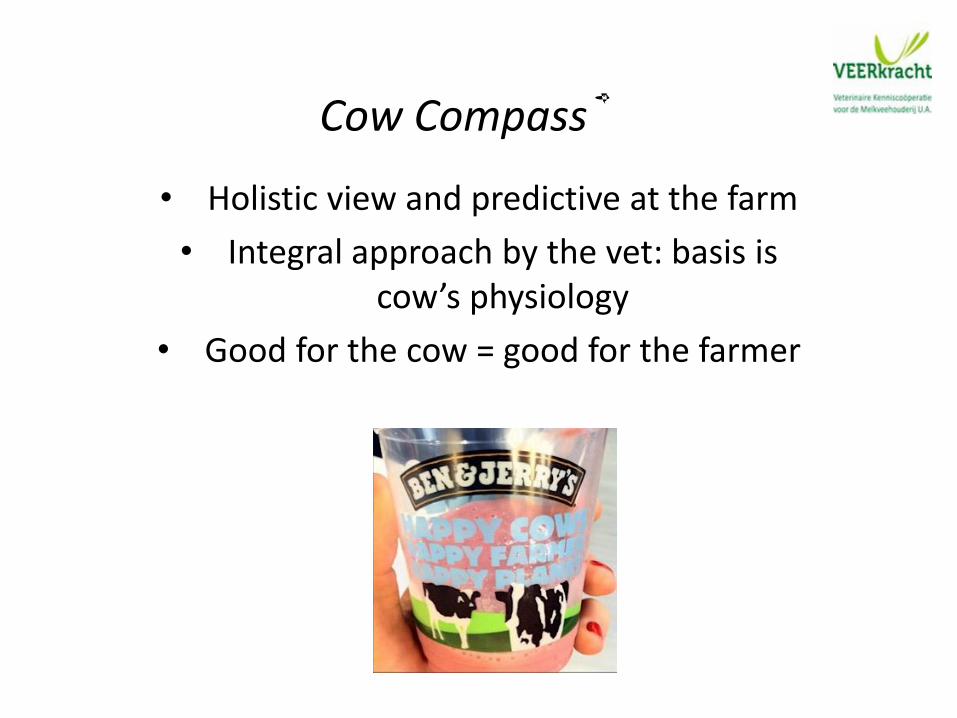
Cow Compass®
• Holistic view and predictive at the farm
• Integral approach by the vet: basis is cow’s physiology
• Good for the cow = good for the farmer
Cows Compass®
• 354 trained (ICM) veterinarians are doing this job
• 2 audits per year (2 x 3 hours per 120 cow farm)
• 2730 participating dairy farms (16%)
• Part of delivery terms of Dutch dairy industry
2017:
Cows Compass®-Welfare Monitor
The aim of developinga Welfare Monitor
• A practical system to show animal welfare on dairy farms
• Basis is Welfare Quality (“gold standard”), but time spending, not enough distinction between farms
• That’s why the sector, in coöperation with the government and the Dutch welfare protectingorganisation, initiated a Welfare Monitor
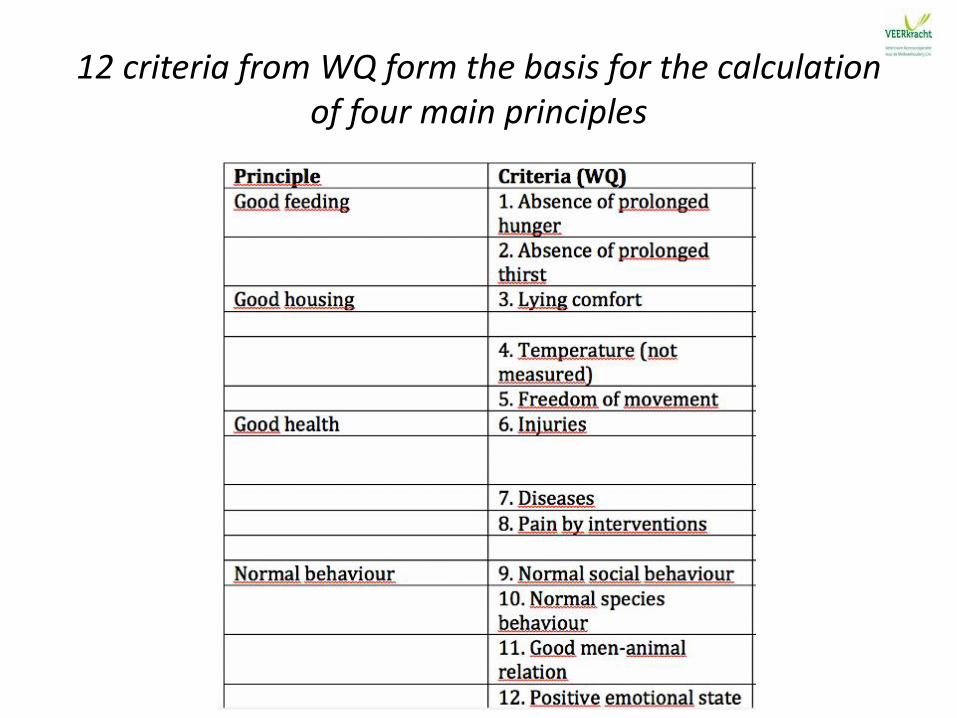
12 criteria from WQ form the basis for the calculationof four main principles
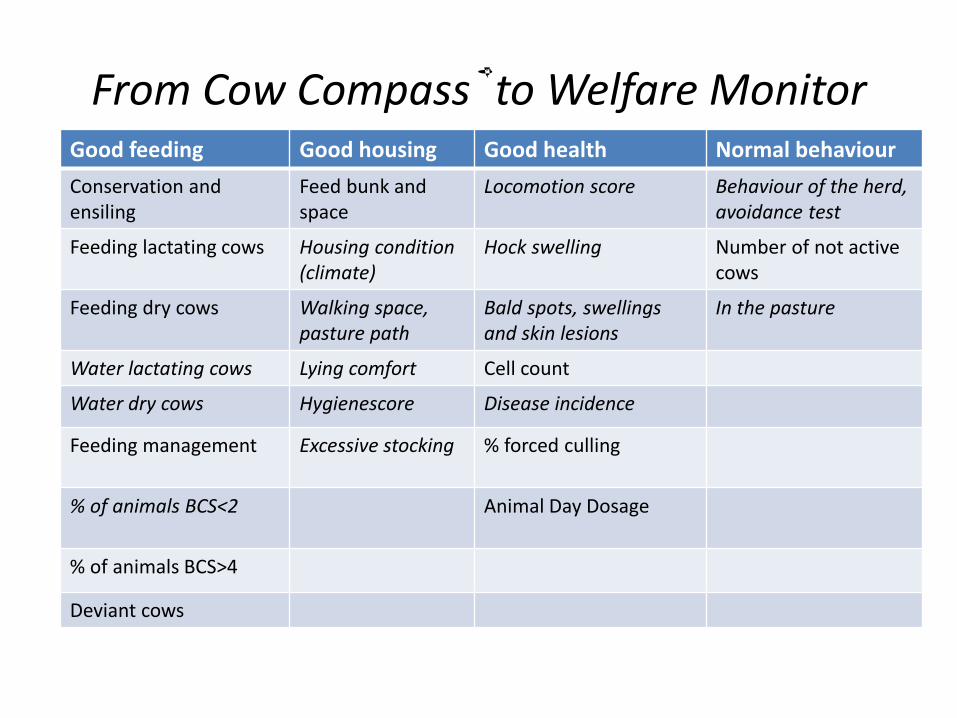
From Cow Compass®to Welfare MonitorGood feeding Good housing Good health Normal behaviour
Conservation andensiling
Feed bunk andspace
Locomotion score Behaviour of the herd, avoidance test
Feeding lactating cows Housing condition(climate)
Hock swelling Number of not activecows
Feeding dry cows Walking space, pasture path
Bald spots, swellingsand skin lesions
In the pasture
Water lactating cows Lying comfort Cell count
Water dry cows Hygienescore Disease incidence
Feeding management Excessive stocking % forced culling
% of animals BCS<2 Animal Day Dosage
% of animals BCS>4
Deviant cows
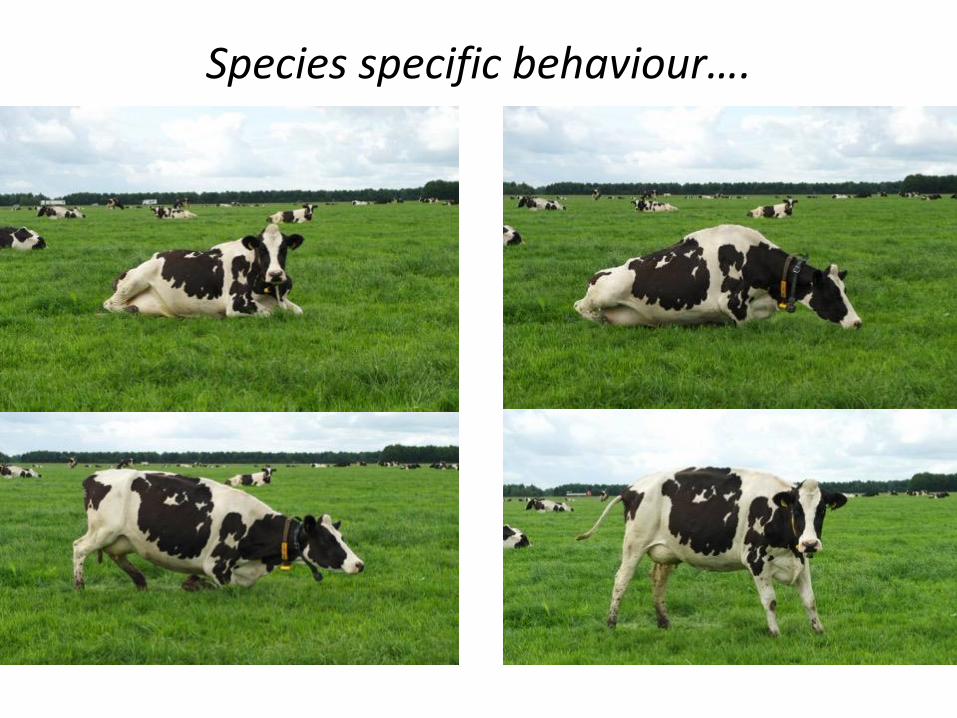
Species specific behaviour….
Marten KnolMelkveehouderij 't Eyland
from Kampen (The Netherlands)
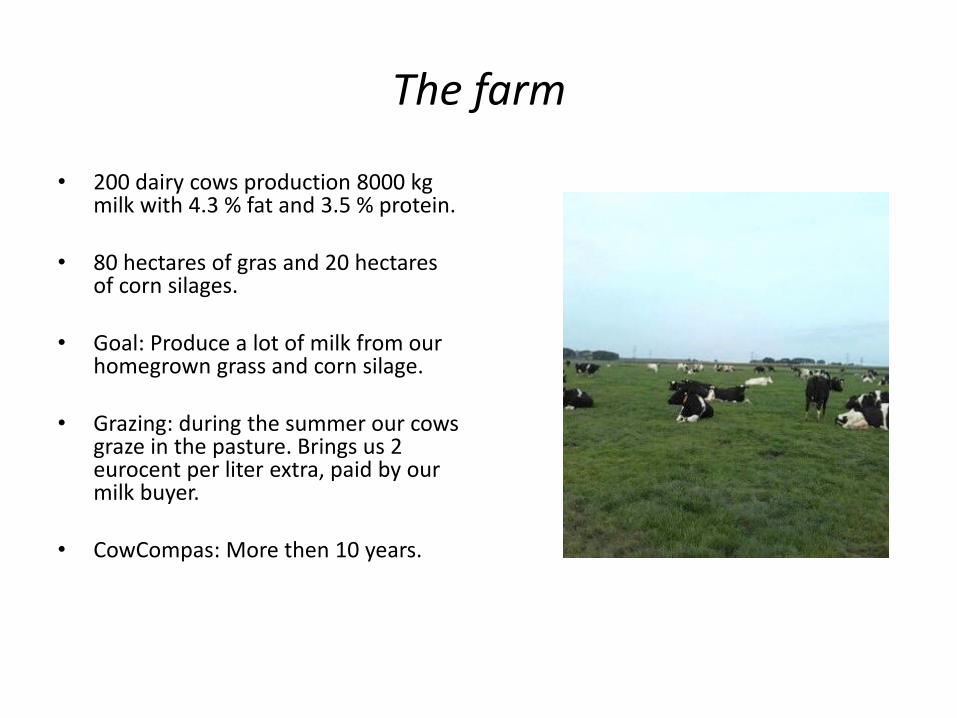
The farm
• 200 dairy cows production 8000 kg milk with 4.3 % fat and 3.5 % protein.
• 80 hectares of gras and 20 hectares of corn silages.
• Goal: Produce a lot of milk from ourhomegrown grass and corn silage.
• Grazing: during the summer our cowsgraze in the pasture. Brings us 2 eurocent per liter extra, paid by ourmilk buyer.
• CowCompas: More then 10 years.
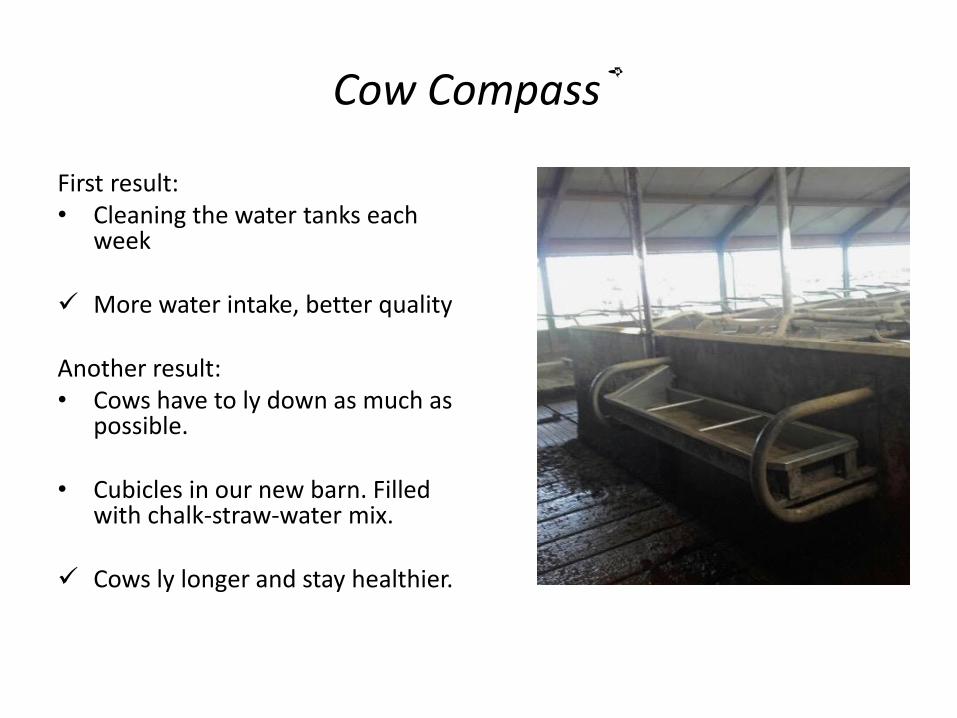
Cow Compass®
First result:• Cleaning the water tanks each
week
More water intake, better quality
Another result:• Cows have to ly down as much as
possible.
• Cubicles in our new barn. Filledwith chalk-straw-water mix.
Cows ly longer and stay healthier.
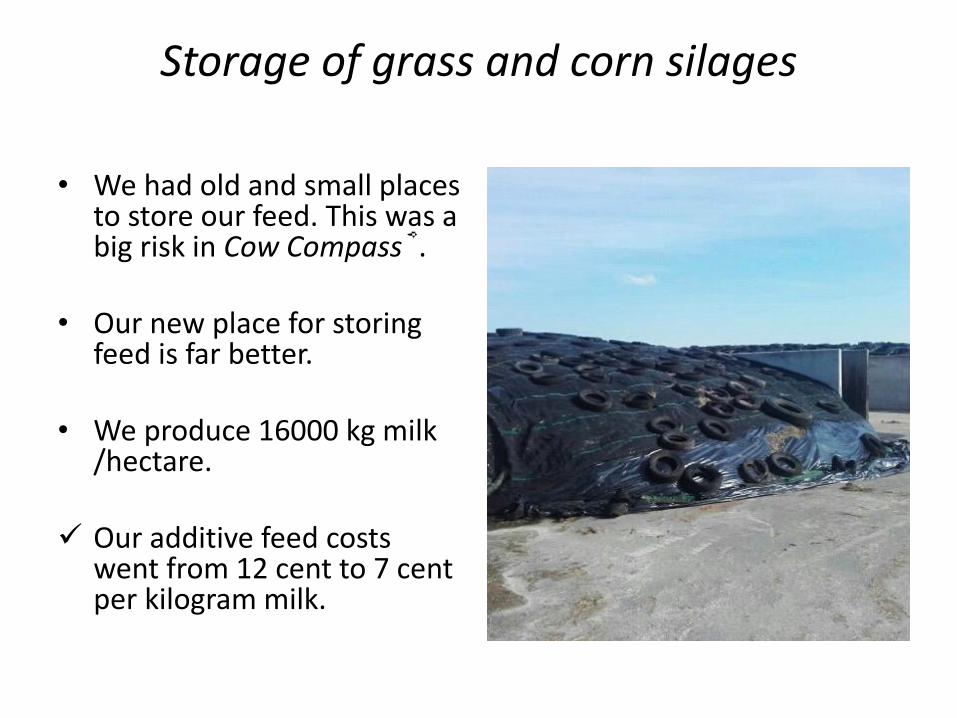
Storage of grass and corn silages
• We had old and small placesto store our feed. This was a big risk in Cow Compass®.
• Our new place for storing feed is far better.
• We produce 16000 kg milk/hectare.
Our additive feed costswent from 12 cent to 7 cent per kilogram milk.
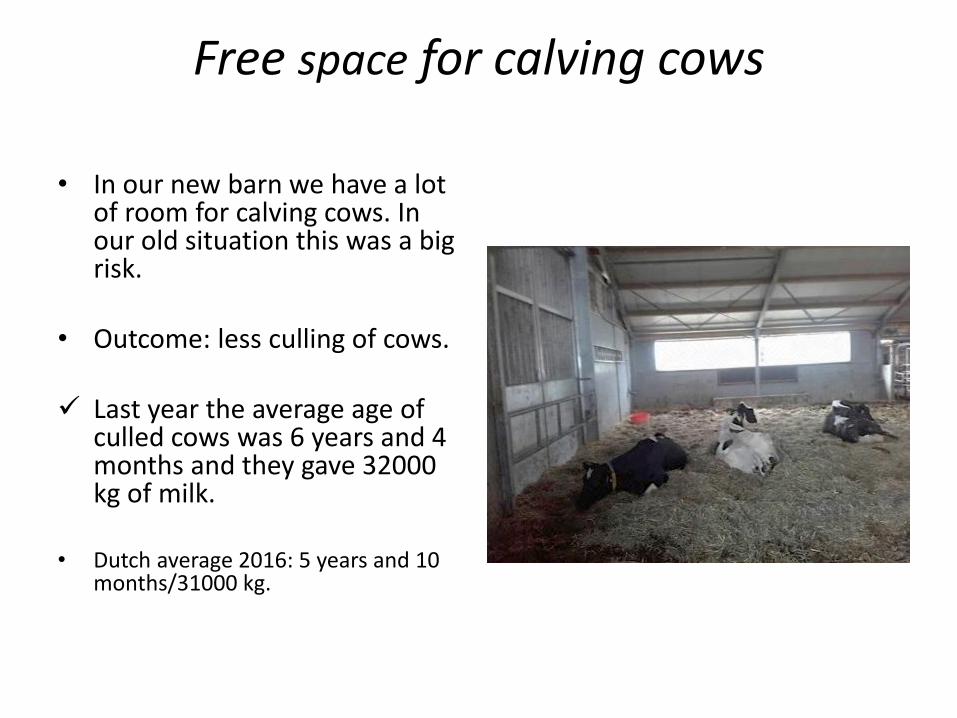
Free space for calving cows
• In our new barn we have a lot of room for calving cows. In our old situation this was a big risk.
• Outcome: less culling of cows.
Last year the average age of culled cows was 6 years and 4 months and they gave 32000 kg of milk.
• Dutch average 2016: 5 years and 10 months/31000 kg.
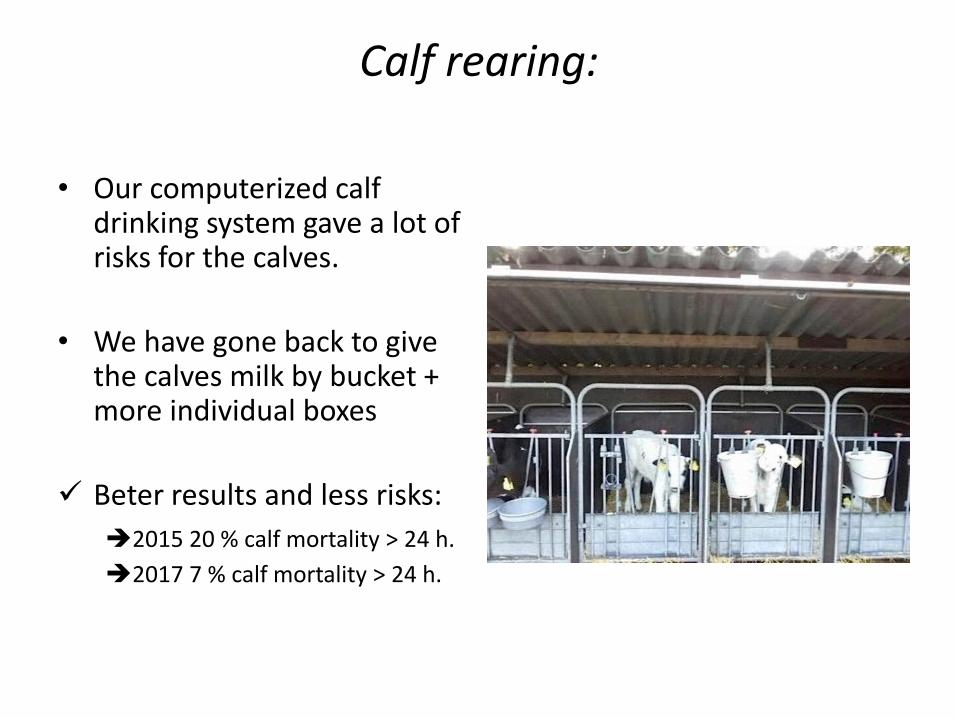
Calf rearing:
• Our computerized calfdrinking system gave a lot of risks for the calves.
• We have gone back to givethe calves milk by bucket + more individual boxes
Beter results and less risks:
2015 20 % calf mortality > 24 h.
2017 7 % calf mortality > 24 h.
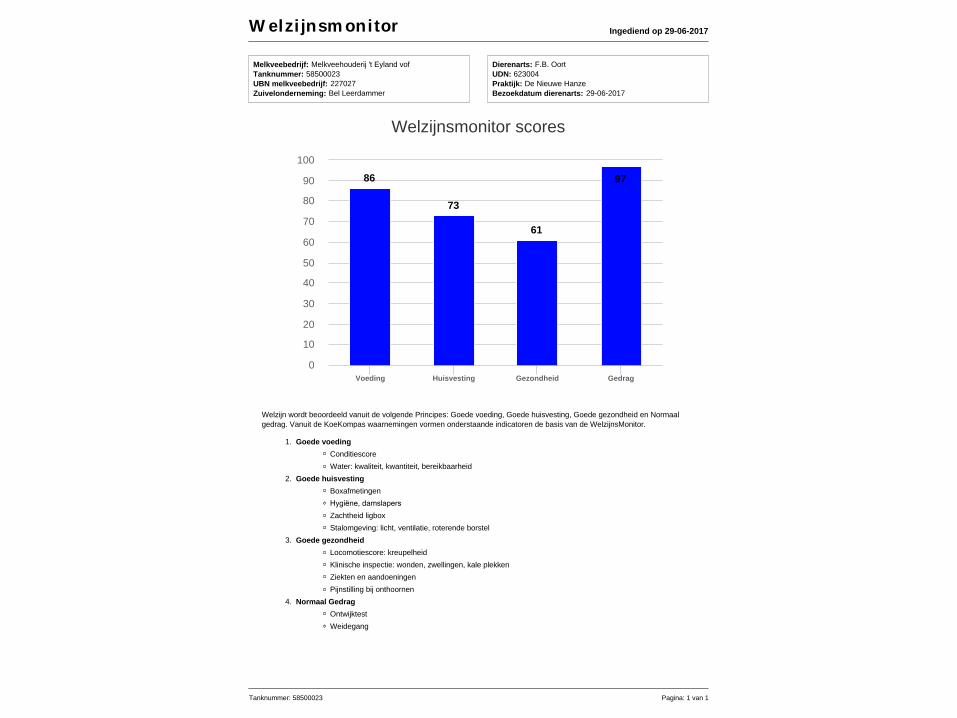
W elzi jnsm onitor Ingediend op 29-06-2017
Melkveebedrijf: Melkveehouderij 't Eyland vof
Tanknummer: 58500023
UBN melkveebedrijf: 227027
Zuivelonderneming: Bel Leerdammer
Dierenarts: F.B. Oort
UDN: 623004
Praktijk: De Nieuwe Hanze
Bezoekdatum dierenarts: 29-06-2017
Welzijnsmonitor scores
86
73
61
97
Voeding Huisvesting Gezondheid Gedrag
0
10
20
30
40
50
60
70
80
90
100
Highcharts.com
Welzijn wordt beoordeeld vanuit de volgende Principes: Goede voeding, Goede huisvesting, Goede gezondheid en Normaal
gedrag. Vanuit de KoeKompas waarnemingen vormen onderstaande indicatoren de basis van de WelzijnsMonitor.
1. Goede voeding
Conditiescore
Water: kwaliteit, kwantiteit, bereikbaarheid
2. Goede huisvesting
Boxafmetingen
Hygiëne, damslapers
Zachtheid ligbox
Stalomgeving: licht, ventilatie, roterende borstel
3. Goede gezondheid
Locomotiescore: kreupelheid
Klinische inspectie: wonden, zwellingen, kale plekken
Ziekten en aandoeningen
Pijnstilling bij onthoornen
4. Normaal Gedrag
Ontwijktest
Weidegang
Tanknummer: 58500023 Pagina: 1 van 1
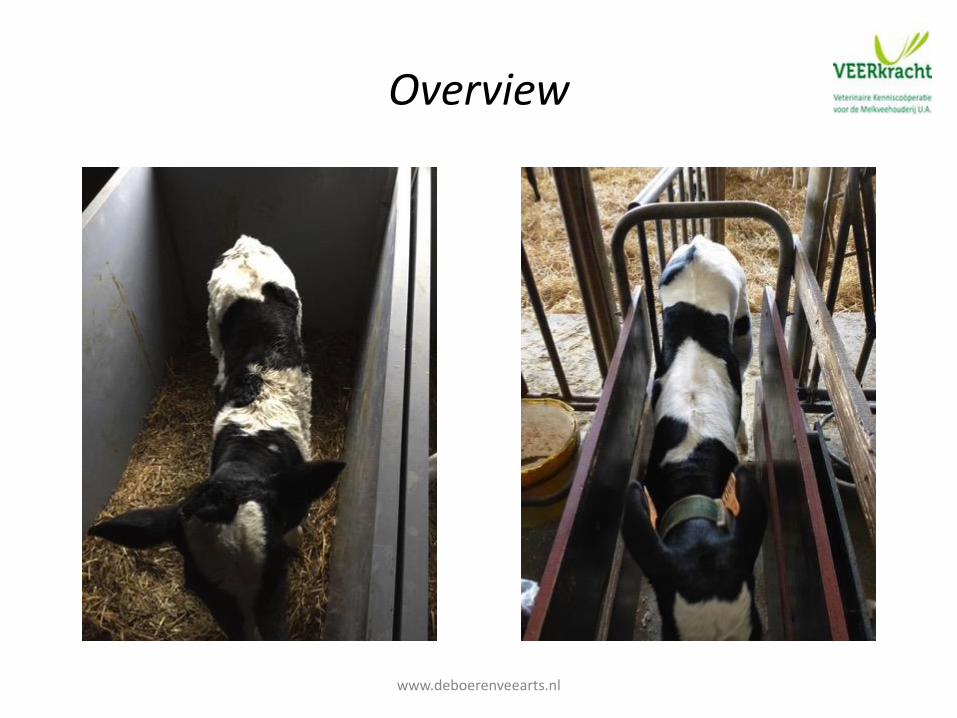
Overview
www.deboerenveearts.nl
Cows Compass®/Welfare monitor: PDCA appraoch
• Ideal zero measurement
• Starting point of choosing andimplementation of improvement-management
• Co-operation with other farm advisors
• Good evaluation andactualisation of risk factors
• Critical succesfactor: f o l l o w u p
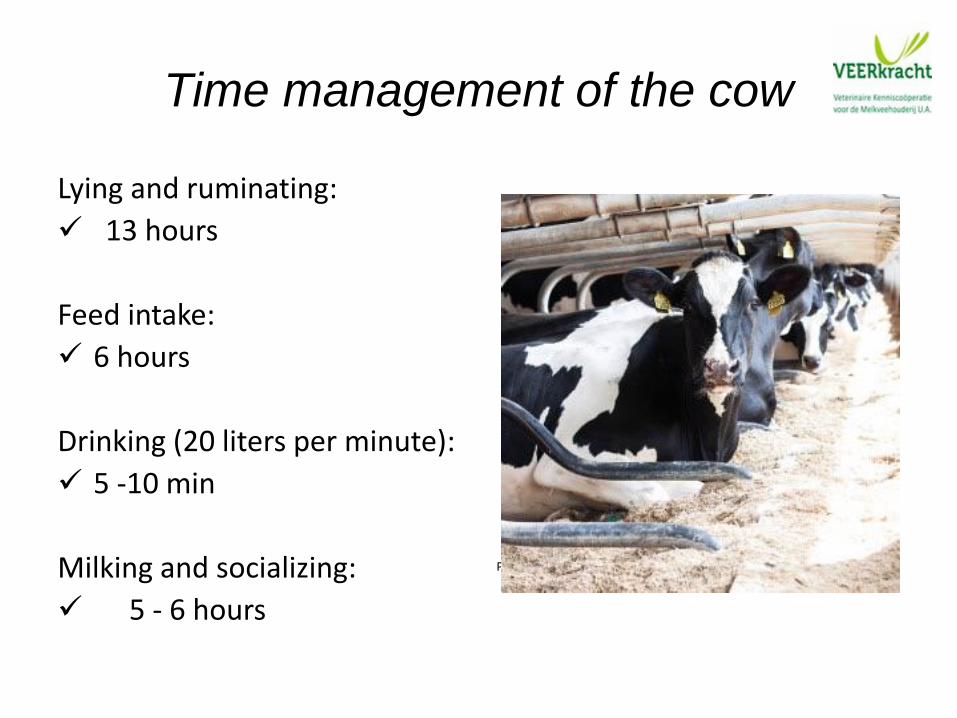
Time management of the cow
Lying and ruminating:
13 hours
Feed intake:
6 hours
Drinking (20 liters per minute):
5 -10 min
Milking and socializing:
5 - 6 hours
Photo: Harald Wiltink
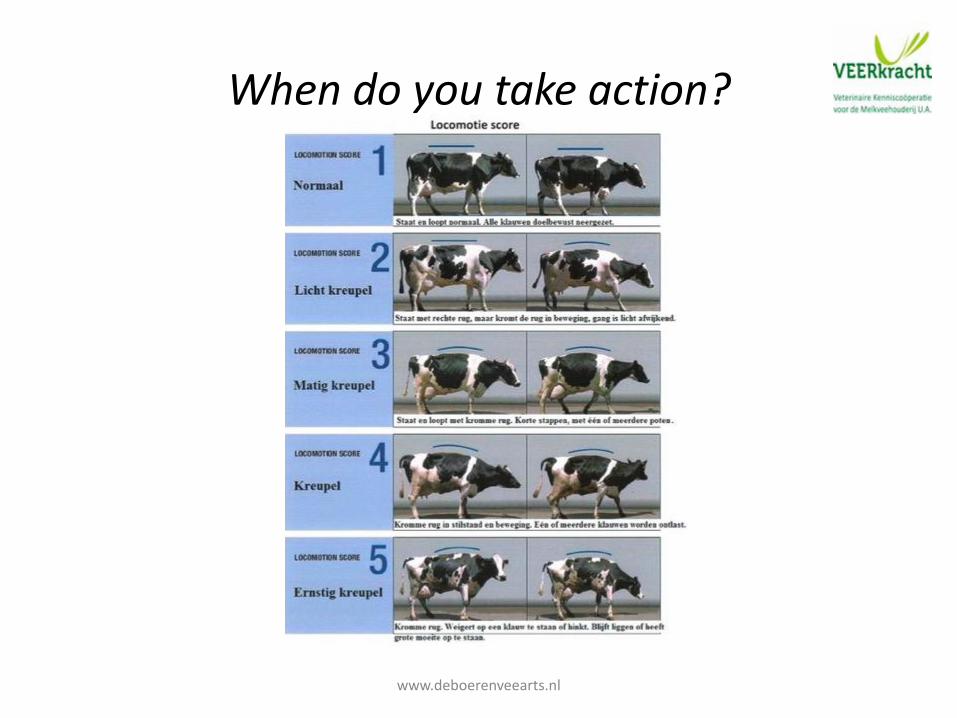
When do you take action?
www.deboerenveearts.nl
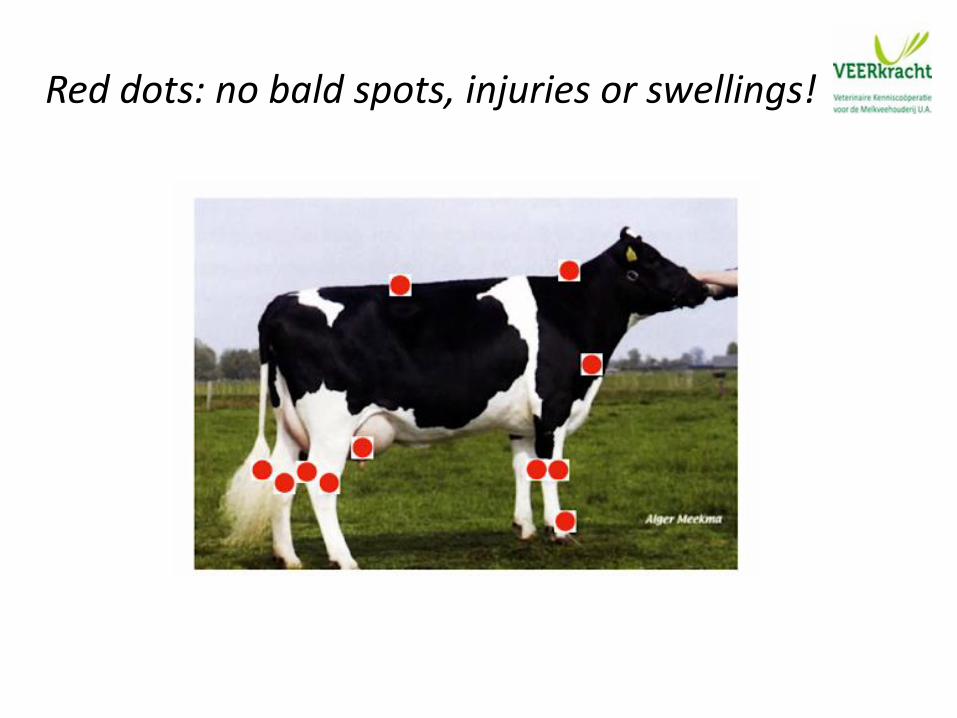
Red dots: no bald spots, injuries or swellings!
Conclusions
• Certified vets carry out Cow Compass®
• Takes 1,5 hours/120 cow farm plus 1,5 hours for filling in a software program and to write report, totally 3 hours
• Welfare Monitor calculated from the Cow Compass® score
• Results are aggregated and used by the Dutch Dairy Chain to show animal welfare of dairy farms to stakeholders
• In favour for the farmer: it can be used as a screening tool to detectwelfare problems and lead to improvement/optimalisation
Come and see!
Foto: Josef Berchthold


