Contents lists available at ScienceDirect
International Journal of Disaster Risk Reduction
International Journal of Disaster Risk Reduction ] (]]]]) ]]]–]]]
2212-42http://d
n Corrfax: þ8
E-m
PleasJourn
journal homepage: www.elsevier.com/locate/ijdrr
Modelling impact of agro-drought on grain productionin China
Zhihao Qin a,b,n, Huajun Tang a, Wenjuan Li a, Hao Zhang c, Shuhe Zhao b,Qiang Wang d
a Institute of Agro-Resources and Regional Planning, Chinese Academy of Agricultural Sciences, Beijing 100081, Chinab International Institute for Earth System Science, Nanjing University, Nanjing 210093, Chinac Department of Statistics, Purdue University, West Lafayette, IN 47907, USAd University of International Business and Economics, Beijing 100029, China
a r t i c l e i n f o
Article history:Received 19 December 2012Received in revised form3 September 2013Accepted 3 September 2013
Keywords:Agro-droughtFood securityGrain productionClimate changeModelling
09/$ - see front matter & 2013 Elsevier Ltd.x.doi.org/10.1016/j.ijdrr.2013.09.002
esponding author. Tel.: þ86 1082106235, þ6 1082106225, þ86 10 68975161.ail addresses: [email protected], qinzhihao
e cite this article as: Qin Z, et al.al of Disaster Risk Reduction (2013
a b s t r a c t
Agro-drought is a powerful natural force shaping significant impacts on food security in acountry like China with huge population and relatively limited cropland resources.Quantitatively modelling the relationship between agro-drought and Chinese grainproduction had not been reported in scientific literature. In this paper we developed anapplicable approach to model the impact of agro-drought on grain production in Chinausing the statistical data on agro-drought at various levels of severity. Our hypothesis wasthat grain production in China should be higher than the actual one shown in statisticalyearbooks for the same cropping structure and farming inputs if there was no drought. Totest the hypothesis, a modelling procedure to link agro-drought at various levels withgrain production had been established at provincial level of China. Statistical data on agro-drought and grain production with consideration of cropping structure were used for themodelling. Our results indicated that the impact was very obvious. Each year �24 Mha(million hectares) of cropping land in China were under drought attacks at various levels.Average drought intensity defined as ratio of grain acreage under drought attacks to totalgrain acreage was 13% during 1990–2011 taking moderate attack as a unity, which isdefined as grain loss of �45% under drought attack according to statistics system in China.Annual loss of grain production as a result of drought attacks was �26 Mt (million tons),shaping an impact of 5.2% to grain production in China. The loss is almost equal to thetotal grain production of such a big grain producer as Hebei, Jilin or Hunan in Chinaand can feed �75 million people. Spatially intensive impacts of agro-drought on grainproduction were observed in northeastern, northwestern and southwestern provinces,where drought intensity was higher than 15% and the impact was over 6%. Our studyreveals that food security of China under drought attacks is with a probability of above92% and grain storage of �20 Mt is required for China to minimize the threat of droughtattacks on its food security. This significant impact of agro-drought on grain productionmight suggest the risk for Chinese food security that needs to be globally concerned undercircumstance of climate change.
& 2013 Elsevier Ltd. All rights reserved.
All rights reserved.
86 10 68975171;
@caas.cn (Z. Qin).
Modelling impact of agro-drought on grain production in China. International), http://dx.doi.org/10.1016/j.ijdrr.2013.09.002i
Z. Qin et al. / International Journal of Disaster Risk Reduction ] (]]]]) ]]]–]]]2
1. Introduction
Climate change has significant impacts on agriculture[15,4,26,19] hence on food security [25,3]. One of theimpacts is through drought [34,17]. Climate change doesnot only lead to warming or cooling of the atmosphere butalso result in occurrence of extreme climate events such asdrought. It has been observed that many severe droughtswere caused by anomaly of atmospheric dynamics drivenby climate change [13,9,28].
Drought as a result of climatic anomaly has obviouseffect on grain production in China [14] which has vastterritory, diverse terrains and complicated climate [32,22].The effect is not only economical but also environmental.Economically drought decreases the productivity of crop-land to threaten food security [27,16] in a country likeChina with huge population and relatively limited crop-land resources [12,32,23]. Environmentally water shortageand high temperature as a result of drought could alter soilfertility fundamental to grain farming [1,6]. Each yearseveral severe drought events occur in various parts ofChina to shape significant impact on food security of thecountry [36]. In 2010 severe drought occurred in south-west China especially in Yunnan Province. In 2011 thedrought-effected region extended from southwest Chinato middle Yangtze River basin of the country. In 2012severe drought occurred in both northwest and southwestChina and in 2013 very severe drought was observed inwinter-wheat growing region of north China. Quantitativeanalysis of the impact could provide essential data fordecision-making to propose anti-drought measures forfood security and environmental sustainability [17].
Relationship between drought and agriculture was aclassical topic for scientific studies, which mainly focusedon drought monitoring and production estimation usingremote sensing, ecosystemmodelling, and statistical analysis[8,2]. Potential impact of global change on food supply andprice was examined in Rosenzweig and Parry [19] using acompatible crop model. Drought monitor developed bySvoboda et al. [24] began a new era of drought monitoringacross North America [11]. In recent decades several droughtindices were proposed for remote sensing of drought andseveral monitoring systems had been developed for localapplication [20,17]. An approach had been developed in Qinet al. [18] to retrieve land surface temperature from MODIS
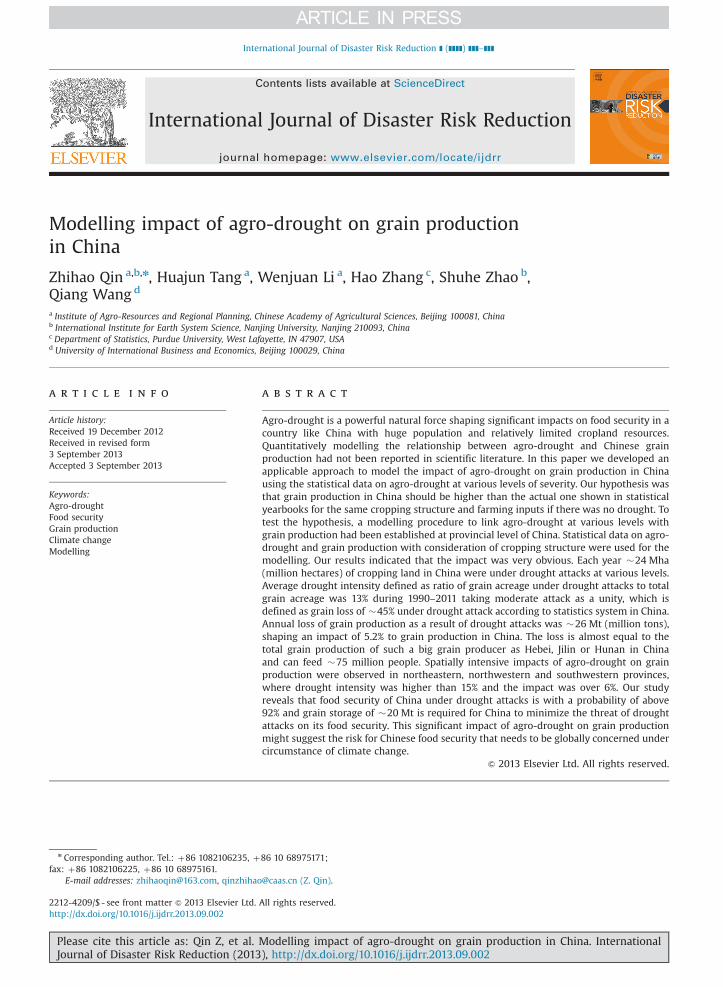
Fig. 1. Mechanism linking agro-d
Please cite this article as: Qin Z, et al. Modelling impact of aJournal of Disaster Risk Reduction (2013), http://dx.doi.org/10.
satellite data for drought monitoring in China. Gao et al., [7]proposed a practical method for remote sensing monitoringof drought severity and validated it through applying toGuangdong Province in south China. Jayanthi et al. [10] usedthe standardized precipitation index from satellite estimatedrainfall to model the drought risk in southern Malawi. Zhou[37] examined valuation of economic loss caused by droughtand estimated the loss to be 7.1–11.8 billion RMB in early1990s. Using an interpolation approach, Zhang [35] esti-mated the potential food loss due to drought during 1980–1997 in Fujian Province of China. Wu et al. [29] proposed amodel to assessment of agricultural drought risk for cornand soybeans in northeast China. Zheng and Huang [36]developed a statistical model to estimated drought-inducedgrain production loss in China and reported that averageannual loss of grain production for the period of 1950–1990was 33,800 Mt (million ton) in China. Recent data on grainproduction loss induced by drought attack and its impact onfood security in China had not been reported.
In this study we intended to quantify drought's impacton grain production in China during the last 22 years, i.e.1990–2011. Our hypothesis was that each year grain pro-duction in China should be greater than actual output forthe same cropping structure and farming inputs if there wasno drought happening. To test the hypothesis, we devel-oped an approach to link grain production with the statisticdata of drought areas at various levels in China. Afterdescribing the approach for quantitative analysis of theimpact, we presented the preliminary results from ouranalysis in Section 3 and gave a brief conclusion inSection 4.
2. Methodology
The approach for the study was a modelling procedureon the basis of the mechanism linking agro-drought withfood security (Fig. 1) using the available data on drought,cropping, and grain production from statistics. Discussionof the available data and the models for the simulation wasthus very necessary.
2.1. Chinese statistics on agro-drought
To reveal the impacts of agro-drought on food security,we had to know the available statistical data on agro-
rought with food security.
gro-drought on grain production in China. International1016/j.ijdrr.2013.09.002i
Z. Qin et al. / International Journal of Disaster Risk Reduction ] (]]]]) ]]]–]]] 3
drought events in China. Since natural hazards includingflood, drought, icy rain, and so on occurred frequently eachyear to attack agriculture hence shape important impactson harvest in China [12,22], high concerns had been givento the statistics of these hazards in Chinese administrationat various levels. Detailed data on the acreage of variousnatural hazards at three levels of severity could beobtained from Chinese statistics yearbooks. The followingthree levels were used in Chinese statistics to indicate themagnitude of drought attack: severe, moderate and slight.Severe drought attack was defined as the very arid condi-tion occurring on cropping regions, which was resultedfrom very few rainfalls for a long term during the croppingseason, hence led to obvious loss of grain production.Statistically the attacks were accounted as acreage underdrought in grain croplands with general loss of above 70%to potential productivity defined as normal yield in thelocality. Similarly, moderate drought attack was accountedas the acreage of grain production with general loss ofabove 30%, and slight attack with loss of above 10%. Thusthe production with general loss of below 10% to potentialproductivity was statistically defined as the normal fluc-tuation of grain farming due to annual climate variationbut not drought attack.
As we known, accurate measurement of the productionloss as a result of drought attacks was generally impossiblefor statistics due to many difficulties in the real world.Instead, the acreage data on various levels of droughtseverity in statistics yearbooks in China were usuallyreported from local agricultural administrations accordingto their rough estimation on the basis of experiences. Theestimation was done by local experts or officials onagricultural administration. Generally they did not directlymeasure the area suffering drought. Instead, they esti-mated the acreage under drought attack according to theirexperiences obtained from their working for years on thelocality. Consequently the statistical data on drought fromstatistics yearbooks of China might not be accurate [23].When the attack of drought happened in a region, the localagricultural administrations reported the statistical acre-age of drought. Sometimes such report was also affectedby the relevant government policies on anti-drought andgrain production. For example, the local administrationsmight tend to enlarge the drought acreage and severity intheir report of drought attack in order to obtain morefunding supports from higher level of government tomitigate the drought effects.
Though the statistics on drought attack in Chinesestatistical yearbooks might not be accurate as a result ofrough estimation to the attack acreage and the relevantpolicies for funding support and officers’ achievements,the drought data were still able to reflect the generalsituation of drought attacks in China, providing the onlyavailable historical data on drought statistics required foranalysis of the impact.
2.2. Drought intensity index for cropping system in China
For convenience we proposed an index to indicatedrought intensity in cropping system of China. The inten-sity index was based on the three levels of drought
Please cite this article as: Qin Z, et al. Modelling impact of aJournal of Disaster Risk Reduction (2013), http://dx.doi.org/10.
severity in Chinese statistics. Drought intensity had beendefined from various points of view and purposes [23].For example, the drought severity was defined accordingto the available soil moisture for cropping, the consecutiveperiod (days) without rainfall, and rainfall bias from long-term average in cropping season.
Among the three levels of drought attack severity instatistics of China, moderate drought represented thegeneral case of drought attacks that shaped importantimpact on agriculture. Therefore we could take the mod-erate attack as unity to define the drought intensity indexas the ratio of drought acreage to the total croppingacreage in regional scale, using the available statisticaldata on drought in China. The drought intensity index canbe estimated as follows:
DIi ¼w1Ai1þw2Ai2þw3Ai3
Aitð1Þ
where DIi is the drought intensity index for province i ofChina, Ai1, Ai2 and Ai3 are the cropping areas under droughtattack at slight, moderate and severe levels, respectively, inprovince i; Ait is the total cropping area in province i; and w1,w2 and w3 denote the weights of drought at slight, moderateand severe levels, respectively. The weights can be roughlyestimated according to the rates of yield declination undervarious drought levels. In order to compute the intensity, wedefine moderate drought as unity, which gives
w1 ¼ P1=P2 ð2Þ
w2 ¼ P2=P2 ð3Þ
w3 ¼ P3=P2 ð4Þwhere P1, P2 and P3 denote the rates of yield declination forslight moderate and severe drought attacks, respectively.Since slight drought was defined as the grain cropping withyield declination of Z10%, moderate as Z30% and severe asZ70%, the rates could be conservatively determined as themedians, i.e. P1¼20%, P2¼45% and P3¼80% for the estimate.Thus, we get w1¼0.45, w2¼1, and w3¼1.78. The provinceswith frequent drought events in large scale would have highDI hence intensive impact of drought in general.
2.3. Linking agro-drought with grain production in China
The relationship between drought and production wasconstructed on the basis of our essential hypothesis thatgrain production in China should be greater than actualone for the same cropping structure and farming inputs ifthere was no drought happening. Therefore, the grainproduction in statistics actually contained the two parts:the production under normal farming conditions withoutdrought attacks and the impact of drought on the farming,with the following relationship
Fa ¼ Fp�Fd�Fo ð5Þwhere Fa was the actual grain production given in statis-tics, Fp was the potential grain production estimated withnormal farming conditions without drought attacks, Fdwas the loss of grain production as a result of droughtattacks, and Fo was the loss of grain production as a resultof other disasters such as icy storm, flood and so on.
gro-drought on grain production in China. International1016/j.ijdrr.2013.09.002i
Z. Qin et al. / International Journal of Disaster Risk Reduction ] (]]]]) ]]]–]]]4
2.4. Estimating grain production loss induced by droughtattack
The importance in modelling the impact of drought ongrain production is to estimate the loss of grain productiondue to attack of drought Fd. Since the statistics on drought wasfor the entire farming system in which grain cropping wasonly a part, we cannot directly use the drought statistical dataon acreage for the estimate. Instead, we propose a propor-tional approach using cropping structure to estimate the loss.
Up to present China is still featured as an agriculturalcountry with its most population living in rural villagesand grain farming is the most important activity inChinese agriculture to meet the need of rural residents[21]. Thus grain farming has a spatial characteristic ofwidespread distribution in terms of provincial administra-tion. When drought happened in a region within theprovincial administration, we could rationally assume thatgrain farming is the most vulnerable sector of agriculturethat could be attacked by the disaster. This is especiallytrue under widespread distribution of grain farming interms of provincial administration, where regional specia-lization of other crops is usually constrained in asmall scale.
With this assumption, we can see that it is rational touse the proportional approach to estimate the acreage ofgrain farming under drought attack from the statisticaldata of drought acreage for the entire agriculture. Accord-ingly the following formula is proposed for the estimate ofgrain loss due to drought attack
Fd ¼ ∑n
i ¼ 1Fdi
¼ ∑n
i ¼ 1½RiAi1Yið1�P1ÞþRiAi2Yið1�P2ÞþRiAi3Yið1�P3Þ�
ð6Þwhere i denotes province i; n is total number of provinces(n¼30); Fdi is drought-caused grain production loss in
Fig. 2. Procedures for modelling the impact o
Please cite this article as: Qin Z, et al. Modelling impact of aJournal of Disaster Risk Reduction (2013), http://dx.doi.org/10.
province i; Ri is the fraction of grain cropping area to thetotal cropping area in province i; Ai1, Ai2 and Ai3 are thecropping areas under drought attack at slight, moderateand severe levels, respectively, in province i; Yi is thepotential yield of grain cropping in province i; and P1, P2and P3 denote the rates of yield declination under droughtat slight, moderate and severe levels, respectively.
2.5. Correlating drought intensity with grain production loss
Since drought can induce significant loss of grain produc-tion, one may rationally expect that the loss should increasewith drought intensity, i.e. the loss might statistically havea very close correlation with drought intensity. In order toexamine the relationship, we take the drought intensityindex as dependent variable and the loss as independentone to conduct linear regression analysis, giving the regres-sion equation as follows:
Y ¼ aþbX ð7Þwhere Y is the loss of grain production under droughtattacks, X is the drought intensity index, a and b are theregression coefficients of the equation. From the analysis wealso can obtain the correlation and determination coeffi-cients to indicate the relationship between the loss and thedrought intensity.
2.6. Calculating the impact of drought on food securityin China
Chinese population was 1.35 billion in 2011, about 1/5 ofthe world total. Food self-sufficiency has been a top priorityfor the Chinese government for decades. Recently China hasstated a clear policy to produce 90–95% of its own food [22].Therefore, the impact of agro-droughts on food security inChina could be estimated as the percentage of drought-causedgrain loss to total grain production required to secure thestable marketing supply in China, which can be expressed
f drought on grain production in China.
gro-drought on grain production in China. International1016/j.ijdrr.2013.09.002i
Z. Qin et al. / International Journal of Disaster Risk Reduction ] (]]]]) ]]]–]]] 5
in the following way
Rd ¼ Fd=Ft ð8Þwhere Rd represents the impact of drought on foodsecurity, and Ft is the grain production required forsecuring a stable supply, which can be simply estimatedas the product of food requirement per capita and totalpopulation or roughly computed as the potential produc-tion Ft¼Fp, which was used in the study. For the use, wewould like to highlight the impact of drought as the ratioof drought-caused disturbance in grain production.
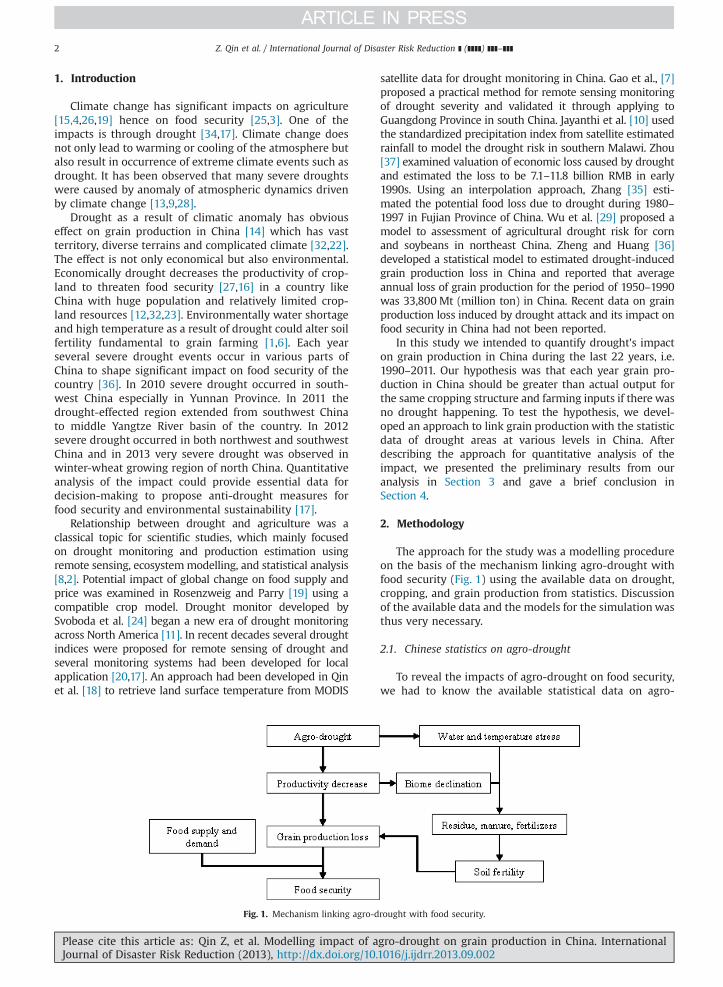
2.7. Procedures and data for the modelling
The procedures to simulate the impact of drought ongrain production were shown in Fig. 2. Statistic data requiredfor the simulation mainly included three parts: grain pro-duction, drought and cropping. Since the simulation was ahierarchic approach starting at provincial level, all the datarequired for the simulation were for the 30 provinces ofChina. And the impact for the whole China was obtainedthrough summation of the impact for the 30 provinces.
3. Restults and analysis
3.1. Drought attacks on agriculture in China
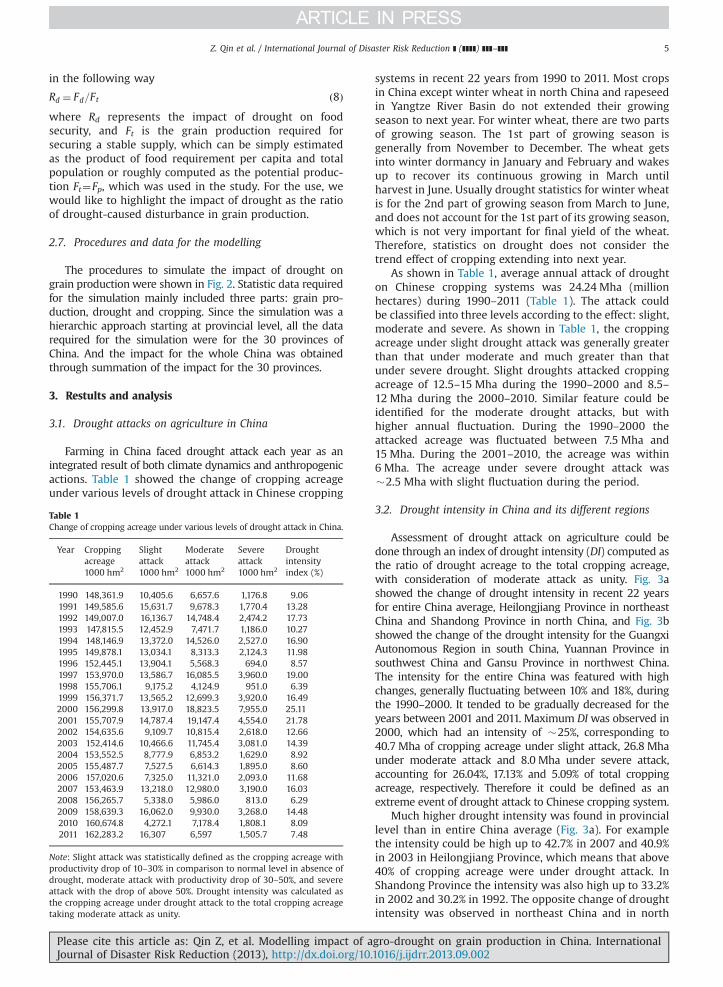
Farming in China faced drought attack each year as anintegrated result of both climate dynamics and anthropogenicactions. Table 1 showed the change of cropping acreageunder various levels of drought attack in Chinese cropping
Table 1Change of cropping acreage under various levels of drought attack in China.
Year Croppingacreage1000 hm2
Slightattack1000 hm2
Moderateattack1000 hm2
Severeattack1000 hm2
Droughtintensityindex (%)
1990 148,361.9 10,405.6 6,657.6 1,176.8 9.061991 149,585.6 15,631.7 9,678.3 1,770.4 13.281992 149,007.0 16,136.7 14,748.4 2,474.2 17.731993 147,815.5 12,452.9 7,471.7 1,186.0 10.271994 148,146.9 13,372.0 14,526.0 2,527.0 16.901995 149,878.1 13,034.1 8,313.3 2,124.3 11.981996 152,445.1 13,904.1 5,568.3 694.0 8.571997 153,970.0 13,586.7 16,085.5 3,960.0 19.001998 155,706.1 9,175.2 4,124.9 951.0 6.391999 156,371.7 13,565.2 12,699.3 3,920.0 16.492000 156,299.8 13,917.0 18,823.5 7,955.0 25.112001 155,707.9 14,787.4 19,147.4 4,554.0 21.782002 154,635.6 9,109.7 10,815.4 2,618.0 12.662003 152,414.6 10,466.6 11,745.4 3,081.0 14.392004 153,552.5 8,777.9 6,853.2 1,629.0 8.922005 155,487.7 7,527.5 6,614.3 1,895.0 8.602006 157,020.6 7,325.0 11,321.0 2,093.0 11.682007 153,463.9 13,218.0 12,980.0 3,190.0 16.032008 156,265.7 5,338.0 5,986.0 813.0 6.292009 158,639.3 16,062.0 9,930.0 3,268.0 14.482010 160,674.8 4,272.1 7,178.4 1,808.1 8.092011 162,283.2 16,307 6,597 1,505.7 7.48
Note: Slight attack was statistically defined as the cropping acreage withproductivity drop of 10–30% in comparison to normal level in absence ofdrought, moderate attack with productivity drop of 30–50%, and severeattack with the drop of above 50%. Drought intensity was calculated asthe cropping acreage under drought attack to the total cropping acreagetaking moderate attack as unity.
Please cite this article as: Qin Z, et al. Modelling impact of aJournal of Disaster Risk Reduction (2013), http://dx.doi.org/10.
systems in recent 22 years from 1990 to 2011. Most cropsin China except winter wheat in north China and rapeseedin Yangtze River Basin do not extended their growingseason to next year. For winter wheat, there are two partsof growing season. The 1st part of growing season isgenerally from November to December. The wheat getsinto winter dormancy in January and February and wakesup to recover its continuous growing in March untilharvest in June. Usually drought statistics for winter wheatis for the 2nd part of growing season from March to June,and does not account for the 1st part of its growing season,which is not very important for final yield of the wheat.Therefore, statistics on drought does not consider thetrend effect of cropping extending into next year.
As shown in Table 1, average annual attack of droughton Chinese cropping systems was 24.24 Mha (millionhectares) during 1990–2011 (Table 1). The attack couldbe classified into three levels according to the effect: slight,moderate and severe. As shown in Table 1, the croppingacreage under slight drought attack was generally greaterthan that under moderate and much greater than thatunder severe drought. Slight droughts attacked croppingacreage of 12.5–15 Mha during the 1990–2000 and 8.5–12 Mha during the 2000–2010. Similar feature could beidentified for the moderate drought attacks, but withhigher annual fluctuation. During the 1990–2000 theattacked acreage was fluctuated between 7.5 Mha and15 Mha. During the 2001–2010, the acreage was within6 Mha. The acreage under severe drought attack was�2.5 Mha with slight fluctuation during the period.
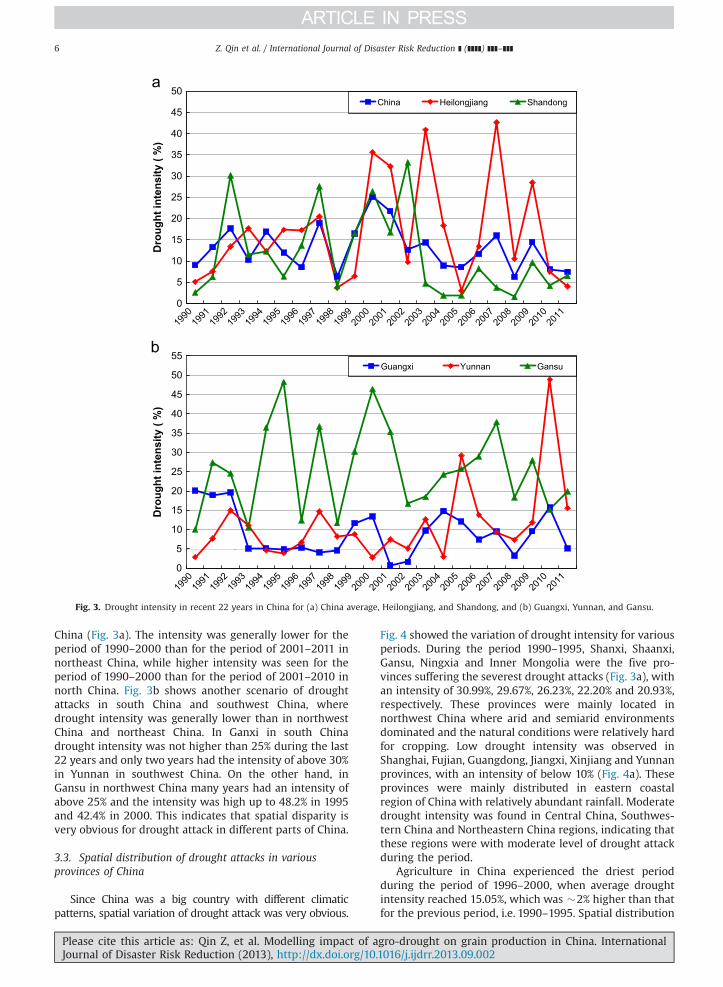
3.2. Drought intensity in China and its different regions
Assessment of drought attack on agriculture could bedone through an index of drought intensity (DI) computed asthe ratio of drought acreage to the total cropping acreage,with consideration of moderate attack as unity. Fig. 3ashowed the change of drought intensity in recent 22 yearsfor entire China average, Heilongjiang Province in northeastChina and Shandong Province in north China, and Fig. 3bshowed the change of the drought intensity for the GuangxiAutonomous Region in south China, Yuannan Province insouthwest China and Gansu Province in northwest China.The intensity for the entire China was featured with highchanges, generally fluctuating between 10% and 18%, duringthe 1990–2000. It tended to be gradually decreased for theyears between 2001 and 2011. Maximum DI was observed in2000, which had an intensity of �25%, corresponding to40.7 Mha of cropping acreage under slight attack, 26.8 Mhaunder moderate attack and 8.0 Mha under severe attack,accounting for 26.04%, 17.13% and 5.09% of total croppingacreage, respectively. Therefore it could be defined as anextreme event of drought attack to Chinese cropping system.
Much higher drought intensity was found in provinciallevel than in entire China average (Fig. 3a). For examplethe intensity could be high up to 42.7% in 2007 and 40.9%in 2003 in Heilongjiang Province, which means that above40% of cropping acreage were under drought attack. InShandong Province the intensity was also high up to 33.2%in 2002 and 30.2% in 1992. The opposite change of droughtintensity was observed in northeast China and in north
gro-drought on grain production in China. International1016/j.ijdrr.2013.09.002i
0
5
10
15
20
25
30
35
40
45
50
1990
1991
1992
1993
1994
1995
1996
1997
1998
1999
2000
2001
2002
2003
2004
2005
2006
2007
2008
2009
2010
2011
Dro
ught
inte
nsity
( %
)
China Heilongjiang Shandong
0
5
10
15
20
25
30
35
40
45
50
55
1990
1991
1992
1993
1994
1995
1996
1997
1998
1999
2000
2001
2002
2003
2004
2005
2006
2007
2008
2009
2010
2011
Dro
ught
inte
nsity
( %
)
Guangxi Yunnan Gansu
a
Fig. 3. Drought intensity in recent 22 years in China for (a) China average, Heilongjiang, and Shandong, and (b) Guangxi, Yunnan, and Gansu.
Z. Qin et al. / International Journal of Disaster Risk Reduction ] (]]]]) ]]]–]]]6
China (Fig. 3a). The intensity was generally lower for theperiod of 1990–2000 than for the period of 2001–2011 innortheast China, while higher intensity was seen for theperiod of 1990–2000 than for the period of 2001–2010 innorth China. Fig. 3b shows another scenario of droughtattacks in south China and southwest China, wheredrought intensity was generally lower than in northwestChina and northeast China. In Ganxi in south Chinadrought intensity was not higher than 25% during the last22 years and only two years had the intensity of above 30%in Yunnan in southwest China. On the other hand, inGansu in northwest China many years had an intensity ofabove 25% and the intensity was high up to 48.2% in 1995and 42.4% in 2000. This indicates that spatial disparity isvery obvious for drought attack in different parts of China.
3.3. Spatial distribution of drought attacks in variousprovinces of China
Since China was a big country with different climaticpatterns, spatial variation of drought attack was very obvious.
Please cite this article as: Qin Z, et al. Modelling impact of aJournal of Disaster Risk Reduction (2013), http://dx.doi.org/10.
Fig. 4 showed the variation of drought intensity for variousperiods. During the period 1990–1995, Shanxi, Shaanxi,Gansu, Ningxia and Inner Mongolia were the five pro-vinces suffering the severest drought attacks (Fig. 3a), withan intensity of 30.99%, 29.67%, 26.23%, 22.20% and 20.93%,respectively. These provinces were mainly located innorthwest China where arid and semiarid environmentsdominated and the natural conditions were relatively hardfor cropping. Low drought intensity was observed inShanghai, Fujian, Guangdong, Jiangxi, Xinjiang and Yunnanprovinces, with an intensity of below 10% (Fig. 4a). Theseprovinces were mainly distributed in eastern coastalregion of China with relatively abundant rainfall. Moderatedrought intensity was found in Central China, Southwes-tern China and Northeastern China regions, indicating thatthese regions were with moderate level of drought attackduring the period.
Agriculture in China experienced the driest periodduring the period of 1996–2000, when average droughtintensity reached 15.05%, which was �2% higher than thatfor the previous period, i.e. 1990–1995. Spatial distribution
gro-drought on grain production in China. International1016/j.ijdrr.2013.09.002i
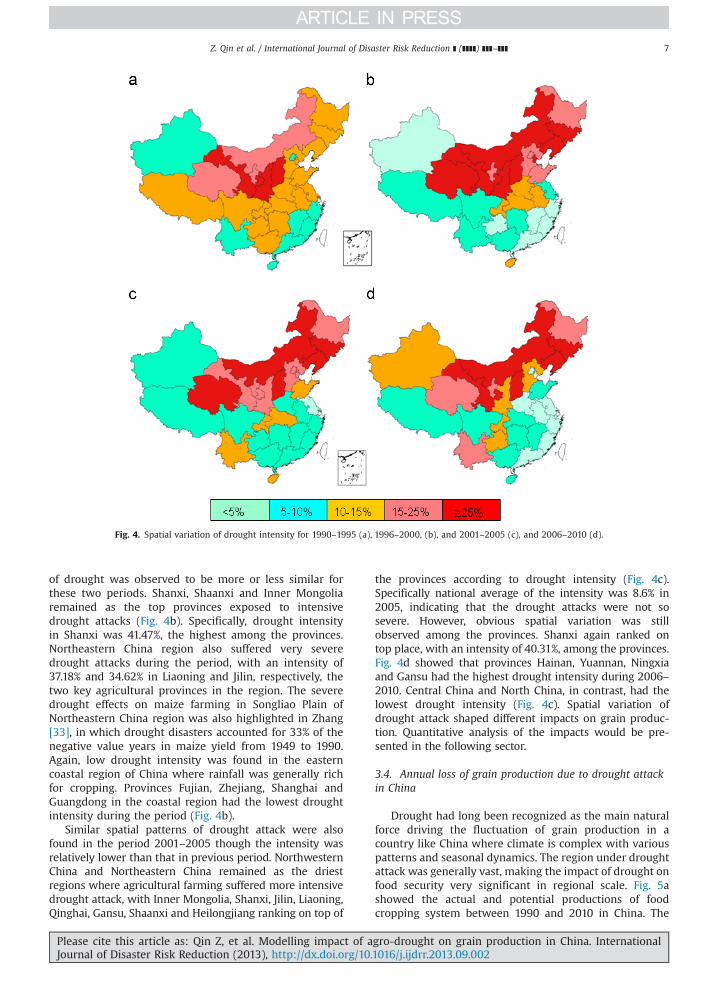
Fig. 4. Spatial variation of drought intensity for 1990–1995 (a), 1996–2000, (b), and 2001–2005 (c), and 2006–2010 (d).
Z. Qin et al. / International Journal of Disaster Risk Reduction ] (]]]]) ]]]–]]] 7
of drought was observed to be more or less similar forthese two periods. Shanxi, Shaanxi and Inner Mongoliaremained as the top provinces exposed to intensivedrought attacks (Fig. 4b). Specifically, drought intensityin Shanxi was 41.47%, the highest among the provinces.Northeastern China region also suffered very severedrought attacks during the period, with an intensity of37.18% and 34.62% in Liaoning and Jilin, respectively, thetwo key agricultural provinces in the region. The severedrought effects on maize farming in Songliao Plain ofNortheastern China region was also highlighted in Zhang[33], in which drought disasters accounted for 33% of thenegative value years in maize yield from 1949 to 1990.Again, low drought intensity was found in the easterncoastal region of China where rainfall was generally richfor cropping. Provinces Fujian, Zhejiang, Shanghai andGuangdong in the coastal region had the lowest droughtintensity during the period (Fig. 4b).
Similar spatial patterns of drought attack were alsofound in the period 2001–2005 though the intensity wasrelatively lower than that in previous period. NorthwesternChina and Northeastern China remained as the driestregions where agricultural farming suffered more intensivedrought attack, with Inner Mongolia, Shanxi, Jilin, Liaoning,Qinghai, Gansu, Shaanxi and Heilongjiang ranking on top of
Please cite this article as: Qin Z, et al. Modelling impact of aJournal of Disaster Risk Reduction (2013), http://dx.doi.org/10.
the provinces according to drought intensity (Fig. 4c).Specifically national average of the intensity was 8.6% in2005, indicating that the drought attacks were not sosevere. However, obvious spatial variation was stillobserved among the provinces. Shanxi again ranked ontop place, with an intensity of 40.31%, among the provinces.Fig. 4d showed that provinces Hainan, Yuannan, Ningxiaand Gansu had the highest drought intensity during 2006–2010. Central China and North China, in contrast, had thelowest drought intensity (Fig. 4c). Spatial variation ofdrought attack shaped different impacts on grain produc-tion. Quantitative analysis of the impacts would be pre-sented in the following sector.
3.4. Annual loss of grain production due to drought attackin China
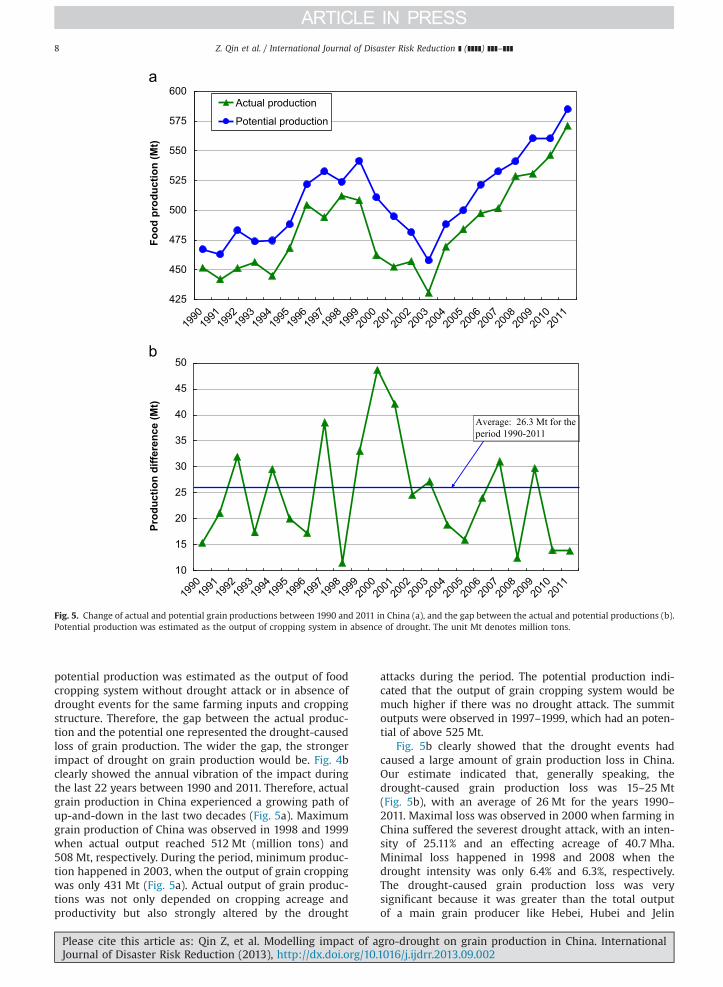
Drought had long been recognized as the main naturalforce driving the fluctuation of grain production in acountry like China where climate is complex with variouspatterns and seasonal dynamics. The region under droughtattack was generally vast, making the impact of drought onfood security very significant in regional scale. Fig. 5ashowed the actual and potential productions of foodcropping system between 1990 and 2010 in China. The
gro-drought on grain production in China. International1016/j.ijdrr.2013.09.002i
425
450
475
500
525
550
575
600
1990
1991
1992
1993
1994
1995
1996
1997
1998
1999
2000
2001
2002
2003
2004
2005
2006
2007
2008
2009
2010
2011
Food
pro
duct
ion
(Mt)
Actual production
Potential production
10
15
20
25
30
35
40
45
50
1990
1991
1992
1993
1994
1995
1996
1997
1998
1999
2000
2001
2002
2003
2004
2005
2006
2007
2008
2009
2010
2011
Average: 26.3 Mt for the
period 1990-2011
Prod
uctio
n di
ffere
nce
(Mt)
Fig. 5. Change of actual and potential grain productions between 1990 and 2011 in China (a), and the gap between the actual and potential productions (b).Potential production was estimated as the output of cropping system in absence of drought. The unit Mt denotes million tons.
Z. Qin et al. / International Journal of Disaster Risk Reduction ] (]]]]) ]]]–]]]8
potential production was estimated as the output of foodcropping system without drought attack or in absence ofdrought events for the same farming inputs and croppingstructure. Therefore, the gap between the actual produc-tion and the potential one represented the drought-causedloss of grain production. The wider the gap, the strongerimpact of drought on grain production would be. Fig. 4bclearly showed the annual vibration of the impact duringthe last 22 years between 1990 and 2011. Therefore, actualgrain production in China experienced a growing path ofup-and-down in the last two decades (Fig. 5a). Maximumgrain production of China was observed in 1998 and 1999when actual output reached 512 Mt (million tons) and508 Mt, respectively. During the period, minimum produc-tion happened in 2003, when the output of grain croppingwas only 431 Mt (Fig. 5a). Actual output of grain produc-tions was not only depended on cropping acreage andproductivity but also strongly altered by the drought
Please cite this article as: Qin Z, et al. Modelling impact of aJournal of Disaster Risk Reduction (2013), http://dx.doi.org/10.
attacks during the period. The potential production indi-cated that the output of grain cropping system would bemuch higher if there was no drought attack. The summitoutputs were observed in 1997–1999, which had an poten-tial of above 525 Mt.
Fig. 5b clearly showed that the drought events hadcaused a large amount of grain production loss in China.Our estimate indicated that, generally speaking, thedrought-caused grain production loss was 15–25 Mt(Fig. 5b), with an average of 26 Mt for the years 1990–2011. Maximal loss was observed in 2000 when farming inChina suffered the severest drought attack, with an inten-sity of 25.11% and an effecting acreage of 40.7 Mha.Minimal loss happened in 1998 and 2008 when thedrought intensity was only 6.4% and 6.3%, respectively.The drought-caused grain production loss was verysignificant because it was greater than the total outputof a main grain producer like Hebei, Hubei and Jelin
gro-drought on grain production in China. International1016/j.ijdrr.2013.09.002i
2
3
4
5
6
7
8
9
10
1990
1991
1992
1993
1994
1995
1996
1997
1998
1999
2000
2001
2002
2003
2004
2005
2006
2007
2008
2009
2010
2011
Impa
ct (
%)
Average: 5.2 mt for the
period 1990-2011
Fig. 6. Impact of drought on food security of China for the period 1990–2010.
y = 1.9618x + 0.9454R2 = 0.9783
10
15
20
25
30
35
40
45
50
55
5 7 9 11 13 15 17 19 21 23 25 27
Drought intensity %
Loss
(mt)
y = 0.3837x + 0.2773R2 = 0.9897
2
3
4
5
6
7
8
9
10
11
5 7 9 11 13 15 17 19 21 23 25 27
Drought intensity %
Impa
ct %
Fig. 7. Linear relationship between drought-caused grain production loss and drought intensity (a) as well as between the impact and the intensity(b) in China for 1990–2010. The unit Mt denotes million tons.
Please cite this article as: Qin Z, et al. Modelling impact of agro-drought on grain production in China. InternationalJournal of Disaster Risk Reduction (2013), http://dx.doi.org/10.1016/j.ijdrr.2013.09.002i
Z. Qin et al. / International Journal of Disaster Risk Reduction ] (]]]]) ]]]–]]] 9
Z. Qin et al. / International Journal of Disaster Risk Reduction ] (]]]]) ]]]–]]]10
provinces, whose grain production was 29.8 Mt, 28.4 Mtand 28.3 Mt, respectively, in 2010. The grain loss bydrought attack was big enough to feed above 50 millionpeople!
3.5. Impact of drought attacks on food security in China
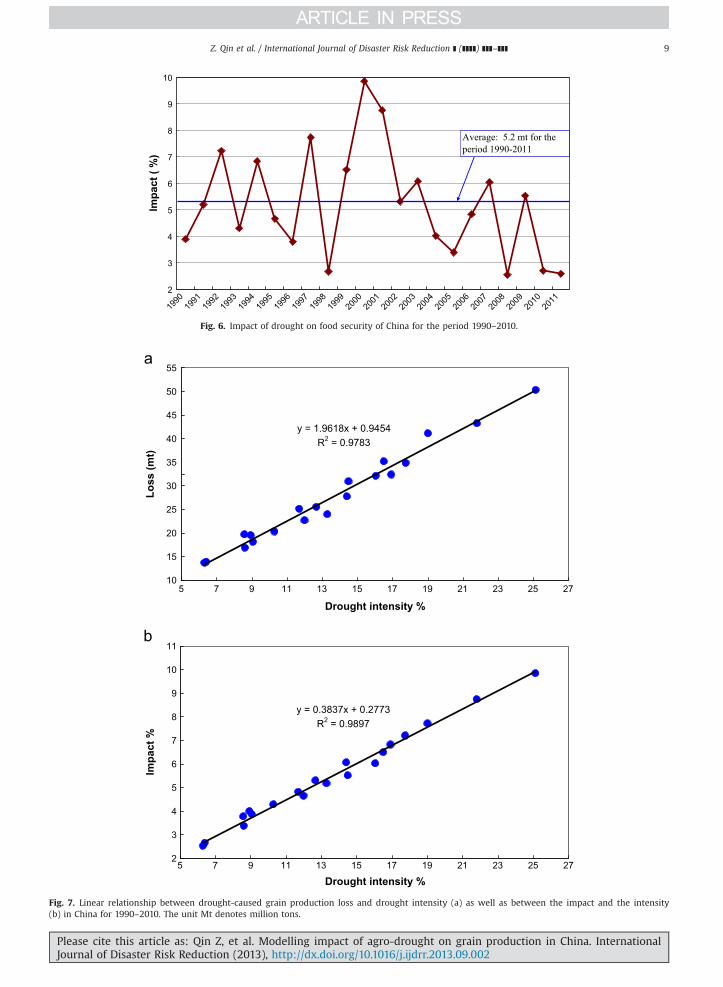
In order to quantitatively reveal the actual impact ofdrought attacks on food security of China, we computedthe ratio of drought-caused grain production loss to thepotential output of food cropping without drought attack.Fig. 6 showed change of the ratio for the period 1990–2011.Though the ratio vibrated sharply during the period, ageneral trend could be seen for quantitative estimate ofthe impact. Therefore, it could be concluded that droughtmight generally cause an average impact of 5.2% to annualgrain production in China, with a maximum of �9.9% andminimum of �2.5%.
The direct relation between drought intensity anddrought-caused grain loss was very clear. Usually the higherthe intensity, the larger amount of grain production losshence the greater impact would be. Fig. 7 plotted the lossand the impact with the intensity for 1990–2010. Regres-sion of the loss in Mt to the intensity in percentage gave thefollowing results
Y ¼ 0:9454þ1:9618X R2 ¼ 0:9783 SEE¼ 1:6146 F ¼ 634:3 t ¼ 25:2
where Y represents the drought-caused grain productionloss, X is the drought intensity computed as an index givenin Eq. (4), and SEE the standard estimation error of theregression equation. The very high R2 indicates that the twofactors have very close correlation. The F-test is highlysignificant at the credential level α¼0.01 for the degreesof freedom df1¼1 and df2¼14, indicating the reliability ofregression. Statistical significance of the t-test at α¼0.01also confirms the applicability of the regression equation.Therefore, it could be concluded that the grain productionin China might have a loss of �2 Mt in grain cropping incorresponding to an increase of 1% in drought intensity.
Similarly, we had the following regression results forFig. 7b which plotted drought intensity with its impact ongrain production
Y ¼ 0:2773þ0:3837X R2 ¼ 0:9897 SEE¼ 0:1735 F ¼ 2074:7 t ¼ 45:5
where Y represents the drought's impact (%) on grainproduction loss, and X is the drought intensity (%). BothF-test and t-test are statistically significant at the creden-tial level of α¼0.01. Therefore, quantitatively we couldconclude that an increase of 1% in drought intensity mightconsequently lead to an increase of 0.38% in the drought'simpact on grain production in China. Since annual grainproduction in China was �500 Mt, an increase of 0.38%might directly cause a loss of �2 Mt in grain production.Thus the above two equations revealed the same quanti-tative relationship from two aspects of drought's impactson food security in China.
With increase of population and living standard, it hasbeen a common understanding that China will need agrain production of above 550 Mt to meet a stable supplyof food for domestic demand [5,30,31]. From the aboveanalysis, we can see that the maximum of drought
Please cite this article as: Qin Z, et al. Modelling impact of aJournal of Disaster Risk Reduction (2013), http://dx.doi.org/10.
intensity during the last two decades was about 25%,leading to grain production loss of about 50 Mt whichwas about 9.8% to the production. Since only two yearsduring the last two decades have drought's impact ofabove 8% on grain production, it can be concluded thatthe food security of China remains in controllable statusunder drought's attacks. On the other hand, we alsounderstand that drought still shapes significant impacton Chinese food security. Statistically, Chinese grain farm-ing under drought attack is able to secure food supply fordomestic demand in probability of above 92%, whichmeets the priority target of Chinese government in foodsecurity. Considering the impact of global climate changewhich may result in more frequent occurrence of extremeclimate events, we estimate that the probability for Chi-nese domestic grain farming to secure its food supply mayslightly decline to 88–90% in the next two decades, i.e. till2030. Therefore drought in China may have some but notbig impacts on grain market of the world.
3.6. Spatial patterns of drought’ impacts on grain productionin China
Fig. 8 showed the spatial distribution of drought-caused grain production loss. Very high spatial variationcould be observed in both the absolute loss and the impactintensity. During 1990–1995 Henan, Shandong, andJiangsu provinces had the greatest grain production lossdue to drought events, with average annual loss of 2.14 Mt,1.97 Mt and 1.51 Mt. Grain loss in the three provinces thustogether contributed 22.13% to Chinese total grain loss dueto drought in the period. There were 13 provinces that hadan average annual grain loss of over 1 Mt in this period asa result of drought attacks. Totally the grain loss due todrought in these provinces accounted for 47.01% ofChinese total.
The absolute amount of grain loss was depended onboth the cropping acreage and drought's impact. Theprovinces with large amount of grain loss might notreceive high impact of drought on food security. Therefore,the impact could be evaluated through an impact intensitycalculated as the ratio of the loss to total production inabsence of drought. Our modelling results indicated thatthe highest impact of drought on grain production wasobserved in the provinces of Shanxi, Shaanxi and Gansu,where the impact intensity exceeded 10% on average, with11.98%, 11.57% and 10.26% during 1990–1995. Actuallythese three provinces also had the highest percentage ofdrought intensity (Fig. 8a). Fig. 8b showed that much moreintensive impact of drought was observed in the yearsbetween 1996 and 2000, when Chinese agriculture experi-enced consecutive strong drought attacks, as indicated inFig. 6b. During the period, there were seven provinceswith an absolute amount of grain loss exceeding 2 Mt onaverage and five provinces with the loss of above 1 Mt.North China, northeast China and northwest China regionshad spatially the greatest grain loss (Fig. 8b) and thegreatest drought impact on the loss. Percentage of theimpact was generally also very high in the regions.Although Heilongjiang, Shandong and Henan provinceshad the largest amount of drought-caused grain production
gro-drought on grain production in China. International1016/j.ijdrr.2013.09.002i
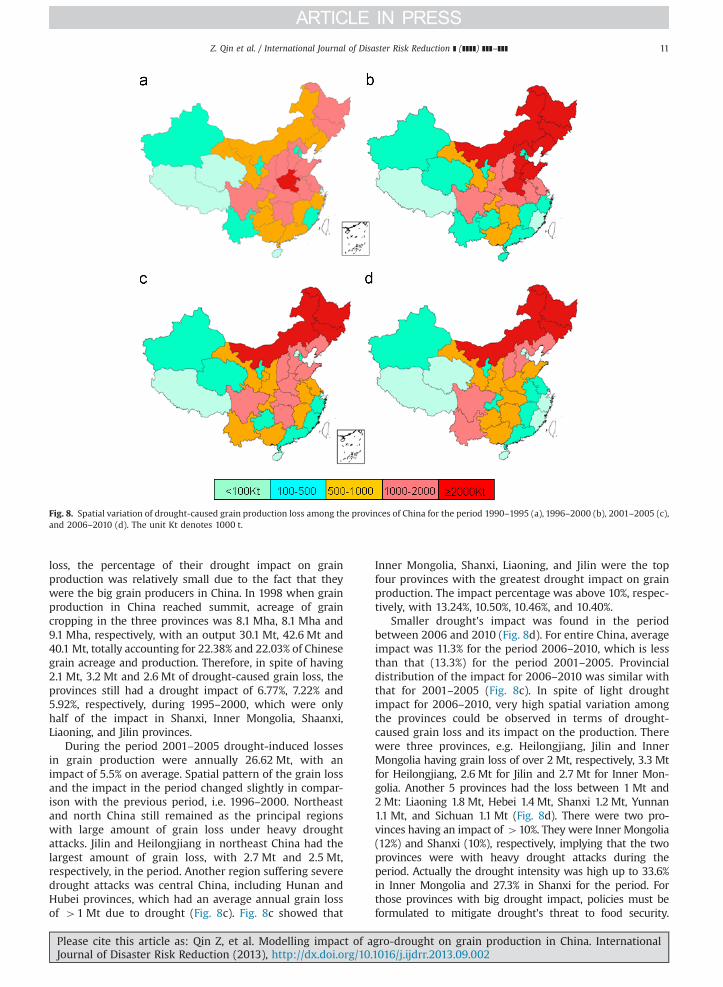
Fig. 8. Spatial variation of drought-caused grain production loss among the provinces of China for the period 1990–1995 (a), 1996–2000 (b), 2001–2005 (c),and 2006–2010 (d). The unit Kt denotes 1000 t.
Z. Qin et al. / International Journal of Disaster Risk Reduction ] (]]]]) ]]]–]]] 11
loss, the percentage of their drought impact on grainproduction was relatively small due to the fact that theywere the big grain producers in China. In 1998 when grainproduction in China reached summit, acreage of graincropping in the three provinces was 8.1 Mha, 8.1 Mha and9.1 Mha, respectively, with an output 30.1 Mt, 42.6 Mt and40.1 Mt, totally accounting for 22.38% and 22.03% of Chinesegrain acreage and production. Therefore, in spite of having2.1 Mt, 3.2 Mt and 2.6 Mt of drought-caused grain loss, theprovinces still had a drought impact of 6.77%, 7.22% and5.92%, respectively, during 1995–2000, which were onlyhalf of the impact in Shanxi, Inner Mongolia, Shaanxi,Liaoning, and Jilin provinces.
During the period 2001–2005 drought-induced lossesin grain production were annually 26.62 Mt, with animpact of 5.5% on average. Spatial pattern of the grain lossand the impact in the period changed slightly in compar-ison with the previous period, i.e. 1996–2000. Northeastand north China still remained as the principal regionswith large amount of grain loss under heavy droughtattacks. Jilin and Heilongjiang in northeast China had thelargest amount of grain loss, with 2.7 Mt and 2.5 Mt,respectively, in the period. Another region suffering severedrought attacks was central China, including Hunan andHubei provinces, which had an average annual grain lossof 41 Mt due to drought (Fig. 8c). Fig. 8c showed that
Please cite this article as: Qin Z, et al. Modelling impact of aJournal of Disaster Risk Reduction (2013), http://dx.doi.org/10.
Inner Mongolia, Shanxi, Liaoning, and Jilin were the topfour provinces with the greatest drought impact on grainproduction. The impact percentage was above 10%, respec-tively, with 13.24%, 10.50%, 10.46%, and 10.40%.
Smaller drought's impact was found in the periodbetween 2006 and 2010 (Fig. 8d). For entire China, averageimpact was 11.3% for the period 2006–2010, which is lessthan that (13.3%) for the period 2001–2005. Provincialdistribution of the impact for 2006–2010 was similar withthat for 2001–2005 (Fig. 8c). In spite of light droughtimpact for 2006–2010, very high spatial variation amongthe provinces could be observed in terms of drought-caused grain loss and its impact on the production. Therewere three provinces, e.g. Heilongjiang, Jilin and InnerMongolia having grain loss of over 2 Mt, respectively, 3.3 Mtfor Heilongjiang, 2.6 Mt for Jilin and 2.7 Mt for Inner Mon-golia. Another 5 provinces had the loss between 1 Mt and2 Mt: Liaoning 1.8 Mt, Hebei 1.4 Mt, Shanxi 1.2 Mt, Yunnan1.1 Mt, and Sichuan 1.1 Mt (Fig. 8d). There were two pro-vinces having an impact of 410%. They were Inner Mongolia(12%) and Shanxi (10%), respectively, implying that the twoprovinces were with heavy drought attacks during theperiod. Actually the drought intensity was high up to 33.6%in Inner Mongolia and 27.3% in Shanxi for the period. Forthose provinces with big drought impact, policies must beformulated to mitigate drought's threat to food security.
gro-drought on grain production in China. International1016/j.ijdrr.2013.09.002i
Z. Qin et al. / International Journal of Disaster Risk Reduction ] (]]]]) ]]]–]]]12
According to our findings, it would be better for China tohave grain storage of �20 Mt to minimize the threat ofdrought attacks on food security.
4. Conclusion
Thorough examination had been done in the study tothe impacts of agro-drought on food security in China. Anapproach was developed for quantitative analysis of theimpact. Using the statistical data on agro-drought andgrain production at provincial level, a hierarchical simula-tion had been done in the study to test the hypothesis thatlinked the agro-drought to grain production in China.
Our results indicated that the impacts of agro-droughton food security were very obvious in China. Each yearabout 25–30 Mha of cropping land were under attack bydrought events at various levels. Drought intensity duringthe last 22 years between 1990 and 2011 in China was13.2% on average, which consequently induced 27 Mt ofgrain production loss, shaping an impact of 5.3% to totalgrain production in China. The last 22 years could bedivided into four periods: 1990–1995, 1996–2000, 2001–2005 and 2006–2011. The period 1996–2000 had theseverest drought, with an intensity of 15.11% on averageand an annual grain production loss of 32 Mt, leading animpact of 6.1%. The drought-induced grain production losscould be equal to the total amount of grain production inone big province such as Jiangsu and Hebei. The amount ofdrought-induced grain production loss was enough to feed�60 million people. In recent 22 years, greater impacts ofagro-drought on grain production were observed in north-east China, northwest China and southwest China regions,including such provinces as Shanxi, Shaanxi, Jilin, Heilong-jiang, Inner Mongolia and Yunnan, with an droughtintensity of more than 15% and an impact of above 5% ongrain production. Statistical analysis revealed that totalgrain production would loss �2 Mt if drought intensityincreases by up to 1 percentage. An increase of 1% indrought intensity might lead to a loss �2 Mt of grainproduction, and an impact of 0.38% on total grain produc-tion. Our study also reveals that food security of China toremain a stable supply of grain for its domestic demand iswith a probability of above 92% and grain storage of�20 Mt is required for China to minimize the threat ofdrought attacks on its food security. Significant impact ofdrought on grain production suggested that an alternativestrategy was very necessary to maintain food security andenvironmental sustainability through anti-drought cam-paigns in China.
Acknowledgement
This study is supported by the Project of National BasicResearch Program of China (973 Program) (Grant No.:2010CB951504) and the Key Project of National SocialScience Foundation of China (Grant No.: 11&zd167).We sincerely thank Dr. Peter Johnston from University ofCape Town, South Africa for his assistance in checkingEnglish of the manuscript. We also thank the threereviewers for their constructive suggestions and
Please cite this article as: Qin Z, et al. Modelling impact of aJournal of Disaster Risk Reduction (2013), http://dx.doi.org/10.
comments to improve the manuscript. Our thanks are alsoextended to Mr. Wenbo Zhang, Dr. Lin Lu, Dr. Liping Lu,and Mr. Lei Gao for various helps in preparing andimproving the manuscript.
References
[1] Asner, GP, Nepstad, D, Cardinot, G, Ray, D. (2004) Drought stress andcarbon uptake in an Amazon forest measured with spaceborne imagingspectroscopy. ⟨www.pnas.org/cgi/doi.10.1073/pnas.0400168101⟩.
[2] Bastiaanssen WGM, Ali S. A new crop yield forecasting model basedon satellite measurements applied across the Indus Basin, Pakistan.Agriculture Ecosystems and Environment 2003;94:321–40.
[3] Brown ME, Funk CC. Food security under climate change. Science2008;319:580–1.
[4] Chavas DR, Izaurralde RC, Thomson AM, Gao X. Long-term climatechange impacts on agricultural productivity in eastern China.Agricultural and Forest Meteorology 2009;149:1118–28.
[5] Chen Y, Li X, Wang J. Changes and effecting factors of grainproduction in China. Chinese Geographical Science 2011;21(6):676–84, http://dx.doi.org/10.1007/s11769-011-0506-9.
[6] Fang JY. Gloabal ecology. Beijing: High Education Press;250 ([In Chinese]).
[7] Gao M, Qin Z, Zhang H, Lu L, Zhou X, Yang X. Remote sensing of agro-droughts in guangdong province of China using MODIS satellite data.Sensors 2008;8:4687–708, http://dx.doi.org/10.3390/s8084687.
[8] Hayes MJ, Decker WL. The prediction of corn production by satellitedata and real time weather data. International Journal of Biometeor-ology 1998;1(42):10–5.
[9] Hong SY, Kalnay E. The 1998 Oklahoma–Texas drought: mechanisticexperiements with NCEP global and regional models. Journal ofClimate 2002;15:945–63.
[10] Jayanthi H, Husak GJ, Funk C, Magadzire T, Chavula A, Verdin JP.Modeling rain-fed maize vulnerability to droughts using the stan-dardized precipitation index from satellite estimated rainfall—Southern Malawi case study. International Journal of Disaster RiskReduction 2013;4:71–81.
[11] Lawrimore J, Heim Jr RR, Svoboda M, Swail V, Engleihart PJ.Beginning a new era of drought monitoring across North America.Bulletin of American Meteorology Society 2002;83:1191–2.
[12] Li S. China's huge investment onwater facilities: an effective adaptation toclimate change, natural disasters, and food security. Natural Hazards2012;61:1473–5, http://dx.doi.org/10.1007/s11069-011-9964-8.
[13] Liu JL, Stewart RE, Szeto KK. Moisture transport and other hydro-meteorologyical features associated with the severe 2000/01drought over the western central Canadian Prairies. Journal ofClimate 2004;17:305–19.
[14] Mu J, Khan S. The effect of climate change on the water and foodnexus in China. Food Security 2009;1:413–30, http://dx.doi.org/10.1007/s12571-009-0042-y.
[15] Piao S, Ciais P, Huang Y, Shen Z, Peng S, Li J, et al. The impacts ofclimate change on water resources and agriculture in China. Nature2010;467:43–51, http://dx.doi.org/10.1038/nature09364.
[16] Ranger N, Surminski S. A preliminary assessment of the impact ofclimate change on non-life insurance demand in the BRICS econo-mies. International Journal of Disaster Risk Reduction 2013;3:14–30.
[17] Qin Z, Gao M, Qin X, Li W, Xu B. Algorithm for retrieve land surfacetemperature from MODIS data for agro-drought monitoring. Journalof Natural Disasters 2005;14(4):64–71 ([in Chinese]).
[18] Qin Z, Xu B, Li M, Wang D, Zhang W, Li W, et al. Advances inresearch on mechanism and monitoring of agro-meteorologicaldisasters in China. Journal of Natural Disasters 2005;14(2):61–9 ([In Chinese]).
[19] Rosenzweig C, Parry ML. Potential impacts of climate change onworld food supply. Nature 1994;367:133–8, http://dx.doi.org/10.1038/367133a0.
[20] Shen G, Tian G. Crop water stress index for drought monitoring.Journal of Dryland Agriculture 1998;16(1):123–8 ([In Chinese]).
[21] Shi W, Tao F, Liu J. Changes in quantity and quality of cropland andthe implications for grain production in the Huang-Huai-Hai Plain ofChina. Food Security 2013;5:69–82, http://dx.doi.org/10.1007/s12571-012-0225-9.
[22] Simelton E. Food self-sufficiency and natural hazards in China. FoodSecurity 2011;3:35–52, http://dx.doi.org/10.1007/s12571-011-0114-7.
[23] Simelton E, Fraser EDG, Termansen M, Forster PM, Dougill AJ.Typologies of crop-drought vulnerability: an empirical analysis ofthe socio-economic factors that influence the sensitivity and
gro-drought on grain production in China. International1016/j.ijdrr.2013.09.002i
Z. Qin et al. / International Journal of Disaster Risk Reduction ] (]]]]) ]]]–]]] 13
resilience to drought of three major food crops in China (1961–2001). Environmental Science & Policy 2009;12:438–52.
[24] Svoboda M, LeComte D, Hayes M, Heim R, Gleason K, Angels J, et al.The drought monitor. Bulletin of American Meteorological Society2002;83:1181–2366.
[25] Wang J. Food security, food prices and climate change in china: adynamic panel data analysis. Agriculture and Agricultural ScienceProcedia 2010;1:321–4.
[26] Thomson AM, Izaurralde RC, Rosenberg NJ, He X. Climate changeimpacts on agriculture and soil carbon sequestration potential in theHuang-Hai Plain of China. Agriculture Ecosystems & Environment2005;114(2–4):195–209.
[27] Tirivarombo S, Hughes DA. Regional droughts and food securityrelationships in the Zambezi River Basin. Physics and Chemistry ofthe Earth 2011;36:977–83.
[28] Trenberth KE, Branstator GW, Arkin PA. Origins of the 1988 NorthAmerican drought. Science 1988;242:1640–5.
[29] Wu H, Hubbard KG, Wilhite DA. An agricultural drought risk-assessment model for corn and soybeans. International Journal ofClimatology 2004;24:723–41.
[30] Xiong W, Lin E, Ju H, Xu Y. Climate change and critical thresholdsin China's food security. Climatic Change 2007;81:205–21,http://dx.doi.org/10.1007/s10584-006-9123-5.
Please cite this article as: Qin Z, et al. Modelling impact of aJournal of Disaster Risk Reduction (2013), http://dx.doi.org/10.
[31] Ye L, Van Ranst E. Production scenarios and the effect of soildegradation on long-term food security in China. Global Environ-mental Change 2009;19:464–81.
[32] Zhang B, Wu P, Zhao X, Wang Y, Wang J, Shi Y. Drought variationtrends in different subregions of the Chinese Loess Plateau over thepast four decades. Agricultural Water Management 2012;115:167–77.
[33] Zhang J. Risk assessment of drought disaster in the maize-growingregion of Songliao Plain, China. Agriculture Ecosystems & Environ-ment 2004;102(2):133–53.
[34] Zhang T, Huang Y. Impacts of climate change and inter-annualvariability on cereal crops in China from 1980 to 2008. Journalof the Science of Food and Agriculture 2012;92(8):1643–52,http://dx.doi.org/10.1002/jsfa.5523.
[35] Zhang X. Estimation of grain production loss induced by meteor-ological disaster in Fujian province of China. Journal of Meteorology1999;25(4):45–7 ([in Chinese]).
[36] Zheng JY, Huang JH. Assessment of disaster-induced grain produc-tion loss during the last 40 years in China. Acta Geographia Sinica1998;53(6):501–10 ([In Chinese]).
[37] Zhou J. Drought and its economic loss in China. Journal of DisasterScience 1993;8(3):45–9 ([in Chinese]).
gro-drought on grain production in China. International1016/j.ijdrr.2013.09.002i


