Mildenhall and Brandon INT: place-based needs assessment (2019)
Public Health Suffolk Page 1 of 97
Mildenhall and Brandon INT: place-based needs assessment (2019)
Public Health Suffolk Page 2 of 97
Contents Executive summary .................................................................................................................................. 4
Demographics ..................................................................................................................................... 4
Wider determinants of health ............................................................................................................. 4
Primary care ........................................................................................................................................ 5
Hospital admissions ............................................................................................................................. 5
Children and young people ................................................................................................................. 6
Older people’s health and wellbeing ................................................................................................... 6
Overview of Mildenhall and Brandon INT’s data ................................................................................. 6
Introduction: Place-based needs assessments ......................................................................................... 9
Geographies ........................................................................................................................................ 9
Forecasts ....................................................................................................................................... 11
Population estimates including US military ................................................................................... 11
Rounding and disclosure ............................................................................................................... 11
Confidence intervals ...................................................................................................................... 12
Significance .................................................................................................................................... 12
Demographics: Mildenhall and Brandon INT .......................................................................................... 14
Population ......................................................................................................................................... 15
Population pyramids Mildenhall and Brandon INT ........................................................................ 15
Projected population change 2017 to 2028 ...................................................................................... 17
English as a second language ............................................................................................................ 18
People with learning disabilities in Mildenhall and Brandon ............................................................. 18
Wider determinants of health ................................................................................................................ 20
Wider determinants of health: deprivation and population ............................................................. 20
Mosaic ............................................................................................................................................... 25
Wider Determinants: Housing waiting list ......................................................................................... 26
Wider determinants of health: Homelessness .................................................................................. 27
Reasons for homelessness ................................................................................................................ 28
Wider determinants of health: Crime ............................................................................................... 29
Wider determinants of health: Access to dental care ....................................................................... 30
Wider determinants of health: Employment and the economy ........................................................ 30
Wider Determinants: Children and young people ............................................................................. 33
Primary care: GP QOF indicators ............................................................................................................ 37
GP key health indicators .................................................................................................................... 37
What is QOF data? ............................................................................................................................ 37
Cardiovascular health needs ............................................................................................................. 40
Mildenhall and Brandon INT: place-based needs assessment (2019)
Public Health Suffolk Page 3 of 97
Respiratory-based health needs ........................................................................................................ 47
Lifestyle-based health needs ............................................................................................................. 50
High dependency and long-term conditions ..................................................................................... 53
Mental Health ................................................................................................................................... 63
Hospital admissions ............................................................................................................................... 70
Top 5 emergency hospital admissions in Mildenhall and Brandon INT area by age group ............... 70
Top 5 Elective Hospital Admissions in Mildenhall and Brandon INT Area by age group .................... 72
Children and young people’s health ....................................................................................................... 75
Breastfeeding and Early Years ........................................................................................................... 75
Young People ..................................................................................................................................... 78
The National Child Measurement Programme .................................................................................. 78
Older People’s Health and Wellbeing ..................................................................................................... 81
Frailty................................................................................................................................................. 81
End-of-life care .................................................................................................................................. 84
References: ............................................................................................................................................ 87
Appendix 1: The Indices of Deprivation, 2015 ........................................................................................ 92
Income deprivation domain .......................................................................................................... 92
Employment deprivation domain .................................................................................................. 92
Education, skills and training deprivation domain ......................................................................... 92
Health deprivation and disability domain ...................................................................................... 92
Crime domain ................................................................................................................................ 93
Barriers to housing and services domain ....................................................................................... 93
Living environment deprivation domain........................................................................................ 93
Income deprivation affecting children index ................................................................................. 93
Appendix 2: Full segmentation data table for the INT, CCG and Suffolk ................................................. 94
Appendix 3: QOF exception rates ........................................................................................................... 95
Quality outcome framework: exception rates ................................................................................... 95
Exception reporting ........................................................................................................................... 95
Appendix 4: GP practice overview, including GP practice age profiles .................................................... 96
Appendix 5: The electronic frailty index (eFI) ......................................................................................... 97
Mildenhall and Brandon INT: place-based needs assessment (2019)
Public Health Suffolk Page 4 of 97
Executive summary This Place-Based Needs Assessment (PBNA) gives an overview of the Mildenhall and Brandon Integrated Neighbourhood Team’s (INT) locality to support understanding of the area’s health, needs, and wider determinants of health so that community-based, evidence-led work can be prioritised to improve health and reduce inequalities.
PBNAs focus on a place, not a condition or a specific population group. They mainly use publicly available data. Published data is robust and enables comparisons with areas outside Suffolk and with England, but publication is often delayed by some months and so can only give a snapshot rather than reflect the current situation. The Knowledge and Intelligence Team (Public Health Suffolk) are looking to add more up to date, local, unpublished data from INT members (for example data from adult social care, children and young people’s services, and Suffolk Fire) to the PBNAs where appropriate: please check the link below for the latest version.
PBNAs should be considered alongside the work that INTs are delivering in their area, that cannot easily be captured in national statistics (for example social prescribing, and health improvement initiatives).
The latest versions of the Suffolk PBNAs are available here, together with presentations or other supporting information: www.healthysuffolk.org.uk/jsna/pbna
If you have any questions about this PBNA, please contact [email protected]
INT members include staff from Suffolk County Council’s adult social care and children and young people’s services, health (including local GP practices), police, mental health, district and borough teams, and the voluntary sector.
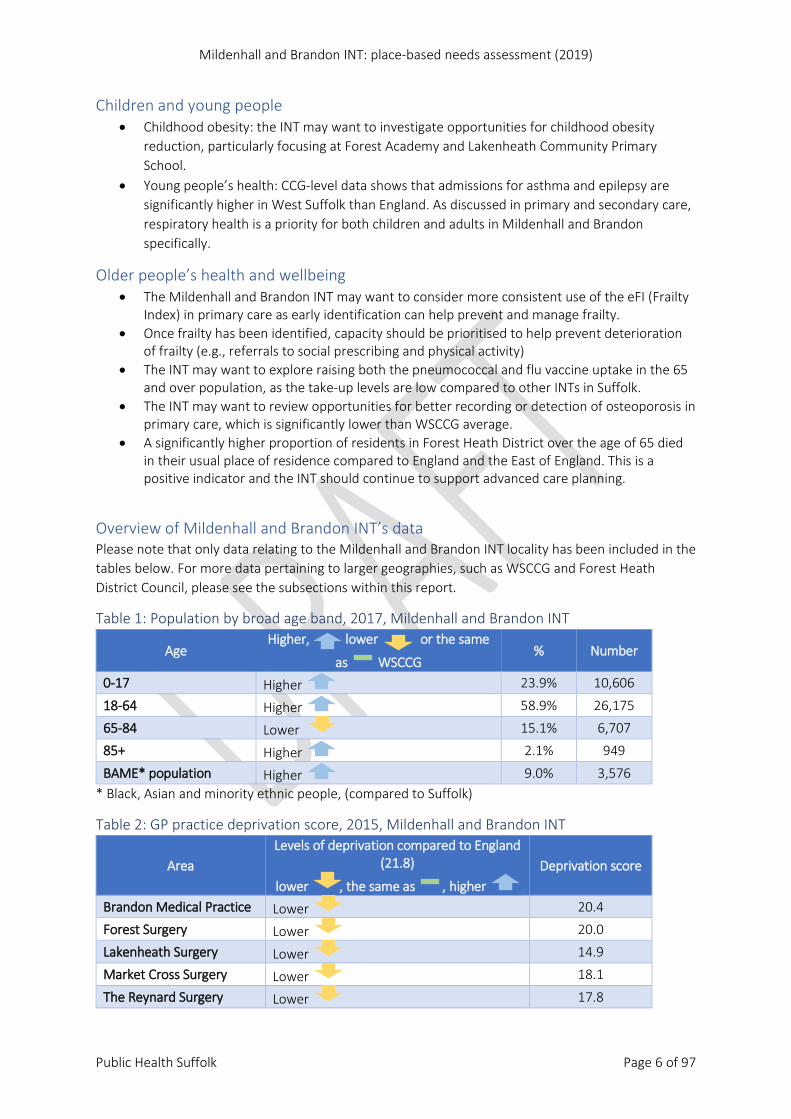
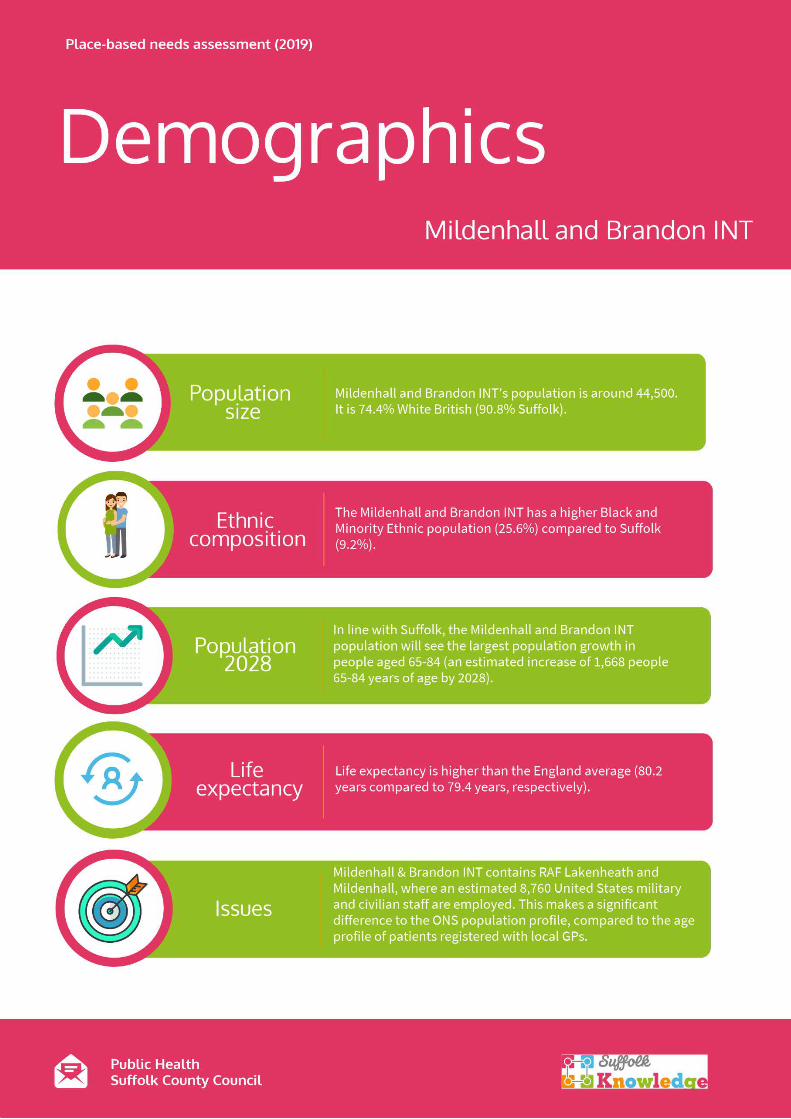
Demographics Mildenhall and Brandon INT’s population is around 44,500. It is 74.4% White British (90.8% Suffolk), indicating a more ethnically diverse population within this INT.
• Life expectancy is statistically significantly higher than the England average (80.2 years compared to 79.4 years, respectively).
• Mildenhall and Brandon INT contains RAF Lakenheath and Mildenhall, where an estimated 8,760 United States military and civilian staff are employed, as well as 560 UK civilian personnel1. This makes a significant difference to the Office for National Statistics (ONS) population profile, compared to the age profile of patients registered with local GPs.
• The population registered with a local GP is relatively young compared to Suffolk (17.2% people are aged 65 or over, compared to 21.9% for West Suffolk CCG (WSCCG)).
• Like Suffolk, the Mildenhall and Brandon INT population is forecast to experience the largest population growth in people aged 65-84 (an estimated increase of 1,668 people 65-84 years of age by 2028).
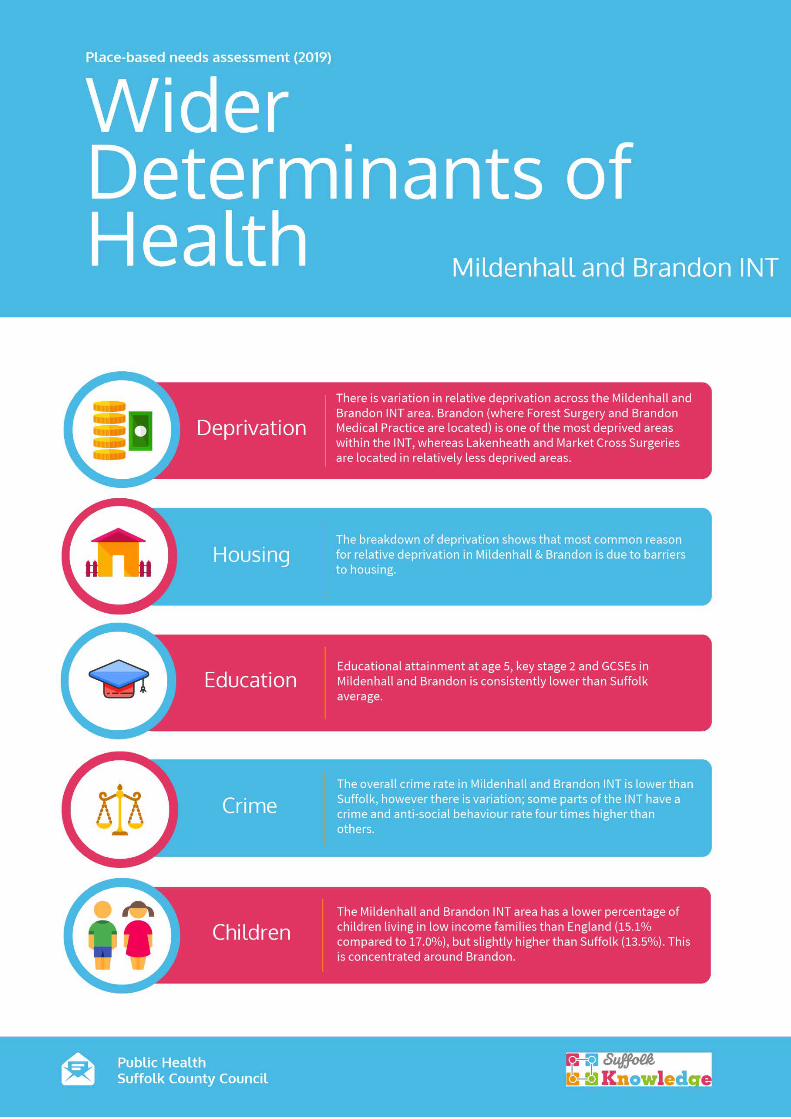
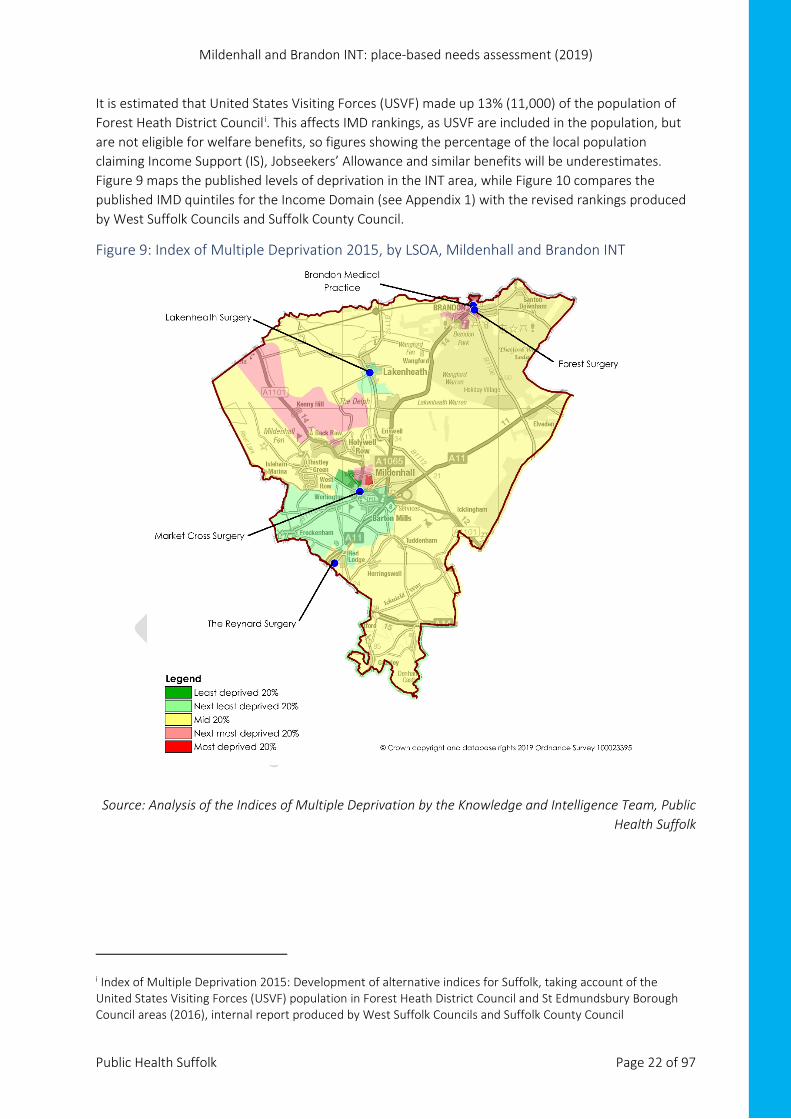
Wider determinants of health • Deprivation: as shown in Figure 9, there is notable variation in relative deprivation across the
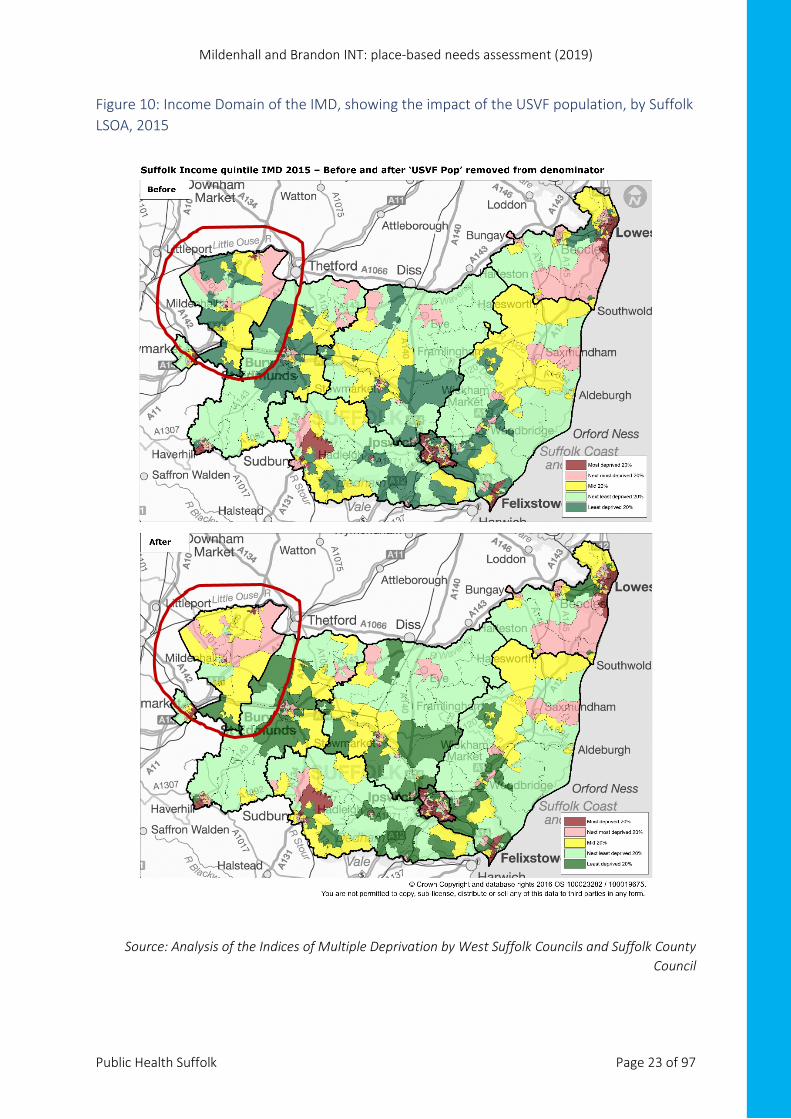
Mildenhall and Brandon INT area. Brandon (where Forest Surgery and Brandon Medical Practice are located) is one of the most deprived areas within the INT, whereas Lakenheath and Market Cross Surgeries are located in relatively less deprived areas. Figure 10 shows the likely impact of US forces on relative deprivation.
Mildenhall and Brandon INT: place-based needs assessment (2019)
Public Health Suffolk Page 5 of 97
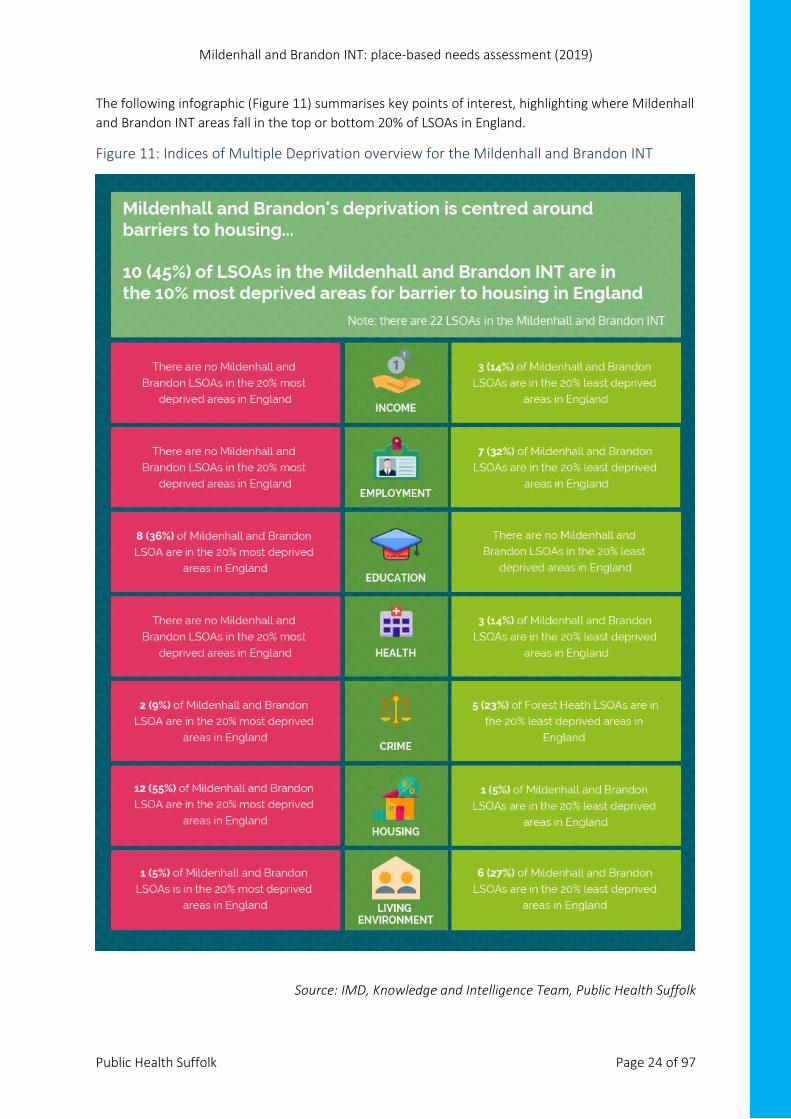
• Housing barriers: the breakdown of deprivation shows that most common reason for relative deprivation in Mildenhall and Brandon is due to barriers to housing.
• Crime: the overall crime rate in Mildenhall and Brandon INT is lower than Suffolk, however there is variation; some parts of the INT have a crime and anti-social behaviour rate four times higher than others.
• Childhood poverty: the Mildenhall and Brandon INT area has a lower percentage of children living in low income families than England (15.1% compared to 17.0%), but slightly higher than Suffolk (13.5%). As shown in figure X, this is concentrated around Brandon.
• Children and educational attainment: educational attainment at age 5, key stage 2 and GCSEs in Mildenhall and Brandon is consistently lower than Suffolk average.
Primary care
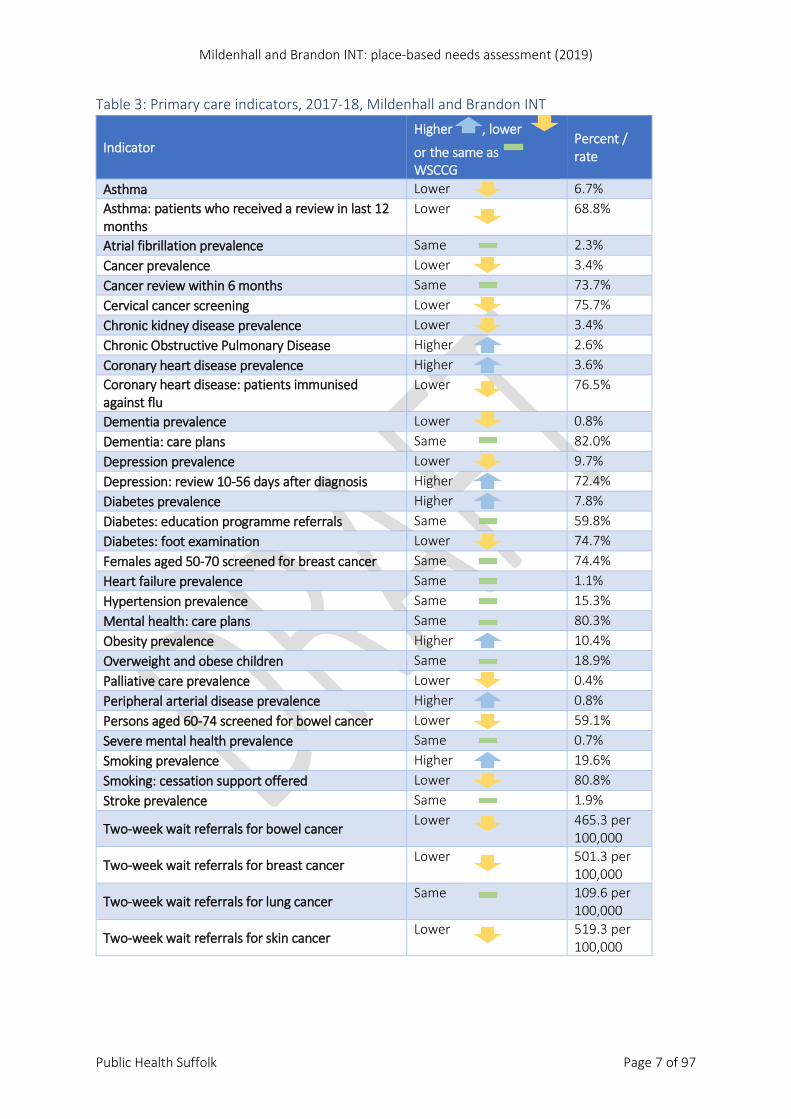
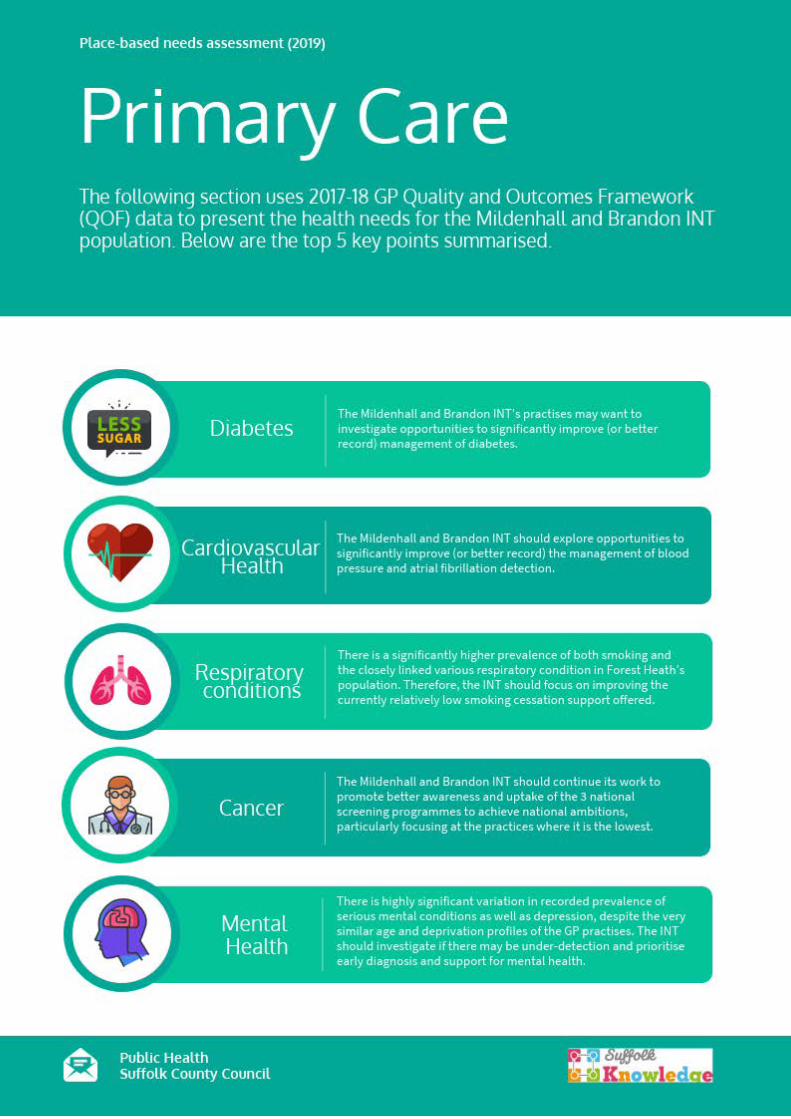
• Diabetes: Mildenhall and Brandon’s INT may want to investigate opportunities to significantly improve (or better record) management of diabetes.
• Cardiovascular Health: Mildenhall and Brandon’s INT may want to explore opportunities to significantly improve (or better record) the management of blood pressure and AF detection.
• Respiratory health: the Mildenhall and Brandon INT may want to focus on improving the low proportion of smoking cessation support offered as well as investigate opportunities to significantly improve (or better record) management of respiratory conditions, particularly as this links to high emergency admissions for asthma and COPD in secondary care.
• Cancer: the INT should continue its work to promote better awareness and uptake of the 3 national screening programmes to achieve national ambitions, particularly focusing at the practices where it is the lowest.
• Mental Health: there is variation in recorded prevalence of serious mental conditions as well as depression, despite the similar age and deprivation profiles of the GP practices. The INT may want to investigate opportunities for early diagnosis and support for mental health.
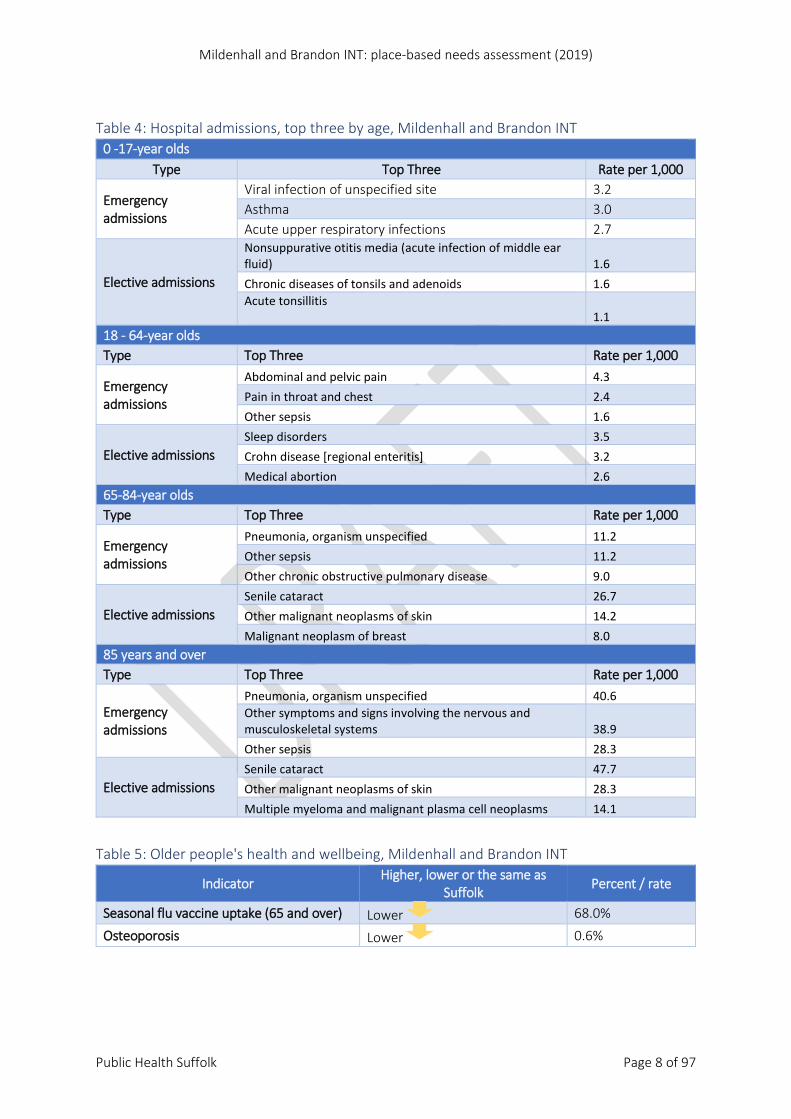
Hospital admissions • Pneumonia is the most common emergency admission in Mildenhall and Brandon for those
aged over 65. In light of this, the INT may want to focus on raising both the pneumococcal and flu vaccine (PPV) uptake in the 65 and over population, particularly as the INT has the lowest PPV uptake in Suffolk and a significantly lower flu vaccine uptake than Suffolk and England averages.
• Respiratory health: both in children (0-17) and in adults (18-84), respiratory conditions are one of the top drivers of emergency admission demand, which links to the opportunity of better management of respiratory conditions discussed in the primary care section above.
• In children (0-17), ear, nose and throat (ENT) infections are a leading cause of elective admissions. The INT could consider options for better management of ENT conditions in the community.
• Iron deficiency anaemia is the fifth most common elective admission for those aged over 85. The INT may want to review community-based interventions as iron deficiency admissions can be preventable.
Mildenhall and Brandon INT: place-based needs assessment (2019)
Public Health Suffolk Page 6 of 97
Children and young people • Childhood obesity: the INT may want to investigate opportunities for childhood obesity
reduction, particularly focusing at Forest Academy and Lakenheath Community Primary School.
• Young people’s health: CCG-level data shows that admissions for asthma and epilepsy are significantly higher in West Suffolk than England. As discussed in primary and secondary care, respiratory health is a priority for both children and adults in Mildenhall and Brandon specifically.
Older people’s health and wellbeing • The Mildenhall and Brandon INT may want to consider more consistent use of the eFI (Frailty
Index) in primary care as early identification can help prevent and manage frailty. • Once frailty has been identified, capacity should be prioritised to help prevent deterioration
of frailty (e.g., referrals to social prescribing and physical activity) • The INT may want to explore raising both the pneumococcal and flu vaccine uptake in the 65
and over population, as the take-up levels are low compared to other INTs in Suffolk. • The INT may want to review opportunities for better recording or detection of osteoporosis in
primary care, which is significantly lower than WSCCG average. • A significantly higher proportion of residents in Forest Heath District over the age of 65 died
in their usual place of residence compared to England and the East of England. This is a positive indicator and the INT should continue to support advanced care planning.
Overview of Mildenhall and Brandon INT’s data Please note that only data relating to the Mildenhall and Brandon INT locality has been included in the tables below. For more data pertaining to larger geographies, such as WSCCG and Forest Heath District Council, please see the subsections within this report.
Table 1: Population by broad age band, 2017, Mildenhall and Brandon INT
Age Higher, lower or the same
as WSCCG % Number
0-17 Higher 23.9% 10,606
18-64 Higher 58.9% 26,175
65-84 Lower 15.1% 6,707
85+ Higher 2.1% 949
BAME* population Higher 9.0% 3,576 * Black, Asian and minority ethnic people, (compared to Suffolk)
Table 2: GP practice deprivation score, 2015, Mildenhall and Brandon INT
Area Levels of deprivation compared to England
(21.8)
lower , the same as , higher Deprivation score
Brandon Medical Practice Lower 20.4
Forest Surgery Lower 20.0
Lakenheath Surgery Lower 14.9
Market Cross Surgery Lower 18.1
The Reynard Surgery Lower 17.8
Mildenhall and Brandon INT: place-based needs assessment (2019)
Public Health Suffolk Page 7 of 97
Table 3: Primary care indicators, 2017-18, Mildenhall and Brandon INT
Indicator Higher , lower
or the same as WSCCG
Percent / rate
Asthma Lower 6.7% Asthma: patients who received a review in last 12 months
Lower 68.8%
Atrial fibrillation prevalence Same 2.3% Cancer prevalence Lower 3.4% Cancer review within 6 months Same 73.7% Cervical cancer screening Lower 75.7% Chronic kidney disease prevalence Lower 3.4% Chronic Obstructive Pulmonary Disease Higher 2.6% Coronary heart disease prevalence Higher 3.6% Coronary heart disease: patients immunised against flu
Lower 76.5%
Dementia prevalence Lower 0.8% Dementia: care plans Same 82.0% Depression prevalence Lower 9.7% Depression: review 10-56 days after diagnosis Higher 72.4% Diabetes prevalence Higher 7.8% Diabetes: education programme referrals Same 59.8% Diabetes: foot examination Lower 74.7% Females aged 50-70 screened for breast cancer Same 74.4% Heart failure prevalence Same 1.1% Hypertension prevalence Same 15.3% Mental health: care plans Same 80.3% Obesity prevalence Higher 10.4% Overweight and obese children Same 18.9% Palliative care prevalence Lower 0.4% Peripheral arterial disease prevalence Higher 0.8% Persons aged 60-74 screened for bowel cancer Lower 59.1% Severe mental health prevalence Same 0.7% Smoking prevalence Higher 19.6% Smoking: cessation support offered Lower 80.8% Stroke prevalence Same 1.9%
Two-week wait referrals for bowel cancer Lower 465.3 per 100,000
Two-week wait referrals for breast cancer Lower 501.3 per 100,000
Two-week wait referrals for lung cancer Same 109.6 per 100,000
Two-week wait referrals for skin cancer Lower 519.3 per 100,000
Mildenhall and Brandon INT: place-based needs assessment (2019)
Public Health Suffolk Page 8 of 97
Table 4: Hospital admissions, top three by age, Mildenhall and Brandon INT
0 -17-year olds Type Top Three Rate per 1,000
Emergency admissions
Viral infection of unspecified site 3.2 Asthma 3.0 Acute upper respiratory infections 2.7
Elective admissions
Nonsuppurative otitis media (acute infection of middle ear fluid) 1.6 Chronic diseases of tonsils and adenoids 1.6 Acute tonsillitis 1.1
18 - 64-year olds Type Top Three Rate per 1,000
Emergency admissions
Abdominal and pelvic pain 4.3 Pain in throat and chest 2.4 Other sepsis 1.6
Elective admissions Sleep disorders 3.5 Crohn disease [regional enteritis] 3.2 Medical abortion 2.6
65-84-year olds Type Top Three Rate per 1,000
Emergency admissions
Pneumonia, organism unspecified 11.2 Other sepsis 11.2 Other chronic obstructive pulmonary disease 9.0
Elective admissions Senile cataract 26.7 Other malignant neoplasms of skin 14.2 Malignant neoplasm of breast 8.0
85 years and over Type Top Three Rate per 1,000
Emergency admissions
Pneumonia, organism unspecified 40.6 Other symptoms and signs involving the nervous and musculoskeletal systems 38.9 Other sepsis 28.3
Elective admissions Senile cataract 47.7 Other malignant neoplasms of skin 28.3 Multiple myeloma and malignant plasma cell neoplasms 14.1
Table 5: Older people's health and wellbeing, Mildenhall and Brandon INT
Indicator Higher, lower or the same as Suffolk Percent / rate
Seasonal flu vaccine uptake (65 and over) Lower 68.0%
Osteoporosis Lower 0.6%
Mildenhall and Brandon INT: place-based needs assessment (2019)
Public Health Suffolk Page 9 of 97
Introduction: Place-based needs assessments Place-Based Needs Assessments (PBNAs) are intended to give an overview of an Integrated Neighbourhood Team’s (INT) locality, to support the Team’s understanding the health, needs, and wider determinants of health for their area so they can prioritise a community-based, evidence-led programme of work.
PBNAs focus on a place, not a condition or a specific population group. They mainly use publicly available data. Published data is robust and enables comparisons with areas outside Suffolk and with England, but publication is often delayed by some months and so can only give a snapshot rather than reflect the current situation. The Knowledge and Intelligence Team (Public Health Suffolk) are looking to add more up to date, local, unpublished data from INT members (for example data from adult social care, children and young people’s services, and Suffolk Fire) to the PBNAs where appropriate: please check the link below for the latest version.
PBNAs should be considered alongside the work that INTs are delivering in their area, that cannot easily be captured in national statistics (for example social prescribing, and health improvement initiatives).
The latest versions of the Suffolk PBNAs are available here, together with presentations or other supporting information: www.healthysuffolk.org.uk/jsna/pbna
If you have any questions about this PBNA, please contact [email protected]
These reports have been produced for INT areas in the Ipswich and East Suffolk and West Suffolk Clinical Commissioning Group areas2. INTs include staff from Suffolk County Council’s adult social care and children and young people’s services, health (including local GP practices), police, mental health, district and borough teams, and the voluntary sector.
Geographies INTs were originally developed from the working areas for adult and social care teams’ locality teams. They may cut across primary care networks (PCNs), wards and electoral divisions.
On 1 April 2019: • West Suffolk Council replaced Forest Heath District Council and St Edmundsbury Borough
Council • East Suffolk Council replaced Suffolk Coastal District Council and Waveney District Council
Although this report was created after these changes, most of the sources for the data in the report use the pre-2019 council areas, so these geographies are still used.
Wherever possible, information is given at an INT level. These are not “standard” geographies; they are created by aggregating data from a lower level. The lower level data is usually for Lower-layer Super Output Areas (LSOAs), created by the Office for National Statistics. These are designed to be stable, permanent geographies, with similar population sizes and to be as socially homogenous as possible. They have 1,000 – 3,000 population and 400 – 1,200 households3.
Some data is produced for the GP practices within an INT. These use NHS boundaries, not LSOAs.
Mildenhall and Brandon INT: place-based needs assessment (2019)
Public Health Suffolk Page 10 of 97
Table 6: Language and abbreviations Acronym Full term Definition A&E Accident and Emergency BAME Black, Asian and minority
ethnic people
CCG Clinical Commissioning Group CCGs were created following the Health and Social Care Act in 2012 and replaced Primary Care Trusts on 1st April 2013. They are clinically-led statutory NHS bodies responsible for the planning and commissioning of health care services for their local area.
DLA Disability Living Allowance Department for Work and Pensions’ payment that is being replaced (from 2013) by Personal Independence Payment (PIP) for people of working age.
DWP Department for Work and Pensions
HES Hospital Episode Statistics Hospital Episode Statistics (HES): a database containing details of all admissions, A and E attendances and outpatient appointments at NHS hospitals in England.
INT Integrated Neighbourhood Team
A typical INT will consist of staff from several different teams/professions: social care for adults and children/families, health, police, mental health, district and borough teams, along with the voluntary sector. The staff from these different teams will work together to deliver several key health and social care objectives.
LSOA Lower-level Super Output Area A Lower Layer Super Output Area (LSOA) is a geographical area. These areas can be viewed as local neighbourhoods. LSOAs are a geographic hierarchy designed to improve the reporting of small area statistics in England and Wales. The Minimum population is 1,000 and the mean is 1,500.
MSOA Middle Layer Super Output Area
Middle Layer Super Output Areas (MSOAs) are built from groups of contiguous Lower Layer Super Output Areas. The minimum population is 5,000 and the mean is 7,200.
ONS Office for National Statistics The ONS is The UK’s largest independent producer of official statistics and the recognised national statistical institute of the UK.
PHE Public Health England Executive agency of the Department of Health and Social Care, that aims to protect and improve the nation's health and wellbeing, and reduce health inequalities4.
PIP Personal Independence Payment
A benefit to help with some of the extra costs caused by long term disability, ill-health or terminal ill-health.
Mildenhall and Brandon INT: place-based needs assessment (2019)
Public Health Suffolk Page 11 of 97
Acronym Full term Definition From 8th April 2013 DWP started to replace Disability Living Allowance (DLA) for working age people with Personal Independence Payment (PIP).
QOF Quality Outcomes Framework The Quality and Outcomes Framework is a system for the performance management and payment of general practitioners in the National Health Service in England, Wales, Scotland and Northern Ireland.
WSCCG West Suffolk CCG WSCCG is the clinically-led statutory NHS body responsible for the planning and commissioning of health care services for the West of Suffolk.
Forecasts Forecasts and future trends in this report are based on published work. We can’t anticipate all changes, so they suggest what the area might look like, given our current knowledge, and if nothing changes: a “do nothing” scenario.
Wherever possible, forecasts or projections are given for 2028, the final year in the NHS long term plan5.
Population estimates including US military Mildenhall and Brandon INT contains RAF Lakenheath and Mildenhall, where an estimated 8,760 United States military and civilian staff are employed. This makes a significant difference to the population profile. The forecasts and projections used in this PBNA are based on ONS figures and calculations that may not completely reflect the local situation. They are used here as they are the figures published nationally, however local knowledge should also be used when considering service design. Figure 3 below in Demographics report section compares the estimated population (ONS) against patients registered with the INT’s GP practices to illustrate the potential differences: most US personnel will not be registered with an NHS GP. Figure 10 shows the impact on the Index of Multiple Deprivation (IMD) rankings.
Although the US military personnel affect population forecasts and some wider determinant data, they do not have a significant impact on the following data:
• Housing; • Homelessness; • Primary care; • Children and Young People; and • Elderly.
Rounding and disclosure It is important that individuals should not be identifiable from published data, either directly or indirectly. If data are published for very small populations, small counts can disclose information about individuals.
Methods to avoid this include:6 • rounding to the nearest 5, 10, 100 etc • not publishing (suppressing) small numbers • swapping (“randomly muddling the individual records prior to any analysis to a degree that
would not affect aggregate analyses”7)
Mildenhall and Brandon INT: place-based needs assessment (2019)
Public Health Suffolk Page 12 of 97
Confidence intervals The data in this document is significant to 95%. This is known as the confidence interval. A 95% confidence interval is an interval generated by a process that's right 95% of the time.
A confidence interval gives the likely range of values for a population based on the ‘estimate’ we obtain when we sample that population. The difference between two groups is ‘statistically significant’ if their confidence intervals don’t overlap (the estimated ranges of possible values are distinct).
Significance In this report, if a number or percentage is said to be “significantly” different, this means that the difference is not likely to be due to chance and their confidence intervals (explained next) don’t overlap8,9.
Mildenhall and Brandon INT: place-based needs assessment (2019)
Public Health Suffolk Page 13 of 97
Mildenhall and Brandon INT: place-based needs assessment (2019)
Public Health Suffolk Page 14 of 97
Demographics: Mildenhall and Brandon INT Understanding how a population has changed in the past can help project how a population may appear in the future, whether by complex calculations or simple facts. For example, the “baby boomers” born in the 1960s will be in “older age” by 204110. These projections can then inform future health and care planning. Below are some key facts regarding space, place and population in across the Mildenhall and Brandon INT.
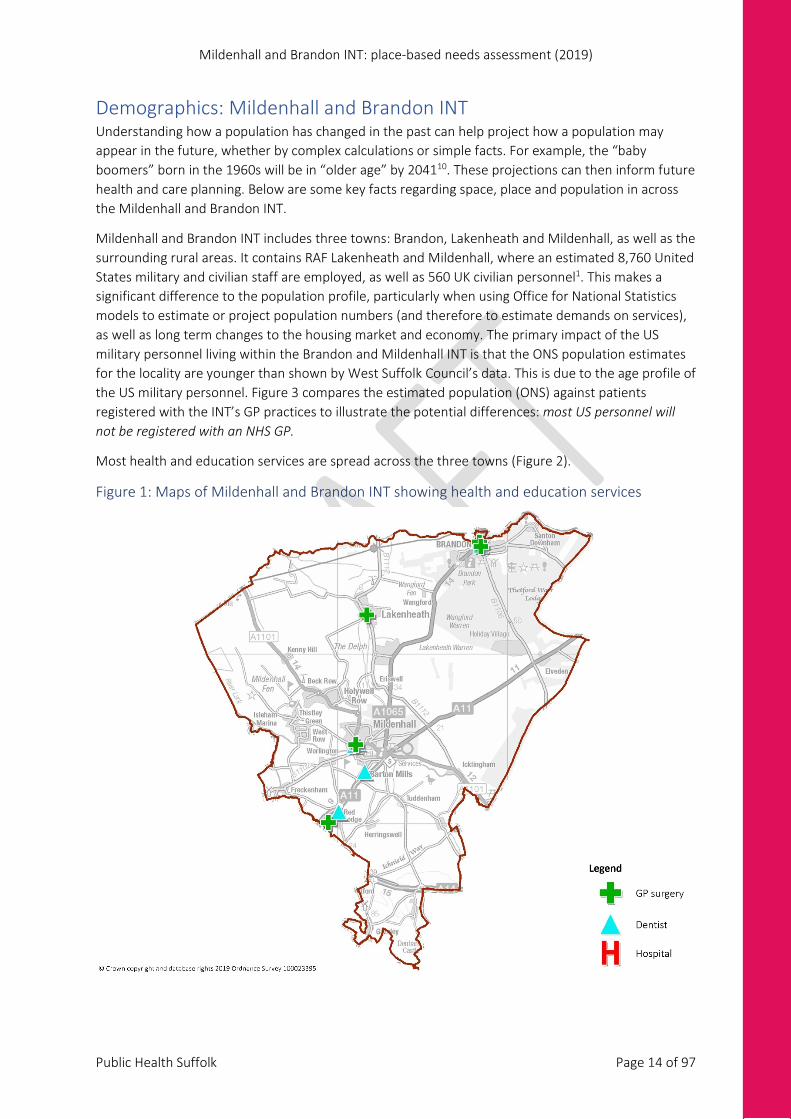
Mildenhall and Brandon INT includes three towns: Brandon, Lakenheath and Mildenhall, as well as the surrounding rural areas. It contains RAF Lakenheath and Mildenhall, where an estimated 8,760 United States military and civilian staff are employed, as well as 560 UK civilian personnel1. This makes a significant difference to the population profile, particularly when using Office for National Statistics models to estimate or project population numbers (and therefore to estimate demands on services), as well as long term changes to the housing market and economy. The primary impact of the US military personnel living within the Brandon and Mildenhall INT is that the ONS population estimates for the locality are younger than shown by West Suffolk Council’s data. This is due to the age profile of the US military personnel. Figure 3 compares the estimated population (ONS) against patients registered with the INT’s GP practices to illustrate the potential differences: most US personnel will not be registered with an NHS GP.
Most health and education services are spread across the three towns (Figure 2).
Figure 1: Maps of Mildenhall and Brandon INT showing health and education services
Mildenhall and Brandon INT: place-based needs assessment (2019)
Public Health Suffolk Page 15 of 97
Source: Knowledge and Intelligence Team, Public Health Suffolk
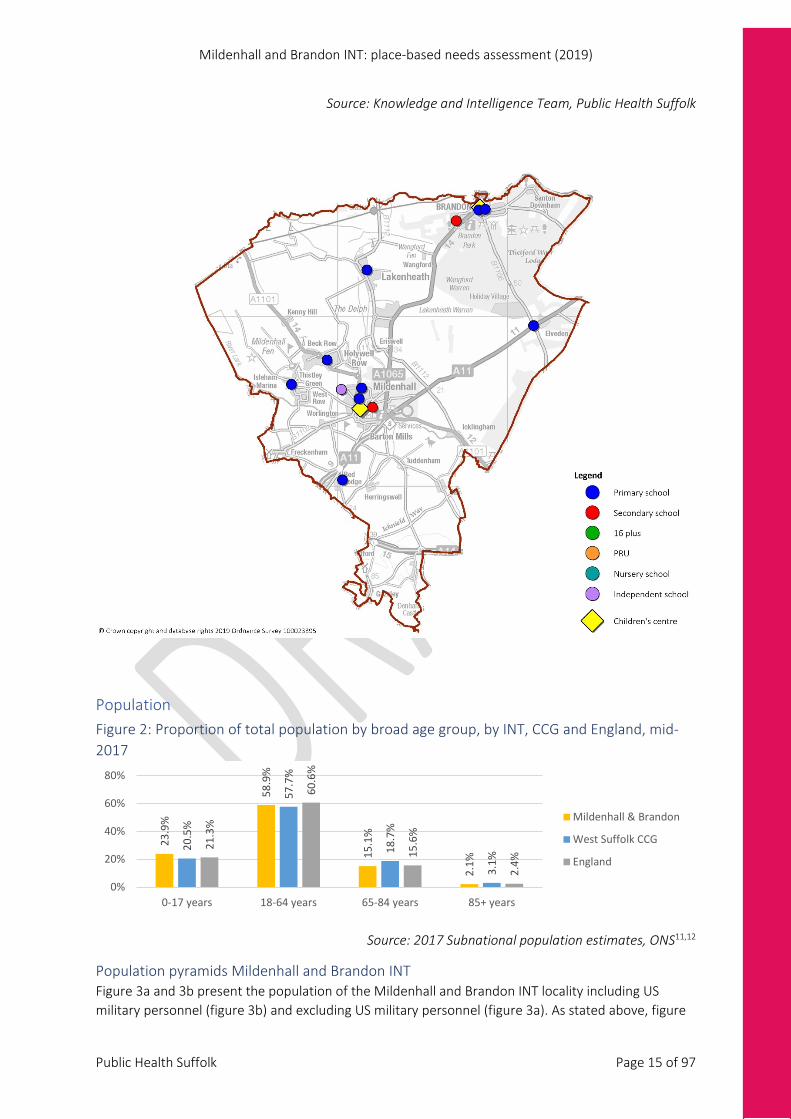
Population Figure 2: Proportion of total population by broad age group, by INT, CCG and England, mid-2017
Source: 2017 Subnational population estimates, ONS11,12
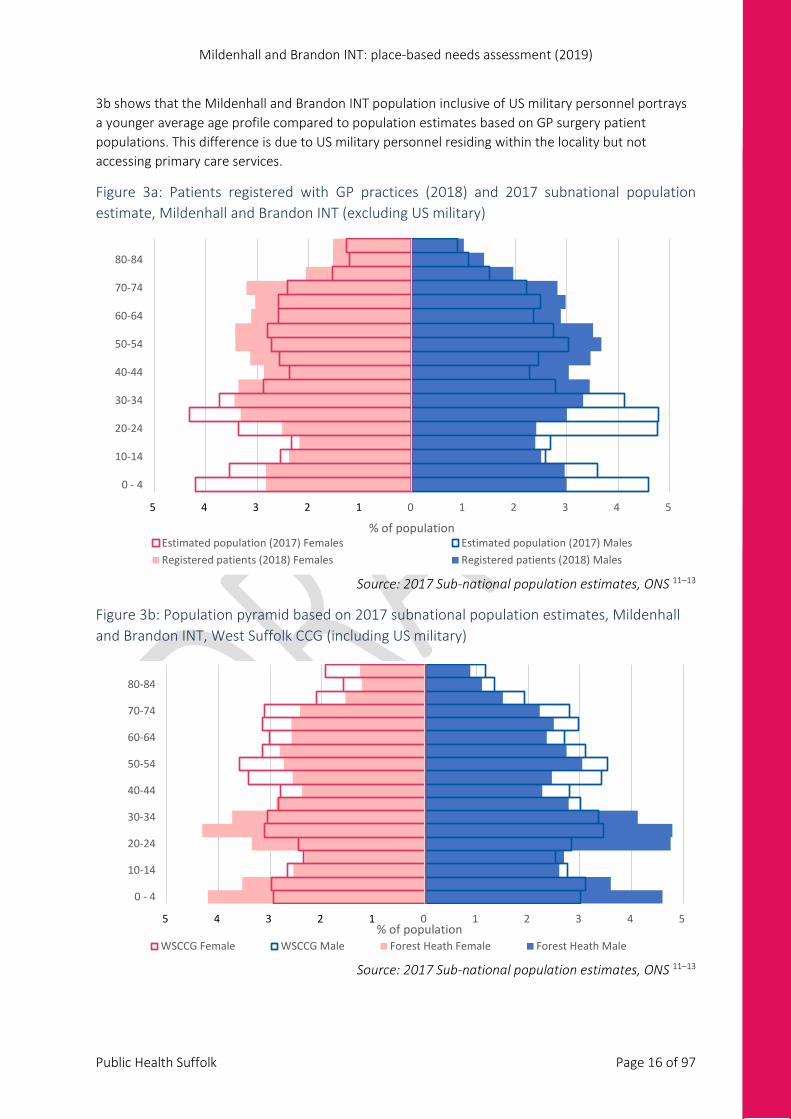
Population pyramids Mildenhall and Brandon INT Figure 3a and 3b present the population of the Mildenhall and Brandon INT locality including US military personnel (figure 3b) and excluding US military personnel (figure 3a). As stated above, figure
23.9
%
58.9
%
15.1
%
2.1%
20.5
%
57.7
%
18.7
%
3.1%
21.3
%
60.6
%
15.6
%
2.4%
0%
20%
40%
60%
80%
0-17 years 18-64 years 65-84 years 85+ years
Mildenhall & Brandon
West Suffolk CCG
England
Mildenhall and Brandon INT: place-based needs assessment (2019)
Public Health Suffolk Page 16 of 97
3b shows that the Mildenhall and Brandon INT population inclusive of US military personnel portrays a younger average age profile compared to population estimates based on GP surgery patient populations. This difference is due to US military personnel residing within the locality but not accessing primary care services.
Figure 3a: Patients registered with GP practices (2018) and 2017 subnational population estimate, Mildenhall and Brandon INT (excluding US military)
Source: 2017 Sub-national population estimates, ONS 11–13
Figure 3b: Population pyramid based on 2017 subnational population estimates, Mildenhall and Brandon INT, West Suffolk CCG (including US military)
Source: 2017 Sub-national population estimates, ONS 11–13
5 4 3 2 1 0 1 2 3 4 5
0 - 4
10-14
20-24
30-34
40-44
50-54
60-64
70-74
80-84
% of populationEstimated population (2017) Females Estimated population (2017) MalesRegistered patients (2018) Females Registered patients (2018) Males
5 4 3 2 1 0 1 2 3 4 5
0 - 4
10-14
20-24
30-34
40-44
50-54
60-64
70-74
80-84
% of populationWSCCG Female WSCCG Male Forest Heath Female Forest Heath Male
Mildenhall and Brandon INT: place-based needs assessment (2019)
Public Health Suffolk Page 17 of 97
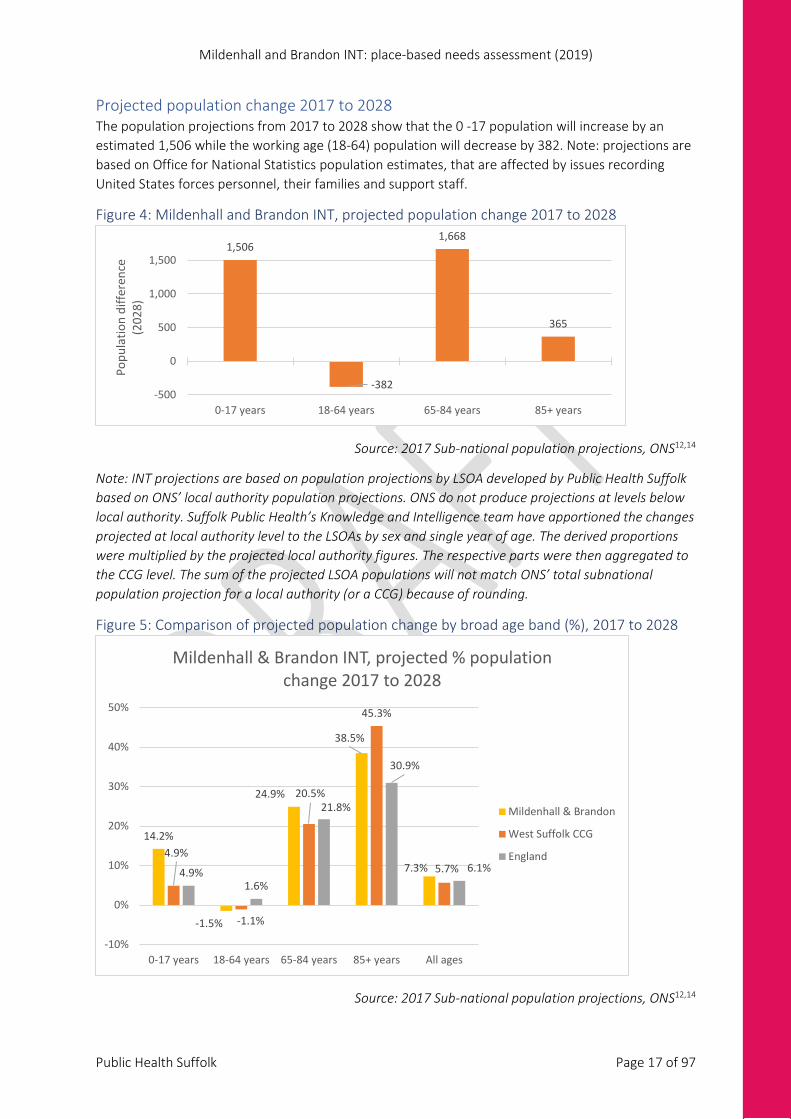
Projected population change 2017 to 2028 The population projections from 2017 to 2028 show that the 0 -17 population will increase by an estimated 1,506 while the working age (18-64) population will decrease by 382. Note: projections are based on Office for National Statistics population estimates, that are affected by issues recording United States forces personnel, their families and support staff.
Figure 4: Mildenhall and Brandon INT, projected population change 2017 to 2028
Source: 2017 Sub-national population projections, ONS12,14
Note: INT projections are based on population projections by LSOA developed by Public Health Suffolk based on ONS’ local authority population projections. ONS do not produce projections at levels below local authority. Suffolk Public Health’s Knowledge and Intelligence team have apportioned the changes projected at local authority level to the LSOAs by sex and single year of age. The derived proportions were multiplied by the projected local authority figures. The respective parts were then aggregated to the CCG level. The sum of the projected LSOA populations will not match ONS’ total subnational population projection for a local authority (or a CCG) because of rounding.
Figure 5: Comparison of projected population change by broad age band (%), 2017 to 2028
Source: 2017 Sub-national population projections, ONS12,14
1,506
-382
1,668
365
-500
0
500
1,000
1,500
0-17 years 18-64 years 65-84 years 85+ years
Popu
latio
n di
ffere
nce
(202
8)
14.2%
-1.5%
24.9%
38.5%
7.3%4.9%
-1.1%
20.5%
45.3%
5.7%4.9%1.6%
21.8%
30.9%
6.1%
-10%
0%
10%
20%
30%
40%
50%
0-17 years 18-64 years 65-84 years 85+ years All ages
Mildenhall & Brandon INT, projected % population change 2017 to 2028
Mildenhall & Brandon
West Suffolk CCG
England
Mildenhall and Brandon INT: place-based needs assessment (2019)
Public Health Suffolk Page 18 of 97
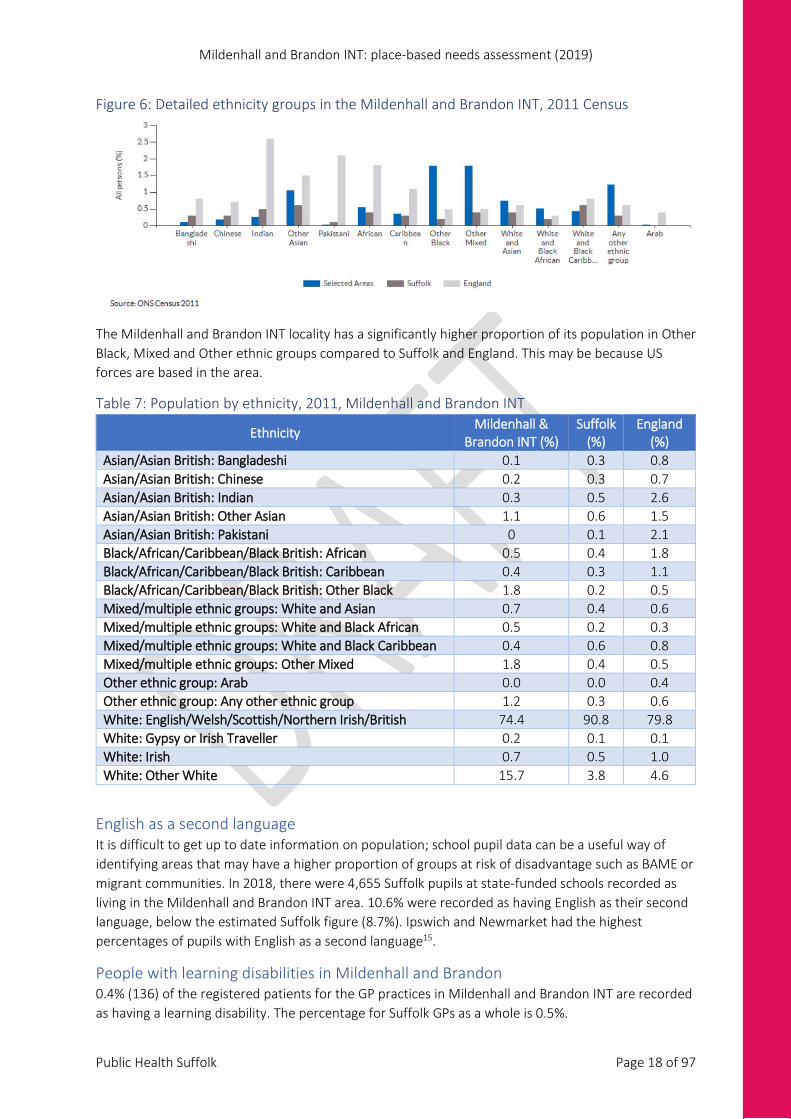
Figure 6: Detailed ethnicity groups in the Mildenhall and Brandon INT, 2011 Census
The Mildenhall and Brandon INT locality has a significantly higher proportion of its population in Other Black, Mixed and Other ethnic groups compared to Suffolk and England. This may be because US forces are based in the area.
Table 7: Population by ethnicity, 2011, Mildenhall and Brandon INT
Ethnicity Mildenhall & Brandon INT (%)
Suffolk (%)
England (%)
Asian/Asian British: Bangladeshi 0.1 0.3 0.8 Asian/Asian British: Chinese 0.2 0.3 0.7 Asian/Asian British: Indian 0.3 0.5 2.6 Asian/Asian British: Other Asian 1.1 0.6 1.5 Asian/Asian British: Pakistani 0 0.1 2.1 Black/African/Caribbean/Black British: African 0.5 0.4 1.8 Black/African/Caribbean/Black British: Caribbean 0.4 0.3 1.1 Black/African/Caribbean/Black British: Other Black 1.8 0.2 0.5 Mixed/multiple ethnic groups: White and Asian 0.7 0.4 0.6 Mixed/multiple ethnic groups: White and Black African 0.5 0.2 0.3 Mixed/multiple ethnic groups: White and Black Caribbean 0.4 0.6 0.8 Mixed/multiple ethnic groups: Other Mixed 1.8 0.4 0.5 Other ethnic group: Arab 0.0 0.0 0.4 Other ethnic group: Any other ethnic group 1.2 0.3 0.6 White: English/Welsh/Scottish/Northern Irish/British 74.4 90.8 79.8 White: Gypsy or Irish Traveller 0.2 0.1 0.1 White: Irish 0.7 0.5 1.0 White: Other White 15.7 3.8 4.6
English as a second language It is difficult to get up to date information on population; school pupil data can be a useful way of identifying areas that may have a higher proportion of groups at risk of disadvantage such as BAME or migrant communities. In 2018, there were 4,655 Suffolk pupils at state-funded schools recorded as living in the Mildenhall and Brandon INT area. 10.6% were recorded as having English as their second language, below the estimated Suffolk figure (8.7%). Ipswich and Newmarket had the highest percentages of pupils with English as a second language15.
People with learning disabilities in Mildenhall and Brandon 0.4% (136) of the registered patients for the GP practices in Mildenhall and Brandon INT are recorded as having a learning disability. The percentage for Suffolk GPs as a whole is 0.5%.
Mildenhall and Brandon INT: place-based needs assessment (2019)
Public Health Suffolk Page 19 of 97
Mildenhall and Brandon INT: place-based needs assessment (2019)
Public Health Suffolk Page 20 of 97
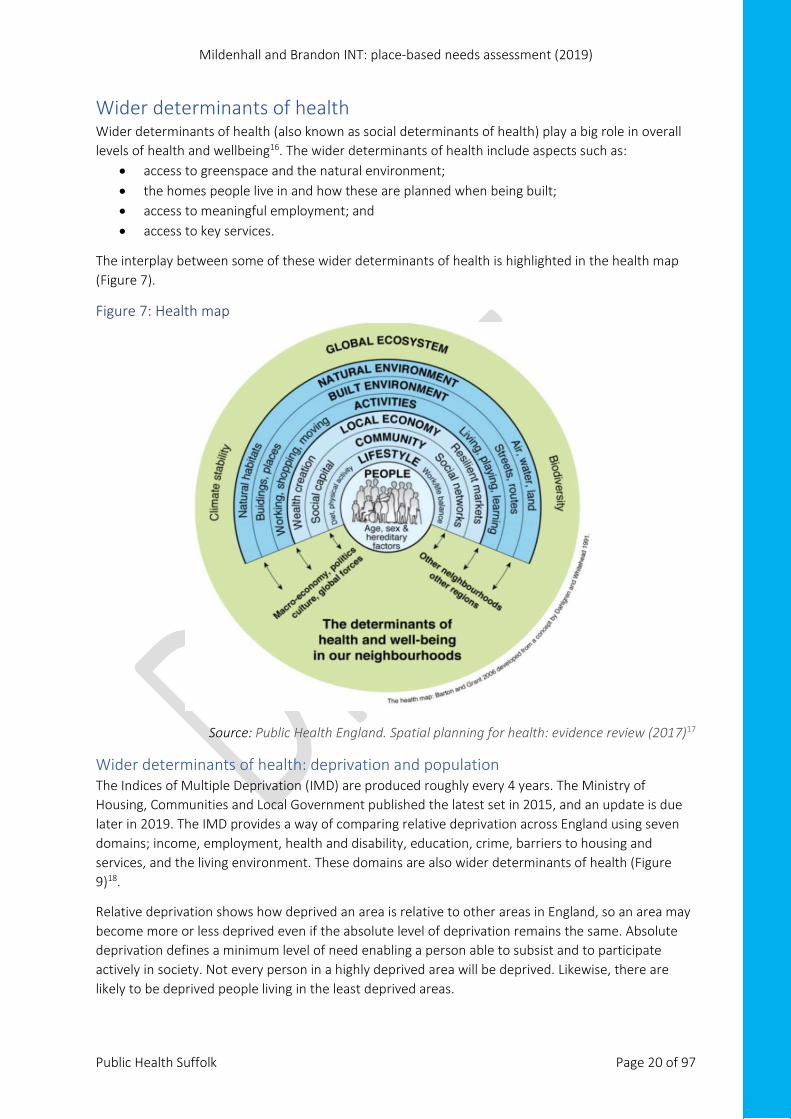
Wider determinants of health Wider determinants of health (also known as social determinants of health) play a big role in overall levels of health and wellbeing16. The wider determinants of health include aspects such as:
• access to greenspace and the natural environment; • the homes people live in and how these are planned when being built; • access to meaningful employment; and • access to key services.
The interplay between some of these wider determinants of health is highlighted in the health map (Figure 7).
Figure 7: Health map
Source: Public Health England. Spatial planning for health: evidence review (2017)17
Wider determinants of health: deprivation and population The Indices of Multiple Deprivation (IMD) are produced roughly every 4 years. The Ministry of Housing, Communities and Local Government published the latest set in 2015, and an update is due later in 2019. The IMD provides a way of comparing relative deprivation across England using seven domains; income, employment, health and disability, education, crime, barriers to housing and services, and the living environment. These domains are also wider determinants of health (Figure 9)18.
Relative deprivation shows how deprived an area is relative to other areas in England, so an area may become more or less deprived even if the absolute level of deprivation remains the same. Absolute deprivation defines a minimum level of need enabling a person able to subsist and to participate actively in society. Not every person in a highly deprived area will be deprived. Likewise, there are likely to be deprived people living in the least deprived areas.
Mildenhall and Brandon INT: place-based needs assessment (2019)
Public Health Suffolk Page 21 of 97
Each domain includes several different indicators such as: crime rate, central heating availability, proportion of the working-age population who cannot speak English or cannot speak it ‘well’, receipt of Jobseekers Allowance19.
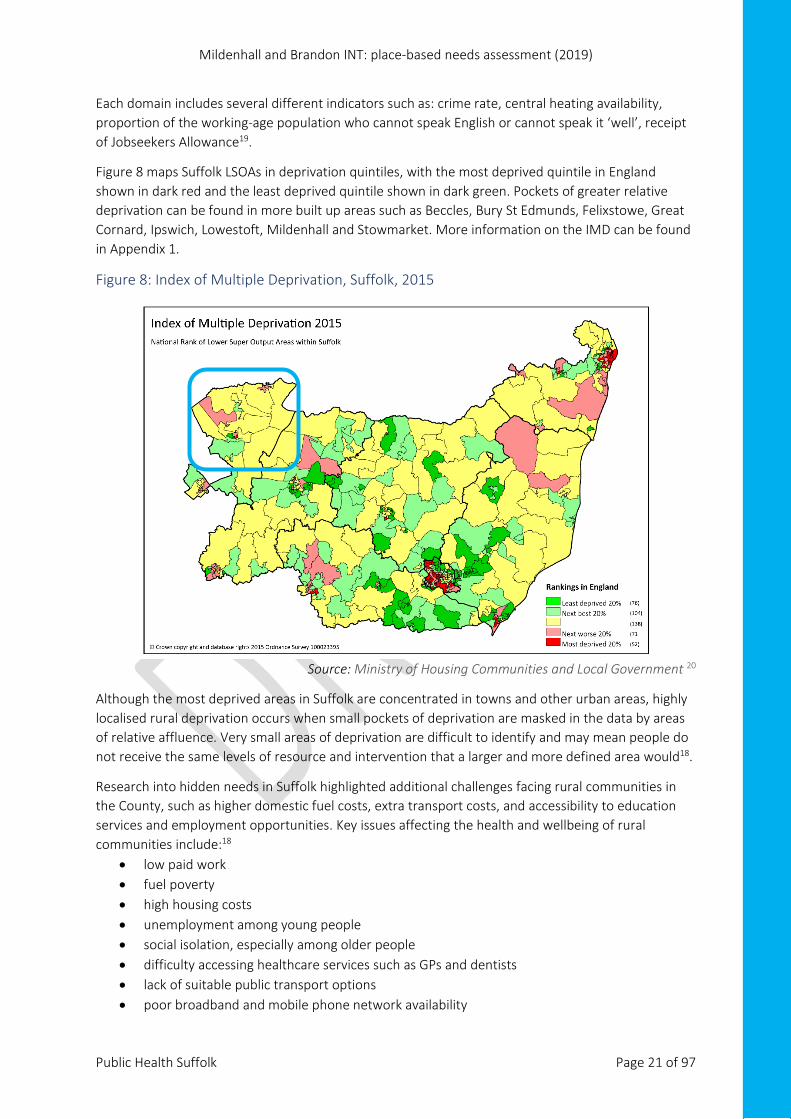
Figure 8 maps Suffolk LSOAs in deprivation quintiles, with the most deprived quintile in England shown in dark red and the least deprived quintile shown in dark green. Pockets of greater relative deprivation can be found in more built up areas such as Beccles, Bury St Edmunds, Felixstowe, Great Cornard, Ipswich, Lowestoft, Mildenhall and Stowmarket. More information on the IMD can be found in Appendix 1.
Figure 8: Index of Multiple Deprivation, Suffolk, 2015
Source: Ministry of Housing Communities and Local Government 20
Although the most deprived areas in Suffolk are concentrated in towns and other urban areas, highly localised rural deprivation occurs when small pockets of deprivation are masked in the data by areas of relative affluence. Very small areas of deprivation are difficult to identify and may mean people do not receive the same levels of resource and intervention that a larger and more defined area would18.
Research into hidden needs in Suffolk highlighted additional challenges facing rural communities in the County, such as higher domestic fuel costs, extra transport costs, and accessibility to education services and employment opportunities. Key issues affecting the health and wellbeing of rural communities include:18
• low paid work • fuel poverty • high housing costs • unemployment among young people • social isolation, especially among older people • difficulty accessing healthcare services such as GPs and dentists • lack of suitable public transport options • poor broadband and mobile phone network availability
Mildenhall and Brandon INT: place-based needs assessment (2019)
Public Health Suffolk Page 22 of 97
It is estimated that United States Visiting Forces (USVF) made up 13% (11,000) of the population of Forest Heath District Councili. This affects IMD rankings, as USVF are included in the population, but are not eligible for welfare benefits, so figures showing the percentage of the local population claiming Income Support (IS), Jobseekers’ Allowance and similar benefits will be underestimates. Figure 9 maps the published levels of deprivation in the INT area, while Figure 10 compares the published IMD quintiles for the Income Domain (see Appendix 1) with the revised rankings produced by West Suffolk Councils and Suffolk County Council.
Figure 9: Index of Multiple Deprivation 2015, by LSOA, Mildenhall and Brandon INT
Source: Analysis of the Indices of Multiple Deprivation by the Knowledge and Intelligence Team, Public Health Suffolk
i Index of Multiple Deprivation 2015: Development of alternative indices for Suffolk, taking account of the United States Visiting Forces (USVF) population in Forest Heath District Council and St Edmundsbury Borough Council areas (2016), internal report produced by West Suffolk Councils and Suffolk County Council
Mildenhall and Brandon INT: place-based needs assessment (2019)
Public Health Suffolk Page 23 of 97
Figure 10: Income Domain of the IMD, showing the impact of the USVF population, by Suffolk LSOA, 2015
Source: Analysis of the Indices of Multiple Deprivation by West Suffolk Councils and Suffolk County Council
Mildenhall and Brandon INT: place-based needs assessment (2019)
Public Health Suffolk Page 24 of 97
The following infographic (Figure 11) summarises key points of interest, highlighting where Mildenhall and Brandon INT areas fall in the top or bottom 20% of LSOAs in England.
Figure 11: Indices of Multiple Deprivation overview for the Mildenhall and Brandon INT
Source: IMD, Knowledge and Intelligence Team, Public Health Suffolk
Mildenhall and Brandon INT: place-based needs assessment (2019)
Public Health Suffolk Page 25 of 97
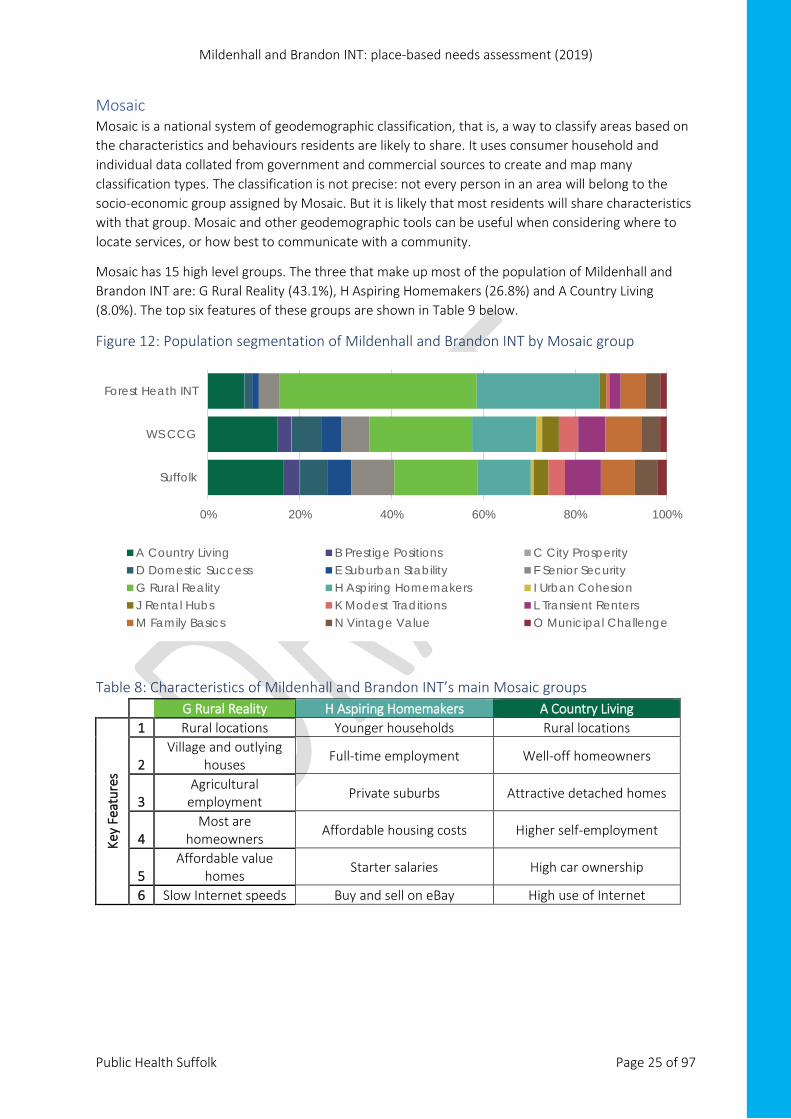
Mosaic Mosaic is a national system of geodemographic classification, that is, a way to classify areas based on the characteristics and behaviours residents are likely to share. It uses consumer household and individual data collated from government and commercial sources to create and map many classification types. The classification is not precise: not every person in an area will belong to the socio-economic group assigned by Mosaic. But it is likely that most residents will share characteristics with that group. Mosaic and other geodemographic tools can be useful when considering where to locate services, or how best to communicate with a community.
Mosaic has 15 high level groups. The three that make up most of the population of Mildenhall and Brandon INT are: G Rural Reality (43.1%), H Aspiring Homemakers (26.8%) and A Country Living (8.0%). The top six features of these groups are shown in Table 9 below.
Figure 12: Population segmentation of Mildenhall and Brandon INT by Mosaic group
Table 8: Characteristics of Mildenhall and Brandon INT’s main Mosaic groups
G Rural Reality H Aspiring Homemakers A Country Living
Key
Feat
ures
1 Rural locations Younger households Rural locations
2 Village and outlying
houses Full-time employment Well-off homeowners
3 Agricultural
employment Private suburbs Attractive detached homes
4 Most are
homeowners Affordable housing costs Higher self-employment
5 Affordable value
homes Starter salaries High car ownership
6 Slow Internet speeds Buy and sell on eBay High use of Internet
0% 20% 40% 60% 80% 100%
Suffolk
WS CCG
Forest Heath INT
A Country Living B Prestige Positions C City ProsperityD Domestic Success E Suburban Stability F Senior SecurityG Rural Reality H Aspiring Homemakers I Urban CohesionJ Rental Hubs K Modest Traditions L Transient RentersM Family Basics N Vintage Value O Municipal Challenge
Mildenhall and Brandon INT: place-based needs assessment (2019)
Public Health Suffolk Page 26 of 97
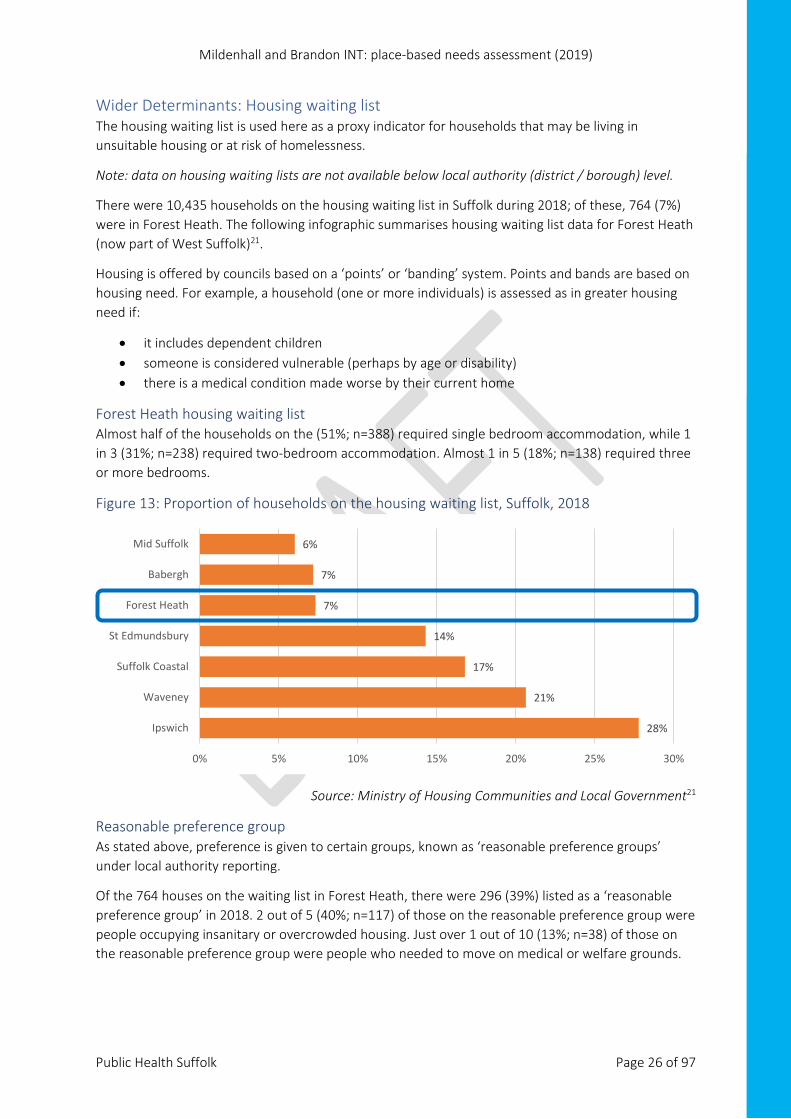
Wider Determinants: Housing waiting list The housing waiting list is used here as a proxy indicator for households that may be living in unsuitable housing or at risk of homelessness.
Note: data on housing waiting lists are not available below local authority (district / borough) level.
There were 10,435 households on the housing waiting list in Suffolk during 2018; of these, 764 (7%) were in Forest Heath. The following infographic summarises housing waiting list data for Forest Heath (now part of West Suffolk)21.
Housing is offered by councils based on a ‘points’ or ‘banding’ system. Points and bands are based on housing need. For example, a household (one or more individuals) is assessed as in greater housing need if:
• it includes dependent children • someone is considered vulnerable (perhaps by age or disability) • there is a medical condition made worse by their current home
Forest Heath housing waiting list Almost half of the households on the (51%; n=388) required single bedroom accommodation, while 1 in 3 (31%; n=238) required two-bedroom accommodation. Almost 1 in 5 (18%; n=138) required three or more bedrooms.
Figure 13: Proportion of households on the housing waiting list, Suffolk, 2018
Source: Ministry of Housing Communities and Local Government21
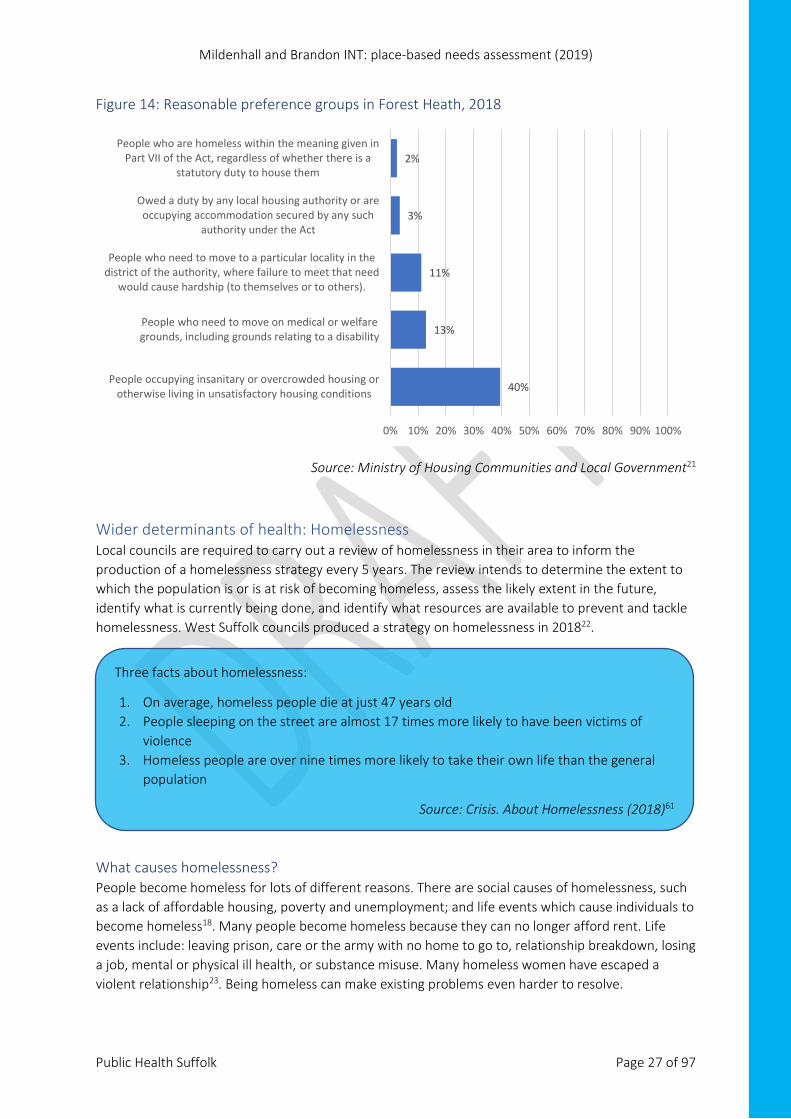
Reasonable preference group As stated above, preference is given to certain groups, known as ‘reasonable preference groups’ under local authority reporting.
Of the 764 houses on the waiting list in Forest Heath, there were 296 (39%) listed as a ‘reasonable preference group’ in 2018. 2 out of 5 (40%; n=117) of those on the reasonable preference group were people occupying insanitary or overcrowded housing. Just over 1 out of 10 (13%; n=38) of those on the reasonable preference group were people who needed to move on medical or welfare grounds.
28%
21%
17%
14%
7%
7%
6%
0% 5% 10% 15% 20% 25% 30%
Ipswich
Waveney
Suffolk Coastal
St Edmundsbury
Forest Heath
Babergh
Mid Suffolk
Mildenhall and Brandon INT: place-based needs assessment (2019)
Public Health Suffolk Page 27 of 97
Figure 14: Reasonable preference groups in Forest Heath, 2018
Source: Ministry of Housing Communities and Local Government21
Wider determinants of health: Homelessness Local councils are required to carry out a review of homelessness in their area to inform the production of a homelessness strategy every 5 years. The review intends to determine the extent to which the population is or is at risk of becoming homeless, assess the likely extent in the future, identify what is currently being done, and identify what resources are available to prevent and tackle homelessness. West Suffolk councils produced a strategy on homelessness in 201822.
What causes homelessness? People become homeless for lots of different reasons. There are social causes of homelessness, such as a lack of affordable housing, poverty and unemployment; and life events which cause individuals to become homeless18. Many people become homeless because they can no longer afford rent. Life events include: leaving prison, care or the army with no home to go to, relationship breakdown, losing a job, mental or physical ill health, or substance misuse. Many homeless women have escaped a violent relationship23. Being homeless can make existing problems even harder to resolve.
40%
13%
11%
3%
2%
0% 10% 20% 30% 40% 50% 60% 70% 80% 90% 100%
People occupying insanitary or overcrowded housing orotherwise living in unsatisfactory housing conditions
People who need to move on medical or welfaregrounds, including grounds relating to a disability
People who need to move to a particular locality in thedistrict of the authority, where failure to meet that need
would cause hardship (to themselves or to others).
Owed a duty by any local housing authority or areoccupying accommodation secured by any such
authority under the Act
People who are homeless within the meaning given inPart VII of the Act, regardless of whether there is a
statutory duty to house them
Three facts about homelessness:
1. On average, homeless people die at just 47 years old 2. People sleeping on the street are almost 17 times more likely to have been victims of
violence 3. Homeless people are over nine times more likely to take their own life than the general
population
Source: Crisis. About Homelessness (2018)61
Mildenhall and Brandon INT: place-based needs assessment (2019)
Public Health Suffolk Page 28 of 97
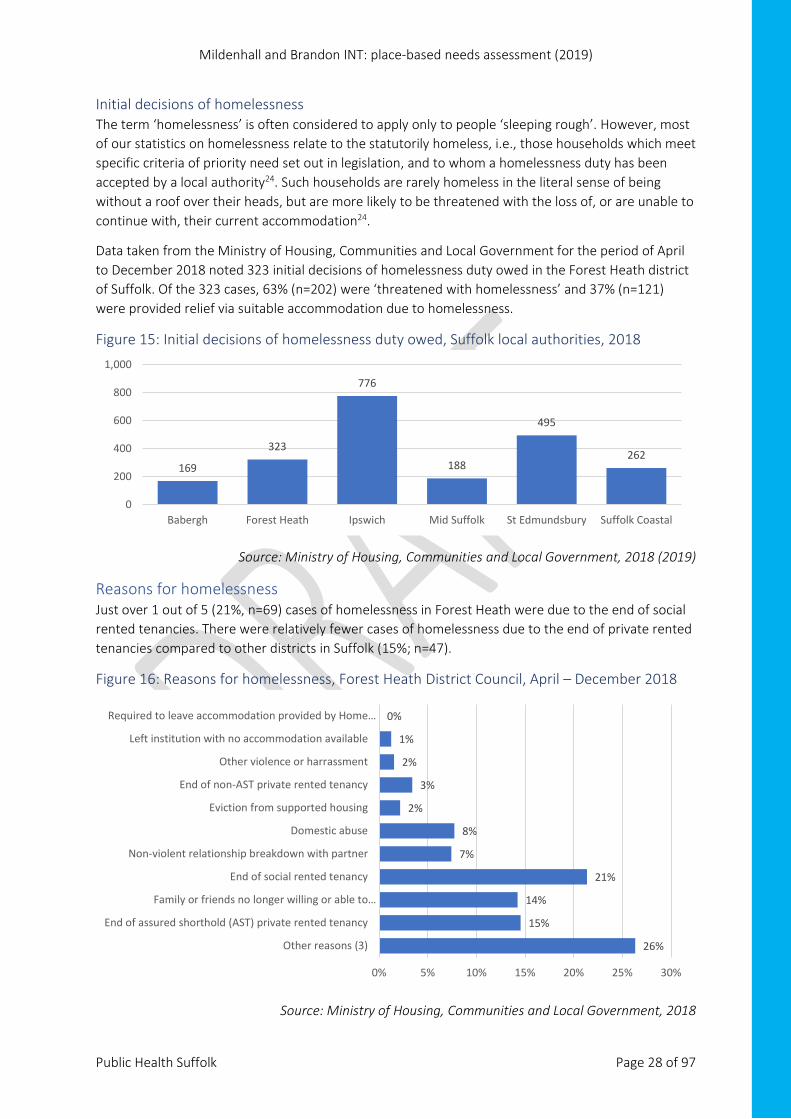
Initial decisions of homelessness The term ‘homelessness’ is often considered to apply only to people ‘sleeping rough’. However, most of our statistics on homelessness relate to the statutorily homeless, i.e., those households which meet specific criteria of priority need set out in legislation, and to whom a homelessness duty has been accepted by a local authority24. Such households are rarely homeless in the literal sense of being without a roof over their heads, but are more likely to be threatened with the loss of, or are unable to continue with, their current accommodation24.
Data taken from the Ministry of Housing, Communities and Local Government for the period of April to December 2018 noted 323 initial decisions of homelessness duty owed in the Forest Heath district of Suffolk. Of the 323 cases, 63% (n=202) were ‘threatened with homelessness’ and 37% (n=121) were provided relief via suitable accommodation due to homelessness.
Figure 15: Initial decisions of homelessness duty owed, Suffolk local authorities, 2018
Source: Ministry of Housing, Communities and Local Government, 2018 (2019)
Reasons for homelessness Just over 1 out of 5 (21%, n=69) cases of homelessness in Forest Heath were due to the end of social rented tenancies. There were relatively fewer cases of homelessness due to the end of private rented tenancies compared to other districts in Suffolk (15%; n=47).
Figure 16: Reasons for homelessness, Forest Heath District Council, April – December 2018
Source: Ministry of Housing, Communities and Local Government, 2018
169
323
776
188
495
262
0
200
400
600
800
1,000
Babergh Forest Heath Ipswich Mid Suffolk St Edmundsbury Suffolk Coastal
26%
15%
14%
21%
7%
8%
2%
3%
2%
1%
0%
0% 5% 10% 15% 20% 25% 30%
Other reasons (3)
End of assured shorthold (AST) private rented tenancy
Family or friends no longer willing or able to…
End of social rented tenancy
Non-violent relationship breakdown with partner
Domestic abuse
Eviction from supported housing
End of non-AST private rented tenancy
Other violence or harrassment
Left institution with no accommodation available
Required to leave accommodation provided by Home…
Mildenhall and Brandon INT: place-based needs assessment (2019)
Public Health Suffolk Page 29 of 97
Note:
1) This category also includes family no longer willing or able to accommodate and friends no longer willing or able to accommodate.
2) Excluding rent arrears for assured shorthold tenancy which is in “End of assured shorthold tenancy”
3) Other reasons include: racially motivated violence or harassment, non-racially motivated / other motivated violence or harassment, left institution or LA care, left HM forces, required to leave accommodation provided by Home Office as asylum support, mortgage arrears (repossession or other loss of home), rent arrears on local authority or other public sector, Registered Provider or private sector dwellings, fire or flood / other emergency, property disrepair.
Wider determinants of health: Crime There are concerns and caveats to crime data25. Police forces use four different systems to record and manage incidents (including road traffic collisions, anti-social behaviour (ASB), and public enquiries), crimes (incidents confirmed as crimes), custody (arrests relating to a crime) and case management (preparation for court hearing). These may not be integrated, leading to data quality risks.
Additionally, data is constantly changing, and reports can only be a snapshot. For example, a crime may be reclassified, or its location changed. Crime locations are anonymised before publication: the recorded location will be “snapped” to the nearest anonymous map point (over a public place and containing either no postal addresses, or at least eight)25.
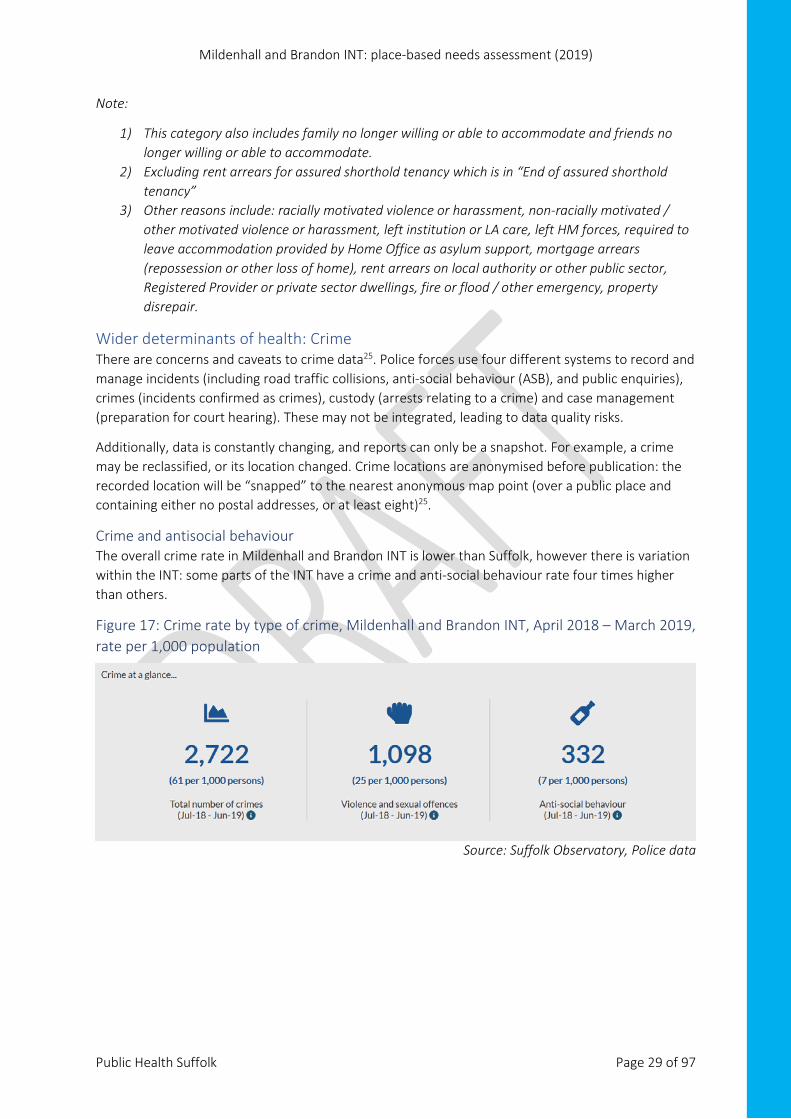
Crime and antisocial behaviour The overall crime rate in Mildenhall and Brandon INT is lower than Suffolk, however there is variation within the INT: some parts of the INT have a crime and anti-social behaviour rate four times higher than others.
Figure 17: Crime rate by type of crime, Mildenhall and Brandon INT, April 2018 – March 2019, rate per 1,000 population
Source: Suffolk Observatory, Police data
Mildenhall and Brandon INT: place-based needs assessment (2019)
Public Health Suffolk Page 30 of 97
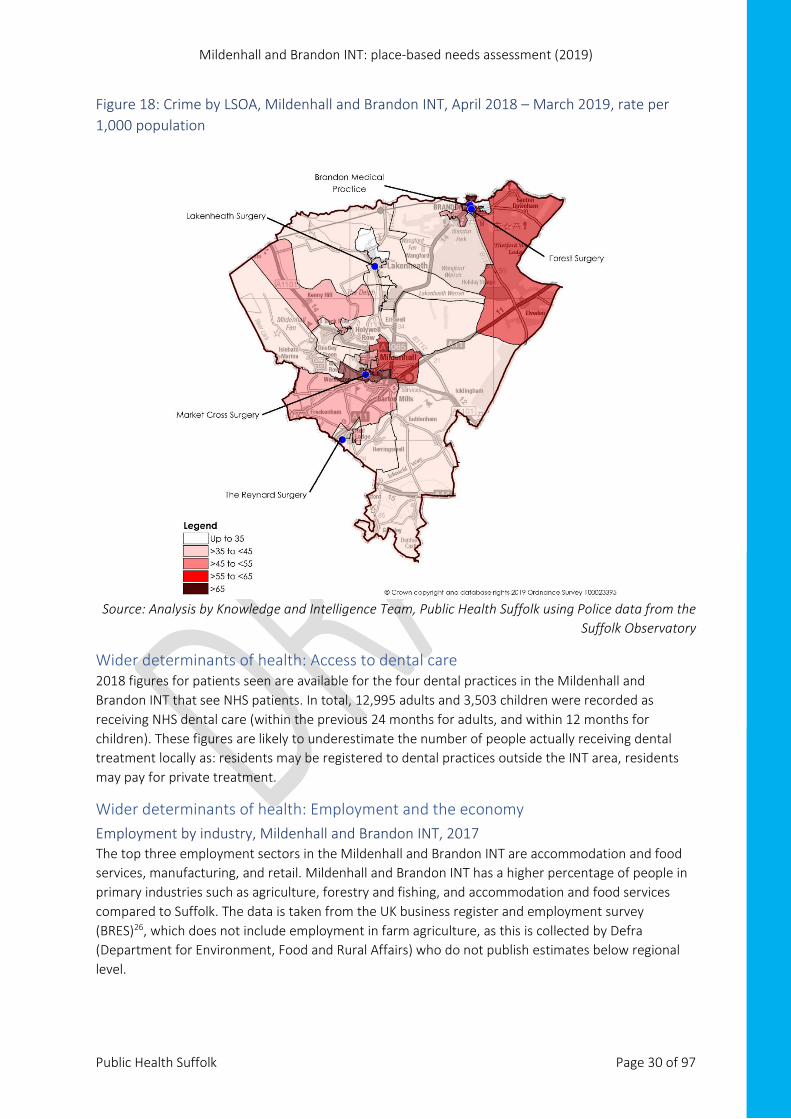
Figure 18: Crime by LSOA, Mildenhall and Brandon INT, April 2018 – March 2019, rate per 1,000 population
Source: Analysis by Knowledge and Intelligence Team, Public Health Suffolk using Police data from the Suffolk Observatory
Wider determinants of health: Access to dental care 2018 figures for patients seen are available for the four dental practices in the Mildenhall and Brandon INT that see NHS patients. In total, 12,995 adults and 3,503 children were recorded as receiving NHS dental care (within the previous 24 months for adults, and within 12 months for children). These figures are likely to underestimate the number of people actually receiving dental treatment locally as: residents may be registered to dental practices outside the INT area, residents may pay for private treatment.
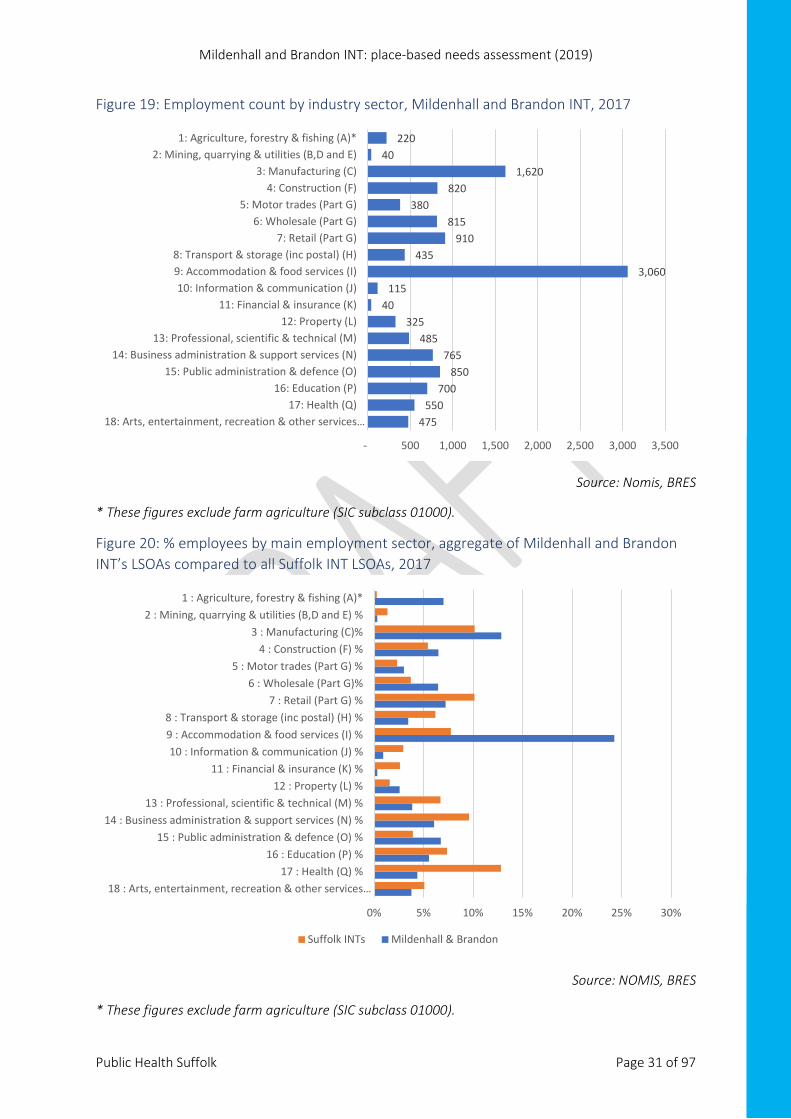
Wider determinants of health: Employment and the economy Employment by industry, Mildenhall and Brandon INT, 2017 The top three employment sectors in the Mildenhall and Brandon INT are accommodation and food services, manufacturing, and retail. Mildenhall and Brandon INT has a higher percentage of people in primary industries such as agriculture, forestry and fishing, and accommodation and food services compared to Suffolk. The data is taken from the UK business register and employment survey (BRES)26, which does not include employment in farm agriculture, as this is collected by Defra (Department for Environment, Food and Rural Affairs) who do not publish estimates below regional level.
Mildenhall and Brandon INT: place-based needs assessment (2019)
Public Health Suffolk Page 31 of 97
Figure 19: Employment count by industry sector, Mildenhall and Brandon INT, 2017
Source: Nomis, BRES
* These figures exclude farm agriculture (SIC subclass 01000).
Figure 20: % employees by main employment sector, aggregate of Mildenhall and Brandon INT’s LSOAs compared to all Suffolk INT LSOAs, 2017
Source: NOMIS, BRES
* These figures exclude farm agriculture (SIC subclass 01000).
475 550
700 850
765 485
325 40
115 3,060
435 910
815 380
820 1,620
40 220
- 500 1,000 1,500 2,000 2,500 3,000 3,500
18: Arts, entertainment, recreation & other services…17: Health (Q)
16: Education (P)15: Public administration & defence (O)
14: Business administration & support services (N)13: Professional, scientific & technical (M)
12: Property (L)11: Financial & insurance (K)
10: Information & communication (J)9: Accommodation & food services (I)8: Transport & storage (inc postal) (H)
7: Retail (Part G)6: Wholesale (Part G)
5: Motor trades (Part G)4: Construction (F)
3: Manufacturing (C)2: Mining, quarrying & utilities (B,D and E)
1: Agriculture, forestry & fishing (A)*
0% 5% 10% 15% 20% 25% 30%
18 : Arts, entertainment, recreation & other services…17 : Health (Q) %
16 : Education (P) %15 : Public administration & defence (O) %
14 : Business administration & support services (N) %13 : Professional, scientific & technical (M) %
12 : Property (L) %11 : Financial & insurance (K) %
10 : Information & communication (J) %9 : Accommodation & food services (I) %8 : Transport & storage (inc postal) (H) %
7 : Retail (Part G) %6 : Wholesale (Part G)%
5 : Motor trades (Part G) % 4 : Construction (F) %
3 : Manufacturing (C)%2 : Mining, quarrying & utilities (B,D and E) %
1 : Agriculture, forestry & fishing (A)*
Suffolk INTs Mildenhall & Brandon
Mildenhall and Brandon INT: place-based needs assessment (2019)
Public Health Suffolk Page 32 of 97
The level of rounding applied varies by estimate. Please see article for further information on how rounding is applied https://www.nomisweb.co.uk/articles/1103.aspx .
The figures include: • employees - anyone aged 16 years or over that an organisation directly pays from its
payroll(s), in return for carrying out a full-time or part-time job or being on a training scheme. Employee numbers exclude voluntary workers, self-employed, working owners who are not paid via PAYE.
• working owners - self-employed workers, if they are registered for VAT or Pay-As-You-Earn (PAYE) schemes (typically sole traders, sole proprietors or partners who receive drawings or a share of the profits). Self-employed people not registered for these, along with HM Forces and Government Supported trainees are excluded.
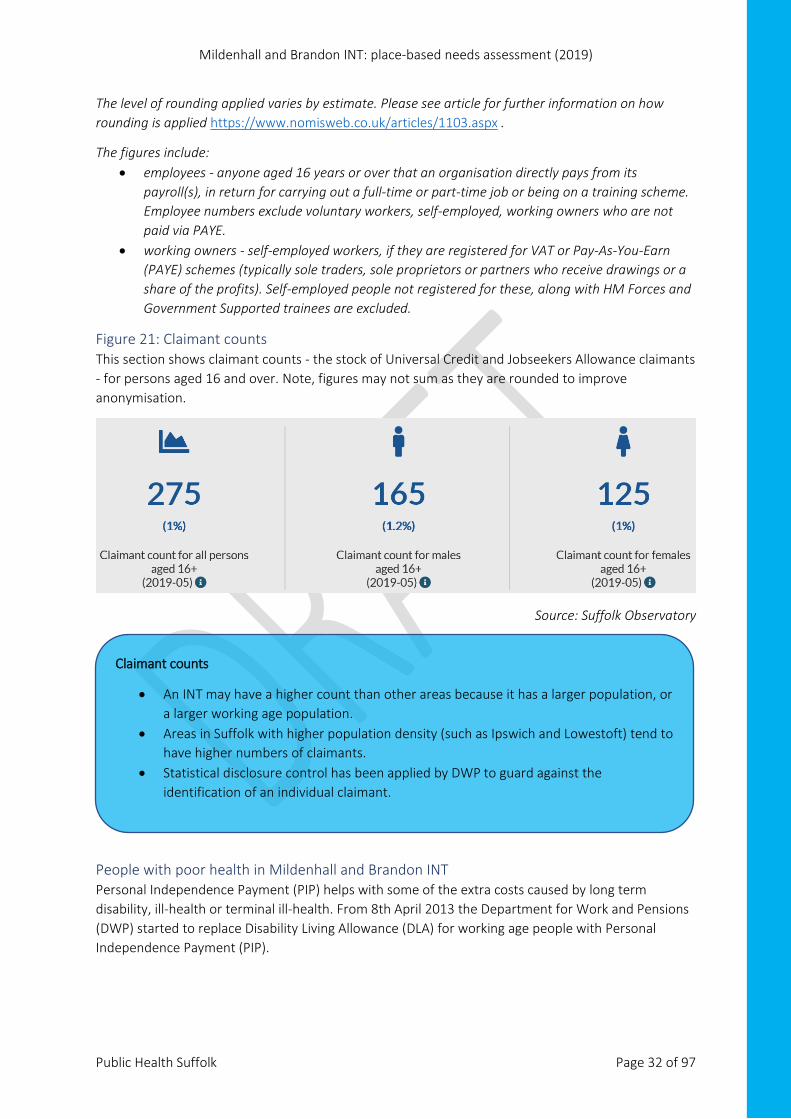
Figure 21: Claimant counts This section shows claimant counts - the stock of Universal Credit and Jobseekers Allowance claimants - for persons aged 16 and over. Note, figures may not sum as they are rounded to improve anonymisation.
Source: Suffolk Observatory
People with poor health in Mildenhall and Brandon INT Personal Independence Payment (PIP) helps with some of the extra costs caused by long term disability, ill-health or terminal ill-health. From 8th April 2013 the Department for Work and Pensions (DWP) started to replace Disability Living Allowance (DLA) for working age people with Personal Independence Payment (PIP).
Claimant counts
• An INT may have a higher count than other areas because it has a larger population, or a larger working age population.
• Areas in Suffolk with higher population density (such as Ipswich and Lowestoft) tend to have higher numbers of claimants.
• Statistical disclosure control has been applied by DWP to guard against the identification of an individual claimant.
Mildenhall and Brandon INT: place-based needs assessment (2019)
Public Health Suffolk Page 33 of 97
There were 1,865 people claiming PIP or DLA in Mildenhall and Brandon INT in the quarter ending November 201827, 5.0% of the total PIP and DLA claims in Suffolk which is lower than the Suffolk INT average (6.3%).
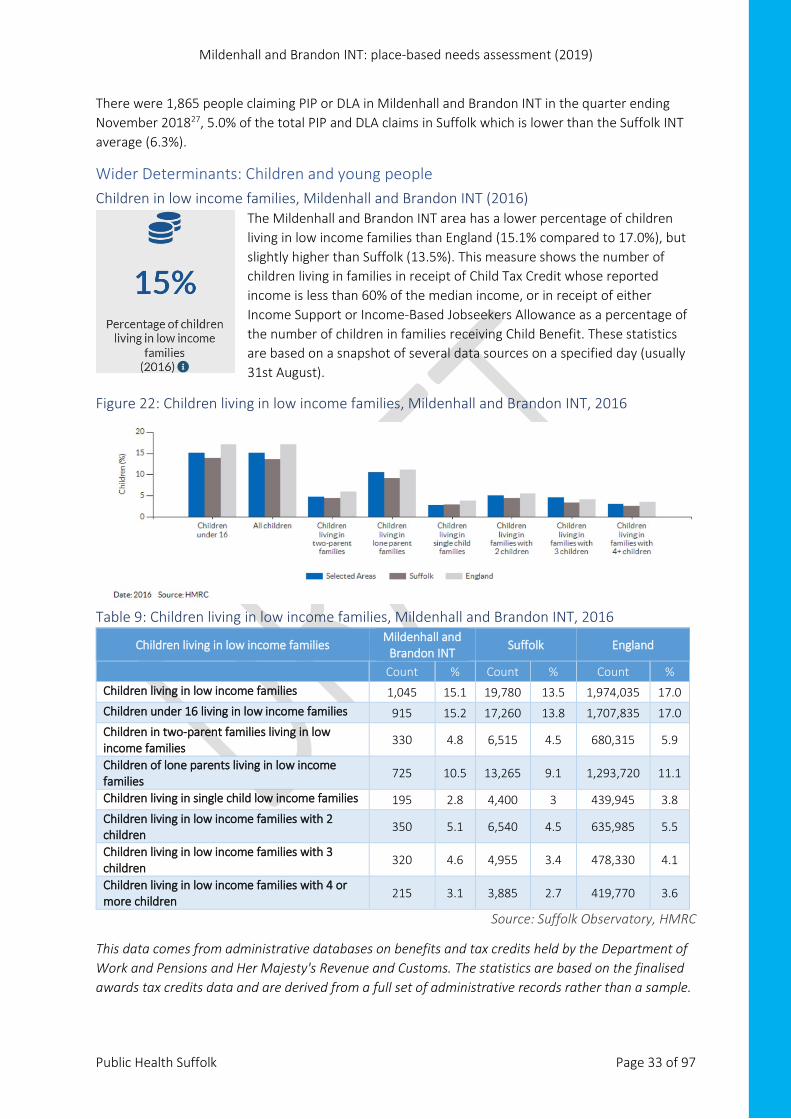
Wider Determinants: Children and young people Children in low income families, Mildenhall and Brandon INT (2016)
The Mildenhall and Brandon INT area has a lower percentage of children living in low income families than England (15.1% compared to 17.0%), but slightly higher than Suffolk (13.5%). This measure shows the number of children living in families in receipt of Child Tax Credit whose reported income is less than 60% of the median income, or in receipt of either Income Support or Income-Based Jobseekers Allowance as a percentage of the number of children in families receiving Child Benefit. These statistics are based on a snapshot of several data sources on a specified day (usually 31st August).
Figure 22: Children living in low income families, Mildenhall and Brandon INT, 2016
Table 9: Children living in low income families, Mildenhall and Brandon INT, 2016
Children living in low income families Mildenhall and
Brandon INT Suffolk England
Count % Count % Count % Children living in low income families 1,045 15.1 19,780 13.5 1,974,035 17.0 Children under 16 living in low income families 915 15.2 17,260 13.8 1,707,835 17.0 Children in two-parent families living in low income families
330 4.8 6,515 4.5 680,315 5.9
Children of lone parents living in low income families
725 10.5 13,265 9.1 1,293,720 11.1
Children living in single child low income families 195 2.8 4,400 3 439,945 3.8 Children living in low income families with 2 children
350 5.1 6,540 4.5 635,985 5.5
Children living in low income families with 3 children
320 4.6 4,955 3.4 478,330 4.1
Children living in low income families with 4 or more children
215 3.1 3,885 2.7 419,770 3.6
Source: Suffolk Observatory, HMRC
This data comes from administrative databases on benefits and tax credits held by the Department of Work and Pensions and Her Majesty's Revenue and Customs. The statistics are based on the finalised awards tax credits data and are derived from a full set of administrative records rather than a sample.
Mildenhall and Brandon INT: place-based needs assessment (2019)
Public Health Suffolk Page 34 of 97
Children in households receiving benefits DWP publishes some data at LSOA level. This should be used with caution as it is usually given as a count not a rate, so does not enable direct comparison between INTs: counts may be higher in certain INTs because they have a larger population, more households, or a larger working age population. Where a rate cannot be calculated, the count is compared to the INT average in Suffolk, in line with the approach taken by the House of Commons Library28.
• In the Mildenhall and Brandon INT area, 785 children (0-18) were living in 385 households that received out-of-work benefits (December 2018)27. This is below the average (1,059 children, 558 households) for Suffolk INT areas.
• There were 146ii households on Universal Credit in Mildenhall and Brandon INT in November 201827. Of these, 24 (16.4%) had a child entitlement. The average number of households receiving Universal Credit for Suffolk INT areas is 940; 38.5% of households on Universal Credit in Suffolk had a child entitlement. Numbers may reflect the roll out of Universal Credit in Suffolk - see the text box on page 36 for further guidance on using counts. Note: statistics for households on Universal Credit are new Official Statistics undergoing evaluation and are badged as “Experimental Official Statistics”.
• 230iii families were in receipt of income support in the Mildenhall and Brandon INT area in the quarter to November 2018, of which 181 were lone parent families. The average for Suffolk INT areas is 241 families, 157 lone parent families.
Children in receipt of pupil premium, Suffolk, 2018 The pupil premium grant is additional funding for publicly funded schools in England. It’s a school-level grant that gives schools extra resources to help them meet challenges, including those arising from deprivation. It’s allocated for schools to:
• improve the academic outcomes of disadvantaged pupils of all abilities • close the attainment gap between disadvantaged pupils and their peers across the country a
useful proxy indicator to show areas of poverty or greater deprivation.
Suffolk County Council annual pupil data for 201815 shows that more than 1 in 4 (27.4%) pupils at state-funded Suffolk schools and also resident in the Mildenhall and Brandon INT were allocated pupil premium funding in 2018, above the Suffolk average (22.7%). It was the INT area with the highest percentage of pupils eligible for pupil premium in West Suffolk and West Suffolk CCG.
ii Statistical disclosure control has been applied by DWP to guard against the identification of an individual claimant. iii Statistical disclosure control has been applied by DWP to guard against the identification of an individual claimant.
Mildenhall and Brandon INT: place-based needs assessment (2019)
Public Health Suffolk Page 35 of 97
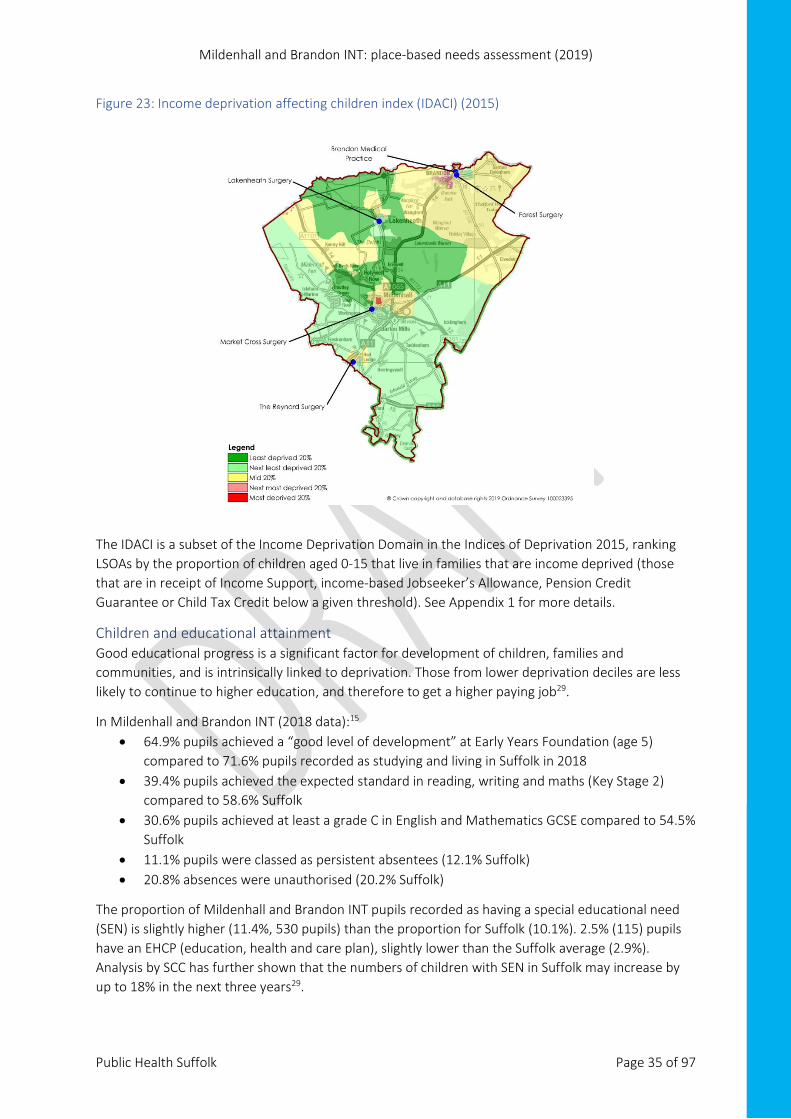
Figure 23: Income deprivation affecting children index (IDACI) (2015)
The IDACI is a subset of the Income Deprivation Domain in the Indices of Deprivation 2015, ranking LSOAs by the proportion of children aged 0-15 that live in families that are income deprived (those that are in receipt of Income Support, income-based Jobseeker’s Allowance, Pension Credit Guarantee or Child Tax Credit below a given threshold). See Appendix 1 for more details.
Children and educational attainment Good educational progress is a significant factor for development of children, families and communities, and is intrinsically linked to deprivation. Those from lower deprivation deciles are less likely to continue to higher education, and therefore to get a higher paying job29.
In Mildenhall and Brandon INT (2018 data):15 • 64.9% pupils achieved a “good level of development” at Early Years Foundation (age 5)
compared to 71.6% pupils recorded as studying and living in Suffolk in 2018 • 39.4% pupils achieved the expected standard in reading, writing and maths (Key Stage 2)
compared to 58.6% Suffolk • 30.6% pupils achieved at least a grade C in English and Mathematics GCSE compared to 54.5%
Suffolk • 11.1% pupils were classed as persistent absentees (12.1% Suffolk) • 20.8% absences were unauthorised (20.2% Suffolk)
The proportion of Mildenhall and Brandon INT pupils recorded as having a special educational need (SEN) is slightly higher (11.4%, 530 pupils) than the proportion for Suffolk (10.1%). 2.5% (115) pupils have an EHCP (education, health and care plan), slightly lower than the Suffolk average (2.9%). Analysis by SCC has further shown that the numbers of children with SEN in Suffolk may increase by up to 18% in the next three years29.
Mildenhall and Brandon INT: place-based needs assessment (2019)
Public Health Suffolk Page 36 of 97
Mildenhall and Brandon INT: place-based needs assessment (2019)
Public Health Suffolk Page 37 of 97
Primary care: GP QOF indicators GP key health indicators The following section uses 2017-18 GP Quality and Outcomes Framework (QOF) data to present the health needs for the Mildenhall and Brandon INT population. This chapter is broken down into five sub-sections:
1. Cardiovascular-based health needs 2. Respiratory-based health needs 3. Lifestyle-based health needs 4. High dependency and long-term conditions 5. Mental health
Note: • Only key areas of difference have been highlighted in this chapter. For a full overview of QOF
indicators, please visit https://fingertips.phe.org.uk/profile/general-practice. • Where possible QOF exception data has been presented for contextual purposes (please
Appendix 3 for more information on QOF exception rates). • Where possible Public Health Suffolk’s consultants have provided recommendations based on
the data provided within this report. • An overview of each GP practice, including age profiles, can be seen in Appendix 4.
What is QOF data? The QOF is a pay-for-performance scheme. It provides practices with funding for completing specific activities that are considered to represent good quality of care, or outcomes that are in line with best clinical evidence30. This publication provides data for the reporting year 1 April 2017 to 31 March 2018 and covers all general practices in England that participated in the QOF in 2017-18.
Patients can be recorded as “exceptions”, meaning they are excluded when calculating achievement. It applies to all indicators where the achievement is determined by the percentage of patients receiving the specified level of care30. Variation in exception reporting within QOF (now called “personalised care adjustment”), can be an indicator that patients’ long term conditions are not being effectively managed.
It is important that QOF is not the solitary measure of the quality of patient care. Patient care encompasses more than QOF indicators, and performance against those indicators.
Reporting on QOF is usually delayed. For example, the latest data in the public domain in May 2019 was for the 2017-18 reporting period. Internally, practices have a much more up to date view of their practice. Interventions may already have been put into place to mitigate issues (such as coding issues/chasing of review appointments) where some data may have been statistically different from the CCG area and England.
Anecdotal evidence also suggests that there may be some variation in interpretation of the QOF contract at GP practice level. For example, one QOF indicator for rheumatoid arthritis is: “the percentage of patients with rheumatoid arthritis, on the register, who have had a face-to-face review in the preceding 12 months”. One GP may record that a patient has had a suitable review if they have been seen in general practice for that specific reason, while others may record this if they have been seen in a hospital setting.
Mildenhall and Brandon INT: place-based needs assessment (2019)
Public Health Suffolk Page 38 of 97
Other issues raised around QOF include:30 • annual changes • micromanagement • impact of the doctor’s agenda taking time away from the patient’s agenda • more activity required for the same amount of funding • political interference relating to specific indicators, placing greater value on elements that • could be measured against the aspects that are harder to quantify but important to patients • concern from some disease specific groups that if their condition is not covered by QOF, • practices would not focus on it • increased awareness of multi morbidity and need to move away from a single disease focus • rise in thresholds making it more difficult to achieve with the pressure then to over-
medicalise patients to hit targets • the introduction of INLIQ (indicators no longer in QOF) and concerns about how this data is
used.
Making sense of the charts: Where possible, data has been compared to the IESCGG and England for statistical significance. This is presented through the colour key below.
• Data points that are not significantly different from WSCCG will have a white centre. • The red line around the Mildenhall and Brandon INT bar does not denote positive or negative
/ higher or lower rates. It is included to highlight the Mildenhall and Brandon INT combined data.
Mildenhall and Brandon INT: place-based needs assessment (2019)
Public Health Suffolk Page 39 of 97
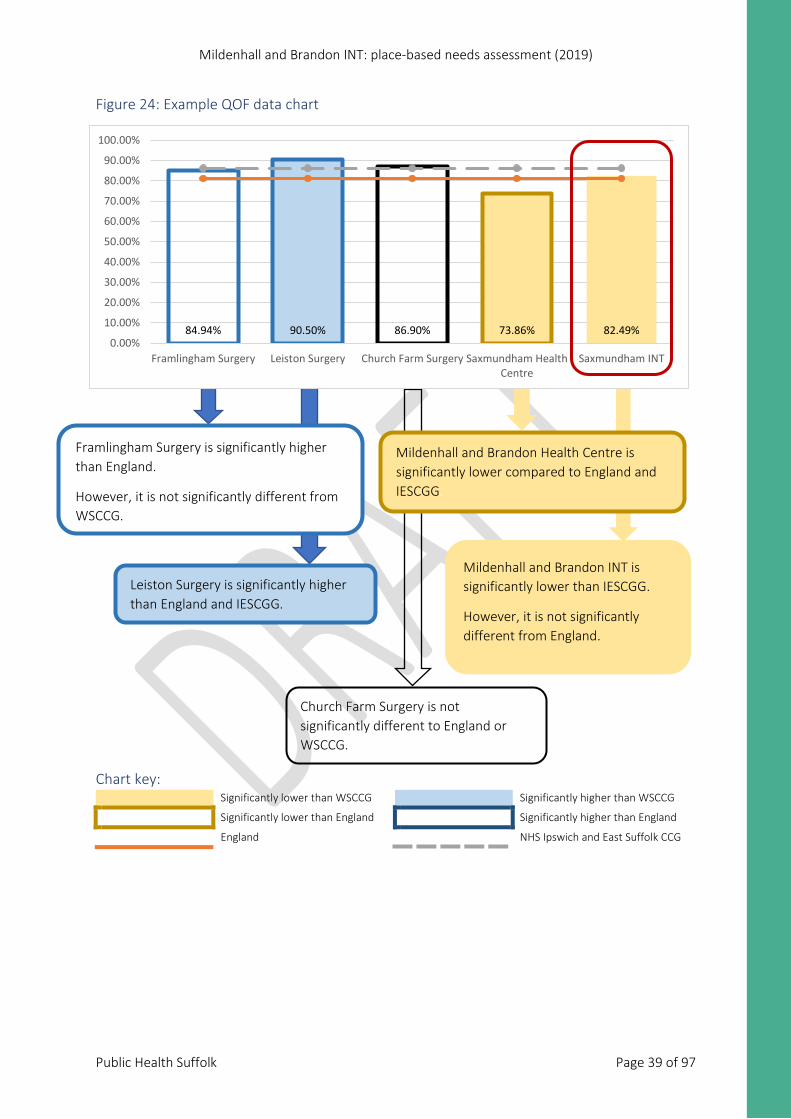
Figure 24: Example QOF data chart
Chart key: Significantly lower than WSCCG Significantly higher than WSCCG Significantly lower than England Significantly higher than England England NHS Ipswich and East Suffolk CCG
Framlingham Surgery is significantly higher than England.
However, it is not significantly different from WSCCG.
84.94% 90.50% 86.90% 73.86% 82.49%0.00%
10.00%
20.00%
30.00%
40.00%
50.00%
60.00%
70.00%
80.00%
90.00%
100.00%
Framlingham Surgery Leiston Surgery Church Farm Surgery Saxmundham HealthCentre
Saxmundham INT
Leiston Surgery is significantly higher than England and IESCGG.
Mildenhall and Brandon Health Centre is significantly lower compared to England and IESCGG.
Mildenhall and Brandon INT is significantly lower than IESCGG.
However, it is not significantly different from England.
Church Farm Surgery is not significantly different to England or WSCCG.
Mildenhall and Brandon INT: place-based needs assessment (2019)
Public Health Suffolk Page 40 of 97
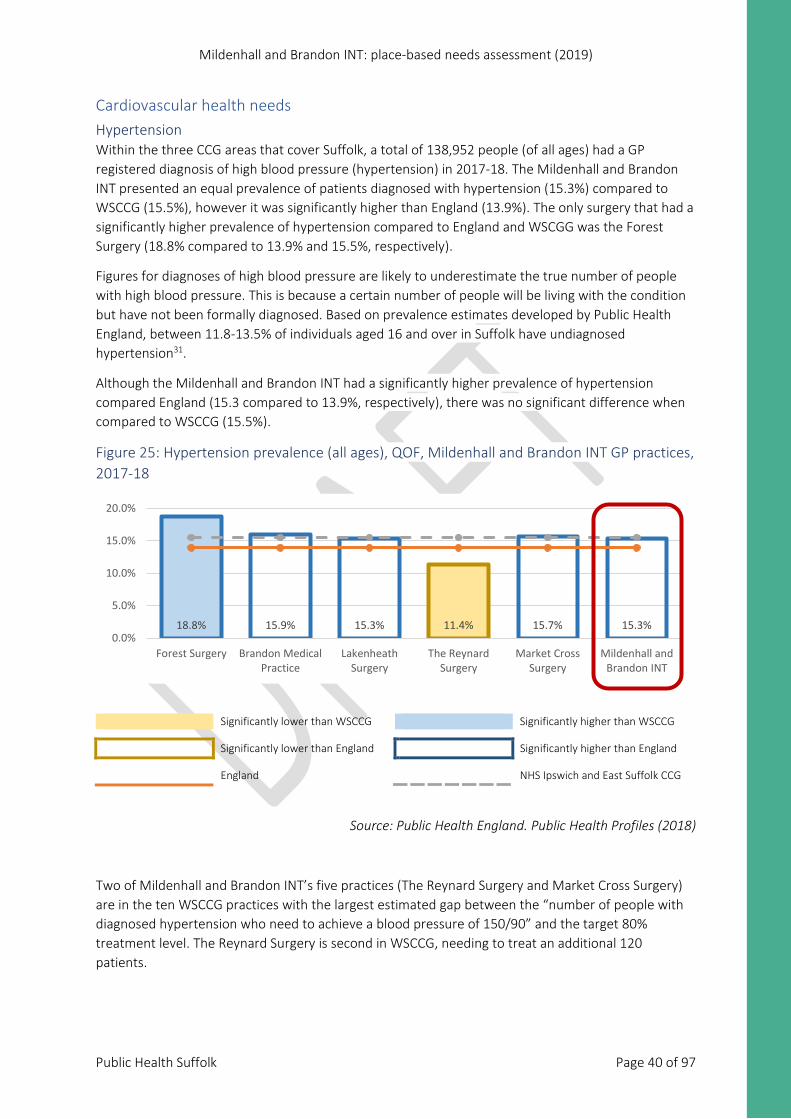
Cardiovascular health needs Hypertension Within the three CCG areas that cover Suffolk, a total of 138,952 people (of all ages) had a GP registered diagnosis of high blood pressure (hypertension) in 2017-18. The Mildenhall and Brandon INT presented an equal prevalence of patients diagnosed with hypertension (15.3%) compared to WSCCG (15.5%), however it was significantly higher than England (13.9%). The only surgery that had a significantly higher prevalence of hypertension compared to England and WSCGG was the Forest Surgery (18.8% compared to 13.9% and 15.5%, respectively).
Figures for diagnoses of high blood pressure are likely to underestimate the true number of people with high blood pressure. This is because a certain number of people will be living with the condition but have not been formally diagnosed. Based on prevalence estimates developed by Public Health England, between 11.8-13.5% of individuals aged 16 and over in Suffolk have undiagnosed hypertension31.
Although the Mildenhall and Brandon INT had a significantly higher prevalence of hypertension compared England (15.3 compared to 13.9%, respectively), there was no significant difference when compared to WSCCG (15.5%).
Figure 25: Hypertension prevalence (all ages), QOF, Mildenhall and Brandon INT GP practices, 2017-18
Significantly lower than WSCCG Significantly higher than WSCCG Significantly lower than England Significantly higher than England England NHS Ipswich and East Suffolk CCG
Source: Public Health England. Public Health Profiles (2018)
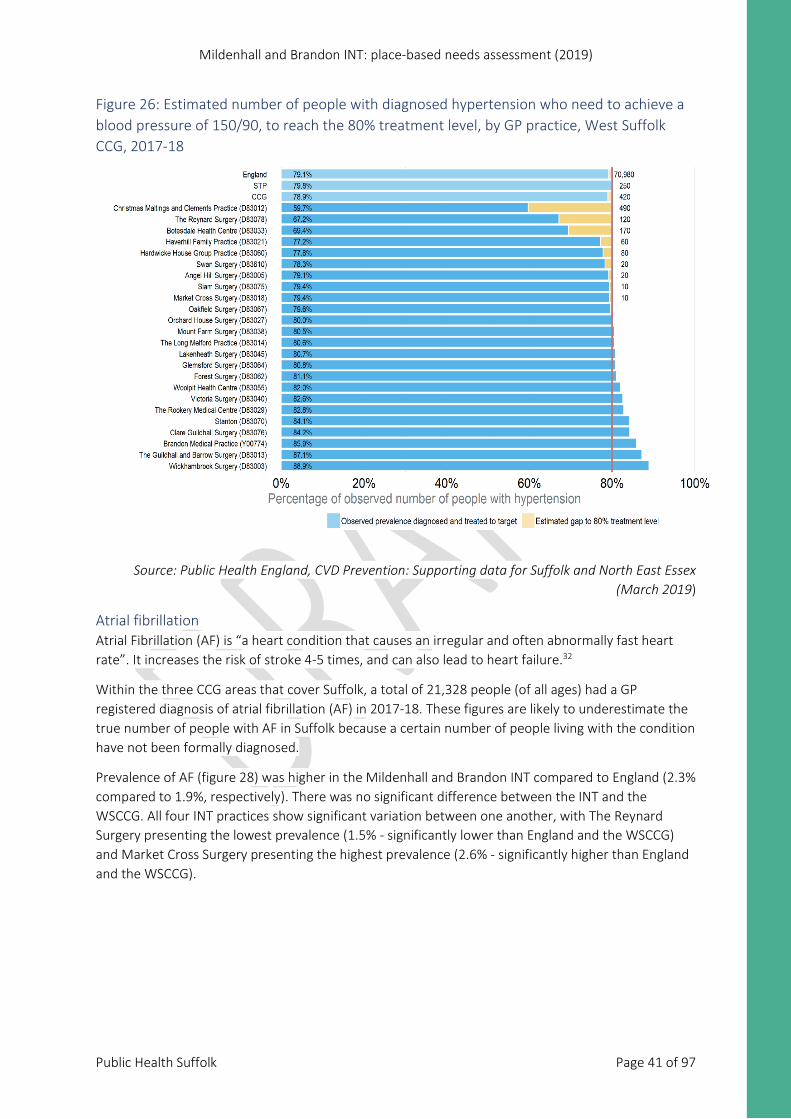
Two of Mildenhall and Brandon INT’s five practices (The Reynard Surgery and Market Cross Surgery) are in the ten WSCCG practices with the largest estimated gap between the “number of people with diagnosed hypertension who need to achieve a blood pressure of 150/90” and the target 80% treatment level. The Reynard Surgery is second in WSCCG, needing to treat an additional 120 patients.
18.8% 15.9% 15.3% 11.4% 15.7% 15.3%0.0%
5.0%
10.0%
15.0%
20.0%
Forest Surgery Brandon MedicalPractice
LakenheathSurgery
The ReynardSurgery
Market CrossSurgery
Mildenhall andBrandon INT
Mildenhall and Brandon INT: place-based needs assessment (2019)
Public Health Suffolk Page 41 of 97
Figure 26: Estimated number of people with diagnosed hypertension who need to achieve a blood pressure of 150/90, to reach the 80% treatment level, by GP practice, West Suffolk CCG, 2017-18
Source: Public Health England, CVD Prevention: Supporting data for Suffolk and North East Essex (March 2019)
Atrial fibrillation Atrial Fibrillation (AF) is “a heart condition that causes an irregular and often abnormally fast heart rate”. It increases the risk of stroke 4-5 times, and can also lead to heart failure.32
Within the three CCG areas that cover Suffolk, a total of 21,328 people (of all ages) had a GP registered diagnosis of atrial fibrillation (AF) in 2017-18. These figures are likely to underestimate the true number of people with AF in Suffolk because a certain number of people living with the condition have not been formally diagnosed.
Prevalence of AF (figure 28) was higher in the Mildenhall and Brandon INT compared to England (2.3% compared to 1.9%, respectively). There was no significant difference between the INT and the WSCCG. All four INT practices show significant variation between one another, with The Reynard Surgery presenting the lowest prevalence (1.5% - significantly lower than England and the WSCCG) and Market Cross Surgery presenting the highest prevalence (2.6% - significantly higher than England and the WSCCG).
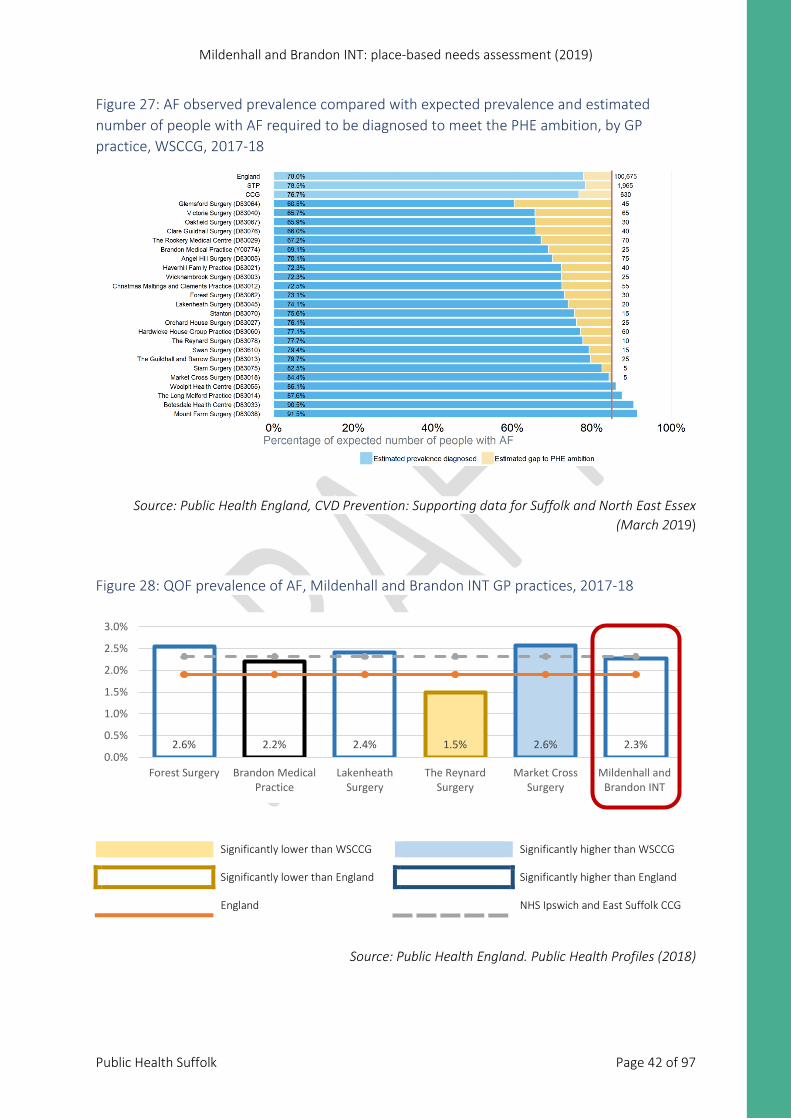
Mildenhall and Brandon INT: place-based needs assessment (2019)
Public Health Suffolk Page 42 of 97
Figure 27: AF observed prevalence compared with expected prevalence and estimated number of people with AF required to be diagnosed to meet the PHE ambition, by GP practice, WSCCG, 2017-18
Source: Public Health England, CVD Prevention: Supporting data for Suffolk and North East Essex (March 2019)
Figure 28: QOF prevalence of AF, Mildenhall and Brandon INT GP practices, 2017-18
Significantly lower than WSCCG Significantly higher than WSCCG Significantly lower than England Significantly higher than England England NHS Ipswich and East Suffolk CCG
Source: Public Health England. Public Health Profiles (2018)
2.6% 2.2% 2.4% 1.5% 2.6% 2.3%0.0%
0.5%
1.0%
1.5%
2.0%
2.5%
3.0%
Forest Surgery Brandon MedicalPractice
LakenheathSurgery
The ReynardSurgery
Market CrossSurgery
Mildenhall andBrandon INT
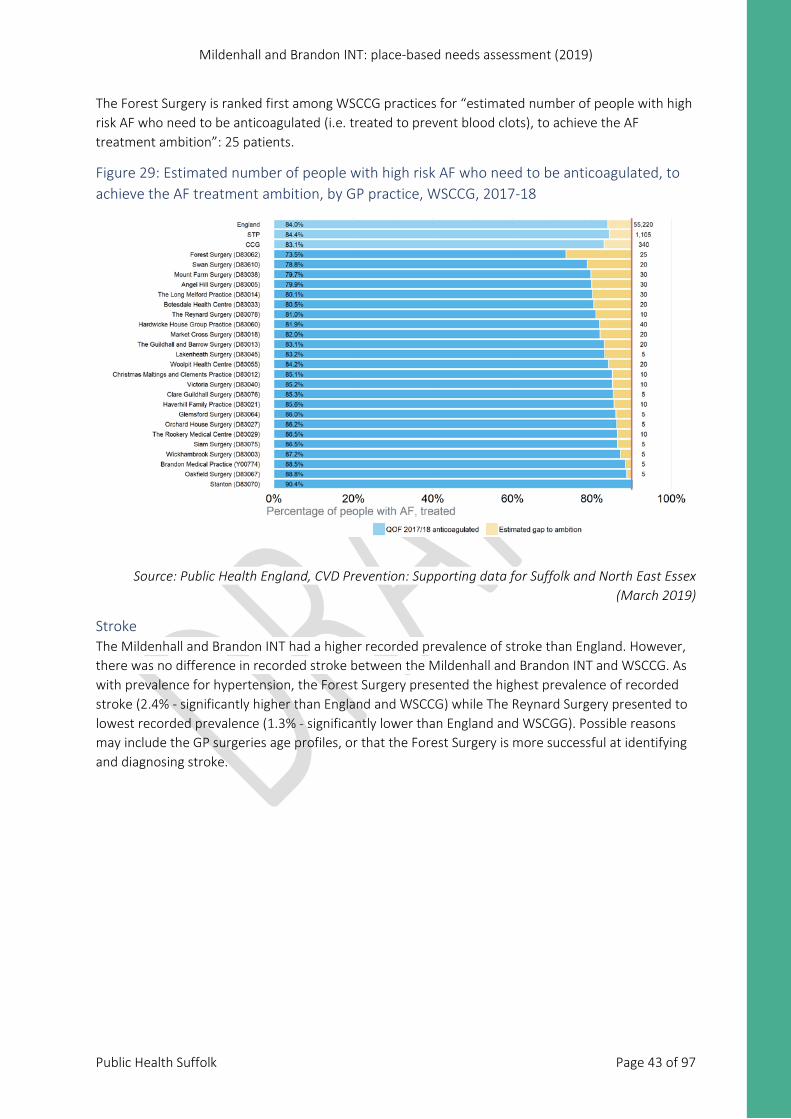
Mildenhall and Brandon INT: place-based needs assessment (2019)
Public Health Suffolk Page 43 of 97
The Forest Surgery is ranked first among WSCCG practices for “estimated number of people with high risk AF who need to be anticoagulated (i.e. treated to prevent blood clots), to achieve the AF treatment ambition”: 25 patients.
Figure 29: Estimated number of people with high risk AF who need to be anticoagulated, to achieve the AF treatment ambition, by GP practice, WSCCG, 2017-18
Source: Public Health England, CVD Prevention: Supporting data for Suffolk and North East Essex (March 2019)
Stroke The Mildenhall and Brandon INT had a higher recorded prevalence of stroke than England. However, there was no difference in recorded stroke between the Mildenhall and Brandon INT and WSCCG. As with prevalence for hypertension, the Forest Surgery presented the highest prevalence of recorded stroke (2.4% - significantly higher than England and WSCCG) while The Reynard Surgery presented to lowest recorded prevalence (1.3% - significantly lower than England and WSCGG). Possible reasons may include the GP surgeries age profiles, or that the Forest Surgery is more successful at identifying and diagnosing stroke.
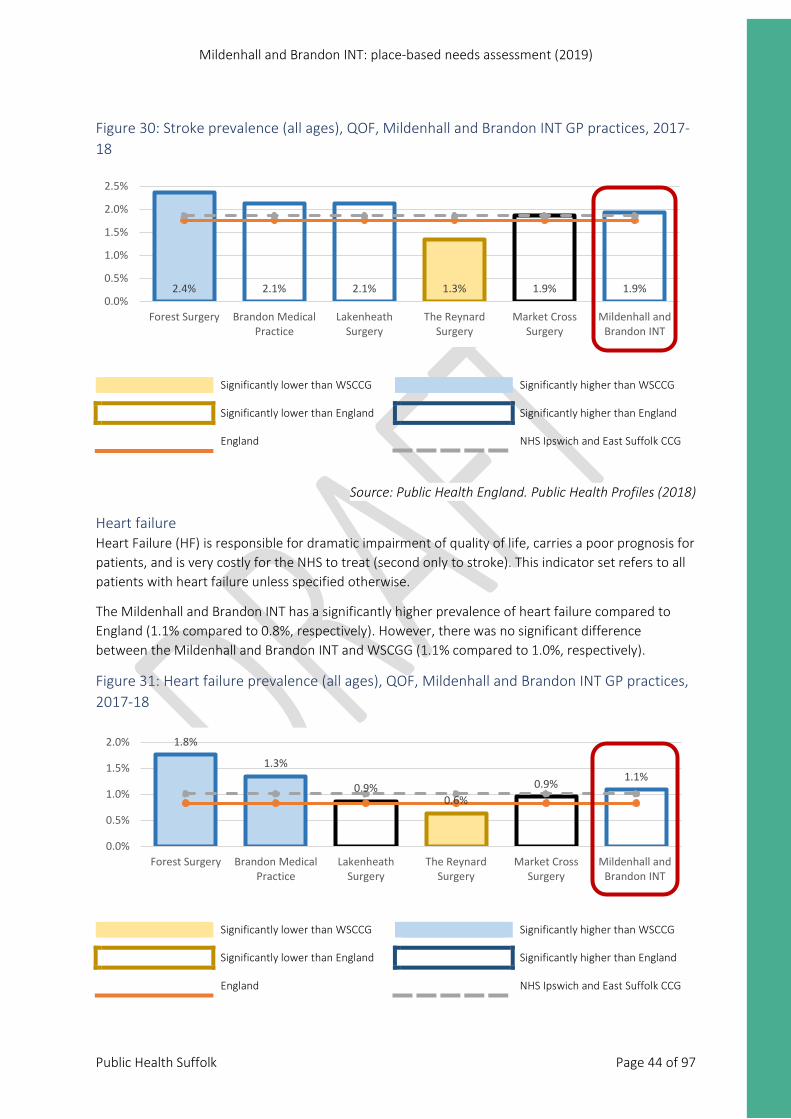
Mildenhall and Brandon INT: place-based needs assessment (2019)
Public Health Suffolk Page 44 of 97
Figure 30: Stroke prevalence (all ages), QOF, Mildenhall and Brandon INT GP practices, 2017-18
Significantly lower than WSCCG Significantly higher than WSCCG Significantly lower than England Significantly higher than England England NHS Ipswich and East Suffolk CCG
Source: Public Health England. Public Health Profiles (2018)
Heart failure Heart Failure (HF) is responsible for dramatic impairment of quality of life, carries a poor prognosis for patients, and is very costly for the NHS to treat (second only to stroke). This indicator set refers to all patients with heart failure unless specified otherwise.
The Mildenhall and Brandon INT has a significantly higher prevalence of heart failure compared to England (1.1% compared to 0.8%, respectively). However, there was no significant difference between the Mildenhall and Brandon INT and WSCGG (1.1% compared to 1.0%, respectively).
Figure 31: Heart failure prevalence (all ages), QOF, Mildenhall and Brandon INT GP practices, 2017-18
Significantly lower than WSCCG Significantly higher than WSCCG Significantly lower than England Significantly higher than England England NHS Ipswich and East Suffolk CCG
2.4% 2.1% 2.1% 1.3% 1.9% 1.9%0.0%
0.5%
1.0%
1.5%
2.0%
2.5%
Forest Surgery Brandon MedicalPractice
LakenheathSurgery
The ReynardSurgery
Market CrossSurgery
Mildenhall andBrandon INT
1.8%
1.3%
0.9%0.6%
0.9% 1.1%
0.0%
0.5%
1.0%
1.5%
2.0%
Forest Surgery Brandon MedicalPractice
LakenheathSurgery
The ReynardSurgery
Market CrossSurgery
Mildenhall andBrandon INT
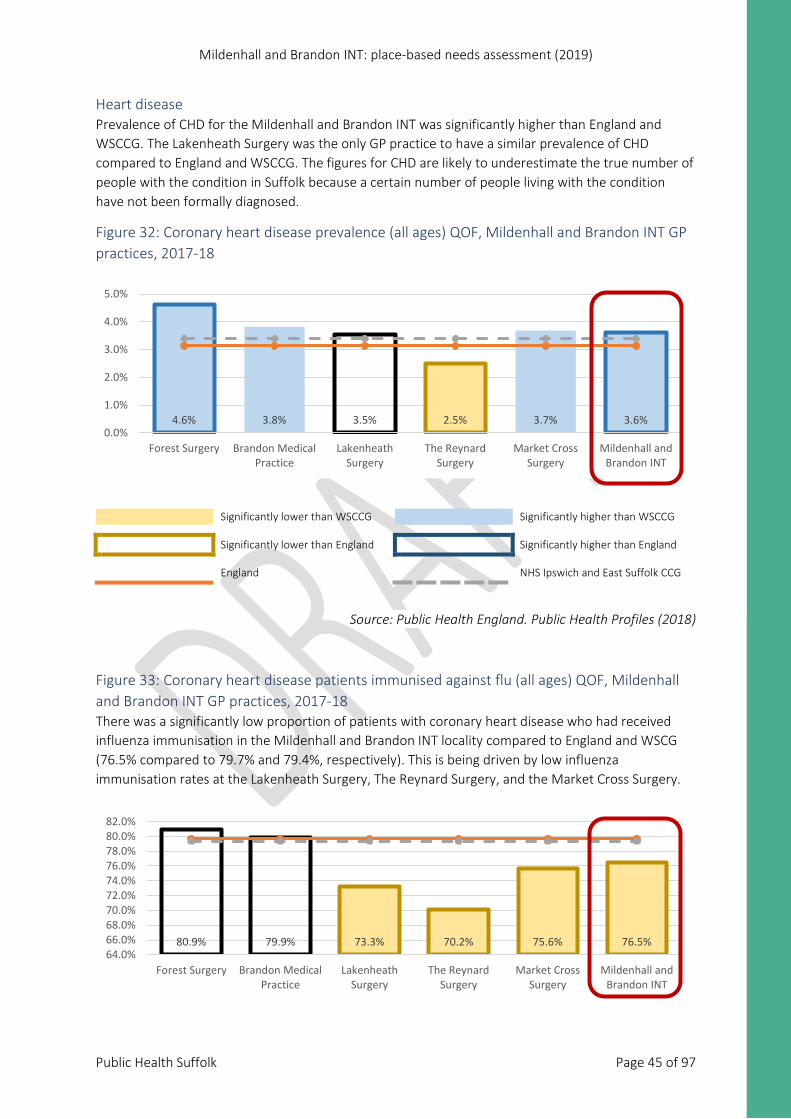
Mildenhall and Brandon INT: place-based needs assessment (2019)
Public Health Suffolk Page 45 of 97
Heart disease Prevalence of CHD for the Mildenhall and Brandon INT was significantly higher than England and WSCCG. The Lakenheath Surgery was the only GP practice to have a similar prevalence of CHD compared to England and WSCCG. The figures for CHD are likely to underestimate the true number of people with the condition in Suffolk because a certain number of people living with the condition have not been formally diagnosed.
Figure 32: Coronary heart disease prevalence (all ages) QOF, Mildenhall and Brandon INT GP practices, 2017-18
Significantly lower than WSCCG Significantly higher than WSCCG Significantly lower than England Significantly higher than England England NHS Ipswich and East Suffolk CCG
Source: Public Health England. Public Health Profiles (2018)
Figure 33: Coronary heart disease patients immunised against flu (all ages) QOF, Mildenhall and Brandon INT GP practices, 2017-18 There was a significantly low proportion of patients with coronary heart disease who had received influenza immunisation in the Mildenhall and Brandon INT locality compared to England and WSCG (76.5% compared to 79.7% and 79.4%, respectively). This is being driven by low influenza immunisation rates at the Lakenheath Surgery, The Reynard Surgery, and the Market Cross Surgery.
4.6% 3.8% 3.5% 2.5% 3.7% 3.6%0.0%
1.0%
2.0%
3.0%
4.0%
5.0%
Forest Surgery Brandon MedicalPractice
LakenheathSurgery
The ReynardSurgery
Market CrossSurgery
Mildenhall andBrandon INT
80.9% 79.9% 73.3% 70.2% 75.6% 76.5%64.0%66.0%68.0%70.0%72.0%74.0%76.0%78.0%80.0%82.0%
Forest Surgery Brandon MedicalPractice
LakenheathSurgery
The ReynardSurgery
Market CrossSurgery
Mildenhall andBrandon INT
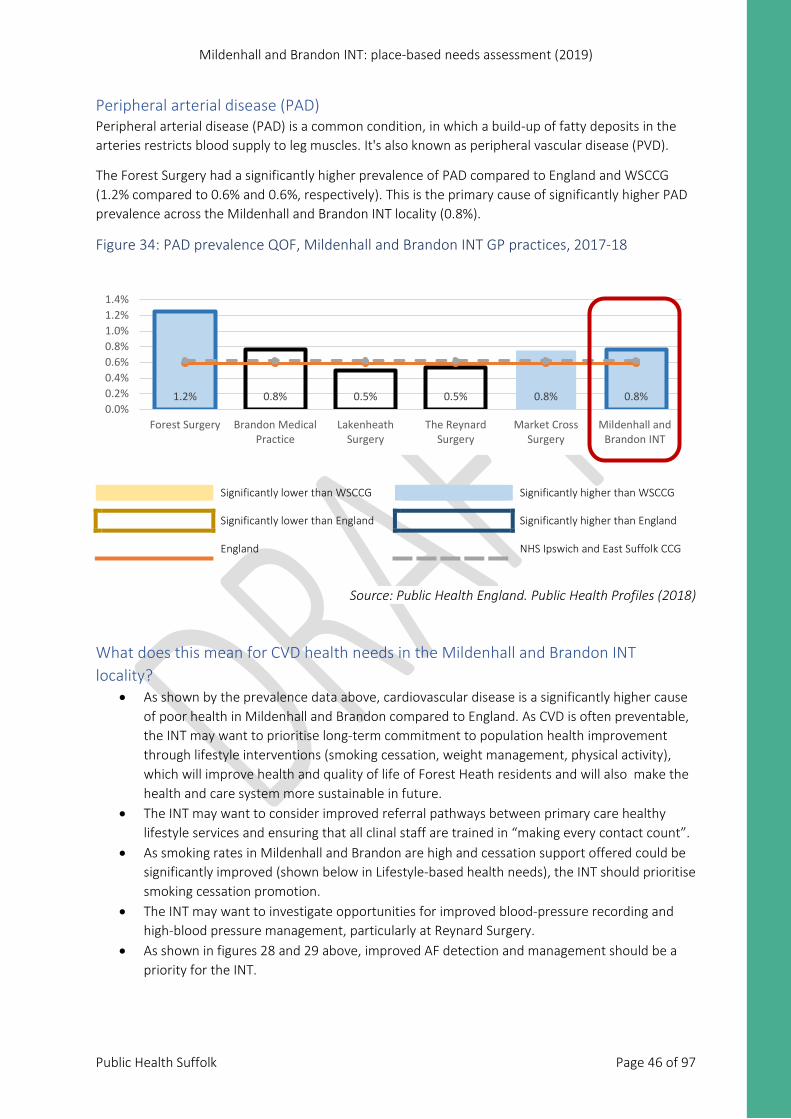
Mildenhall and Brandon INT: place-based needs assessment (2019)
Public Health Suffolk Page 46 of 97
Peripheral arterial disease (PAD) Peripheral arterial disease (PAD) is a common condition, in which a build-up of fatty deposits in the arteries restricts blood supply to leg muscles. It's also known as peripheral vascular disease (PVD).
The Forest Surgery had a significantly higher prevalence of PAD compared to England and WSCCG (1.2% compared to 0.6% and 0.6%, respectively). This is the primary cause of significantly higher PAD prevalence across the Mildenhall and Brandon INT locality (0.8%).
Figure 34: PAD prevalence QOF, Mildenhall and Brandon INT GP practices, 2017-18
Significantly lower than WSCCG Significantly higher than WSCCG Significantly lower than England Significantly higher than England England NHS Ipswich and East Suffolk CCG
Source: Public Health England. Public Health Profiles (2018)
What does this mean for CVD health needs in the Mildenhall and Brandon INT locality?
• As shown by the prevalence data above, cardiovascular disease is a significantly higher cause of poor health in Mildenhall and Brandon compared to England. As CVD is often preventable, the INT may want to prioritise long-term commitment to population health improvement through lifestyle interventions (smoking cessation, weight management, physical activity), which will improve health and quality of life of Forest Heath residents and will also make the health and care system more sustainable in future.
• The INT may want to consider improved referral pathways between primary care healthy lifestyle services and ensuring that all clinal staff are trained in “making every contact count”.
• As smoking rates in Mildenhall and Brandon are high and cessation support offered could be significantly improved (shown below in Lifestyle-based health needs), the INT should prioritise smoking cessation promotion.
• The INT may want to investigate opportunities for improved blood-pressure recording and high-blood pressure management, particularly at Reynard Surgery.
• As shown in figures 28 and 29 above, improved AF detection and management should be a priority for the INT.
1.2% 0.8% 0.5% 0.5% 0.8% 0.8%0.0%0.2%0.4%0.6%0.8%1.0%1.2%1.4%
Forest Surgery Brandon MedicalPractice
LakenheathSurgery
The ReynardSurgery
Market CrossSurgery
Mildenhall andBrandon INT
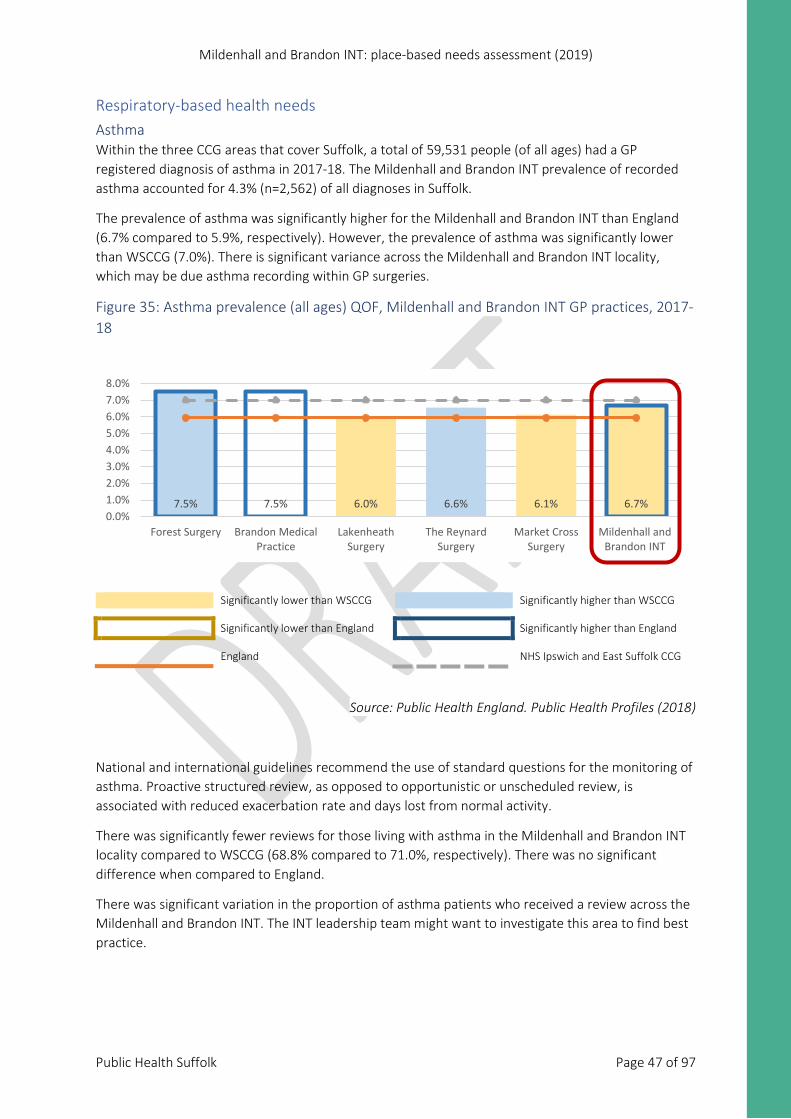
Mildenhall and Brandon INT: place-based needs assessment (2019)
Public Health Suffolk Page 47 of 97
Respiratory-based health needs Asthma Within the three CCG areas that cover Suffolk, a total of 59,531 people (of all ages) had a GP registered diagnosis of asthma in 2017-18. The Mildenhall and Brandon INT prevalence of recorded asthma accounted for 4.3% (n=2,562) of all diagnoses in Suffolk.
The prevalence of asthma was significantly higher for the Mildenhall and Brandon INT than England (6.7% compared to 5.9%, respectively). However, the prevalence of asthma was significantly lower than WSCCG (7.0%). There is significant variance across the Mildenhall and Brandon INT locality, which may be due asthma recording within GP surgeries.
Figure 35: Asthma prevalence (all ages) QOF, Mildenhall and Brandon INT GP practices, 2017-18
Significantly lower than WSCCG Significantly higher than WSCCG Significantly lower than England Significantly higher than England England NHS Ipswich and East Suffolk CCG
Source: Public Health England. Public Health Profiles (2018)
National and international guidelines recommend the use of standard questions for the monitoring of asthma. Proactive structured review, as opposed to opportunistic or unscheduled review, is associated with reduced exacerbation rate and days lost from normal activity.
There was significantly fewer reviews for those living with asthma in the Mildenhall and Brandon INT locality compared to WSCCG (68.8% compared to 71.0%, respectively). There was no significant difference when compared to England.
There was significant variation in the proportion of asthma patients who received a review across the Mildenhall and Brandon INT. The INT leadership team might want to investigate this area to find best practice.
7.5% 7.5% 6.0% 6.6% 6.1% 6.7%0.0%1.0%2.0%3.0%4.0%5.0%6.0%7.0%8.0%
Forest Surgery Brandon MedicalPractice
LakenheathSurgery
The ReynardSurgery
Market CrossSurgery
Mildenhall andBrandon INT
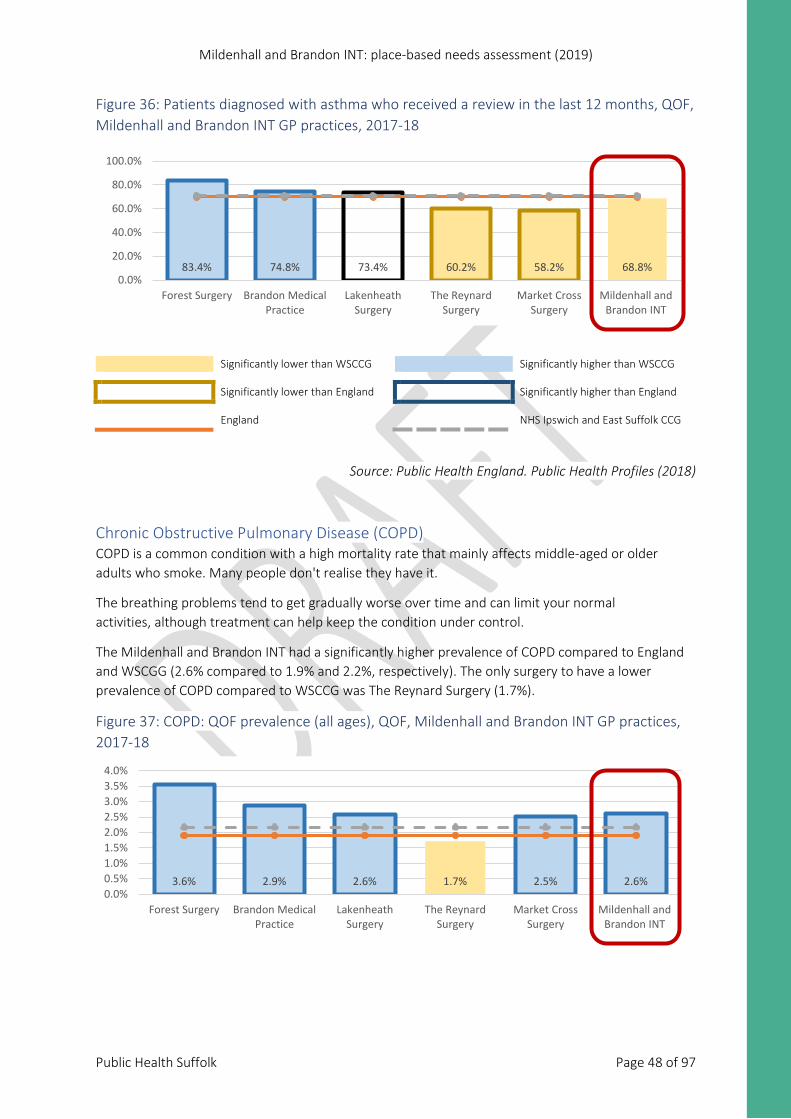
Mildenhall and Brandon INT: place-based needs assessment (2019)
Public Health Suffolk Page 48 of 97
Figure 36: Patients diagnosed with asthma who received a review in the last 12 months, QOF, Mildenhall and Brandon INT GP practices, 2017-18
Significantly lower than WSCCG Significantly higher than WSCCG Significantly lower than England Significantly higher than England England NHS Ipswich and East Suffolk CCG
Source: Public Health England. Public Health Profiles (2018)
Chronic Obstructive Pulmonary Disease (COPD) COPD is a common condition with a high mortality rate that mainly affects middle-aged or older adults who smoke. Many people don't realise they have it.
The breathing problems tend to get gradually worse over time and can limit your normal activities, although treatment can help keep the condition under control.
The Mildenhall and Brandon INT had a significantly higher prevalence of COPD compared to England and WSCGG (2.6% compared to 1.9% and 2.2%, respectively). The only surgery to have a lower prevalence of COPD compared to WSCCG was The Reynard Surgery (1.7%).
Figure 37: COPD: QOF prevalence (all ages), QOF, Mildenhall and Brandon INT GP practices, 2017-18
83.4% 74.8% 73.4% 60.2% 58.2% 68.8%0.0%
20.0%
40.0%
60.0%
80.0%
100.0%
Forest Surgery Brandon MedicalPractice
LakenheathSurgery
The ReynardSurgery
Market CrossSurgery
Mildenhall andBrandon INT
3.6% 2.9% 2.6% 1.7% 2.5% 2.6%0.0%0.5%1.0%1.5%2.0%2.5%3.0%3.5%4.0%
Forest Surgery Brandon MedicalPractice
LakenheathSurgery
The ReynardSurgery
Market CrossSurgery
Mildenhall andBrandon INT
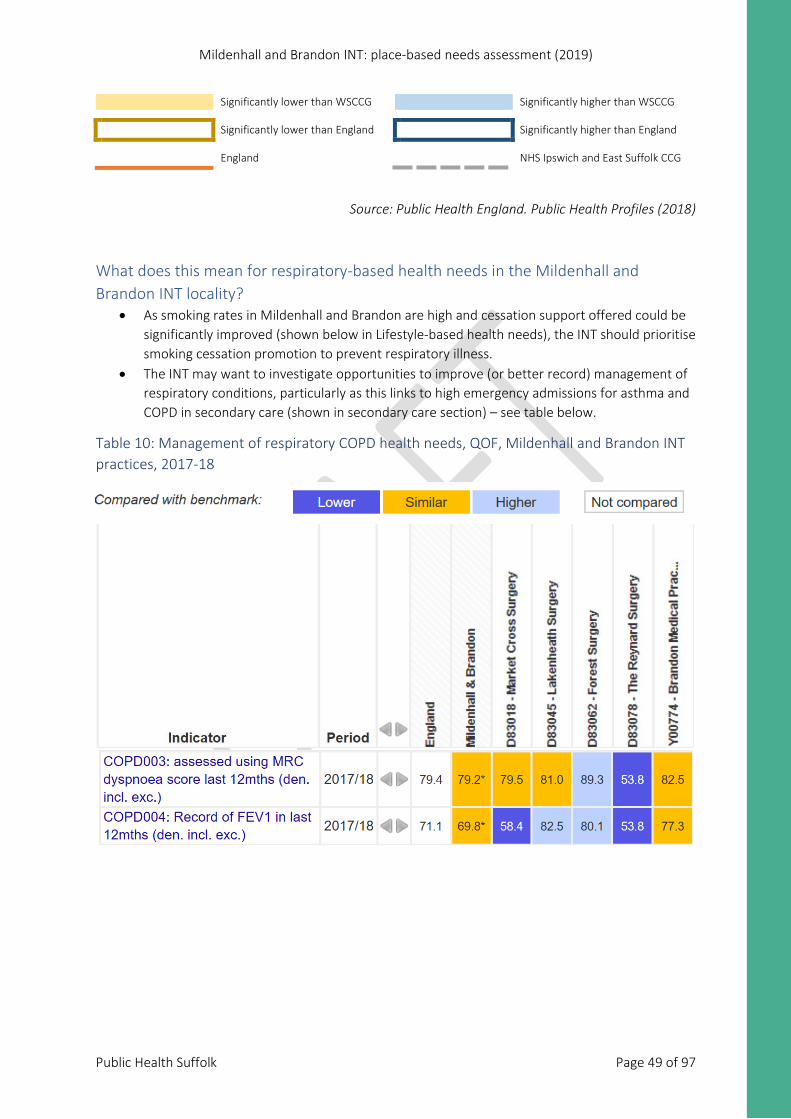
Mildenhall and Brandon INT: place-based needs assessment (2019)
Public Health Suffolk Page 49 of 97
Significantly lower than WSCCG Significantly higher than WSCCG Significantly lower than England Significantly higher than England England NHS Ipswich and East Suffolk CCG
Source: Public Health England. Public Health Profiles (2018)
What does this mean for respiratory-based health needs in the Mildenhall and Brandon INT locality?
• As smoking rates in Mildenhall and Brandon are high and cessation support offered could be significantly improved (shown below in Lifestyle-based health needs), the INT should prioritise smoking cessation promotion to prevent respiratory illness.
• The INT may want to investigate opportunities to improve (or better record) management of respiratory conditions, particularly as this links to high emergency admissions for asthma and COPD in secondary care (shown in secondary care section) – see table below.
Table 10: Management of respiratory COPD health needs, QOF, Mildenhall and Brandon INT practices, 2017-18
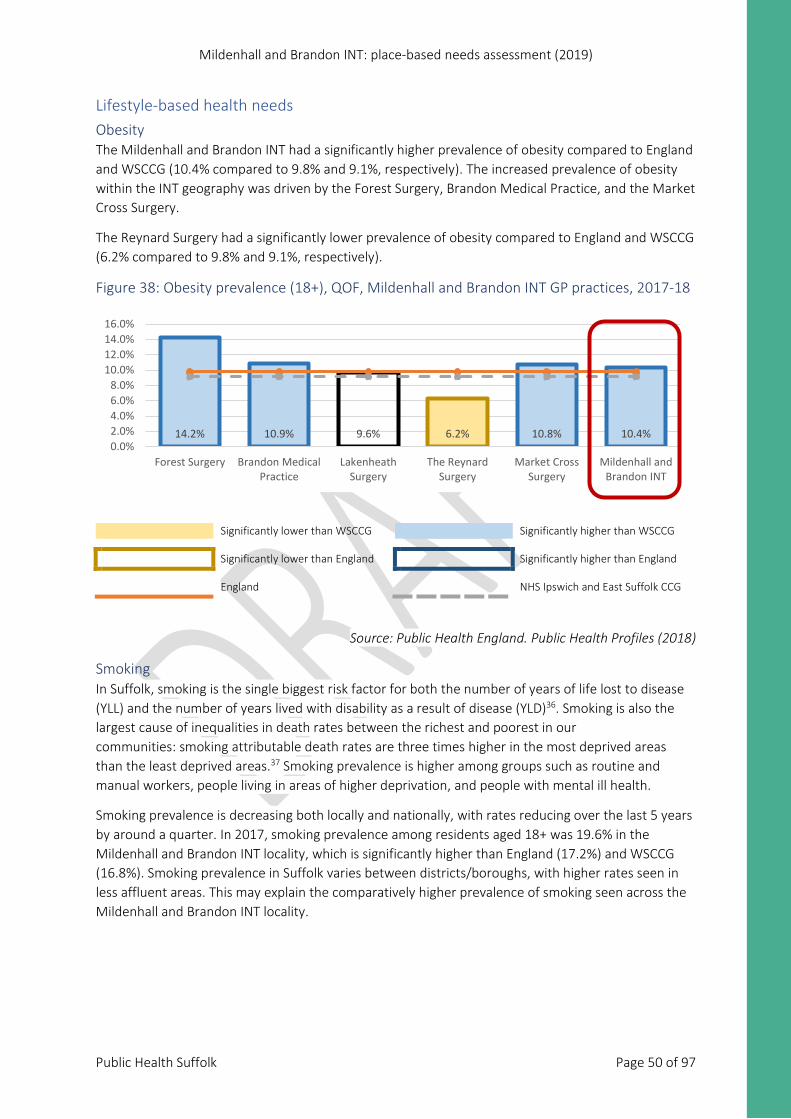
Mildenhall and Brandon INT: place-based needs assessment (2019)
Public Health Suffolk Page 50 of 97
Lifestyle-based health needs Obesity The Mildenhall and Brandon INT had a significantly higher prevalence of obesity compared to England and WSCCG (10.4% compared to 9.8% and 9.1%, respectively). The increased prevalence of obesity within the INT geography was driven by the Forest Surgery, Brandon Medical Practice, and the Market Cross Surgery.
The Reynard Surgery had a significantly lower prevalence of obesity compared to England and WSCCG (6.2% compared to 9.8% and 9.1%, respectively).
Figure 38: Obesity prevalence (18+), QOF, Mildenhall and Brandon INT GP practices, 2017-18
Significantly lower than WSCCG Significantly higher than WSCCG Significantly lower than England Significantly higher than England England NHS Ipswich and East Suffolk CCG
Source: Public Health England. Public Health Profiles (2018)
Smoking In Suffolk, smoking is the single biggest risk factor for both the number of years of life lost to disease (YLL) and the number of years lived with disability as a result of disease (YLD)36. Smoking is also the largest cause of inequalities in death rates between the richest and poorest in our communities: smoking attributable death rates are three times higher in the most deprived areas than the least deprived areas.37 Smoking prevalence is higher among groups such as routine and manual workers, people living in areas of higher deprivation, and people with mental ill health.
Smoking prevalence is decreasing both locally and nationally, with rates reducing over the last 5 years by around a quarter. In 2017, smoking prevalence among residents aged 18+ was 19.6% in the Mildenhall and Brandon INT locality, which is significantly higher than England (17.2%) and WSCCG (16.8%). Smoking prevalence in Suffolk varies between districts/boroughs, with higher rates seen in less affluent areas. This may explain the comparatively higher prevalence of smoking seen across the Mildenhall and Brandon INT locality.
14.2% 10.9% 9.6% 6.2% 10.8% 10.4%0.0%2.0%4.0%6.0%8.0%
10.0%12.0%14.0%16.0%
Forest Surgery Brandon MedicalPractice
LakenheathSurgery
The ReynardSurgery
Market CrossSurgery
Mildenhall andBrandon INT
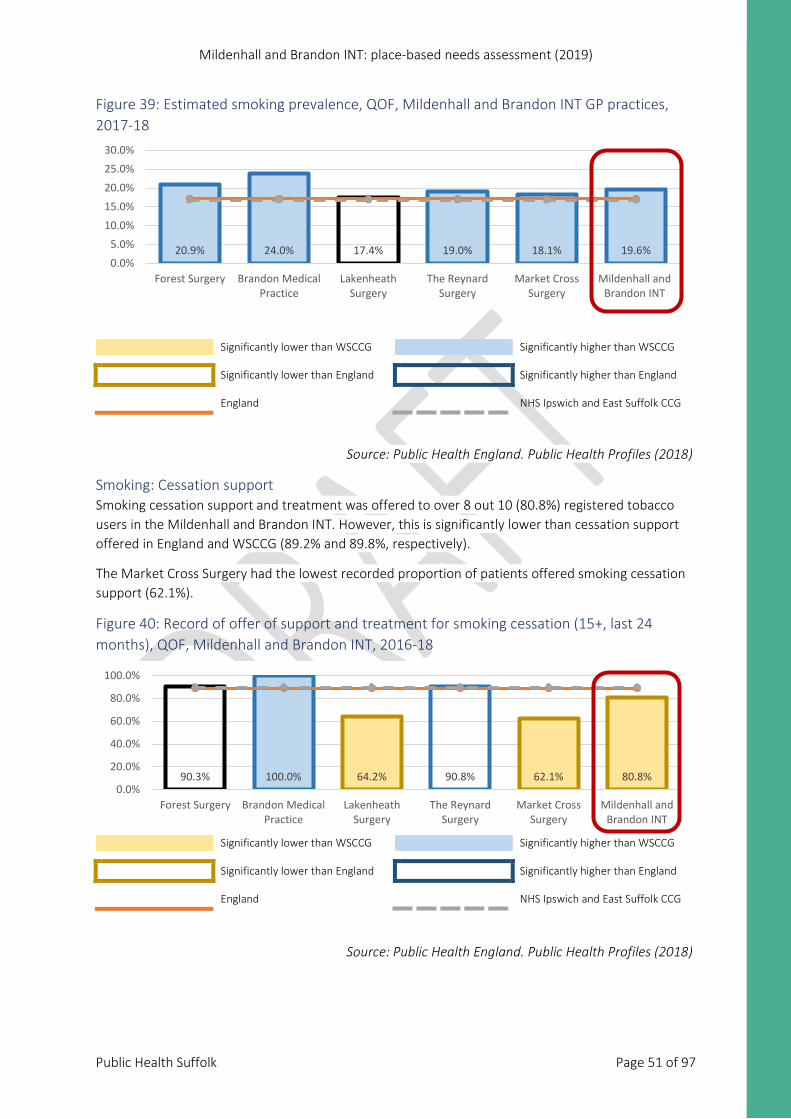
Mildenhall and Brandon INT: place-based needs assessment (2019)
Public Health Suffolk Page 51 of 97
Figure 39: Estimated smoking prevalence, QOF, Mildenhall and Brandon INT GP practices, 2017-18
Significantly lower than WSCCG Significantly higher than WSCCG Significantly lower than England Significantly higher than England England NHS Ipswich and East Suffolk CCG
Source: Public Health England. Public Health Profiles (2018)
Smoking: Cessation support Smoking cessation support and treatment was offered to over 8 out 10 (80.8%) registered tobacco users in the Mildenhall and Brandon INT. However, this is significantly lower than cessation support offered in England and WSCCG (89.2% and 89.8%, respectively).
The Market Cross Surgery had the lowest recorded proportion of patients offered smoking cessation support (62.1%).
Figure 40: Record of offer of support and treatment for smoking cessation (15+, last 24 months), QOF, Mildenhall and Brandon INT, 2016-18
Significantly lower than WSCCG Significantly higher than WSCCG Significantly lower than England Significantly higher than England England NHS Ipswich and East Suffolk CCG
Source: Public Health England. Public Health Profiles (2018)
20.9% 24.0% 17.4% 19.0% 18.1% 19.6%0.0%5.0%
10.0%15.0%20.0%25.0%30.0%
Forest Surgery Brandon MedicalPractice
LakenheathSurgery
The ReynardSurgery
Market CrossSurgery
Mildenhall andBrandon INT
90.3% 100.0% 64.2% 90.8% 62.1% 80.8%0.0%
20.0%
40.0%
60.0%
80.0%
100.0%
Forest Surgery Brandon MedicalPractice
LakenheathSurgery
The ReynardSurgery
Market CrossSurgery
Mildenhall andBrandon INT
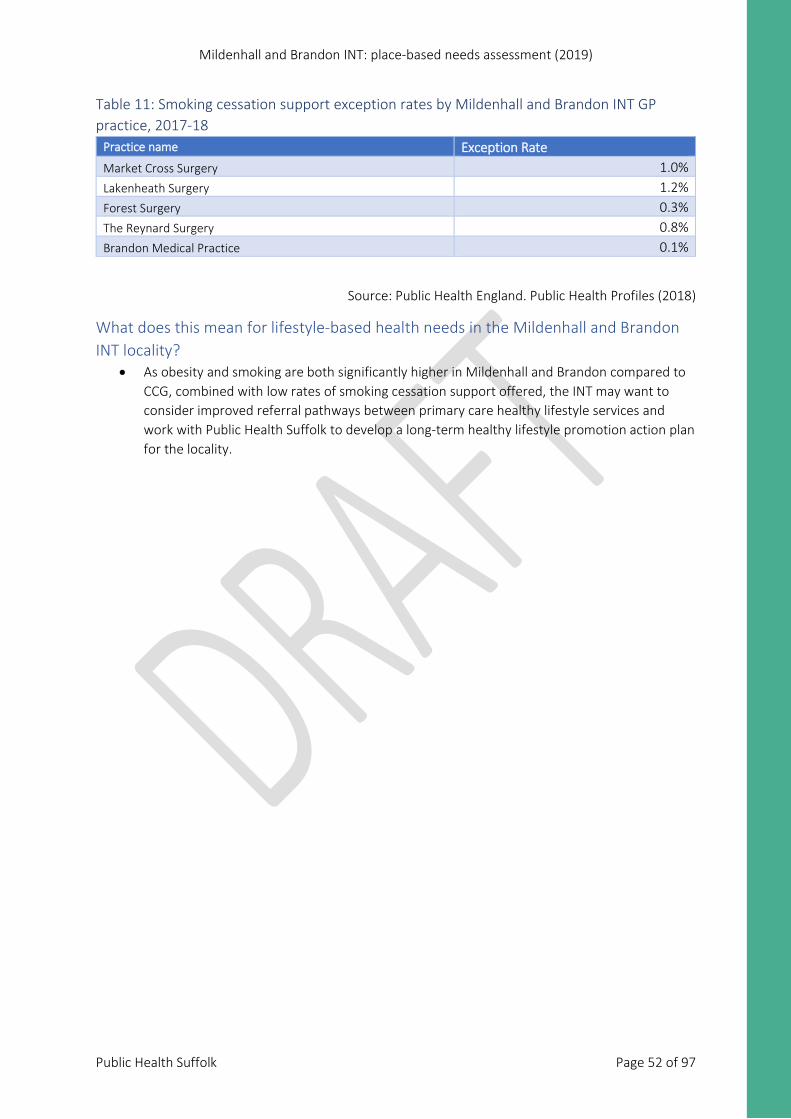
Mildenhall and Brandon INT: place-based needs assessment (2019)
Public Health Suffolk Page 52 of 97
Table 11: Smoking cessation support exception rates by Mildenhall and Brandon INT GP practice, 2017-18
Practice name Exception Rate Market Cross Surgery 1.0% Lakenheath Surgery 1.2% Forest Surgery 0.3% The Reynard Surgery 0.8% Brandon Medical Practice 0.1%
Source: Public Health England. Public Health Profiles (2018)
What does this mean for lifestyle-based health needs in the Mildenhall and Brandon INT locality?
• As obesity and smoking are both significantly higher in Mildenhall and Brandon compared to CCG, combined with low rates of smoking cessation support offered, the INT may want to consider improved referral pathways between primary care healthy lifestyle services and work with Public Health Suffolk to develop a long-term healthy lifestyle promotion action plan for the locality.
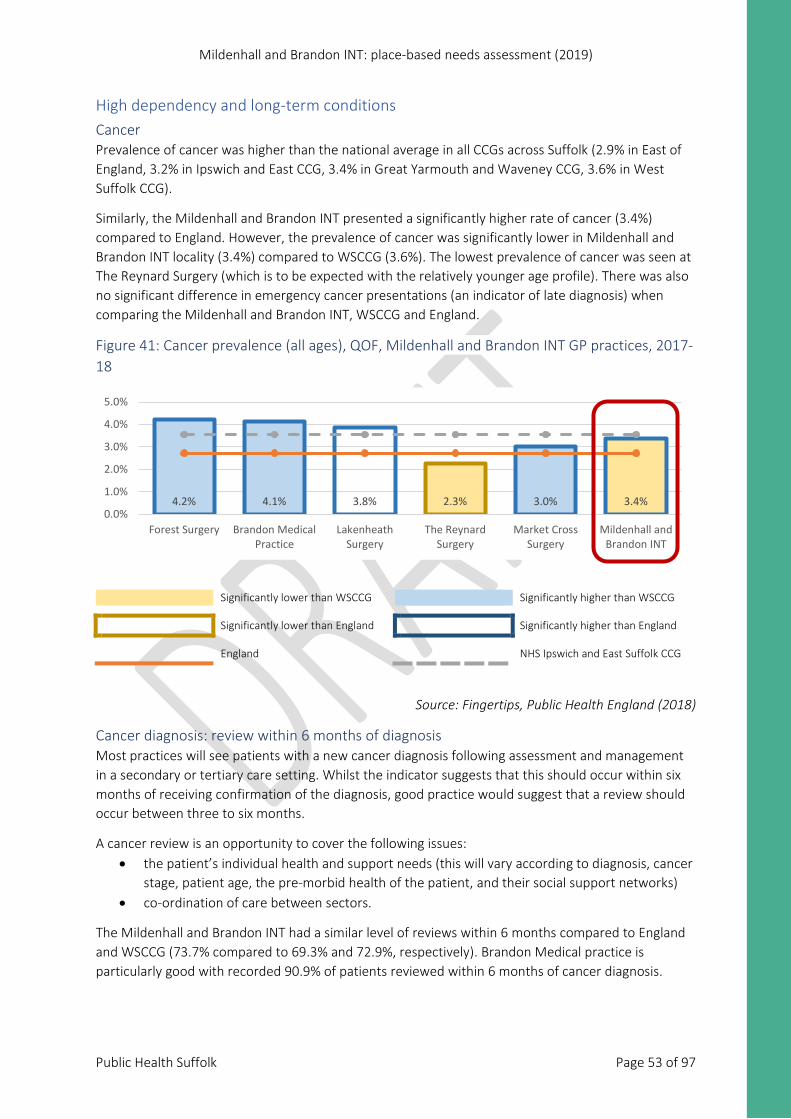
Mildenhall and Brandon INT: place-based needs assessment (2019)
Public Health Suffolk Page 53 of 97
High dependency and long-term conditions Cancer Prevalence of cancer was higher than the national average in all CCGs across Suffolk (2.9% in East of England, 3.2% in Ipswich and East CCG, 3.4% in Great Yarmouth and Waveney CCG, 3.6% in West Suffolk CCG).
Similarly, the Mildenhall and Brandon INT presented a significantly higher rate of cancer (3.4%) compared to England. However, the prevalence of cancer was significantly lower in Mildenhall and Brandon INT locality (3.4%) compared to WSCCG (3.6%). The lowest prevalence of cancer was seen at The Reynard Surgery (which is to be expected with the relatively younger age profile). There was also no significant difference in emergency cancer presentations (an indicator of late diagnosis) when comparing the Mildenhall and Brandon INT, WSCCG and England.
Figure 41: Cancer prevalence (all ages), QOF, Mildenhall and Brandon INT GP practices, 2017-18
Significantly lower than WSCCG Significantly higher than WSCCG Significantly lower than England Significantly higher than England England NHS Ipswich and East Suffolk CCG
Source: Fingertips, Public Health England (2018)
Cancer diagnosis: review within 6 months of diagnosis Most practices will see patients with a new cancer diagnosis following assessment and management in a secondary or tertiary care setting. Whilst the indicator suggests that this should occur within six months of receiving confirmation of the diagnosis, good practice would suggest that a review should occur between three to six months.
A cancer review is an opportunity to cover the following issues: • the patient’s individual health and support needs (this will vary according to diagnosis, cancer
stage, patient age, the pre-morbid health of the patient, and their social support networks) • co-ordination of care between sectors.
The Mildenhall and Brandon INT had a similar level of reviews within 6 months compared to England and WSCCG (73.7% compared to 69.3% and 72.9%, respectively). Brandon Medical practice is particularly good with recorded 90.9% of patients reviewed within 6 months of cancer diagnosis.
4.2% 4.1% 3.8% 2.3% 3.0% 3.4%0.0%
1.0%
2.0%
3.0%
4.0%
5.0%
Forest Surgery Brandon MedicalPractice
LakenheathSurgery
The ReynardSurgery
Market CrossSurgery
Mildenhall andBrandon INT
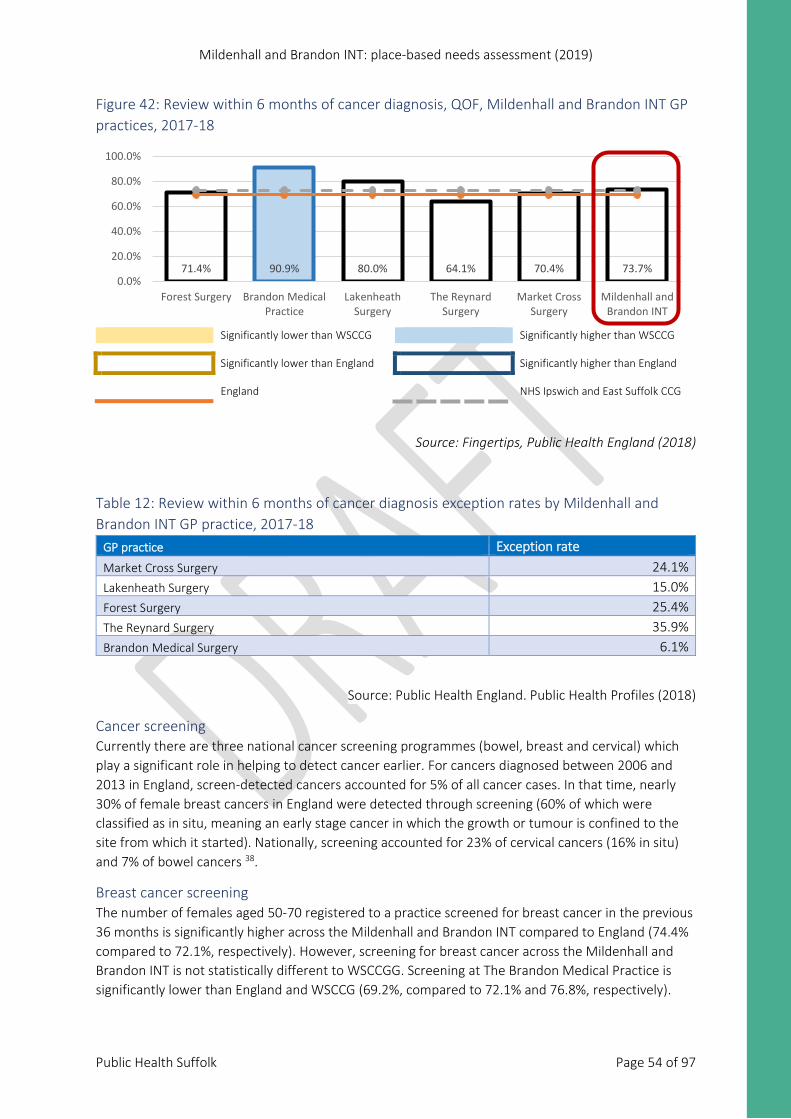
Mildenhall and Brandon INT: place-based needs assessment (2019)
Public Health Suffolk Page 54 of 97
Figure 42: Review within 6 months of cancer diagnosis, QOF, Mildenhall and Brandon INT GP practices, 2017-18
Significantly lower than WSCCG Significantly higher than WSCCG Significantly lower than England Significantly higher than England England NHS Ipswich and East Suffolk CCG
Source: Fingertips, Public Health England (2018)
Table 12: Review within 6 months of cancer diagnosis exception rates by Mildenhall and Brandon INT GP practice, 2017-18
GP practice Exception rate Market Cross Surgery 24.1% Lakenheath Surgery 15.0% Forest Surgery 25.4% The Reynard Surgery 35.9% Brandon Medical Surgery 6.1%
Source: Public Health England. Public Health Profiles (2018)
Cancer screening Currently there are three national cancer screening programmes (bowel, breast and cervical) which play a significant role in helping to detect cancer earlier. For cancers diagnosed between 2006 and 2013 in England, screen-detected cancers accounted for 5% of all cancer cases. In that time, nearly 30% of female breast cancers in England were detected through screening (60% of which were classified as in situ, meaning an early stage cancer in which the growth or tumour is confined to the site from which it started). Nationally, screening accounted for 23% of cervical cancers (16% in situ) and 7% of bowel cancers 38.
Breast cancer screening The number of females aged 50-70 registered to a practice screened for breast cancer in the previous 36 months is significantly higher across the Mildenhall and Brandon INT compared to England (74.4% compared to 72.1%, respectively). However, screening for breast cancer across the Mildenhall and Brandon INT is not statistically different to WSCCGG. Screening at The Brandon Medical Practice is significantly lower than England and WSCCG (69.2%, compared to 72.1% and 76.8%, respectively).
71.4% 90.9% 80.0% 64.1% 70.4% 73.7%0.0%
20.0%
40.0%
60.0%
80.0%
100.0%
Forest Surgery Brandon MedicalPractice
LakenheathSurgery
The ReynardSurgery
Market CrossSurgery
Mildenhall andBrandon INT
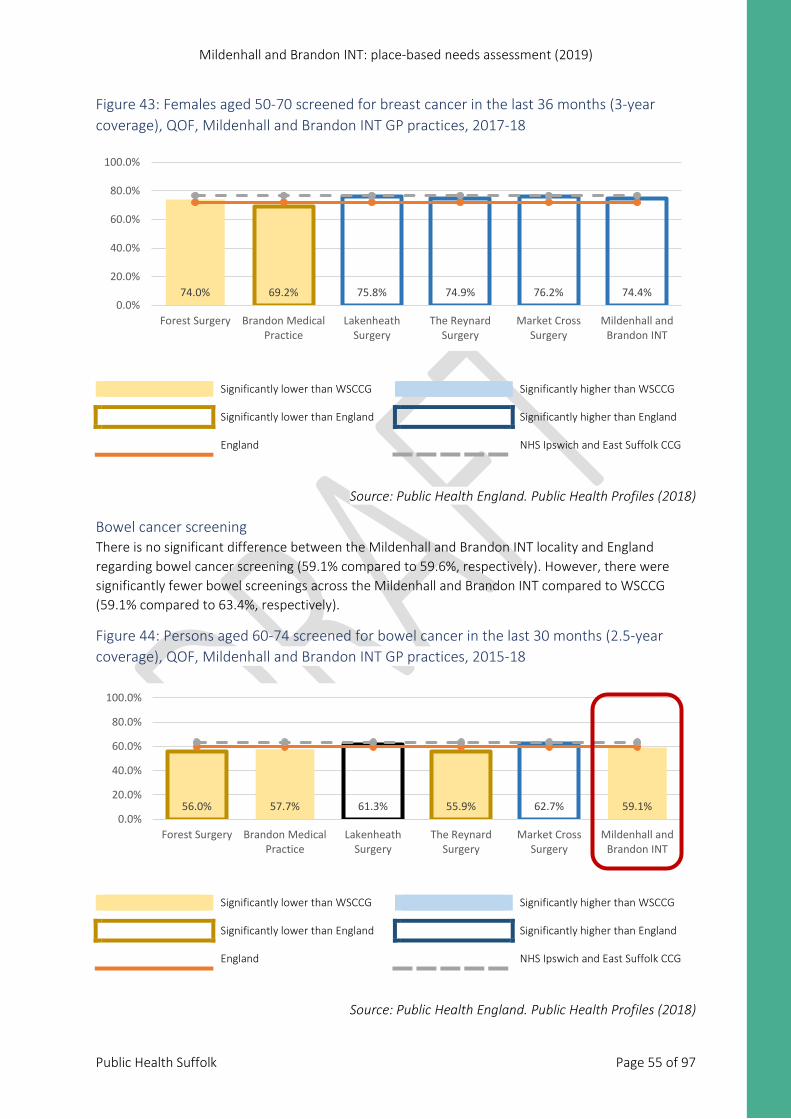
Mildenhall and Brandon INT: place-based needs assessment (2019)
Public Health Suffolk Page 55 of 97
Figure 43: Females aged 50-70 screened for breast cancer in the last 36 months (3-year coverage), QOF, Mildenhall and Brandon INT GP practices, 2017-18
Significantly lower than WSCCG Significantly higher than WSCCG Significantly lower than England Significantly higher than England England NHS Ipswich and East Suffolk CCG
Source: Public Health England. Public Health Profiles (2018)
Bowel cancer screening There is no significant difference between the Mildenhall and Brandon INT locality and England regarding bowel cancer screening (59.1% compared to 59.6%, respectively). However, there were significantly fewer bowel screenings across the Mildenhall and Brandon INT compared to WSCCG (59.1% compared to 63.4%, respectively).
Figure 44: Persons aged 60-74 screened for bowel cancer in the last 30 months (2.5-year coverage), QOF, Mildenhall and Brandon INT GP practices, 2015-18
Significantly lower than WSCCG Significantly higher than WSCCG Significantly lower than England Significantly higher than England England NHS Ipswich and East Suffolk CCG
Source: Public Health England. Public Health Profiles (2018)
74.0% 69.2% 75.8% 74.9% 76.2% 74.4%0.0%
20.0%
40.0%
60.0%
80.0%
100.0%
Forest Surgery Brandon MedicalPractice
LakenheathSurgery
The ReynardSurgery
Market CrossSurgery
Mildenhall andBrandon INT
56.0% 57.7% 61.3% 55.9% 62.7% 59.1%0.0%
20.0%
40.0%
60.0%
80.0%
100.0%
Forest Surgery Brandon MedicalPractice
LakenheathSurgery
The ReynardSurgery
Market CrossSurgery
Mildenhall andBrandon INT
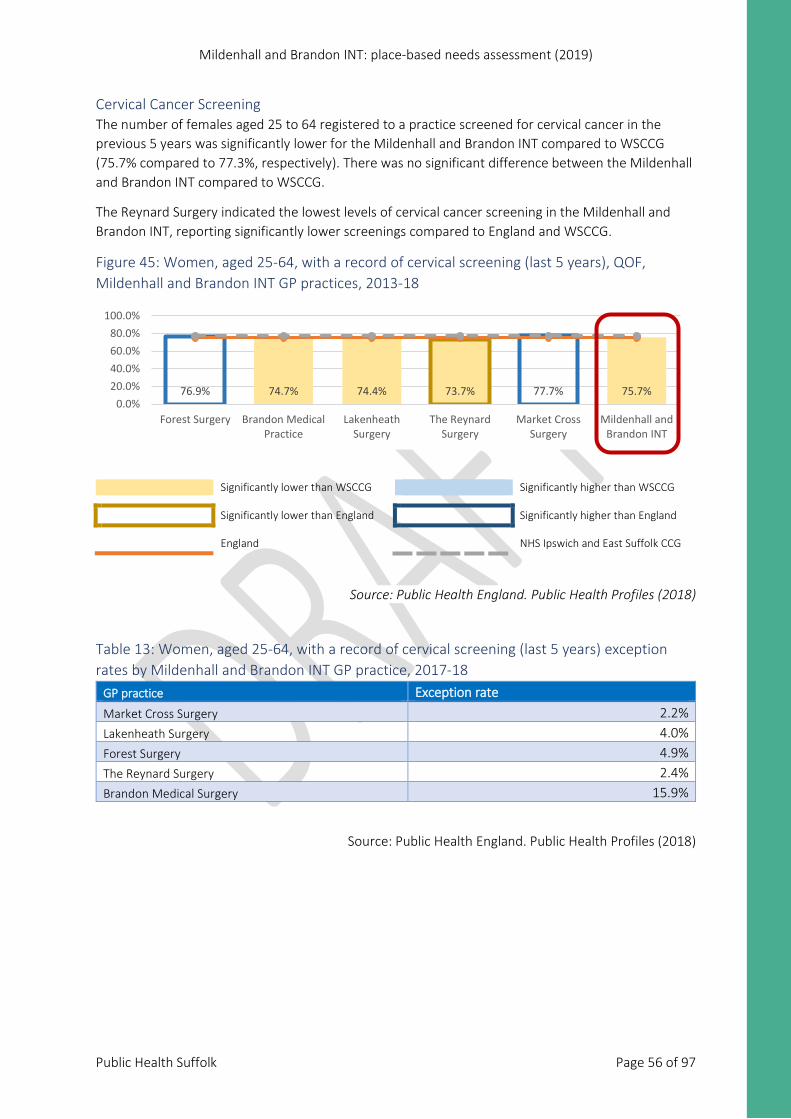
Mildenhall and Brandon INT: place-based needs assessment (2019)
Public Health Suffolk Page 56 of 97
Cervical Cancer Screening The number of females aged 25 to 64 registered to a practice screened for cervical cancer in the previous 5 years was significantly lower for the Mildenhall and Brandon INT compared to WSCCG (75.7% compared to 77.3%, respectively). There was no significant difference between the Mildenhall and Brandon INT compared to WSCCG.
The Reynard Surgery indicated the lowest levels of cervical cancer screening in the Mildenhall and Brandon INT, reporting significantly lower screenings compared to England and WSCCG.
Figure 45: Women, aged 25-64, with a record of cervical screening (last 5 years), QOF, Mildenhall and Brandon INT GP practices, 2013-18
Significantly lower than WSCCG Significantly higher than WSCCG Significantly lower than England Significantly higher than England England NHS Ipswich and East Suffolk CCG
Source: Public Health England. Public Health Profiles (2018)
Table 13: Women, aged 25-64, with a record of cervical screening (last 5 years) exception rates by Mildenhall and Brandon INT GP practice, 2017-18
GP practice Exception rate Market Cross Surgery 2.2% Lakenheath Surgery 4.0% Forest Surgery 4.9% The Reynard Surgery 2.4% Brandon Medical Surgery 15.9%
Source: Public Health England. Public Health Profiles (2018)
76.9% 74.7% 74.4% 73.7% 77.7% 75.7%0.0%
20.0%40.0%60.0%80.0%
100.0%
Forest Surgery Brandon MedicalPractice
LakenheathSurgery
The ReynardSurgery
Market CrossSurgery
Mildenhall andBrandon INT
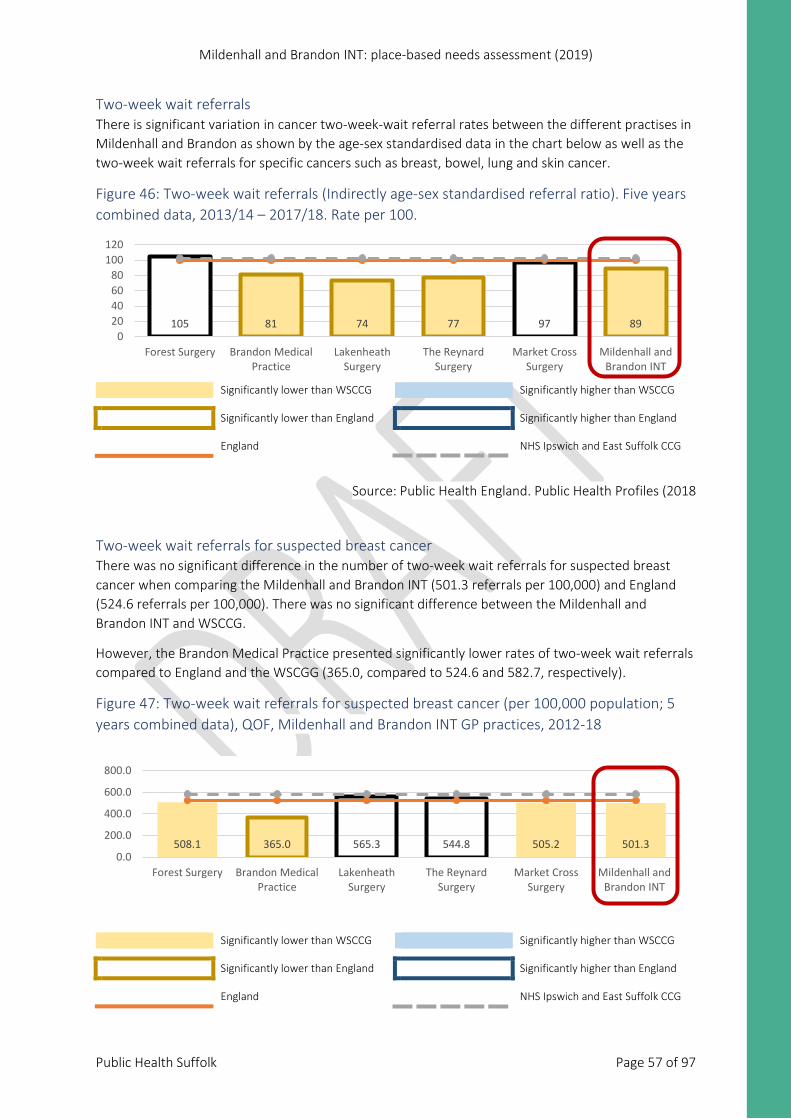
Mildenhall and Brandon INT: place-based needs assessment (2019)
Public Health Suffolk Page 57 of 97
Two-week wait referrals There is significant variation in cancer two-week-wait referral rates between the different practises in Mildenhall and Brandon as shown by the age-sex standardised data in the chart below as well as the two-week wait referrals for specific cancers such as breast, bowel, lung and skin cancer.
Figure 46: Two-week wait referrals (Indirectly age-sex standardised referral ratio). Five years combined data, 2013/14 – 2017/18. Rate per 100.
Significantly lower than WSCCG Significantly higher than WSCCG Significantly lower than England Significantly higher than England England NHS Ipswich and East Suffolk CCG
Source: Public Health England. Public Health Profiles (2018
Two-week wait referrals for suspected breast cancer There was no significant difference in the number of two-week wait referrals for suspected breast cancer when comparing the Mildenhall and Brandon INT (501.3 referrals per 100,000) and England (524.6 referrals per 100,000). There was no significant difference between the Mildenhall and Brandon INT and WSCCG.
However, the Brandon Medical Practice presented significantly lower rates of two-week wait referrals compared to England and the WSCGG (365.0, compared to 524.6 and 582.7, respectively).
Figure 47: Two-week wait referrals for suspected breast cancer (per 100,000 population; 5 years combined data), QOF, Mildenhall and Brandon INT GP practices, 2012-18
Significantly lower than WSCCG Significantly higher than WSCCG Significantly lower than England Significantly higher than England England NHS Ipswich and East Suffolk CCG
508.1 365.0 565.3 544.8 505.2 501.30.0
200.0
400.0
600.0
800.0
Forest Surgery Brandon MedicalPractice
LakenheathSurgery
The ReynardSurgery
Market CrossSurgery
Mildenhall andBrandon INT
105 81 74 77 97 890
20406080
100120
Forest Surgery Brandon MedicalPractice
LakenheathSurgery
The ReynardSurgery
Market CrossSurgery
Mildenhall andBrandon INT
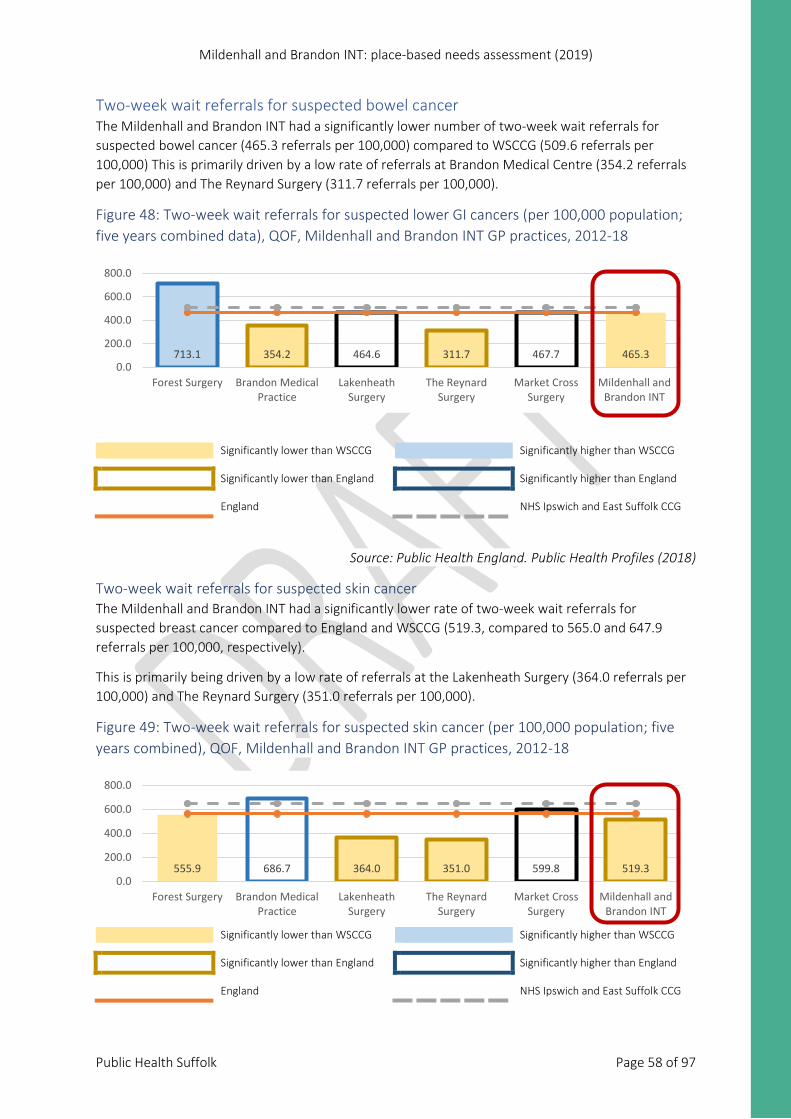
Mildenhall and Brandon INT: place-based needs assessment (2019)
Public Health Suffolk Page 58 of 97
Two-week wait referrals for suspected bowel cancer The Mildenhall and Brandon INT had a significantly lower number of two-week wait referrals for suspected bowel cancer (465.3 referrals per 100,000) compared to WSCCG (509.6 referrals per 100,000) This is primarily driven by a low rate of referrals at Brandon Medical Centre (354.2 referrals per 100,000) and The Reynard Surgery (311.7 referrals per 100,000).
Figure 48: Two-week wait referrals for suspected lower GI cancers (per 100,000 population; five years combined data), QOF, Mildenhall and Brandon INT GP practices, 2012-18
Significantly lower than WSCCG Significantly higher than WSCCG Significantly lower than England Significantly higher than England England NHS Ipswich and East Suffolk CCG
Source: Public Health England. Public Health Profiles (2018)
Two-week wait referrals for suspected skin cancer The Mildenhall and Brandon INT had a significantly lower rate of two-week wait referrals for suspected breast cancer compared to England and WSCCG (519.3, compared to 565.0 and 647.9 referrals per 100,000, respectively).
This is primarily being driven by a low rate of referrals at the Lakenheath Surgery (364.0 referrals per 100,000) and The Reynard Surgery (351.0 referrals per 100,000).
Figure 49: Two-week wait referrals for suspected skin cancer (per 100,000 population; five years combined), QOF, Mildenhall and Brandon INT GP practices, 2012-18
Significantly lower than WSCCG Significantly higher than WSCCG Significantly lower than England Significantly higher than England England NHS Ipswich and East Suffolk CCG
713.1 354.2 464.6 311.7 467.7 465.30.0
200.0
400.0
600.0
800.0
Forest Surgery Brandon MedicalPractice
LakenheathSurgery
The ReynardSurgery
Market CrossSurgery
Mildenhall andBrandon INT
555.9 686.7 364.0 351.0 599.8 519.30.0
200.0
400.0
600.0
800.0
Forest Surgery Brandon MedicalPractice
LakenheathSurgery
The ReynardSurgery
Market CrossSurgery
Mildenhall andBrandon INT
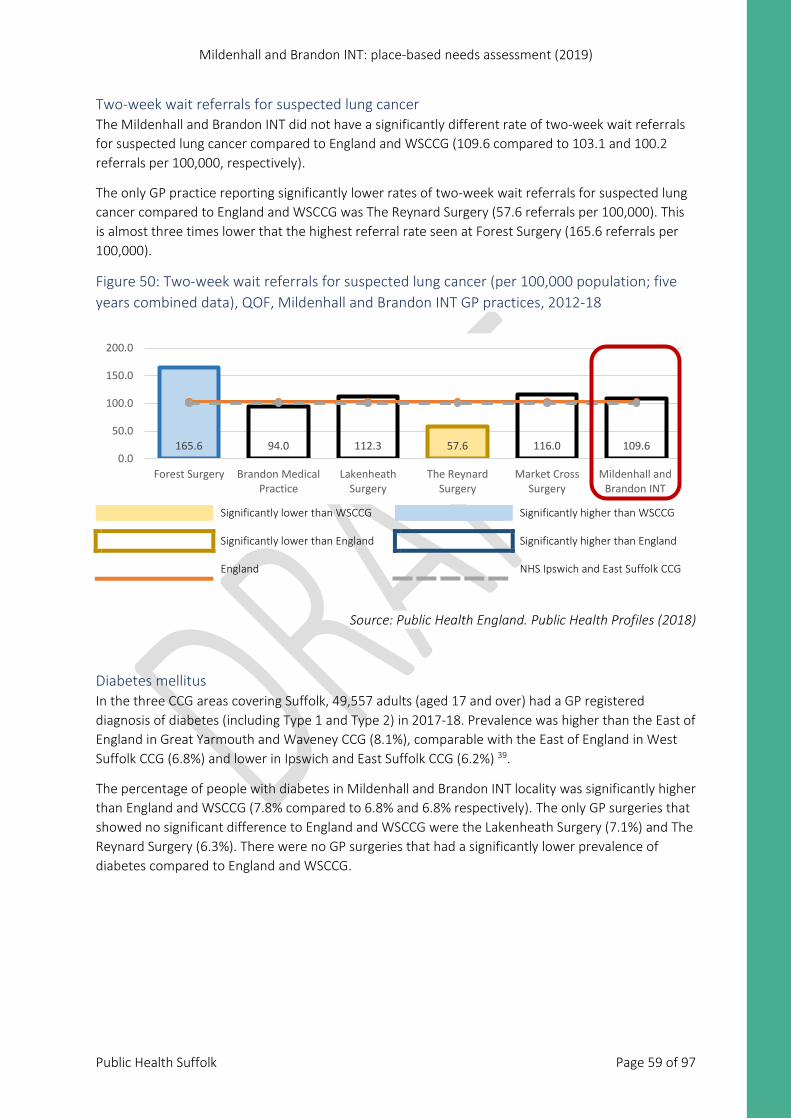
Mildenhall and Brandon INT: place-based needs assessment (2019)
Public Health Suffolk Page 59 of 97
Two-week wait referrals for suspected lung cancer The Mildenhall and Brandon INT did not have a significantly different rate of two-week wait referrals for suspected lung cancer compared to England and WSCCG (109.6 compared to 103.1 and 100.2 referrals per 100,000, respectively).
The only GP practice reporting significantly lower rates of two-week wait referrals for suspected lung cancer compared to England and WSCCG was The Reynard Surgery (57.6 referrals per 100,000). This is almost three times lower that the highest referral rate seen at Forest Surgery (165.6 referrals per 100,000).
Figure 50: Two-week wait referrals for suspected lung cancer (per 100,000 population; five years combined data), QOF, Mildenhall and Brandon INT GP practices, 2012-18
Significantly lower than WSCCG Significantly higher than WSCCG Significantly lower than England Significantly higher than England England NHS Ipswich and East Suffolk CCG
Source: Public Health England. Public Health Profiles (2018)
Diabetes mellitus In the three CCG areas covering Suffolk, 49,557 adults (aged 17 and over) had a GP registered diagnosis of diabetes (including Type 1 and Type 2) in 2017-18. Prevalence was higher than the East of England in Great Yarmouth and Waveney CCG (8.1%), comparable with the East of England in West Suffolk CCG (6.8%) and lower in Ipswich and East Suffolk CCG (6.2%) 39.
The percentage of people with diabetes in Mildenhall and Brandon INT locality was significantly higher than England and WSCCG (7.8% compared to 6.8% and 6.8% respectively). The only GP surgeries that showed no significant difference to England and WSCCG were the Lakenheath Surgery (7.1%) and The Reynard Surgery (6.3%). There were no GP surgeries that had a significantly lower prevalence of diabetes compared to England and WSCCG.
165.6 94.0 112.3 57.6 116.0 109.60.0
50.0
100.0
150.0
200.0
Forest Surgery Brandon MedicalPractice
LakenheathSurgery
The ReynardSurgery
Market CrossSurgery
Mildenhall andBrandon INT
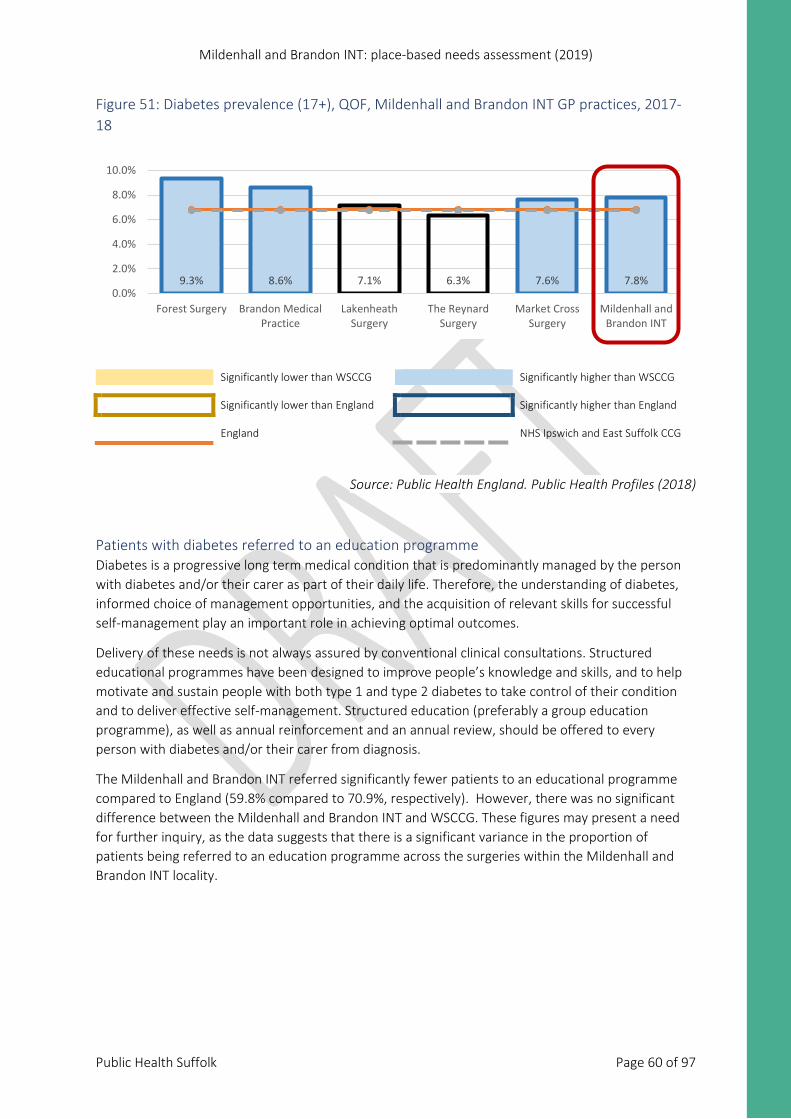
Mildenhall and Brandon INT: place-based needs assessment (2019)
Public Health Suffolk Page 60 of 97
Figure 51: Diabetes prevalence (17+), QOF, Mildenhall and Brandon INT GP practices, 2017-18
Significantly lower than WSCCG Significantly higher than WSCCG Significantly lower than England Significantly higher than England England NHS Ipswich and East Suffolk CCG
Source: Public Health England. Public Health Profiles (2018)
Patients with diabetes referred to an education programme Diabetes is a progressive long term medical condition that is predominantly managed by the person with diabetes and/or their carer as part of their daily life. Therefore, the understanding of diabetes, informed choice of management opportunities, and the acquisition of relevant skills for successful self-management play an important role in achieving optimal outcomes.
Delivery of these needs is not always assured by conventional clinical consultations. Structured educational programmes have been designed to improve people’s knowledge and skills, and to help motivate and sustain people with both type 1 and type 2 diabetes to take control of their condition and to deliver effective self-management. Structured education (preferably a group education programme), as well as annual reinforcement and an annual review, should be offered to every person with diabetes and/or their carer from diagnosis.
The Mildenhall and Brandon INT referred significantly fewer patients to an educational programme compared to England (59.8% compared to 70.9%, respectively). However, there was no significant difference between the Mildenhall and Brandon INT and WSCCG. These figures may present a need for further inquiry, as the data suggests that there is a significant variance in the proportion of patients being referred to an education programme across the surgeries within the Mildenhall and Brandon INT locality.
9.3% 8.6% 7.1% 6.3% 7.6% 7.8%0.0%
2.0%
4.0%
6.0%
8.0%
10.0%
Forest Surgery Brandon MedicalPractice
LakenheathSurgery
The ReynardSurgery
Market CrossSurgery
Mildenhall andBrandon INT
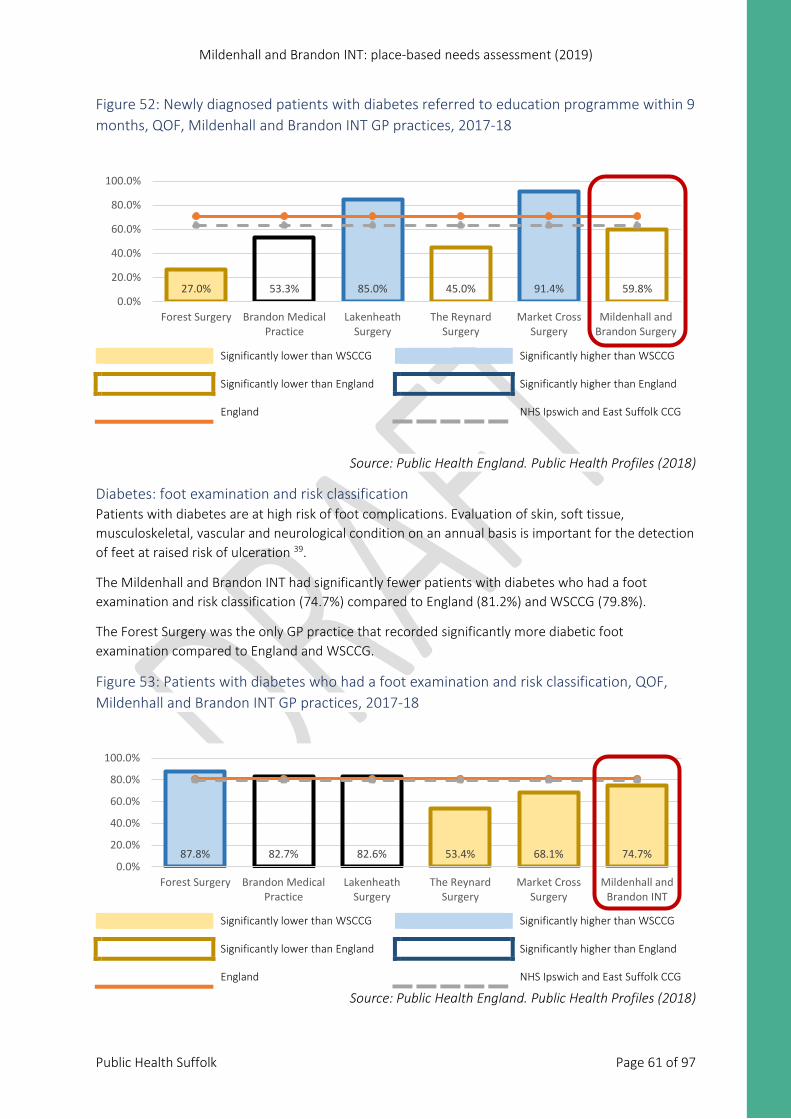
Mildenhall and Brandon INT: place-based needs assessment (2019)
Public Health Suffolk Page 61 of 97
Figure 52: Newly diagnosed patients with diabetes referred to education programme within 9 months, QOF, Mildenhall and Brandon INT GP practices, 2017-18
Significantly lower than WSCCG Significantly higher than WSCCG Significantly lower than England Significantly higher than England England NHS Ipswich and East Suffolk CCG
Source: Public Health England. Public Health Profiles (2018)
Diabetes: foot examination and risk classification Patients with diabetes are at high risk of foot complications. Evaluation of skin, soft tissue, musculoskeletal, vascular and neurological condition on an annual basis is important for the detection of feet at raised risk of ulceration 39.
The Mildenhall and Brandon INT had significantly fewer patients with diabetes who had a foot examination and risk classification (74.7%) compared to England (81.2%) and WSCCG (79.8%).
The Forest Surgery was the only GP practice that recorded significantly more diabetic foot examination compared to England and WSCCG.
Figure 53: Patients with diabetes who had a foot examination and risk classification, QOF, Mildenhall and Brandon INT GP practices, 2017-18
Significantly lower than WSCCG Significantly higher than WSCCG Significantly lower than England Significantly higher than England England NHS Ipswich and East Suffolk CCG
Source: Public Health England. Public Health Profiles (2018)
27.0% 53.3% 85.0% 45.0% 91.4% 59.8%0.0%
20.0%
40.0%
60.0%
80.0%
100.0%
Forest Surgery Brandon MedicalPractice
LakenheathSurgery
The ReynardSurgery
Market CrossSurgery
Mildenhall andBrandon Surgery
87.8% 82.7% 82.6% 53.4% 68.1% 74.7%0.0%
20.0%
40.0%
60.0%
80.0%
100.0%
Forest Surgery Brandon MedicalPractice
LakenheathSurgery
The ReynardSurgery
Market CrossSurgery
Mildenhall andBrandon INT
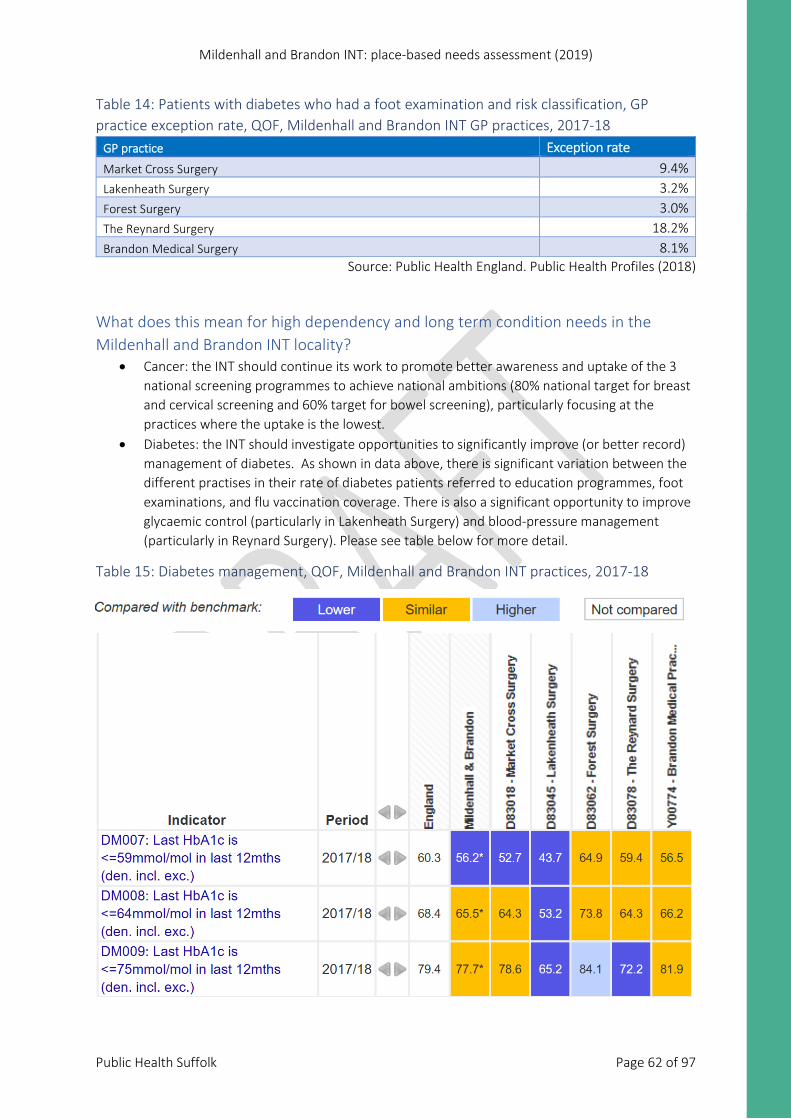
Mildenhall and Brandon INT: place-based needs assessment (2019)
Public Health Suffolk Page 62 of 97
Table 14: Patients with diabetes who had a foot examination and risk classification, GP practice exception rate, QOF, Mildenhall and Brandon INT GP practices, 2017-18
GP practice Exception rate Market Cross Surgery 9.4% Lakenheath Surgery 3.2% Forest Surgery 3.0% The Reynard Surgery 18.2% Brandon Medical Surgery 8.1%
Source: Public Health England. Public Health Profiles (2018)
What does this mean for high dependency and long term condition needs in the Mildenhall and Brandon INT locality?
• Cancer: the INT should continue its work to promote better awareness and uptake of the 3 national screening programmes to achieve national ambitions (80% national target for breast and cervical screening and 60% target for bowel screening), particularly focusing at the practices where the uptake is the lowest.
• Diabetes: the INT should investigate opportunities to significantly improve (or better record) management of diabetes. As shown in data above, there is significant variation between the different practises in their rate of diabetes patients referred to education programmes, foot examinations, and flu vaccination coverage. There is also a significant opportunity to improve glycaemic control (particularly in Lakenheath Surgery) and blood-pressure management (particularly in Reynard Surgery). Please see table below for more detail.
Table 15: Diabetes management, QOF, Mildenhall and Brandon INT practices, 2017-18
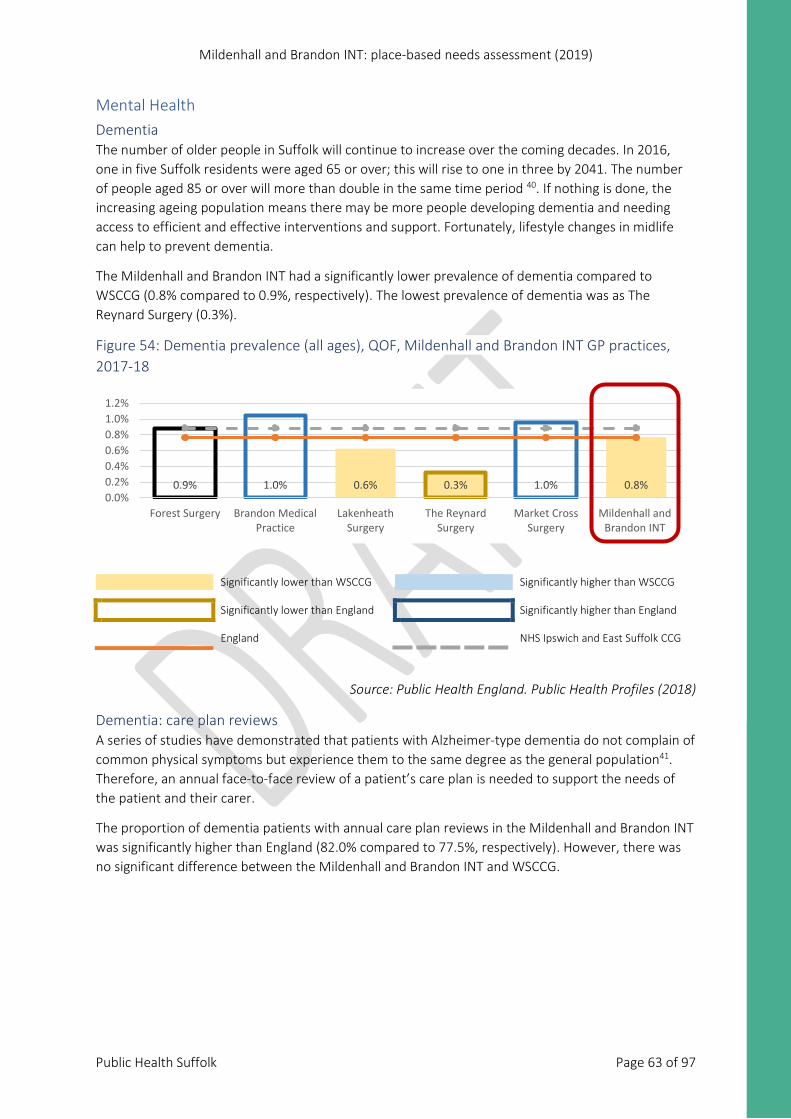
Mildenhall and Brandon INT: place-based needs assessment (2019)
Public Health Suffolk Page 63 of 97
Mental Health Dementia The number of older people in Suffolk will continue to increase over the coming decades. In 2016, one in five Suffolk residents were aged 65 or over; this will rise to one in three by 2041. The number of people aged 85 or over will more than double in the same time period 40. If nothing is done, the increasing ageing population means there may be more people developing dementia and needing access to efficient and effective interventions and support. Fortunately, lifestyle changes in midlife can help to prevent dementia.
The Mildenhall and Brandon INT had a significantly lower prevalence of dementia compared to WSCCG (0.8% compared to 0.9%, respectively). The lowest prevalence of dementia was as The Reynard Surgery (0.3%).
Figure 54: Dementia prevalence (all ages), QOF, Mildenhall and Brandon INT GP practices, 2017-18
Significantly lower than WSCCG Significantly higher than WSCCG Significantly lower than England Significantly higher than England England NHS Ipswich and East Suffolk CCG
Source: Public Health England. Public Health Profiles (2018)
Dementia: care plan reviews A series of studies have demonstrated that patients with Alzheimer-type dementia do not complain of common physical symptoms but experience them to the same degree as the general population41. Therefore, an annual face-to-face review of a patient’s care plan is needed to support the needs of the patient and their carer.
The proportion of dementia patients with annual care plan reviews in the Mildenhall and Brandon INT was significantly higher than England (82.0% compared to 77.5%, respectively). However, there was no significant difference between the Mildenhall and Brandon INT and WSCCG.
0.9% 1.0% 0.6% 0.3% 1.0% 0.8%0.0%0.2%0.4%0.6%0.8%1.0%1.2%
Forest Surgery Brandon MedicalPractice
LakenheathSurgery
The ReynardSurgery
Market CrossSurgery
Mildenhall andBrandon INT
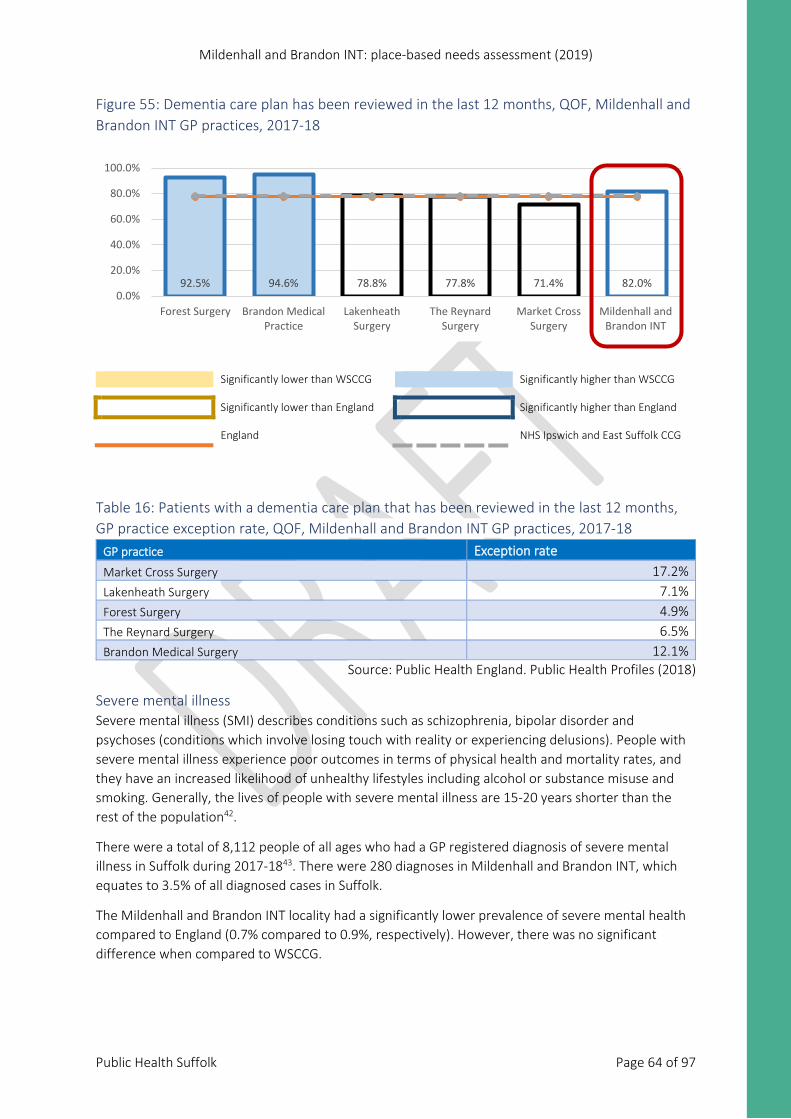
Mildenhall and Brandon INT: place-based needs assessment (2019)
Public Health Suffolk Page 64 of 97
Figure 55: Dementia care plan has been reviewed in the last 12 months, QOF, Mildenhall and Brandon INT GP practices, 2017-18
Significantly lower than WSCCG Significantly higher than WSCCG Significantly lower than England Significantly higher than England England NHS Ipswich and East Suffolk CCG
Table 16: Patients with a dementia care plan that has been reviewed in the last 12 months, GP practice exception rate, QOF, Mildenhall and Brandon INT GP practices, 2017-18
GP practice Exception rate Market Cross Surgery 17.2% Lakenheath Surgery 7.1% Forest Surgery 4.9% The Reynard Surgery 6.5% Brandon Medical Surgery 12.1%
Source: Public Health England. Public Health Profiles (2018)
Severe mental illness Severe mental illness (SMI) describes conditions such as schizophrenia, bipolar disorder and psychoses (conditions which involve losing touch with reality or experiencing delusions). People with severe mental illness experience poor outcomes in terms of physical health and mortality rates, and they have an increased likelihood of unhealthy lifestyles including alcohol or substance misuse and smoking. Generally, the lives of people with severe mental illness are 15-20 years shorter than the rest of the population42.
There were a total of 8,112 people of all ages who had a GP registered diagnosis of severe mental illness in Suffolk during 2017-1843. There were 280 diagnoses in Mildenhall and Brandon INT, which equates to 3.5% of all diagnosed cases in Suffolk.
The Mildenhall and Brandon INT locality had a significantly lower prevalence of severe mental health compared to England (0.7% compared to 0.9%, respectively). However, there was no significant difference when compared to WSCCG.
92.5% 94.6% 78.8% 77.8% 71.4% 82.0%0.0%
20.0%
40.0%
60.0%
80.0%
100.0%
Forest Surgery Brandon MedicalPractice
LakenheathSurgery
The ReynardSurgery
Market CrossSurgery
Mildenhall andBrandon INT
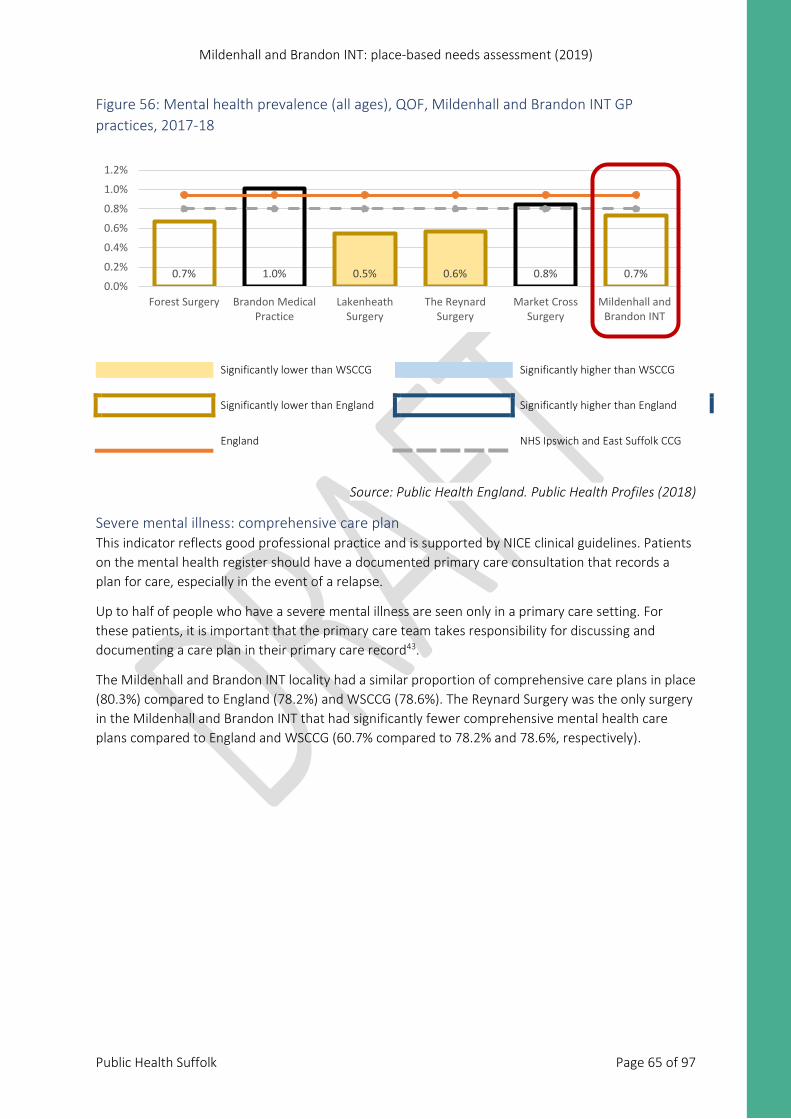
Mildenhall and Brandon INT: place-based needs assessment (2019)
Public Health Suffolk Page 65 of 97
Figure 56: Mental health prevalence (all ages), QOF, Mildenhall and Brandon INT GP practices, 2017-18
Significantly lower than WSCCG Significantly higher than WSCCG
Significantly lower than England Significantly higher than England
England NHS Ipswich and East Suffolk CCG
Source: Public Health England. Public Health Profiles (2018)
Severe mental illness: comprehensive care plan This indicator reflects good professional practice and is supported by NICE clinical guidelines. Patients on the mental health register should have a documented primary care consultation that records a plan for care, especially in the event of a relapse.
Up to half of people who have a severe mental illness are seen only in a primary care setting. For these patients, it is important that the primary care team takes responsibility for discussing and documenting a care plan in their primary care record43.
The Mildenhall and Brandon INT locality had a similar proportion of comprehensive care plans in place (80.3%) compared to England (78.2%) and WSCCG (78.6%). The Reynard Surgery was the only surgery in the Mildenhall and Brandon INT that had significantly fewer comprehensive mental health care plans compared to England and WSCCG (60.7% compared to 78.2% and 78.6%, respectively).
0.7% 1.0% 0.5% 0.6% 0.8% 0.7%0.0%
0.2%
0.4%
0.6%
0.8%
1.0%
1.2%
Forest Surgery Brandon MedicalPractice
LakenheathSurgery
The ReynardSurgery
Market CrossSurgery
Mildenhall andBrandon INT
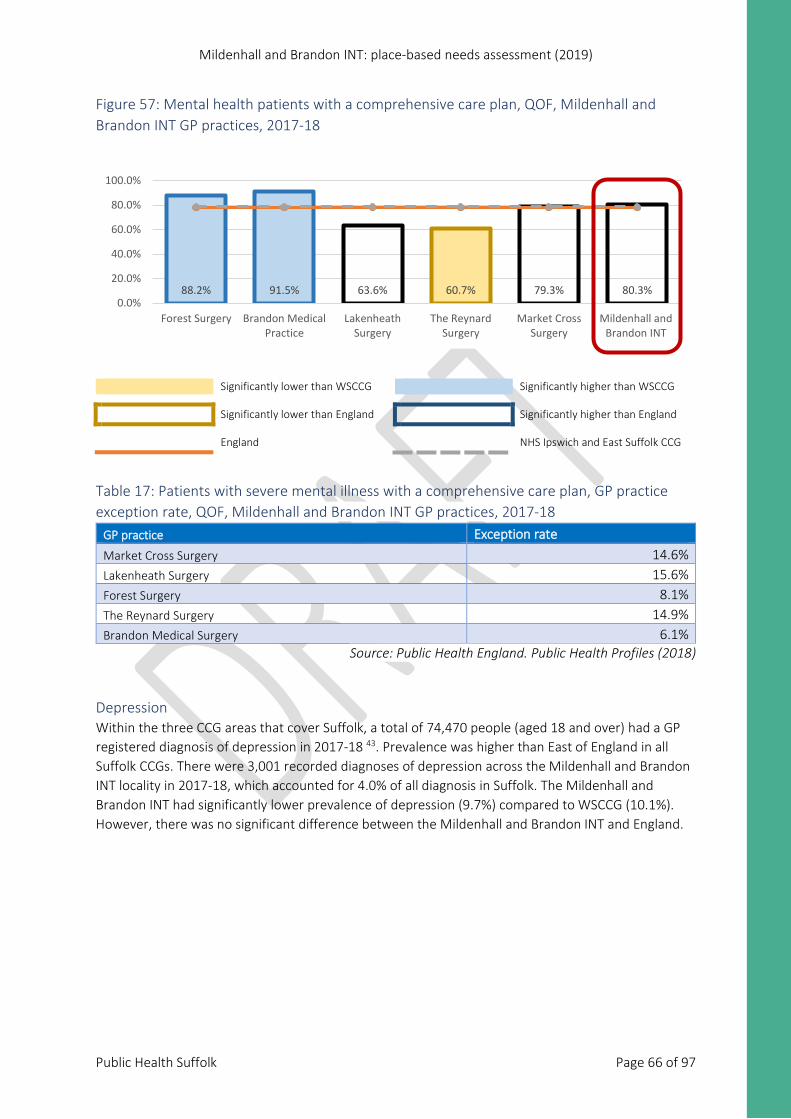
Mildenhall and Brandon INT: place-based needs assessment (2019)
Public Health Suffolk Page 66 of 97
Figure 57: Mental health patients with a comprehensive care plan, QOF, Mildenhall and Brandon INT GP practices, 2017-18
Significantly lower than WSCCG Significantly higher than WSCCG Significantly lower than England Significantly higher than England England NHS Ipswich and East Suffolk CCG
Table 17: Patients with severe mental illness with a comprehensive care plan, GP practice exception rate, QOF, Mildenhall and Brandon INT GP practices, 2017-18
GP practice Exception rate Market Cross Surgery 14.6% Lakenheath Surgery 15.6% Forest Surgery 8.1% The Reynard Surgery 14.9% Brandon Medical Surgery 6.1%
Source: Public Health England. Public Health Profiles (2018)
Depression Within the three CCG areas that cover Suffolk, a total of 74,470 people (aged 18 and over) had a GP registered diagnosis of depression in 2017-18 43. Prevalence was higher than East of England in all Suffolk CCGs. There were 3,001 recorded diagnoses of depression across the Mildenhall and Brandon INT locality in 2017-18, which accounted for 4.0% of all diagnosis in Suffolk. The Mildenhall and Brandon INT had significantly lower prevalence of depression (9.7%) compared to WSCCG (10.1%). However, there was no significant difference between the Mildenhall and Brandon INT and England.
88.2% 91.5% 63.6% 60.7% 79.3% 80.3%0.0%
20.0%
40.0%
60.0%
80.0%
100.0%
Forest Surgery Brandon MedicalPractice
LakenheathSurgery
The ReynardSurgery
Market CrossSurgery
Mildenhall andBrandon INT
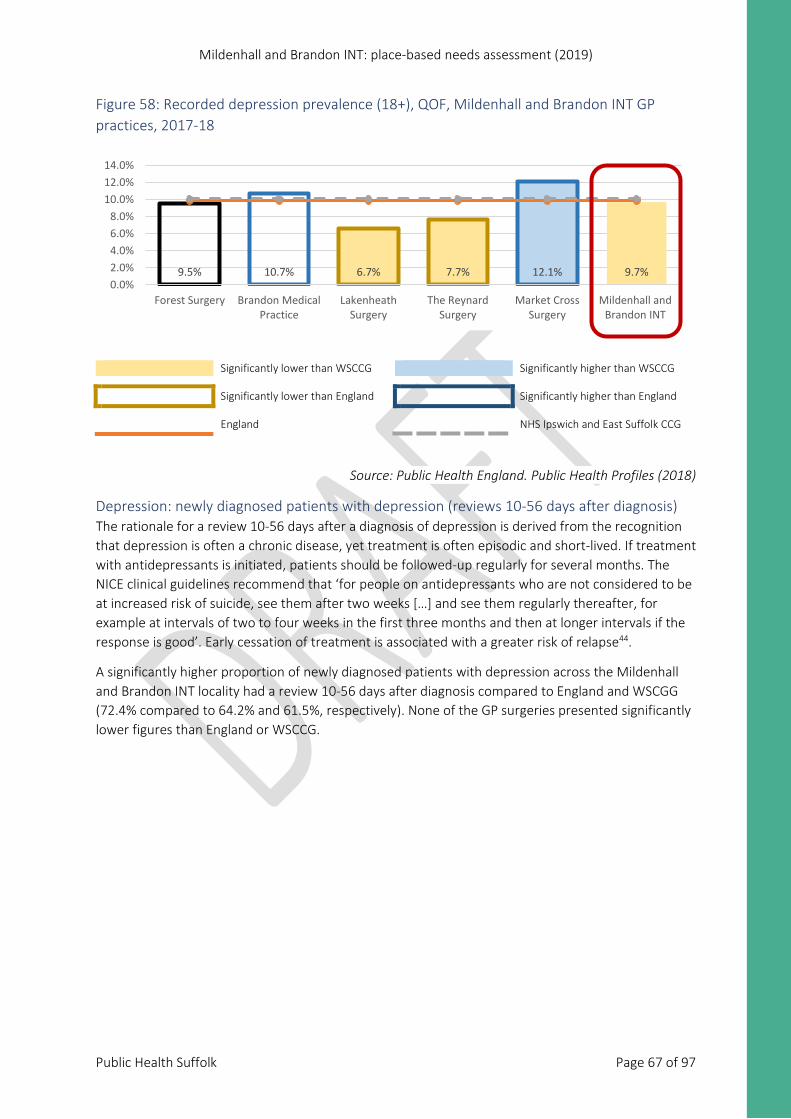
Mildenhall and Brandon INT: place-based needs assessment (2019)
Public Health Suffolk Page 67 of 97
Figure 58: Recorded depression prevalence (18+), QOF, Mildenhall and Brandon INT GP practices, 2017-18
Significantly lower than WSCCG Significantly higher than WSCCG Significantly lower than England Significantly higher than England England NHS Ipswich and East Suffolk CCG
Source: Public Health England. Public Health Profiles (2018)
Depression: newly diagnosed patients with depression (reviews 10-56 days after diagnosis) The rationale for a review 10-56 days after a diagnosis of depression is derived from the recognition that depression is often a chronic disease, yet treatment is often episodic and short-lived. If treatment with antidepressants is initiated, patients should be followed-up regularly for several months. The NICE clinical guidelines recommend that ‘for people on antidepressants who are not considered to be at increased risk of suicide, see them after two weeks […] and see them regularly thereafter, for example at intervals of two to four weeks in the first three months and then at longer intervals if the response is good’. Early cessation of treatment is associated with a greater risk of relapse44.
A significantly higher proportion of newly diagnosed patients with depression across the Mildenhall and Brandon INT locality had a review 10-56 days after diagnosis compared to England and WSCGG (72.4% compared to 64.2% and 61.5%, respectively). None of the GP surgeries presented significantly lower figures than England or WSCCG.
9.5% 10.7% 6.7% 7.7% 12.1% 9.7%0.0%2.0%4.0%6.0%8.0%
10.0%12.0%14.0%
Forest Surgery Brandon MedicalPractice
LakenheathSurgery
The ReynardSurgery
Market CrossSurgery
Mildenhall andBrandon INT
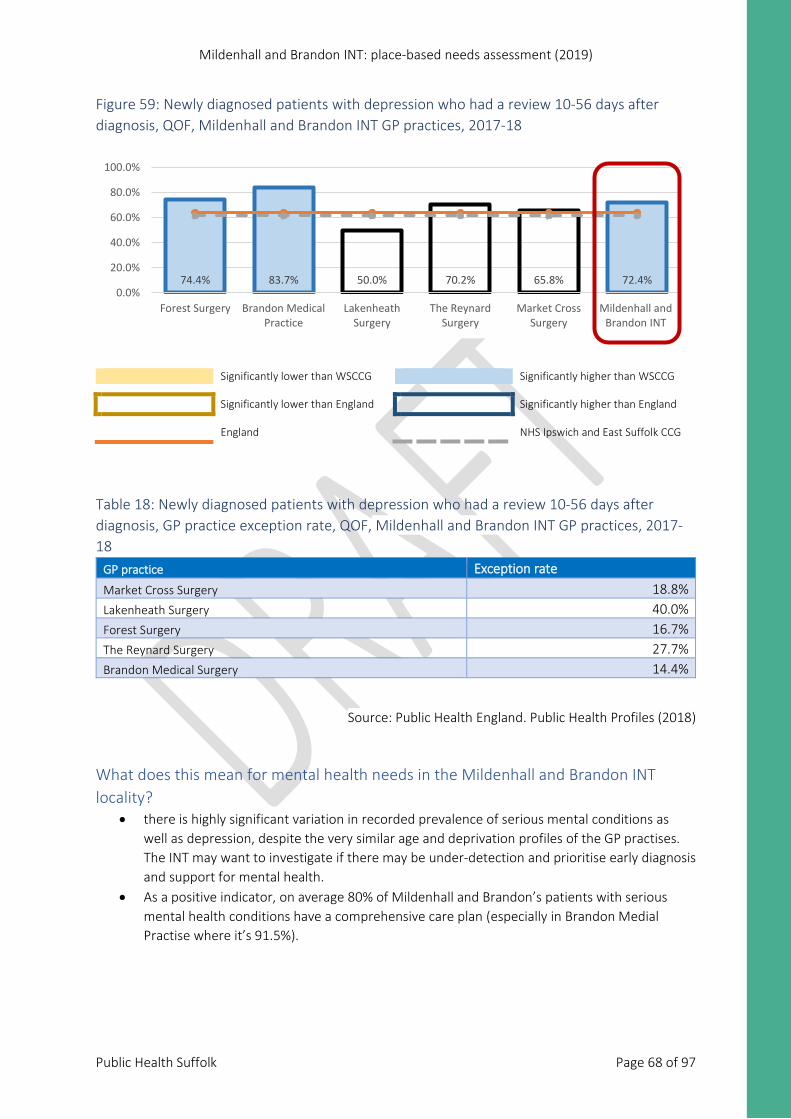
Mildenhall and Brandon INT: place-based needs assessment (2019)
Public Health Suffolk Page 68 of 97
Figure 59: Newly diagnosed patients with depression who had a review 10-56 days after diagnosis, QOF, Mildenhall and Brandon INT GP practices, 2017-18
Significantly lower than WSCCG Significantly higher than WSCCG Significantly lower than England Significantly higher than England England NHS Ipswich and East Suffolk CCG
Table 18: Newly diagnosed patients with depression who had a review 10-56 days after diagnosis, GP practice exception rate, QOF, Mildenhall and Brandon INT GP practices, 2017-18
GP practice Exception rate Market Cross Surgery 18.8% Lakenheath Surgery 40.0% Forest Surgery 16.7% The Reynard Surgery 27.7% Brandon Medical Surgery 14.4%
Source: Public Health England. Public Health Profiles (2018)
What does this mean for mental health needs in the Mildenhall and Brandon INT locality?
• there is highly significant variation in recorded prevalence of serious mental conditions as well as depression, despite the very similar age and deprivation profiles of the GP practises. The INT may want to investigate if there may be under-detection and prioritise early diagnosis and support for mental health.
• As a positive indicator, on average 80% of Mildenhall and Brandon’s patients with serious mental health conditions have a comprehensive care plan (especially in Brandon Medial Practise where it’s 91.5%).
74.4% 83.7% 50.0% 70.2% 65.8% 72.4%0.0%
20.0%
40.0%
60.0%
80.0%
100.0%
Forest Surgery Brandon MedicalPractice
LakenheathSurgery
The ReynardSurgery
Market CrossSurgery
Mildenhall andBrandon INT
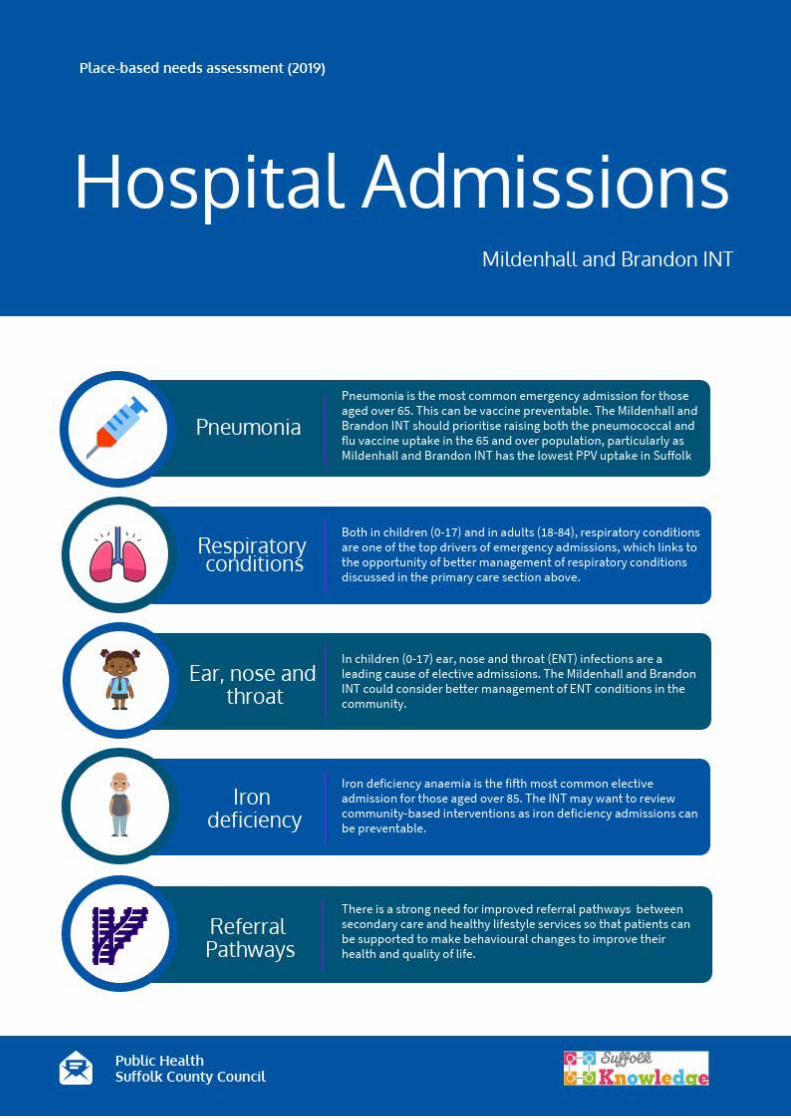
Mildenhall and Brandon INT: place-based needs assessment (2019)
Public Health Suffolk Page 69 of 97
Figure 62: Hospital admissions, Mildenhall and Brandon INT
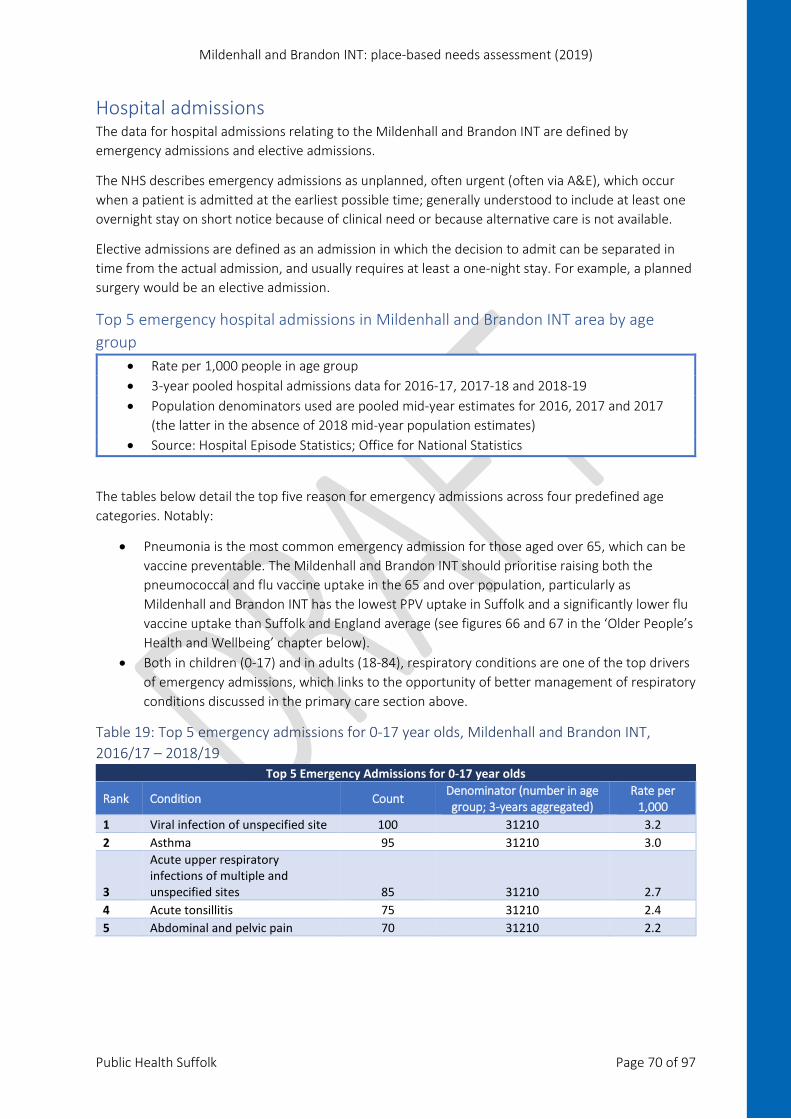
Mildenhall and Brandon INT: place-based needs assessment (2019)
Public Health Suffolk Page 70 of 97
Hospital admissions The data for hospital admissions relating to the Mildenhall and Brandon INT are defined by emergency admissions and elective admissions.
The NHS describes emergency admissions as unplanned, often urgent (often via A&E), which occur when a patient is admitted at the earliest possible time; generally understood to include at least one overnight stay on short notice because of clinical need or because alternative care is not available.
Elective admissions are defined as an admission in which the decision to admit can be separated in time from the actual admission, and usually requires at least a one-night stay. For example, a planned surgery would be an elective admission.
Top 5 emergency hospital admissions in Mildenhall and Brandon INT area by age group
• Rate per 1,000 people in age group • 3-year pooled hospital admissions data for 2016-17, 2017-18 and 2018-19 • Population denominators used are pooled mid-year estimates for 2016, 2017 and 2017
(the latter in the absence of 2018 mid-year population estimates) • Source: Hospital Episode Statistics; Office for National Statistics
The tables below detail the top five reason for emergency admissions across four predefined age categories. Notably:
• Pneumonia is the most common emergency admission for those aged over 65, which can be vaccine preventable. The Mildenhall and Brandon INT should prioritise raising both the pneumococcal and flu vaccine uptake in the 65 and over population, particularly as Mildenhall and Brandon INT has the lowest PPV uptake in Suffolk and a significantly lower flu vaccine uptake than Suffolk and England average (see figures 66 and 67 in the ‘Older People’s Health and Wellbeing’ chapter below).
• Both in children (0-17) and in adults (18-84), respiratory conditions are one of the top drivers of emergency admissions, which links to the opportunity of better management of respiratory conditions discussed in the primary care section above.
Table 19: Top 5 emergency admissions for 0-17 year olds, Mildenhall and Brandon INT, 2016/17 – 2018/19
Top 5 Emergency Admissions for 0-17 year olds
Rank Condition Count Denominator (number in age group; 3-years aggregated)
Rate per 1,000
1 Viral infection of unspecified site 100 31210 3.2 2 Asthma 95 31210 3.0
3
Acute upper respiratory infections of multiple and unspecified sites 85 31210 2.7
4 Acute tonsillitis 75 31210 2.4 5 Abdominal and pelvic pain 70 31210 2.2
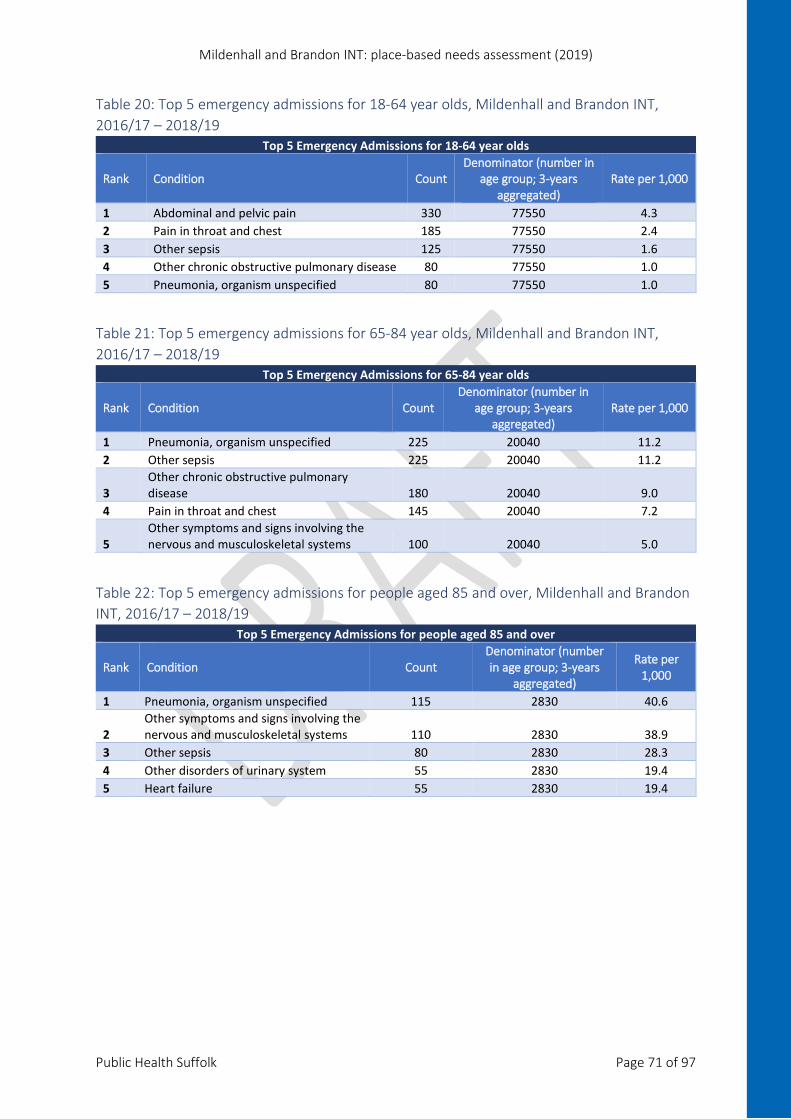
Mildenhall and Brandon INT: place-based needs assessment (2019)
Public Health Suffolk Page 71 of 97
Table 20: Top 5 emergency admissions for 18-64 year olds, Mildenhall and Brandon INT, 2016/17 – 2018/19
Top 5 Emergency Admissions for 18-64 year olds
Rank Condition Count Denominator (number in
age group; 3-years aggregated)
Rate per 1,000
1 Abdominal and pelvic pain 330 77550 4.3 2 Pain in throat and chest 185 77550 2.4 3 Other sepsis 125 77550 1.6 4 Other chronic obstructive pulmonary disease 80 77550 1.0 5 Pneumonia, organism unspecified 80 77550 1.0
Table 21: Top 5 emergency admissions for 65-84 year olds, Mildenhall and Brandon INT, 2016/17 – 2018/19
Top 5 Emergency Admissions for 65-84 year olds
Rank Condition Count Denominator (number in
age group; 3-years aggregated)
Rate per 1,000
1 Pneumonia, organism unspecified 225 20040 11.2 2 Other sepsis 225 20040 11.2
3 Other chronic obstructive pulmonary disease 180 20040 9.0
4 Pain in throat and chest 145 20040 7.2
5 Other symptoms and signs involving the nervous and musculoskeletal systems 100 20040 5.0
Table 22: Top 5 emergency admissions for people aged 85 and over, Mildenhall and Brandon INT, 2016/17 – 2018/19
Top 5 Emergency Admissions for people aged 85 and over
Rank Condition Count Denominator (number in age group; 3-years
aggregated)
Rate per 1,000
1 Pneumonia, organism unspecified 115 2830 40.6
2 Other symptoms and signs involving the nervous and musculoskeletal systems 110 2830 38.9
3 Other sepsis 80 2830 28.3 4 Other disorders of urinary system 55 2830 19.4 5 Heart failure 55 2830 19.4
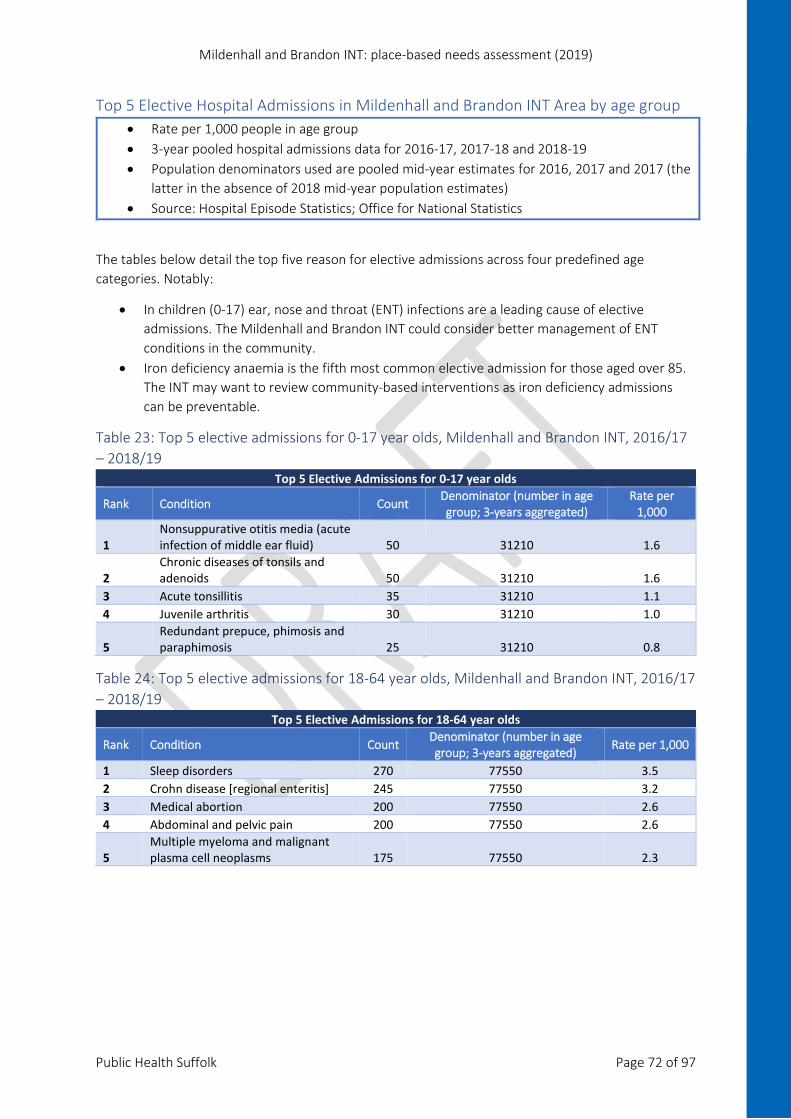
Mildenhall and Brandon INT: place-based needs assessment (2019)
Public Health Suffolk Page 72 of 97
Top 5 Elective Hospital Admissions in Mildenhall and Brandon INT Area by age group • Rate per 1,000 people in age group • 3-year pooled hospital admissions data for 2016-17, 2017-18 and 2018-19 • Population denominators used are pooled mid-year estimates for 2016, 2017 and 2017 (the
latter in the absence of 2018 mid-year population estimates) • Source: Hospital Episode Statistics; Office for National Statistics
The tables below detail the top five reason for elective admissions across four predefined age categories. Notably:
• In children (0-17) ear, nose and throat (ENT) infections are a leading cause of elective admissions. The Mildenhall and Brandon INT could consider better management of ENT conditions in the community.
• Iron deficiency anaemia is the fifth most common elective admission for those aged over 85. The INT may want to review community-based interventions as iron deficiency admissions can be preventable.
Table 23: Top 5 elective admissions for 0-17 year olds, Mildenhall and Brandon INT, 2016/17 – 2018/19
Top 5 Elective Admissions for 0-17 year olds
Rank Condition Count Denominator (number in age group; 3-years aggregated)
Rate per 1,000
1 Nonsuppurative otitis media (acute infection of middle ear fluid) 50 31210 1.6
2 Chronic diseases of tonsils and adenoids 50 31210 1.6
3 Acute tonsillitis 35 31210 1.1 4 Juvenile arthritis 30 31210 1.0
5 Redundant prepuce, phimosis and paraphimosis 25 31210 0.8
Table 24: Top 5 elective admissions for 18-64 year olds, Mildenhall and Brandon INT, 2016/17 – 2018/19
Top 5 Elective Admissions for 18-64 year olds
Rank Condition Count Denominator (number in age group; 3-years aggregated) Rate per 1,000
1 Sleep disorders 270 77550 3.5 2 Crohn disease [regional enteritis] 245 77550 3.2 3 Medical abortion 200 77550 2.6 4 Abdominal and pelvic pain 200 77550 2.6
5 Multiple myeloma and malignant plasma cell neoplasms 175 77550 2.3
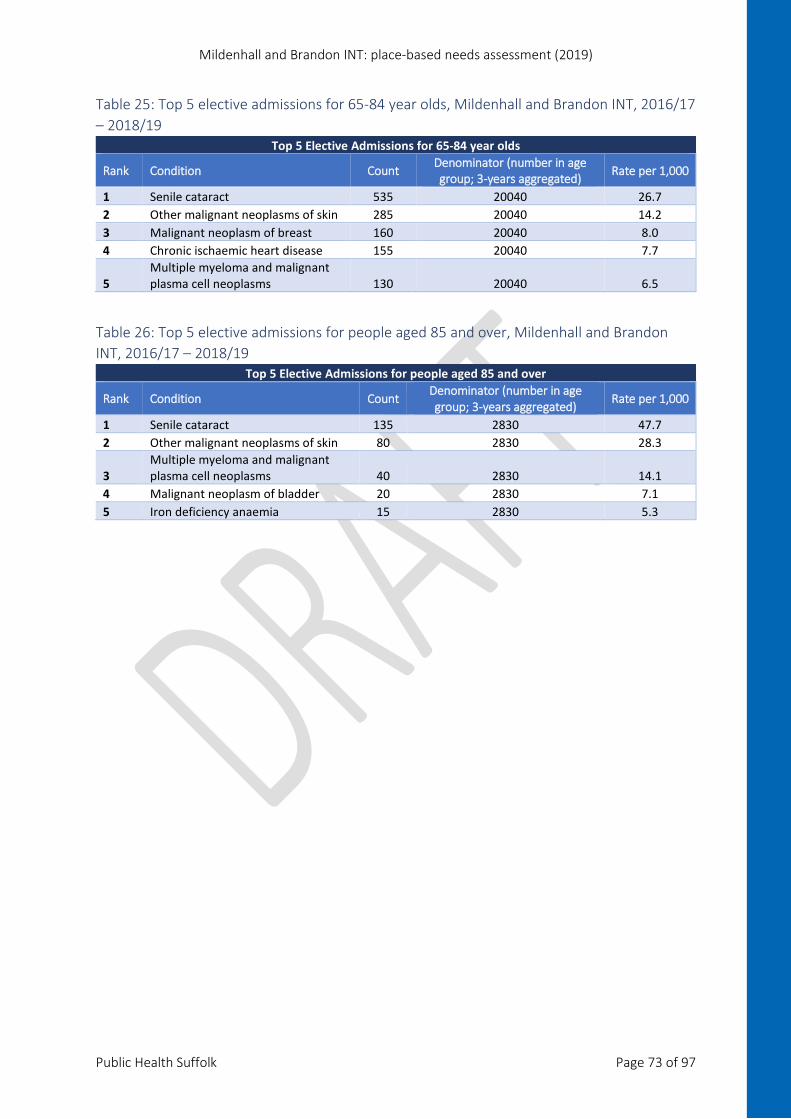
Mildenhall and Brandon INT: place-based needs assessment (2019)
Public Health Suffolk Page 73 of 97
Table 25: Top 5 elective admissions for 65-84 year olds, Mildenhall and Brandon INT, 2016/17 – 2018/19
Top 5 Elective Admissions for 65-84 year olds
Rank Condition Count Denominator (number in age group; 3-years aggregated) Rate per 1,000
1 Senile cataract 535 20040 26.7 2 Other malignant neoplasms of skin 285 20040 14.2 3 Malignant neoplasm of breast 160 20040 8.0 4 Chronic ischaemic heart disease 155 20040 7.7
5 Multiple myeloma and malignant plasma cell neoplasms 130 20040 6.5
Table 26: Top 5 elective admissions for people aged 85 and over, Mildenhall and Brandon INT, 2016/17 – 2018/19
Top 5 Elective Admissions for people aged 85 and over
Rank Condition Count Denominator (number in age group; 3-years aggregated) Rate per 1,000
1 Senile cataract 135 2830 47.7 2 Other malignant neoplasms of skin 80 2830 28.3
3 Multiple myeloma and malignant plasma cell neoplasms 40 2830 14.1
4 Malignant neoplasm of bladder 20 2830 7.1 5 Iron deficiency anaemia 15 2830 5.3
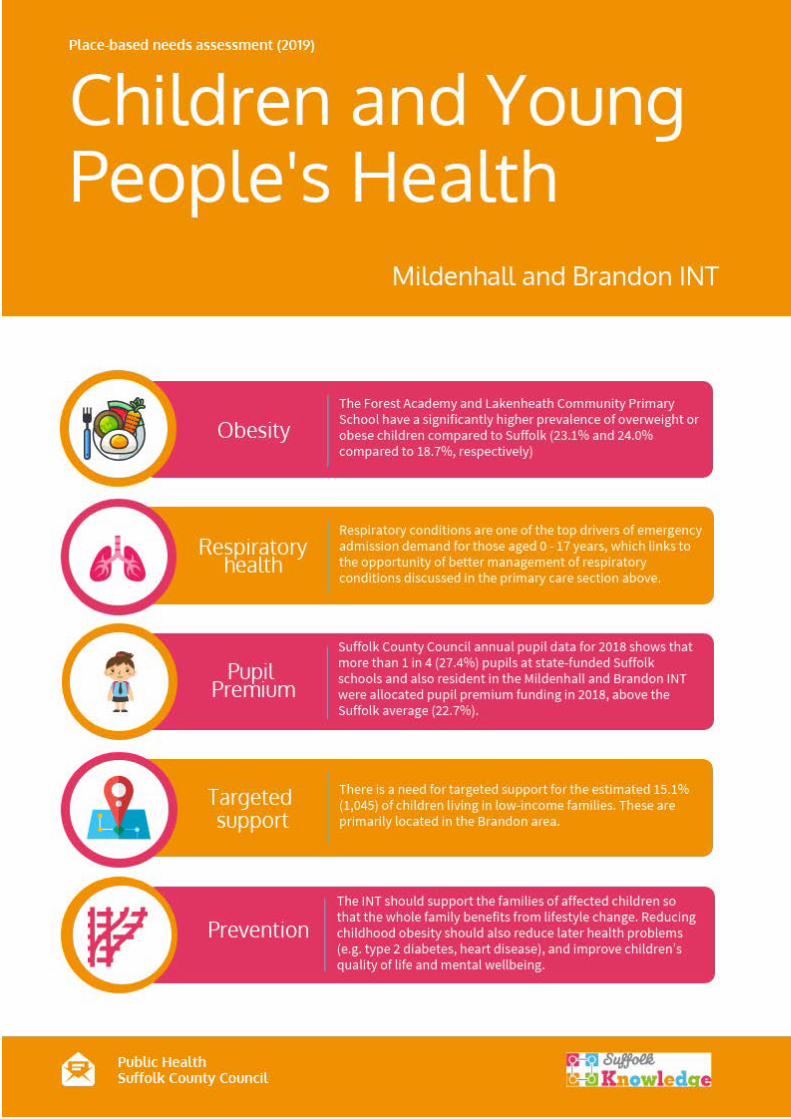
Mildenhall and Brandon INT: place-based needs assessment (2019)
Public Health Suffolk Page 74 of 97
Figure 63: Children and young people’s health, Mildenhall and Brandon INT
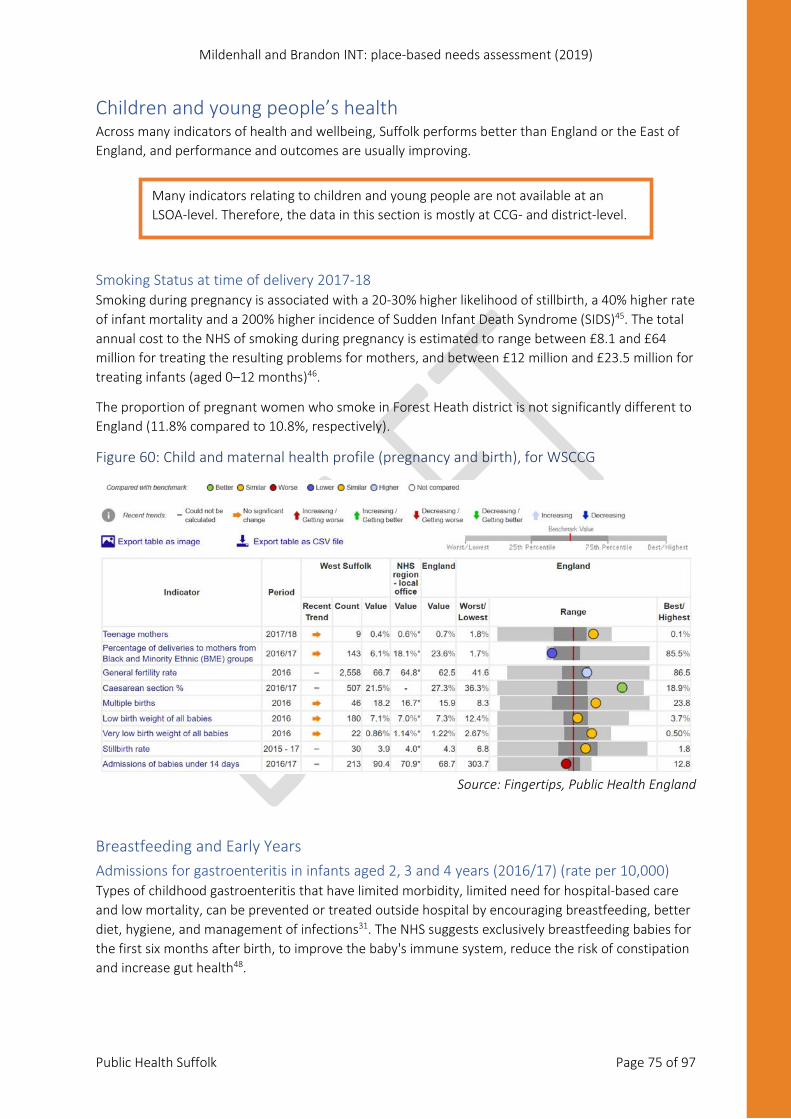
Mildenhall and Brandon INT: place-based needs assessment (2019)
Public Health Suffolk Page 75 of 97
Children and young people’s health Across many indicators of health and wellbeing, Suffolk performs better than England or the East of England, and performance and outcomes are usually improving.
Smoking Status at time of delivery 2017-18 Smoking during pregnancy is associated with a 20-30% higher likelihood of stillbirth, a 40% higher rate of infant mortality and a 200% higher incidence of Sudden Infant Death Syndrome (SIDS)45. The total annual cost to the NHS of smoking during pregnancy is estimated to range between £8.1 and £64 million for treating the resulting problems for mothers, and between £12 million and £23.5 million for treating infants (aged 0–12 months)46.
The proportion of pregnant women who smoke in Forest Heath district is not significantly different to England (11.8% compared to 10.8%, respectively).
Figure 60: Child and maternal health profile (pregnancy and birth), for WSCCG
Source: Fingertips, Public Health England
Breastfeeding and Early Years Admissions for gastroenteritis in infants aged 2, 3 and 4 years (2016/17) (rate per 10,000) Types of childhood gastroenteritis that have limited morbidity, limited need for hospital-based care and low mortality, can be prevented or treated outside hospital by encouraging breastfeeding, better diet, hygiene, and management of infections31. The NHS suggests exclusively breastfeeding babies for the first six months after birth, to improve the baby's immune system, reduce the risk of constipation and increase gut health48.
Many indicators relating to children and young people are not available at an LSOA-level. Therefore, the data in this section is mostly at CCG- and district-level.
Mildenhall and Brandon INT: place-based needs assessment (2019)
Public Health Suffolk Page 76 of 97
• WSCCG has a significantly higher admission rate for gastroenteritis per 10,000 compared to England (91.0 compared to 54.3 per 10,000 children aged 2-4).
Admissions for respiratory tract infections in infants aged under 1 year (2016/17) (rate per 10,000) Types of childhood respiratory tract infections that have limited morbidity or need for hospital-based care and low mortality, can be prevented or treated outside hospital by encouraging breastfeeding, better diet, hygiene, and management of infections31.
• Although fewer infants aged under 1 year are admitted for respiratory tract infections compared to gastroenteritis, WSCCG has a significantly higher admission rate per 10,000 compared to England (859 compared to 698 per 10,000, respectively). It is important to note that WSCCG is not significantly different to England regarding admissions for respiratory tract infections in infants aged 2, 3, and 4 years.
• This reflects the top five emergency admissions for the 0-17 age group for the Mildenhall and Brandon INT locality, where 3 out of 5 of the top five reasons for emergency admissions are respiratory-specific.
Admissions of babies under 14 days (2016/17) High levels of admissions of either mothers or babies soon after birth can suggest problems with the timing or quality of health assessments before the initial transfer or with postnatal care once the mother is home. Dehydration and jaundice are two common reasons for re-admission of babies and are often linked to problems with feeding 31.
• WSCCG has a significantly higher admission rate per 1,000 compared to England (90.4 compared to 68.7). A review of educational material for mothers (specifically first-time mothers) may help to reduce admission rates for babies under 14 days.
Emergency admissions for children aged 0 – 4 (2016/17) (rate per 1,000) Approximately 35% of all admissions in the NHS in England are classified as emergency admissions, costing approximately £11 billion a year. Admitting a patient to hospital as an emergency case is costly and frequently preventable, yet the number of emergency admissions to hospital has been rising for some time31.
• WSCCG has a significantly higher rate of emergency admissions per 1,000 children aged 0 – 4 compared to England (192.4 per 1,000 compared to 162.6, respectively).
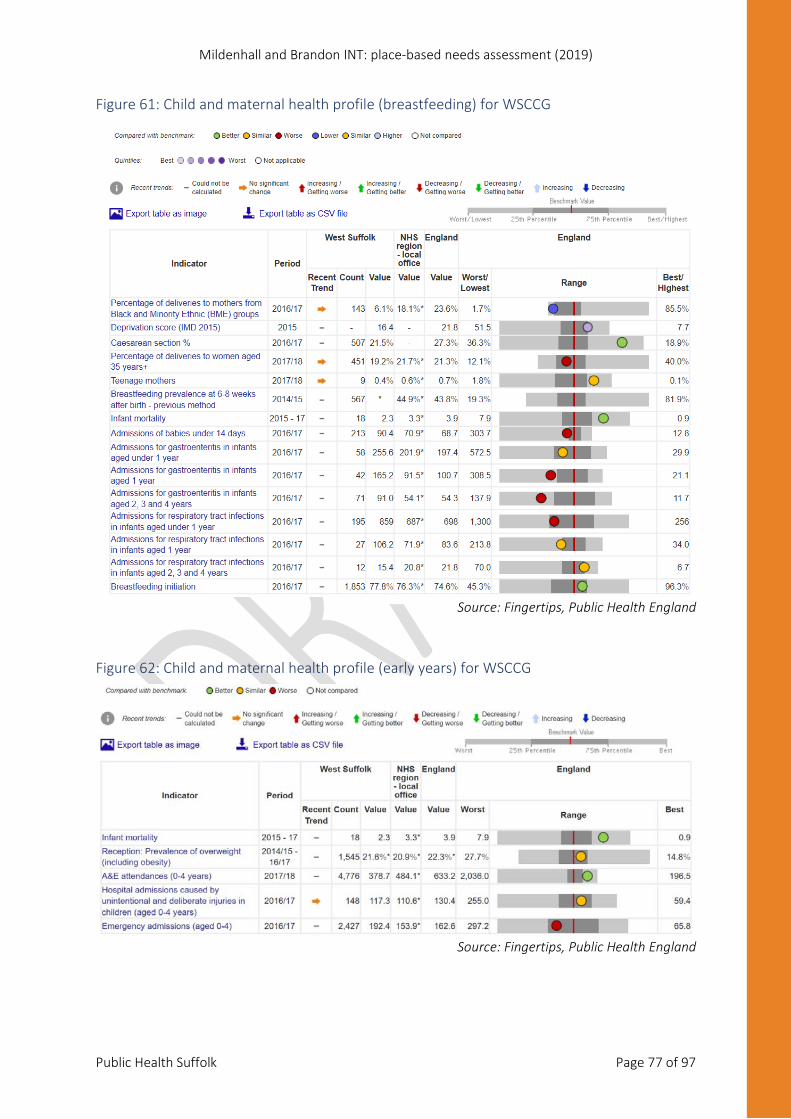
Mildenhall and Brandon INT: place-based needs assessment (2019)
Public Health Suffolk Page 77 of 97
Figure 61: Child and maternal health profile (breastfeeding) for WSCCG
Source: Fingertips, Public Health England
Figure 62: Child and maternal health profile (early years) for WSCCG
Source: Fingertips, Public Health England
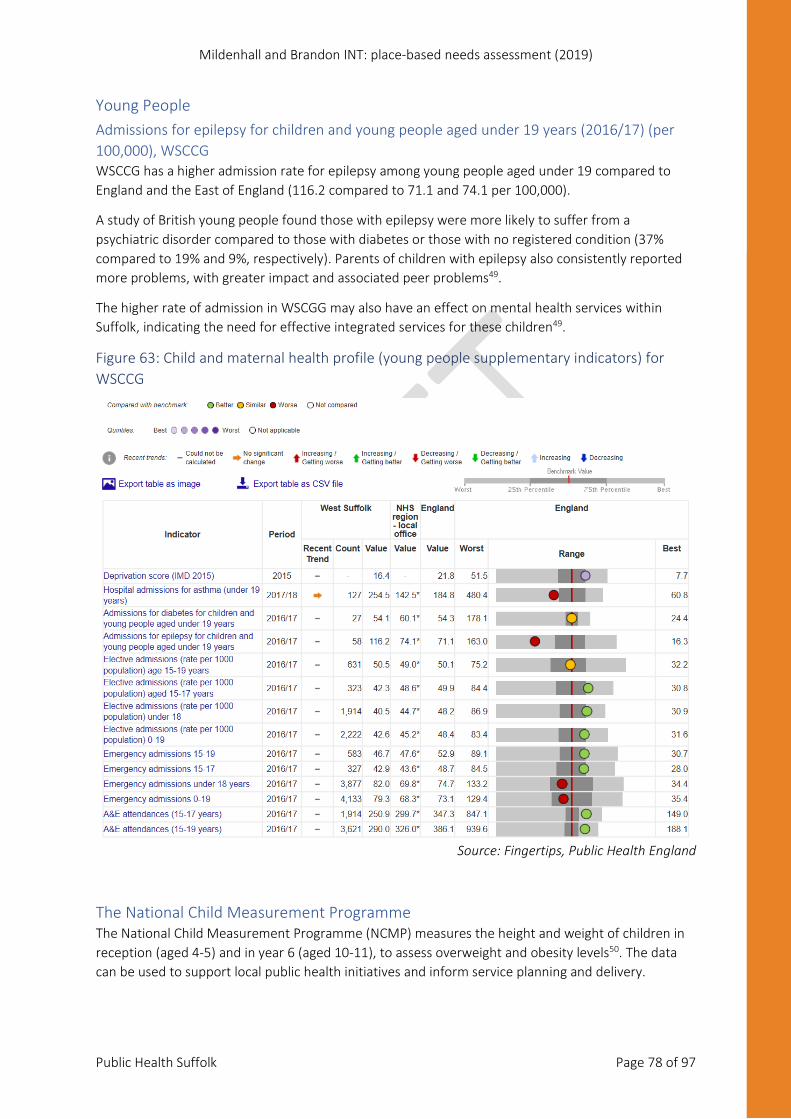
Mildenhall and Brandon INT: place-based needs assessment (2019)
Public Health Suffolk Page 78 of 97
Young People Admissions for epilepsy for children and young people aged under 19 years (2016/17) (per 100,000), WSCCG WSCCG has a higher admission rate for epilepsy among young people aged under 19 compared to England and the East of England (116.2 compared to 71.1 and 74.1 per 100,000).
A study of British young people found those with epilepsy were more likely to suffer from a psychiatric disorder compared to those with diabetes or those with no registered condition (37% compared to 19% and 9%, respectively). Parents of children with epilepsy also consistently reported more problems, with greater impact and associated peer problems49.
The higher rate of admission in WSCGG may also have an effect on mental health services within Suffolk, indicating the need for effective integrated services for these children49.
Figure 63: Child and maternal health profile (young people supplementary indicators) for WSCCG
Source: Fingertips, Public Health England
The National Child Measurement Programme The National Child Measurement Programme (NCMP) measures the height and weight of children in reception (aged 4-5) and in year 6 (aged 10-11), to assess overweight and obesity levels50. The data can be used to support local public health initiatives and inform service planning and delivery.
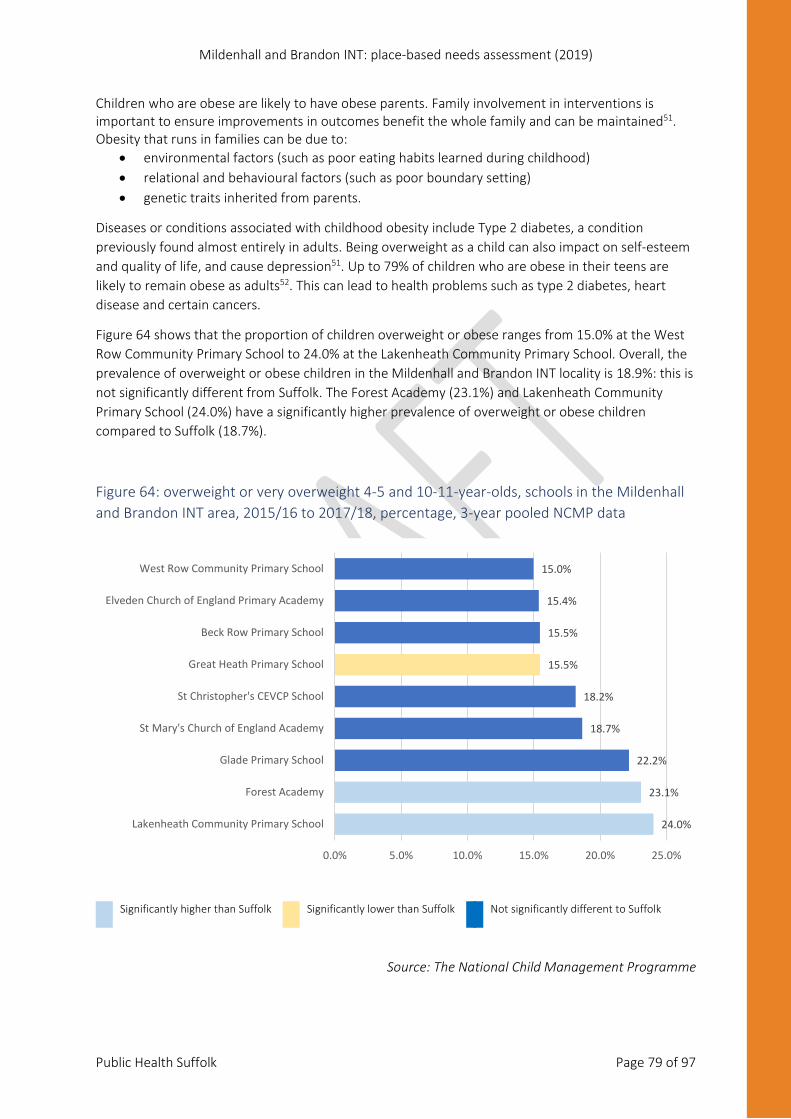
Mildenhall and Brandon INT: place-based needs assessment (2019)
Public Health Suffolk Page 79 of 97
Children who are obese are likely to have obese parents. Family involvement in interventions is important to ensure improvements in outcomes benefit the whole family and can be maintained51. Obesity that runs in families can be due to:
• environmental factors (such as poor eating habits learned during childhood) • relational and behavioural factors (such as poor boundary setting) • genetic traits inherited from parents.
Diseases or conditions associated with childhood obesity include Type 2 diabetes, a condition previously found almost entirely in adults. Being overweight as a child can also impact on self-esteem and quality of life, and cause depression51. Up to 79% of children who are obese in their teens are likely to remain obese as adults52. This can lead to health problems such as type 2 diabetes, heart disease and certain cancers.
Figure 64 shows that the proportion of children overweight or obese ranges from 15.0% at the West Row Community Primary School to 24.0% at the Lakenheath Community Primary School. Overall, the prevalence of overweight or obese children in the Mildenhall and Brandon INT locality is 18.9%: this is not significantly different from Suffolk. The Forest Academy (23.1%) and Lakenheath Community Primary School (24.0%) have a significantly higher prevalence of overweight or obese children compared to Suffolk (18.7%).
Figure 64: overweight or very overweight 4-5 and 10-11-year-olds, schools in the Mildenhall and Brandon INT area, 2015/16 to 2017/18, percentage, 3-year pooled NCMP data
Significantly higher than Suffolk Significantly lower than Suffolk Not significantly different to Suffolk
Source: The National Child Management Programme
24.0%
23.1%
22.2%
18.7%
18.2%
15.5%
15.5%
15.4%
15.0%
0.0% 5.0% 10.0% 15.0% 20.0% 25.0%
Lakenheath Community Primary School
Forest Academy
Glade Primary School
St Mary's Church of England Academy
St Christopher's CEVCP School
Great Heath Primary School
Beck Row Primary School
Elveden Church of England Primary Academy
West Row Community Primary School
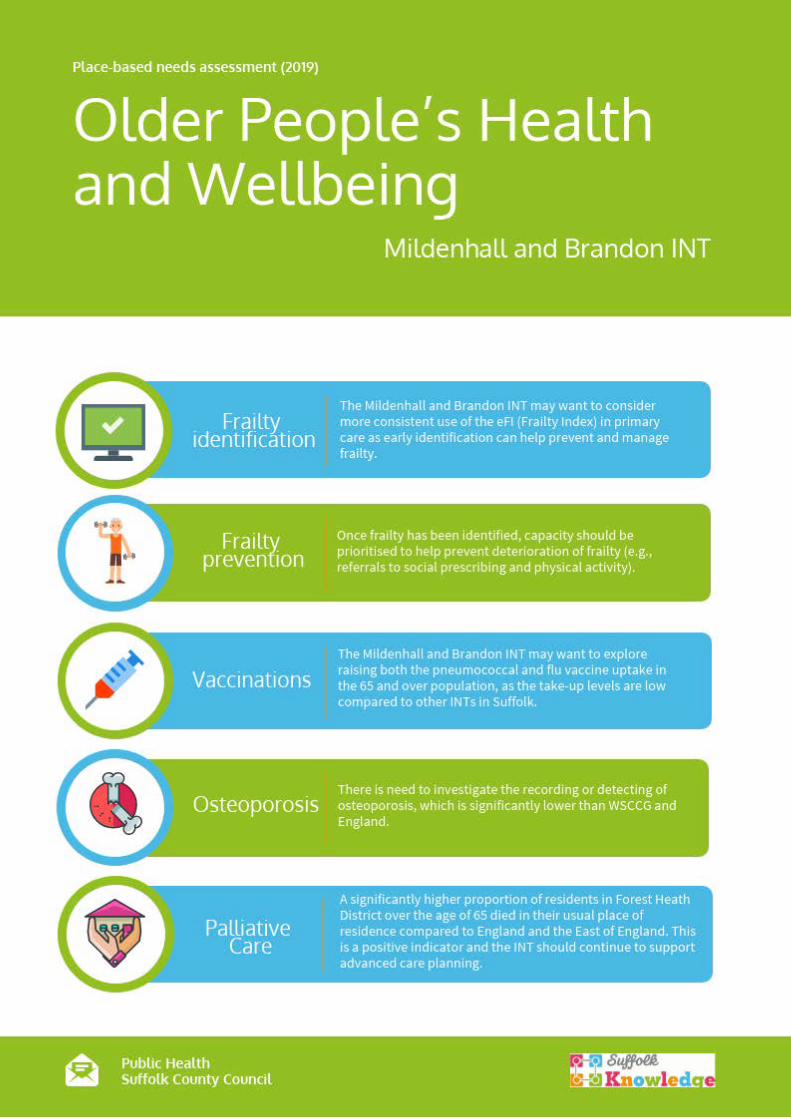
Mildenhall and Brandon INT: place-based needs assessment (2019)
Public Health Suffolk Page 80 of 97
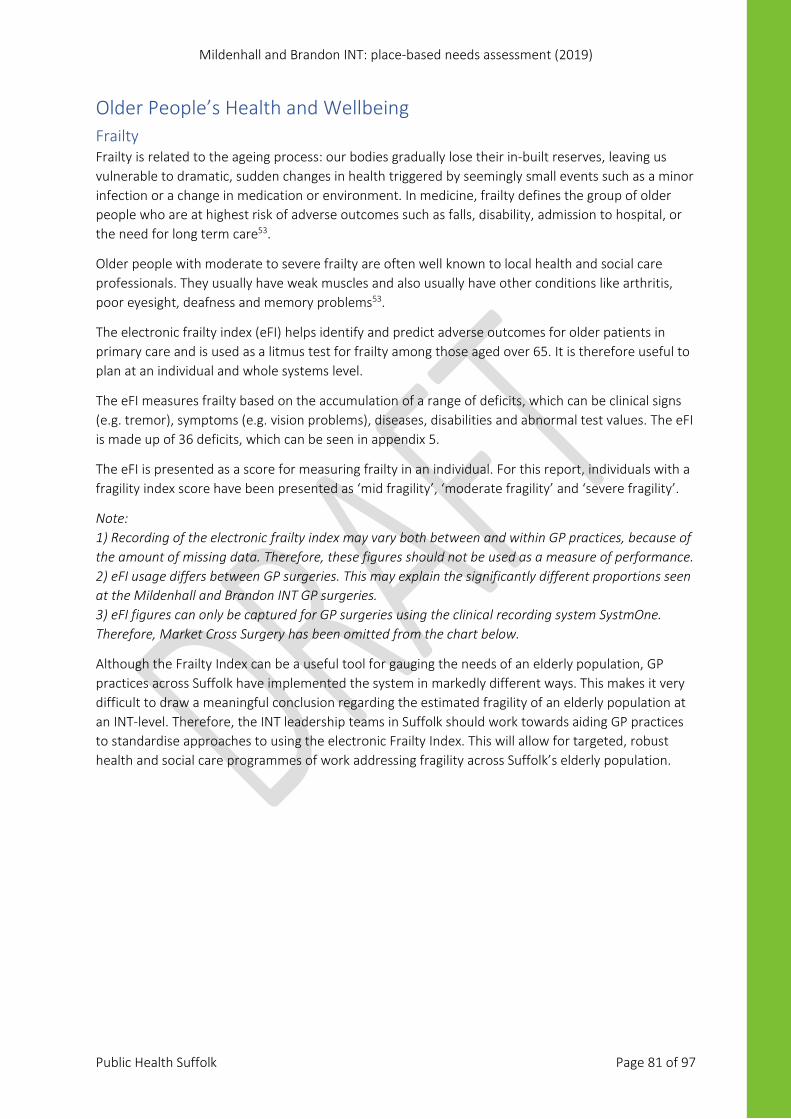
Mildenhall and Brandon INT: place-based needs assessment (2019)
Public Health Suffolk Page 81 of 97
Older People’s Health and Wellbeing Frailty Frailty is related to the ageing process: our bodies gradually lose their in-built reserves, leaving us vulnerable to dramatic, sudden changes in health triggered by seemingly small events such as a minor infection or a change in medication or environment. In medicine, frailty defines the group of older people who are at highest risk of adverse outcomes such as falls, disability, admission to hospital, or the need for long term care53.
Older people with moderate to severe frailty are often well known to local health and social care professionals. They usually have weak muscles and also usually have other conditions like arthritis, poor eyesight, deafness and memory problems53.
The electronic frailty index (eFI) helps identify and predict adverse outcomes for older patients in primary care and is used as a litmus test for frailty among those aged over 65. It is therefore useful to plan at an individual and whole systems level.
The eFI measures frailty based on the accumulation of a range of deficits, which can be clinical signs (e.g. tremor), symptoms (e.g. vision problems), diseases, disabilities and abnormal test values. The eFI is made up of 36 deficits, which can be seen in appendix 5.
The eFI is presented as a score for measuring frailty in an individual. For this report, individuals with a fragility index score have been presented as ‘mid fragility’, ‘moderate fragility’ and ‘severe fragility’.
Note: 1) Recording of the electronic frailty index may vary both between and within GP practices, because of the amount of missing data. Therefore, these figures should not be used as a measure of performance. 2) eFI usage differs between GP surgeries. This may explain the significantly different proportions seen at the Mildenhall and Brandon INT GP surgeries. 3) eFI figures can only be captured for GP surgeries using the clinical recording system SystmOne. Therefore, Market Cross Surgery has been omitted from the chart below.
Although the Frailty Index can be a useful tool for gauging the needs of an elderly population, GP practices across Suffolk have implemented the system in markedly different ways. This makes it very difficult to draw a meaningful conclusion regarding the estimated fragility of an elderly population at an INT-level. Therefore, the INT leadership teams in Suffolk should work towards aiding GP practices to standardise approaches to using the electronic Frailty Index. This will allow for targeted, robust health and social care programmes of work addressing fragility across Suffolk’s elderly population.
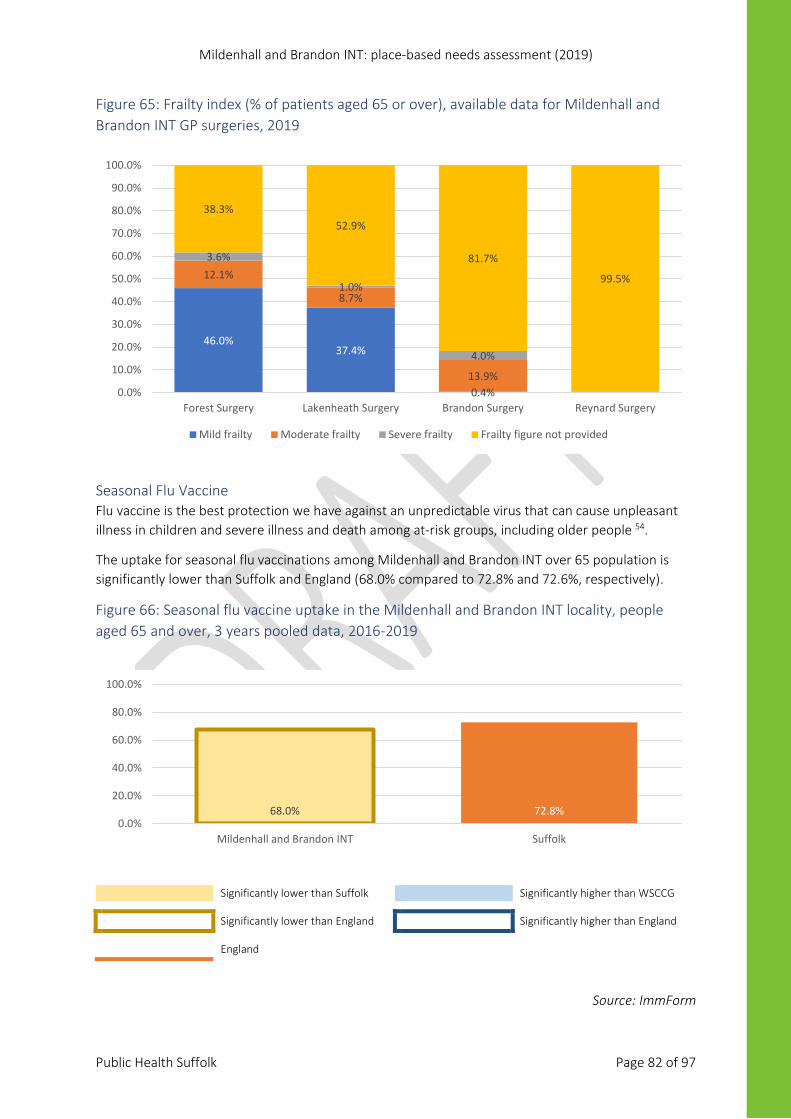
Mildenhall and Brandon INT: place-based needs assessment (2019)
Public Health Suffolk Page 82 of 97
Figure 65: Frailty index (% of patients aged 65 or over), available data for Mildenhall and Brandon INT GP surgeries, 2019
Seasonal Flu Vaccine Flu vaccine is the best protection we have against an unpredictable virus that can cause unpleasant illness in children and severe illness and death among at-risk groups, including older people 54.
The uptake for seasonal flu vaccinations among Mildenhall and Brandon INT over 65 population is significantly lower than Suffolk and England (68.0% compared to 72.8% and 72.6%, respectively).
Figure 66: Seasonal flu vaccine uptake in the Mildenhall and Brandon INT locality, people aged 65 and over, 3 years pooled data, 2016-2019
Significantly lower than Suffolk Significantly higher than WSCCG Significantly lower than England Significantly higher than England England
Source: ImmForm
46.0%37.4%
0.4%
12.1%
8.7%
13.9%
3.6%
1.0%
4.0%
38.3%52.9%
81.7%
99.5%
0.0%
10.0%
20.0%
30.0%
40.0%
50.0%
60.0%
70.0%
80.0%
90.0%
100.0%
Forest Surgery Lakenheath Surgery Brandon Surgery Reynard Surgery
Mild frailty Moderate frailty Severe frailty Frailty figure not provided
68.0% 72.8%0.0%
20.0%
40.0%
60.0%
80.0%
100.0%
Mildenhall and Brandon INT Suffolk
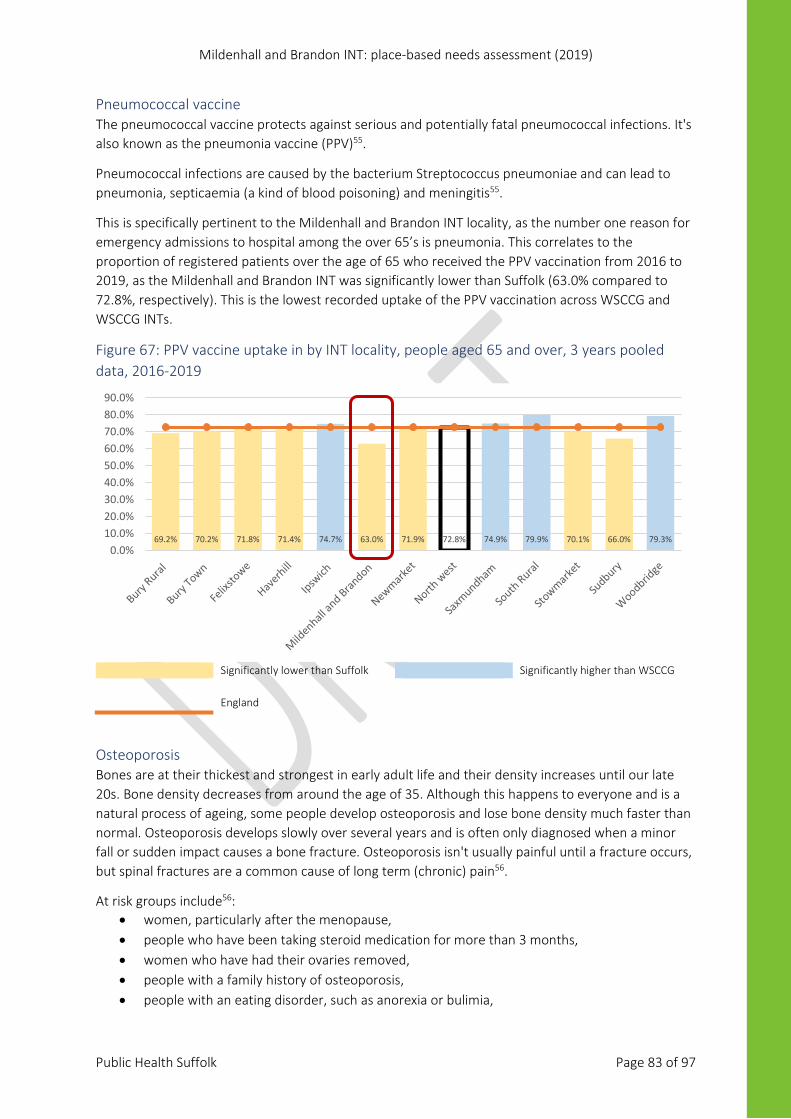
Mildenhall and Brandon INT: place-based needs assessment (2019)
Public Health Suffolk Page 83 of 97
Pneumococcal vaccine The pneumococcal vaccine protects against serious and potentially fatal pneumococcal infections. It's also known as the pneumonia vaccine (PPV)55.
Pneumococcal infections are caused by the bacterium Streptococcus pneumoniae and can lead to pneumonia, septicaemia (a kind of blood poisoning) and meningitis55.
This is specifically pertinent to the Mildenhall and Brandon INT locality, as the number one reason for emergency admissions to hospital among the over 65’s is pneumonia. This correlates to the proportion of registered patients over the age of 65 who received the PPV vaccination from 2016 to 2019, as the Mildenhall and Brandon INT was significantly lower than Suffolk (63.0% compared to 72.8%, respectively). This is the lowest recorded uptake of the PPV vaccination across WSCCG and WSCCG INTs.
Figure 67: PPV vaccine uptake in by INT locality, people aged 65 and over, 3 years pooled data, 2016-2019
Significantly lower than Suffolk Significantly higher than WSCCG England
Osteoporosis Bones are at their thickest and strongest in early adult life and their density increases until our late 20s. Bone density decreases from around the age of 35. Although this happens to everyone and is a natural process of ageing, some people develop osteoporosis and lose bone density much faster than normal. Osteoporosis develops slowly over several years and is often only diagnosed when a minor fall or sudden impact causes a bone fracture. Osteoporosis isn't usually painful until a fracture occurs, but spinal fractures are a common cause of long term (chronic) pain56.
At risk groups include56: • women, particularly after the menopause, • people who have been taking steroid medication for more than 3 months, • women who have had their ovaries removed, • people with a family history of osteoporosis, • people with an eating disorder, such as anorexia or bulimia,
69.2% 70.2% 71.8% 71.4% 74.7% 63.0% 71.9% 72.8% 74.9% 79.9% 70.1% 66.0% 79.3%0.0%
10.0%20.0%30.0%40.0%50.0%60.0%70.0%80.0%90.0%
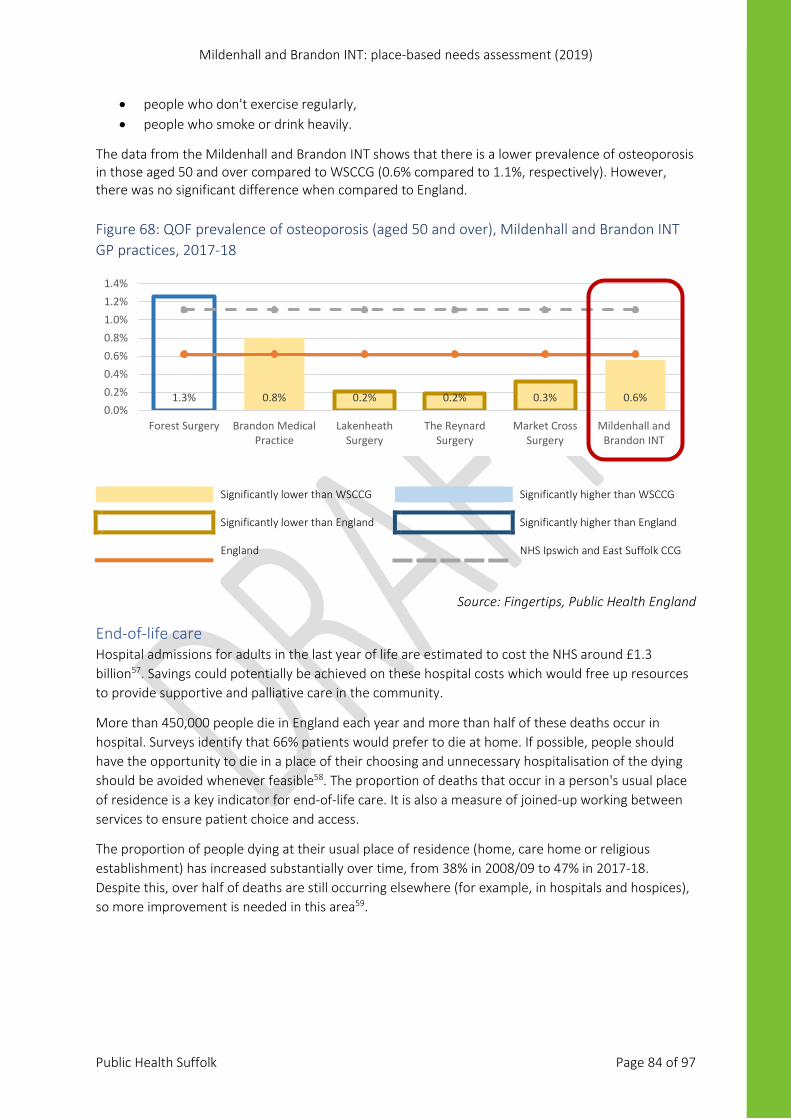
Mildenhall and Brandon INT: place-based needs assessment (2019)
Public Health Suffolk Page 84 of 97
• people who don't exercise regularly, • people who smoke or drink heavily.
The data from the Mildenhall and Brandon INT shows that there is a lower prevalence of osteoporosis in those aged 50 and over compared to WSCCG (0.6% compared to 1.1%, respectively). However, there was no significant difference when compared to England. Figure 68: QOF prevalence of osteoporosis (aged 50 and over), Mildenhall and Brandon INT GP practices, 2017-18
Significantly lower than WSCCG Significantly higher than WSCCG Significantly lower than England Significantly higher than England England NHS Ipswich and East Suffolk CCG
Source: Fingertips, Public Health England
End-of-life care Hospital admissions for adults in the last year of life are estimated to cost the NHS around £1.3 billion57. Savings could potentially be achieved on these hospital costs which would free up resources to provide supportive and palliative care in the community.
More than 450,000 people die in England each year and more than half of these deaths occur in hospital. Surveys identify that 66% patients would prefer to die at home. If possible, people should have the opportunity to die in a place of their choosing and unnecessary hospitalisation of the dying should be avoided whenever feasible58. The proportion of deaths that occur in a person's usual place of residence is a key indicator for end-of-life care. It is also a measure of joined-up working between services to ensure patient choice and access.
The proportion of people dying at their usual place of residence (home, care home or religious establishment) has increased substantially over time, from 38% in 2008/09 to 47% in 2017-18. Despite this, over half of deaths are still occurring elsewhere (for example, in hospitals and hospices), so more improvement is needed in this area59.
1.3% 0.8% 0.2% 0.2% 0.3% 0.6%0.0%0.2%0.4%0.6%0.8%1.0%1.2%1.4%
Forest Surgery Brandon MedicalPractice
LakenheathSurgery
The ReynardSurgery
Market CrossSurgery
Mildenhall andBrandon INT
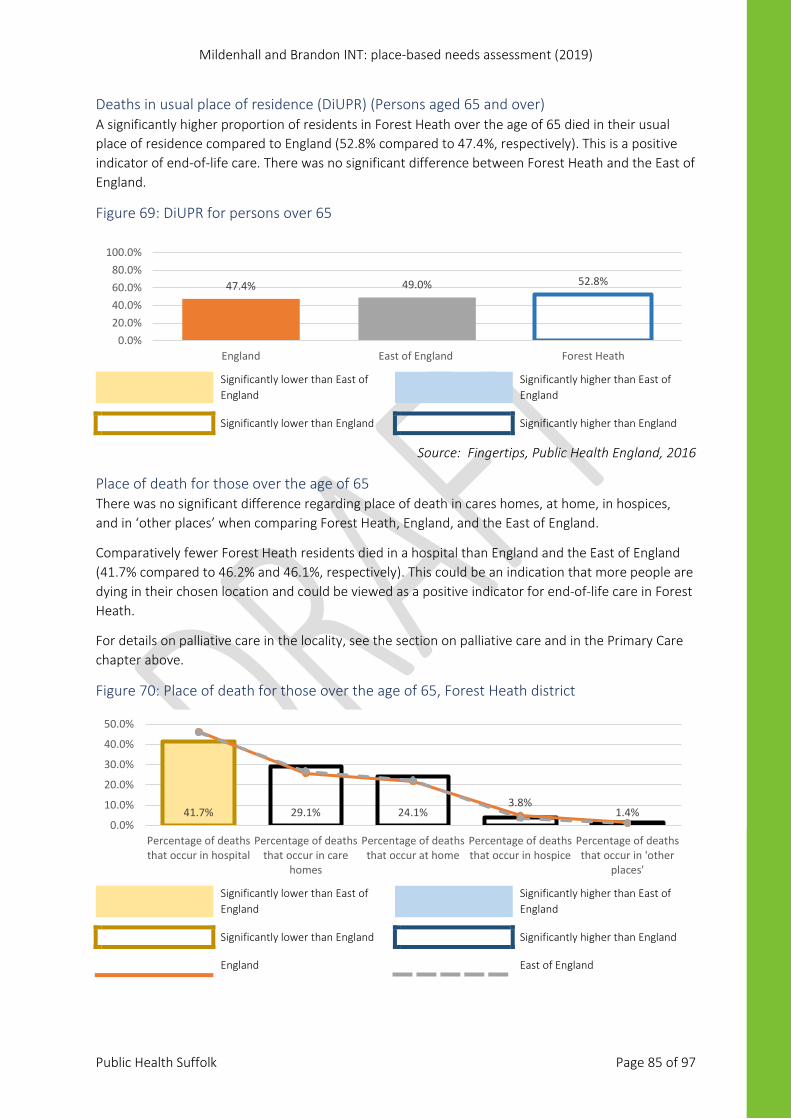
Mildenhall and Brandon INT: place-based needs assessment (2019)
Public Health Suffolk Page 85 of 97
Deaths in usual place of residence (DiUPR) (Persons aged 65 and over) A significantly higher proportion of residents in Forest Heath over the age of 65 died in their usual place of residence compared to England (52.8% compared to 47.4%, respectively). This is a positive indicator of end-of-life care. There was no significant difference between Forest Heath and the East of England.
Figure 69: DiUPR for persons over 65
Significantly lower than East of England
Significantly higher than East of England
Significantly lower than England Significantly higher than England
Source: Fingertips, Public Health England, 2016
Place of death for those over the age of 65 There was no significant difference regarding place of death in cares homes, at home, in hospices, and in ‘other places’ when comparing Forest Heath, England, and the East of England.
Comparatively fewer Forest Heath residents died in a hospital than England and the East of England (41.7% compared to 46.2% and 46.1%, respectively). This could be an indication that more people are dying in their chosen location and could be viewed as a positive indicator for end-of-life care in Forest Heath.
For details on palliative care in the locality, see the section on palliative care and in the Primary Care chapter above.
Figure 70: Place of death for those over the age of 65, Forest Heath district
Significantly lower than East of England
Significantly higher than East of England
Significantly lower than England Significantly higher than England England East of England
47.4% 49.0% 52.8%
0.0%20.0%40.0%60.0%80.0%
100.0%
England East of England Forest Heath
41.7% 29.1% 24.1%3.8%
1.4%0.0%
10.0%
20.0%
30.0%
40.0%
50.0%
Percentage of deathsthat occur in hospital
Percentage of deathsthat occur in care
homes
Percentage of deathsthat occur at home
Percentage of deathsthat occur in hospice
Percentage of deathsthat occur in 'other
places'
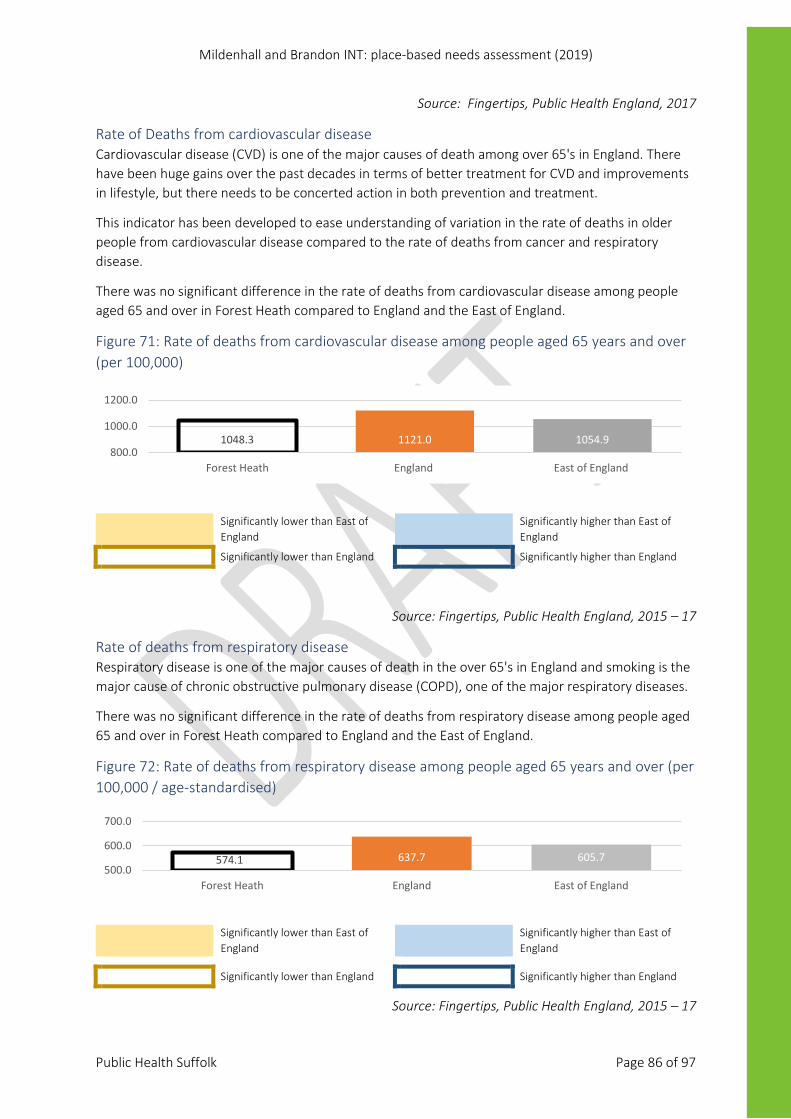
Mildenhall and Brandon INT: place-based needs assessment (2019)
Public Health Suffolk Page 86 of 97
Source: Fingertips, Public Health England, 2017
Rate of Deaths from cardiovascular disease Cardiovascular disease (CVD) is one of the major causes of death among over 65's in England. There have been huge gains over the past decades in terms of better treatment for CVD and improvements in lifestyle, but there needs to be concerted action in both prevention and treatment.
This indicator has been developed to ease understanding of variation in the rate of deaths in older people from cardiovascular disease compared to the rate of deaths from cancer and respiratory disease.
There was no significant difference in the rate of deaths from cardiovascular disease among people aged 65 and over in Forest Heath compared to England and the East of England.
Figure 71: Rate of deaths from cardiovascular disease among people aged 65 years and over (per 100,000)
Significantly lower than East of England
Significantly higher than East of England
Significantly lower than England Significantly higher than England
Source: Fingertips, Public Health England, 2015 – 17
Rate of deaths from respiratory disease Respiratory disease is one of the major causes of death in the over 65's in England and smoking is the major cause of chronic obstructive pulmonary disease (COPD), one of the major respiratory diseases.
There was no significant difference in the rate of deaths from respiratory disease among people aged 65 and over in Forest Heath compared to England and the East of England.
Figure 72: Rate of deaths from respiratory disease among people aged 65 years and over (per 100,000 / age-standardised)
Significantly lower than East of England
Significantly higher than East of England
Significantly lower than England Significantly higher than England
Source: Fingertips, Public Health England, 2015 – 17
1048.3 1121.0 1054.9800.0
1000.0
1200.0
Forest Heath England East of England
574.1 637.7 605.7500.0
600.0
700.0
Forest Heath England East of England
Mildenhall and Brandon INT: place-based needs assessment (2019)
Public Health Suffolk Page 87 of 97
References: 1. Public Health Suffolk County Council. Suffolk on a Page 2018. Healthy Suffolk (2018). Available
at: https://www.healthysuffolk.org.uk/blog/blog/suffolk-on-a-page-2018
2. Suffolk County Council. What are Integrated Neighbourhood Teams? (2019). Available at: http://www.connectsuffolk.co.uk/faqs/what-are-integrated-neighbourhood-teams/. (Accessed: 28th May 2019)
3. Office for National Statistics. Census geography. (2011). Available at: https://www.ons.gov.uk/methodology/geography/ukgeographies/censusgeography#output-area-oa. (Accessed: 28th May 2019)
4. Public Health England. About us - Public Health England. (2018). Available at: https://www.gov.uk/government/organisations/public-health-england/about. (Accessed: 1st July 2019)
5. NHS. NHS Long Term Plan. (2018). Available at: https://www.longtermplan.nhs.uk/. (Accessed: 23rd May 2019)
6. Association of Public Health Observatories (APHO). Using small area data in public health intelligence. (2009). Available at: https://fingertips.phe.org.uk/documents/APHO Tech Briefing 6 Using Small Area Data.pdf
7. Public Health England. Technical Guidance. 2008 (2008). Available at: https://fingertips.phe.org.uk/profile/guidance
8. Health Knowledge. Statistical Significance. Available at: https://www.healthknowledge.org.uk/interactive-learning/fae/making-sense-of-results/statistical-significance. (Accessed: 28th May 2019)
9. Campbell, M. J., Shantikumar, S. and Health Knowledge. Methods for the Quantification of Uncertainty. Public Health Textbook (2016). Available at: https://www.healthknowledge.org.uk/public-health-textbook/research-methods/1b-statistical-methods/methods-quantification-uncertainty. (Accessed: 28th May 2019)
10. Office for National Statistics. Overview of the UK population (November 2018). (2018). Available at: https://www.ons.gov.uk/peoplepopulationandcommunity/populationandmigration/populationestimates/articles/overviewoftheukpopulation/november2018
11. Office for National Statistics. Estimates of the population for the UK, England and Wales, Scotland and Northern Ireland. (2018). Available at: https://www.ons.gov.uk/peoplepopulationandcommunity/populationandmigration/populationestimates/datasets/populationestimatesforukenglandandwalesscotlandandnorthernireland. (Accessed: 23rd May 2019)
12. Office for National Statistics. Lower layer Super Output Area population estimates (supporting information). (2018). Available at: https://www.ons.gov.uk/peoplepopulationandcommunity/populationandmigration/populationestimates/datasets/lowersuperoutputareamidyearpopulationestimates. (Accessed: 23rd May 2019)
13. NHS Digital. Patients Registered at a GP Practice - November 2018. (2018). Available at: https://digital.nhs.uk/data-and-information/publications/statistical/patients-registered-at-a-gp-practice/november-2018. (Accessed: 11th December 2018)
Mildenhall and Brandon INT: place-based needs assessment (2019)
Public Health Suffolk Page 88 of 97
14. Office for National Statistics. Subnational population projections for England: 2016-based (report). (2018). Available at: https://www.ons.gov.uk/peoplepopulationandcommunity/populationandmigration/populationprojections/bulletins/subnationalpopulationprojectionsforengland/2016based
15. Suffolk County Council Children and Young People’s Services. Annual pupil data. (2018).
16. Public Health Suffolk. How we sustain Suffolk: State of Suffolk. (2019). Available at: https://www.healthysuffolk.org.uk/jsna/state-of-suffolk-report/sos19-how-we-sustain-suffolk
17. Public Health England. Spatial planning for health: evidence review. 68 (2017). Available at: https://www.gov.uk/government/publications/spatial-planning-for-health-evidence-review. (Accessed: 27th February 2019)
18. Suffolk Public Health. Where we live: State of Suffolk. (2019). Available at: https://www.healthysuffolk.org.uk/jsna/state-of-suffolk-report/sos19-where-we-live
19. Suffolk County Council. Suffolk changes in the Index of Multiple Deprivation from 2010 to 2015. (2015). Available at: https://www.healthysuffolk.org.uk/uploads/SCC-Index-of-Multiple-Deprivation-2010-2015-FINAL.pdf
20. Ministry of Housing Communities and Local Government. English indices of deprivation 2015. (2015). Available at: https://www.gov.uk/government/statistics/english-indices-of-deprivation-2015. (Accessed: 1st January 2019)
21. Ministry of Housing Communities & Local Government. Local authority housing statistics data returns for 2017 to 2018. (2019). Available at: https://www.gov.uk/government/statistical-data-sets/local-authority-housing-statistics-data-returns-for-2017-to-2018. (Accessed: 29th May 2019)
22. West Suffolk Councils. West Suffolk Homelessness Reduction Strategy2018 – 2023. (2018).
23. Crisis. 85f719edbe2569a1bf94b0df3b0a6dd28ad9453c @ www.crisis.org.uk. Crisis - About Homelessness (2018). Available at: https://www.crisis.org.uk/ending-homelessness/about-homelessness/. (Accessed: 15th May 2019)
24. Ministry of Housing Communities and Local Government. Homelessness data: notes and definitions. (2018). Available at: https://www.gov.uk/guidance/homelessness-data-notes-and-definitions. (Accessed: 28th May 2019)
25. Police. About data.police.uk. Available at: https://data.police.uk/about/. (Accessed: 29th May 2019)
26. Office for National Statistics. Business Register Employment Survey (BRES) QMI -. (2014). Available at: https://www.ons.gov.uk/employmentandlabourmarket/peopleinwork/employmentandemployeetypes/methodologies/businessregisteremploymentsurveybresqmi. (Accessed: 2nd July 2019)
27. Department for Work and Pensions. Statistics at DWP. Available at: https://www.gov.uk/government/organisations/department-for-work-pensions/about/statistics. (Accessed: 28th June 2019)
28. House of Commons Library. Constituency data: Personal Independence Payment. 3 (2019). Available at: https://commonslibrary.parliament.uk/social-policy/welfare-pensions/benefits/constituency-data-personal-independence-payment/. (Accessed: 25th June 2019)
Mildenhall and Brandon INT: place-based needs assessment (2019)
Public Health Suffolk Page 89 of 97
29. Suffolk County Council. State of Children in Suffolk Report 2016. (2016). Available at: https://www.healthysuffolk.org.uk/uploads/The_State_of_Children_in_Suffolk_full_draft_1.6.pdf
30. British Medical Association. Focus on GP quality indicators. (2018). Available at: https://www.bma.org.uk/-/media/files/pdfs/collective%20voice/committees/gpc/priorities/focus-on-gp-quality-indicators.pdf
31. Public Health England. Public Health Profiles. Fingertips https://fingertips.phe.org.uk/ (2015). Available at: https://fingertips.phe.org.uk/. (Accessed: 1st January 2019)
32. NHS. Atrial fibrillation. Health A-Z (2018). Available at: https://www.nhs.uk/conditions/atrial-fibrillation/. (Accessed: 1st July 2019)
33. NHS & Health Education England. Making Every Contact Count (MECC). (2019). Available at: https://www.makingeverycontactcount.co.uk/. (Accessed: 1st July 2019)
34. NHS. Cardiovascular disease (CVD). (2019). Available at: https://www.england.nhs.uk/ourwork/clinical-policy/cvd/. (Accessed: 1st July 2019)
35. Department of Health and Social Care. Smoke-free generation: tobacco control plan for England. (2017). Available at: https://www.gov.uk/government/publications/towards-a-smoke-free-generation-tobacco-control-plan-for-england
36. GBD. Global Burden of Disease. (2019). Available at: https://vizhub.healthdata.org/gbd-compare/
37. Office for National Statistics & Public Health England. Likelihood of smoking four times higher in England’s most deprived areas than least deprived. (2018). Available at: https://www.ons.gov.uk/peoplepopulationandcommunity/healthandsocialcare/drugusealcoholandsmoking/articles/likelihoodofsmokingfourtimeshigherinenglandsmostdeprivedareasthanleastdeprived/2018-03-14. (Accessed: 1st July 2019)
38. National Cancer Registration and Analysis Centre. Routes to Diagnosis. (2017). Available at: http://www.ncin.org.uk/publications/routes_to_diagnosis. (Accessed: 1st January 2019)
39. Public Health England. Diabetes Profile. Fingertips (2018). Available at: https://fingertips.phe.org.uk/profile/diabetes-ft. (Accessed: 1st January 2019)
40. ONS. Living longer: how our population is changing and why it matters. (2019). Available at: https://www.ons.gov.uk/peoplepopulationandcommunity/birthsdeathsandmarriages/ageing/articles/livinglongerhowourpopulationischangingandwhyitmatters/2019-03-15
41. Public Health England. DEM004: Dementia care plan has been reviewed last 12mths: Indicator Definitions and Supporting Information. Fingertips (2019). Available at: https://fingertips.phe.org.uk/profile/general-practice/data#page/6/gid/2000003/pat/152/par/E38000086/ati/7/are/D83036/iid/91215/age/1/sex/4. (Accessed: 1st June 2019)
42. Public Health Suffolk. Mental Health Needs Assessment. (2018). Available at: https://www.healthysuffolk.org.uk/jsna/health-needs-assessments/mhna-2018. (Accessed: 1st January 2019)
43. Public Health England. Mental Health, Dementia and Neurology. Public Health Profiles (2018). Available at: https://fingertips.phe.org.uk/profile-group/mental-health.
44. Public Health England. National General Practice Profiles. Available at:
Mildenhall and Brandon INT: place-based needs assessment (2019)
Public Health Suffolk Page 90 of 97
https://fingertips.phe.org.uk/profile/general-practice
45. Godfrey, C. & Consortium, P. H. R. Estimating the costs to the NHS of smoking in pregnancy for pregnant women and infants. Public Health Research Consortium (York, 2010). Available at: http://phrc.lshtm.ac.uk/papers/PHRC_A3-06_Short_Report.pdf
46. Wolfe I & Macfarlane A, Donkin A, Marmot M, V. R. Why children die: Death in infants, children and young people in the UK Part B A Policy Response for England. (2014). Available at: https://www.ncb.org.uk/sites/default/files/uploads/documents/Policy_docs/why_children_die_full_report.pdf
47. Public Health England. Percentage of deliveries to mothers from Black and Minority Ethnic (BME) groups: Indicator definition and supporting information. Public Health Profiles (2019). Available at: https://fingertips.phe.org.uk/profile/child-health-profiles/data#page/6/gid/1938133222/pat/6/par/E12000006/ati/102/are/E10000029/iid/92973/age/1/sex/2. (Accessed: 1st July 2019)
48. Public Health England. Breastfeeding and dental health. (2019). Available at: https://www.gov.uk/government/publications/breastfeeding-and-dental-health/breastfeeding-and-dental-health. (Accessed: 1st January 2019)
49. Davies, Sharon; Heyman, Isobel; Goodman, R. A population survey of mental health problems in children with epilepsy. (2003). https://doi.org/10.1111/j.1469-8749.2003.tb00398.x
50. NHS Digital. National Child Measurement Programme. (2019). Available at: https://digital.nhs.uk/services/national-child-measurement-programme/. (Accessed: 1st May 2019)
51. National Institute for Health and Care Excellence. Obesity in children and young people: prevention and lifestyle weight management programmes. (2015). Available at: https://www.nrv.gov.au/introduction. (Accessed: 20th June 2019)
52. NICE. Obesity in children and young people: prevention and lifestyle weight management programmes. Quality Standard (QS94) (2015). Available at: https://www.nice.org.uk/guidance/qs94. (Accessed: 2nd July 2019)
53. NHS England. Frailty – what it means and how to keep well over the winter months. (2013). Available at: https://www.england.nhs.uk/blog/frailty/. (Accessed: 1st January 2019)
54. NHS. Flu Vaccination. (2019). Available at: https://www.nhs.uk/conditions/vaccinations/flu-influenza-vaccine/. (Accessed: 1st May 2019)
55. NHS England. Pneumococcal vaccine. (2019). Available at: https://www.nhs.uk/conditions/vaccinations/pneumococcal-vaccination/. (Accessed: 22nd July 2019)
56. NHS England. Osteoporosis. (2019). Available at: https://www.nhs.uk/conditions/osteoporosis/causes/. (Accessed: 1st May 2019)
57. Department of Health. End of Life Care Strategy: Second Annual Report. Management (2010). Available at: https://www.gov.uk/government/publications/end-of-life-care-strategy-second-annual-report
58. Qipp, T. M., Summers, S. & Collins, K. End of Life Baseline Report. (2011). Available at: https://www.networks.nhs.uk/nhs-networks/nhs-north-of-england-end-of-life-care-shared/nhs-north-west-pct-cluster-baseline-reports/End of Life baseline report -Greater Manchester FINAL.pdf
Mildenhall and Brandon INT: place-based needs assessment (2019)
Public Health Suffolk Page 91 of 97
59. Nuffield Trust. Dying at Home. (2019). Available at: https://www.nuffieldtrust.org.uk/resource/dying-at-home. (Accessed: 21st May 2019)
60. Department for Communities and Local Government. English indices of deprivation 2015. (2015). Available at: https://www.gov.uk/government/statistics/english-indices-of-deprivation-2015
61. Crisis, “About homelessness,” Crisis - About Homelessness, 2017. [Online]. Available: http://www.crisis.org.uk/data/files/publications/Crisis Homelessness briefing.pdf. [Accessed: 15-May-2019].
Mildenhall and Brandon INT: place-based needs assessment (2019)
Public Health Suffolk Page 92 of 97
Appendix 1: The Indices of Deprivation, 2015 The Indices of Deprivation (IMD) 2015 provide a set of relative measures of deprivation for small areas (Lower-layer Super Output Areas) across England, based on seven different domains of deprivation:
1. Income Deprivation 2. Employment Deprivation 3. Education, Skills and Training Deprivation 4. Health Deprivation and Disability 5. Crime 6. Barriers to Housing and Services 7. Living Environment Deprivation
Each of these domains is based on a basket of indicators. As far as is possible, each indicator is based on data from the most recent time point available; in practice most indicators in the IMD 2015 relate to the tax year 2012/13.
The IMD 2015 combines information from the seven domains to produce an overall relative measure of deprivation. The domains are combined using the following weights:
1. Income Deprivation (22.5%) 2. Employment Deprivation (22.5%) 3. Education, Skills and Training Deprivation (13.5%) 4. Health Deprivation and Disability (13.5%) 5. Crime (9.3%) 6. Barriers to Housing and Services (9.3%) 7. Living Environment Deprivation (9.3%)
Income deprivation domain The Income Deprivation Domain measures the proportion of the population experiencing deprivation relating to low income. The definition of low income used includes both those people that are out-of-work, and those that are in work but who have low earnings (and who satisfy the respective means tests).
Employment deprivation domain The Employment Deprivation Domain measures the proportion of the working age population in an area involuntarily excluded from the labour market. This includes people who would like to work but are unable to do so due to unemployment, sickness or disability, or caring responsibilities.
Education, skills and training deprivation domain The Education, Skills and Training Deprivation Domain measures the lack of attainment and skills in the local population. The indicators fall into two sub-domains: one relating to children and young people and one relating to adult skills.
Health deprivation and disability domain The Health Deprivation and Disability Domain measures the risk of premature death and the impairment of quality of life through poor physical or mental health. The domain measures morbidity, disability and premature mortality but not aspects of behaviour or environment that may be predictive of future health deprivation.
Mildenhall and Brandon INT: place-based needs assessment (2019)
Public Health Suffolk Page 93 of 97
Crime domain The Crime Domain measures the risk of personal and material victimisation at local level.
Barriers to housing and services domain The Barriers to Housing and Services Domain measures the physical and financial accessibility of housing and local services. The indicators fall into two sub-domains: ‘geographical barriers’, which relate to the physical proximity of local services, and ‘wider barriers’ which includes issues relating to access to housing such as affordability and homelessness.
Living environment deprivation domain The Living Environment Deprivation Domain measures the quality of the local environment. The indicators fall into two sub-domains. The ‘indoors’ living environment measures the quality of housing; while the ‘outdoors’ living environment contains measures of air quality and road traffic accidents.
Income deprivation affecting children index The Income Deprivation Affecting Children Index (IDACI) measures the proportion of all children aged 0-15 living in income deprived families60. This is one of two supplementary indices and is a sub-set of the Income Deprivation Domain.
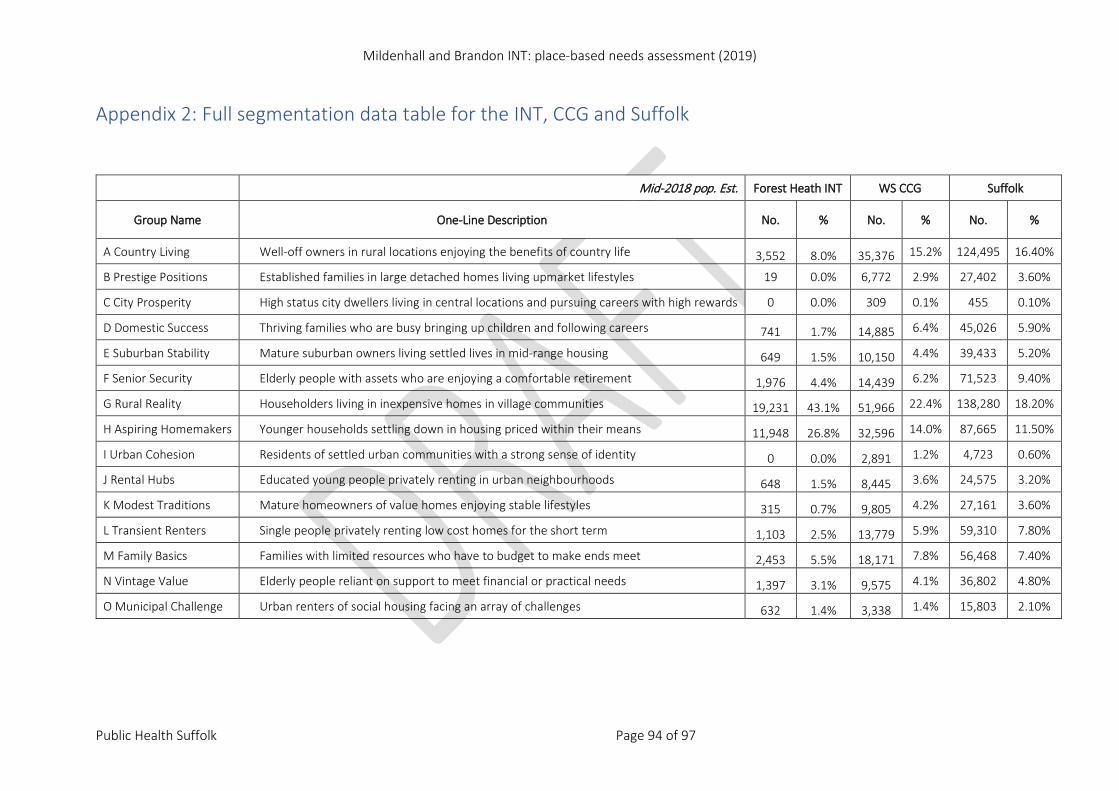
Mildenhall and Brandon INT: place-based needs assessment (2019)
Public Health Suffolk Page 94 of 97
Appendix 2: Full segmentation data table for the INT, CCG and Suffolk
Mid-2018 pop. Est. Forest Heath INT WS CCG Suffolk
Group Name One-Line Description No. % No. % No. %
A Country Living Well-off owners in rural locations enjoying the benefits of country life 3,552 8.0% 35,376 15.2% 124,495 16.40%
B Prestige Positions Established families in large detached homes living upmarket lifestyles 19 0.0% 6,772 2.9% 27,402 3.60%
C City Prosperity High status city dwellers living in central locations and pursuing careers with high rewards 0 0.0% 309 0.1% 455 0.10%
D Domestic Success Thriving families who are busy bringing up children and following careers 741 1.7% 14,885 6.4% 45,026 5.90%
E Suburban Stability Mature suburban owners living settled lives in mid-range housing 649 1.5% 10,150 4.4% 39,433 5.20%
F Senior Security Elderly people with assets who are enjoying a comfortable retirement 1,976 4.4% 14,439 6.2% 71,523 9.40%
G Rural Reality Householders living in inexpensive homes in village communities 19,231 43.1% 51,966 22.4% 138,280 18.20%
H Aspiring Homemakers Younger households settling down in housing priced within their means 11,948 26.8% 32,596 14.0% 87,665 11.50%
I Urban Cohesion Residents of settled urban communities with a strong sense of identity 0 0.0% 2,891 1.2% 4,723 0.60%
J Rental Hubs Educated young people privately renting in urban neighbourhoods 648 1.5% 8,445 3.6% 24,575 3.20%
K Modest Traditions Mature homeowners of value homes enjoying stable lifestyles 315 0.7% 9,805 4.2% 27,161 3.60%
L Transient Renters Single people privately renting low cost homes for the short term 1,103 2.5% 13,779 5.9% 59,310 7.80%
M Family Basics Families with limited resources who have to budget to make ends meet 2,453 5.5% 18,171 7.8% 56,468 7.40%
N Vintage Value Elderly people reliant on support to meet financial or practical needs 1,397 3.1% 9,575 4.1% 36,802 4.80%
O Municipal Challenge Urban renters of social housing facing an array of challenges 632 1.4% 3,338 1.4% 15,803 2.10%
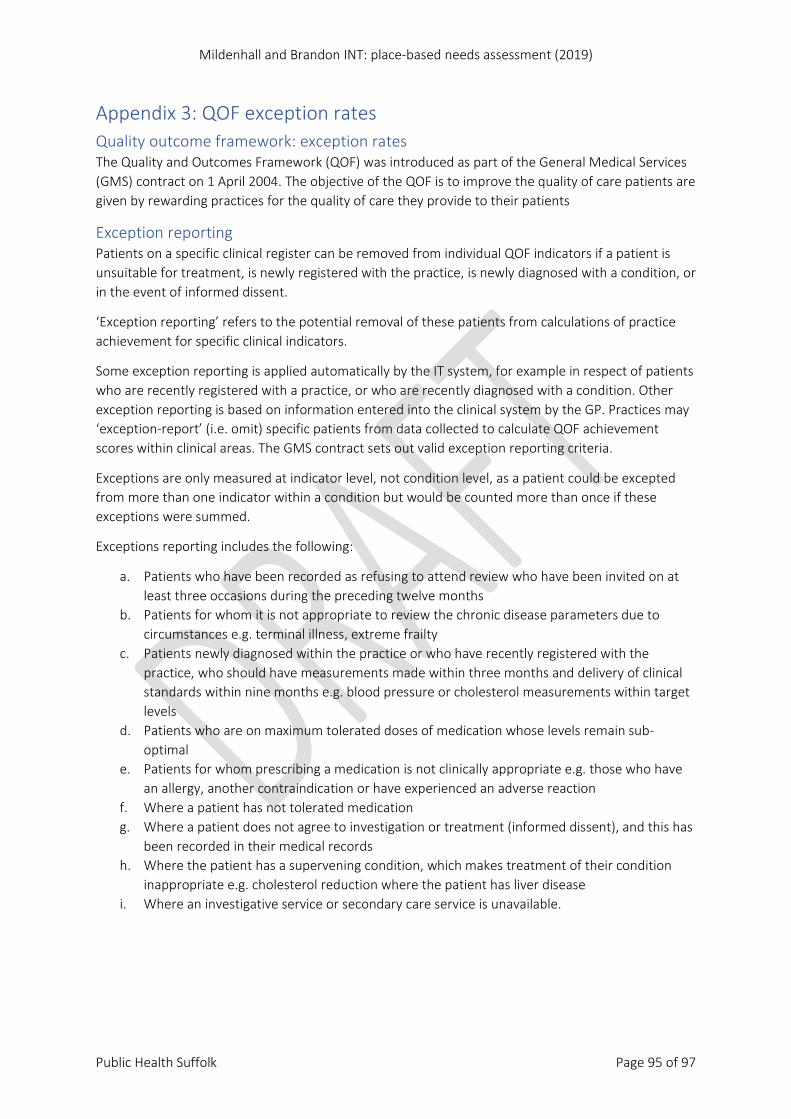
Mildenhall and Brandon INT: place-based needs assessment (2019)
Public Health Suffolk Page 95 of 97
Appendix 3: QOF exception rates Quality outcome framework: exception rates The Quality and Outcomes Framework (QOF) was introduced as part of the General Medical Services (GMS) contract on 1 April 2004. The objective of the QOF is to improve the quality of care patients are given by rewarding practices for the quality of care they provide to their patients
Exception reporting Patients on a specific clinical register can be removed from individual QOF indicators if a patient is unsuitable for treatment, is newly registered with the practice, is newly diagnosed with a condition, or in the event of informed dissent.
‘Exception reporting’ refers to the potential removal of these patients from calculations of practice achievement for specific clinical indicators.
Some exception reporting is applied automatically by the IT system, for example in respect of patients who are recently registered with a practice, or who are recently diagnosed with a condition. Other exception reporting is based on information entered into the clinical system by the GP. Practices may ‘exception-report’ (i.e. omit) specific patients from data collected to calculate QOF achievement scores within clinical areas. The GMS contract sets out valid exception reporting criteria.
Exceptions are only measured at indicator level, not condition level, as a patient could be excepted from more than one indicator within a condition but would be counted more than once if these exceptions were summed.
Exceptions reporting includes the following:
a. Patients who have been recorded as refusing to attend review who have been invited on at least three occasions during the preceding twelve months
b. Patients for whom it is not appropriate to review the chronic disease parameters due to circumstances e.g. terminal illness, extreme frailty
c. Patients newly diagnosed within the practice or who have recently registered with the practice, who should have measurements made within three months and delivery of clinical standards within nine months e.g. blood pressure or cholesterol measurements within target levels
d. Patients who are on maximum tolerated doses of medication whose levels remain sub-optimal
e. Patients for whom prescribing a medication is not clinically appropriate e.g. those who have an allergy, another contraindication or have experienced an adverse reaction
f. Where a patient has not tolerated medication g. Where a patient does not agree to investigation or treatment (informed dissent), and this has
been recorded in their medical records h. Where the patient has a supervening condition, which makes treatment of their condition
inappropriate e.g. cholesterol reduction where the patient has liver disease i. Where an investigative service or secondary care service is unavailable.
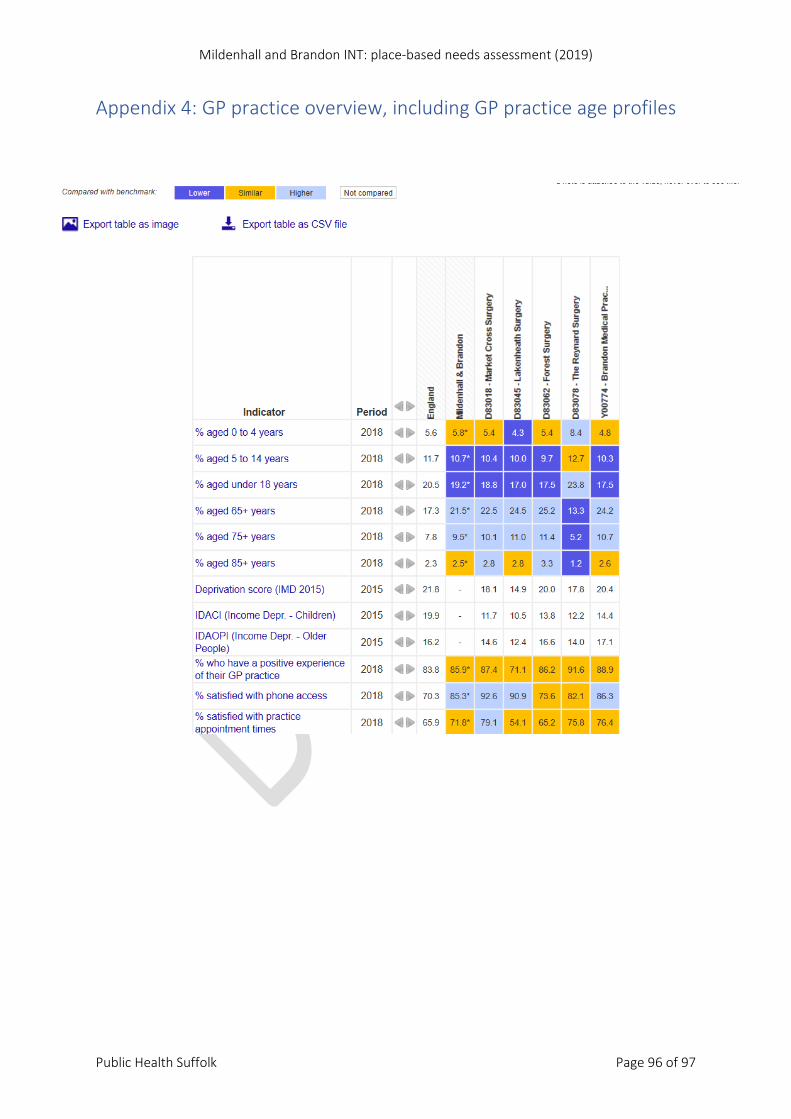
Mildenhall and Brandon INT: place-based needs assessment (2019)
Public Health Suffolk Page 96 of 97
Appendix 4: GP practice overview, including GP practice age profiles
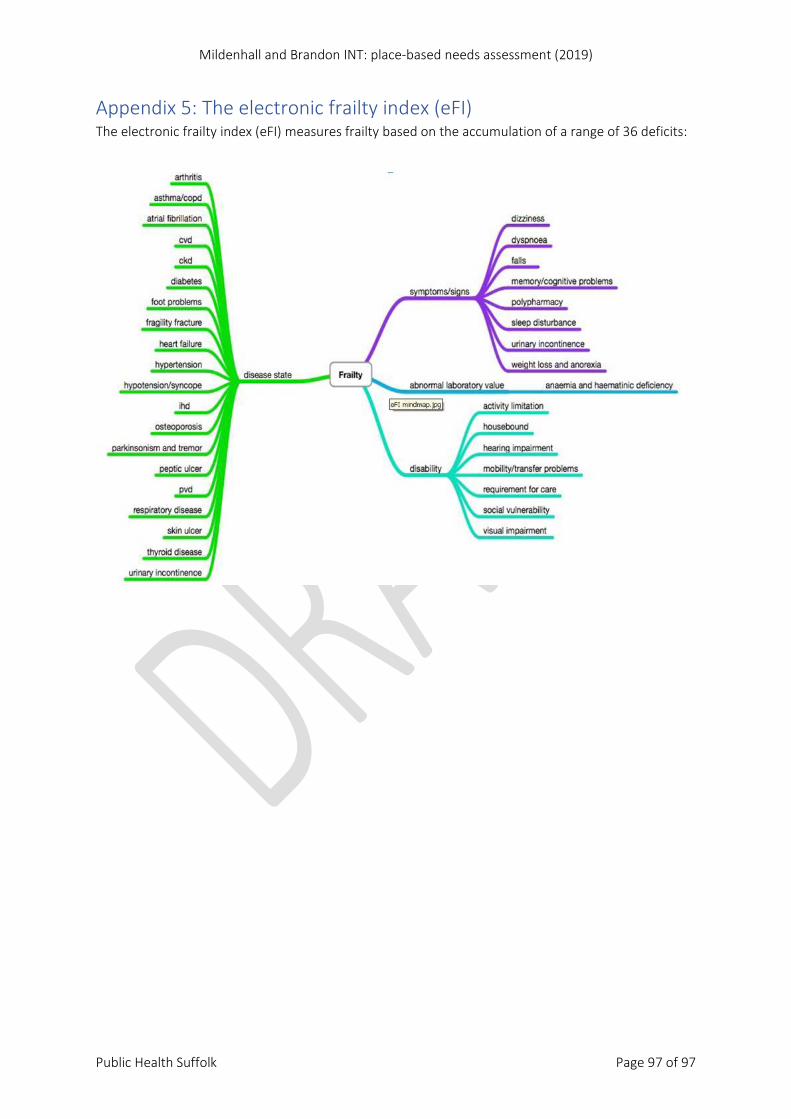
Mildenhall and Brandon INT: place-based needs assessment (2019)
Public Health Suffolk Page 97 of 97
Appendix 5: The electronic frailty index (eFI) The electronic frailty index (eFI) measures frailty based on the accumulation of a range of 36 deficits:


