Università Degli Studi Di Padova
Dipartimento Di Biologia
Scuola Di Dottorato Di Ricerca In Bioscienze E Biotecnologie
Indirizzo Di Genetica E Biologia Molecolare Dello Sviluppo
Ciclo XXIV
MicroRNAs: from biogenesis to post-transcriptional
regulatory networks
Direttore della Scuola: Ch.mo Prof. Giuseppe Zanotti
Supervisore: Dr.ssa Stefania Bortoluzzi
Dottorando: Marta Biasiolo

I
Contents
1. Abstract ....................................................................................................................... 1
2. Sommario .................................................................................................................... 3
3. Background ................................................................................................................. 5
3.1. miRNA biology ........................................................................................................ 5
3.1.1. microRNAs biogenesis ...................................................................................... 5
3.1.2 miRNA genes genomic arrangement .................................................................. 7
3.2. microRNA detection and their interaction with mRNAs ......................................... 9
3.2.1. MicroRNAs discovery and analysis .................................................................. 9
3.2.2. MicroRNA-mRNA interaction ........................................................................ 10
3.2.3. MicroRNA targets prediction .......................................................................... 12
3.3. miRNAs and diseases ............................................................................................ 14
3.4. MicroRNA–offset RNAs (moRNAs): by-product spectators or functional players?
...................................................................................................................................... 15
3.4.1. moRNA discovery by massive sequencing of short RNAs ............................. 16
3.4.2. moRNAs biogenesis: by-product or co-product? ............................................ 16
3.4.3. The functions of moRNAs are unknown at present ......................................... 17
3.5. Regulatory network inference ................................................................................ 18
4. Material and Methods ................................................................................................ 23
4.1. microRNAs and genes: sequences and genomic positions ..................................... 23
4.2. Biological Datasets ................................................................................................ 23
4.2.1. Multiple Myeloma dataset ............................................................................... 23
4.2.2. Acute Lymphoblastic Leukemia dataset .......................................................... 24
4.2.3. Normal and Alzheimer's parietal lobe cortex .................................................. 24
4.2.4. Normal prostate and prostate cancer ............................................................... 25
4.2.5. Multiple cancers and normal tissues dataset .................................................... 25
4.2.6. Colorectal cancer dataset ................................................................................. 25
4.2.7. Adult T-cell leukemia lymphoma dataset ........................................................ 26
II
4.2.8. SET2 cells line dataset .................................................................................... 27
4.3. Cluster analysis ...................................................................................................... 27
4.4. miRNA and gene differential expression analysis ................................................. 28
4.5. MicroRNA target predictions ................................................................................. 28
4.5.1. miRanda .......................................................................................................... 28
4.5.2. Pita .................................................................................................................. 28
4.5.3. TargetScan ....................................................................................................... 29
4.6. Regulatory network reconstruction ........................................................................ 29
4.6.1. Transcriptional regulatory network ................................................................. 29
4.6.2. Integrative analysis .......................................................................................... 29
4.6.3. Post-transcriptional regulatory networks ......................................................... 30
4.6.4. Network critical components analysis ............................................................. 31
4.7. MAGIA web-based tool ......................................................................................... 35
4.7.1. Input files ........................................................................................................ 36
4.7.2. Target predictions ............................................................................................ 37
4.7.3. Computation of interaction measure ................................................................ 38
4.7.4. Output and links to other database resources .................................................. 40
4.7.5. Bi-partite networks visualizations ................................................................... 40
4.8. Analysis of sister miRNA pairs expression ratio. .................................................. 41
4.9. Statistical analysis .................................................................................................. 41
4.10. New miRNA target prediction ............................................................................. 41
5. Results ....................................................................................................................... 45
5.1. Identification of microRNA expression patterns and definition of a
microRNA/mRNA regulatory network in distinct molecular groups of multiple
myeloma ....................................................................................................................... 45
5.1.1. Global miRNA expression profiling in MM patients ...................................... 45
5.1.2. Integrative analysis of miRNA/mRNA expression and reconstruction of a
regulatory network in MM ........................................................................................ 49
5.1.3. Critical analysis of transcriptional and post-transcriptional regulatory networks
.................................................................................................................................. 51
III
5.2. miRNAs modulation in colon cancer and metastasis development and its impact on
regulatory networks and pathways ................................................................................ 56
5.2.1. miRNA and genes expression in normal colon, colon carcinoma and liver
metastasis samples .................................................................................................... 56
5.2.2. Informativity of miRNAs and genes for samples classification and variability
in the N-T-M transitions ............................................................................................ 58
5.2.3. Differentially expressed miRNAs ................................................................... 60
5.2.4. RT-PCR miRNA expression validation ........................................................... 62
5.2.5. miRNA and genes expression profiles integration allows the identification of
most probable miRNA targets ................................................................................... 63
5.2.6. Regulatory networks modulated in tumor and metastasis development .......... 63
5.2.7. miR-182 control ENTPD5 ............................................................................... 66
5.2.8 miRNAs modulated KEGG pathways .............................................................. 67
5.3. microRNA expression in HTLV-1 infection and adult T-cell leukemia/lymphoma
...................................................................................................................................... 68
5.3.1. microRNAs with altered expression in ATLL cells ........................................ 68
5.3.2. microRNA target prediction ............................................................................ 70
5.4. MAGIA, a web-based tool for miRNA and Genes Integrated Analysis ................. 73
5.4.1. MAGIA application and testing to a case study .............................................. 73
5.5. Impact of host genes and strand selection on miRNA and miRNA* expression .... 76
5.5.1. Microarray-based expression datasets analyses description ............................ 76
5.5.2. Expression of sister mature miRNA pairs belonging to the same hairpin ....... 77
5.5.3. miRNA are hosted by long genes .................................................................... 83
5.5.4. Limited co-expression of intragenic miRNAs and host genes ......................... 83
5.5.5. Impact of host genes expression used as proxy for miRNAs on target selection.
.................................................................................................................................. 84
5.6. Characterization and discovery of novel miRNAs and moRNAs in JAK2V617F
mutated SET2 cell ......................................................................................................... 87
5.6.1. Small RNA library .......................................................................................... 87
5.6.2. Known miRNAs and isomiRs expressed in SET2 cells ............................. 87
5.6.3. Novel miRNAs expressed in SET2 cells were discovered in known hairpin
precursors .................................................................................................................. 89
IV
5.6.4. Sister miRNA expression prevalence ............................................................. 92
5.6.5. miRNA-offset RNAs (moRNAs) identification in known hairpin precursors
.................................................................................................................................. 94
6. Discussion and Conclusions ...................................................................................... 95
6.1. Identification of microRNA expression patterns and definition of a transcriptional
and post-transcriptional regulatory network in distinct molecular groups of multiple
myeloma ....................................................................................................................... 95
6.2. miRNAs modulation in colon cancer and metastasis development and its impact on
regulatory networks and pathways .............................................................................. 100
6.3. microRNA expression in HTLV-1 infection and adult T-cell leukemia/lymphoma
.................................................................................................................................... 104
6.4. MAGIA, a web-based tool for miRNA and Genes Integrated Analysis ............... 106
6.5. Impact of host genes and strand selection on miRNA and miRNA* expression .. 107
6.6. Characterization and discovery of novel miRNAs and moRNAs in JAK2V617F
mutated SET2 cell ....................................................................................................... 109
Reference List ................................................................................................................ 113
Supplementary material .................................................................................................. 133
1
1. Abstract
The discovery of microRNA-based post-transcriptional regulation of gene expression
added a novel level of genetic regulation to a wide range of biological processes.
Dysregulation of miRNAs expression plays a critical role in the pathogenesis of genetic
and multifactorial disorders and of most human cancers. To bypass limitations of
computational predictions of miRNA–target relationships, we developed a method for
integrated analysis of miRNA and gene expression profiles in combination with target
prediction, allowing the identification and study of post-transcriptional regulatory
networks in specific biological contexts. This methodology was also implemented in a
web tool, MAGIA, that allows integrating target predictions and miRNA and gene
expression profiles for the miRNA–mRNA bipartite networks reconstruction, gene
functional enrichment and pathway annotations for results browsing. Network analysis
has been applied to highlight the importance of some regulatory elements in the
regulatory network reconstructed calculating the drop of network efficiency caused by
node deactivation. Biologically relevant results, obtained by bioinfomatic analyses in the
frame of different projects, were the starting point for further experimental studies, which
identified key miRNA-target relations in cancerogenesis. miRNAs biogenesis is not still
completely understood. Thus with the integration of genomic information with sequence
and expression data we studied the strand selection bias and the expression behavior of
intragenic miRNAs and host genes. In contrast with classical biogenesis model, these
analyses highlighted that 5’ and 3’ miRNA strands, the “major” and the “minor” forms,
deriving from the same hairpin precursor may co-coordinately contribute to silencing of
different sets of target genes. Indeed, the behaved tendency to co-expression of intragenic
miRNAs and their “host” mRNA genes was confuted by expression profiles examination,
suggesting that the expression profile of a given host gene can hardly be a good estimator
of co-transcribed miRNA(s) for post-transcriptional regulatory networks inference. In the
last year, short RNAs massive sequencing was exploited for a miRNOme analysis of
myeloproliferative neoplasms (MPN). This analysis allowed the characterization of short
RNAs (known and novel miRNAs, isomiRs and moRNAs) expressed by SET2 cells, a
JAK2-mutated cell line model for MPN. moRNAs (microRNA-offset RNA) derived from
extended hairpin stem sequences, probably by alternative nuclear and/or cytoplasmic
processing. They seem to be conserved across species and the conservation extent
correlates with expression level. This evidence suggests that moRNAs might be miRNA
co-products, representing a distinct functional class of miRNA-related agents. In
conclusion, our analyses were addressed to shed light on the complexity of microRNA-
mediated gene regulation, pointing out the regulatory importance of post-transcriptional
phases of miRNAs biogenesis, reinforcing the role of such layer of miRNA biogenesis in
miRNA-based regulation of cell activities in physiology and in different diseases

.
3
2. Sommario
La scoperta della regolazione post-trascrizionale dei miRNA ha aggiunto un nuovo livello
alla regolazione genetica in numerosi processi biologici. Alterazioni nell’espressione dei
miRNA possono giocare un importante ruolo nell’insorgenza di svariate patologie ed in
particolare in molte neoplasie. Per ovviare alle limitazioni presenti nelle relazioni
miRNA-mRNA degli algoritmi di predizione computazionali, è stata sviluppata una
metodologia per l’integrazione dei profili d’espressione di miRNA e mRNA con le
predizioni dei bersagli biologici dei miRNA, che ha permesso l’identificazione di reti
regolative post-trascrizionali in diversi contesti biologici. Questa metodologia è stata
inoltre implementata in un “web-tool”, soprannominato MAGIA. Per evidenziare
l’importanza di alcuni elementi regolativi presenti nei circuiti biologici è stata applicata la
teoria delle reti per l’identificazione di geni critici attraverso la loro de-attivazione nella
rete. I frutti di queste analisi bioinformatiche, svolte nell’ambito di numerosi progetti,
hanno rappresentato il punto di partenza per successivi studi sperimentali che hanno
portato alla scoperta di rilevanti relazioni miRNA-target in specifici tumori. La biogenesi
dei miRNA non è stata ancora completamente chiarita, perciò, integrando informazioni
derivanti dalle sequenze genomiche e da dati d’espressione, sono stati approfonditi alcuni
loro aspetti, quali la teoria di generazione dei miRNA maturi per selezione del filamento
e la co-espressione dei miRNA intragenici e dei loro geni ospiti. Le suddette analisi
hanno evidenziato che i miRNA generati dal 5’ ed il 3’, derivanti dallo stesso miRNA
precursore, supportano solo parzialmente il modello classico della biogenesi dei miRNA,
secondo il quale uno dei due miRNA maturi è scelto in modo deterministico e degradato.
Entrambe le forme “major” e “minor”, infatti, possono contribuire insieme al
silenziamento di gruppi diversi di geni bersaglio. La tendenza alla co-espressione tra i
miRNA intragenici e i loro geni ospiti, inoltre, è stata confutata dall’analisi dei loro
profili d’espressione, dimostrando che i profili d’espressione dei geni ospite non possono
essere usati come stimatori dell’espressione dei miRNA per l’inferenza di reti regolative
post-trascrizionali. Nell’ultimo anno, il sequenziamento massivo di brevi RNA è stato
sfruttato per l’analisi approfondita di miRNA nelle neoplasie mieloproliferative.
Attraverso questo approccio è stato possibile scoprire e caratterizzare numerosi brevi
RNA, quali miRNA noti e nuovi, isomiRNA e i moRNA, che sono espressi nelle cellule
SET2, linee cellulari con mutazione del gene JAK2. I moRNA (microRNA-offset RNA)
derivano dalle sequenze dei precursori dei miRNA, probabilmente da un processo
alternativo del nucleo e/o citoplasmatico, e sembrano essere conservati in varie specie. Il
loro grado di conservazione è correlato con i livelli d’espressione e si potrebbe dedurre
che siano prodotti insieme ai miRNA, ma rappresentando una classe funzionale distinta
da essi. In conclusione, le nostre analisi sono state indirizzate a far luce sulla complessità
della regolazione dei geni da parte dei miRNA, in particolare sull’importanza delle fasi
post-trascrizionali della biogenesi dei miRNA ed il loro ruolo nella regolazione delle
attività cellulari fisiologiche ed in diverse patologie.

5
3. Background
In 1993 in a genetic screen in nematode worms two small RNA sequences, originating by
lin-4 transcript, were identified. These small RNAs of approximately 22 and 61 nt had
sequences complementary to a sequence in the 3’ untranslated region (UTR) of lin-14
mRNA. This discovery led to hypothesize that lin-4 regulates lin-14 translation via an
antisense RNA-RNA interaction for a post-transcriptional temporal regulation during C.
elegans development (Lee et al., 1993; Wightman et al., 1993). From that moment small
RNAs were observed to be involved in many biological processes range from
heterochromatin formation to mRNA destabilization and transcriptional control. The
number of small RNAs continues to substantially increase also thanks to the recent
development of deep-sequencing technologies and computational prediction methods, able
to discover also less abundant small RNAs. ‘Small RNA’ is a rather arbitrary term, because
it was previously used for other non-coding RNAs, such as small nuclear RNAs (shrines)
and transfer RNAs (tunas). What distinguishes and defines eukaryotic small RNAs in the
RNA silencing pathway is their limited size (~20-30 nucleotides (nt)) and their association
with Argonaut (Ago)-family proteins(Kim et al., 2009). At least three classes of small
RNAs are encoded in our genome, based on their biogenesis mechanism and the type of
Ago protein that they are associated with: microns (miRNAs), endogenous small interfering
RNAs (endo-siRNAs or esiRNA s) and Piwi-interacting RNAs (piRNAs) (Kim et al.,
2009). This thesis will focus on different aspects of microRNAs from biogenesis to the
reconstruction of the post-transcriptional regulatory network.
3.1. miRNA biology
3.1.1. microRNAs biogenesis
miRNAs are single-stranded RNAs of ~22 nt in length that are transcribed in the nucleus
by RNA polymerase II, originating primary transcripts (pri-miRNAs). Pri-miRNAs are
usually several kilobases long and contain local stem-loop structures. The first step of
miRNA maturation is cleavage at the stem of the hairpin structure by Drosha-DiGeorge
syndrome critical region gene 8 (DGCR8) complex that generate ~65 nt hairpin, a pre-
miRNA. Following nuclear processing, pre-miRNAs are exported to the cytoplasm by
exportin 5 (EXP5) where they are cleaved again near the terminal loop by Dicer, releasing
~22-nt miRNA duplexes. Human Dicer seems to cooperate with two closely related protein,
6
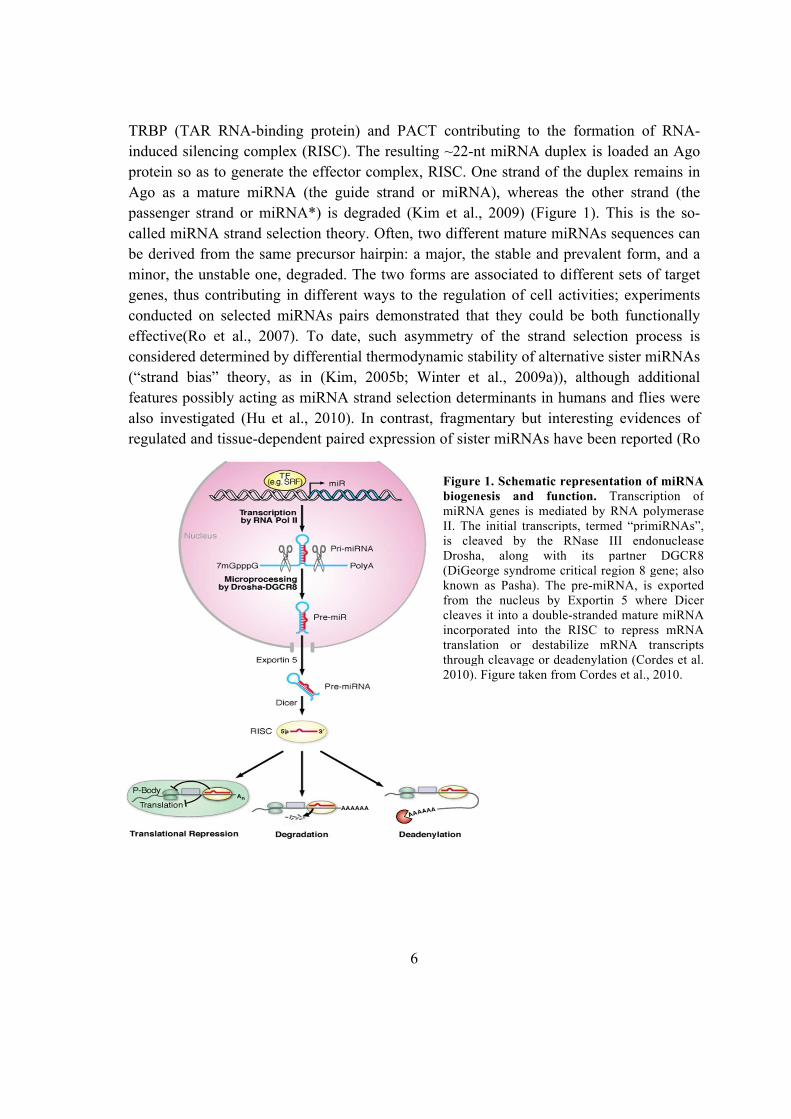
TRBP (TAR RNA-binding protein) and PACT contributing to the formation of RNA-
induced silencing complex (RISC). The resulting ~22-nt miRNA duplex is loaded an Ago
protein so as to generate the effector complex, RISC. One strand of the duplex remains in
Ago as a mature miRNA (the guide strand or miRNA), whereas the other strand (the
passenger strand or miRNA*) is degraded (Kim et al., 2009) (Figure 1). This is the so-
called miRNA strand selection theory. Often, two different mature miRNAs sequences can
be derived from the same precursor hairpin: a major, the stable and prevalent form, and a
minor, the unstable one, degraded. The two forms are associated to different sets of target
genes, thus contributing in different ways to the regulation of cell activities; experiments
conducted on selected miRNAs pairs demonstrated that they could be both functionally
effective(Ro et al., 2007). To date, such asymmetry of the strand selection process is
considered determined by differential thermodynamic stability of alternative sister miRNAs
(“strand bias” theory, as in (Kim, 2005b; Winter et al., 2009a)), although additional
features possibly acting as miRNA strand selection determinants in humans and flies were
also investigated (Hu et al., 2010). In contrast, fragmentary but interesting evidences of
regulated and tissue-dependent paired expression of sister miRNAs have been reported (Ro
Figure 1. Schematic representation of miRNA
biogenesis and function. Transcription of
miRNA genes is mediated by RNA polymerase
II. The initial transcripts, termed “primiRNAs”,
is cleaved by the RNase III endonuclease
Drosha, along with its partner DGCR8
(DiGeorge syndrome critical region 8 gene; also
known as Pasha). The pre-miRNA, is exported
from the nucleus by Exportin 5 where Dicer
cleaves it into a double-stranded mature miRNA
incorporated into the RISC to repress mRNA
translation or destabilize mRNA transcripts
through cleavage or deadenylation (Cordes et al.
2010). Figure taken from Cordes et al., 2010.
7
et al., 2007).
To support this, a recent paper has been published reporting sequencing and
characterization of bovine miRNAs (Jin et al., 2009), which underlined that only 60% of
them displayed thermodynamic stability-dependent strand selection bias. These studies
introduced innovative concepts and unraveled that i) both sister mature miRNAs may be
accumulated in some tissues and cell types, and ii) the strand selection might not be
deterministic but tissue-specific, so that a given strand could be guide strand in a specific
cell type and passenger in another one. The crucial pathogenetic role of the passenger
strand has been pointed out by a study on thyroid cancer (Jazdzewski et al., 2009).
Moreover with the increase of the attention of miRNA biogenesis processes, always new
details about new biological mechanisms about mature miRNA generation come out. In
particular, production of mature miRNA from an endogenous hairpin RNA with 5'
overhangs has also been reported. Ando et al. show that human recombinant DICER
protein (rDICER) processes a hairpin RNA with 5' overhangs in vitro and generates an
intermediate duplex with a 29 nt-5' strand and a 23 nt-3' strand, which was eventually
cleaved into a canonical miRNA duplex via a two-step cleavage(Ando et al., 2011). The
two-step cleavage of a hairpin RNA with 5' overhangs shows that DICER releases double-
stranded RNAs after the first cleavage and binds them again in the inverse direction for a
second cleavage. These findings may have consequences for how DICER may be able to
interact with or process differing precursor structures (Ando et al., 2011).
3.1.2 miRNA genes genomic arrangement
Many studies improved notions about miRNA genes structure but their clear definition is
still ongoing. The majority of miRNAs derive from stand-alone non-protein-coding loci
distinct from known transcription units, identified as intergenic. These miRNAs can be
monocistronic with their own promoters or polycistronic, where several miRNAs are
transcribed as cluster of primary transcripts with a shared promoter (Axtell et al., 2011;
Olena and Patton, 2010). A number of miRNA genes have also been discovered that reside
within the TUs of other genes, both intronic and exonic. Approximately 50% of miRNAs
are located on introns of annotated genes, both protein-coding and noncoding. Intronic
miRNAs are thought to be transcribed from the same promoter as their host genes and
processed from the introns of host genes but there is evidence of miRNA genes resided
within the introns under control of their own promoters.
A special intronic miRNAs are mirtrons, that are generated from the termini of short
intronic hairpins giving rise to pre-miRNA hairpins with 3’ overhangs and subsequently to
mature ~22 nt species, which function as typical miRNA-class regulatory RNAs(Westholm
and Lai, 2011). Rarely, miRNAs are also found resided within the exons of annotated
genes; in particular, they often overlap an exon and an intron of a noncoding genes. These

8
miRNAs are also thought to be transcribed by their host gene promoter and their maturation
often excludes host genes function (Axtell et al., 2011; Olena and Patton, 2010) (Figure 2).
About 40% of miRNAs are found in clusters frequently containing miRNAs belonging to
different families. This unrelated mature miRNAs generated from a given cluster can target
multiple different mRNAs. The best and well-studied example of miRNA cluster is miR-
17-19 cluster, a miRNA polycistron also known as oncomir-1, is among the most potent
oncogenic miRNAs. Overexpression of mir-17-92 was both found in several human B-cell
lymphomas, and its enforced expression exhibits strong tumorigenic activity in multiple
mouse tumor models. mir-17-92 carries out pleiotropic functions during both normal
development and malignant transformation, as it acts to promote proliferation, inhibit
differentiation, increase angiogenesis, and sustain cell survival. Unlike most protein coding
genes, mir-17-92 is a polycistronic miRNA cluster that contains multiple miRNA
components, each of which has a potential to regulate hundreds of target mRNAs. This
unique gene structure of mir-17-92 may underlie the molecular basis for its pleiotropic
functions in a cell type- and context-dependent manner. These findings on mir-17-92
indicate that miRNAs are
integrated components of the
molecular pathways that regulate
tumor development and tumor
maintenance and imply nuanced
regulation by miRNAs than was
perhaps expected (Olena and
Patton, 2010; Olive et al., 2010).
Moreover this cluster was found
highly expressed (among the top
25% of expressed miRNAs) in
SET2 cells (Bortoluzzi et al.,
2012). Recent evidence support
the contention that uncontrolled
expression of both or either these
two clusters results in the loss of
physiologic control of cell cycle
arrest and apoptosis by
transforming growth factor-β
contributing to oncogenesis.
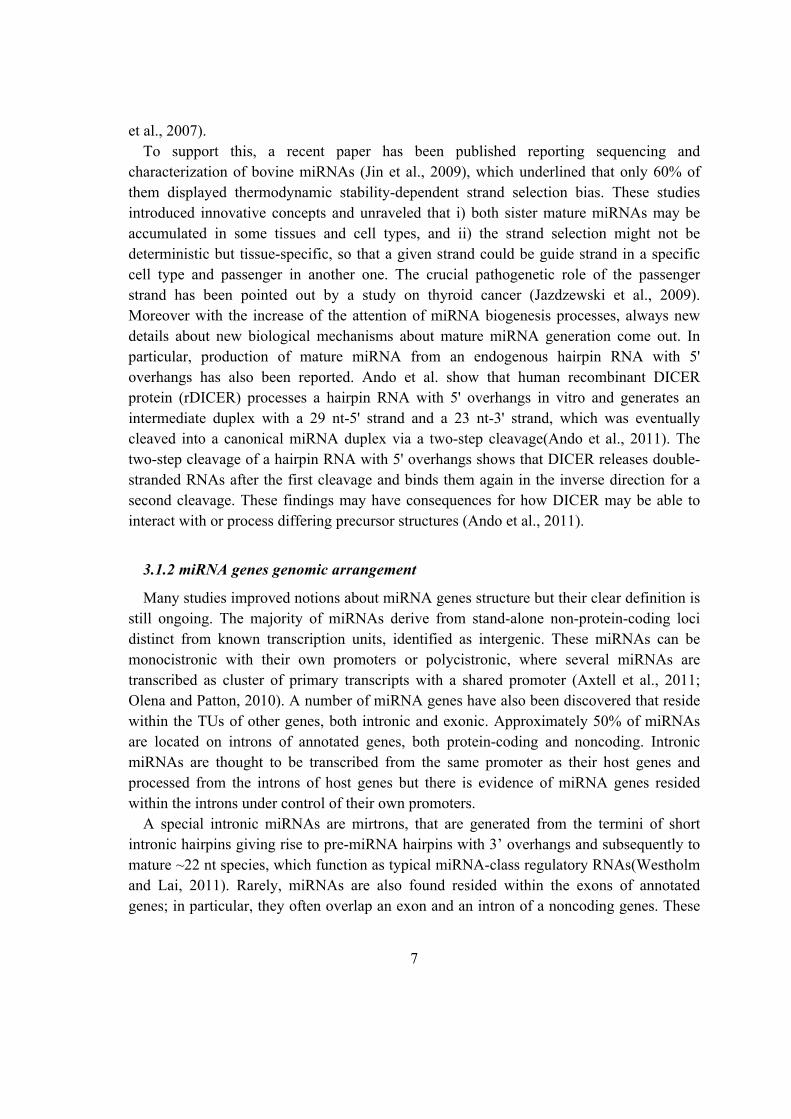
Figure 2. miRNA genes structure. Intergenic miRNAs derive
from stand-alone non-protein-coding loci distinct from known
transcription units. A number of miRNA genes have also been
discovered that reside within the TUs of other genes, both
intronic and exonic. About 40% of miRNAs are found in
clusters frequently containing miRNAs belonging to different
families. Figure taken from Olena and Patton, 2010.
9
3.2. microRNA detection and their interaction with mRNAs
3.2.1. MicroRNAs discovery and analysis
A still present challenge in biology is the efficient discovery of miRNAs. Initially, miRNAs
was detected by large cloning and sequencing efforts, a methodology extremely time and
labor demanding. Moreover, structural and physiological miRNA characteristics make
difficult to detect their presence because also their low expression levels the main reason
for their late discovery (Lhakhang and Chaudhry, 2011). Hybridization methods (Northern
blotting and microarray technology) are very useful for miRNA detection. First these
methods have a well established protocol set and are able to observed both pre-cursor and
mature miRNA forms. This technique is quite laborious and time consuming, do not
distinguish miRNAs with small sequence differences and cannot be used for stem cells and
primary tumor analysis for the amount of RNA required for detecting miRNAs (5-10
micrograms of total RNA per gel lane). On the other hand, microarrays technology offers a
high-throughput analysis to quantify miRNA abundance and copy number variations.
Reverse transcriptase PCR-based methods were developed and optimized for miRNA
detection, including real-time methods based upon reverse transcription (RT) reaction with
stem-loop primer followed by a TaqMan PCR analysis. Microarray profiling and
quantitative real-time RT-PCR (qRT-PCR) are the two common methods for miRNA
expression evaluation, but results from microarray data and qRT-PCR do not always agree.
This depends on the higher sensitivity of qRT-PCR compared with microarray
technologies, which can only detect a 3-4 log of dynamic range rather than 7 log using
qRT-PCR. Next-generation sequencing technologies allow today a quickly sequencing and
profiling miRNA populations. This methodology provides measuring miRNAs sequence
variations, isomiRs, and in-depth analysis of post-transcriptional miRNA editing. Moreover
it gives the possibility to detect and measure expression of known miRNAs and to discover
new miRNAs (Lhakhang and Chaudhry, 2011). Due to several gigabytes of sequence data
generated in each single deep-sequencing experiment, the need to adapted bioinformatics
tools is immediately emerged. Following some tools will be reported. miRanalyzer is a web
server tool for the analysis of deep-sequencing experiments for small RNAs. The web
server tool requires a simple input file containing a list of unique reads and its copy
numbers (expression levels). Using these data, miRanalyzer (i) detects all known
microRNA sequences annotated in miRBase, (ii) finds all perfect matches against other
libraries of transcribed sequences and (iii) predicts new microRNAs with a machine
learning approach (Hackenberg et al., 2009). Guan et al. developed mirExplorer, which is
based on an integrated adaptive boosting method to de novo predict pre-miRNAs from
genome, and to discover miRNAs from NGS data (Guan et al., 2011). Instead DARIO free
web service allows to study short read data from small RNA-seq experiments providing a
wide range of analysis features, including quality control, read normalization, ncRNA
10
quantification and prediction of putative ncRNA candidates(Fasold et al., 2011).
3.2.2. MicroRNA-mRNA interaction
Mature miRNAs can cause translation inhibition or mRNA cleavage, by base pairing
with the 3’ untranslated region (3’-UTR) of their target mRNAs, depending on the
complementarity degree between the miRNA and its target sequence (Alexiou et al., 2009;
Kuhn et al., 2008; Sethupathy et al., 2006). An individual miRNA is able to affect the
translation of more than one target mRNAs and each mRNA may be regulated by multiple
miRNAs. Many mRNAs have potential multiple sites for the same miRNA. It was reported
that multiple sites enhance the degree of down-regulation and two sites of the same or
different miRNAs located closely to each other could act synergistically (Witkos et al.,
2011).The 5’ region of miRNA (“seed” sequence) usually contributes more to the
specificity and activity in binding targets according to experimental evidence. The
interactions between miRNA and mRNA are usually restricted to the “seed” sequence near
the 5’ terminus in animals despite the fact that most plant miRNAs regulate their targets
based on complete complementarity. The 6 to 8-nt “seed” sequence is highly conserved
among species and is characterized by a strict Watson-Crick pairing between miRNA and
its target site. Even a slight change in seed sequence may alter the spectrum of miRNA
targets (Cai et al., 2009; Lim et al., 2003). In animal, miRNA-mRNA interactions presented
regions of strict complementarity, bulges and mismatches. There is no single model that
would depict all miRNA-mRNA interactions because of their relative heterogeneity. The
classification of miRNA target sites is based on the complementarity within 5’ (the seed
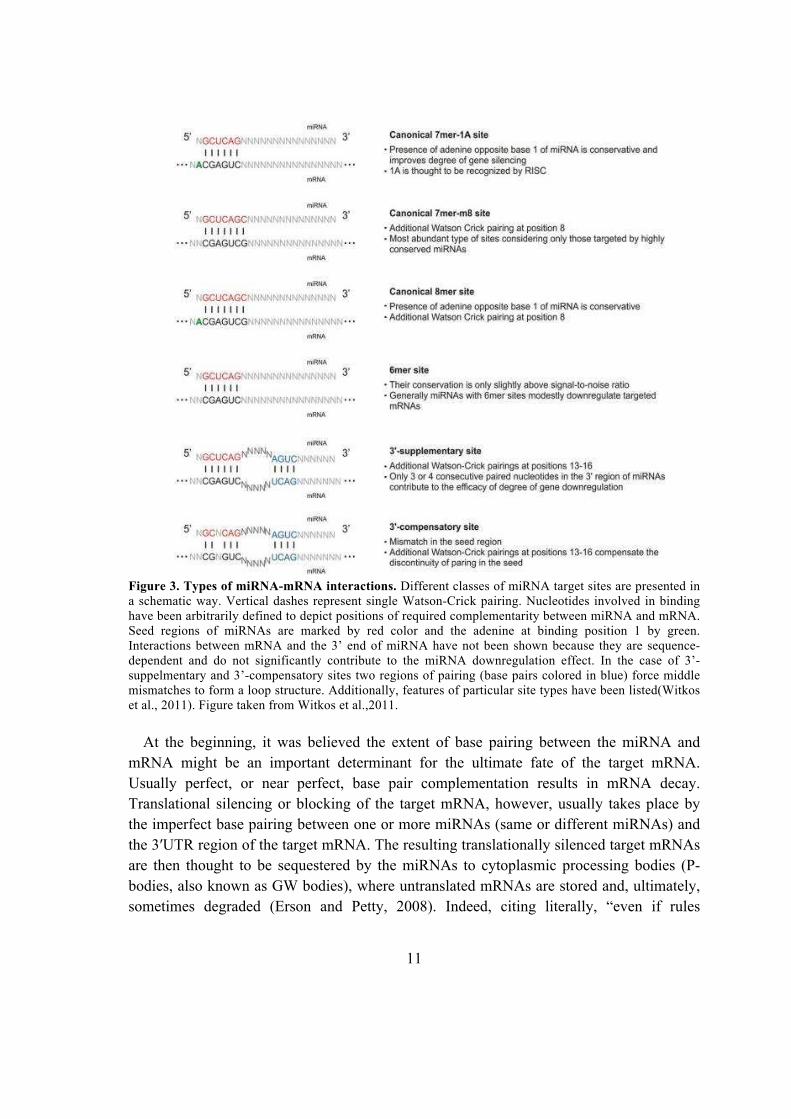
region) and 3’ part of miRNA and distinguishes three sites types (Figure 3): 1) canonical,
2) 3’-supplementary and 3) 3’-compensatory sites (Witkos et al., 2011).
Canonical sites have a complete pairing within the seed region. There are three major
types of canonical sites: the 7mer1A that has an adenine in position 1 at the 5’ end of
miRNA, the 8mer having matched adenine in position 1 and an additional match in position
8 and the 7mer-m8 that has a match in position 8. A minor class of canonical sites are
represented by 6-nt seed which modestly downregulate targeted mRNA. miRNA-mRNA
bound by a canonical site at the 5’ of miRNA can have an additional pairing also at the 3’
with its corresponding mRNA, the so-called 3’-supplementary site. This site type usually
has a less profound effect on target recognition and its efficiency. 3’ compensatory sites
required 3-4 nt consecutively paired in positions 13-16 of miRNA for enhancing the
effectiveness of miRNA-mRNA interaction which facilitate target prediction and may
compensate possible discontinuity of seed pairing (Witkos et al., 2011).
11
Figure 3. Types of miRNA-mRNA interactions. Different classes of miRNA target sites are presented in
a schematic way. Vertical dashes represent single Watson-Crick pairing. Nucleotides involved in binding
have been arbitrarily defined to depict positions of required complementarity between miRNA and mRNA.
Seed regions of miRNAs are marked by red color and the adenine at binding position 1 by green.
Interactions between mRNA and the 3’ end of miRNA have not been shown because they are sequence-
dependent and do not significantly contribute to the miRNA downregulation effect. In the case of 3’-
suppelmentary and 3’-compensatory sites two regions of pairing (base pairs colored in blue) force middle
mismatches to form a loop structure. Additionally, features of particular site types have been listed(Witkos
et al., 2011). Figure taken from Witkos et al.,2011.
At the beginning, it was believed the extent of base pairing between the miRNA and
mRNA might be an important determinant for the ultimate fate of the target mRNA.
Usually perfect, or near perfect, base pair complementation results in mRNA decay.
Translational silencing or blocking of the target mRNA, however, usually takes place by
the imperfect base pairing between one or more miRNAs (same or different miRNAs) and
the 3′UTR region of the target mRNA. The resulting translationally silenced target mRNAs
are then thought to be sequestered by the miRNAs to cytoplasmic processing bodies (P-
bodies, also known as GW bodies), where untranslated mRNAs are stored and, ultimately,
sometimes degraded (Erson and Petty, 2008). Indeed, citing literally, “even if rules

12
involving Watson–Crick hybridization of microRNAs with mRNAs have generated great
interest and researchers ardently seek simplifying principles, nature seems very
uncooperative” (Jeffries et al., 2010). Furthermore, nowadays the relation between base-
complementary and mode of action is controversial, and this vision is surpassed. Analysis
of the miRNA target sites indicated that genes with longer 3’ UTRs usually have higher
density of miRNA-binding sites and are mainly involved in developmental modulations,
whereas genes with shorter 3’ UTRs usually have lower density of miRNA-binding sites
and tend to be involved in basic cellular processes. This might be also related to shortening
of 3’UTR in the oncogene in tumor to escape their repression (Mayr and Bartel, 2009).
Some evidence show a small subset of miRNAs exert repression regulation by specifically
targeting the 5’ UTR of some mRNAs suggesting many miRNAs may contain significant
interaction sites with mRNA 5’-UTR and 3’-UTR motifs through their 3’- and 5’-end
sequences, respectively (Cai et al., 2009).
To date few miRNAs have been shown to be prone to RNA editing providing another
layer of regulatory controls within the complex network of RNA-mediated gene functions.
RNA editing can display a micro-regulatory role in controlling the miRNA-processing
machinery since it contributes to the generation of different mature miRNAs from identical
miRNA transcripts that may silence a set of genes different from those target by the
unedited miRNA, potentially targeting a different set of genes due to RNA editing in
different tissues (tissue-specific RNA editing) (Cai et al., 2009; Erson and Petty, 2008).
Single nucleotide polymorphisms (SNP), created by changes in DNA sequences of
miRNA-coding genes or in an miRNA-binding site in mRNAs, are recently emerged to
affect the biogenesis and function of miRNA. Many miRNA polymorphisms are shown to
be associated with disease because of a gain- or a loss-of function of miRNAs on mRNAs
(Cai et al., 2009).
All these findings increase the complexity of mechanisms by which miRNA regulate
gene expressions and highlight how much investigation are needed to illustrate the
functional circuits that are critical to cellular processes.
3.2.3. MicroRNA targets prediction
Target mRNAs of miRNAs can be predicted by computational methods, developed
according to our understanding of miRNA regulatory functions. Current target prediction
programs depend on the information from sequence, structure associated free energy and
evolutionary conservation to predict candidate mRNAs. Different computational miRNA
finding strategies have been planned based on the conserved sequences present amongst the
different species that can both fold into extended hairpins and are also present in intergenic
locations. Availability of full genome databases of several organisms has further enabled in
the development of better informatics based approaches. In recent years, a number of
13
programs and bioinformatics tools have been developed and used successfully for the
identification and analysis of miRNAs and their targets (Shruti et al., 2011). These
algorithms can be divided into two main classes established on the basis of the use or not of
the target site conservation, influencing the output by narrowing the results. The algorithms
based on conservation criteria are for example miRanda, Targetscan, Pictar, Diana-microT
while PITA and rna22 belong to the algorithms using thermodynamic stability of
miRNA:mRNA hybrid, seed complementarity, multiple target site, and free energy of
binding sites(Witkos et al., 2011).
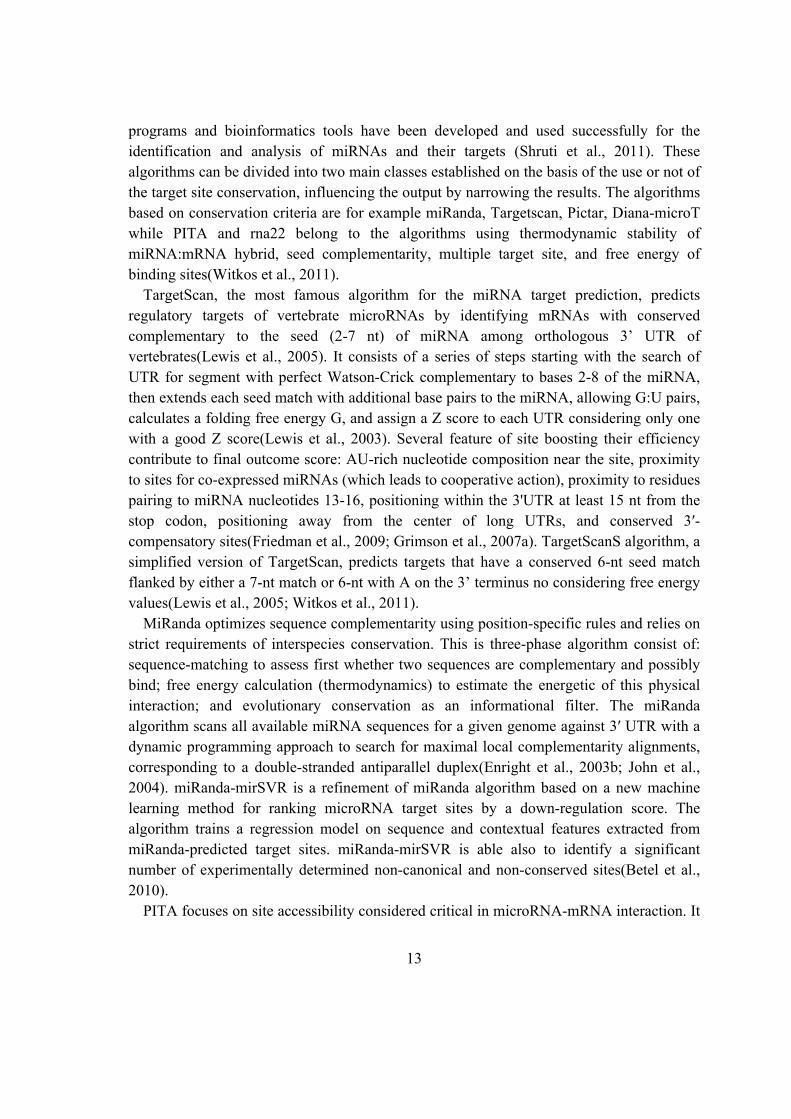
TargetScan, the most famous algorithm for the miRNA target prediction, predicts
regulatory targets of vertebrate microRNAs by identifying mRNAs with conserved
complementary to the seed (2-7 nt) of miRNA among orthologous 3’ UTR of
vertebrates(Lewis et al., 2005). It consists of a series of steps starting with the search of
UTR for segment with perfect Watson-Crick complementary to bases 2-8 of the miRNA,
then extends each seed match with additional base pairs to the miRNA, allowing G:U pairs,
calculates a folding free energy G, and assign a Z score to each UTR considering only one
with a good Z score(Lewis et al., 2003). Several feature of site boosting their efficiency
contribute to final outcome score: AU-rich nucleotide composition near the site, proximity
to sites for co-expressed miRNAs (which leads to cooperative action), proximity to residues
pairing to miRNA nucleotides 13-16, positioning within the 3'UTR at least 15 nt from the
stop codon, positioning away from the center of long UTRs, and conserved 3′-
compensatory sites(Friedman et al., 2009; Grimson et al., 2007a). TargetScanS algorithm, a
simplified version of TargetScan, predicts targets that have a conserved 6-nt seed match
flanked by either a 7-nt match or 6-nt with A on the 3’ terminus no considering free energy
values(Lewis et al., 2005; Witkos et al., 2011).
MiRanda optimizes sequence complementarity using position-specific rules and relies on
strict requirements of interspecies conservation. This is three-phase algorithm consist of:
sequence-matching to assess first whether two sequences are complementary and possibly
bind; free energy calculation (thermodynamics) to estimate the energetic of this physical
interaction; and evolutionary conservation as an informational filter. The miRanda
algorithm scans all available miRNA sequences for a given genome against 3′ UTR with a
dynamic programming approach to search for maximal local complementarity alignments,
corresponding to a double-stranded antiparallel duplex(Enright et al., 2003b; John et al.,
2004). miRanda-mirSVR is a refinement of miRanda algorithm based on a new machine
learning method for ranking microRNA target sites by a down-regulation score. The
algorithm trains a regression model on sequence and contextual features extracted from
miRanda-predicted target sites. miRanda-mirSVR is able also to identify a significant
number of experimentally determined non-canonical and non-conserved sites(Betel et al.,
2010).
PITA focuses on site accessibility considered critical in microRNA-mRNA interaction. It
14
is a parameter-free model for microRNA-target interaction that computes the difference
between the free energy gained from the formation of the microRNA-target duplex and the
energetic cost of unpairing the target to make it accessible to the microRNA(Kertesz et al.,
2007).
Comparative evaluations of different target prediction methods provided some kind of
ranking of the sensitivity of different algorithm (Bagga et al., 2005; Lim et al., 2005; Wu
and Belasco, 2008), but all available software produces a large fraction of false positive
predictions. This might be due not only to the limited comprehension of the molecular basis
and effect of miRNA-target pairing, but also to context dependency of post-transcriptional
regulation. Thus, the integration of target predictions with miRNA and target mRNA
expression profiles has been proposed to select functional miRNA-mRNA relationships,
according to increasing experimental evidences which supported the miRNA mechanism of
target degradation rather than translational repression.
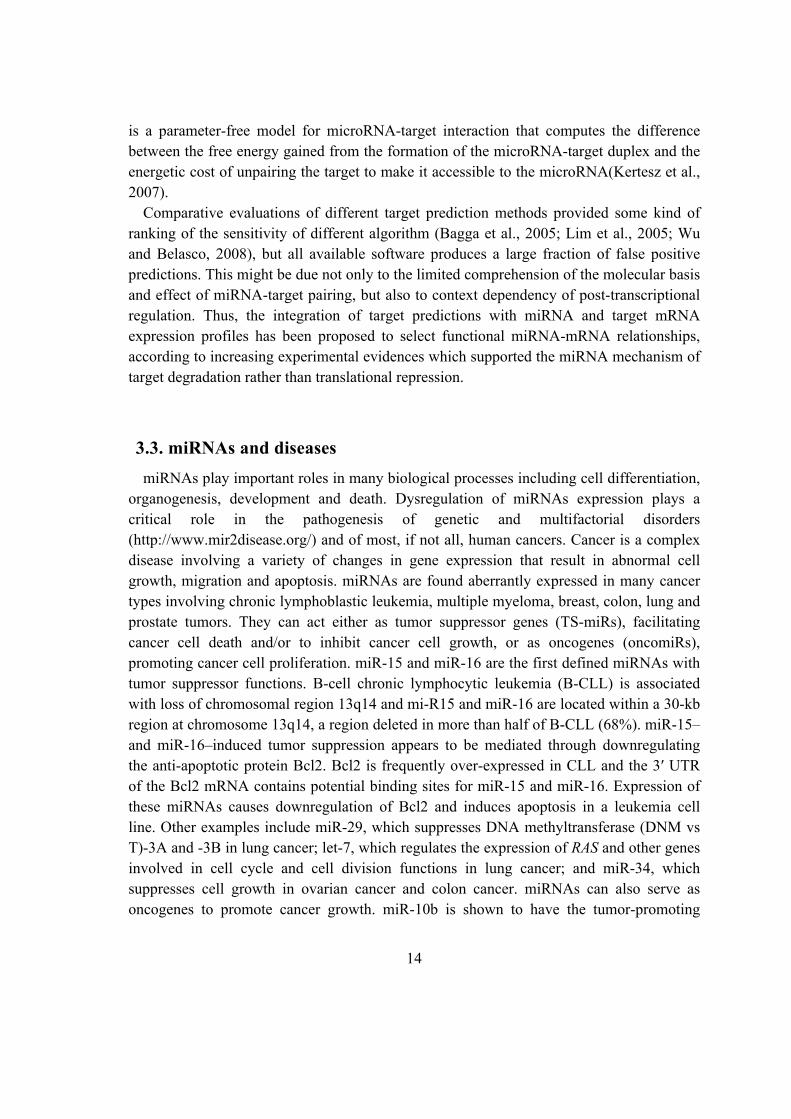
3.3. miRNAs and diseases
miRNAs play important roles in many biological processes including cell differentiation,
organogenesis, development and death. Dysregulation of miRNAs expression plays a
critical role in the pathogenesis of genetic and multifactorial disorders
(http://www.mir2disease.org/) and of most, if not all, human cancers. Cancer is a complex
disease involving a variety of changes in gene expression that result in abnormal cell
growth, migration and apoptosis. miRNAs are found aberrantly expressed in many cancer
types involving chronic lymphoblastic leukemia, multiple myeloma, breast, colon, lung and
prostate tumors. They can act either as tumor suppressor genes (TS-miRs), facilitating
cancer cell death and/or to inhibit cancer cell growth, or as oncogenes (oncomiRs),
promoting cancer cell proliferation. miR-15 and miR-16 are the first defined miRNAs with
tumor suppressor functions. B-cell chronic lymphocytic leukemia (B-CLL) is associated
with loss of chromosomal region 13q14 and mi-R15 and miR-16 are located within a 30-kb
region at chromosome 13q14, a region deleted in more than half of B-CLL (68%). miR-15–
and miR-16–induced tumor suppression appears to be mediated through downregulating
the anti-apoptotic protein Bcl2. Bcl2 is frequently over-expressed in CLL and the 3′ UTR
of the Bcl2 mRNA contains potential binding sites for miR-15 and miR-16. Expression of
these miRNAs causes downregulation of Bcl2 and induces apoptosis in a leukemia cell
line. Other examples include miR-29, which suppresses DNA methyltransferase (DNM vs
T)-3A and -3B in lung cancer; let-7, which regulates the expression of RAS and other genes
involved in cell cycle and cell division functions in lung cancer; and miR-34, which
suppresses cell growth in ovarian cancer and colon cancer. miRNAs can also serve as
oncogenes to promote cancer growth. miR-10b is shown to have the tumor-promoting
15
activity in cancer metastasis; it is over-expressed in metastatic breast cancer cells and
promotes cell migration and invasion. The transcription of miR-10b is regulated by the
transcription factor Twist, and the downstream targets of miR-10b include homeobox D10.
The inhibition of homeobox D10 by miR-10b increases the expression of RHOC, a well-
characterized pro-metastatic gene, leading to tumor cell invasion and metastasis. Other
miRNAs as oncogenes include miR-17 clusters in B-cell lymphoma, miR-21 in
glioblastoma, and miR-373 and miR-520c as metastasis-promoting miRNAs. miRNA
clusters also are emerged implicated in many cancer type. A well-studied miRNA cluster,
miR-17-92, consists of 7 individual miRNAs encoded from a frequently amplified locus at
13q31.3 in B-cell lymphomas. It was shown miRNAs of this cluster only altogether can
enhance tumorigenesis by inhibition of apoptosis in tumors(Li et al., 2009).
Recently, miR-16 has been found to be involved in polycytemia vera development and
functional experiments showed that miR-16 silencing is able to prevent erythroid colony
formation in vitro and erythrocytosis in vivo(Guglielmelli et al., 2011).
miRNAs also participate in the regulation of differentiation and growth of cardiac cells,
and it is hypothesize that miRNAs involved in cardiac hypertrophy and heart failure. Other
evidence correlates miRNA dysfunction with metabolic, immune, and inflammatory
disorders.
In conclusion, miRNAs are emerged as possible therapeutic targets for a large number of
diseases and can use as a novel clinical method to monitor the progression, prognosis,
diagnosis, and evaluation of treatment responses(Li et al., 2009; Wang, 2010; Zhang,
2008).
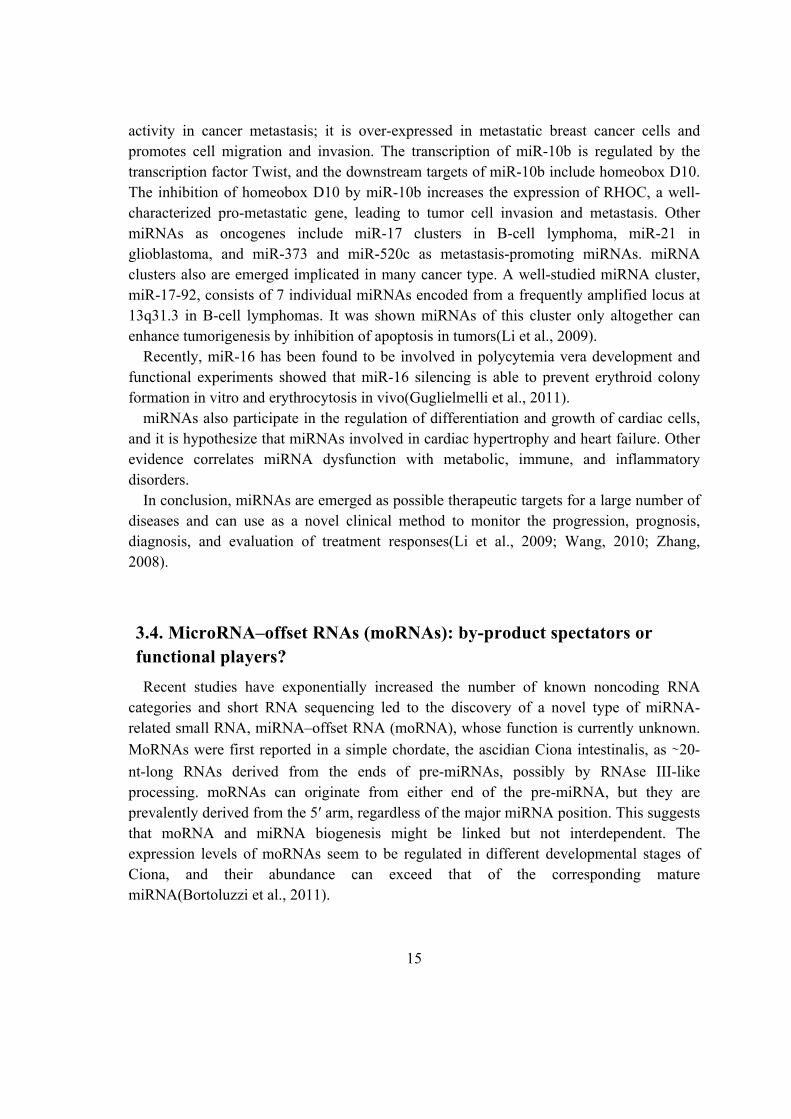
3.4. MicroRNA–offset RNAs (moRNAs): by-product spectators or
functional players?
Recent studies have exponentially increased the number of known noncoding RNA
categories and short RNA sequencing led to the discovery of a novel type of miRNA-
related small RNA, miRNA–offset RNA (moRNA), whose function is currently unknown.
MoRNAs were first reported in a simple chordate, the ascidian Ciona intestinalis, as ∼20-
nt-long RNAs derived from the ends of pre-miRNAs, possibly by RNAse III-like
processing. moRNAs can originate from either end of the pre-miRNA, but they are
prevalently derived from the 5′ arm, regardless of the major miRNA position. This suggests
that moRNA and miRNA biogenesis might be linked but not interdependent. The
expression levels of moRNAs seem to be regulated in different developmental stages of
Ciona, and their abundance can exceed that of the corresponding mature
miRNA(Bortoluzzi et al., 2011).
16
3.4.1. moRNA discovery by massive sequencing of short RNAs
For both intragenic and intergenic (single or clustered) miRNAs, primary miRNAs are
transcribed, edited and cleaved in the nucleus to generate hairpin precursors that are
exported to the cytoplasm, where maturation takes place (Winter et al., 2009b). Dicer
cleaves the pre-miRNA hairpin to produce an miRNA duplex (~22 nt), which is
incorporated into the RNA-induced silencing complex (RISC). The RISC recognizes the
duplex, unwinds it, selects the guide miRNA strand (while degrading the passenger
strand) and mediates recognition of target RNAs. In some cases, both miRNAs are
expressed and can differentially contribute to the regulation of cellular activities.
The application of deep sequencing technologies (RNAseq) to short RNAs facilitated the
identification and expression quantification of known miRNAs, as well as the discovery
of new miRNAs; the number of miRNAs identified increased by at least 50% in the last
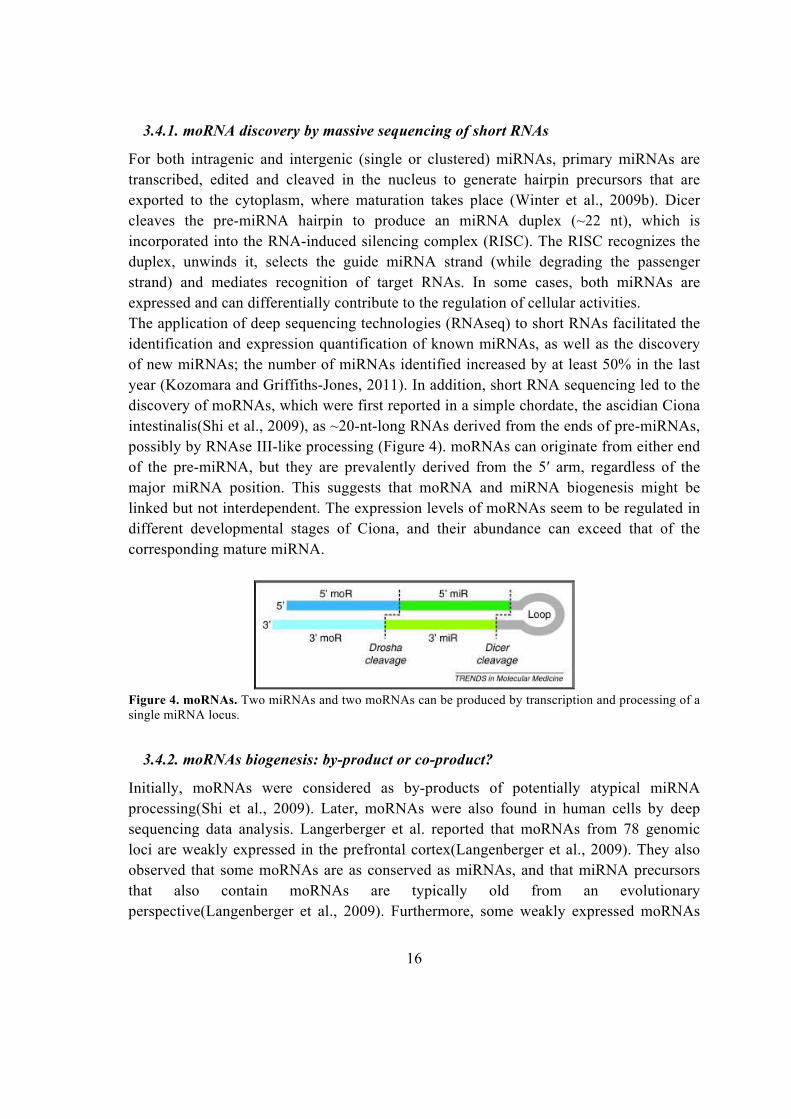
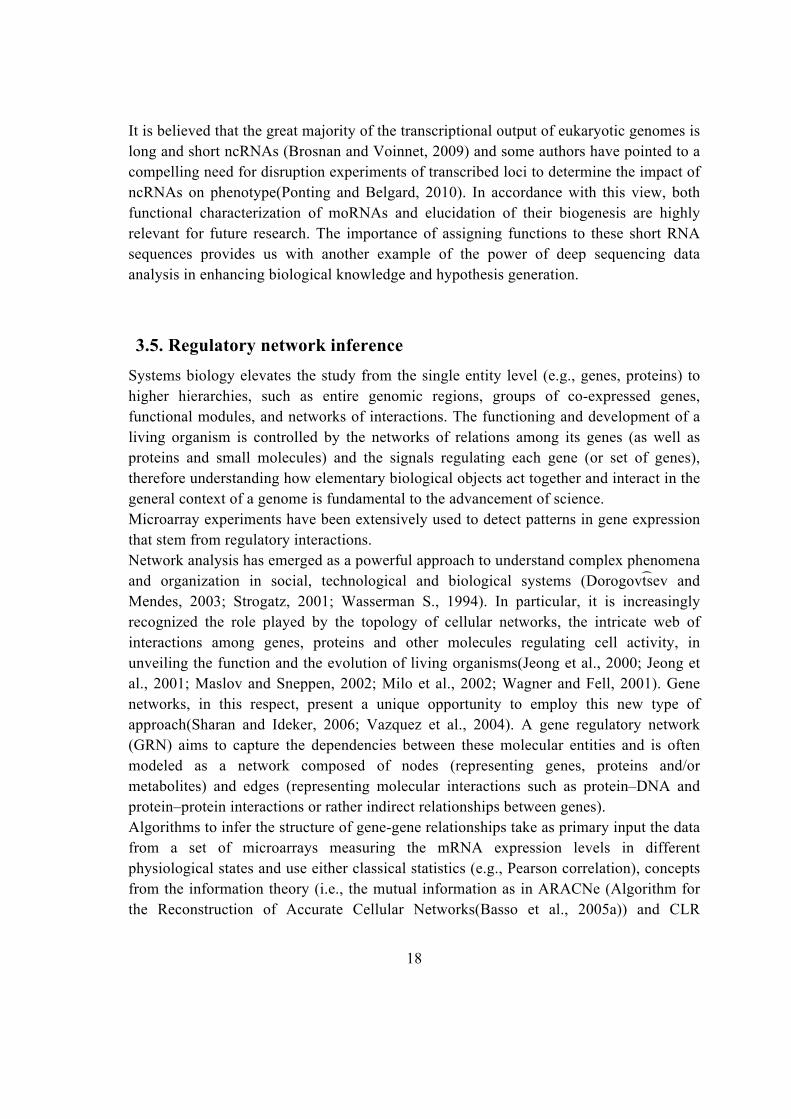
year (Kozomara and Griffiths-Jones, 2011). In addition, short RNA sequencing led to the
discovery of moRNAs, which were first reported in a simple chordate, the ascidian Ciona
intestinalis(Shi et al., 2009), as ~20-nt-long RNAs derived from the ends of pre-miRNAs,
possibly by RNAse III-like processing (Figure 4). moRNAs can originate from either end
of the pre-miRNA, but they are prevalently derived from the 5′ arm, regardless of the
major miRNA position. This suggests that moRNA and miRNA biogenesis might be
linked but not interdependent. The expression levels of moRNAs seem to be regulated in
different developmental stages of Ciona, and their abundance can exceed that of the
corresponding mature miRNA.
Figure 4. moRNAs. Two miRNAs and two moRNAs can be produced by transcription and processing of a
single miRNA locus.
3.4.2. moRNAs biogenesis: by-product or co-product?
Initially, moRNAs were considered as by-products of potentially atypical miRNA
processing(Shi et al., 2009). Later, moRNAs were also found in human cells by deep
sequencing data analysis. Langerberger et al. reported that moRNAs from 78 genomic
loci are weakly expressed in the prefrontal cortex(Langenberger et al., 2009). They also
observed that some moRNAs are as conserved as miRNAs, and that miRNA precursors
that also contain moRNAs are typically old from an evolutionary
perspective(Langenberger et al., 2009). Furthermore, some weakly expressed moRNAs
17
have been found in solid tumors, together with other small RNAs(Meiri et al., 2010).
Subsequently, moRNAs that lie immediately 5′ or 3′ of a viral miRNA were discovered
by small RNA sequencing in the B cell line BC-3 infected with Kaposi's sarcoma-
associated herpes virus(Umbach and Cullen, 2010) and in rhadinovirus-infected tumor
samples from rhesus macaques. A study investigating different types of tiny RNAs
localized in nuclear or cytoplasmic RNA fractions of THP-1 cells (a human acute
monocytic leukemia cell line) showed that moRNAs are 18-fold enriched in the nucleus
and are predominantly derived from the 5′ arm of the precursor(Taft et al., 2010).
Recently, Drosophila melanogaster miRNAs were deeply annotated using more than 1
billion reads from 187 short RNA libraries(Berezikov et al., 2011b). In this way, five-
phased miRNA loci were identified (e.g. the locus dme-mir-277 produces the following:
5′ moR, miR-277, expressed loop, miR-277 and 3′ moR).
moRNAs are generally included in the miRNA hairpin precursor, and in some cases the
moRNA overlaps the miRNA position by a few nucleotides(Langenberger et al., 2009).
Other moRNAs that overhang the miRNA hairpin can be produced by non-canonical
Drosha processing(Berezikov et al., 2011b). Thus, it is not clear how the two ends of
moRNAs arise and if or how Drosha and Dicer are involved. moRNAs seem to be
conserved across species, the conservation extent correlates with expression level (Shi et
al., 2009) and expression levels of certain moRNAs are greater than for their
corresponding miRNA(Umbach et al., 2010). In addition, moRNAs are prevalently
produced by the 5′ arm of the precursor, independent of which arm produces the most
expressed mature miRNA (Langenberger et al., 2009) and (Umbach et al., 2010). This
evidence suggests that moRNAs might be miRNA co-products, representing a distinct
functional class of miRNA-related agents (Berezikov et al., 2011a).
3.4.3. The functions of moRNAs are unknown at present
The hypothesis that moRNAs are a new class of functional regulators whose qualitative
alteration and/or expression dysregulation might impact on human diseases is intriguing,
but evidence regarding possible moRNA functions is still fragmentary. Umbach and
colleagues used a luciferase-based indicator assay to demonstrate that a viral moRNA
(moR-rR1-3-5p) has moderate inhibitory activity against an artificial mRNA bearing a
perfect target site (Langenberger et al., 2009). In this case, an moRNA might guide RISC
to complementary target mRNAs, acting as an miRNA. Nevertheless, moRNA
enrichment observed in the nucleus (Taft et al., 2010) might indicate that some moRNAs
play a different role specifically related to nuclear processes. It is known that specific
miRNAs, such as miR-29b, are re-imported into the nucleus where they might be
transcriptional regulators(Winter et al., 2009a). Similarly, other nuclear tiny RNAs are
associated with transcript initiation and splice sites(Taft et al., 2010).
18
It is believed that the great majority of the transcriptional output of eukaryotic genomes is
long and short ncRNAs (Brosnan and Voinnet, 2009) and some authors have pointed to a
compelling need for disruption experiments of transcribed loci to determine the impact of
ncRNAs on phenotype(Ponting and Belgard, 2010). In accordance with this view, both
functional characterization of moRNAs and elucidation of their biogenesis are highly
relevant for future research. The importance of assigning functions to these short RNA
sequences provides us with another example of the power of deep sequencing data
analysis in enhancing biological knowledge and hypothesis generation.
3.5. Regulatory network inference
Systems biology elevates the study from the single entity level (e.g., genes, proteins) to
higher hierarchies, such as entire genomic regions, groups of co-expressed genes,
functional modules, and networks of interactions. The functioning and development of a
living organism is controlled by the networks of relations among its genes (as well as
proteins and small molecules) and the signals regulating each gene (or set of genes),
therefore understanding how elementary biological objects act together and interact in the
general context of a genome is fundamental to the advancement of science.
Microarray experiments have been extensively used to detect patterns in gene expression
that stem from regulatory interactions.
Network analysis has emerged as a powerful approach to understand complex phenomena
and organization in social, technological and biological systems (Dorogovt͡ sev and
Mendes, 2003; Strogatz, 2001; Wasserman S., 1994). In particular, it is increasingly
recognized the role played by the topology of cellular networks, the intricate web of
interactions among genes, proteins and other molecules regulating cell activity, in
unveiling the function and the evolution of living organisms(Jeong et al., 2000; Jeong et
al., 2001; Maslov and Sneppen, 2002; Milo et al., 2002; Wagner and Fell, 2001). Gene
networks, in this respect, present a unique opportunity to employ this new type of
approach(Sharan and Ideker, 2006; Vazquez et al., 2004). A gene regulatory network
(GRN) aims to capture the dependencies between these molecular entities and is often
modeled as a network composed of nodes (representing genes, proteins and/or
metabolites) and edges (representing molecular interactions such as protein–DNA and
protein–protein interactions or rather indirect relationships between genes).
Algorithms to infer the structure of gene-gene relationships take as primary input the data
from a set of microarrays measuring the mRNA expression levels in different
physiological states and use either classical statistics (e.g., Pearson correlation), concepts
from the information theory (i.e., the mutual information as in ARACNe (Algorithm for
the Reconstruction of Accurate Cellular Networks(Basso et al., 2005a)) and CLR
19
algorithms(Faith et al., 2007)) or probabilistic models (as in the Bayesian networks) to
reconstruct the network of transcriptional interactions.
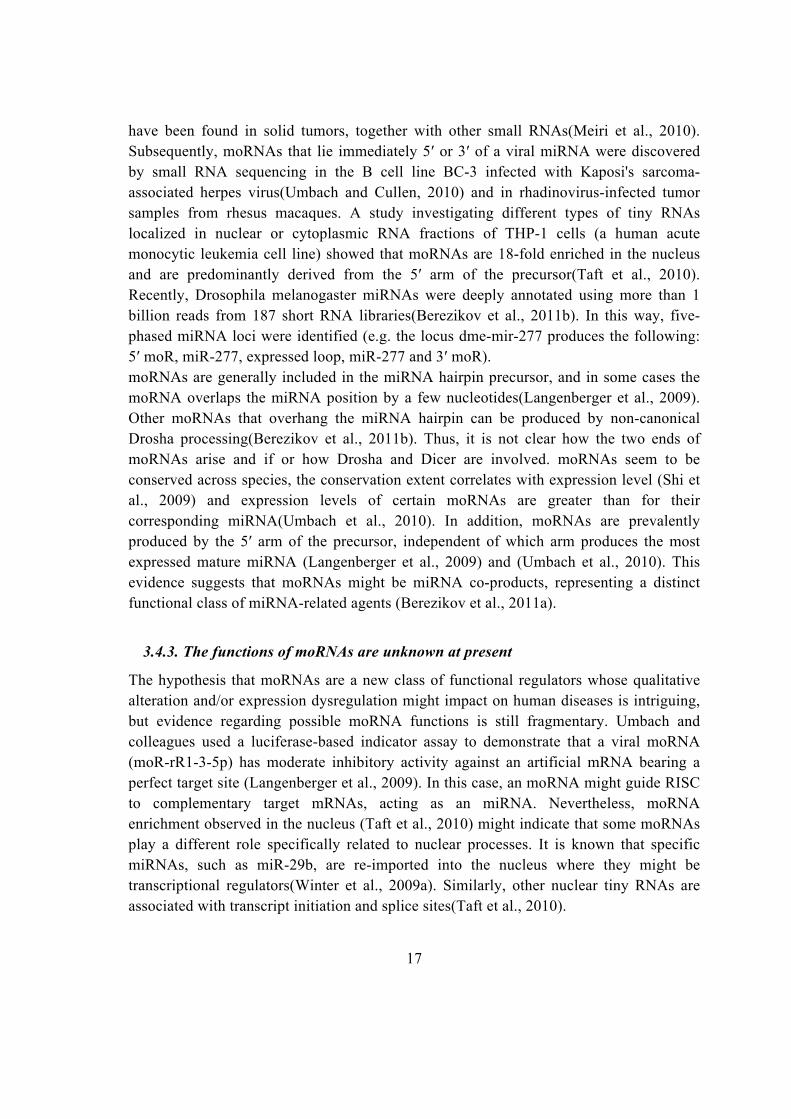
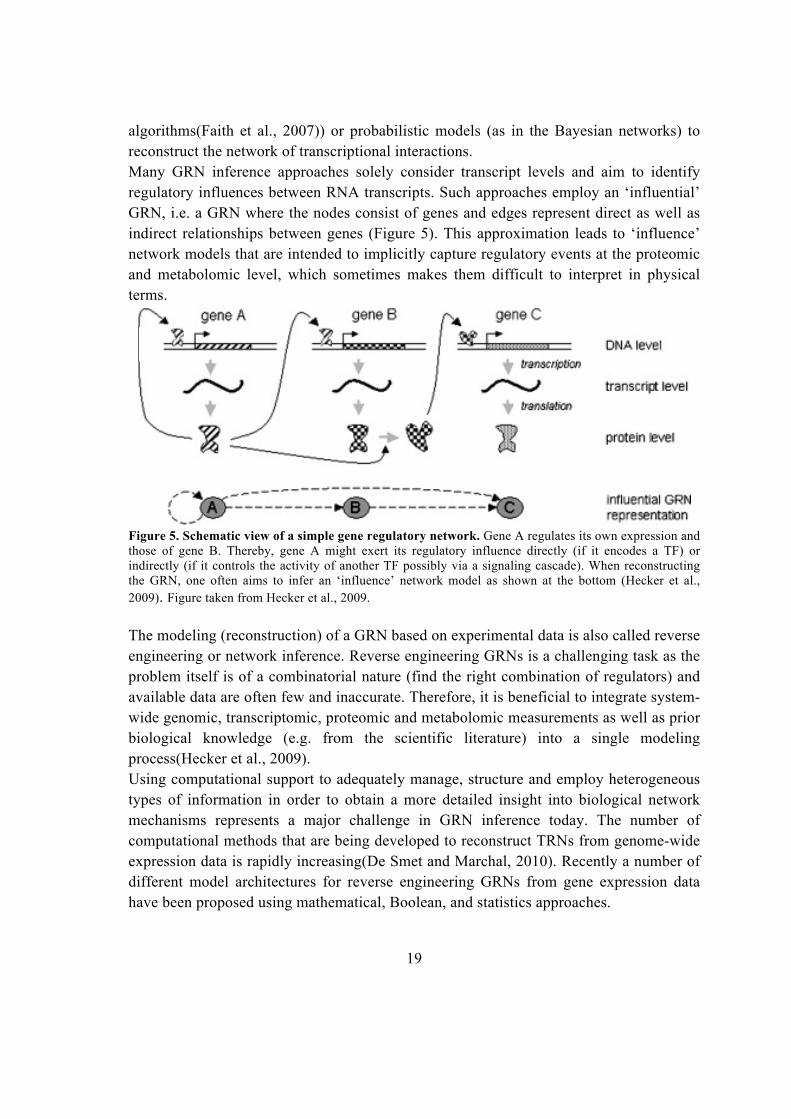
Many GRN inference approaches solely consider transcript levels and aim to identify
regulatory influences between RNA transcripts. Such approaches employ an ‘influential’
GRN, i.e. a GRN where the nodes consist of genes and edges represent direct as well as
indirect relationships between genes (Figure 5). This approximation leads to ‘influence’
network models that are intended to implicitly capture regulatory events at the proteomic
and metabolomic level, which sometimes makes them difficult to interpret in physical
terms.
Figure 5. Schematic view of a simple gene regulatory network. Gene A regulates its own expression and
those of gene B. Thereby, gene A might exert its regulatory influence directly (if it encodes a TF) or
indirectly (if it controls the activity of another TF possibly via a signaling cascade). When reconstructing
the GRN, one often aims to infer an ‘influence’ network model as shown at the bottom (Hecker et al.,
2009). Figure taken from Hecker et al., 2009.
The modeling (reconstruction) of a GRN based on experimental data is also called reverse
engineering or network inference. Reverse engineering GRNs is a challenging task as the
problem itself is of a combinatorial nature (find the right combination of regulators) and
available data are often few and inaccurate. Therefore, it is beneficial to integrate system-
wide genomic, transcriptomic, proteomic and metabolomic measurements as well as prior
biological knowledge (e.g. from the scientific literature) into a single modeling
process(Hecker et al., 2009).
Using computational support to adequately manage, structure and employ heterogeneous
types of information in order to obtain a more detailed insight into biological network
mechanisms represents a major challenge in GRN inference today. The number of
computational methods that are being developed to reconstruct TRNs from genome-wide
expression data is rapidly increasing(De Smet and Marchal, 2010). Recently a number of
different model architectures for reverse engineering GRNs from gene expression data
have been proposed using mathematical, Boolean, and statistics approaches.
20
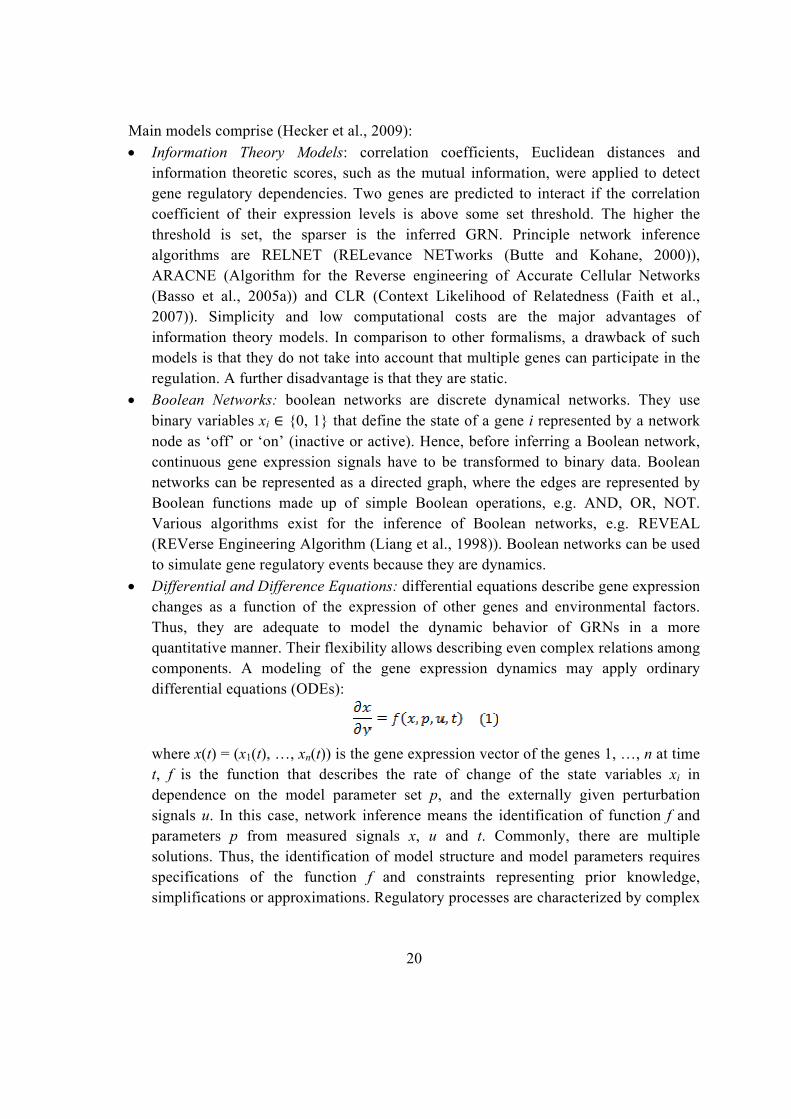
Main models comprise (Hecker et al., 2009):
• Information Theory Models: correlation coefficients, Euclidean distances and
information theoretic scores, such as the mutual information, were applied to detect
gene regulatory dependencies. Two genes are predicted to interact if the correlation
coefficient of their expression levels is above some set threshold. The higher the
threshold is set, the sparser is the inferred GRN. Principle network inference
algorithms are RELNET (RELevance NETworks (Butte and Kohane, 2000)),
ARACNE (Algorithm for the Reverse engineering of Accurate Cellular Networks
(Basso et al., 2005a)) and CLR (Context Likelihood of Relatedness (Faith et al.,
2007)). Simplicity and low computational costs are the major advantages of
information theory models. In comparison to other formalisms, a drawback of such
models is that they do not take into account that multiple genes can participate in the
regulation. A further disadvantage is that they are static.
• Boolean Networks: boolean networks are discrete dynamical networks. They use
binary variables xi {0, 1} that define the state of a gene i represented by a network
node as ‘off’ or ‘on’ (inactive or active). Hence, before inferring a Boolean network,
continuous gene expression signals have to be transformed to binary data. Boolean
networks can be represented as a directed graph, where the edges are represented by
Boolean functions made up of simple Boolean operations, e.g. AND, OR, NOT.
Various algorithms exist for the inference of Boolean networks, e.g. REVEAL
(REVerse Engineering Algorithm (Liang et al., 1998)). Boolean networks can be used
to simulate gene regulatory events because they are dynamics.
• Differential and Difference Equations: differential equations describe gene expression
changes as a function of the expression of other genes and environmental factors.
Thus, they are adequate to model the dynamic behavior of GRNs in a more
quantitative manner. Their flexibility allows describing even complex relations among
components. A modeling of the gene expression dynamics may apply ordinary
differential equations (ODEs):
where x(t) = (x1(t), …, xn(t)) is the gene expression vector of the genes 1, …, n at time
t, f is the function that describes the rate of change of the state variables xi in
dependence on the model parameter set p, and the externally given perturbation
signals u. In this case, network inference means the identification of function f and
parameters p from measured signals x, u and t. Commonly, there are multiple
solutions. Thus, the identification of model structure and model parameters requires
specifications of the function f and constraints representing prior knowledge,
simplifications or approximations. Regulatory processes are characterized by complex
21
non-linear dynamics, but mainly GRN inference approaches based on differential
equations consider linear models or are limited to very specific types of non-linear
functions.
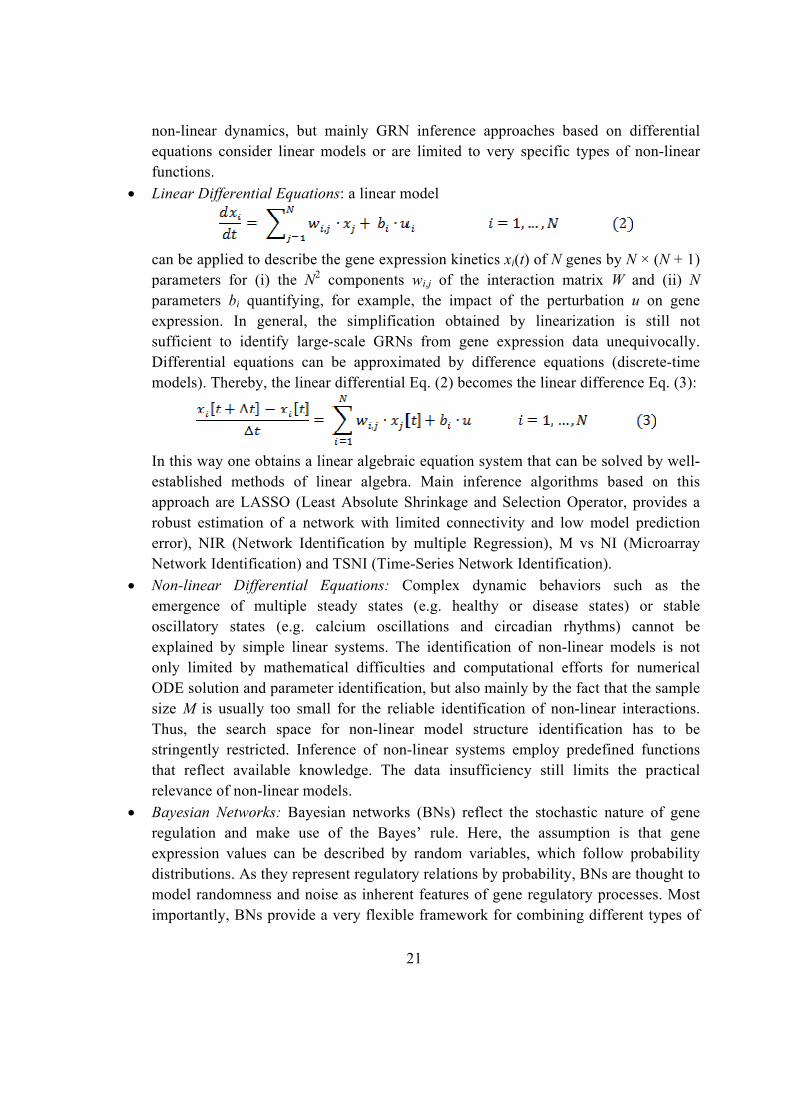
• Linear Differential Equations: a linear model
can be applied to describe the gene expression kinetics xi(t) of N genes by N × (N + 1)
parameters for (i) the N2 components wi,j of the interaction matrix W and (ii) N
parameters bi quantifying, for example, the impact of the perturbation u on gene
expression. In general, the simplification obtained by linearization is still not
sufficient to identify large-scale GRNs from gene expression data unequivocally.
Differential equations can be approximated by difference equations (discrete-time
models). Thereby, the linear differential Eq. (2) becomes the linear difference Eq. (3):
In this way one obtains a linear algebraic equation system that can be solved by well-
established methods of linear algebra. Main inference algorithms based on this
approach are LASSO (Least Absolute Shrinkage and Selection Operator, provides a
robust estimation of a network with limited connectivity and low model prediction
error), NIR (Network Identification by multiple Regression), M vs NI (Microarray
Network Identification) and TSNI (Time-Series Network Identification).
• Non-linear Differential Equations: Complex dynamic behaviors such as the
emergence of multiple steady states (e.g. healthy or disease states) or stable
oscillatory states (e.g. calcium oscillations and circadian rhythms) cannot be
explained by simple linear systems. The identification of non-linear models is not
only limited by mathematical difficulties and computational efforts for numerical
ODE solution and parameter identification, but also mainly by the fact that the sample
size M is usually too small for the reliable identification of non-linear interactions.
Thus, the search space for non-linear model structure identification has to be
stringently restricted. Inference of non-linear systems employ predefined functions
that reflect available knowledge. The data insufficiency still limits the practical
relevance of non-linear models.
• Bayesian Networks: Bayesian networks (BNs) reflect the stochastic nature of gene
regulation and make use of the Bayes’ rule. Here, the assumption is that gene
expression values can be described by random variables, which follow probability
distributions. As they represent regulatory relations by probability, BNs are thought to
model randomness and noise as inherent features of gene regulatory processes. Most
importantly, BNs provide a very flexible framework for combining different types of

22
data and prior knowledge in the process of GRN inference to derive a suitable
network structure. Besides, BNs have a number of features that make them attractive
candidates for GRN modeling, such as their ability to avoid over-fitting a model to
training data and to handle incomplete noisy data as well as hidden variables (e.g. TF
activities). BNs can be learned based on discrete (often Boolean) and continuous
expression levels.
The discovery of small RNAs adding a novel level of post-transcriptional gene regulation
of different biological processes and systematic integration of various high-throughput
datasets was proposed to analyze the transcriptional activity of microRNAs.
Cheng et al. (Cheng et al., 2011) planned the reconstruction of an integrated regulatory
network, using three major types of regulation: TF→gene, TF→miRNA and
miRNA→gene. They identified the target genes and target miRNAs for a set of TFs
based on the ChIP-Seq binding profiles, the predicted targets of miRNAs using annotated
3'UTR sequences and conservation information. Shmeier et al. combined several sources
of interaction and association data to analyse and place miRNAs within regulatory
pathways that influence human ovarian cancer (OC) suggesting a major role of miRNAs
in OC (Schmeier et al., 2011). Another example is GenMiR++, a Bayesian data analysis
algorithm that uses paired expression profiles of miRNAs and mRNAs expression data to
identify functional miRNA-target relationships and directed research in this area is of
utmost importance to enhance our understanding of the molecular mechanisms underlying
biological systems.
23
4. Material and Methods
4.1. microRNAs and genes: sequences and genomic positions
The complete set of hairpin precursors of human microRNA sequences was downloaded
from miRBase version 14, thus obtaining a set of 721 pre-miRNA hairpin sequences and
904 mature miRNAs, 185 of which are tagged as “minor”, according to miRBase
annotation (i.e. hsa-miR-30e*). We obtained 49, 506 human genes and 132, 056 transcripts
sequences from ENSEMBL (version 56) each associated to a unique chromosomal
position. Hairpin miRNA sequences were aligned with the version 37.1 of the human
genome to establish their genomic positions as start and end coordinates of the aligned
region in a specific chromosome and strand. Alignments associated to at least 95%
sequence identities, calculated over the hairpin sequence length, have been considered for
miRNA genome position definition. As genomic localization is referred to hairpin
sequences whereas miRNA microarray platforms measure expression profiles of mature
miRNAs, mature miRNAs to hairpin correspondence info was used for data integration.
miRNA hairpins localizations were compared with those of protein-coding genes to
identify intragenic miRNAs, putatively transcribed from the coding gene promoter. To
define the miRNA-host gene relationships considered in further analyses, only miRNAs
fully included in genes spanned regions were considered as intragenic. Specifically, 367
miRNAs were categorized as intergenic and thus excluded, whereas 309 intragenic
miRNAs, were associated with 279 protein-coding human host genes. Among these, 23
(8.5%) include at least two miRNAs.
4.2. Biological Datasets
4.2.1. Multiple Myeloma dataset
Multiple Myeloma dataset (MM) dataset consists of matched miRNAs and genes
expression profiles from purified plasma cells of thirty-nine human samples, including 33
patients with multiple myeloma (MM), 2 with plasma cell leukemia (PCLs) and 4 normal
control samples (NCs) from healthy donors. The miRNA expression was profiled on the
Agilent Human miRNA Microarray V2(Lionetti et al., 2009). The human miRNAs data were
reannotated on Sanger Release 12.0 and normalized using the Aroma Light package for
Bioconductor. To overcome scaling biases resulting from background subtraction, the data
were converted to obtain positive values throughout the dataset, at a minimum value of 1.
24
The raw and normalized microRNA data are available through GEO accession number
GSE17498. The gene expression was profiled on Affymetrix GeneChip® Human Gene 1.0
ST Array. The raw intensity signals of genes were extracted from CEL files and normalized
using robust multi-array average (RMA) normalization method, which consists of three
steps: background correction, quantile normalization (each performed at the individual probe
level), and robust linear model fit using log-transformed intensities (at the probeset level)
implemented in the affy package for Bioconductor and re-annotated using Manhong Dai
custom cdf, HuGene10stv1_Hs_ENSG (available at
http://brainarray.mbni.med.umich.edu/Brainarray/Database/CustomCDF/12.1.0/ensg.asp).
To the reconstruction of the transcriptional regulatory network a bigger dataset of gene
expression (hereafter denoted as MM158GE) comprising 5 normal, 11 monoclonal
gammopathies of unknown significance (MGUS), 133 MM, and 9 plasma cell leukemia
(PCL) for a total of 158 samples was collected and were quantified using RMA (affy
Bioconductor package) and the GeneAnnot custom Chip Definition Files.
4.2.2. Acute Lymphoblastic Leukemia dataset
Acute Lymphoblastic Leukemia dataset (ALL) dataset consists of matched miRNA and
genes expression profiles in nineteen adult Acute Lymphoblastic Leukemia (ALL) cases,
including T-lineage and B-lineage cells, harboring specific molecular lesions (Fulci et al.,
2009)(GEO accession GSE14834). Human miRNA data obtained by Lc Sciences Human
470 miRHuman 9.0 microarray were background subtracted, quantile-normalized between
the intra-array replicates, and summarized for each microRNA as the average of its seven
repeating spots on the array. The background value was set for each array as quantified by
the service provider. Processed miRNA intensity values were normalized between-array by
quantile normalization. Quantile normalization was performed using function
normalize.quantiles from R package preprocessCore. Gene expression was profiled on
Affymetrix GeneChip® Human Genome U133 Plus 2.0 Array. The raw intensity signals of
genes were extracted from CEL files and normalized using RMA algorithm of affy package
for Bioconductor and re-annotated using Manhong Dai custom cdf,
HGU133Plus2_Hs_ENSG (available at
http://brainarray.mbni.med.umich.edu/Brainarray/Database/CustomCDF/12.1.0/ensg.asp).
4.2.3. Normal and Alzheimer's parietal lobe cortex
Normal and Alzheimer's parietal lobe cortex (ALZ) dataset consists of 16 matched
miRNA and gene expression experiments, obtained by USC/XJZ Human 0.9 K miRNA-
940-v1.0 and Affymetrix Human Genome U133 Plus 2.0 Array, in parietal lobe tissue from
4 Alzheimer Disease patients and 4 age-matched controls (GSE16759)(Nunez-Iglesias et
25
al., 2010). The raw intensity signals of genes were extracted from CEL files, normalized
using RMA algorithm of affy package for Bioconductor, and re-annotated using Manhong
Dai custom cdf, HGU133Plus2_Hs_ENSG. Human miRNA data were processed using the
same approach of gene expression reconstruction.
4.2.4. Normal prostate and prostate cancer
Normal prostate and prostate cancer (PRO) dataset consists of the subset of 140 matched
miRNA and gene expression experiments, obtained respectively by Agilent-019118 Human
miRNA Microarray 2.0 and Affymetrix Human Exon 1.0 ST, of the prostate data reported
in (Taylor et al., 2010)(GEO accession GSE21032) regarding primary and metastatic
prostate cancer samples and control normal adjacent benign prostate. Human miRNA data
were processed using the same approach suggested by the original paper. Gene expression
profiles was obtain using RMAExpress, a standalone GUI program to compute gene
expression summary values for Affymetrix Genechip data using the Robust Multichip
Average expression summary and to carry out quality assessment using probe-level
metrics.
4.2.5. Multiple cancers and normal tissues dataset
Multiple cancers and normal tissues dataset (MCN) dataset includes miRNAs expression
profiles in 32 samples from 14 different patients and 8 different tumor types, with tumor
cells and normal cells counterpart for each patient (GEO accession GSE14985). Tissue
samples were from various embryonic lineages: one pair from breast, lymphoma and
prostate; two from liver, ovary, testes and lung and three from colon: two technical
replicates are included for ovary and testes samples. MiRNA expression was profiled using
Agilent Human miRNA Microarray 2.0. Agilent's Feature Extraction software version
9.5.3.1 was used to generate GeneView files. These files contain the processed signals for
each of the 799 miRNAs on the array. For each miRNA, expression values
(gTotalGeneSignal) below the noise level (gTotalGeneError) were replaced by the value of
the corresponding total gene error. All samples were then normalized to have the same 75th
percentile value(Navon et al., 2009).
4.2.6. Colorectal cancer dataset
From the institutional colorectal database, 55 patients with colorectal cancer, who
underwent primary surgery at University of Padova, were selected. Tissue samples were
obtained from the patients during the surgical procedure. Colorectal cancer dataset
includes 78 and 80 miRNA and gene expression experiments, respectively.
26
MiRNA expression was profiled using GeneChip miRNA 1.0 Array. We used free
miRNA QC tool software from Affymetrix to normalize data and perform preliminary
quality control procedures for all miRNA experiments. miRNA expression measures were
reconstructed from .cel files by using the Robust Multichip Average (RMA) method.
miRNAs resulting detected in less than 20 samples were discarded. In this way we
obtained 309 miRNAs with expression profiles in the considered set of tissue samples,
which were considered for the following analyses.
GeneChip Human Exon 1.0 ST (Affymetrix) has been used to obtain high quality gene
expression quantification. Raw data were processed by RMAExpress, a GUI program to
compute gene expression summary values for Affymetrix Genechip® data using the
Robust Multichip Average expression summary and to carry out quality assessment using
probe-level metrics. Gene expression profiles were obtained from exon data by RMA
using EntrezGene-based custom CDF (http://brainarray.mbni.med.umich.edu/Brainarray).
Using Shannon entropy calculated on expression profiles as variability measure, 30% of
genes with less variable expression profile across considered samples were filtered out.
Quality control of miRNA and gene chips was grounded on two main PLM-based quality
statistics, Normalized Unscaled Standard Error (NUSE) and Relative Log Expression
(RLE), to assess the global quality of signals in each array, on the basis of distribution of
standard errors and of relative log of expression of the single probeset. MA plots before
and after RMA were evaluated to identify biases associated to specific classes of signal
intensity. IQR Limits option was used to visualize control limits (1.5*IQR above the
upper quartile and 1.5*IQR below the lower quartile) derived based on normal boxplot
outlier identification rules.
4.2.7. Adult T-cell leukemia lymphoma dataset
Adult T-cell leukemia lymphoma dataset (ATLL) consists of 15 matched miRNA and
gene expression experiments deriving from peripheral blood mononuclear cells (PBMC) of
7 ATLL patients (6 with leukemia, 1 with lymphoma) and from 4 resting and 4 stimulated
CD4+ cells. miRNA expressions were quantified using Agilent microRNA microarrays
(V1). Signal intensities were normalized using quantile-quantile normalization after
substituting negative values with the lowest positive value obtained for the arrays. The
distribution of signal intensities was then plotted to filter out microRNAs with weak signals
having probably no biological relevance. This procedure yielded 137 microRNAs with at
least two samples in the upper 75th percentile (corresponding to a signal intensity of
>5.91). Gene expression data for resting and stimulated CD4+ cells (sample sets A, B, D,
P) were obtained using Affymetrix hgu133plus2 arrays. ATLL samples were analyzed
using Affymetrix hgu133a2 arrays as described (Pise-Masison et al., 2009). Data were
extracted from CEL files and normalized using the RMA package for Bioconductor and
27
custom Gene-Annot-based Chip Annotation Files, Version 2.0.1 (CDF)(Ferrari et al.,
2007). Total RNA was subjected to reverse transcription and quantitative PCR to detect
known microRNAs using Applied Biosystems Taqman microRNA assays and 7900HT Fast
Real-Time PCR System according the manufacturer's protocol. Results were analyzed by
relative quantification using total RNA from freshly isolated PBMC (pooled from 3 donors)
as a calibrator and RNU44 as an endogenous control.
4.2.8. SET2 cells line dataset
SET2 cells line dataset comprises a small RNA library generated from exponentially
growing SET2 cells (DSMZ, Braunschweig, Germany) and sequenced on Illumina GAIIx.
Raw sequencing reads were obtained using Illumina’s Pipeline v1.5 software following
analysis of sequencing image by Pipeline Firecrest Module and base-calling by Pipeline
Bustard Module. Library construction and sequencing were performed at LC Sciences
(Houston, Tx; www.lcsciences.com).
4.3. Cluster analysis
Hierarchical cluster analysis on microarray data was performed on gene and miRNA
expression data to arrange gene or miRNA according to similarity in pattern of gene
expression, or arrange biological sample according to similarity in different biological
conditions or tissue types. Average-linkage method was used for clustering correlation
microarray expression matrices. The object of this algorithm is to compute a dendrogram
that assembles all elements into a single tree. For any set of n genes or miRNAs (similar
processes was computed for microarray sample), an upper-diagonal similarity matrix is
computed by using the metric described above, which contains similarity scores for all
pairs of genes. The matrix is scanned to identify the highest value (representing the most
similar pair of genes). A node is created joining these two genes, and a gene expression
profile is computed for the node by averaging observation for the joined elements (missing
values are omitted and the two joined elements are weighted by the number of genes they
contain). The similarity matrix is updated with this new node replacing the two joined
elements, and the process is repeated n-1 times until only a single element remains.
Clustering expression data were used to see how much considered biological microarray
samples groups together efficiently the same tissue type in the same biological condition or
simply similar biological condition, such as normal and tumor samples(Eisen et al., 1998).
28
4.4. miRNA and gene differential expression analysis
A Significance analysis of microarrays (SAM) was performed to identify significant
genes in a set of microarray experiments. The input to SAM is gene expression
measurements from a set of microarray experiments, as well as a response variable from
each experiment. The response variable may be a grouping like untreated, treated (either
unpaired or paired), a multiclass grouping (like breast cancer, lymphoma, colon cancer,
etc…), a quantitative variable (like blood pressure) or a possibly censored survival time.
SAM computes a statistic for each gene, measuring the strength of the relationship
between gene expression and the response variable. It uses repeated permutations of the
data to determine if the expression of any genes is significantly related to the response.
The cutoff for significance is determined by a tuning parameter delta, chosen by the user
based on the false positive rate. One can also choose a fold change parameter, to ensure
that called genes change at least a pre-specified amount(Tusher et al., 2001).
The cutoff for significance is determined by a tuning parameter delta, chosen based on the
false positive rate (FDR). We considered significant a FDR lower than to 0.01.
4.5. MicroRNA target predictions
4.5.1. miRanda
miRNA targets have been predicted applying miRanda algorithm(Enright et al., 2003a;
John et al., 2004) on human miRNA and transcript sequences of miRBase Release 123
and ENSEMBL Release 52, respectively. The score threshold of miRanda, associated
with each predicted miRNA-transcript targeting relationship and depending on the
sequence alignment and thermodynamic stability of the RNA duplex, has been set at 160.
Finally, the correspondence between ENSEMBL_transcript and EntrezGene_ID was
defined.
4.5.2. Pita
PITA algorithm was used to compute miRNA target predictions over up-to-date versions
56 and 38 of ENSEMBL and RefSeq transcript sequences, respectively. The miRNA
sequences were downloaded from mirBase version 14. Based on known transcript to gene
correspondences, gene-centered predictions were then derived combining transcript-based
results into a single group for each gene. In this way a gene is predicted target of a given
miRNA if at least one of its transcripts carries predicted target site(s)(Kertesz et al., 2007).

29
4.5.3. TargetScan
TargetScan predictions (versions 5.0 or 5.1) were downloaded from
http://www.targetscan.org. The set of microRNA-target predictions comprises both
conserved and non conserved sites that match the seed region of each miRNA(Friedman et
al., 2009).
4.6. Regulatory network reconstruction
4.6.1. Transcriptional regulatory network
The transcriptional regulatory network was reconstructed using ARACNe and gene
expression signals. ARACNe utilizes information and data transmission concepts (i.e.,
mutual information and data processing inequality) to identify statistically significant co-
regulations among genes from microarray expression profiles. Mutual information and data
processing inequality allow reconstructing gene-gene relationships which most likely
represent either direct regulatory interactions or interactions mediated by post-
transcriptional modifiers. Briefly, the algorithm first uses the expression data to calculate
pair wise Mutual Information (MI) through a computationally efficient Gaussian kernel
estimator. ARACNe calculates the kernel width depending on the size and statistics of the
dataset. The second step is the elimination of the interactions that are not statistically
significant according to a p-value or a MI threshold and returns a series of irreducible
statistical dependencies. The post-processing step eliminates interactions that are likely to
be indirect. The Data Processing Inequality (DPI) theorem removes indirect regulatory
influences that appear as direct because of a high MI score due to the presence of a
common neighbor. An additional parameter, called DPI tolerance, can be used to
compensate for errors in the MI estimate that might affect DPI application(Basso et al.,
2005a). The parameters of the kernel width and the Mutual Information threshold were
calculated using MATLAB scripts. The p-value to determine the MI threshold was set at
1e-7
, while the DPI tolerance was set equal to 10%. A list of Transcription Factors (TF) for
the platform HG-U133A was also imputed as a parameter to prevent the DPI from
removing transcriptional interactions in favor of non-transcriptional ones (interactions
between two non-TFs).
4.6.2. Integrative analysis
The integrative analysis of miRNAs and target genes expression profiles is based on the
assumption that, at least for miRNAs acting at post-transcriptional level on mRNAs
stability, for a given miRNA, true targets expression profiles are expected to be anti-
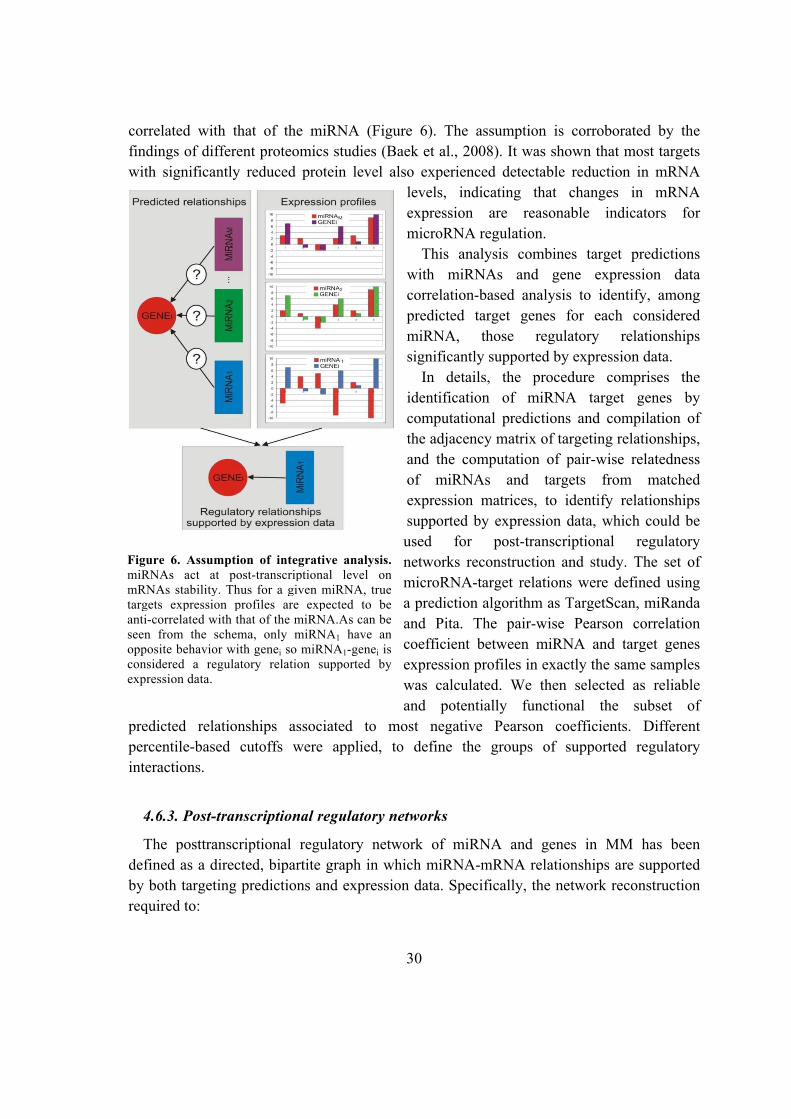
30
correlated with that of the miRNA (Figure 6). The assumption is corroborated by the
findings of different proteomics studies (Baek et al., 2008). It was shown that most targets
with significantly reduced protein level also experienced detectable reduction in mRNA
levels, indicating that changes in mRNA
expression are reasonable indicators for
microRNA regulation.
This analysis combines target predictions
with miRNAs and gene expression data
correlation-based analysis to identify, among
predicted target genes for each considered
miRNA, those regulatory relationships
significantly supported by expression data.
In details, the procedure comprises the
identification of miRNA target genes by
computational predictions and compilation of
the adjacency matrix of targeting relationships,
and the computation of pair-wise relatedness
of miRNAs and targets from matched
expression matrices, to identify relationships
supported by expression data, which could be
used for post-transcriptional regulatory
networks reconstruction and study. The set of
microRNA-target relations were defined using
a prediction algorithm as TargetScan, miRanda
and Pita. The pair-wise Pearson correlation
coefficient between miRNA and target genes
expression profiles in exactly the same samples
was calculated. We then selected as reliable
and potentially functional the subset of
predicted relationships associated to most negative Pearson coefficients. Different
percentile-based cutoffs were applied, to define the groups of supported regulatory
interactions.
4.6.3. Post-transcriptional regulatory networks
The posttranscriptional regulatory network of miRNA and genes in MM has been
defined as a directed, bipartite graph in which miRNA-mRNA relationships are supported
by both targeting predictions and expression data. Specifically, the network reconstruction
required to:
Figure 6. Assumption of integrative analysis.
miRNAs act at post-transcriptional level on
mRNAs stability. Thus for a given miRNA, true
targets expression profiles are expected to be
anti-correlated with that of the miRNA.As can be
seen from the schema, only miRNA1 have an
opposite behavior with genei so miRNA1-genei is
considered a regulatory relation supported by
expression data.
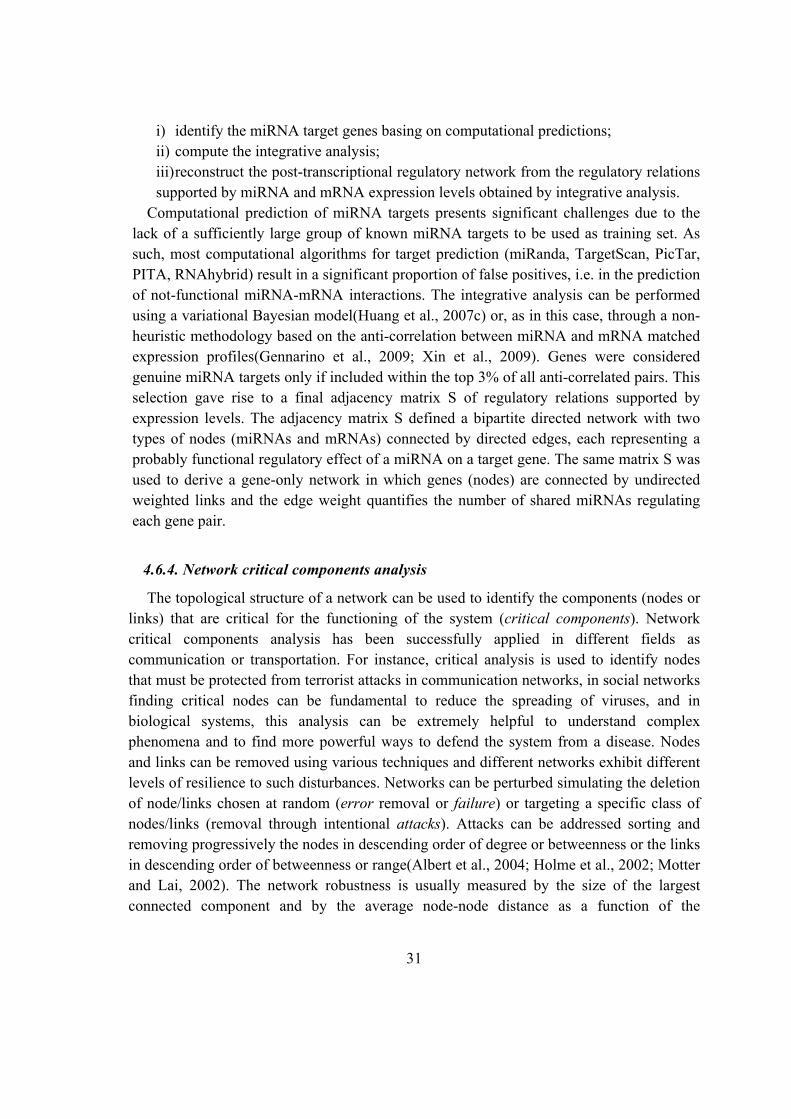
31
i) identify the miRNA target genes basing on computational predictions;
ii) compute the integrative analysis;
iii) reconstruct the post-transcriptional regulatory network from the regulatory relations
supported by miRNA and mRNA expression levels obtained by integrative analysis.
Computational prediction of miRNA targets presents significant challenges due to the
lack of a sufficiently large group of known miRNA targets to be used as training set. As
such, most computational algorithms for target prediction (miRanda, TargetScan, PicTar,
PITA, RNAhybrid) result in a significant proportion of false positives, i.e. in the prediction
of not-functional miRNA-mRNA interactions. The integrative analysis can be performed
using a variational Bayesian model(Huang et al., 2007c) or, as in this case, through a non-
heuristic methodology based on the anti-correlation between miRNA and mRNA matched
expression profiles(Gennarino et al., 2009; Xin et al., 2009). Genes were considered
genuine miRNA targets only if included within the top 3% of all anti-correlated pairs. This
selection gave rise to a final adjacency matrix S of regulatory relations supported by
expression levels. The adjacency matrix S defined a bipartite directed network with two
types of nodes (miRNAs and mRNAs) connected by directed edges, each representing a
probably functional regulatory effect of a miRNA on a target gene. The same matrix S was
used to derive a gene-only network in which genes (nodes) are connected by undirected
weighted links and the edge weight quantifies the number of shared miRNAs regulating
each gene pair.
4.6.4. Network critical components analysis
The topological structure of a network can be used to identify the components (nodes or
links) that are critical for the functioning of the system (critical components). Network
critical components analysis has been successfully applied in different fields as
communication or transportation. For instance, critical analysis is used to identify nodes
that must be protected from terrorist attacks in communication networks, in social networks
finding critical nodes can be fundamental to reduce the spreading of viruses, and in
biological systems, this analysis can be extremely helpful to understand complex
phenomena and to find more powerful ways to defend the system from a disease. Nodes
and links can be removed using various techniques and different networks exhibit different
levels of resilience to such disturbances. Networks can be perturbed simulating the deletion
of node/links chosen at random (error removal or failure) or targeting a specific class of
nodes/links (removal through intentional attacks). Attacks can be addressed sorting and
removing progressively the nodes in descending order of degree or betweenness or the links
in descending order of betweenness or range(Albert et al., 2004; Holme et al., 2002; Motter
and Lai, 2002). The network robustness is usually measured by the size of the largest
connected component and by the average node-node distance as a function of the
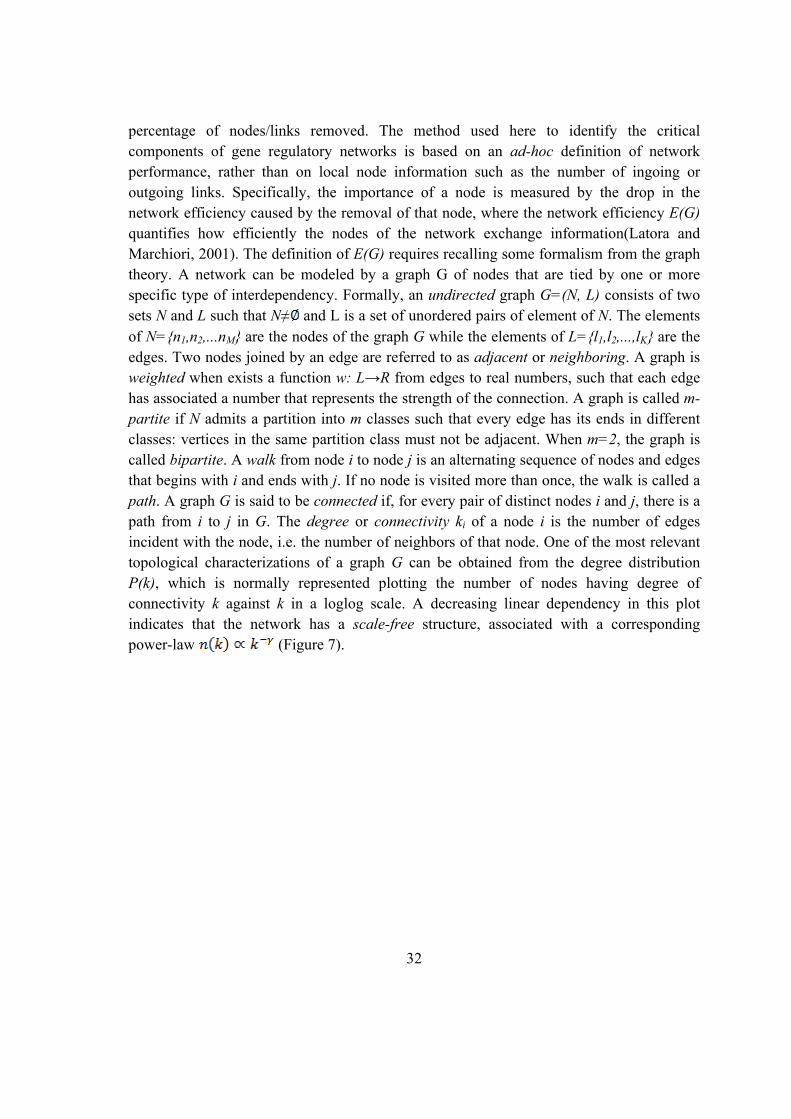
32
percentage of nodes/links removed. The method used here to identify the critical
components of gene regulatory networks is based on an ad-hoc definition of network
performance, rather than on local node information such as the number of ingoing or
outgoing links. Specifically, the importance of a node is measured by the drop in the
network efficiency caused by the removal of that node, where the network efficiency E(G)
quantifies how efficiently the nodes of the network exchange information(Latora and
Marchiori, 2001). The definition of E(G) requires recalling some formalism from the graph
theory. A network can be modeled by a graph G of nodes that are tied by one or more
specific type of interdependency. Formally, an undirected graph G=(N, L) consists of two
sets N and L such that N≠ and L is a set of unordered pairs of element of N. The elements
of N={n1,n2,...nM} are the nodes of the graph G while the elements of L={l1,l2,...,lK} are the
edges. Two nodes joined by an edge are referred to as adjacent or neighboring. A graph is
weighted when exists a function w: L→R from edges to real numbers, such that each edge
has associated a number that represents the strength of the connection. A graph is called m-
partite if N admits a partition into m classes such that every edge has its ends in different
classes: vertices in the same partition class must not be adjacent. When m=2, the graph is
called bipartite. A walk from node i to node j is an alternating sequence of nodes and edges
that begins with i and ends with j. If no node is visited more than once, the walk is called a
path. A graph G is said to be connected if, for every pair of distinct nodes i and j, there is a
path from i to j in G. The degree or connectivity ki of a node i is the number of edges
incident with the node, i.e. the number of neighbors of that node. One of the most relevant
topological characterizations of a graph G can be obtained from the degree distribution
P(k), which is normally represented plotting the number of nodes having degree of
connectivity k against k in a loglog scale. A decreasing linear dependency in this plot
indicates that the network has a scale-free structure, associated with a corresponding
power-law (Figure 7).
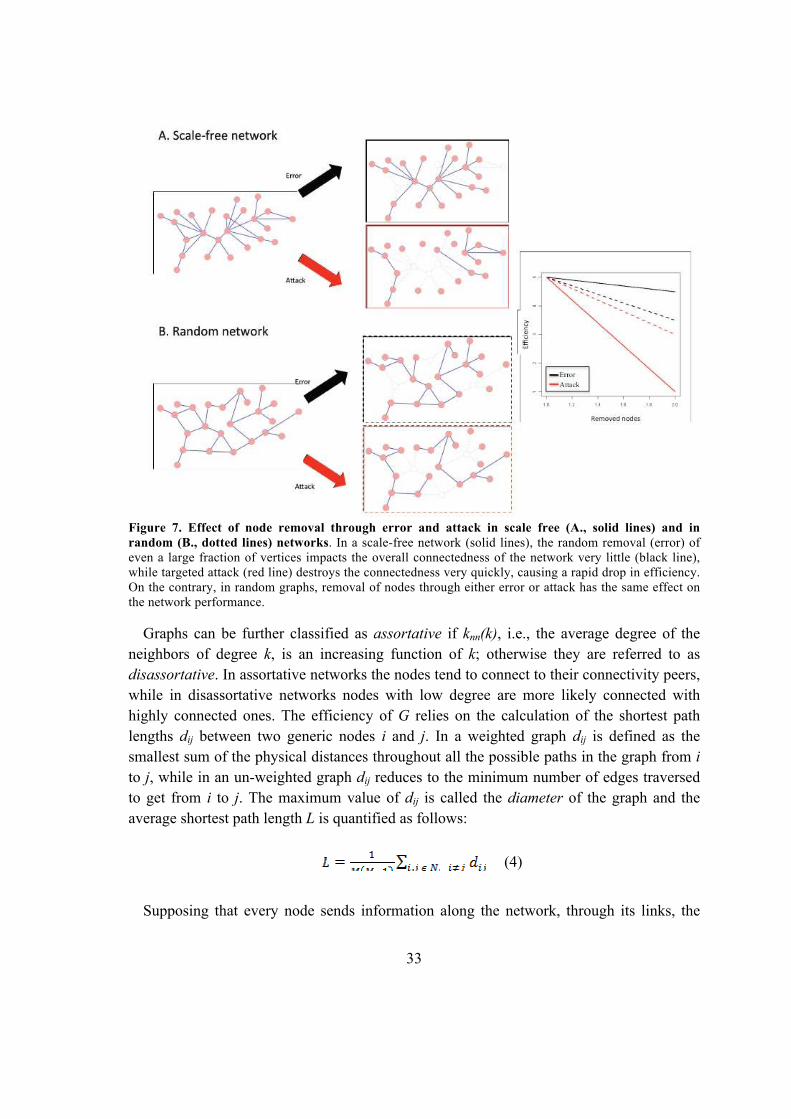
33
Figure 7. Effect of node removal through error and attack in scale free (A., solid lines) and in
random (B., dotted lines) networks. In a scale-free network (solid lines), the random removal (error) of
even a large fraction of vertices impacts the overall connectedness of the network very little (black line),
while targeted attack (red line) destroys the connectedness very quickly, causing a rapid drop in efficiency.
On the contrary, in random graphs, removal of nodes through either error or attack has the same effect on
the network performance.
Graphs can be further classified as assortative if knn(k), i.e., the average degree of the
neighbors of degree k, is an increasing function of k; otherwise they are referred to as
disassortative. In assortative networks the nodes tend to connect to their connectivity peers,
while in disassortative networks nodes with low degree are more likely connected with
highly connected ones. The efficiency of G relies on the calculation of the shortest path
lengths dij between two generic nodes i and j. In a weighted graph dij is defined as the
smallest sum of the physical distances throughout all the possible paths in the graph from i
to j, while in an un-weighted graph dij reduces to the minimum number of edges traversed
to get from i to j. The maximum value of dij is called the diameter of the graph and the
average shortest path length L is quantified as follows:
(4)
Supposing that every node sends information along the network, through its links, the

34
efficiency εij in the communication between node i and node j is assumed to be inversely
proportional to their shortest distance, i.e. . It’s worthwhile noting that the
assumption that efficiency and distance are inversely proportional is a reasonable
approximation although sometimes other relationships might be used, especially if justified
by a more specific knowledge of the system. By assuming , when there is no
path in the graph between i and j, and consistently . Consequently, the average
efficiency E(G) of the graph G can be defined as:
The definition of E(G) according to Eq.(5) avoids the divergence of L in case of
disconnected components thus allowing the analysis of the entire network and not only of
the biggest connected sub-graph. Since E(G) varies in the range [0,∞), it would be more
practical to normalize E(G) in the interval [0,1]. The most natural way to normalize E(G) is
with respect to the efficiency of a network Gideal
composed of all the possible
edges:
(6)
Though the maximum value E(G)=1 is reached only when there is a link between each
pair of nodes, real networks can nevertheless assume high values of E. This definition is
valid for both un-weighted and weighted graphs and can also be applied to disconnected
graphs. The efficiency can be evaluated on any sub-graph G’=(N’,L’) of G=(N,L), where
G’ of G is a graph such that and . The sub-graph of the neighbors of a given
node i, denoted as Gi, is the sub-graph induced by Ni, i.e., the set of nodes adjacent to i.
Given ci the node cardinality of Gi, the local efficiency Eloc is defined as the average of the
sub-graph efficiencies E(Gi) normalized with respect to the ideal sub-graphs in which all
the edges are present:
Since , the local efficiency Eloc quantifies the efficiency of the system in tolerating
faults, i.e., how efficient is the communication between the first neighbors of i when i is
removed. Graphs that have high value of Eglob and Eloc, i.e., that are very efficient both in
their global and local communication, are defined as small-words networks. Given the
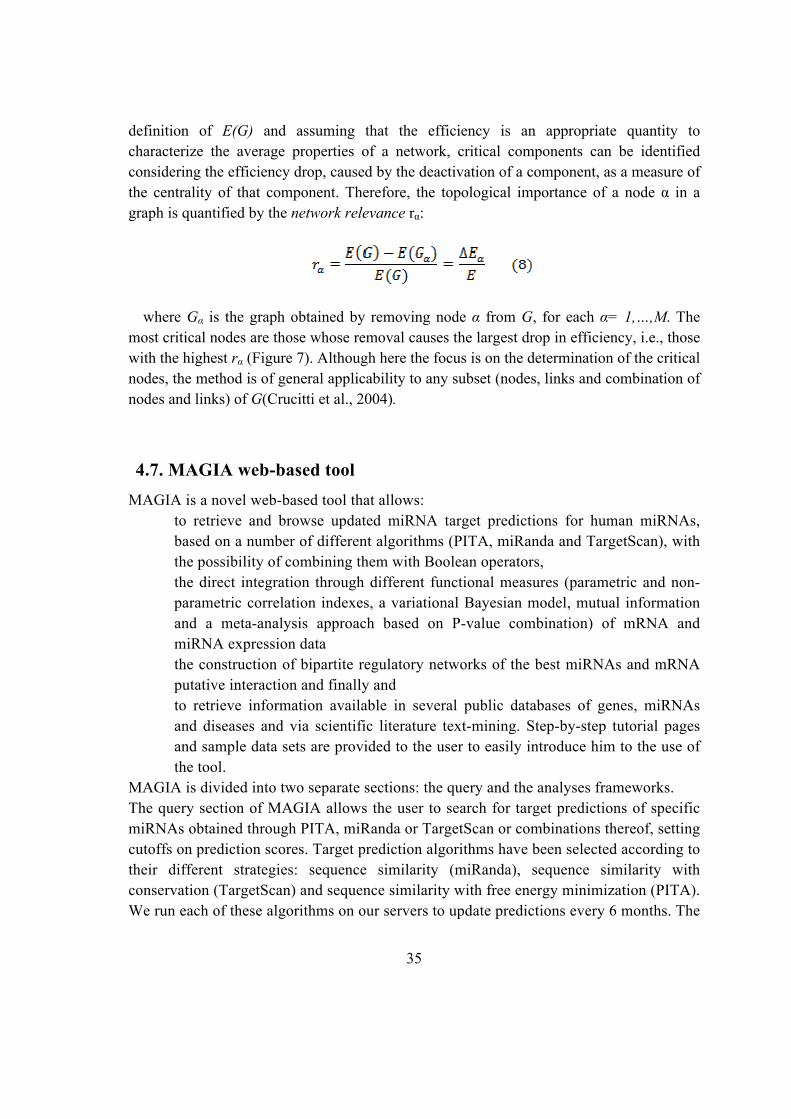
35
definition of E(G) and assuming that the efficiency is an appropriate quantity to
characterize the average properties of a network, critical components can be identified
considering the efficiency drop, caused by the deactivation of a component, as a measure of
the centrality of that component. Therefore, the topological importance of a node α in a
graph is quantified by the network relevance rα:
where Gα is the graph obtained by removing node α from G, for each α= 1,…,M. The
most critical nodes are those whose removal causes the largest drop in efficiency, i.e., those
with the highest rα (Figure 7). Although here the focus is on the determination of the critical
nodes, the method is of general applicability to any subset (nodes, links and combination of
nodes and links) of G(Crucitti et al., 2004).
4.7. MAGIA web-based tool
MAGIA is a novel web-based tool that allows:
to retrieve and browse updated miRNA target predictions for human miRNAs,
based on a number of different algorithms (PITA, miRanda and TargetScan), with
the possibility of combining them with Boolean operators,
the direct integration through different functional measures (parametric and non-
parametric correlation indexes, a variational Bayesian model, mutual information
and a meta-analysis approach based on P-value combination) of mRNA and
miRNA expression data
the construction of bipartite regulatory networks of the best miRNAs and mRNA
putative interaction and finally and
to retrieve information available in several public databases of genes, miRNAs
and diseases and via scientific literature text-mining. Step-by-step tutorial pages
and sample data sets are provided to the user to easily introduce him to the use of
the tool.
MAGIA is divided into two separate sections: the query and the analyses frameworks.
The query section of MAGIA allows the user to search for target predictions of specific
miRNAs obtained through PITA, miRanda or TargetScan or combinations thereof, setting
cutoffs on prediction scores. Target prediction algorithms have been selected according to
their different strategies: sequence similarity (miRanda), sequence similarity with
conservation (TargetScan) and sequence similarity with free energy minimization (PITA).
We run each of these algorithms on our servers to update predictions every 6 months. The

36
query output is a table including, for all considered miRNAs, the list of predicted target
genes or transcripts with the different prediction scores according to the method(s) chosen
by the user. The same information may be downloaded as a text file for processing and
further elaboration.
The analysis pipeline is composed by three different steps through which MAGIA refines
target predictions using miRNA and mRNA gene expression data (Figure 8):
• selection of the gene or transcript annotation (EntrezGene, RefSeq, ENSEMBL
gene or transcript) and of the integration method or the relatedness measure;
• choice of target prediction algorithms, their score cut-offs and Boolean
combinations;
• upload of two matrices representing mRNA and miRNA normalized expression
profiles.
MAGIA takes into account two different experimental designs:
• mRNA and miRNA data collected on different biological samples, resulting in
different sample sizes (hereafter called non-matched case)
• mRNA and miRNA expression data obtained from the same biological samples
(the matched case).
The tool employs a meta-analysis approach based on a P-value combination in the first
case, while one of four different measures of relatedness can be adopted for the analysis
of matched profiles: Spearman and Pearson correlation, mutual information, and a
variational Bayesian model. Computational intensive calculations of MAGIA analyses are
carried out by a multicore cluster.
4.7.1. Input files
MAGIA analysis pipeline takes as input two expression matrices (in the tab-delimited
format) with genes and miRNAs on the rows and samples on the columns. When profiles
are matched, the names of the columns of mRNA and miRNA data sets should
correspond exactly, while in the non-matched-case the columns labels should represent
sample classes: samples belonging to the same class should have the same label. The first
column of both matrices should represent miRNA and gene IDs. MAGIA allows
EntrezGene or Ensembl IDs for genes and RefSeq or Ensembl IDs for transcripts, while
miRNA IDs must represent miRBase-compliant mature miRNA identifiers. Expression
matrices should be pre-processed and a filtering procedure for the removal of invariable
(‘flat’) expression profiles is highly recommended. A series of quality checks are
performed during the upload.
Sample files for miRNA and gene expression, fully compliant with the user choices of
steps 1 and 2, are also provided in this step for tutorial purposes. These sample files
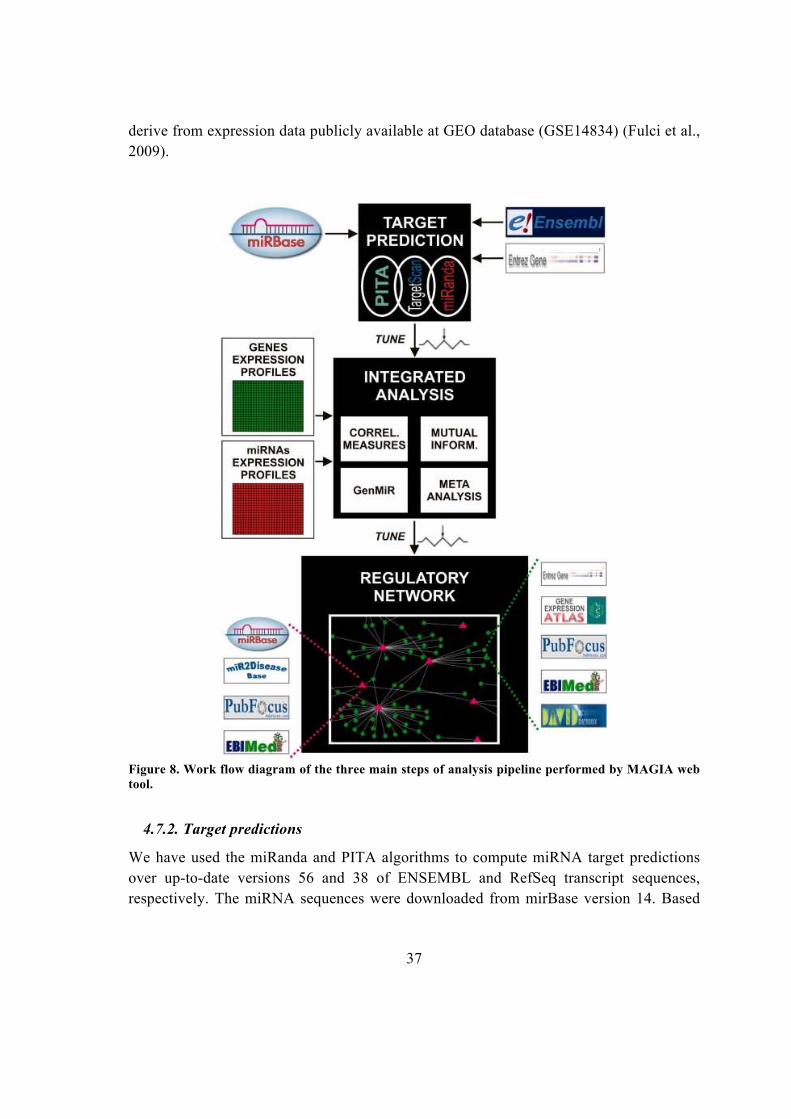
37
derive from expression data publicly available at GEO database (GSE14834) (Fulci et al.,
2009).
Figure 8. Work flow diagram of the three main steps of analysis pipeline performed by MAGIA web
tool.
4.7.2. Target predictions
We have used the miRanda and PITA algorithms to compute miRNA target predictions
over up-to-date versions 56 and 38 of ENSEMBL and RefSeq transcript sequences,
respectively. The miRNA sequences were downloaded from mirBase version 14. Based
38
on known transcript to gene correspondences, gene-centered predictions were then
derived combining transcript-based results into a single group for each gene. In this way a
gene is predicted target of a given miRNA if at least one of its transcripts carries
predicted target site(s). TargetScan predictions (version 5.0) were downloaded from
http://www.targetscan.org.
4.7.3. Computation of interaction measure
Pearson and Spearman correlations. Correlation indicates the strength and direction of a
linear relationship between two random variables. Parametric (Pearson) or non-parametric
(Spearman) correlation coefficients are computed in the case of matched samples between
gene/transcript and miRNA data. Pearson's correlation coefficient between two variables is
defined as the covariance of the two variables (X, Y) divided by the product of their
standard deviations:
The Spearman correlation coefficient is defined as the Pearson correlation coefficient
between the ranked variables. The n raw scores Xi, Yi are converted to ranks xi, yi, and ρ is
computed from these:
Tied values are assigned a rank equal to the average of their positions in the ascending
order of the values.
In general, non-parametric statistic has different expected values from the Pearson
correlation coefficient, even for large samples. Since they estimate different population
parameters, they cannot be directly compared: they generally should be viewed as
alternative measures of association. The non-parametric coefficient should be chosen in
case of outliers or with small number of measures; otherwise a parametric approach may be
more appropriate. Moreover, Pearson coefficient testing requires that both variables derive
from a bivariate normal distribution, an assumption not necessary for the Spearman
coefficient testing. The tool computes correlation coefficients for all the predicted miRNA–
target interactions and also provides a false discovery rate (FDR, following Benjamini and
Hochberg estimation method) for each one.
Mutual information. Mutual information is a measure of the mutual dependence of two
variables. The mutual information of two discrete random variable X and Y can be formally
defined as:
39
Intuitively, it captures the information that a variable X (a gene expression profile) and a
variable Y (a miRNA expression profile) share: how much the knowledge of one of these
variables reduces our uncertainty about the other. Thus, the mutual information can be
interpreted as a generalized measure of correlation, analogous to the Pearson correlation,
but sensitive to any functional relationship, not just to linear dependencies. There are
several possible strategies for the reliable estimation of the mutual information in case of
finite data, each of them characterized by a systematic error due to the finite size sample
[see (Steuer et al., 2002) for a review]. In particular, following the Kraskov and colleagues
(2003) approach (Kraskov et al., 2004), MAGIA calculates mutual information based on
nearest neighbor distances with k = 5. Mutual information, identifying any functional
relationship between miRNA and gene expression profiles, does not allow the identification
of the sign of such relationship.
GenMir++. The variational Bayesian model, called GenMiR++ (Huang et al., 2007c)
uses as prior information target predictions derived from one of the previous mentioned
algorithms (e.g. PITA) and updates such information using expression matrices. It
combines predictions with miRNA and mRNA expression profiles, under the assumption of
anti-correlation. Under a complex model, the posterior probability of miRNA–gene
interactions (S) is calculated, known the target predictions (C), expression matrices (X and
Z), by integrating over nuisance variables gamma (Γ, tissue scaling) and lambda (Λ,
regulatory weights) and other parameters in the equation,
An estimate of such posterior probability is calculated through an EM algorithm. Thus
GenMir++ could have convergence problems, particularly in case of non-sparse incidence
matrices.
Meta-analysis. The meta-analysis approach is suggested only in the case of non-matched
biological samples. Given the diverse nature and number of samples between miRNA and
gene profiles, neither correlation coefficients nor mutual information or posterior
probabilities can be computed. MAGIA adopts in their place a meta-analyses approach
based on P-value combination allowing, unlike other web tools, the presence of more than
two groups. Empirical Bayes test (Smyth, 2004) (as implemented in limma package in R) is
separately performed on miRNA and mRNA expression levels and lists of differentially
miRNAs and genes are stored. Then, only for predicted miRNA–mRNA interactions (based
on the target prediction algorithms the user has chosen) the inverse Chi-squared
approach(Moreau et al., 2003) is used to combine miRNAs and genes P-values. In
particular, in the case of a two classes experimental design, P-values of over-expressed
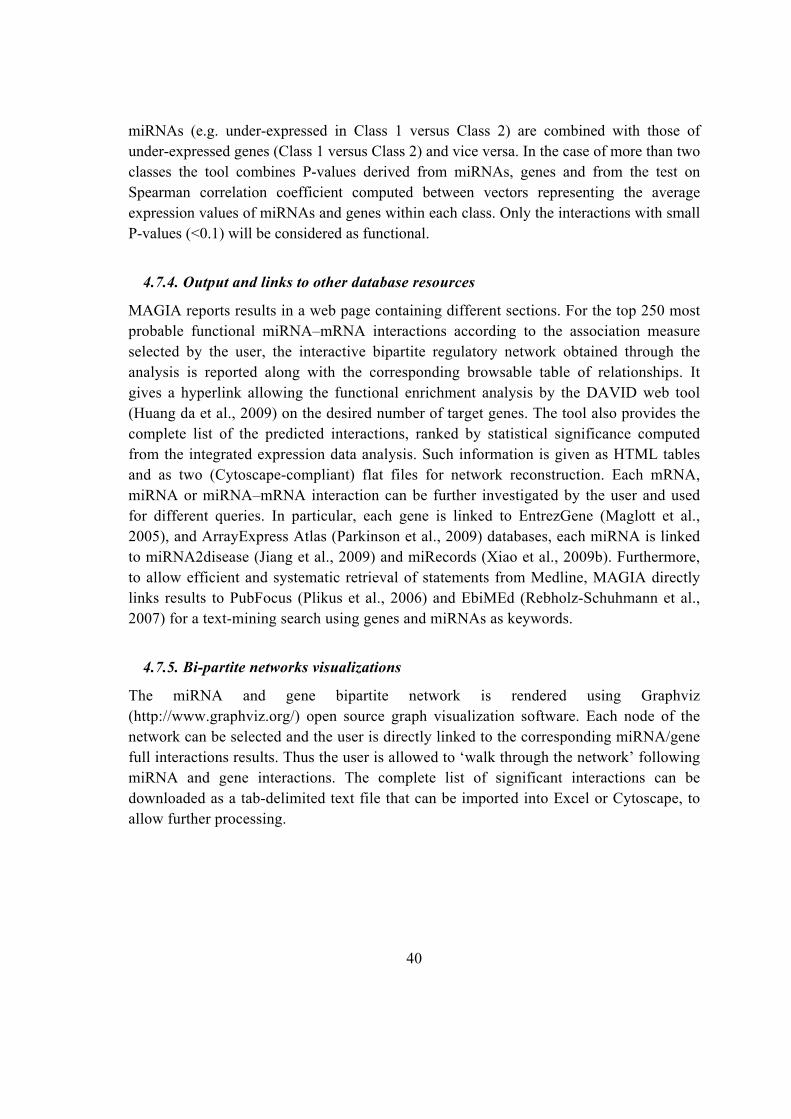
40
miRNAs (e.g. under-expressed in Class 1 versus Class 2) are combined with those of
under-expressed genes (Class 1 versus Class 2) and vice versa. In the case of more than two
classes the tool combines P-values derived from miRNAs, genes and from the test on
Spearman correlation coefficient computed between vectors representing the average
expression values of miRNAs and genes within each class. Only the interactions with small
P-values (<0.1) will be considered as functional.
4.7.4. Output and links to other database resources
MAGIA reports results in a web page containing different sections. For the top 250 most
probable functional miRNA–mRNA interactions according to the association measure
selected by the user, the interactive bipartite regulatory network obtained through the
analysis is reported along with the corresponding browsable table of relationships. It
gives a hyperlink allowing the functional enrichment analysis by the DAVID web tool
(Huang da et al., 2009) on the desired number of target genes. The tool also provides the
complete list of the predicted interactions, ranked by statistical significance computed
from the integrated expression data analysis. Such information is given as HTML tables
and as two (Cytoscape-compliant) flat files for network reconstruction. Each mRNA,
miRNA or miRNA–mRNA interaction can be further investigated by the user and used
for different queries. In particular, each gene is linked to EntrezGene (Maglott et al.,
2005), and ArrayExpress Atlas (Parkinson et al., 2009) databases, each miRNA is linked
to miRNA2disease (Jiang et al., 2009) and miRecords (Xiao et al., 2009b). Furthermore,
to allow efficient and systematic retrieval of statements from Medline, MAGIA directly
links results to PubFocus (Plikus et al., 2006) and EbiMEd (Rebholz-Schuhmann et al.,
2007) for a text-mining search using genes and miRNAs as keywords.
4.7.5. Bi-partite networks visualizations
The miRNA and gene bipartite network is rendered using Graphviz
(http://www.graphviz.org/) open source graph visualization software. Each node of the
network can be selected and the user is directly linked to the corresponding miRNA/gene
full interactions results. Thus the user is allowed to ‘walk through the network’ following
miRNA and gene interactions. The complete list of significant interactions can be
downloaded as a tab-delimited text file that can be imported into Excel or Cytoscape, to
allow further processing.
41
4.8. Analysis of sister miRNA pairs expression ratio.
For each sister miRNA pair represented in at least one of the five considered datasets, we
calculated the per sample log2(ratio) between expression values of sister miRNAs (e.g.
miR-X/miR-X*, miR-X-5p/miR-X-3p according to miRBase annotation). Matrix values
were standardized and used for cluster analysis of samples and of miRNA pairs, using
Euclidean distance and average clustering. Then, for each dataset we considered not
expressed in a given sample those miRNAs associated to expression values lower than the
median of the dataset expression matrix (i.e. low values were set to 0). We calculated the
per sample log2(ratio) between expression values of sister miRNAs as indicated before, but
miRNA pairs expressed in alternative way in a given sample were associated to extreme
values. When only one out of two sister miRNAs was expressed over the threshold,
log2(ratio) values (generating ±∞) were artificially set to maxLog(ratio)+0.1, if only the
first miR is expressed, or to minLog(ratio)-0.1 in the opposite case. Values of log2(ratio) of
samples in which both miRNAs of the pair are not expressed were not considered for the
clustering analyses.
4.9. Statistical analysis
Conventional statistical procedures were applied, where appropriated using standard
packages for R software. Wilcoxon rank-sum tests was used to evaluate the length of host
gene in comparison with all human genes. This is a non-parametric statistical hypothesis
test for assessing whether one of two distribution samples of independent observations
tends to have larger values than the other. Studend’s t-test was applied with independent
samples having a standard normal distribution. In particular this was performed for test
the difference between the expression level of new and novel miRNAs and moRNAs in
SET2 cells. Shannon Entropy was used for filter out invariant miRNAs or genes in the
expression datasets. Entropy is a measure of the uncertainty associated with a random
variable and in particular Shannon entropy quantifies the expected value of the
information contained in different type of data.
4.10. New miRNA target prediction
The prediction of target genes of novel miRNAs, discovered by small RNA deep
sequencing constitutes one of the final parts of a complex analysis employing for data
handling and analysis summary in a flow-chart outline of study procedures (Figure 9).
42
Figure 9. Computational pipeline. A computational pipeline was set up using the Scons build tool
(http://www.scons.org/) as skeleton. It includes third party libraries and programs and in house developed
code and aims to analyze in a reproducible way short RNA sequencing data using up to date metadata from
human genome sequence and miRBase (http://www.mirbase.org/). As shown in Figure S1, the pipeline
includes raw data pre-processing, different filtering steps before and after mapping to reference sequences,
as well as methods for known miRNAs quantification, isomiR characterization, and for miRNA and other
short RNA discovery.
Genes target of new miRNAs were predicted by using TargetScan run locally using as
input new miRNA sequences and the set of 3’UTR sequences of all human transcripts and
orthologs in 23 species (TargetScan database v5.2). TargetScan groups miRNAs (intra- and
inter species) in a family if they have conserved 8mer and 7mer sites representing the seed

43
region, required by the prediction algorithm. For each novel miRNA, a family was created
aggregating to all known miRNAs the novel miRNA satisfying a custom similarity
condition. Specifically, for each novel miRNA we performed a pair-wise alignment with all
known miRNAs, using ClustalW2 algorithm, from above-mentioned species set. If the
number of matches between the 5’ regions of miRNA pairs exceeded the half-length of the
shorter miRNA minus 3, the novel and the known miRNAs were included in a custom
family. The process was repeated iteratively. Then for each custom family we performed a
multiple alignment with ClustalW2 to find the common substring of 7nt in the 5’of all
miRNAs sequences, which was used as seed sequence for target predictions.

45
5. Results
5.1. Identification of microRNA expression patterns and definition of a
microRNA/mRNA regulatory network in distinct molecular groups of
multiple myeloma
Multiple myeloma (MM) is a malignant proliferation of bone marrow (BM) plasma cells
(PCLs), characterized by a profound genomic instability involving both numerical and
structural chromosomal aberrations of potential prognostic relevance.1 Nearly half of MM
tumors are hyperdiploid (HD) with multiple trisomies of nonrandom odd-numbered
chromosomes and a low prevalence of chromosomal translocations involving the
immunoglobulin heavy chain (IGH) locus at 14q32 and chromosome 13 deletion1; the
others are nonhyperdiploid (NHD) tumors often showing chromosome 13 deletion, 1q gain,
and IGH translocations with the most frequent partners being 11q13, 4p16, 16q23, 20q11,
and 6p21. The deregulation of at least one of the cyclin D genes is observed in almost all
MM cases and, in combination with recurrent IGH translocations, has been proposed for a
molecular classification of MM called translocation/cyclin (TC) classification. The
occurrence of specific transcriptional patterns associated with the molecular subgroups and
major genetic lesions of MM has been extensively described in several studies by us and
others(Biasiolo et al., 2010; Lionetti et al., 2009).
5.1.1. Global miRNA expression profiling in MM patients
MiRNA profiles were analyzed by high-density microarrays, specific for 723 human
miRNAs, in 40 patients representative of the 5 TC groups (supplemental Table S 1), and
in PCLs from 3 NCs. To determine whether global miRNA profiling could distinguish the
molecular groups, we performed an unsupervised analysis using conventional hierarchical
agglomerative clustering: the 43 samples were described by 74 miRNAs whose average
change in expression levels varied at least 2-fold from the mean across the dataset. The
most striking finding was that all of the TC4 patients were tightly clustered (Figure 10,
gray cluster, P < .001), as were 4 of 5 TC5 cases (red cluster, P < .001). The TC2 cases
were partially grouped (blue cluster, P < 0.005), whereas the TC1 and TC3 samples were
scattered along the dendrogram. The NCs were clearly grouped in a distinct sub-branch.
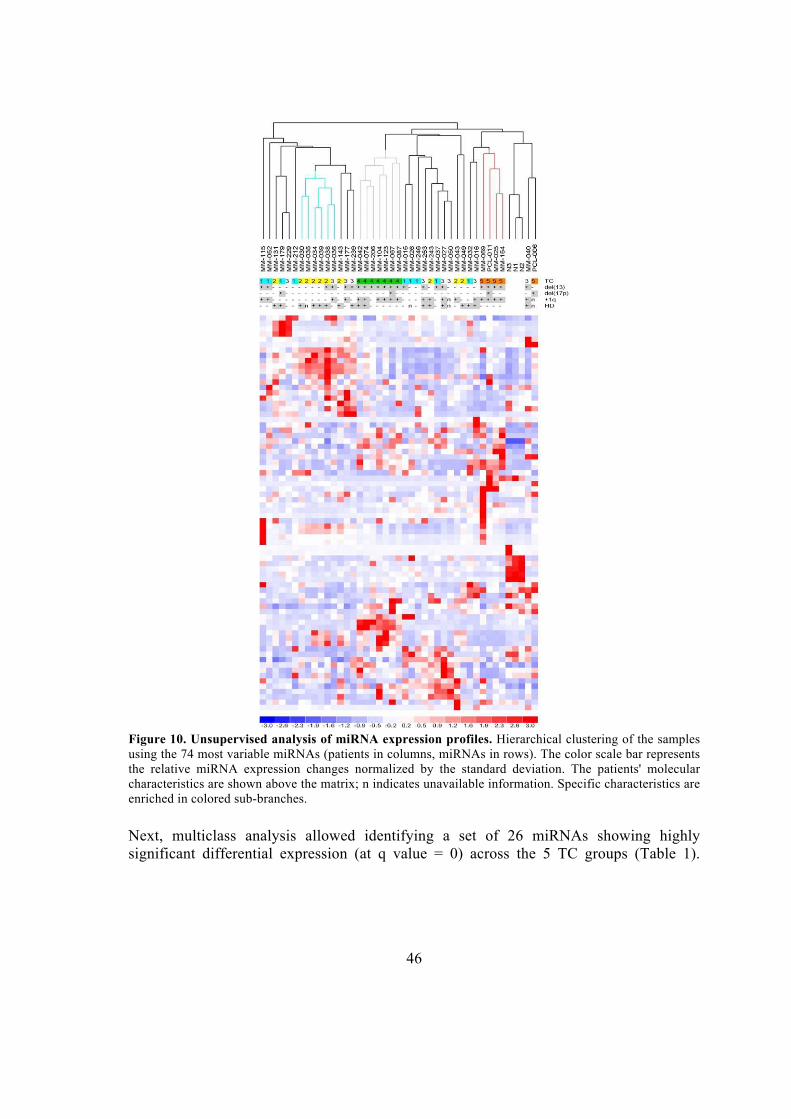
46
Figure 10. Unsupervised analysis of miRNA expression profiles. Hierarchical clustering of the samples
using the 74 most variable miRNAs (patients in columns, miRNAs in rows). The color scale bar represents
the relative miRNA expression changes normalized by the standard deviation. The patients' molecular
characteristics are shown above the matrix; n indicates unavailable information. Specific characteristics are
enriched in colored sub-branches.
Next, multiclass analysis allowed identifying a set of 26 miRNAs showing highly
significant differential expression (at q value = 0) across the 5 TC groups (Table 1).
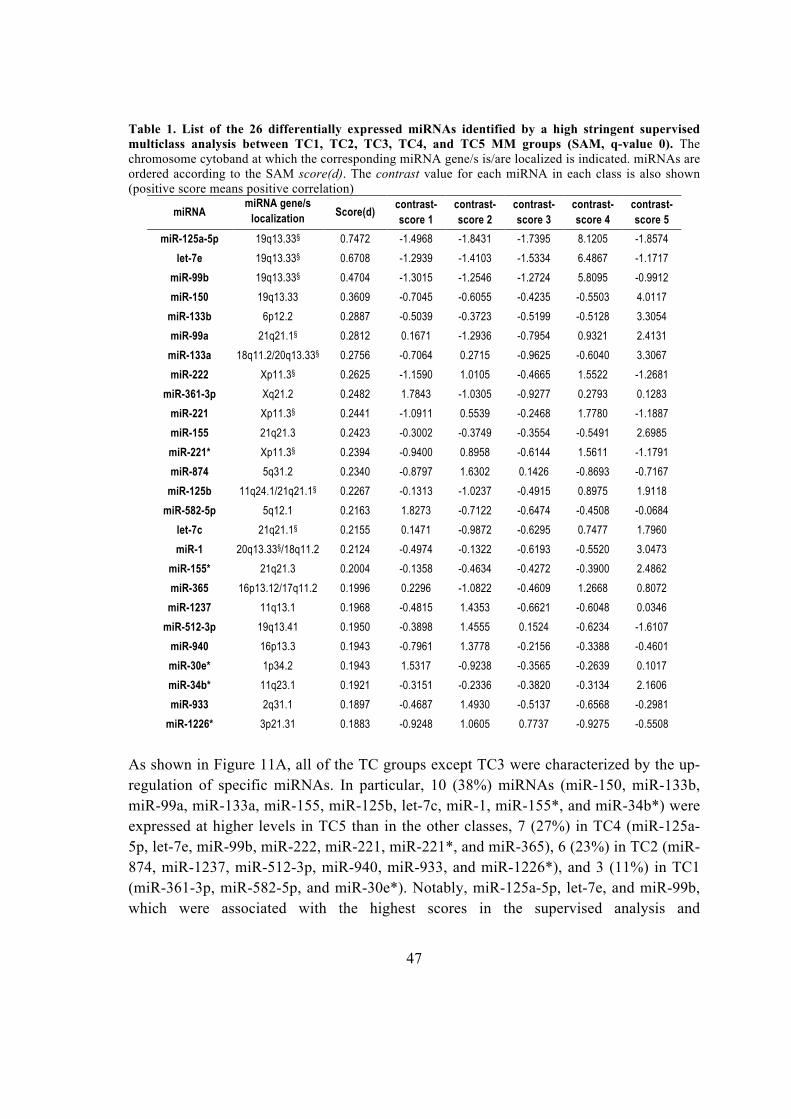
47
Table 1. List of the 26 differentially expressed miRNAs identified by a high stringent supervised
multiclass analysis between TC1, TC2, TC3, TC4, and TC5 MM groups (SAM, q-value 0). The
chromosome cytoband at which the corresponding miRNA gene/s is/are localized is indicated. miRNAs are
ordered according to the SAM score(d). The contrast value for each miRNA in each class is also shown
(positive score means positive correlation)
miRNA miRNA gene/s
localization Score(d)
contrast-
score 1
contrast-
score 2
contrast-
score 3
contrast-
score 4
contrast-
score 5
miR-125a-5p 19q13.33§ 0.7472 -1.4968 -1.8431 -1.7395 8.1205 -1.8574
let-7e 19q13.33§ 0.6708 -1.2939 -1.4103 -1.5334 6.4867 -1.1717
miR-99b 19q13.33§ 0.4704 -1.3015 -1.2546 -1.2724 5.8095 -0.9912
miR-150 19q13.33 0.3609 -0.7045 -0.6055 -0.4235 -0.5503 4.0117
miR-133b 6p12.2 0.2887 -0.5039 -0.3723 -0.5199 -0.5128 3.3054
miR-99a 21q21.1§ 0.2812 0.1671 -1.2936 -0.7954 0.9321 2.4131
miR-133a 18q11.2/20q13.33§ 0.2756 -0.7064 0.2715 -0.9625 -0.6040 3.3067
miR-222 Xp11.3§ 0.2625 -1.1590 1.0105 -0.4665 1.5522 -1.2681
miR-361-3p Xq21.2 0.2482 1.7843 -1.0305 -0.9277 0.2793 0.1283
miR-221 Xp11.3§ 0.2441 -1.0911 0.5539 -0.2468 1.7780 -1.1887
miR-155 21q21.3 0.2423 -0.3002 -0.3749 -0.3554 -0.5491 2.6985
miR-221* Xp11.3§ 0.2394 -0.9400 0.8958 -0.6144 1.5611 -1.1791
miR-874 5q31.2 0.2340 -0.8797 1.6302 0.1426 -0.8693 -0.7167
miR-125b 11q24.1/21q21.1§ 0.2267 -0.1313 -1.0237 -0.4915 0.8975 1.9118
miR-582-5p 5q12.1 0.2163 1.8273 -0.7122 -0.6474 -0.4508 -0.0684
let-7c 21q21.1§ 0.2155 0.1471 -0.9872 -0.6295 0.7477 1.7960
miR-1 20q13.33§/18q11.2 0.2124 -0.4974 -0.1322 -0.6193 -0.5520 3.0473
miR-155* 21q21.3 0.2004 -0.1358 -0.4634 -0.4272 -0.3900 2.4862
miR-365 16p13.12/17q11.2 0.1996 0.2296 -1.0822 -0.4609 1.2668 0.8072
miR-1237 11q13.1 0.1968 -0.4815 1.4353 -0.6621 -0.6048 0.0346
miR-512-3p 19q13.41 0.1950 -0.3898 1.4555 0.1524 -0.6234 -1.6107
miR-940 16p13.3 0.1943 -0.7961 1.3778 -0.2156 -0.3388 -0.4601
miR-30e* 1p34.2 0.1943 1.5317 -0.9238 -0.3565 -0.2639 0.1017
miR-34b* 11q23.1 0.1921 -0.3151 -0.2336 -0.3820 -0.3134 2.1606
miR-933 2q31.1 0.1897 -0.4687 1.4930 -0.5137 -0.6568 -0.2981
miR-1226* 3p21.31 0.1883 -0.9248 1.0605 0.7737 -0.9275 -0.5508
As shown in Figure 11A, all of the TC groups except TC3 were characterized by the up-
regulation of specific miRNAs. In particular, 10 (38%) miRNAs (miR-150, miR-133b,
miR-99a, miR-133a, miR-155, miR-125b, let-7c, miR-1, miR-155*, and miR-34b*) were
expressed at higher levels in TC5 than in the other classes, 7 (27%) in TC4 (miR-125a-
5p, let-7e, miR-99b, miR-222, miR-221, miR-221*, and miR-365), 6 (23%) in TC2 (miR-
874, miR-1237, miR-512-3p, miR-940, miR-933, and miR-1226*), and 3 (11%) in TC1
(miR-361-3p, miR-582-5p, and miR-30e*). Notably, miR-125a-5p, let-7e, and miR-99b,
which were associated with the highest scores in the supervised analysis and
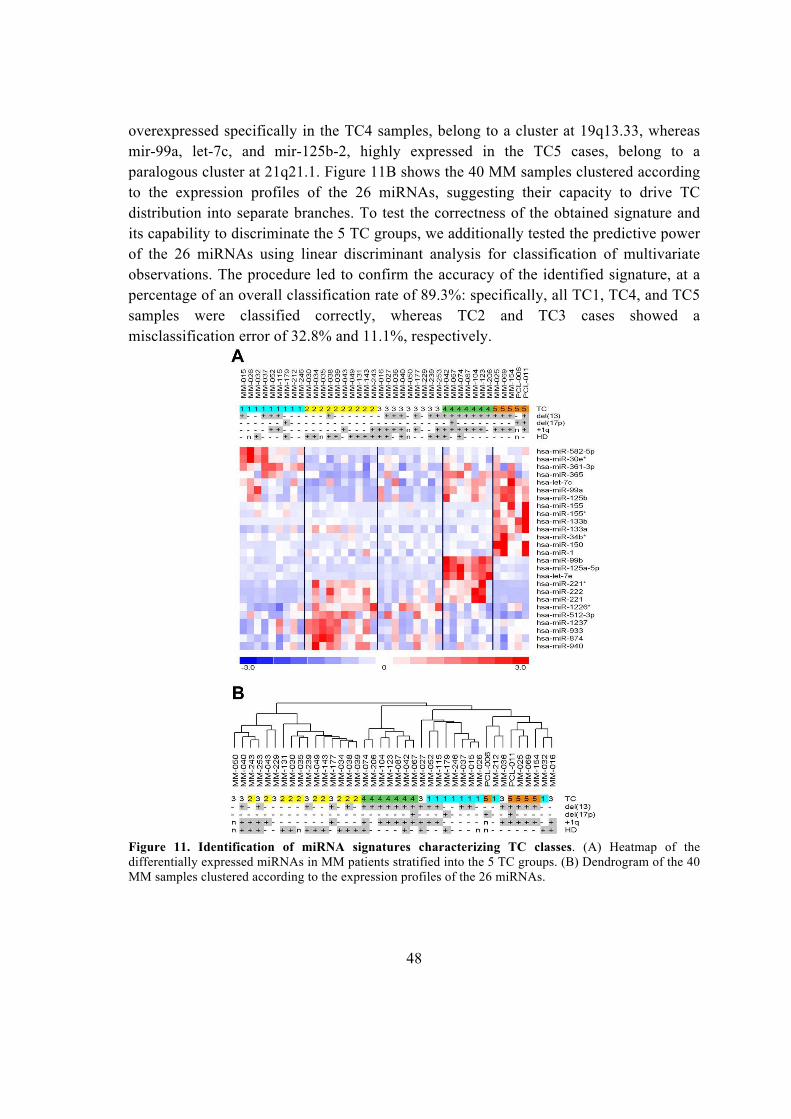
48
overexpressed specifically in the TC4 samples, belong to a cluster at 19q13.33, whereas
mir-99a, let-7c, and mir-125b-2, highly expressed in the TC5 cases, belong to a
paralogous cluster at 21q21.1. Figure 11B shows the 40 MM samples clustered according
to the expression profiles of the 26 miRNAs, suggesting their capacity to drive TC
distribution into separate branches. To test the correctness of the obtained signature and
its capability to discriminate the 5 TC groups, we additionally tested the predictive power
of the 26 miRNAs using linear discriminant analysis for classification of multivariate
observations. The procedure led to confirm the accuracy of the identified signature, at a
percentage of an overall classification rate of 89.3%: specifically, all TC1, TC4, and TC5
samples were classified correctly, whereas TC2 and TC3 cases showed a
misclassification error of 32.8% and 11.1%, respectively.
Figure 11. Identification of miRNA signatures characterizing TC classes. (A) Heatmap of the
differentially expressed miRNAs in MM patients stratified into the 5 TC groups. (B) Dendrogram of the 40
MM samples clustered according to the expression profiles of the 26 miRNAs.
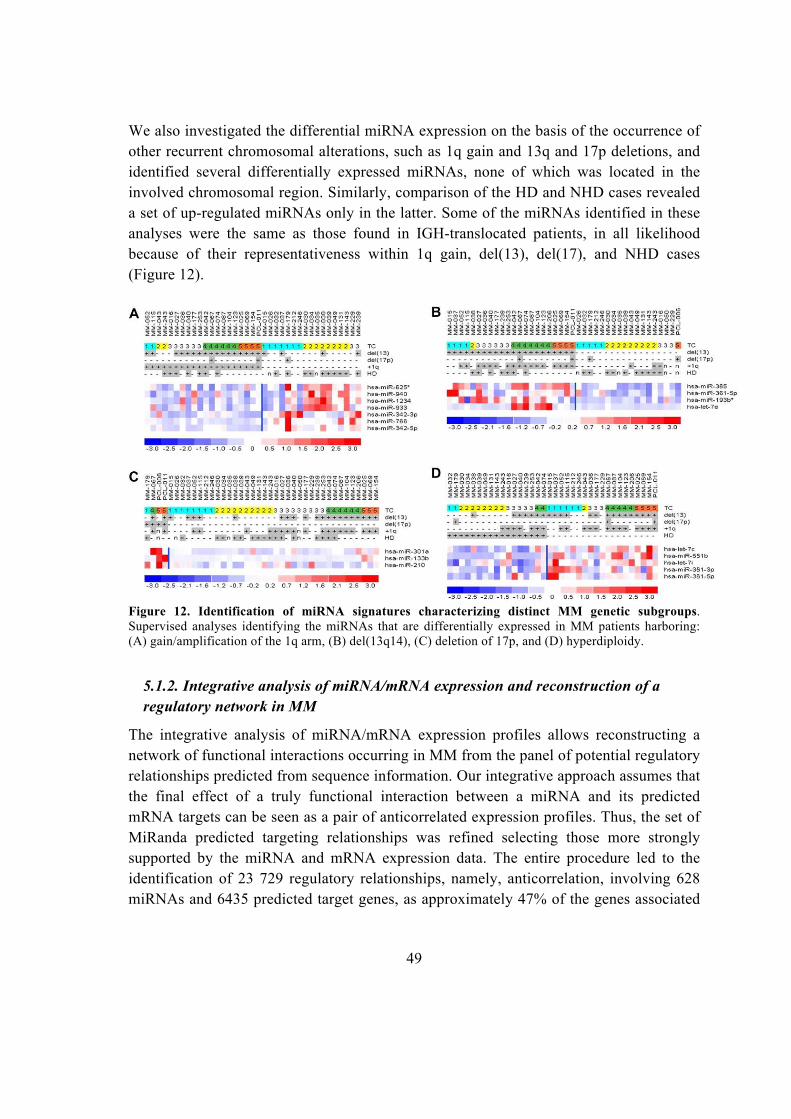
49
We also investigated the differential miRNA expression on the basis of the occurrence of
other recurrent chromosomal alterations, such as 1q gain and 13q and 17p deletions, and
identified several differentially expressed miRNAs, none of which was located in the
involved chromosomal region. Similarly, comparison of the HD and NHD cases revealed
a set of up-regulated miRNAs only in the latter. Some of the miRNAs identified in these
analyses were the same as those found in IGH-translocated patients, in all likelihood
because of their representativeness within 1q gain, del(13), del(17), and NHD cases
(Figure 12).
Figure 12. Identification of miRNA signatures characterizing distinct MM genetic subgroups.
Supervised analyses identifying the miRNAs that are differentially expressed in MM patients harboring:
(A) gain/amplification of the 1q arm, (B) del(13q14), (C) deletion of 17p, and (D) hyperdiploidy.
5.1.2. Integrative analysis of miRNA/mRNA expression and reconstruction of a
regulatory network in MM
The integrative analysis of miRNA/mRNA expression profiles allows reconstructing a
network of functional interactions occurring in MM from the panel of potential regulatory
relationships predicted from sequence information. Our integrative approach assumes that
the final effect of a truly functional interaction between a miRNA and its predicted
mRNA targets can be seen as a pair of anticorrelated expression profiles. Thus, the set of
MiRanda predicted targeting relationships was refined selecting those more strongly
supported by the miRNA and mRNA expression data. The entire procedure led to the
identification of 23 729 regulatory relationships, namely, anticorrelation, involving 628
miRNAs and 6435 predicted target genes, as approximately 47% of the genes associated
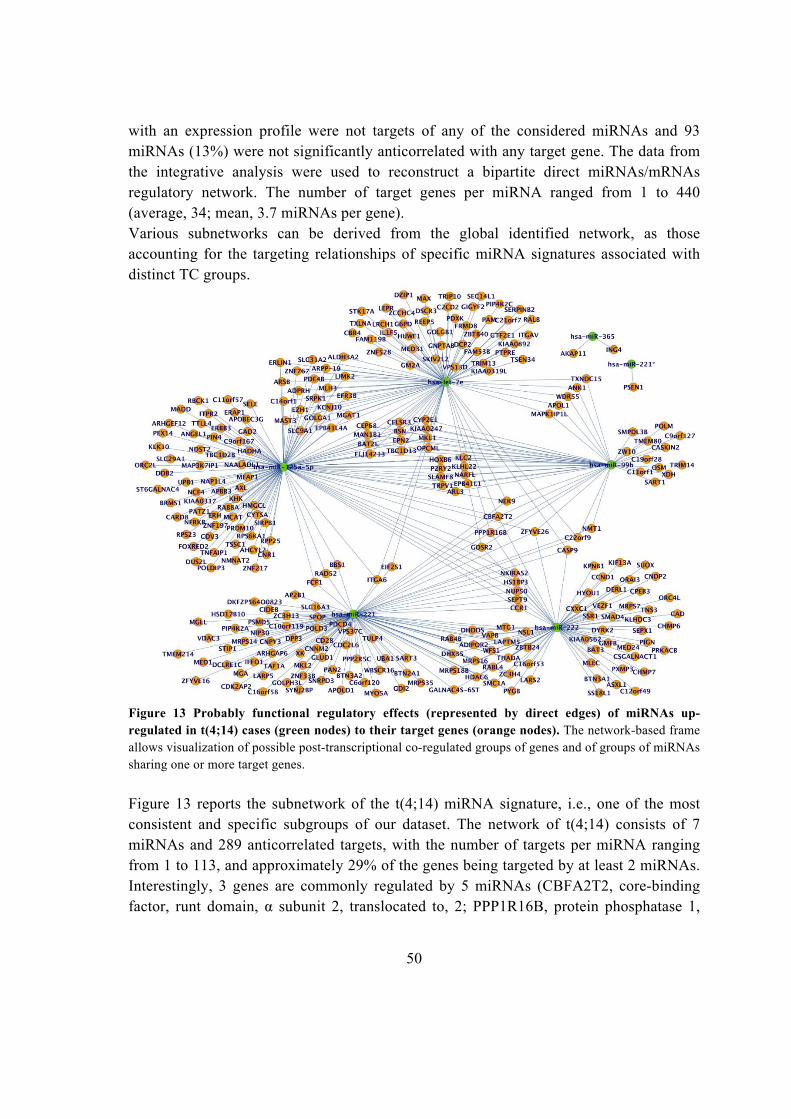
50
with an expression profile were not targets of any of the considered miRNAs and 93
miRNAs (13%) were not significantly anticorrelated with any target gene. The data from
the integrative analysis were used to reconstruct a bipartite direct miRNAs/mRNAs
regulatory network. The number of target genes per miRNA ranged from 1 to 440
(average, 34; mean, 3.7 miRNAs per gene).
Various subnetworks can be derived from the global identified network, as those
accounting for the targeting relationships of specific miRNA signatures associated with
distinct TC groups.
Figure 13 Probably functional regulatory effects (represented by direct edges) of miRNAs up-
regulated in t(4;14) cases (green nodes) to their target genes (orange nodes). The network-based frame
allows visualization of possible post-transcriptional co-regulated groups of genes and of groups of miRNAs
sharing one or more target genes.
Figure 13 reports the subnetwork of the t(4;14) miRNA signature, i.e., one of the most
consistent and specific subgroups of our dataset. The network of t(4;14) consists of 7
miRNAs and 289 anticorrelated targets, with the number of targets per miRNA ranging
from 1 to 113, and approximately 29% of the genes being targeted by at least 2 miRNAs.
Interestingly, 3 genes are commonly regulated by 5 miRNAs (CBFA2T2, core-binding
factor, runt domain, α subunit 2, translocated to, 2; PPP1R16B, protein phosphatase 1,

51
regulatory inhibitor subunit 16B; and GOSR2, Golgi SNAP receptor complex member 2).
Functional enrichment analysis of anticorrelated targets revealed various overrepresented
biologic processes, including chromosome segregation, protein polyubiquitination, cell
cycle regulation, and unfolded protein response. Interestingly, a comparison between the
identified supported miRNA target genes and mRNAs down-regulated in the t(4;14) cases
(as identified in a larger proprietary dataset of 132 MMs, data not shown) highlighted that
the miRNA targets were significantly enriched in down-regulated genes (P < 0.001).
Similarly, subnetworks were derived considering the sets of miRNAs differentially
expressed in TC5 and TC1 groups (supplemental Table S 2).
5.1.3. Critical analysis of transcriptional and post-transcriptional regulatory
networks
Network analysis has emerged as a powerful approach to understand complex
phenomena and organization in social, technological and biological systems. In particular,
it is increasingly recognized the role played by the topology of cellular networks, the
intricate web of interactions among genes, proteins and other molecules regulating cell
activity, in unveiling the biological mechanisms underlying the physiological states of
living organisms. Critical analysis of network components has been applied to inspect the
transcriptional and post-transcriptional regulatory networks reconstructed from mRNA and
microRNA expression data of multiple myeloma (MM) samples. Specifically, the
importance of a gene as a putative regulatory element has been assessed calculating the
drop in the network performance caused by its deactivation instead of quantifying its
degree of connectivity.
ARACNe inferred a transcriptional network with 9666 nodes (i.e. genes) and 86846
edges (i.e. interactions) from the MM158GE dataset. The topological characteristics of the
network are reported in Table 2, in terms of number of nodes, number of edges, maximum
kmax and average kmean connectivity (k being the degree of a node, i.e. the number of its
interactions), diameter (representing the maximum value of dij) and global and local
efficiencies.
Table 2. Metrics of transcriptional and post-transcriptional networks
NETWORK TYPE Nodes (M) Edges (K) kmax kmean Diameter Eglob Eloc
Transcriptional 9666 86846 219 17.96 8 0.279 0.150
Post-transcriptional 6435 909324 1811 282.62 8 0.611 0.866
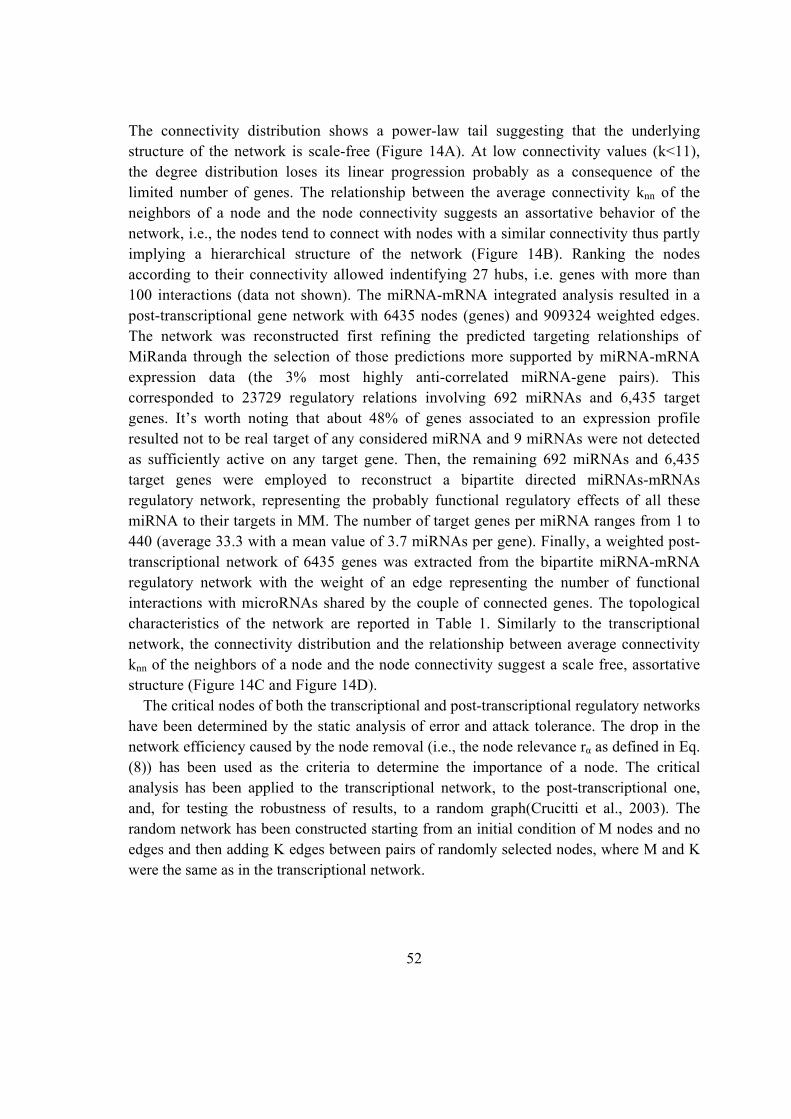
52
The connectivity distribution shows a power-law tail suggesting that the underlying
structure of the network is scale-free (Figure 14A). At low connectivity values (k<11),
the degree distribution loses its linear progression probably as a consequence of the
limited number of genes. The relationship between the average connectivity knn of the
neighbors of a node and the node connectivity suggests an assortative behavior of the
network, i.e., the nodes tend to connect with nodes with a similar connectivity thus partly
implying a hierarchical structure of the network (Figure 14B). Ranking the nodes
according to their connectivity allowed indentifying 27 hubs, i.e. genes with more than
100 interactions (data not shown). The miRNA-mRNA integrated analysis resulted in a
post-transcriptional gene network with 6435 nodes (genes) and 909324 weighted edges.
The network was reconstructed first refining the predicted targeting relationships of
MiRanda through the selection of those predictions more supported by miRNA-mRNA
expression data (the 3% most highly anti-correlated miRNA-gene pairs). This
corresponded to 23729 regulatory relations involving 692 miRNAs and 6,435 target
genes. It’s worth noting that about 48% of genes associated to an expression profile
resulted not to be real target of any considered miRNA and 9 miRNAs were not detected
as sufficiently active on any target gene. Then, the remaining 692 miRNAs and 6,435
target genes were employed to reconstruct a bipartite directed miRNAs-mRNAs
regulatory network, representing the probably functional regulatory effects of all these
miRNA to their targets in MM. The number of target genes per miRNA ranges from 1 to
440 (average 33.3 with a mean value of 3.7 miRNAs per gene). Finally, a weighted post-
transcriptional network of 6435 genes was extracted from the bipartite miRNA-mRNA
regulatory network with the weight of an edge representing the number of functional
interactions with microRNAs shared by the couple of connected genes. The topological
characteristics of the network are reported in Table 1. Similarly to the transcriptional
network, the connectivity distribution and the relationship between average connectivity
knn of the neighbors of a node and the node connectivity suggest a scale free, assortative
structure (Figure 14C and Figure 14D).
The critical nodes of both the transcriptional and post-transcriptional regulatory networks
have been determined by the static analysis of error and attack tolerance. The drop in the
network efficiency caused by the node removal (i.e., the node relevance rα as defined in Eq.
(8)) has been used as the criteria to determine the importance of a node. The critical
analysis has been applied to the transcriptional network, to the post-transcriptional one,
and, for testing the robustness of results, to a random graph(Crucitti et al., 2003). The
random network has been constructed starting from an initial condition of M nodes and no
edges and then adding K edges between pairs of randomly selected nodes, where M and K
were the same as in the transcriptional network.
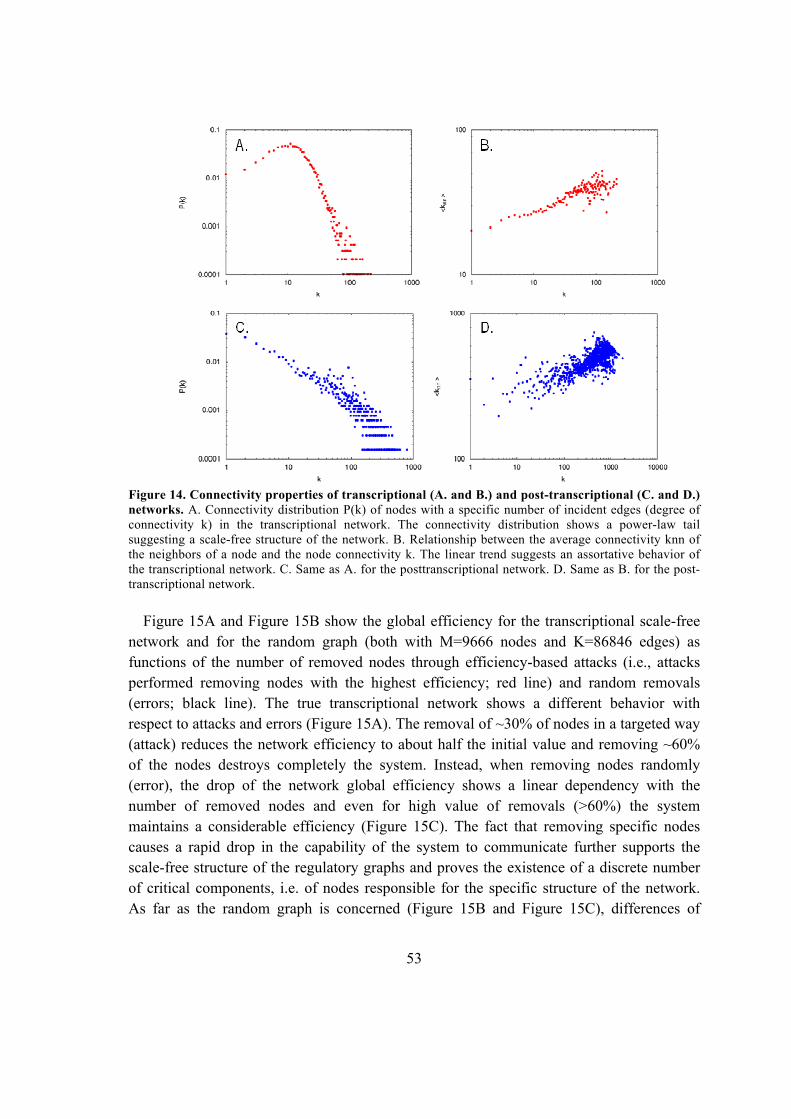
53
Figure 14. Connectivity properties of transcriptional (A. and B.) and post-transcriptional (C. and D.)
networks. A. Connectivity distribution P(k) of nodes with a specific number of incident edges (degree of
connectivity k) in the transcriptional network. The connectivity distribution shows a power-law tail
suggesting a scale-free structure of the network. B. Relationship between the average connectivity knn of
the neighbors of a node and the node connectivity k. The linear trend suggests an assortative behavior of
the transcriptional network. C. Same as A. for the posttranscriptional network. D. Same as B. for the post-
transcriptional network.
Figure 15A and Figure 15B show the global efficiency for the transcriptional scale-free
network and for the random graph (both with M=9666 nodes and K=86846 edges) as
functions of the number of removed nodes through efficiency-based attacks (i.e., attacks
performed removing nodes with the highest efficiency; red line) and random removals
(errors; black line). The true transcriptional network shows a different behavior with
respect to attacks and errors (Figure 15A). The removal of ~30% of nodes in a targeted way
(attack) reduces the network efficiency to about half the initial value and removing ~60%
of the nodes destroys completely the system. Instead, when removing nodes randomly
(error), the drop of the network global efficiency shows a linear dependency with the
number of removed nodes and even for high value of removals (>60%) the system
maintains a considerable efficiency (Figure 15C). The fact that removing specific nodes
causes a rapid drop in the capability of the system to communicate further supports the
scale-free structure of the regulatory graphs and proves the existence of a discrete number
of critical components, i.e. of nodes responsible for the specific structure of the network.
As far as the random graph is concerned (Figure 15B and Figure 15C), differences of
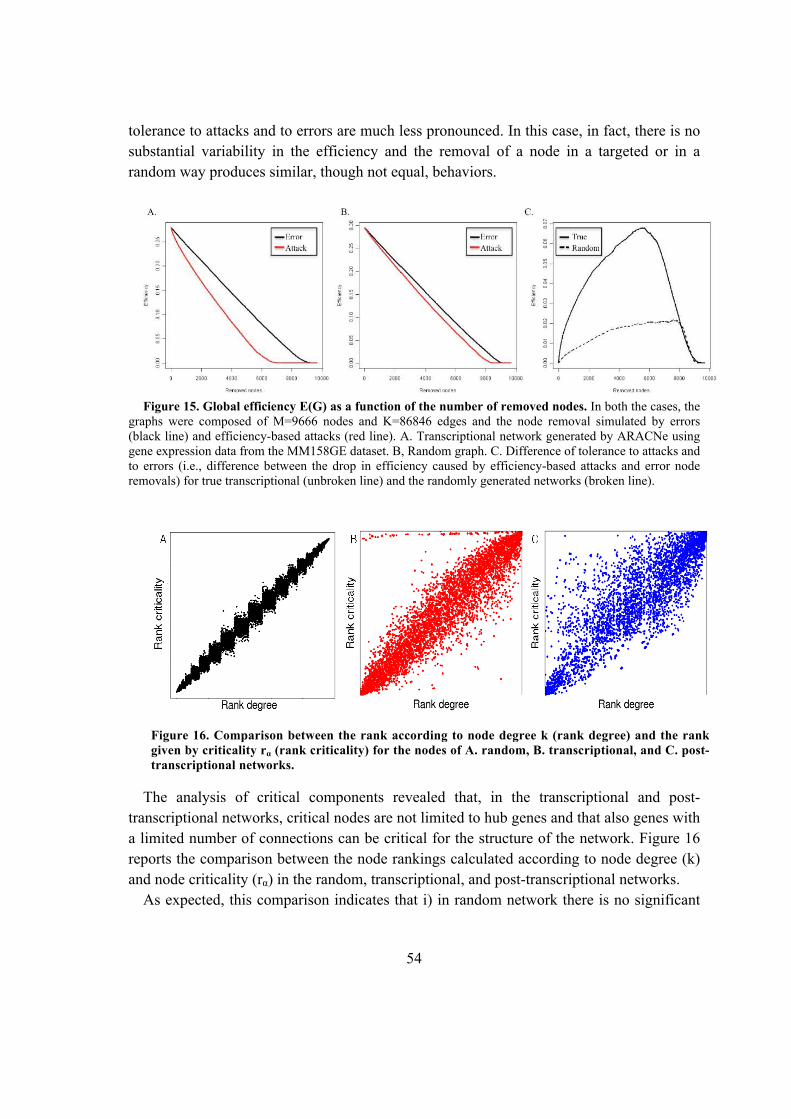
54
tolerance to attacks and to errors are much less pronounced. In this case, in fact, there is no
substantial variability in the efficiency and the removal of a node in a targeted or in a
random way produces similar, though not equal, behaviors.
Figure 15. Global efficiency E(G) as a function of the number of removed nodes. In both the cases, the
graphs were composed of M=9666 nodes and K=86846 edges and the node removal simulated by errors
(black line) and efficiency-based attacks (red line). A. Transcriptional network generated by ARACNe using
gene expression data from the MM158GE dataset. B, Random graph. C. Difference of tolerance to attacks and
to errors (i.e., difference between the drop in efficiency caused by efficiency-based attacks and error node
removals) for true transcriptional (unbroken line) and the randomly generated networks (broken line).
The analysis of critical components revealed that, in the transcriptional and post-
transcriptional networks, critical nodes are not limited to hub genes and that also genes with
a limited number of connections can be critical for the structure of the network. Figure 16
reports the comparison between the node rankings calculated according to node degree (k)
and node criticality (rα) in the random, transcriptional, and post-transcriptional networks.
As expected, this comparison indicates that i) in random network there is no significant
Figure 16. Comparison between the rank according to node degree k (rank degree) and the rank
given by criticality rα (rank criticality) for the nodes of A. random, B. transcriptional, and C. post-
transcriptional networks.
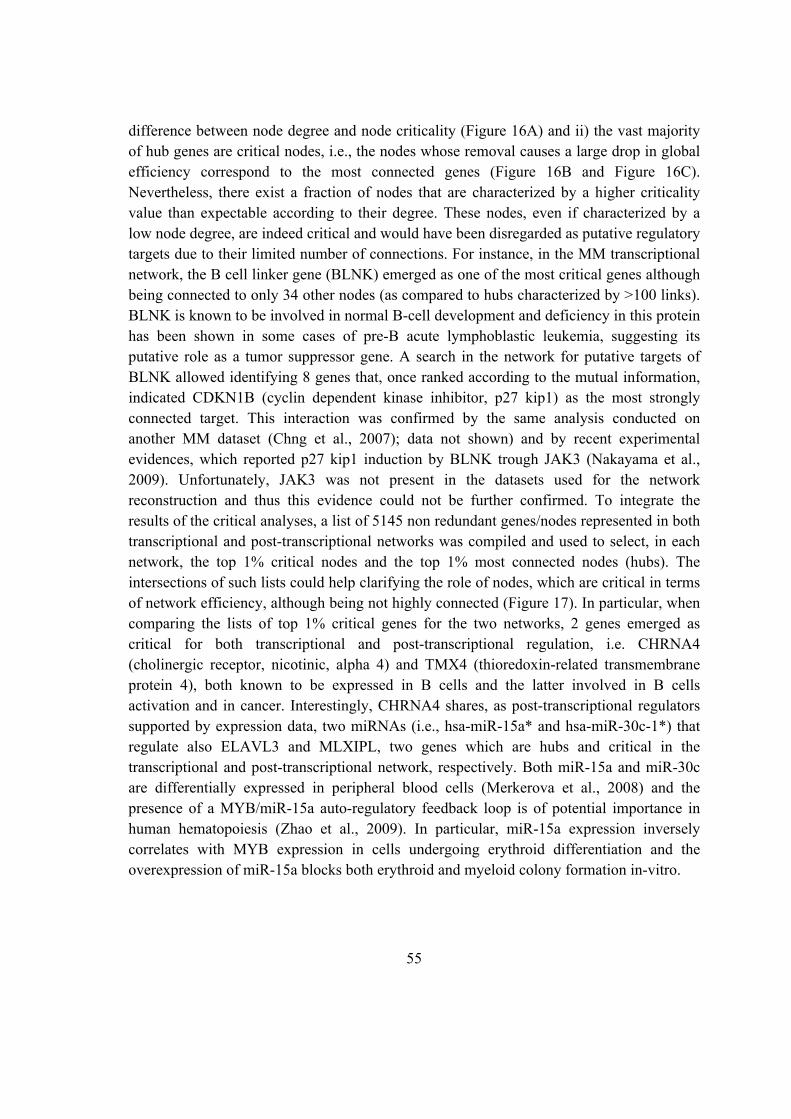
55
difference between node degree and node criticality (Figure 16A) and ii) the vast majority
of hub genes are critical nodes, i.e., the nodes whose removal causes a large drop in global
efficiency correspond to the most connected genes (Figure 16B and Figure 16C).
Nevertheless, there exist a fraction of nodes that are characterized by a higher criticality
value than expectable according to their degree. These nodes, even if characterized by a
low node degree, are indeed critical and would have been disregarded as putative regulatory
targets due to their limited number of connections. For instance, in the MM transcriptional
network, the B cell linker gene (BLNK) emerged as one of the most critical genes although
being connected to only 34 other nodes (as compared to hubs characterized by >100 links).
BLNK is known to be involved in normal B-cell development and deficiency in this protein
has been shown in some cases of pre-B acute lymphoblastic leukemia, suggesting its
putative role as a tumor suppressor gene. A search in the network for putative targets of
BLNK allowed identifying 8 genes that, once ranked according to the mutual information,
indicated CDKN1B (cyclin dependent kinase inhibitor, p27 kip1) as the most strongly
connected target. This interaction was confirmed by the same analysis conducted on
another MM dataset (Chng et al., 2007); data not shown) and by recent experimental
evidences, which reported p27 kip1 induction by BLNK trough JAK3 (Nakayama et al.,
2009). Unfortunately, JAK3 was not present in the datasets used for the network
reconstruction and thus this evidence could not be further confirmed. To integrate the
results of the critical analyses, a list of 5145 non redundant genes/nodes represented in both
transcriptional and post-transcriptional networks was compiled and used to select, in each
network, the top 1% critical nodes and the top 1% most connected nodes (hubs). The
intersections of such lists could help clarifying the role of nodes, which are critical in terms
of network efficiency, although being not highly connected (Figure 17). In particular, when
comparing the lists of top 1% critical genes for the two networks, 2 genes emerged as
critical for both transcriptional and post-transcriptional regulation, i.e. CHRNA4
(cholinergic receptor, nicotinic, alpha 4) and TMX4 (thioredoxin-related transmembrane
protein 4), both known to be expressed in B cells and the latter involved in B cells
activation and in cancer. Interestingly, CHRNA4 shares, as post-transcriptional regulators
supported by expression data, two miRNAs (i.e., hsa-miR-15a* and hsa-miR-30c-1*) that
regulate also ELAVL3 and MLXIPL, two genes which are hubs and critical in the
transcriptional and post-transcriptional network, respectively. Both miR-15a and miR-30c
are differentially expressed in peripheral blood cells (Merkerova et al., 2008) and the
presence of a MYB/miR-15a auto-regulatory feedback loop is of potential importance in
human hematopoiesis (Zhao et al., 2009). In particular, miR-15a expression inversely
correlates with MYB expression in cells undergoing erythroid differentiation and the
overexpression of miR-15a blocks both erythroid and myeloid colony formation in-vitro.
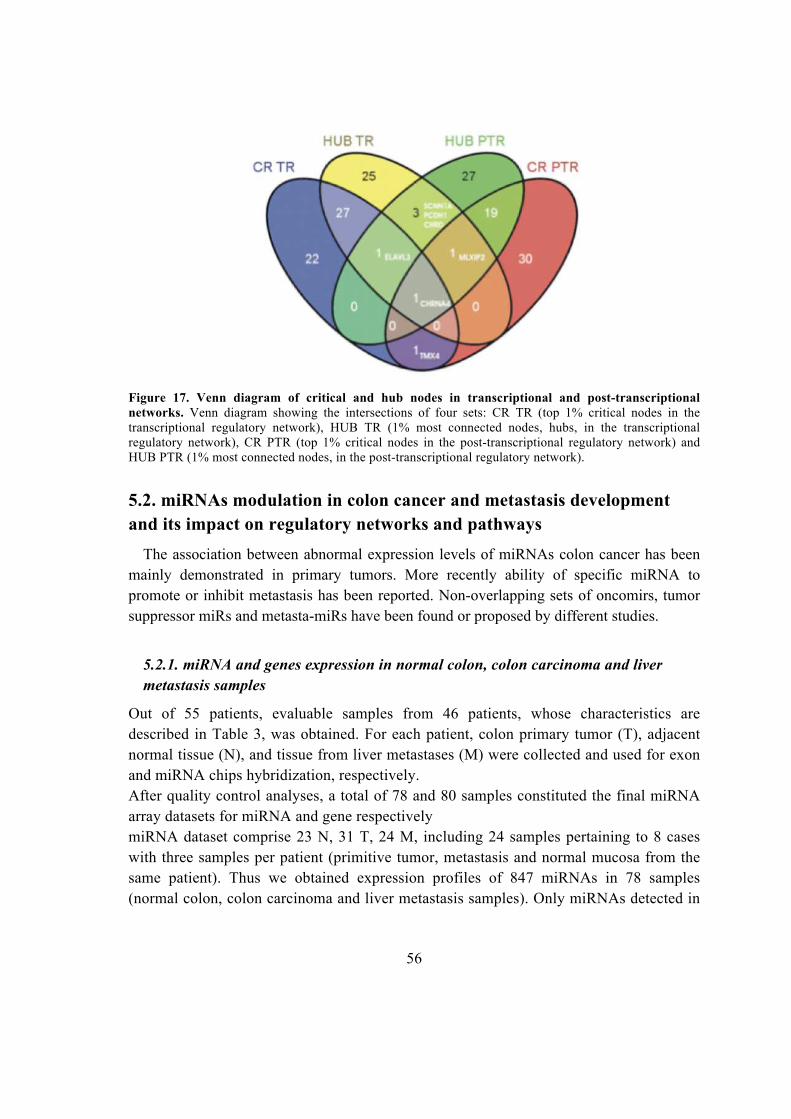
56
Figure 17. Venn diagram of critical and hub nodes in transcriptional and post-transcriptional
networks. Venn diagram showing the intersections of four sets: CR TR (top 1% critical nodes in the
transcriptional regulatory network), HUB TR (1% most connected nodes, hubs, in the transcriptional
regulatory network), CR PTR (top 1% critical nodes in the post-transcriptional regulatory network) and
HUB PTR (1% most connected nodes, in the post-transcriptional regulatory network).
5.2. miRNAs modulation in colon cancer and metastasis development
and its impact on regulatory networks and pathways
The association between abnormal expression levels of miRNAs colon cancer has been
mainly demonstrated in primary tumors. More recently ability of specific miRNA to
promote or inhibit metastasis has been reported. Non-overlapping sets of oncomirs, tumor
suppressor miRs and metasta-miRs have been found or proposed by different studies.
5.2.1. miRNA and genes expression in normal colon, colon carcinoma and liver
metastasis samples
Out of 55 patients, evaluable samples from 46 patients, whose characteristics are
described in Table 3, was obtained. For each patient, colon primary tumor (T), adjacent
normal tissue (N), and tissue from liver metastases (M) were collected and used for exon
and miRNA chips hybridization, respectively.
After quality control analyses, a total of 78 and 80 samples constituted the final miRNA
array datasets for miRNA and gene respectively
miRNA dataset comprise 23 N, 31 T, 24 M, including 24 samples pertaining to 8 cases
with three samples per patient (primitive tumor, metastasis and normal mucosa from the
same patient). Thus we obtained expression profiles of 847 miRNAs in 78 samples
(normal colon, colon carcinoma and liver metastasis samples). Only miRNAs detected in
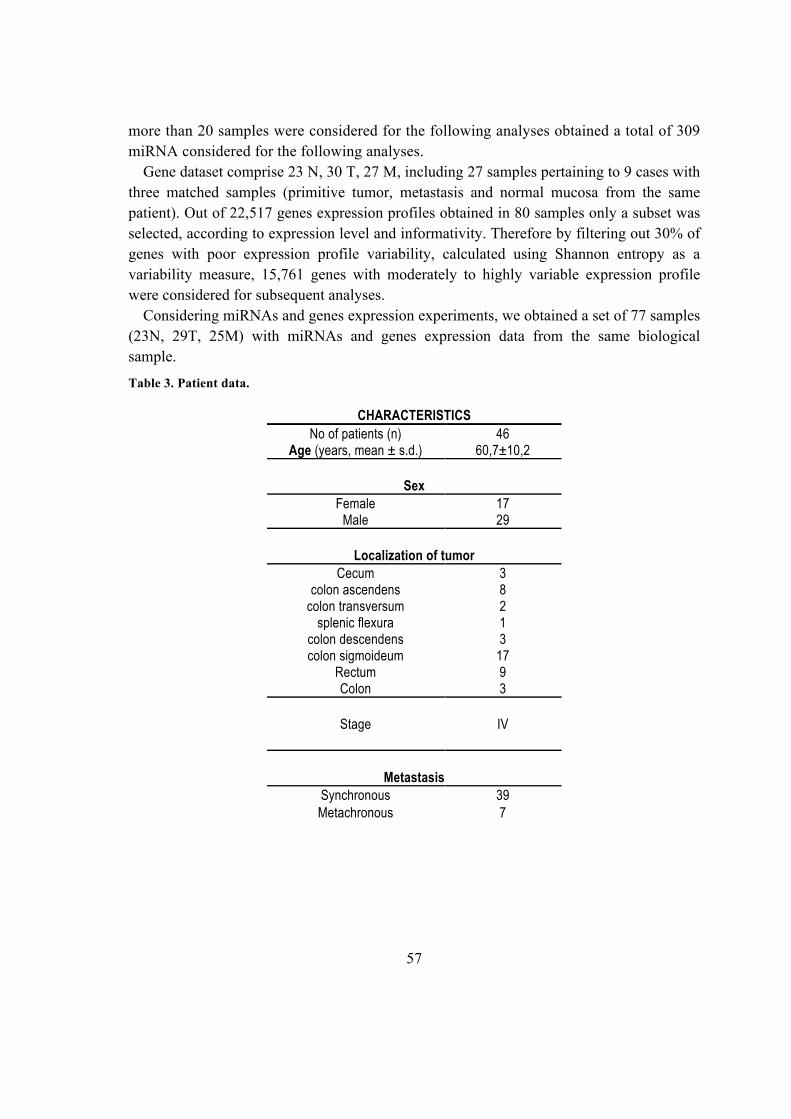
57
more than 20 samples were considered for the following analyses obtained a total of 309
miRNA considered for the following analyses.
Gene dataset comprise 23 N, 30 T, 27 M, including 27 samples pertaining to 9 cases with
three matched samples (primitive tumor, metastasis and normal mucosa from the same
patient). Out of 22,517 genes expression profiles obtained in 80 samples only a subset was
selected, according to expression level and informativity. Therefore by filtering out 30% of
genes with poor expression profile variability, calculated using Shannon entropy as a
variability measure, 15,761 genes with moderately to highly variable expression profile
were considered for subsequent analyses.
Considering miRNAs and genes expression experiments, we obtained a set of 77 samples
(23N, 29T, 25M) with miRNAs and genes expression data from the same biological
sample.
Table 3. Patient data.
CHARACTERISTICS
No of patients (n) 46 Age (years, mean ± s.d.) 60,7±10,2
Sex
Female 17 Male 29
Localization of tumor
Cecum 3 colon ascendens 8 colon transversum 2 splenic flexura 1
colon descendens 3 colon sigmoideum 17
Rectum 9 Colon 3
Stage
IV
Metastasis
Synchronous 39 Metachronous 7
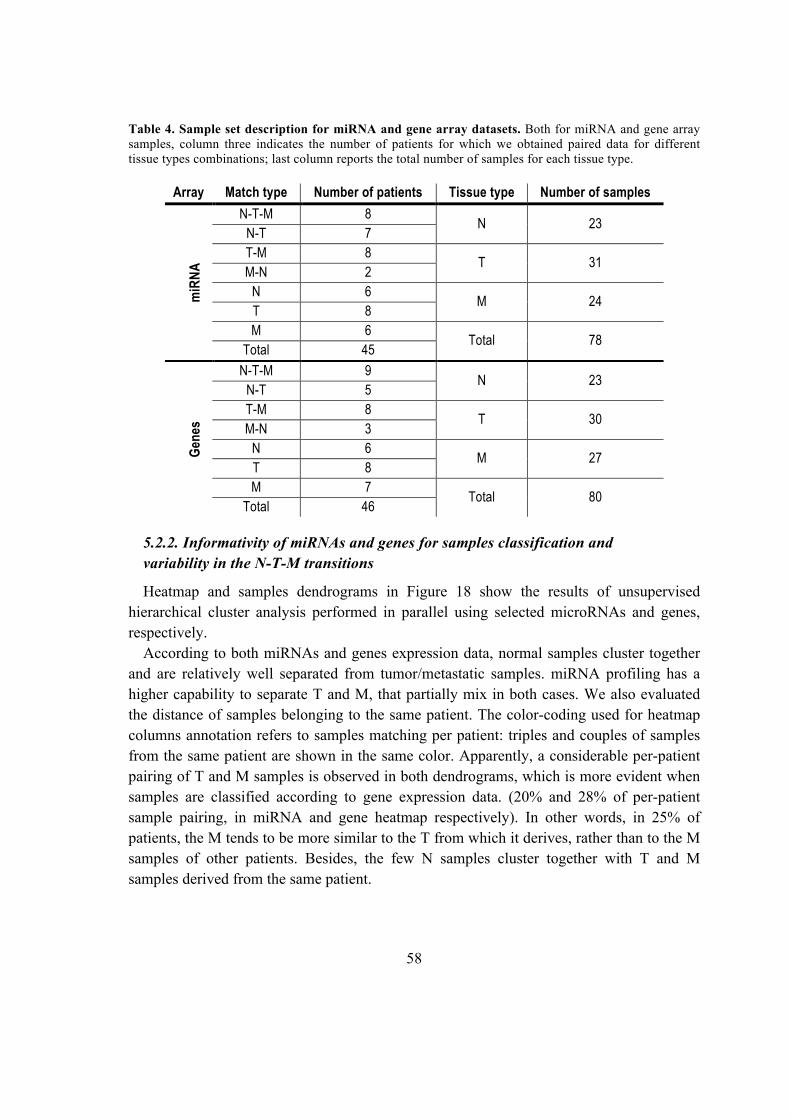
58
Table 4. Sample set description for miRNA and gene array datasets. Both for miRNA and gene array
samples, column three indicates the number of patients for which we obtained paired data for different
tissue types combinations; last column reports the total number of samples for each tissue type.
Array Match type Number of patients Tissue type Number of samples
miR
NA
N-T-M 8 N 23
N-T 7
T-M 8 T 31
M-N 2
N 6 M 24
T 8
M 6 Total 78
Total 45
Gen
es
N-T-M 9 N 23
N-T 5
T-M 8 T 30
M-N 3
N 6 M 27
T 8
M 7 Total 80
Total 46
5.2.2. Informativity of miRNAs and genes for samples classification and
variability in the N-T-M transitions
Heatmap and samples dendrograms in Figure 18 show the results of unsupervised
hierarchical cluster analysis performed in parallel using selected microRNAs and genes,
respectively.
According to both miRNAs and genes expression data, normal samples cluster together
and are relatively well separated from tumor/metastatic samples. miRNA profiling has a
higher capability to separate T and M, that partially mix in both cases. We also evaluated
the distance of samples belonging to the same patient. The color-coding used for heatmap
columns annotation refers to samples matching per patient: triples and couples of samples
from the same patient are shown in the same color. Apparently, a considerable per-patient
pairing of T and M samples is observed in both dendrograms, which is more evident when
samples are classified according to gene expression data. (20% and 28% of per-patient
sample pairing, in miRNA and gene heatmap respectively). In other words, in 25% of
patients, the M tends to be more similar to the T from which it derives, rather than to the M
samples of other patients. Besides, the few N samples cluster together with T and M
samples derived from the same patient.
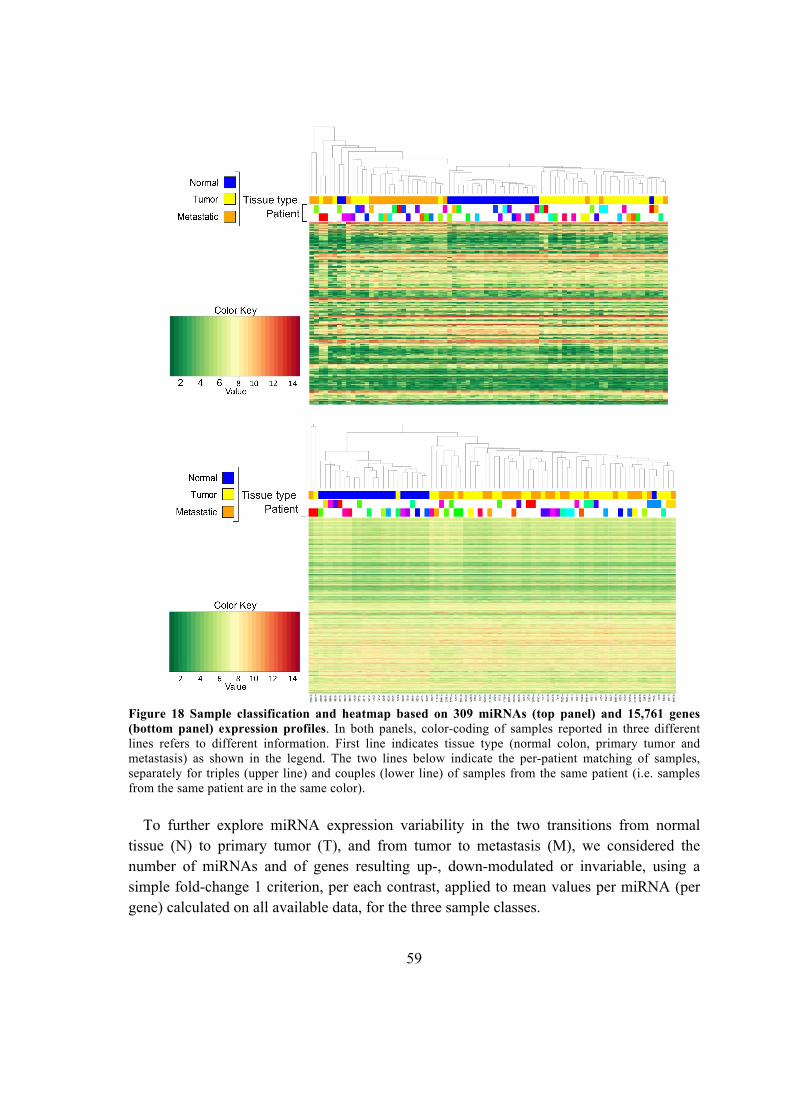
59
Figure 18 Sample classification and heatmap based on 309 miRNAs (top panel) and 15,761 genes
(bottom panel) expression profiles. In both panels, color-coding of samples reported in three different
lines refers to different information. First line indicates tissue type (normal colon, primary tumor and
metastasis) as shown in the legend. The two lines below indicate the per-patient matching of samples,
separately for triples (upper line) and couples (lower line) of samples from the same patient (i.e. samples
from the same patient are in the same color).
To further explore miRNA expression variability in the two transitions from normal
tissue (N) to primary tumor (T), and from tumor to metastasis (M), we considered the
number of miRNAs and of genes resulting up-, down-modulated or invariable, using a
simple fold-change 1 criterion, per each contrast, applied to mean values per miRNA (per
gene) calculated on all available data, for the three sample classes.
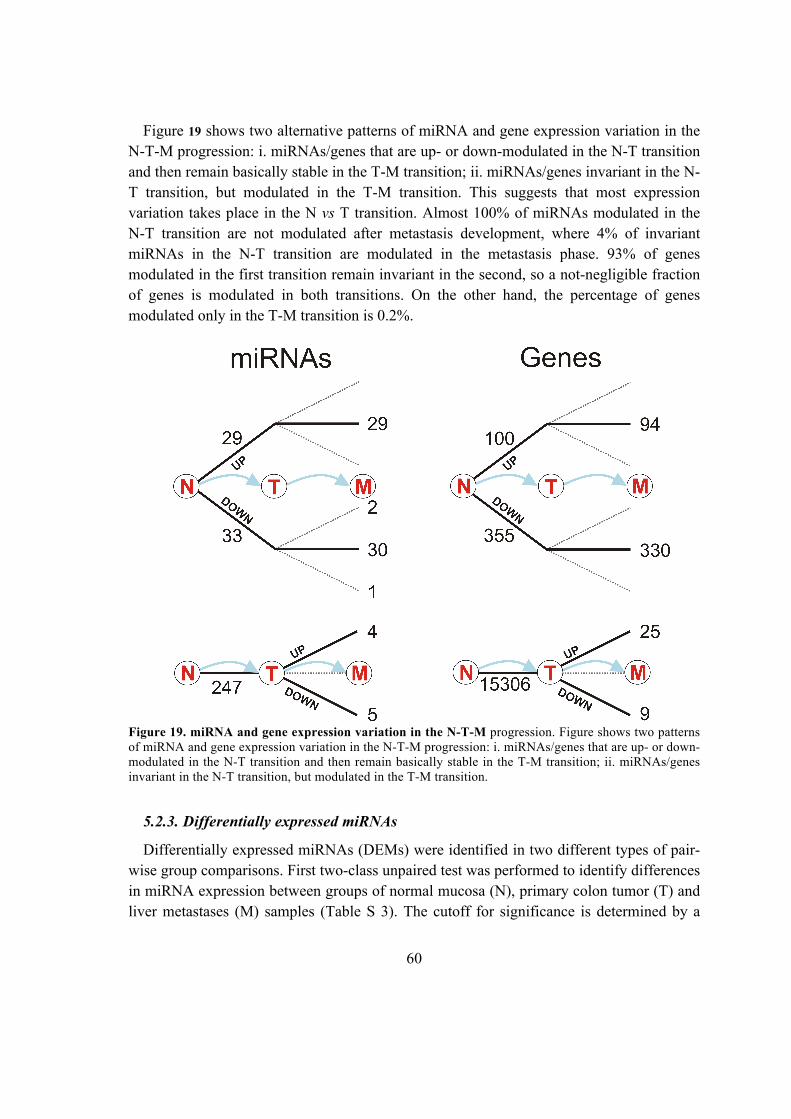
60
Figure 19 shows two alternative patterns of miRNA and gene expression variation in the
N-T-M progression: i. miRNAs/genes that are up- or down-modulated in the N-T transition
and then remain basically stable in the T-M transition; ii. miRNAs/genes invariant in the N-
T transition, but modulated in the T-M transition. This suggests that most expression
variation takes place in the N vs T transition. Almost 100% of miRNAs modulated in the
N-T transition are not modulated after metastasis development, where 4% of invariant
miRNAs in the N-T transition are modulated in the metastasis phase. 93% of genes
modulated in the first transition remain invariant in the second, so a not-negligible fraction
of genes is modulated in both transitions. On the other hand, the percentage of genes
modulated only in the T-M transition is 0.2%.
Figure 19. miRNA and gene expression variation in the N-T-M progression. Figure shows two patterns
of miRNA and gene expression variation in the N-T-M progression: i. miRNAs/genes that are up- or down-
modulated in the N-T transition and then remain basically stable in the T-M transition; ii. miRNAs/genes
invariant in the N-T transition, but modulated in the T-M transition.
5.2.3. Differentially expressed miRNAs
Differentially expressed miRNAs (DEMs) were identified in two different types of pair-
wise group comparisons. First two-class unpaired test was performed to identify differences
in miRNA expression between groups of normal mucosa (N), primary colon tumor (T) and
liver metastases (M) samples (Table S 3). The cutoff for significance is determined by a
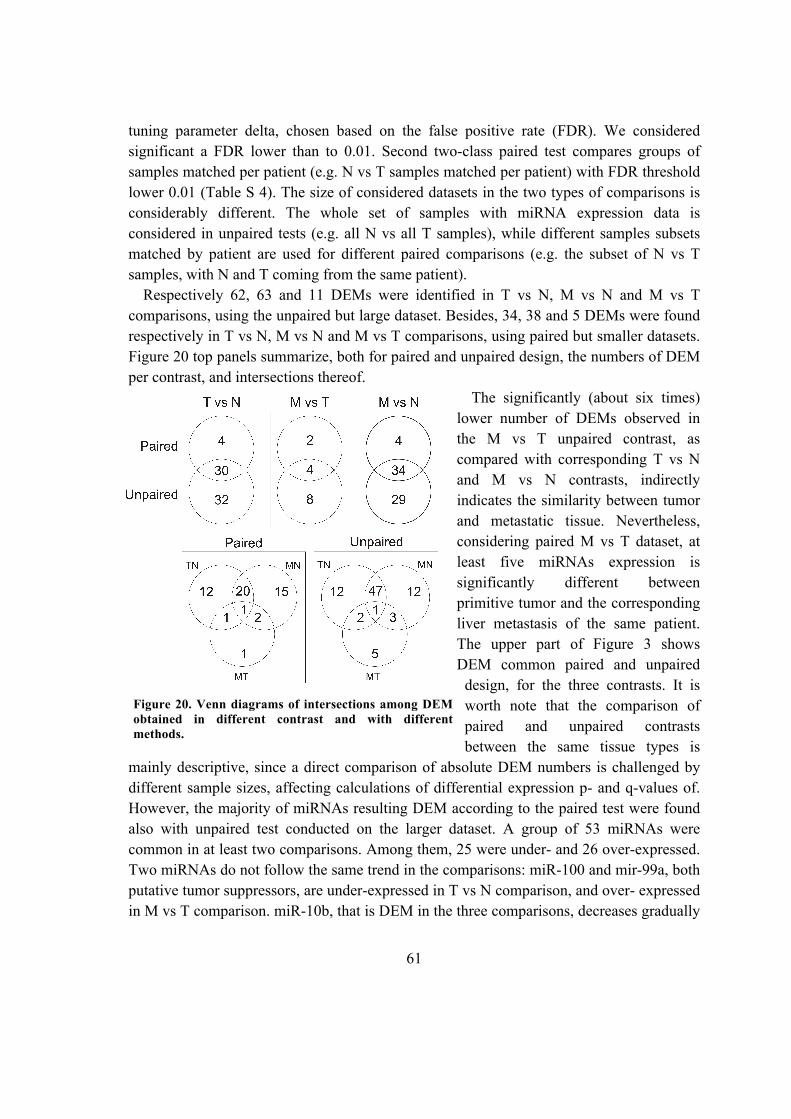
61
tuning parameter delta, chosen based on the false positive rate (FDR). We considered
significant a FDR lower than to 0.01. Second two-class paired test compares groups of
samples matched per patient (e.g. N vs T samples matched per patient) with FDR threshold
lower 0.01 (Table S 4). The size of considered datasets in the two types of comparisons is
considerably different. The whole set of samples with miRNA expression data is
considered in unpaired tests (e.g. all N vs all T samples), while different samples subsets
matched by patient are used for different paired comparisons (e.g. the subset of N vs T
samples, with N and T coming from the same patient).
Respectively 62, 63 and 11 DEMs were identified in T vs N, M vs N and M vs T
comparisons, using the unpaired but large dataset. Besides, 34, 38 and 5 DEMs were found
respectively in T vs N, M vs N and M vs T comparisons, using paired but smaller datasets.
Figure 20 top panels summarize, both for paired and unpaired design, the numbers of DEM
per contrast, and intersections thereof.
The significantly (about six times)
lower number of DEMs observed in
the M vs T unpaired contrast, as
compared with corresponding T vs N
and M vs N contrasts, indirectly
indicates the similarity between tumor
and metastatic tissue. Nevertheless,
considering paired M vs T dataset, at
least five miRNAs expression is
significantly different between
primitive tumor and the corresponding
liver metastasis of the same patient.
The upper part of Figure 3 shows
DEM common paired and unpaired
design, for the three contrasts. It is
worth note that the comparison of
paired and unpaired contrasts
between the same tissue types is
mainly descriptive, since a direct comparison of absolute DEM numbers is challenged by
different sample sizes, affecting calculations of differential expression p- and q-values of.
However, the majority of miRNAs resulting DEM according to the paired test were found
also with unpaired test conducted on the larger dataset. A group of 53 miRNAs were
common in at least two comparisons. Among them, 25 were under- and 26 over-expressed.
Two miRNAs do not follow the same trend in the comparisons: miR-100 and mir-99a, both
putative tumor suppressors, are under-expressed in T vs N comparison, and over- expressed
in M vs T comparison. miR-10b, that is DEM in the three comparisons, decreases gradually
Figure 20. Venn diagrams of intersections among DEM
obtained in different contrast and with different
methods.
62
in the N, T and M series.
5.2.4. RT-PCR miRNA expression validation
A key issue for evaluating results robustness is the agreement of expression estimations
obtained by array and qRT-PCR techniques. The goodness of array-based results was tested
with two strategies using: i. qRT-PCR on the same RNA samples and ii. on an independent
set of patients. Quantitative RT-PCR analysis was performed using TaqMan MicroRNA
Assays (Applied Biosystems Technologies, Milan, IT) in all 78 samples constituted the
final miRNA array dataset three times in triplicate. We used Shannon entropy, a measure of
the information content of expression profiles (i.e. of profile variability) and identified
miR-200c as a trustable control with minimum entropy and detectable expression used for
normalize miRNA expression results obtained by qRT-PCR.
So the expression measure of 5 miRNA, three down-regulated miRNA (has-miR-150,
hsa-miR-10b, hsa-miR-146a) and two up-regulated (has-miR-210 and has-miR-122).
miR-150 is the most down-regulated miRNAs in T vs N comparison, whereas miR-10b
since it is DEM in all the three contrasts. miRNA-122 and miRNA-146a are DEM in
comparison M vs T. miR-122, highly liver-specific and important in hepatitis C virus
infection, cholesterol metabolism and hepatocellular carcinoma (Filipowicz and Grosshans,
2011), appeared to be strongly up-regulated in M vs T. Instead miR-146a is the most down-
regulated miRNA in the same comparison. miR-210 was selected because up-regulated in
M vs T and M vs N comparisons and a robust target of hypoxia-inducible factor, and its
overexpression has been detected in a variety of cardiovascular diseases and solid tumors.
High levels of miR-210 have been linked to an in vivo hypoxic signature and associated
with adverse prognosis in cancer patients (Huang et al., 2010).
For the first strategy, we correlated the qRT-PCR data (2-∆Ct
as expression estimation) for
each miRNA with the corresponding expression level measured by microarray experiments
using Spearman rank correlation, that is robust against outliers. The correlation coefficients
were all significantly positive and significant (P < 0.01).
Furthermore, miR-150 and miR-146a were also tested in an independent set of 7 patients
which matched tissue and the results confirmed data obtained with microarray data.
The expression level of miR-122, a highly liver-specific miRNA, was significantly
different between primary and liver metastatic tumors (7.9 Fold Change) suggesting the
effect from normal hepatocyte contamination. In order to verify this hypothesis, miR-122
expression was evaluated in samples where normal colon and liver tissue had been mixed
in different proportions. Results obtained in RT-PCR confirmed the contamination effect,
since a combination including more than 80% of colon tissue still revealed the expression
of miR-122.
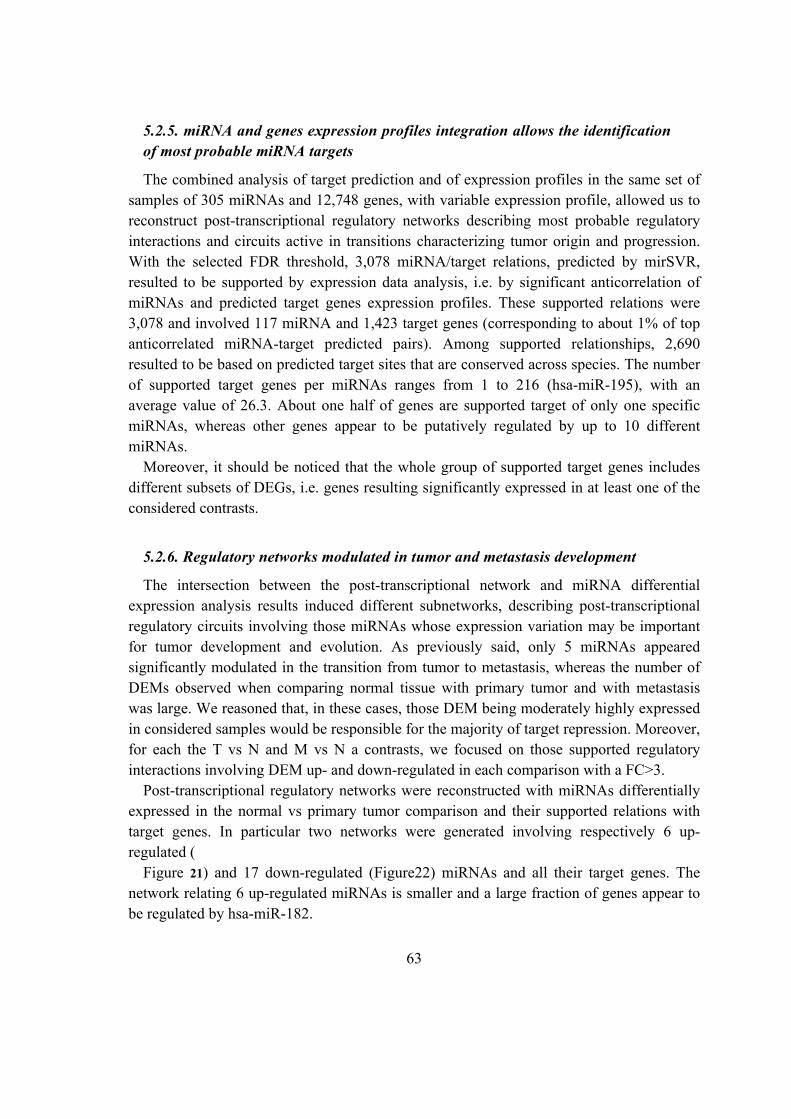
63
5.2.5. miRNA and genes expression profiles integration allows the identification
of most probable miRNA targets
The combined analysis of target prediction and of expression profiles in the same set of
samples of 305 miRNAs and 12,748 genes, with variable expression profile, allowed us to
reconstruct post-transcriptional regulatory networks describing most probable regulatory
interactions and circuits active in transitions characterizing tumor origin and progression.
With the selected FDR threshold, 3,078 miRNA/target relations, predicted by mirSVR,
resulted to be supported by expression data analysis, i.e. by significant anticorrelation of
miRNAs and predicted target genes expression profiles. These supported relations were
3,078 and involved 117 miRNA and 1,423 target genes (corresponding to about 1% of top
anticorrelated miRNA-target predicted pairs). Among supported relationships, 2,690
resulted to be based on predicted target sites that are conserved across species. The number
of supported target genes per miRNAs ranges from 1 to 216 (hsa-miR-195), with an
average value of 26.3. About one half of genes are supported target of only one specific
miRNAs, whereas other genes appear to be putatively regulated by up to 10 different
miRNAs.
Moreover, it should be noticed that the whole group of supported target genes includes
different subsets of DEGs, i.e. genes resulting significantly expressed in at least one of the
considered contrasts.
5.2.6. Regulatory networks modulated in tumor and metastasis development
The intersection between the post-transcriptional network and miRNA differential
expression analysis results induced different subnetworks, describing post-transcriptional
regulatory circuits involving those miRNAs whose expression variation may be important
for tumor development and evolution. As previously said, only 5 miRNAs appeared
significantly modulated in the transition from tumor to metastasis, whereas the number of
DEMs observed when comparing normal tissue with primary tumor and with metastasis
was large. We reasoned that, in these cases, those DEM being moderately highly expressed
in considered samples would be responsible for the majority of target repression. Moreover,
for each the T vs N and M vs N a contrasts, we focused on those supported regulatory
interactions involving DEM up- and down-regulated in each comparison with a FC>3.
Post-transcriptional regulatory networks were reconstructed with miRNAs differentially
expressed in the normal vs primary tumor comparison and their supported relations with
target genes. In particular two networks were generated involving respectively 6 up-
regulated (
Figure 21) and 17 down-regulated (Figure22) miRNAs and all their target genes. The
network relating 6 up-regulated miRNAs is smaller and a large fraction of genes appear to
be regulated by hsa-miR-182.
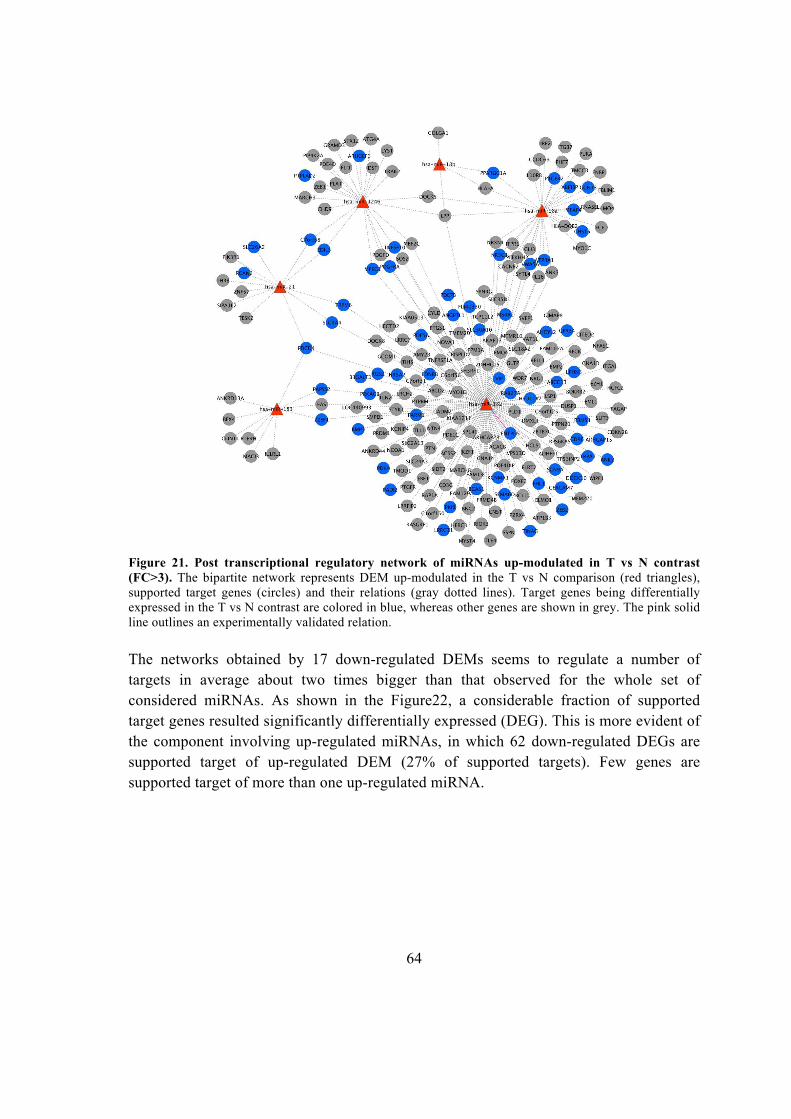
64
Figure 21. Post transcriptional regulatory network of miRNAs up-modulated in T vs N contrast
(FC>3). The bipartite network represents DEM up-modulated in the T vs N comparison (red triangles),
supported target genes (circles) and their relations (gray dotted lines). Target genes being differentially
expressed in the T vs N contrast are colored in blue, whereas other genes are shown in grey. The pink solid
line outlines an experimentally validated relation.
The networks obtained by 17 down-regulated DEMs seems to regulate a number of
targets in average about two times bigger than that observed for the whole set of
considered miRNAs. As shown in the Figure22, a considerable fraction of supported
target genes resulted significantly differentially expressed (DEG). This is more evident of
the component involving up-regulated miRNAs, in which 62 down-regulated DEGs are
supported target of up-regulated DEM (27% of supported targets). Few genes are
supported target of more than one up-regulated miRNA.
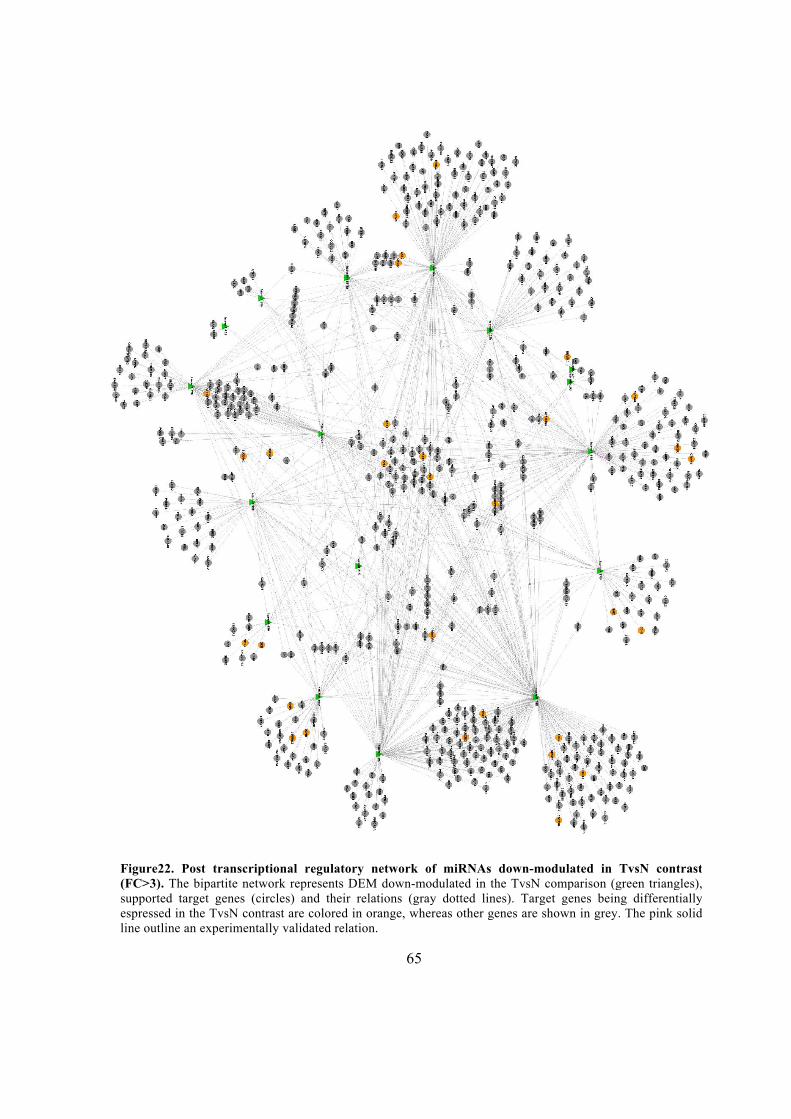
65
Figure22. Post transcriptional regulatory network of miRNAs down-modulated in TvsN contrast
(FC>3). The bipartite network represents DEM down-modulated in the TvsN comparison (green triangles),
supported target genes (circles) and their relations (gray dotted lines). Target genes being differentially
espressed in the TvsN contrast are colored in orange, whereas other genes are shown in grey. The pink solid
line outline an experimentally validated relation.

66
Figure 23 represents the network
involving five DEM observed in the M vs
T contrast and their supported target genes.
This network is small and consists of five
unconnected components. No differentially
expressed genes were observed among the
supported targets on miRNAs differentially
expressed in the tumor to metastasis
transition.
5.2.7. miR-182 control ENTPD5
Among the interactions between miRNA
and target genes detected in our
regulatory network, miR-145–c-Myc and
miR-182–ENTPD5 relationships were
experimentally validated using RT-PCR.
Data from expression arrays indicated
that c-Myc mRNA is up-regulated in T vs N samples anti-correlating with down-regulation
observed for miR-145. We examined this expression profile by qRT-PCR confirming the
miR-mRNA modulation in the transition from normal to primary tumor and metastasis. As
in literature, even in our series miR-145 is down-modulated in primary tumor and in
metastases, while c-Myc is up-modulated (Figure S 1).
ENTPD5, known also as PCPH proto-oncogene, belongs to the family of ectonucleoside
triphosphate diphosphohydrolase enzymes that hydrolyze extracellular tri- and
diphosphonucleosides and are components of cellular purinergic signaling.
The importance of the interplay between miR-182 and ENTPD5, is supported by their
expression behavior that was investigated by qRT-PCR in a panel of 5 tumor cell lines of
colon cancer. As shown in Figure 24B, higher expression of miR-182 and lower expression
of ENTPD5 were observed in all tumor cell lines as compared to normal colon mucosa.
This result not only confirms the microarray profiling data but also suggests a role of the
anti-correlated relationship in conferring some advantageous property to the tumor cells.
The functional relationship was further validated by Luciferase reporter assay in HEK293T
cells transfected with construct containing the firefly luciferase gene fused to the 3’-UTR of
ENTPD5 (pMIR-ENTPD5). When cells were co-transfected with hsa-miR-182, we
observed a 50% reduction in luciferase expression as compared to cells transfected with a
control plasmid (P<0.05) (Figure 24A).
Figure 23. Post transcriptional regulatory network
of miRNAs modulated in MvsT contrast. The
bipartite network represents DEM up- and down-
modulated (red and green triangles, respectively) in the
MvsT comparison, supported target genes (circles) and
their relations (gray dotted lines).
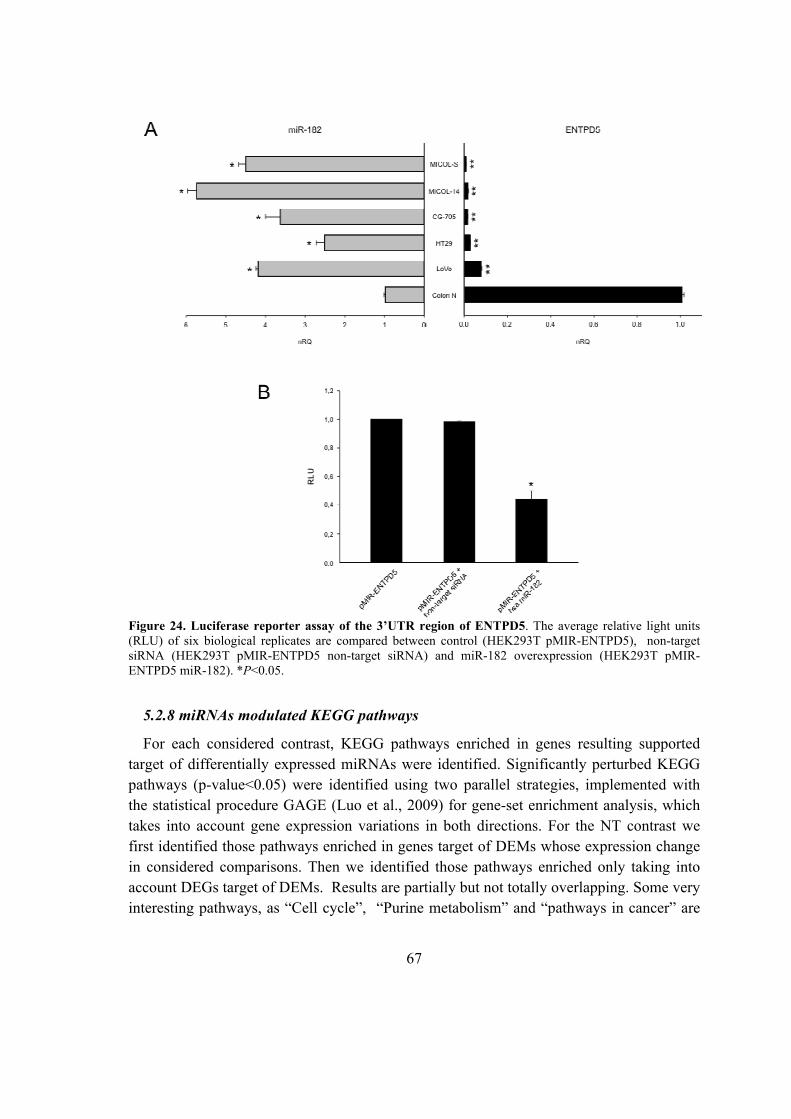
67
Figure 24. Luciferase reporter assay of the 3’UTR region of ENTPD5. The average relative light units
(RLU) of six biological replicates are compared between control (HEK293T pMIR-ENTPD5), non-target
siRNA (HEK293T pMIR-ENTPD5 non-target siRNA) and miR-182 overexpression (HEK293T pMIR-
ENTPD5 miR-182). *P<0.05.
5.2.8 miRNAs modulated KEGG pathways
For each considered contrast, KEGG pathways enriched in genes resulting supported
target of differentially expressed miRNAs were identified. Significantly perturbed KEGG
pathways (p-value<0.05) were identified using two parallel strategies, implemented with
the statistical procedure GAGE (Luo et al., 2009) for gene-set enrichment analysis, which
takes into account gene expression variations in both directions. For the NT contrast we
first identified those pathways enriched in genes target of DEMs whose expression change
in considered comparisons. Then we identified those pathways enriched only taking into
account DEGs target of DEMs. Results are partially but not totally overlapping. Some very
interesting pathways, as “Cell cycle”, “Purine metabolism” and “pathways in cancer” are

68
found in both cases, whereas other as “P53 signaling” is identified by the first, less
conservative strategy. On the other hand, “Wnt signaling” and “Colorectal cancer”
pathways are found specifically enriched in DEGs target of DEMs (Table S 5).
5.3. microRNA expression in HTLV-1 infection and adult T-cell
leukemia/lymphoma
Human T-cell leukemia virus type 1 (HTLV-1) infects approximately 20 million people
worldwide. About 5% of infected individuals develop an aggressive malignancy of mature
CD4+ T-cells termed adult T-cell leukemia/lymphoma (ATLL) or a progressive
neurological disease termed tropical spastic paraparesis/HTLV-associated myelopathy
(TSP/HAM)(Goncalves et al., 2010). The transforming potential of HTLV-1 is attributable
primarily to the viral protein Tax, which, in addition to transactivating the viral promoter,
affects the expression and function of cellular genes controlling cell turnover and
chromosome stability(Saggioro et al., 2009).
5.3.1. microRNAs with altered expression in ATLL cells
Expression of microRNAs in 7 ATLL samples was examined using microRNA-
microarrays
Table 5.
Table 5. ATLL patient samples
Patient Gender/age (years) Diagnosis WBC (cells/µl) CD4+CD25+
(cells/µl) % CD4+CD25+ Therapy
ATL1 M/48 Leukemia 40,500 31,646 78 RIT
ATL3 M/53 Leukemia 39,700 30,211 76 Zenapax
ATL5a F/50 Leukemia 49,300 40,640 82 CHOP
ATL12 M/41 Leukemia 10,500 4,958 47 CVP
ATL14 M/34 Leukemia 90,600 84,715 94 None
ATL24 F/36 Lymphoma 6,680 1,486 22 CHOP
ATL32 M/54 Leukemia 34,400 26,595 77 None
Controls consisted of 4 sets of resting and stimulated CD4+ cells. Only miRNA with
signal intensities in the upper 3 quartiles in at least 2 samples, corresponding to an
expression value of 5.91, was selected, giving rise to a subset of 137 microRNAs.
Unsupervised cluster analysis was performed on this dataset using SPSS software, with
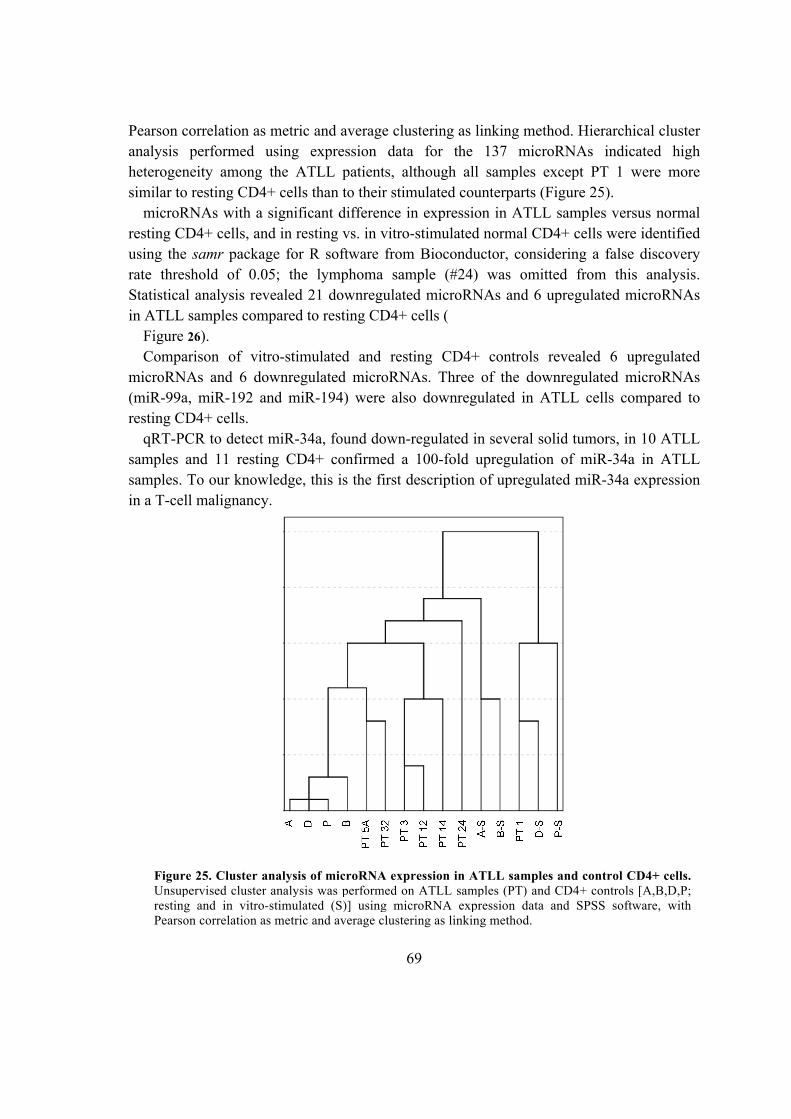
69
Pearson correlation as metric and average clustering as linking method. Hierarchical cluster
analysis performed using expression data for the 137 microRNAs indicated high
heterogeneity among the ATLL patients, although all samples except PT 1 were more
similar to resting CD4+ cells than to their stimulated counterparts (Figure 25).
microRNAs with a significant difference in expression in ATLL samples versus normal
resting CD4+ cells, and in resting vs. in vitro-stimulated normal CD4+ cells were identified
using the samr package for R software from Bioconductor, considering a false discovery
rate threshold of 0.05; the lymphoma sample (#24) was omitted from this analysis.
Statistical analysis revealed 21 downregulated microRNAs and 6 upregulated microRNAs
in ATLL samples compared to resting CD4+ cells (
Figure 26).
Comparison of vitro-stimulated and resting CD4+ controls revealed 6 upregulated
microRNAs and 6 downregulated microRNAs. Three of the downregulated microRNAs
(miR-99a, miR-192 and miR-194) were also downregulated in ATLL cells compared to
resting CD4+ cells.
qRT-PCR to detect miR-34a, found down-regulated in several solid tumors, in 10 ATLL
samples and 11 resting CD4+ confirmed a 100-fold upregulation of miR-34a in ATLL
samples. To our knowledge, this is the first description of upregulated miR-34a expression
in a T-cell malignancy.
Figure 25. Cluster analysis of microRNA expression in ATLL samples and control CD4+ cells.
Unsupervised cluster analysis was performed on ATLL samples (PT) and CD4+ controls [A,B,D,P;
resting and in vitro-stimulated (S)] using microRNA expression data and SPSS software, with
Pearson correlation as metric and average clustering as linking method.
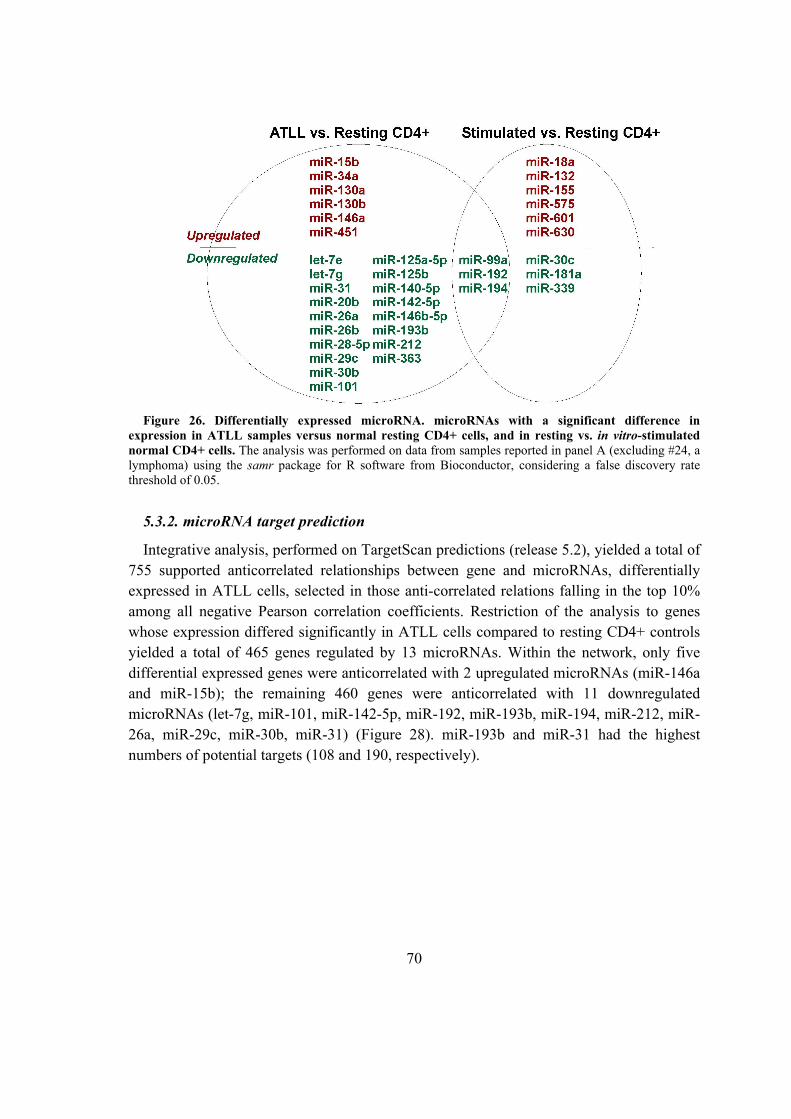
70
Figure 26. Differentially expressed microRNA. microRNAs with a significant difference in
expression in ATLL samples versus normal resting CD4+ cells, and in resting vs. in vitro-stimulated
normal CD4+ cells. The analysis was performed on data from samples reported in panel A (excluding #24, a
lymphoma) using the samr package for R software from Bioconductor, considering a false discovery rate
threshold of 0.05.
5.3.2. microRNA target prediction
Integrative analysis, performed on TargetScan predictions (release 5.2), yielded a total of
755 supported anticorrelated relationships between gene and microRNAs, differentially
expressed in ATLL cells, selected in those anti-correlated relations falling in the top 10%
among all negative Pearson correlation coefficients. Restriction of the analysis to genes
whose expression differed significantly in ATLL cells compared to resting CD4+ controls
yielded a total of 465 genes regulated by 13 microRNAs. Within the network, only five
differential expressed genes were anticorrelated with 2 upregulated microRNAs (miR-146a
and miR-15b); the remaining 460 genes were anticorrelated with 11 downregulated
microRNAs (let-7g, miR-101, miR-142-5p, miR-192, miR-193b, miR-194, miR-212, miR-
26a, miR-29c, miR-30b, miR-31) (Figure 28). miR-193b and miR-31 had the highest
numbers of potential targets (108 and 190, respectively).

71
Figure 27. Piechar of the mapping of enriched BP terms to respectively 20 main functional classes of
GO biological process terms. Figure shows the mapping of enriched BP terms to respectively 20 main
functional classes.
Enrichment analysis performed using GOstats R packages highlighted 109 genes (out of
460 present in the network) belong to the GO term “developmental processes”, enriched
with a P-value of 0.0036. twenty-one genes belong to GO Term “growth” and 11 to
“regulation of cell growth” (see Table S 6). Figure 27 shows the result of enriched GO
terms group in the respectively 20 main functional classes of biological process GO terms.
Moreover the most represented pathways according to KEGG (Kyoto Encyclopedia of
Genes and Genomes) analysis of pathways (http://www.genome.jp/kegg/) using DAVID
are “pathways in cancer”, “Wnt signaling pathway” and again “cell cycle”.
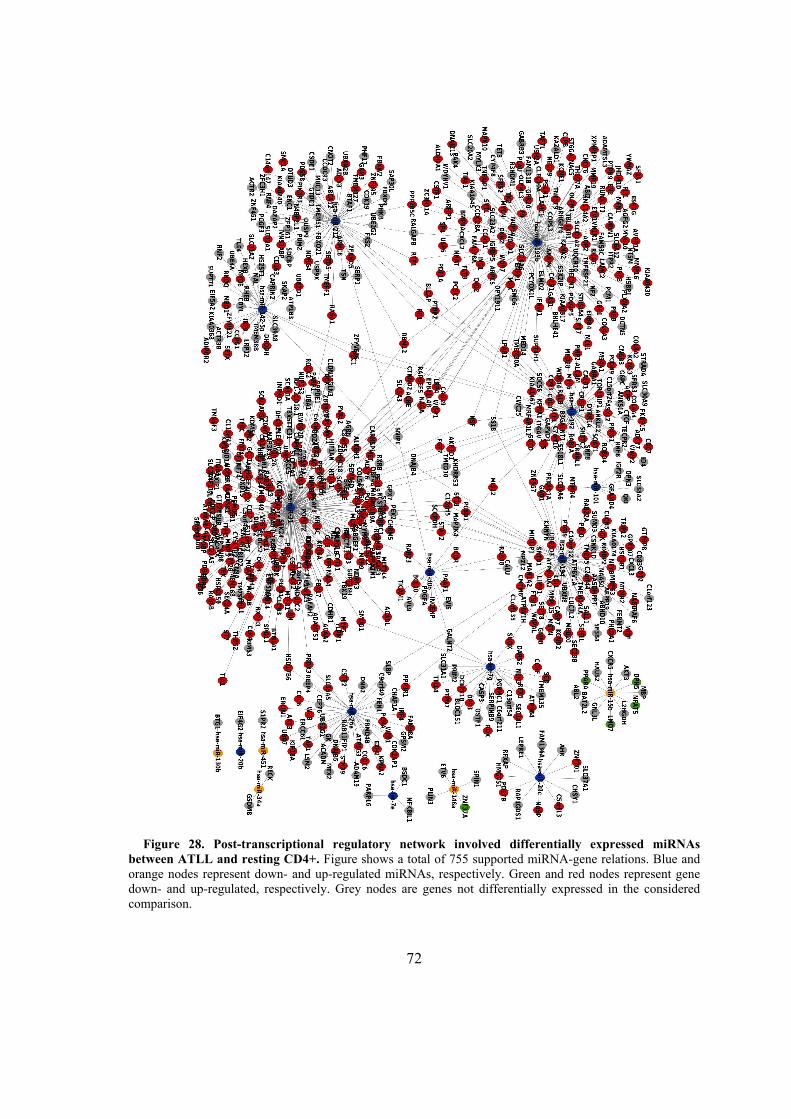
72
Figure 28. Post-transcriptional regulatory network involved differentially expressed miRNAs
between ATLL and resting CD4+. Figure shows a total of 755 supported miRNA-gene relations. Blue and
orange nodes represent down- and up-regulated miRNAs, respectively. Green and red nodes represent gene
down- and up-regulated, respectively. Grey nodes are genes not differentially expressed in the considered
comparison.
73
5.4. MAGIA, a web-based tool for miRNA and Genes Integrated
Analysis
miRNAs can have multiple targets and that each protein-coding gene can be targeted by
multiple miRNAs, it has been suggested that more than one third of human genes could
be regulated by miRNAs. In this perspective, the networks of post-transcriptional
regulatory relationships tend to have a highly complex nature. All computational
approaches applied to predict miRNA targets are plagued by a significant fraction of false
positives. This is caused not only by the limited comprehension of the molecular basis of
miRNA–target pairing, but also by the context-dependency of post-transcriptional
regulation. According to the increasing experimental evidences supporting the miRNA
mechanism of target degradation rather than translational repression, the integration of
target predictions with miRNA and gene expression profiles has been proposed to
improve the detection of functional miRNA–mRNA relationships. Since miRNAs tend to
down-regulate target mRNAs (Bagga et al., 2005; Lim et al., 2005; Wu and Belasco,
2008), the expression profiles of genuinely interacting pairs are expected to be anti-
correlated. Integrative analysis can be performed adopting a variational Bayesian model
(Huang et al., 2007b; Huang et al., 2007c), or by using a non-heuristic methodology
based on the anti-correlation between miRNA and mRNA expression profiles.
Unfortunately, the combination of large-scale target prediction results obtained with
different algorithms is not straightforward for most experimental researchers, whereas the
integrative analysis of miRNA and gene expression profiles is complicated by the many-
to-many nature of predicted relationships and target annotations to be considered.
Then MAGIA (miRNA and genes integrated analysis, freely available at
http://gencomp.bio.unipd.it/magia) will be presented. This novel web tool allows
integrating target predictions and gene expression profiles using different relatedness
measures either for matched or un-matched expression profiles, using miRNA–mRNA
bipartite networks reconstruction, gene functional enrichment and pathway annotations
for results browsing(Sales et al., 2010).
5.4.1. MAGIA application and testing to a case study
As a benchmark case study we used the mRNA and miRNA expression profiles published
by Fulci et al.(Fulci et al., 2009). In this study, the Authors investigated miRNA and gene
expression profiles in a series of adult Acute Lymphoblastic Leukemia (ALL) cases. ALL
is a heterogeneous disease comprising several subentities that differ for both
immunophenotypic and molecular characteristics. In particular, T-lineage and B-lineage
harboring specific molecular lesions have been considered by expression analyses.
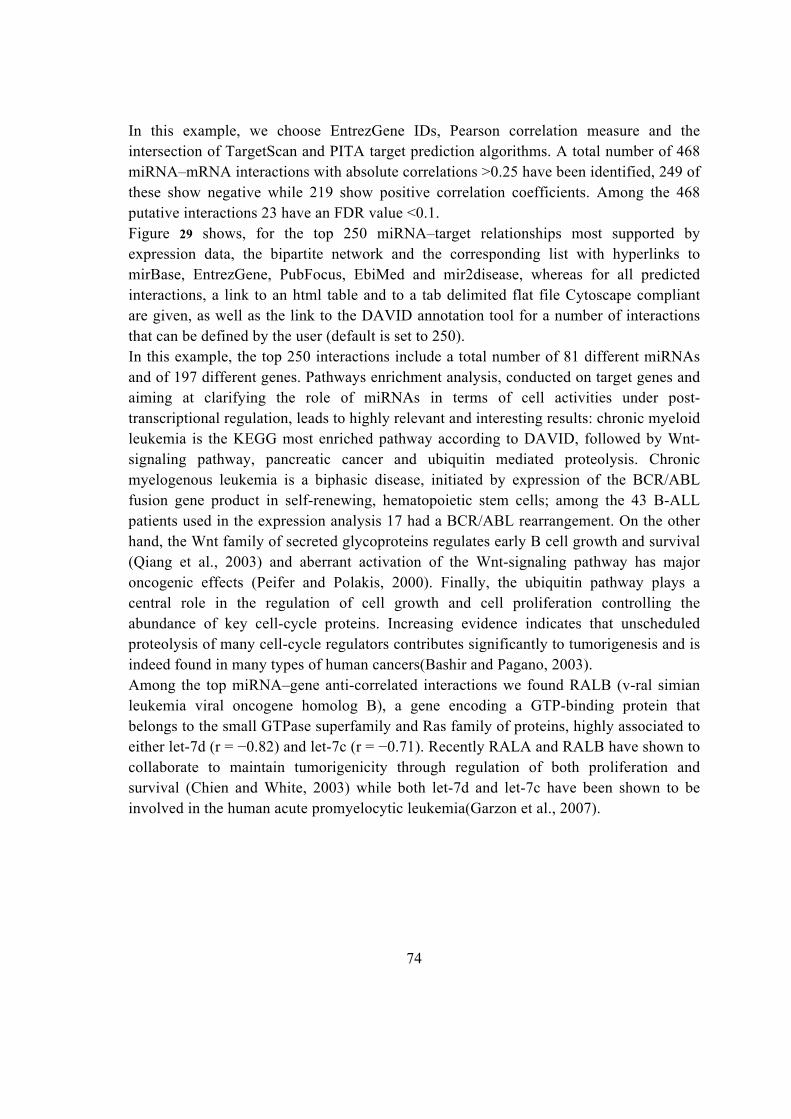
74
In this example, we choose EntrezGene IDs, Pearson correlation measure and the
intersection of TargetScan and PITA target prediction algorithms. A total number of 468
miRNA–mRNA interactions with absolute correlations >0.25 have been identified, 249 of
these show negative while 219 show positive correlation coefficients. Among the 468
putative interactions 23 have an FDR value <0.1.
Figure 29 shows, for the top 250 miRNA–target relationships most supported by
expression data, the bipartite network and the corresponding list with hyperlinks to
mirBase, EntrezGene, PubFocus, EbiMed and mir2disease, whereas for all predicted
interactions, a link to an html table and to a tab delimited flat file Cytoscape compliant
are given, as well as the link to the DAVID annotation tool for a number of interactions
that can be defined by the user (default is set to 250).
In this example, the top 250 interactions include a total number of 81 different miRNAs
and of 197 different genes. Pathways enrichment analysis, conducted on target genes and
aiming at clarifying the role of miRNAs in terms of cell activities under post-
transcriptional regulation, leads to highly relevant and interesting results: chronic myeloid
leukemia is the KEGG most enriched pathway according to DAVID, followed by Wnt-
signaling pathway, pancreatic cancer and ubiquitin mediated proteolysis. Chronic
myelogenous leukemia is a biphasic disease, initiated by expression of the BCR/ABL
fusion gene product in self-renewing, hematopoietic stem cells; among the 43 B-ALL
patients used in the expression analysis 17 had a BCR/ABL rearrangement. On the other
hand, the Wnt family of secreted glycoproteins regulates early B cell growth and survival
(Qiang et al., 2003) and aberrant activation of the Wnt-signaling pathway has major
oncogenic effects (Peifer and Polakis, 2000). Finally, the ubiquitin pathway plays a
central role in the regulation of cell growth and cell proliferation controlling the
abundance of key cell-cycle proteins. Increasing evidence indicates that unscheduled
proteolysis of many cell-cycle regulators contributes significantly to tumorigenesis and is
indeed found in many types of human cancers(Bashir and Pagano, 2003).
Among the top miRNA–gene anti-correlated interactions we found RALB (v-ral simian
leukemia viral oncogene homolog B), a gene encoding a GTP-binding protein that
belongs to the small GTPase superfamily and Ras family of proteins, highly associated to
either let-7d (r = −0.82) and let-7c (r = −0.71). Recently RALA and RALB have shown to
collaborate to maintain tumorigenicity through regulation of both proliferation and
survival (Chien and White, 2003) while both let-7d and let-7c have been shown to be
involved in the human acute promyelocytic leukemia(Garzon et al., 2007).
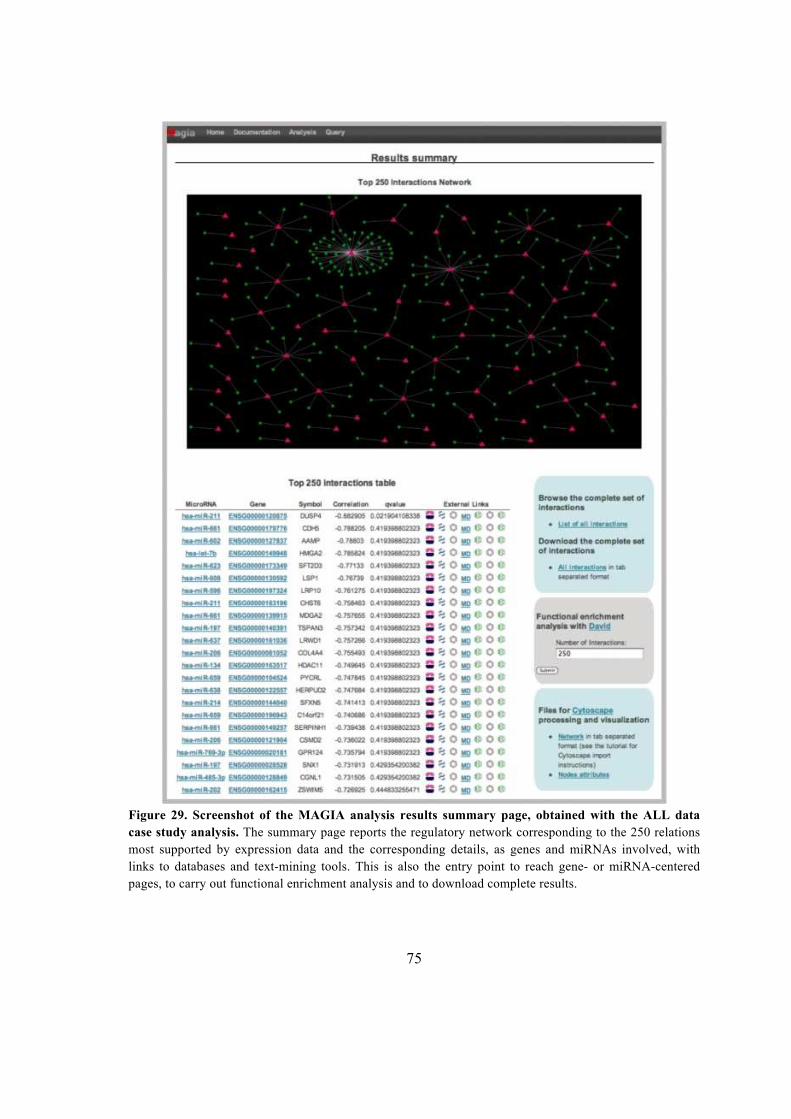
75
Figure 29. Screenshot of the MAGIA analysis results summary page, obtained with the ALL data
case study analysis. The summary page reports the regulatory network corresponding to the 250 relations
most supported by expression data and the corresponding details, as genes and miRNAs involved, with
links to databases and text-mining tools. This is also the entry point to reach gene- or miRNA-centered
pages, to carry out functional enrichment analysis and to download complete results.
76
hsa-miR-222 and let-7e have been recently found to be two of the most discriminant
miRNAs markers between ALL and AML (Mi et al., 2007) and in our analysis have been
found highly anti-correlated with respectively ETS1 (v-ets erythroblastosis virus E26
oncogene homolog 1) (r = −0.58) recently found to be involved in tumor development
and progression (Hahne et al., 2009) and with p53 (r = –0.51) whose oncogenic role has
been extensively studied in the last years(Hrstka et al., 2009).
Several other interactions have been reported by MAGIA, most of them including
miRNAs and/or genes involved in tumor development and progression. Indeed, repeating
the sample analysis with the same expression data and settings indicated above, but only
for the 12 miRNAs reportedly differentially expressed across samples (Fulci et al., 2009)
an interaction biologically relevant and validated (according to Diana Tarbase and
miRecords), regarding hsa-let-7e and HMGA2 (high mobility group AT-hook 2 gene) is
indicated by MAGIA at the first ranked position. While a complete investigation of
biological relevance of all interactions reported by MAGIA is beyond the scope of this
work, they validate the MAGIA integrative approach, the usefulness of the display of
results and the discovery power of data analysis with this tool.
5.5. Impact of host genes and strand selection on miRNA and miRNA*
expression
Dysregulation of miRNAs expression plays a critical role in the pathogenesis of genetic,
multifactorial disorders and in human cancers. We exploited sequence, genomic and
expression information to investigate two main aspects of post-transcriptional regulation in
miRNA biogenesis, namely strand selection regulation and expression relationships
between intragenic miRNAs and host genes(Biasiolo et al., 2011).
5.5.1. Microarray-based expression datasets analyses description
Table 6 shows details about microarray-based expression datasets considered for each
different analysis performed in this study. An amount of five dataset was collected to obtain
expression profiles of large numbers of known miRNAs, measured in many samples,
representing fairly different biological contexts. They comprise four microarray-based
datasets including matched miRNA and gene expression profiles, two regard blood cells
(Multiple Myeloma and normal plasma cells samples (MM), Acute Lymphoblastic
Leukemia samples (ALL)) whereas the other two regard parietal lobe cortex (normal and
with in Alzheimer's disease, ALZ) and prostate (normal and cancer), and a fifth dataset,
include miRNA only expression profiles in 8 different cancer types and corresponding
normal tissues samples (MCN). The number of miRNAs represented in each expression
77
dataset is also indicated in Table 6.
We considered all mature miRNAs in miRBase, where 676 (corresponding to 869 mature
sequences) were assigned to unique genomic locations whereas the remaining were
discarded, since unmapped or corresponding to more than one different localization per
miRNA.
Table 6. Schema of expression datasets used for different levels of analyses in this study. Among five
expression datasets obtained by microarray technology, four comprise matched miRNA and gene expression,
whereas one includes only miRNA expression data.
DATASETS
Matched miRNA and genes expression data
miRNA-only
expression
data
MM ALL ALZ PRO MCN
Total number of miRNAs in the original
series matrix 722 470 462 373 722
AN
AL
YS
ES
sister miRNA pairs √ √ √ √ √
Intragenic
miRNA/host
gene
Co-expression √ √ √ √
Real/Proxy for
network
reconstruction
√ √ √ √
5.5.2. Expression of sister mature miRNA pairs belonging to the same hairpin
Two different mature miRNA sequences (miRNA/miRNA*) are generated from a fraction
of precursor hairpins and are associated to different sets of target genes and regulated cell
activities. We considered expression profiles of mature miRNAs, obtained by microarray
platforms specifically designed to measure mature forms.
Part of miRNA hairpin sequences is represented, in each dataset, by two different mature
miRNAs, each one associated to an individual expression profile. After removing
redundancy due to existence of identical mature pairs derived from hairpins belonging to
different genomic localizations, a set of 237 couples of sister mature miRNAs from the
same hairpin represented in the MCN, MM datasets was considered. In ALL, ALZ and
PRO datasets we found respectively 32, 37 and 95 sister miRNA pairs.
The investigation of expression relationships between sister miRNA pairs provided
interesting clues for a better understanding of the regulation of the strand selection bias. We
were willing to comprehend if one miRNA in the pair is more expressed than the other in
all tissues/cell types/conditions or if the strand selection bias may be cell/tissue-specific.
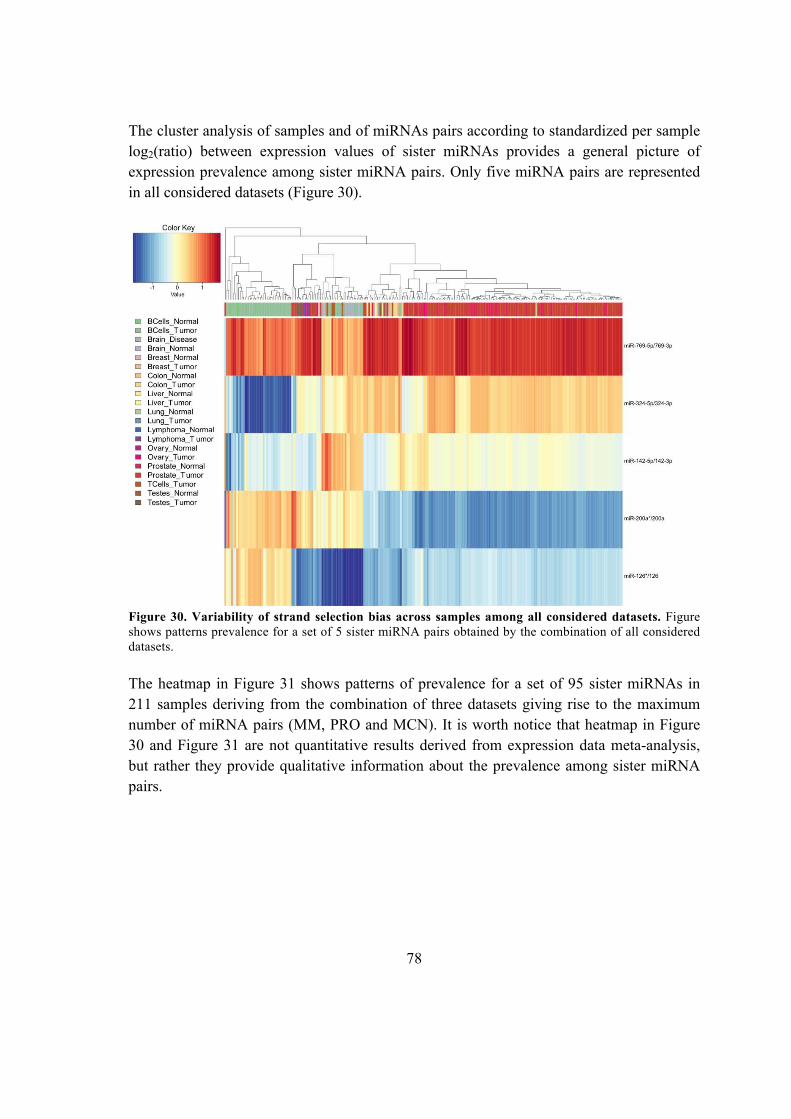
78
The cluster analysis of samples and of miRNAs pairs according to standardized per sample
log2(ratio) between expression values of sister miRNAs provides a general picture of
expression prevalence among sister miRNA pairs. Only five miRNA pairs are represented
in all considered datasets (Figure 30).
Figure 30. Variability of strand selection bias across samples among all considered datasets. Figure
shows patterns prevalence for a set of 5 sister miRNA pairs obtained by the combination of all considered
datasets.
The heatmap in Figure 31 shows patterns of prevalence for a set of 95 sister miRNAs in
211 samples deriving from the combination of three datasets giving rise to the maximum
number of miRNA pairs (MM, PRO and MCN). It is worth notice that heatmap in Figure
30 and Figure 31 are not quantitative results derived from expression data meta-analysis,
but rather they provide qualitative information about the prevalence among sister miRNA
pairs.
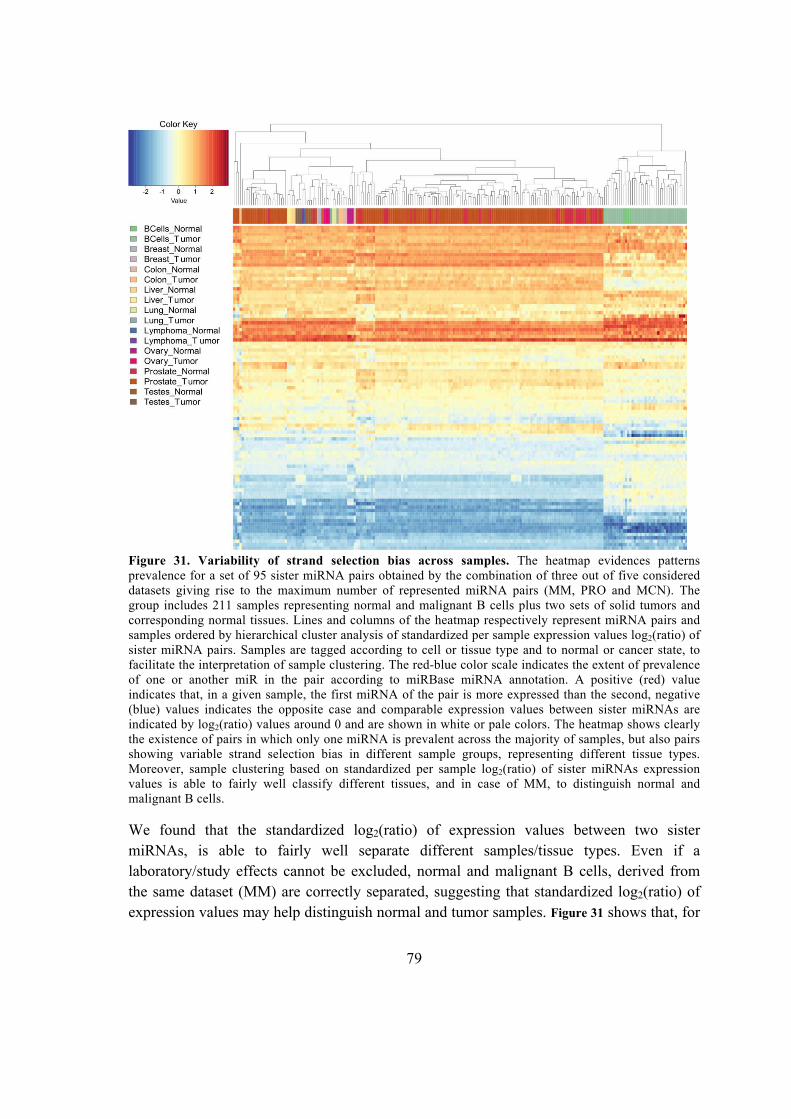
79
Figure 31. Variability of strand selection bias across samples. The heatmap evidences patterns
prevalence for a set of 95 sister miRNA pairs obtained by the combination of three out of five considered
datasets giving rise to the maximum number of represented miRNA pairs (MM, PRO and MCN). The
group includes 211 samples representing normal and malignant B cells plus two sets of solid tumors and
corresponding normal tissues. Lines and columns of the heatmap respectively represent miRNA pairs and
samples ordered by hierarchical cluster analysis of standardized per sample expression values log2(ratio) of
sister miRNA pairs. Samples are tagged according to cell or tissue type and to normal or cancer state, to
facilitate the interpretation of sample clustering. The red-blue color scale indicates the extent of prevalence
of one or another miR in the pair according to miRBase miRNA annotation. A positive (red) value
indicates that, in a given sample, the first miRNA of the pair is more expressed than the second, negative
(blue) values indicates the opposite case and comparable expression values between sister miRNAs are
indicated by log2(ratio) values around 0 and are shown in white or pale colors. The heatmap shows clearly
the existence of pairs in which only one miRNA is prevalent across the majority of samples, but also pairs
showing variable strand selection bias in different sample groups, representing different tissue types.
Moreover, sample clustering based on standardized per sample log2(ratio) of sister miRNAs expression
values is able to fairly well classify different tissues, and in case of MM, to distinguish normal and
malignant B cells.
We found that the standardized log2(ratio) of expression values between two sister
miRNAs, is able to fairly well separate different samples/tissue types. Even if a
laboratory/study effects cannot be excluded, normal and malignant B cells, derived from
the same dataset (MM) are correctly separated, suggesting that standardized log2(ratio) of
expression values may help distinguish normal and tumor samples. Figure 31 shows that, for
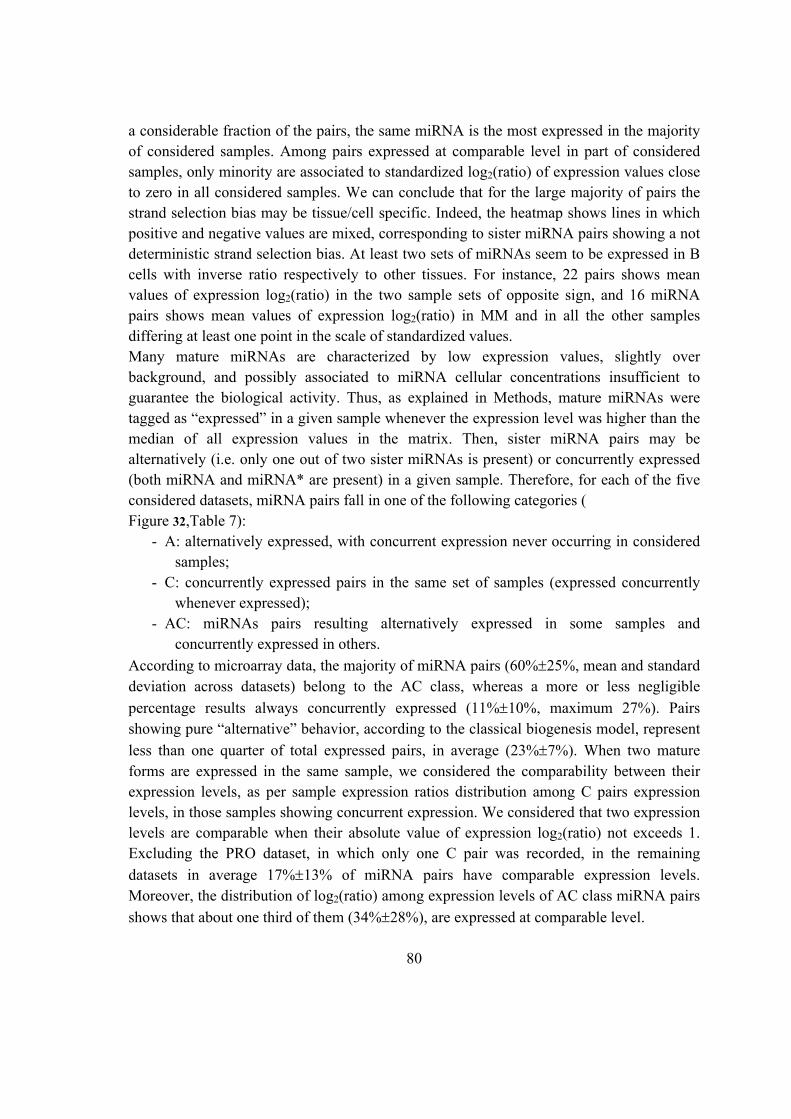
80
a considerable fraction of the pairs, the same miRNA is the most expressed in the majority
of considered samples. Among pairs expressed at comparable level in part of considered
samples, only minority are associated to standardized log2(ratio) of expression values close
to zero in all considered samples. We can conclude that for the large majority of pairs the
strand selection bias may be tissue/cell specific. Indeed, the heatmap shows lines in which
positive and negative values are mixed, corresponding to sister miRNA pairs showing a not
deterministic strand selection bias. At least two sets of miRNAs seem to be expressed in B
cells with inverse ratio respectively to other tissues. For instance, 22 pairs shows mean
values of expression log2(ratio) in the two sample sets of opposite sign, and 16 miRNA
pairs shows mean values of expression log2(ratio) in MM and in all the other samples
differing at least one point in the scale of standardized values.
Many mature miRNAs are characterized by low expression values, slightly over
background, and possibly associated to miRNA cellular concentrations insufficient to
guarantee the biological activity. Thus, as explained in Methods, mature miRNAs were
tagged as “expressed” in a given sample whenever the expression level was higher than the
median of all expression values in the matrix. Then, sister miRNA pairs may be
alternatively (i.e. only one out of two sister miRNAs is present) or concurrently expressed
(both miRNA and miRNA* are present) in a given sample. Therefore, for each of the five
considered datasets, miRNA pairs fall in one of the following categories (
Figure 32,Table 7):
- A: alternatively expressed, with concurrent expression never occurring in considered
samples;
- C: concurrently expressed pairs in the same set of samples (expressed concurrently
whenever expressed);
- AC: miRNAs pairs resulting alternatively expressed in some samples and
concurrently expressed in others.
According to microarray data, the majority of miRNA pairs (60%±25%, mean and standard
deviation across datasets) belong to the AC class, whereas a more or less negligible
percentage results always concurrently expressed (11%±10%, maximum 27%). Pairs
showing pure “alternative” behavior, according to the classical biogenesis model, represent
less than one quarter of total expressed pairs, in average (23%±7%). When two mature
forms are expressed in the same sample, we considered the comparability between their
expression levels, as per sample expression ratios distribution among C pairs expression
levels, in those samples showing concurrent expression. We considered that two expression
levels are comparable when their absolute value of expression log2(ratio) not exceeds 1.
Excluding the PRO dataset, in which only one C pair was recorded, in the remaining
datasets in average 17%±13% of miRNA pairs have comparable expression levels.
Moreover, the distribution of log2(ratio) among expression levels of AC class miRNA pairs
shows that about one third of them (34%±28%), are expressed at comparable level.
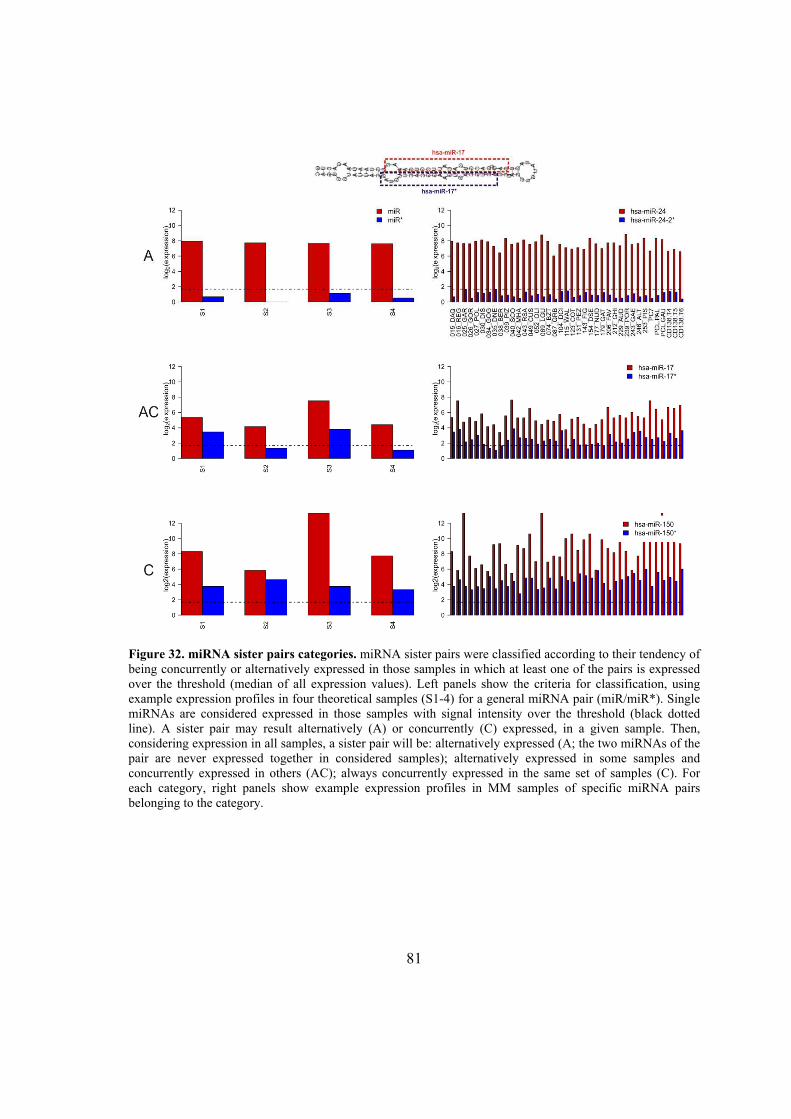
81
Figure 32. miRNA sister pairs categories. miRNA sister pairs were classified according to their tendency of
being concurrently or alternatively expressed in those samples in which at least one of the pairs is expressed
over the threshold (median of all expression values). Left panels show the criteria for classification, using
example expression profiles in four theoretical samples (S1-4) for a general miRNA pair (miR/miR*). Single
miRNAs are considered expressed in those samples with signal intensity over the threshold (black dotted
line). A sister pair may result alternatively (A) or concurrently (C) expressed, in a given sample. Then,
considering expression in all samples, a sister pair will be: alternatively expressed (A; the two miRNAs of the
pair are never expressed together in considered samples); alternatively expressed in some samples and
concurrently expressed in others (AC); always concurrently expressed in the same set of samples (C). For
each category, right panels show example expression profiles in MM samples of specific miRNA pairs
belonging to the category.
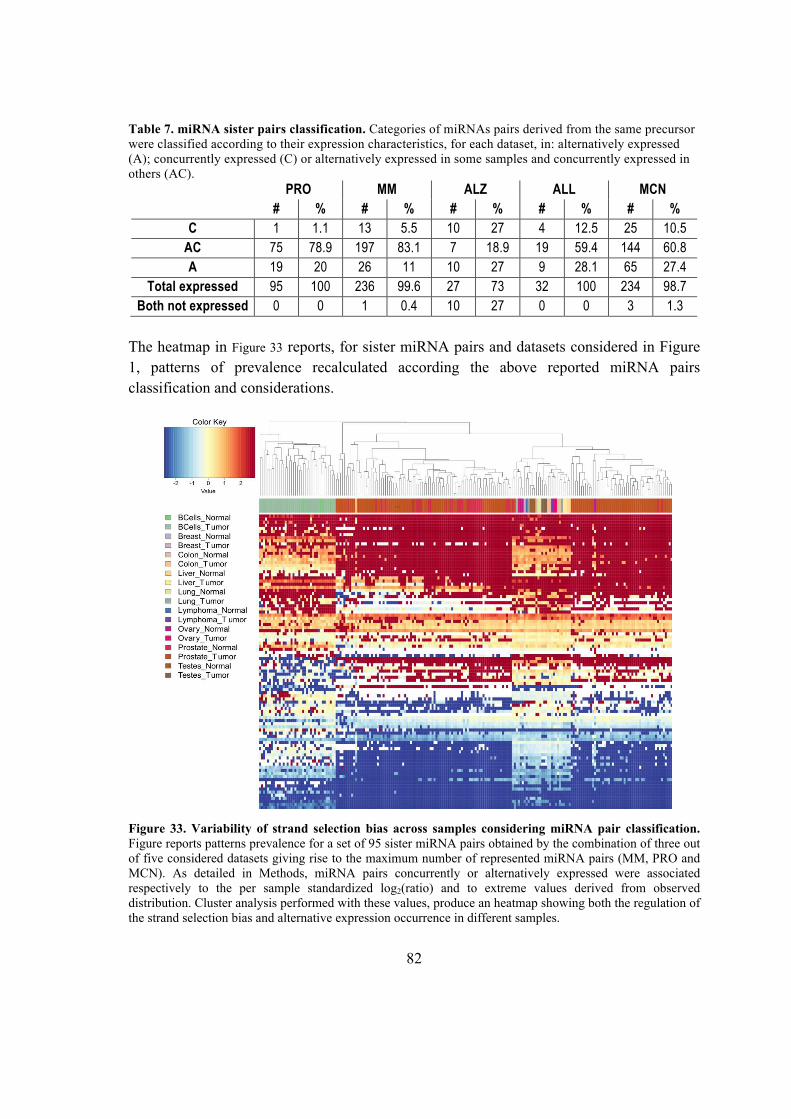
82
Table 7. miRNA sister pairs classification. Categories of miRNAs pairs derived from the same precursor
were classified according to their expression characteristics, for each dataset, in: alternatively expressed
(A); concurrently expressed (C) or alternatively expressed in some samples and concurrently expressed in
others (AC).
PRO MM ALZ ALL MCN
# % # % # % # % # %
C 1 1.1 13 5.5 10 27 4 12.5 25 10.5
AC 75 78.9 197 83.1 7 18.9 19 59.4 144 60.8
A 19 20 26 11 10 27 9 28.1 65 27.4
Total expressed 95 100 236 99.6 27 73 32 100 234 98.7
Both not expressed 0 0 1 0.4 10 27 0 0 3 1.3
The heatmap in Figure 33 reports, for sister miRNA pairs and datasets considered in Figure
1, patterns of prevalence recalculated according the above reported miRNA pairs
classification and considerations.
Figure 33. Variability of strand selection bias across samples considering miRNA pair classification.
Figure reports patterns prevalence for a set of 95 sister miRNA pairs obtained by the combination of three out
of five considered datasets giving rise to the maximum number of represented miRNA pairs (MM, PRO and
MCN). As detailed in Methods, miRNA pairs concurrently or alternatively expressed were associated
respectively to the per sample standardized log2(ratio) and to extreme values derived from observed
distribution. Cluster analysis performed with these values, produce an heatmap showing both the regulation of
the strand selection bias and alternative expression occurrence in different samples.

83
5.5.3. miRNA are hosted by long genes
A few studies considered miRNAs host genes genomic length/organization and their
possible regulatory role. In particular, Golan and colleagues (Golan et al., 2010) observed
that miRNA genes are hosted within introns of short genes and hypothesized that miRNA
integration into short genes might be evolutionary favorable due to interaction with the pre-
mRNA splicing mechanism. Here, we evaluated the length of the 279 host genes in
comparison with all human genes. The average gene span of the 279 host genes (180867 nt;
Wilcoxon rank sum test p-value 2.2*10-16
, Figure 34) is significantly longer (on average 6
times) than that of remaining 49, 506 human genes (29, 945 nt).
Figure 34. Host genes are relatively long. The back-to-back histogram compares the length distribution
of host genes with that of all human genes. Host genes are longer than expected by chance and the
difference is highly significant.
5.5.4. Limited co-expression of intragenic miRNAs and host genes
We considered the pair-wise expression correlations of respectively 309, 147, 148 and
170 mature miRNA/host gene pairs in the MM, ALL, ALZ and PRO datasets (Table 8).
In all datasets, more than one half of miRNA/host pairs (63±13, average and standard
deviation across datasets) were positively correlated, with slightly positive value for the
median correlation per dataset. However using a criterion of FDR<0.01, no pairs meet a
correlation significance in the ALZ dataset, whereas in the remaining datasets from the
5% to the 36% of correlations result significant. Overall, our data indicated that in all four
different datasets a large majority of miRNA/host gene expression profiles are not
significantly positively correlated and are instead poorly correlated or even anti-
correlated, in contrast with the notion that intragenic miRNAs are co-expressed with host
genes.
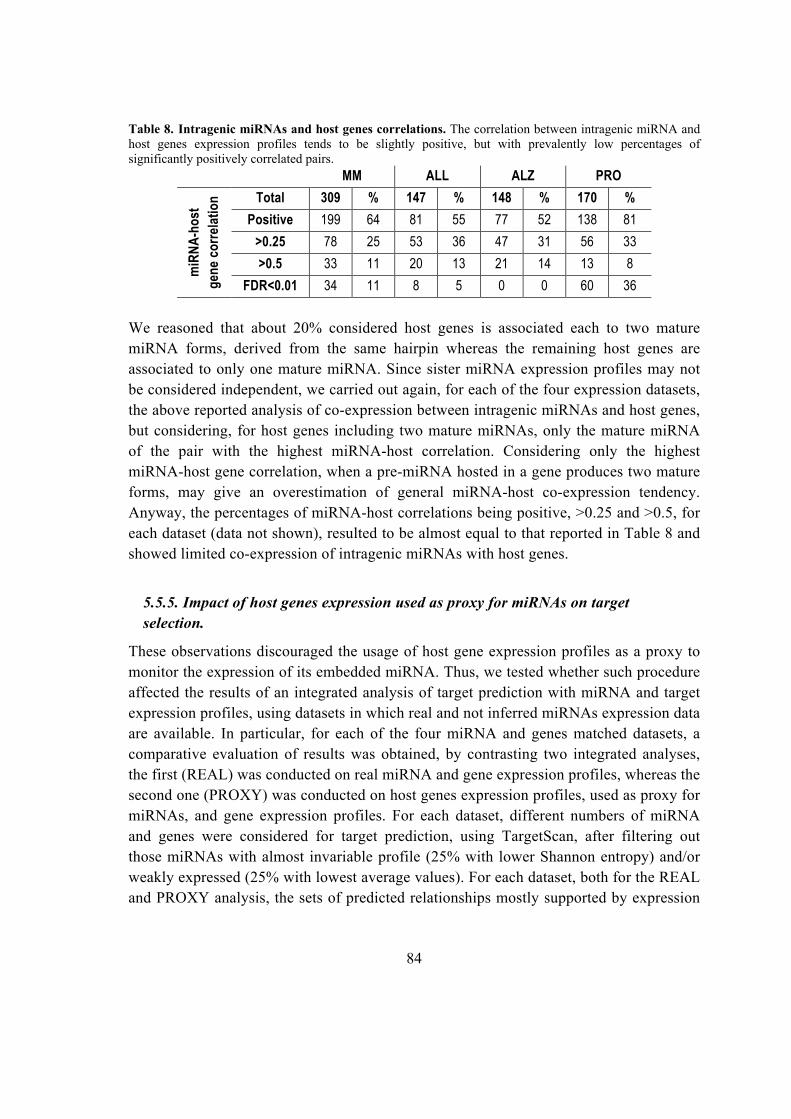
84
Table 8. Intragenic miRNAs and host genes correlations. The correlation between intragenic miRNA and
host genes expression profiles tends to be slightly positive, but with prevalently low percentages of
significantly positively correlated pairs.
MM ALL ALZ PRO m
iRN
A-h
ost
gen
e co
rrel
atio
n Total 309 % 147 % 148 % 170 %
Positive 199 64 81 55 77 52 138 81
>0.25 78 25 53 36 47 31 56 33
>0.5 33 11 20 13 21 14 13 8
FDR<0.01 34 11 8 5 0 0 60 36
We reasoned that about 20% considered host genes is associated each to two mature
miRNA forms, derived from the same hairpin whereas the remaining host genes are
associated to only one mature miRNA. Since sister miRNA expression profiles may not
be considered independent, we carried out again, for each of the four expression datasets,
the above reported analysis of co-expression between intragenic miRNAs and host genes,
but considering, for host genes including two mature miRNAs, only the mature miRNA
of the pair with the highest miRNA-host correlation. Considering only the highest
miRNA-host gene correlation, when a pre-miRNA hosted in a gene produces two mature
forms, may give an overestimation of general miRNA-host co-expression tendency.
Anyway, the percentages of miRNA-host correlations being positive, >0.25 and >0.5, for
each dataset (data not shown), resulted to be almost equal to that reported in Table 8 and
showed limited co-expression of intragenic miRNAs with host genes.
5.5.5. Impact of host genes expression used as proxy for miRNAs on target
selection.
These observations discouraged the usage of host gene expression profiles as a proxy to
monitor the expression of its embedded miRNA. Thus, we tested whether such procedure
affected the results of an integrated analysis of target prediction with miRNA and target
expression profiles, using datasets in which real and not inferred miRNAs expression data
are available. In particular, for each of the four miRNA and genes matched datasets, a
comparative evaluation of results was obtained, by contrasting two integrated analyses,
the first (REAL) was conducted on real miRNA and gene expression profiles, whereas the
second one (PROXY) was conducted on host genes expression profiles, used as proxy for
miRNAs, and gene expression profiles. For each dataset, different numbers of miRNA
and genes were considered for target prediction, using TargetScan, after filtering out
those miRNAs with almost invariable profile (25% with lower Shannon entropy) and/or
weakly expressed (25% with lowest average values). For each dataset, both for the REAL
and PROXY analysis, the sets of predicted relationships mostly supported by expression
85
profiles anti-correlation analysis were identified according to different percentile cut-offs
on miRNA-target expression profiles anti-correlation values. It is worth notice that in
different studies cutoffs around 1-3% were considered adequately stringent for a selection
of candidate functional miRNA-target relationships.
A set of 2, 848 validated miRNA-target interactions, resulting from Diana Tarbase
(Papadopoulos et al., 2009b) and/or miRecords (Xiao et al., 2009a) was collected to
provide an independent, also if narrow, true solution for comparative evaluation. In total,
756 validated miRNA-target relations were represented in the considered set of predicted
relations, with different small subsets represented for different expression datasets. The
average of total numbers of predicted relations associated to negative correlation values
in different datasets (representing the group from which we selected most supported
relations according to anti-correlation ranking cutoffs) was about 81,500. For each dataset
and each threshold, we evaluated the number of validated relations included in the
selected set of supported relations, according to the REAL and the PROXY analysis, as
compared with the expected number of validated relations. The ratio between observed
and expected numbers of validated relations included in a selected set of supported
relations defines an “enrichment score”, measuring the helpfulness of expression profiles
anti-correlation analysis to identify functional regulatory interactions among simply
predicted relations. Figure 35 reports the variation of enrichment score, against stringency
of anti-correlation-based percentile threshold, for each considered expression dataset.
Plainly, the REAL analysis is able to enrich in validated relations, when it focuses on
anti-correlated miRNA-target subsets defined with high stringency (from 1% to 5%), but
loses its power, as expected, at lower stringency. Besides, the REAL analysis results
outperform those of the PROXY, which seems to find, almost in all datasets, proportions
of validated (over supported) relations comparable or even lower than expected by
chance, almost independently from the applied stringency on anti-correlation. We
observed also that, for each considered expression dataset, the groups of validated
relations detected by the REAL and PROXY methods are almost completely disjointed.
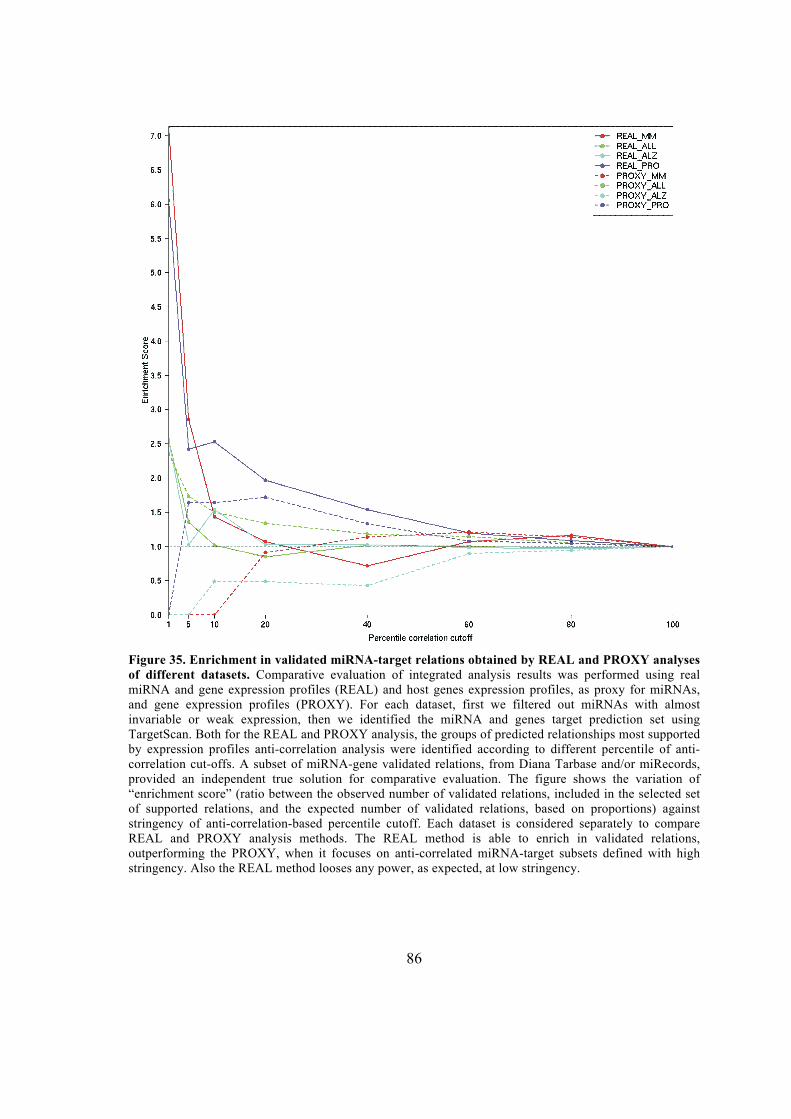
86
Figure 35. Enrichment in validated miRNA-target relations obtained by REAL and PROXY analyses
of different datasets. Comparative evaluation of integrated analysis results was performed using real
miRNA and gene expression profiles (REAL) and host genes expression profiles, as proxy for miRNAs,
and gene expression profiles (PROXY). For each dataset, first we filtered out miRNAs with almost
invariable or weak expression, then we identified the miRNA and genes target prediction set using
TargetScan. Both for the REAL and PROXY analysis, the groups of predicted relationships most supported
by expression profiles anti-correlation analysis were identified according to different percentile of anti-
correlation cut-offs. A subset of miRNA-gene validated relations, from Diana Tarbase and/or miRecords,
provided an independent true solution for comparative evaluation. The figure shows the variation of
“enrichment score” (ratio between the observed number of validated relations, included in the selected set
of supported relations, and the expected number of validated relations, based on proportions) against
stringency of anti-correlation-based percentile cutoff. Each dataset is considered separately to compare
REAL and PROXY analysis methods. The REAL method is able to enrich in validated relations,
outperforming the PROXY, when it focuses on anti-correlated miRNA-target subsets defined with high
stringency. Also the REAL method looses any power, as expected, at low stringency.
87
5.6. Characterization and discovery of novel miRNAs and moRNAs in
JAK2V617F mutated SET2 cell
The JAK2V617F mutation, that occurs in most patients with polycythemia vera (PV) and
about 60% of those with essential thrombocythemia (ET) and primary myelofibrosis
(PMF)1, is considered integral to the pathogenesis of myeloproliferative neoplasms (MPN),
although additional, antecedent mutations are required for a MPN to develop. The disease
can be reproduced in mice expressing the JAK2V617F allele 5. Cells harboring the
JAK2V617F mutation display autonomous activation of several cell signaling pathways,
particularly JAK/STAT, and proliferate and maturate in a cytokine-independent manner.
Recent information highlighted that deranged epigenetic gene regulation(Vannucchi et al.,
2009) and abnormal expression of microRNAs(Bruchova et al., 2007; Bruchova et al.,
2008; Guglielmelli et al., 2007) also contribute to the pathogenesis of MPN(Bortoluzzi et
al., 2012).
5.6.1. Small RNA library
The Illumina GAIIx sequencing of the small RNA library from SET-2 cells produced
32,760,003 reads which, after extensive preprocessing and quality control, were
reduced to 27,906,609 reads, representing about 85% of sequenced reads. A first
mapping phase aimed at discarding contaminations and repeats, yet tolerating for
possibly unknown miRNA loci, produced 22,167,999 reads (68% of raw data). These
were accurately mapped to “extended hairpins” in order to identify and quantify known
miRNAs and for discovery and characterization of novel isomiRs and other miRNA-
associated expressed RNAs. In total, 1,421 known hairpin precursors, corresponding to
1,731 known mature miRNA sequences.
5.6.2. Known miRNAs and isomiRs expressed in SET2 cells
A total of 652 known miRNAs were found expressed in SET2 cells with expression levels
ranged from 10 to 2,268,333 (mean 29,830, median 613), with 300 and 124 miRNAs
presenting read counts of at least 103
and 104, respectively. Only 21 highly expressed
miRNAs accounted for 70% of known miRNAs expression (Table 9) and are thus
predicted to account for most of miRNA-mediated gene repression in SET2 cells. KEGG
pathway enrichment for known miRNAs was obtained using DIANA-miRPath web-tool
(Papadopoulos et al., 2009a) based on TargetScan5 miRNA target predictions. mirPath is
a software to identify molecular pathways potentially altered by the expression of single
or multiple microRNAs. Most relevant KEGG pathways significantly enriched in genes
predicted target of 21 most expressed miRNAs are the MAPK signaling pathway, TGF-
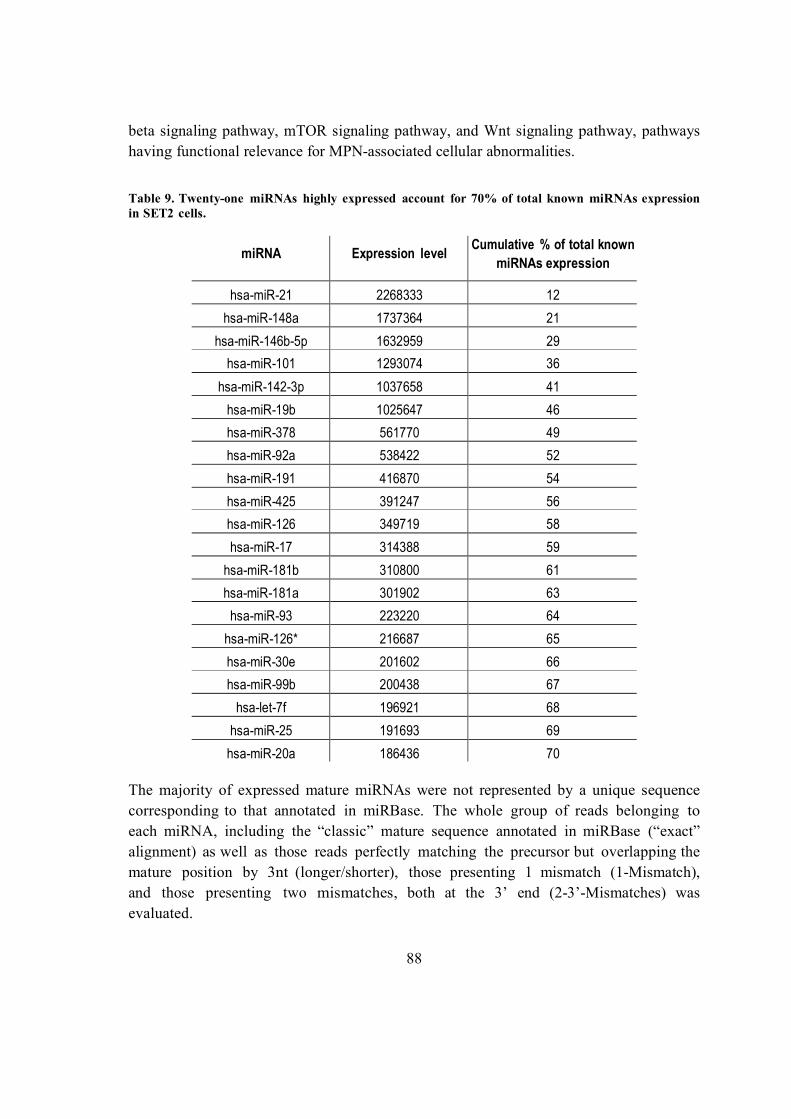
88
beta signaling pathway, mTOR signaling pathway, and Wnt signaling pathway, pathways
having functional relevance for MPN-associated cellular abnormalities.
Table 9. Twenty-one miRNAs highly expressed account for 70% of total known miRNAs expression
in SET2 cells.
miRNA Expression level Cumulative % of total known
miRNAs expression
hsa-miR-21 2268333 12
hsa-miR-148a 1737364 21
hsa-miR-146b-5p 1632959 29
hsa-miR-101 1293074 36
hsa-miR-142-3p 1037658 41
hsa-miR-19b 1025647 46
hsa-miR-378 561770 49
hsa-miR-92a 538422 52
hsa-miR-191 416870 54
hsa-miR-425 391247 56
hsa-miR-126 349719 58
hsa-miR-17 314388 59
hsa-miR-181b 310800 61
hsa-miR-181a 301902 63
hsa-miR-93 223220 64
hsa-miR-126* 216687 65
hsa-miR-30e 201602 66
hsa-miR-99b 200438 67
hsa-let-7f 196921 68
hsa-miR-25 191693 69
hsa-miR-20a 186436 70
The majority of expressed mature miRNAs were not represented by a unique sequence
corresponding to that annotated in miRBase. The whole group of reads belonging to
each miRNA, including the “classic” mature sequence annotated in miRBase (“exact”
alignment) as well as those reads perfectly matching the precursor but overlapping the
mature position by 3nt (longer/shorter), those presenting 1 mismatch (1-Mismatch),
and those presenting two mismatches, both at the 3’ end (2-3’-Mismatches) was
evaluated.
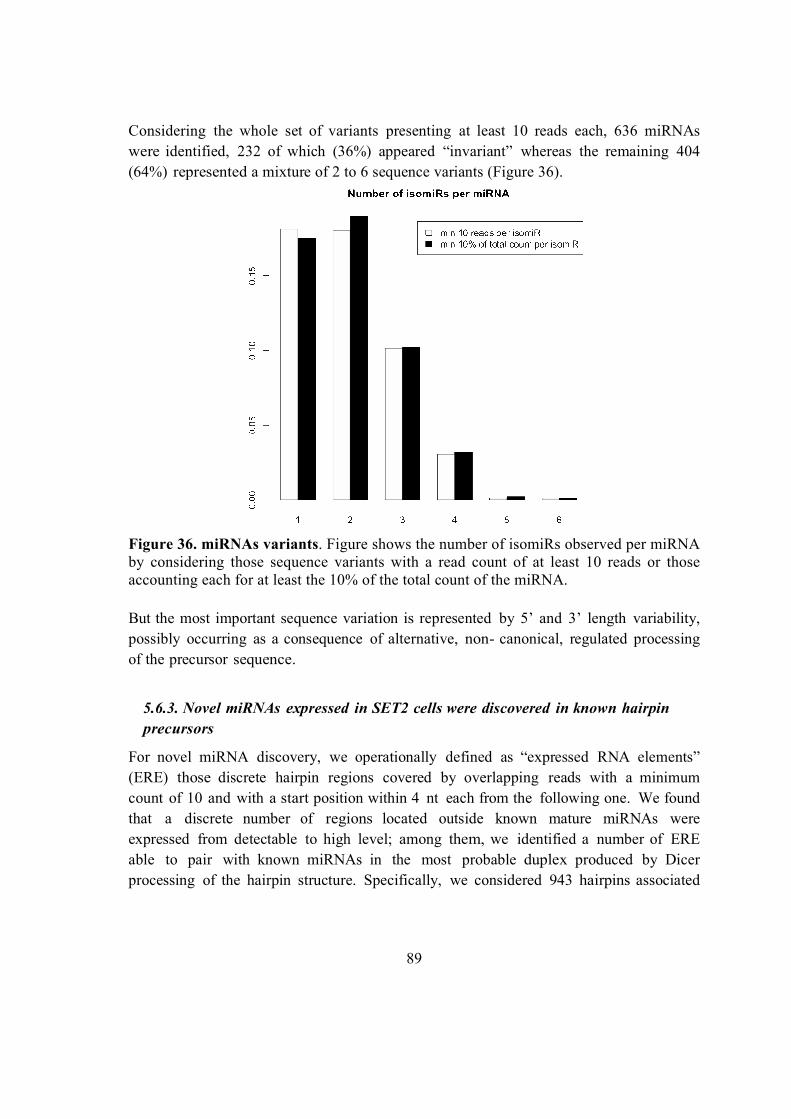
89
Considering the whole set of variants presenting at least 10 reads each, 636 miRNAs
were identified, 232 of which (36%) appeared “invariant” whereas the remaining 404
(64%) represented a mixture of 2 to 6 sequence variants (Figure 36).
Figure 36. miRNAs variants. Figure shows the number of isomiRs observed per miRNA
by considering those sequence variants with a read count of at least 10 reads or those
accounting each for at least the 10% of the total count of the miRNA.
But the most important sequence variation is represented by 5’ and 3’ length variability,
possibly occurring as a consequence of alternative, non- canonical, regulated processing
of the precursor sequence.
5.6.3. Novel miRNAs expressed in SET2 cells were discovered in known hairpin
precursors
For novel miRNA discovery, we operationally defined as “expressed RNA elements”
(ERE) those discrete hairpin regions covered by overlapping reads with a minimum
count of 10 and with a start position within 4 nt each from the following one. We found
that a discrete number of regions located outside known mature miRNAs were
expressed from detectable to high level; among them, we identified a number of ERE
able to pair with known miRNAs in the most probable duplex produced by Dicer
processing of the hairpin structure. Specifically, we considered 943 hairpins associated
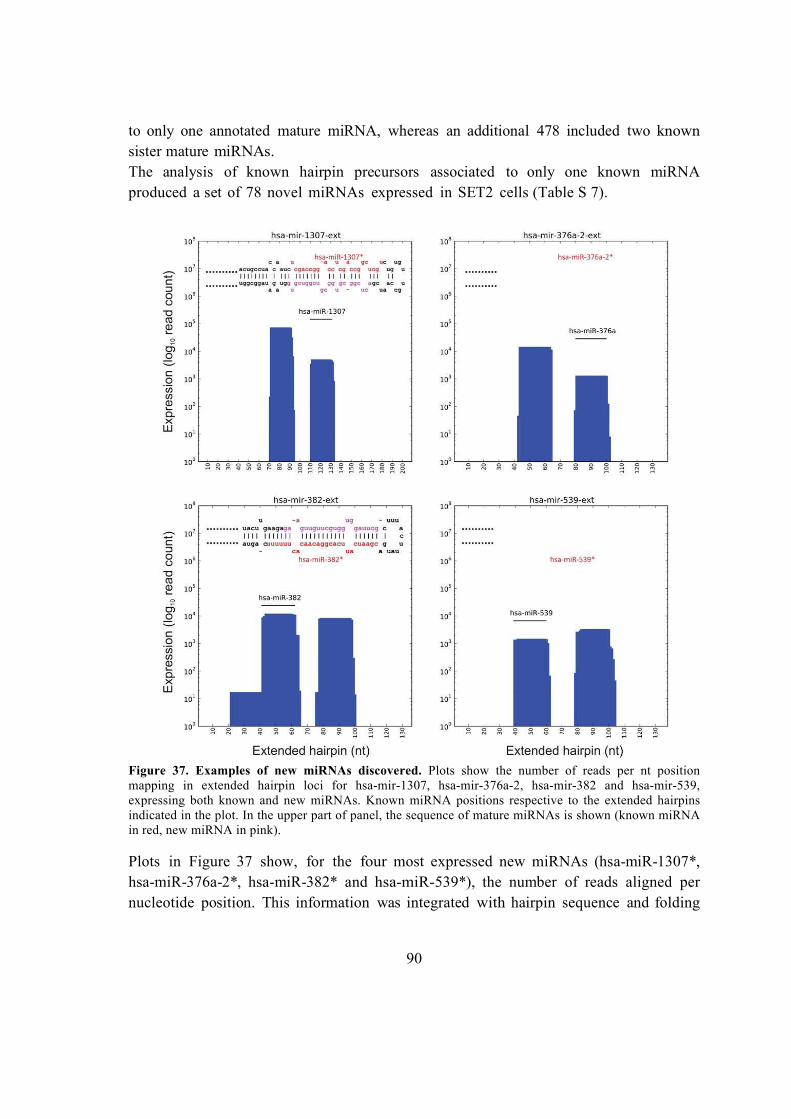
90
to only one annotated mature miRNA, whereas an additional 478 included two known
sister mature miRNAs.
The analysis of known hairpin precursors associated to only one known miRNA
produced a set of 78 novel miRNAs expressed in SET2 cells (Table S 7).
Figure 37. Examples of new miRNAs discovered. Plots show the number of reads per nt position
mapping in extended hairpin loci for hsa-mir-1307, hsa-mir-376a-2, hsa-mir-382 and hsa-mir-539,
expressing both known and new miRNAs. Known miRNA positions respective to the extended hairpins
indicated in the plot. In the upper part of panel, the sequence of mature miRNAs is shown (known miRNA
in red, new miRNA in pink).
Plots in Figure 37 show, for the four most expressed new miRNAs (hsa-miR-1307*,
hsa-miR-376a-2*, hsa-miR-382* and hsa-miR-539*), the number of reads aligned per
nucleotide position. This information was integrated with hairpin sequence and folding

91
data to define new miRNA sequences. Table 10 reports name, sequence and expression
level of novel miRNAs having a read count of at least 500.
Table 10. Novel miRNA expressions. Name and predicted sequence of 15 new miRNAs with read
count greater than 500. Seven new miRNAs associated to read counts over 103 are shown in bold.
New miRNA Sequence Expression
hsa-miR-1307* CTCGACCGGACCTCGACCGGCTCGT 72670
hsa-miR-376a-2* GGTAGATTTTCCTTCTATGGTTA 14296
hsa-miR-382* CGAATCATTCACGGACAACACTTTTT 8296
hsa-miR-539* AATCATACAAGGACAATTTCTTTTTGA 3332
hsa-miR-181b-1* CTCACTGAACAATGAATGCAACT 1542
hsa-miR-561* ATCAAGGATCTTAAACTTTGCC 1315
hsa-let-7c* CTGTACAACCTTCTAGCTTTCCT 1195
hsa-miR-652* ACAACCCTAGGAGAGGGTGCCATTCA 982
hsa-miR-301a* GCTCTGACTTTATTGCACTACT 880
hsa-miR-487a* GTGGTTATCCCTGCTGTGTTCG 823
hsa-miR-370* AAGCCAGGTCACGTCTCTGCAGTTACAC 624
hsa-miR-412* TGGTCGACCAGTTGGAAAGTAAT 578
hsa-miR-376c* GTGGATATTCCTTCTATGTTTAT 568
hsa-miR-381* AAGCGAGGTTGCCCTTTGTATATTC 567
hsa-miR-376b* GTGGATATTCCTTCTATGTTTA 532
Expression levels of new miRNAs identified in SET2 cells ranged from 10 to 72,670
(mean 1471, median 63) and were significantly lower than those of known miRNAs
(Two Sample t-test of mean equality p-value =6.521e-06) (Figure 38).
Nevertheless, 11 new miRNAs (14%) showed an expression level higher than the
median value observed for known miRNAs. In particular, hsa-miR-1307*, hsa-miR-
376a-2* and hsa-miR-382* resulted very highly expressed, at level even greater than
75% of known miRNAs.
Conserved TargetScan custom target predictions (See Methods) for 15 novel miRNAs
with a read count of at least 500 are included in Table S 8. Specifically, conserved and
not-conserved target sites were predicted using TargetScan and filtered according to the
context score. Only conserved target sites associated to top 25% scores and non-
conserved sites included in top 5% scores were reported.
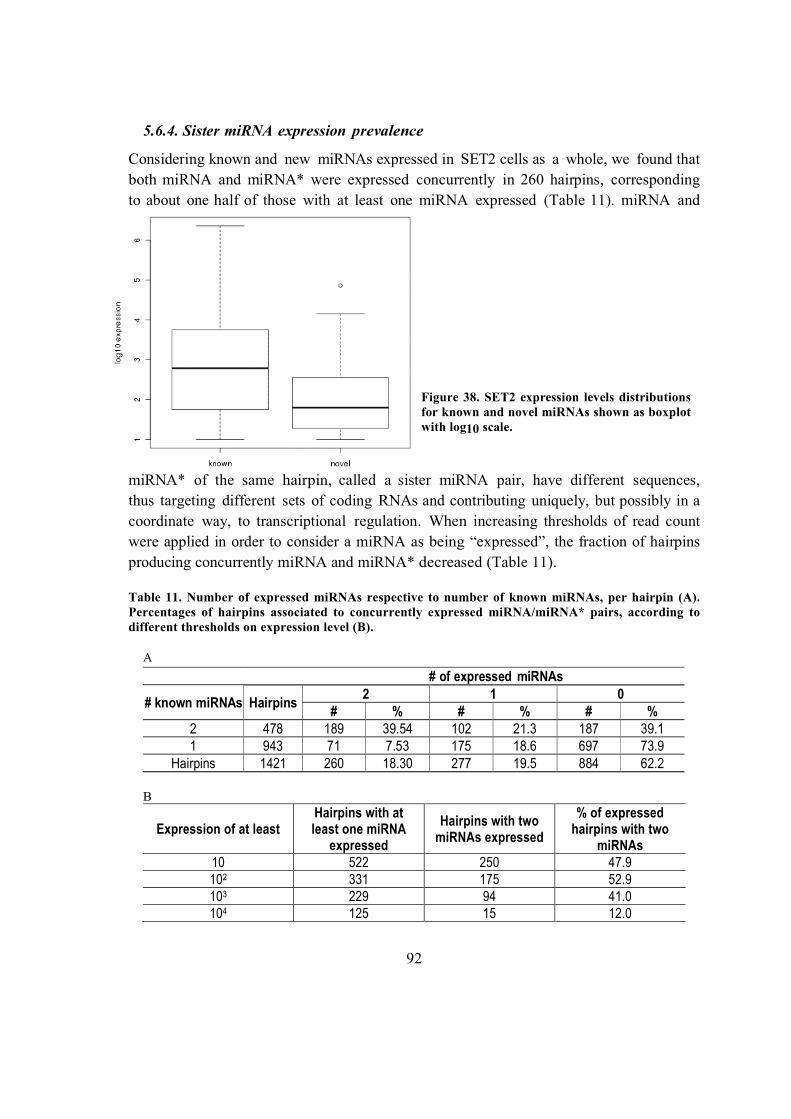
92
5.6.4. Sister miRNA expression prevalence
Considering known and new miRNAs expressed in SET2 cells as a whole, we found that
both miRNA and miRNA* were expressed concurrently in 260 hairpins, corresponding
to about one half of those with at least one miRNA expressed (Table 11). miRNA and
miRNA* of the same hairpin, called a sister miRNA pair, have different sequences,
thus targeting different sets of coding RNAs and contributing uniquely, but possibly in a
coordinate way, to transcriptional regulation. When increasing thresholds of read count
were applied in order to consider a miRNA as being “expressed”, the fraction of hairpins
producing concurrently miRNA and miRNA* decreased (Table 11).
Table 11. Number of expressed miRNAs respective to number of known miRNAs, per hairpin (A).
Percentages of hairpins associated to concurrently expressed miRNA/miRNA* pairs, according to
different thresholds on expression level (B).
A
# of expressed miRNAs
# known miRNAs Hairpins 2 1 0
# % # % # % 2 478 189 39.54 102 21.3 187 39.1 1 943 71 7.53 175 18.6 697 73.9
Hairpins 1421 260 18.30 277 19.5 884 62.2
B
Expression of at least Hairpins with at least one miRNA
expressed
Hairpins with two miRNAs expressed
% of expressed hairpins with two
miRNAs 10 522 250 47.9 102 331 175 52.9 103 229 94 41.0 104 125 15 12.0
Figure 38. SET2 expression levels distributions
for known and novel miRNAs shown as boxplot
with log10 scale.

93
Nevertheless, the fraction of hairpins producing a meaningful quantity of both miRNAs
remained considerable at all thresholds.
No strand prevalence in expressed miRNAs was observed (Figure 39). Out of 277
hairpins expressing only one miRNA, 47% and 53% expressed only the 5’ or the 3’
miRNA (130 and 147), respectively. Regarding 260 hairpins expressing both sister
miRNAs, the highly expressed miRNA was the 5’ or 3’ form in 135 and 125 of them,
respectively. A considerable fraction of concurrently expressed miRNA pairs were
found to be expressed at comparable level: 66 (25%) and 38 (14%) of concurrently
expressed pairs were associated to an absolute log2(ratio) of expression values not higher
that 2 and 1, respectively.
Figure 39. Prevalence of 5' and 3' miRNAs expression. A) Scatterplot showing 5' and 3'
miRNAs expression, both for the sister pairs including two known miRNAs and for those
including one new miRNA. B) Distribution of log2ratio of 5' and 3' miRNAs expression
values.
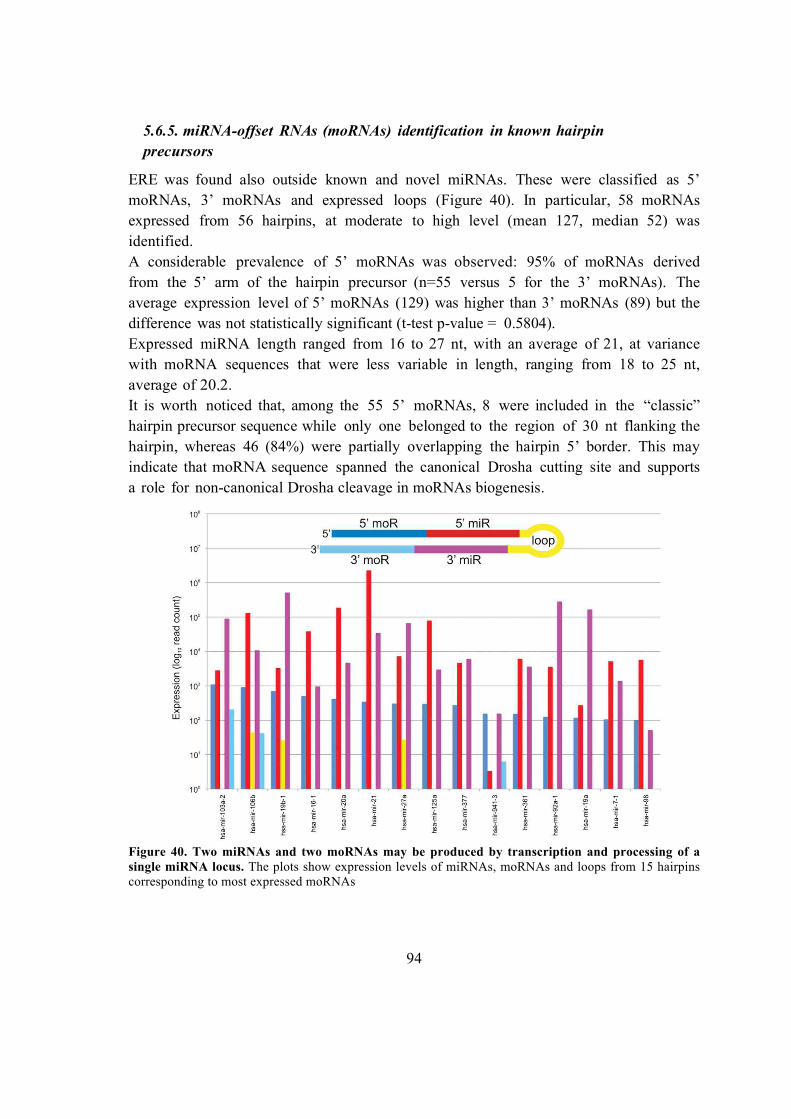
94
5.6.5. miRNA-offset RNAs (moRNAs) identification in known hairpin
precursors
ERE was found also outside known and novel miRNAs. These were classified as 5’
moRNAs, 3’ moRNAs and expressed loops (Figure 40). In particular, 58 moRNAs
expressed from 56 hairpins, at moderate to high level (mean 127, median 52) was
identified.
A considerable prevalence of 5’ moRNAs was observed: 95% of moRNAs derived
from the 5’ arm of the hairpin precursor (n=55 versus 5 for the 3’ moRNAs). The
average expression level of 5’ moRNAs (129) was higher than 3’ moRNAs (89) but the
difference was not statistically significant (t-test p-value = 0.5804).
Expressed miRNA length ranged from 16 to 27 nt, with an average of 21, at variance
with moRNA sequences that were less variable in length, ranging from 18 to 25 nt,
average of 20.2.
It is worth noticed that, among the 55 5’ moRNAs, 8 were included in the “classic”
hairpin precursor sequence while only one belonged to the region of 30 nt flanking the
hairpin, whereas 46 (84%) were partially overlapping the hairpin 5’ border. This may
indicate that moRNA sequence spanned the canonical Drosha cutting site and supports
a role for non-canonical Drosha cleavage in moRNAs biogenesis.
Figure 40. Two miRNAs and two moRNAs may be produced by transcription and processing of a
single miRNA locus. The plots show expression levels of miRNAs, moRNAs and loops from 15 hairpins
corresponding to most expressed moRNAs
95
6. Discussion and Conclusions
In this thesis I illustrated results obtained combining different type of data and
bioinformatic analyses to investigate different aspect of miRNA. An integrative genomic
and systems biology approach based on computational prediction of miRNA targets in
combination with experimentally-determined miRNAs and genes expression measures is
more effective for the identification of biologically relevant miRNA-target relationships.
Integrating miRNA and gene expression data we are able to identify miRNA target gene
most reliable among the vast number of computational prediction available on-line
providing an important contribution aimed at characterizing the role of specific miRNAs
in different neoplasms. Moreover the reconstruction of transcriptional and post-
transcriptional regulatory networks became a crucial step to understand mechanism of all
biological systems. We exploited method deriving from social network theory to analyze
these regulatory networks to hamper our capacity of extracting de-novo knowledge from
biological networks. To delve into some miRNA aspects, post-transcriptional regulation
in miRNA biogenesis, namely the strand selection theory, and the relation between
intragenic miRNAs and their host gene, we used sequence, genomic and expression
information in different biological context in 5 large dataset. And lastly the deep
sequencing data analysis help us to portray a general picture of short RNAs expressed in
SET2 cells, a JAK2V617F mutated cell line, where known and novel miRNA expressions
was quantified and a new class of short RNAs, moRNAs, was discovered.
6.1. Identification of microRNA expression patterns and definition of a
transcriptional and post-transcriptional regulatory network in distinct
molecular groups of multiple myeloma
The integrative analysis of the different types of genomic data (i.e., miRNA and mRNA
expression levels and genome-wide CN profiles) allowed the definition of distinct
patterns of miRNA deregulation and the prediction of the miRNA/mRNA regulatory
networks in molecular subtypes of MM.
Particularly, results highlighted that specific patterns of miRNA expression may
differentiate MMs with distinct and well-known genetic alterations. Specific signatures
were found to be associated with t(4;14) or translocated MAF genes and, to a lesser

96
extent, with t(11;14) and TC2 group (expressing moderate levels of CCND1 in the
absence of IGH translocation).
Most of the 26 miRNAs significantly discriminating the TC groups have previously been
found to be involved in solid and hematologic tumors. The most extensively investigated
are miR-155, miR-221 and miR-222, and the let-7 family. MiR-155 is involved in many
biologic processes, including hematopoiesis, inflammation, and immunity, and its
deregulation has been found to be associated with certain types of solid and hematologic
tumors, in which it is predominantly overexpressed and acts as an oncomiR (Esquela-
Kerscher and Slack, 2006). Notably, miR-155 has been very recently found deregulated
in Waldenström macroglobulinemia (WM), suggesting a role in the proliferation and
growth of WM cells acting on signaling cascades, including MAPK/ERK, PI3/AKT, and
nuclear factor-κB pathways(Roccaro et al., 2009). In addition, miR-155 knockdown leads
to significant increase of WM cells in G1 phase and to the down-regulation of cyclin-
dependent kinases and cyclins D and the simultaneous up-regulation of p53 expression,
suggesting a critical role in the regulation of cell-cycle proteins responsible for G1
arrest(Roccaro et al., 2009). MiR-221 and miR-222 have also been found to be up-
modulated in many tumors and described to target the C-KIT, p27, and p57 genes
(Lotterman et al., 2008; Visone and Croce, 2009). Finally, many human let-7 genes,
which are known to target RAS genes and oncogenes involved in the cell cycle, such as
HMGA2, MYC, CDK6, and CDC25,(Medina and Slack, 2008) map to regions frequently
deleted in human tumors, indicating that they may function as tumor suppressors. The
most striking finding was the very specific expression of 3 miRNAs (miR-99b, let-7e, and
miR-125a-5p), encoded in a conserved genomic cluster, in the t(4;14) cases. They are
coordinately up-regulated during metamorphosis in Drosophila, where they are
cotranscribed as a single polycistronic transcript (Sempere et al., 2003; Sokol et al.,
2008). Although their involvement has been suggested in various tumors, to our
knowledge, this is the first evidence of their coordinated deregulation in cancer.
The differential miRNA expression associated with distinct genetic subgroups is a novel
finding in MM. Of note, it has already been reported in other hematologic malignancies,
such as acute myeloid leukemia (Jongen-Lavrencic et al., 2008) and chronic lymphocytic
leukemia. As regards this latter neoplasia, in which the role of miRNA has been
extensively investigated, (Calin and Croce, 2009) the presence of miRNA signatures
associated with the major specific genetic lesions (trisomy 12 and 13q14, 11q23, and
17p13 deletions) has been reported very recently (Visone et al., 2009). Interestingly, as
found in our study, the discriminating miRNAs were not localized in the chromosomal
regions specific for the corresponding cytogenetic abnormalities. Overall, the
identification of specific miRNA patterns may help not only to distinguish distinct MM
genetic subgroups known to show differences in term of response to therapy and survival,
but also to provide a better understanding of their pathogenesis.
97
The computational prediction of miRNA targets currently presents several significant
challenges because all of the most widely used tools (miRanda, TargetScan, PicTar,
PITA, and RNAhybrid) are characterized by a significant proportion of false-positive
interactions(Didiano and Hobert, 2008; Grimson et al., 2007b)(Curtale et al., 2010) that
are partly because posttranscriptional regulation is context-dependent. On the basis of
increasing experimental evidence supporting the hypothesis that miRNAs can act through
target degradation, it has been proposed that target predictions could be integrated with
miRNA and gene expression profiles to select functional miRNA/mRNA relationships.
This can be done by adopting a variational Bayesian model and software, (Huang et al.,
2007b; Huang et al., 2007c) or simply using a nonheuristic method based on
miRNA/mRNA anticorrelation. We applied the latter to our dataset, which allowed the
reconstruction of a general miRNA/mRNA regulatory network that represents the
putative functional regulatory effects (as supported by expression data) of all of these
miRNAs on their targets in MM.
On the basis of the target genes identified here, several the miRNAs differentially
expressed in IGH translocated cases may play important roles in the biology of MM
PCLs. With regard to the t(4;14) miRNA signature, 5 miRNAs target CBFA2T2, a
nuclear repressor homologous to ETO that binds to the AML1-ETO complex and may
play a role in hematopoietic differentiation(Fracchiolla et al., 1998; Lindberg et al.,
2005). Furthermore, let-7e targets PTPRE, a positive regulator of osteoclast
function(Chiusaroli et al., 2004) and a selective inhibitor of IL-6– and IL-10–induced
JAK-STAT signaling(Tanuma et al., 2001). Interestingly, the expression of the tumor
suppressor gene PDCD4 (programmed cell death 4)(Lankat-Buttgereit and Goke, 2009), a
supported target of miR-221 based on our analysis, has recently been found to depend on
the levels of MMSET, which is deregulated by the t(4;14)(Brito et al., 2009). ING4, a
tumor suppressor frequently mutated or down-regulated in human cancers, which was
recently described to exert an inhibitory effect on MM-induced angiogenesis(Colla et al.,
2007; Kim, 2005a), is a supported target of miR-365. Concerning the TC5 signature,
miR-133a targets DM vs TF1, a putative tumor suppressor that activates the ARF-p53
pathway, leading to cell growth arrest or apoptosis; notably, it maps at 7q21, often
deleted in human malignancies(Inoue et al., 2007). Finally, among the miRNAs up-
regulated in t(11;14), miR-361-3p and miR-30e* target PPP2R4, an activator subunit of
PP2A, which plays an important role in the survival and growth of MM cells because it
dephosphorylates the GP130 subunit of the IL-6 receptor, thus preventing its degradation
and allowing the activation of IL-6 signaling(Kang et al., 1996; Mitsuhashi et al., 2005).
All this findings strongly suggest that understanding the molecular biology of myeloma
requires considering the miRNome in the context of the genomic and transcriptomic
features of malignant PCLs. Based on this integrated approach, our data may provide an
98
important contribution to future investigations aimed at characterizing the role of specific
miRNAs in MM pathogenesis.
Furthermore, reconstructing regulatory network from expression data is a crucial step to
understand the mechanisms underlying biological systems. However, the high number of
genes and interactions still represents a challenging issue for the extraction of relevant
targets and relationships from such large systems. A standard approach is searching
targets among the most connected genes (hubs) or among sub groups of genes known to
be relevant in the analyzed phenotype. The goal of this type of analysis is to identify
previously unknown relationships that can be the object of a subsequent experimental
validation. An alternative approach is studying the network characteristics to identify
groups of genes organized in sub-networks, which may suggest novel interactions and
shed light on regulatory modules involving these genes or their common targets.
Although effective, both strategies rely on prior knowledge to select the genes of interest,
thus hampering the capacity of extracting de-novo knowledge from the network. A way to
overcome this limitation could be adapting techniques commonly used in the analysis of
communication and infrastructure networks. In these fields, a key analysis is the
resilience of the network to external disturbances and to malfunctioning. Network
robustness strongly relies on the network structure and, in particular, on the existence of
paths between the nodes. When nodes or links are removed, the lengths of these paths can
increase and some nodes will become disconnected. It is therefore interesting to find the
critical component of the network, i.e. the nodes or edges that are really important for the
functioning of the network. In Latora and Marchiori, the authors proposed a method to
evaluate the importance of a network element (that can be a node or an edge) by
considering the drop in the network performance caused by its deactivation (Latora and
Marchiori, 2005). The performance of the perturbed network is compared with the
original one. Iturria-Medina and colleagues applied a similar approach to investigate the
human brain anatomical network(Iturria-Medina et al., 2008). Different criteria can be
used to measure the performance, such as efficiency or mean flow rate of information.
Efficiency measures how efficiently the nodes of the network exchange information.
Applying this concept to regulatory network, critical nodes and edges are critical genes
and critical regulatory interaction, respectively. Usually the most important nodes are
considered the most connected ones (hubs), but this is not always the case. In genetic
networks a gene can be connected to many genes simply because is a transcription factor
that normally controls many targets or a gene that is controlled by many other genes. For
instance, in the analysis of the B cell networks, the largest hub with more than 300
interactions was a poorly characterized gene, BYSL. Instead, a much more interesting
gene was MYC that, with only 56 neighbors, ranked 410th in terms of connectivity.
MYC, a well-known proto-oncogene, had neighbors that were themselves genetic hubs
(including BYSL), such that MYC could modulate a substantial percentage of all genes in
99
the cell trough a relatively small number of neighbors(Basso et al., 2005b). Recently,
some approaches exploited the topological features of large gene regulatory networks to
identify individual components that are biologically relevant or to elucidate the role of
each particular element in regulation. Patapov and co-workers introduced the pair-wise
disconnectivity index to quantitatively evaluate the topological significance of each
element (i.e., nodes and edges) in the context of all other elements of the regulatory
network (Potapov et al., 2008). The application of this approach to the analysis of the
TLR4 signal transduction network allowed identifying a number of key signaling and
transcription regulators among the nodes top-ranking in terms of disconnectivity index.
Differently, Emmert-Streib and Dehmer used the concept of functional robustness,
originally introduced by Li et al.(Li et al., 2004), to study the functional robustness of the
transcriptional regulatory network in yeast(Emmert-Streib and Dehmer, 2009). The
definition of an information theoretic measure to estimate the influence of single node
perturbations on the global network topology allowed identifying nodes which are fragile
with respect to single node knockouts and revealed significant differences between fragile
nodes and hubs. Interestingly, the set of fragile nodes was statistically enriched in
essential genes, i.e. in genes required to sustain vital yeast. Here, the critical analysis of
network components has been applied to inspect the transcriptional and
posttranscriptional regulatory networks reconstructed from mRNA and miRNA
expression data of multiple myeloma samples. The transcriptional and post-
transcriptional networks were reconstructed using ARACNe and the Pearson correlation
coefficient of the expression vectors of miRNA target genes, respectively. Both networks
showed a scale free structure, i.e. a type of structure reported with evidence in lower
organisms, but still argument of debate in eukaryotes. The connectivity plots of Figure 14
strengthen the hypothesis that the structure of human interaction 406 networks has a scale
free nature with a saturation effect also reported for other scale-free networks, when the
maximum connectivity range is below 1000(Albert, 2005; Almaas, 2007; Barabasi and
Albert, 1999; Basso et al., 2005a). Both networks are also slightly assortative, meaning
that they tend to have an aristocratic behavior where nodes with high degree tend to
connect with nodes with similar degree. This suggests a hierarchical control mechanism,
as also reported in(Basso et al., 2005a). The analysis of critical components revealed that
genes with a limited number of connections could be critical for the structure of the
network and that hubs are not necessarily critical nodes. Indeed, about one half of most
connected nodes in each considered network were not included in the corresponding list
of most critical nodes and genes like BLNK, characterized by a low node degree, were
instead critical. These non-hub critical nodes would have been disregarded as putative
regulatory targets due to their limited number of connections although they may provide
clues to the detection of key regulatory circuits. Finally, the integration of the
transcriptional and post-transcriptional levels allowed identifying critical genes for both
100
types of regulatory interactions and dissecting direct critical relationships at
transcriptional level from interaction that are instead indirect since mediated by post-
transcriptional regulation.
6.2. miRNAs modulation in colon cancer and metastasis development
and its impact on regulatory networks and pathways
The impact of miRNA in colorectal cancer (CRC) development and progression has been
clearly demonstrated in the recent years, and for several miRNAs tumor-suppressor or
tumor promoter roles have been proposed. Furthermore, different miRNA signatures have
been found informative for tumor prognosis and clinical outcome in various cohorts of
patients.
In this study, we carried out a genome-wide integrative analysis of miRNA and genes
expression profiles in CRC samples, comprehensive of normal colon mucosa, primary
tumor and liver metastasis, in order to identify differentially expressed miRNAs and their
anti-correlated targets, defining modulated post-trancriptional regulatory networks. The
ultimate aims were to discover specific miRNA-gene relationships significantly supported
by expression data and associated with tumor progression, and to gain new insights into
the cellular pathways affected by identified miRNAs.
Our results suggested that miRNA and gene expression profiles had different capability to
discriminate different sample classes. The fairly good separation of normal samples from
tumor and metastases that was obtained according to both miRNA and gene profiles,
confirmed the quality of tissue enrichment procedure implemented in the study. On the
other hand, expression profiles of miRNAs resulted to be more informative than those of
genes to distinguish primary tumors from metastases. Interestingly, by considering per-
patient match of different tissue samples, we showed that tumor and metastatic samples
obtained from the same patient have a not negligible tendency to cluster together. This
finding indicates that, on the basis of gene expression characteristics, a metastasis is more
similar to the matched tumor that to the metastases of other patients. Differently, our
results seem to suggest that the variability of miRNAs expression profiles observed after
metastasis development process, is more extensively shared between different patients.
For the identification of miRNAs and genes differentially expressed in different tissue
types (DEM and DEG, respectively), we adopted stringent criteria. We implemented two
strategies for the identification of DEM modulated between sample classes: considering
the whole set of samples and by using per-patient matching information, but using a
smaller group of patients. We observed that the second approach seem to be less
powerful, since it discover set of DEMs largely represented in those already found by the
first one. This may be partially due to the reduced number of patients for which all tissue

101
types were available. Besides, the T vs N contrast identified about six times more DEM
than the M vs T comparison, confirming above raised observations.
A global reduction of miRNA expression levels has been reported as a general trait of
human cancer(Lu et al., 2005), and the experimental repression of miRNA biogenesis in
cancer cell lines has been shown capable to promote cell proliferation and invasion
(Martello et al., 2010). These observations led to the hypothesis that cancer cells may use
down regulation of miRNA to foster invasive and metastatic behaviors. However, in
contrast with these findings are studies on clinical samples showing that in solid tumors
the most common miRNA event is gain of expression, whereas loss of expression is a
more limited event and more tissue specific(Volinia et al., 2006). Partially in agreement
with this last report, we did not observe a preferential down-regulation of miRNAs in our
set of samples, since a similar number of up- and down-regulated miRNAs (29 and 33,
respectively) was obtained when an all tumors (paired and unpaired samples) were
contrasted vs all normal tissues. Also, among the robust group of miRNAs resulting
modulated in the NT contrast according to both paired and unpaired samples
comparisons, up- and down-regulated miRNAs are equally represented.
The number of dysregulated miRNAs was basically maintained from tumor to metastasis
transition. A more general tendency towards the down-regulation was instead
demonstrated in gene expression data, as 100 up-regulated and 355 down-regulated genes
were observed when tumor vs normal comparison was carried out, while 29 and 9 genes
were up- and down-regulated, respectively, in the tumor vs metastasis transition. Clearly,
it is difficult to exactly establish how much gene expression down-regulation is a direct
effect of miRNAs modulation and how much it may be due instead to different forces,
working at other regulatory levels. Nevertheless, our data confirm that miRNA
dysregulation is essential at all stages of tumorigenesis, since it largely occurs in primary
tumor as well as in metastasis. Furthermore, once present, the specific miRNA pattern is
almost steadily maintained even in advanced primary tumors and in their distant
metastases.
The list of miRNAs differentially expressed between tumor and normal mucosa (both in
paired and unpaired comparisons) includes miRNAs that have been previously described
as members of a miRNA "signature" common to different types of solid tumors(Negrini
et al., 2009). Many of them have been also implicated in molecular and biological
processes that drive tumorigenesis in CRC. Relevant examples are miR-143, miR-145,
miR-125b and miR-21, which are associated with cell growth and survival; the miR-17-
92 cluster, miR-20 and miR-100, which are involved in uncontrolled cellular
proliferation; the miR-183 cluster and miR-31, which are implicated in cell migration;
and miR-150, which has been very recently identified as a potential biomarker of
prognosis and therapeutic outcome in CRC (for the details about up- or down-regulation
of these miRNAs see Table). Interestingly miR-139-5p, the most down-regulated in the T
102
vs N comparison, has been very recently identified as a member of a signature predictive
of the tumor status in stage II CRC(Chang et al., 2011b); moreover, miR-224, the most
up-regulated together with miR-183 in the same comparison, was identified for its ability
to distinguish CRC with a proficient or a deficient DNA mismatch repair(Oberg et al.,
2011). For some of these miRNA the tumor-promoting or tumor-suppressing functions in
CRC as well as in other tumors have been previously suggested. However, in the light of
the large number of mRNA regulated by each miRNA, it is very likely that two or more
genes from different molecular pathways may be altered in their expression, and
considering the tissue specificity of the miRNA activity, a strict classification of cancer-
associated miRNAs into onco- or tumor-suppressor miRNAs might be an over-
simplification.
When primary tumor and metastatic samples were compared, a limited number of
differentially expressed miRNAs comprising 5 over and 6 under expressed miRNAs was
obtained in unpaired comparison; while only 5 over expressed miRNA were obtained in
paired comparison. Common to both paired and unpaired comparison were miR-210,
whose over expression in solid tumors has been associated with hypoxia, cell survival and
invasion, miR-100 that has been considered a regulator of ATM/mTOR pathway, and
miR-122, that it was shown being a contamination from residual liver tissue.
Notably, two other miRNAs, miR-100 and miR-139-5p, were characterized by an
inversion of their down modulation in the tumor toward metastasis transition (in paired
and unpaired group, respectively) even if their expression level in the metastatic samples
was still lower in comparison with normal tissue.
The identification of a limited number of miRNAs differentially expressed between tumor
and metastases may be explained in two different ways. On one hand, as a consequence
of cancer progression a malignant tumor contains multiple cell populations with
heterogeneous behaviors, and clones with the ability to invade and develop metastases
might be present in the primary lesion. Thus, miRNAs associated with metastasis may
already be expressed in early tumors, which implies that clones with metastatic potential
are present from the beginning in the primary lesion. Alternatively, primary tumors that
we had used were of advanced stage and then of high metastatic potential, thus
dysregulated miRNAs associated with primary tumor were not further modified during
the transition from primary tumor to metastatic lesion.
In the second part of the study, we carried out the integrative analysis of miRNA and
genes expression profiles to reconstruct post-transcriptional regulatory networks. Post-
transcriptional regulatory networks unveil a significant layer of interconnection among
different miRNAs and genes during the transition from normal to tumor stage
Clearly, the point is understanding how much miRNA expression variation through the
main steps of disease progression impacts on gene expression modulation, and ultimately
on cell behavior. We exploited miRNAs and genes matched expression profiles to
103
identify a very reduced set of miRNA-gene targeting relationships, which are most likely
to take place in the considered cells. miRNA activity is part of complex regulatory
networks and gene expression profiles are the result of different forces, working at
multiple regulatory levels. Proteomics studies(Baek et al., 2008), showed that most
miRNA targets with significantly reduced protein levels also experienced detectable
reduction in mRNA levels, indicating that changes in mRNA expression are reasonable
indicators for microRNA regulation. Using a stringent significance criterion (FDR<0.01)
and controlling for multiple testing, we were able to identify a set of 3,078 miRNA-target
relations, involving 117 (39%) out of 309 selected miRNAs. Afterwards, we considered
the results of this enrichment analysis in the light of information about differentially
expressed miRNAs and genes in the T vs N and M vs T comparisons. The study of the
regulatory network in tumor development is particularly relevant: it involves the subset of
miRNAs differentially expressed in the T vs N comparison, showing a sizeable fold-
change and resulting to be associated to at least one supported target gene. The T vs N
network we identified includes two components (unconnected subnetworks), involving
respectively 6 up-regulated and 17 down-regulated miRNAs together with their putative
target genes, part of which are significantly differentially expressed in the same contrast.
The biological meaning of the smaller component (Figure22) pertaining to the 6 miRNAs
up-modulated in the T vs N contrast is witnessed by the large proportion of significantly
modulated genes among the set of supported target genes represented in the network. This
observation outlines that the pure number of up- or down-regulated miRNAs may be
scarcely relevant to predict the impact of miRNA regulation on cell behavior, for which
gene expression is a proxy.
Some genes are shared targets of different miRNAs. For instance, the PDCD4 gene, a
tumor suppressor gene, appears to be the target of three different miRNAs, miR-21, miR-
182 and miR-183 (these last are members of the same family), up-regulated in the
primary tumor compared with normal counterpart, and resulted significantly down-
regulated in the same comparison.
The interplay between the sub-networks modulated by miR-21 and miR-182 deserves
some comments. miR-21 is an oncomiR whose role in "licensing" and supporting the
neoplastic process since the earliest step of tumorigenesis is well known in different solid
tumors; its overexpression, indeed, has been detected in pre-neoplastic lesions of colon
mucosa and in advanced adenocarcinomas (Chang et al., 2011a). The connection between
miR-21 and miR-182 is particularly intriguing in view of the role of miR-182 in the
cytoskeleton reorganization, a process that favors the epithelial-to-mesenchimal transition
and fosters cell proliferation and invasion. Among the miR-182 predicted targets,
ENTPD5 resulted differentially down-regulated in our analysis. The gene product is a
member of the family of ectonucleoside triphosphate diphosphohydrolase (E-NTPDases)
enzymes that hydrolyze extracellular tri- and diphosphonucleosides, are components of
104
cellular purinergic signaling and involved in energy metabolism(Stella et al., 2010).
Recently, Mikula et al. showed that both ENTPD5 mRNA and protein levels
progressively decrease during the transition from normal colon mucosa, through
adenoma, to adenocarcinoma(Mikula et al., 2010). This finding is in line with our results,
which additionally indicate miR-182 as a possible regulator of ENTPD5 expression.
Overall, our results go beyond the idea of up- or down-regulated miRNA signatures
affecting a given cell behavior. Instead, they suggest a complex interplay between up- and
down-regulated miRNAs: the admixture thereof is a specific signature of tumor
development (or progression), whose modulation (up- or down-) impact in different ways
to genes belonging to the same pathway. Final biological output obviously depends on
miRNA and gene quality, on direction of modulation, as well as on the pathway structure
(i.e. the role of gene products and their direct relationships in the pathway).
6.3. microRNA expression in HTLV-1 infection and adult T-cell
leukemia/lymphoma
Using microRNA-arrays, we identified 21 downregulated microRNAs and 6 upregulated
microRNAs in ATLL samples with respect to resting CD4+ T-cells.
First of all an unsupervised cluster analysis was performed on selected microRNA
expression profiles, to eliminate miRNA with very weak signals. The hierarchical cluster
analysis showed high heterogeneity among the ATLL patients, although all samples except
PT 1 were more similar to resting CD4+ cells than to their stimulated counterparts. The
resting CD4+ controls well clustered together, while the stimulated counterparts differed
considerably from each other.
Differential expression analysis on microRNA data highlighted a preponderance of
downregulated microRNA expression in tumor cells versus their normal counterparts in
agreement with early profiling studies of broad panel of human tumors (Lu et al., 2005).
Indeed the two classes statistical analysis performed on ATLL versus resting CD4+
miRNAs evidenced 21 down-regulated and 6 up-regulated miRNAs. In particular,
functional data in the context of HTLV-1 are already published for miR-130b(Yeung et
al., 2008). The predicted promoter region of miR-130b contains potential binding sites for
NF-κB, and is responsive to Tax(Yeung et al., 2008). miR-130b as well as miR-93
(upregulated in ATLL samples examined by Yeung et al.) were found to provide a
survival advantage to ATLL cell lines through downregulation of TP53INP1 (tumor
protein 53-induced nuclear protein 1)(Yeung et al., 2008), a protein that contributes to
cell cycle-arrest- and apoptotic signals transmitted by p53 and p73 in response to DNA
damage and other stress conditions(Pouyet and Carrier, 2010; Savkovic et al., 2004).
105
miR-146b-5p is identical to miR-146a except for 2 differing nucleotides near their 3'
ends. Downregulation of miR-146b-5p in ATLL samples is therefore interesting in light
of the documented increase in levels of miR-146a in HTLV-1-infected cells(Pichler et
al., 2008; Tomita et al., 2009). miR-146a was initially distinguished by its upregulation in
myeloid cells exposed to the innate immune stimulus lipopolysaccharide; this induction
occurs through the NK-kB pathway and has a role in fine-tuning the innate immune
response(Zhao et al., 2011). In CD4+ T-cells, miR-146a is induced upon TCR stimulation
(Cobb et al., 2006; Curtale et al., 2010), where it contributes to attenuation of the IL-2
signal and protects the cells from AICD (activation-induced cell death)(Curtale et al.,
2010; Taganov et al., 2006). Induction of miR-146a in HTLV-1-infected cells is also NF-
kB-mediated through Tax, and confers a survival advantage to these cells (Tomita et al.,
2009). Increased expression of miR-146a is also observed in EBV-infected B-cells during
latency III, the viral growth program that drives B-cell proliferation(Cameron et al.,
2008b).These properties, along with the fact that several solid tumors display
upregulation of miR-146a/b(Li et al., 2010; Wang et al., 2011), suggest that they could
contribute to the transformation process associated with HTLV-1. On the other hand,
studies in breast cancer cells (Bhaumik et al., 2008; Hurst et al., 2009) and glioma cells
(Xia et al., 2009) indicate that miR-146a and 146b interfere with metastasis and invasion,
therefore suggesting tumor suppressor function for these microRNAs in some cell
contexts. miR-146a and miR-146b map to chromosomes 5q33 and 10q24, respectively,
and their genomic regions differ in terms of promoter elements, length and intron-exon
content(Taganov et al., 2006). Determination of the mechanism responsible for
downregulation of miR-146b-5p in ATLL cells may therefore add to the understanding of
alterations in transcription factors and RNA processing pathways that contribute to the
transformation process.
The sequence of miR-125a-5p is very similar to miR-125b, one of 5 microRNAs that
target the HIV-1 3'UTR (along with miR-150, miR-28, miR-223 and miR-382) and
influence the ability of the virus to productively infect CD4+ T-cells, monocytes and
macrophages (Huang et al., 2007a; Wang et al., 2009b).
Interesting among 6 miRNA upregulated in the ATLL-resting CD4+ comparison is miR-
34a known to be upregulated by p53 in response to genotoxic and oncogenic stress and
targets genes affecting cell proliferation and survival, resulting in growth arrest, senescence
and apoptosis; miR-34a downregulation in several solid tumors suggests its function as a
tumor suppressor(Hermeking, 2010). However, miR-34a is upregulated in Epstein-Barr
virus-transformed B-cells (Mrazek et al., 2007) during latency type III (Cameron et al.,
2008a) and in hepatitis B virus-associated hepatocellular carcinoma (Mizuguchi et al.,
2011), and might exert diverse effects depending on the cell context (Dutta et al., 2007).
Among hematological cancers miR-34a has been studied most extensively in chronic
lymphocytic leukemia (CLL). miR-34a levels vary among CLL cases and can exceed those

106
found in normal CD19+ B-cells (Asslaber et al., 2010), but are consistently lower in tumors
bearing mutated or otherwise inactivated p53(Asslaber et al., 2010; Mraz et al., 2009). This
is of interest, as ATLL cells generally harbor functionally inactive p53(Wang et al., 2009a;
Yamada and Kamihira, 2005), implying involvement of alternative pathways driving miR-
34a expression. This is supported by studies of human papillomavirus-infected
keratinocytes, which show initial downregulation of miR-34a due to interaction of E6 with
p53, followed by restoration of miR-34a expression despite continued p53
inactivation(Wang et al., 2009a).
The post-transcriptional regulatory network, involving miRNA differentially expressed
in ATLL versus resting CD4+ cells and their putative target mRNAs, was reconstructed.
Network observation suggests that down-regulated miR-192, miR-212 and miR-31 seem to
act in a cooperative way in the cAMP signaling by determining the upregulation of several
forms of Adenylate cyclase. Previous studies of miR-34a demonstrated that it targets
mRNAs coding for genes affecting cell proliferation and survival, including Cyclins D1
and E2, Bcl-2, CDK4 and CDK6, c-Myc and N-Myc, E2F3, Met, and SIRT1. In turn,
downregulation of SIRT1 enhances p53 activity (Hermeking, 2010; Yamakuchi and
Lowenstein, 2009). Among the potential microRNA targets revealed for miR-34a in our
analysis, STAT4 is of particular interest. STAT4 is a transcription factor that plays an
important role in mediating proinflammatory immune responses(Kaplan, 2005). Studies of
STAT4-deficient mice demonstrated its importance for biologic responses to IL-12,
including production of IFN-gamma(Watford et al., 2004).
Moreover, in some enriched GO term “regulation of biological quality”, “primary
methabolic process” and “developmental process” we found several members of the RAS
superfamily of small GTPase, RAB14, RAB23, RHOQ (Ras homolog gene family, member
Q), and RAC1, predicted to be targets of several miRNA in the network (miR-31, miR-30b,
miR-142-5p). Several RAS proteins have been associated with cancer cell migration and
invasiveness.
Furthermore, the involvement of many miRNA supported target genes in critical
biological circuits leading to ATLL was also reinforced from the enrichment in KEGG
pathway in “pathway in cancer”, “Wnt-signaling pathway” and “cell cycle”.
6.4. MAGIA, a web-based tool for miRNA and Genes Integrated
Analysis
The integrative analysis of target prediction, miRNA and gene expression profiles is not
straightforward for most experimental researchers, not only for problems regarding
miRNA and targets annotations, but also for the many-to-many nature of predicted
relationships to be considered and the extensive time requirements of computations.
107
However, there is an increasing amount of experimental studies aiming at gaining
molecular understanding of biological processes or diseases from the computation and the
visualization of high-throughput systems biology analyses results. Available tools are not
adequate to the rapidly increasing amount of matched miRNA–gene profiles, the analysis
of which could gain a remarkable advantage from target predictions and miRNA–gene
expression profiles integration. MAGIA (MiRNA And Genes Integrated Analysis) tries to
fill these gaps allowing the combination of target predictions for either matched or un-
matched expression miRNA–gene profiles. Using different relatedness measures and
integration methods, MAGIA refines target predictions and reconstructs miRNA–gene
bipartite networks. In this context, MAGIA is a useful, timely and easy-to-use web tool
that will facilitate users in the investigation of the post-transcriptional regulatory
networks and in the discovery of biologically relevant regulatory circuits.
6.5. Impact of host genes and strand selection on miRNA and miRNA*
expression
Post-transcriptional regulation in miRNA biogenesis, namely strand selection, and
expression relationships between intragenic miRNAs and host genes was investigated
exploiting sequence, genomic and expression information.
Our observations were based on a comprehensive collection of miRNAs and
genes/transcripts whose annotation and localization was integrated with expression
profiles computed from five large microarray-based datasets, regarding different
biological contexts and including both normal and tumor/disease samples. At least 8
different tissues types are represented (breast, prostate, liver, ovary, testes, lung, colon
and brain) plus different T- and B-lineage blood cells. The high number of samples and
the broad coverage of cell types would guarantee both significance and fair generality of
the obtained results.
The first evidence emerging from our analysis regards the expression behavior of pairs of
sister mature miRNAs produced from the same hairpin. In the classic model of miRNA
biogenesis, the duplex of mature miRNAs is produced by Dicer processing of the hairpin
precursor. Then, a following strand selection step determines which mature miRNA is the
degraded “passenger” strand and which is the major and stable form that will act as guide
for the mature miRISC complex in the post-transcriptional silencing of target genes. It is
worth notice that the two mature miRNAs have different sets of target genes and may
differently contribute to the regulation of cell activities. The analysis of expression
profiles showed that, considering different samples, representing different tissue types
under various conditions, the strand selection is highly regulated. In fact, we observed
miRNA pairs in which the same miRNA is the most expressed in the majority of

108
considered samples, as well as miRNA pairs expressed at comparable level in almost all
considered samples. Nevertheless, the large majority of miRNA pairs show a not
deterministic strand selection bias, which may be highly regulated since it shows tissue-
/cell-/condition-specific modulation. This is confirmed by the fact that unsupervised
analysis, using for samples classification only information about the direction and the
strength of the strand selection bias, is able to distinguish different tissues, and sometimes
also different conditions (as normal and malignant cells). Moreover, when considering a
minimum expression threshold, only a minority of pairs were expressed alternatively in
all considered cell types, whereas the majority were concurrently expressed in some cell
types and alternatively in others. A significant fraction of concurrently expressed pairs
showed highly comparable levels, suggesting that both the major and the minor forms
may contribute to post-transcriptional gene silencing, possibly in a coordinate way. Also
considering separately alternatively and concurrently expressed pairs, the regulated nature
of the strand selection is evident. All these results highlighted once again the complexity
of miRNA biogenesis regulation that is also emerging from sequencing data analysis,
continuously adding novel layers to miRNAs biogenesis pathways and enriching
possibilities for their regulation.
The second aim of the study was to clarify to what extent intragenic miRNAs were co-
expressed with the corresponding host genes. An intragenic miRNAs and host genes
related behavior has been taken for proven by different Authors and used as a strong
assumption for the design of computational methods for miRNA targets identification
(Moreau et al., 2003) or to go further and explore the possible role of intragenic miRNAs
in supporting the regulatory activity of host genes products(Mi et al., 2007). We
considered four expression datasets including expression profiles in various cell types
(brain in normal and with Alzheimer disease conditions, normal prostate and prostate
cancer, normal blood cells and different blood cell diseases) and clearly showed, that the
large majority of intragenic miRNAs do not share similar expression profiles with their
host genes. Only 10% of miRNA and host gene pairs appear significantly co-expressed.
This may be partially explained by the fact that not all miRNAs located in introns of
protein coding genes are under the transcriptional control of coding gene promoter(s). In
fact, Corcoran and colleagues (2009) (Corcoran et al., 2009) experimentally identified
mammalian miRNA Polymerase II promoters by chromatin immunoprecipitation. They
discovered that the nearest ChiP-chip peak for a number of intragenic miRNAs overlaps
the host gene’s TSS but that reportedly one quarter of intragenic miRNAs may be
transcribed from their own promoters and thus showing different expression behavior and
modulation than the protein-coding gene transcript(s). This result, as well our findings
and considerations, encourage much more detailed studies about transcriptional
regulation of miRNAs expression.
109
Moreover, host genes expression profiles were proposed as possible proxies for the
intragenic miRNA expression profile, when the latter is unavailable, to identify most
probable miRNA target genes. So we conducted two integrated analysis of target
prediction and expression profiles, one using real miRNA and gene expression profiles,
and the second using host genes expression profiles as proxy for miRNAs, and gene
expression profiles. The comparative evaluation of the two methods was based on an
independent true solution, represented by a set of validated regulatory interactions. This
allowed to measure and compare the effectiveness of the two methods in finding
validated regulatory interactions, among the subset of predicted miRNA-target relations
supported by negative correlations of expression profiles. Our results support the
usefulness of the integrated analysis conducted on real miRNAs expression profiles,
when stringency is kept reasonably high. Moreover, as expected from previous
observations about intragenic miRNAs and host genes scarce co-expression, we
experienced that the use of host genes expression as a proxy for miRNA profiles for the
integrated analysis seems not significantly enrich in validated relations.
We can conclude that the large majority of miRNA pairs show a not deterministic strand
selection bias, which may be highly regulated, since it presents tissue-/cell-/condition-
specific modulation reinforcing the importance of the strand selection regulation, adding
the role of such layer of miRNA biogenesis in miRNA-based control of cell activities.
Furthermore, our results showed that most host genes and intragenic miRNAs are
scarcely co-expressed. In specific cases, they might be co/expressed but mainly in a
cell/tissue-specific way. This actually does not rule out the importance of already
documented cooperation of specific intragenic miRNAs and host genes products, but
proves that the expression information of corresponding host genes can hardly be used as
estimator for actual expression of the co-transcribed miRNA and encourage more detailed
studies of transcriptional regulation of miRNAs expression.
6.6. Characterization and discovery of novel miRNAs and moRNAs in
JAK2V617F mutated SET2 cell
By exploiting deep sequencing data the fraction of short RNAs expressed in SET2 cells, a
JAK2V617F mutated cell line was characterized and analyzed in integration with
different levels of genomic information and metadata concerning known hairpin loci.
We focused on known miRNA loci by considering 1,421 known hairpin precursors and
1,731 known mature miRNAs, including hundreds of new miRNAs discovered by
massive sequencing approaches.
The expression of known mature miRNAs from sequencing data has been estimated with
a method able to correct for multiple mapping issues. Reads multiple mapping might arise
110
from variable reasons largely attributable to miRNA loci redundancy and similarity, to
the existence of miRNA families, as well to reads-to-reference sequence mapping
choices. The problem of mapping quality was considerably overlooked by different
studies that recently exploited RNA-seq for miRNAs and isomiRs discovery. It has been
shown(Papadopoulos et al., 2009a) that short reads are prone to map to multiple genomic
loci with an equal number of mismatches (or even without mismatches), in particular
among multicopy miRNA precursors (identical mature miRNAs may be produced by
different hairpins, transcribed from different loci) and miRNA families. Other studies
considered only reads with unique mapping(Petrocca et al., 2008), although a too
restrictive mapping settings may affect quantitative estimation of multicopy miRNAs.
Basically, we implemented a “multiple-mapping corrected read count” to quantify
correctly expression levels relatively to both hairpin and mature miRNAs, also including
multilocus miRNAs and miRNA families.
Another main finding of the study regards mature miRNA sequence variation. We
showed that mature miRNAs were no longer represented by a unique sequence, i.e. the
one annotated in miRBase, rather they were found as mixtures of sequence variants,
called isomiRs, that derive mainly from non-canonical processing of hairpin precursors.
Two third of miRNAs expressed in SET2 cells were found associated to different
sequences. Data showed that 60% of miRNAs are associated to 2-4 isomiRs, that differ
from the most expressed isomiR only for 5’ and 3’ sequence length, but align exactly to
the hairpin precursor. This might imply that most isomiRs arise as a consequence of
alternative processing of miRNA precursors. Interestingly, the sequence variability of
isomiRs regards prevalently the 3’ region of mature miRNAs, but 8% of isomiRs differ
from the “classic” miRNA sequence in the 5’ region, possibly impacting on target
recognition and/or regulatory activity and strength. Future evaluations of isomiR quality
and proportion in different cell types will help to clarify if and how much this miRNA
biogenesis feature is cell- and context-specifically regulated.
In the second part of the study, we exploited the discovery power of RNA-seq to identify
a consistent number of novel short RNAs expressed from miRNA loci in SET2 cells. It is
worth notice that RNA discovery results were produced using only read aligning exactly
to hairpin loci in order to minimize artifacts. At variance with other studies, we mapped
sequence reads to extended hairpin loci, i.e. the hairpin precursor genomic regions plus
30 nucleotides upstream and downstream. This allowed us to uncover novel short RNAs
derived from extended hairpin loci transcription and canonical or non-canonical
processing. More specifically, we discovered 78 novel miRNAs expressed from known
hairpin precursors. These are all new miRNA*, 11 of which are expressed in SET2 cells
over the median value observed for the group of detected known miRNAs.
These data confirm recent findings about the importance of miRNA*(Kuchenbauer et al.,
2011). Considering known and new miRNAs together, we took into account expression
111
behavior of pairs of miRNAs derived from 5 and 3’ strands of the same hairpin
(miRNA/miRNA*, so called “sister miRNAs”). Sister miRNAs have different sequences
and target different sets of coding RNAs. We showed that for about one half of hairpins
both sister miRNAs are expressed concurrently; very likely, both contribute to target
repression. Moreover, slightly less than one quarter of concurrently detected sister
miRNA pairs were expressed at the same or comparable level. No strand prevalence was
observed. These results further support theories about the not deterministic nature of
strand selection bias, that appears to be regulated in cell-, tissue- and condition-specific
way. Also, our findings are compatible with the two-steps cleavage of hairpin RNA by
Dicer(Burroughs et al., 2011); bidirectional binding of processed dsRNAs by Dicer may
indeed result in directional presentation of double strand miRNA duplex to Argonaute
influencing the strand selection bias.
Very interestingly, we found short expressed RNAs derived from regions of extended
hairpins outside known and new miRNAs. These are members of a novel class of
miRNA-related RNAs, called micro-RNA offset RNAs (moRNAs)(Fernandez-Valverde
et al., 2010) recently identified by massive short RNAseq. In the present study 58
moRNAs expressed from 56 hairpins at moderate to high level were identified. In
particular hsa-5'-moR-103a-2, hsa-5'-moR-106b, hsa-5'-moR-19b-1 and hsa-5'-moR-16-1
were highly expressed in SET2 cells. It was also of interest that 5 of the 16 most
expressed moRNAs were associated with the 17-92 (miR-19b-1, miR-20a, miR-92a,
miR-19a) and the 106-25 (miR-106b) cluster, as discussed above for miRNAs. Of note,
some of the highly expressed moRNAs were unique and did not perfectly overlap the
most expressed miRNAs from the same cluster, suggesting that activation of the cluster
might result in global up- regulation of the genes but also in a non-balanced ratio between
miRNAs and moRNAs.
Evidence regarding possible functions of moRNAs is still fragmentary(Fernandez-
Valverde et al., 2010); one hypothesis claims that moRNAs might guide RISC to
complementary target mRNAs as miRNAs do(Guo et al., 2011). Nevertheless, the fact
that moRNAs are nuclear enriched may support the alternative hypothesis that moRNAs
intervene specifically in nuclear processes as other nuclear short and long RNAs do.
Therefore, moRNAs can be viewed as a new class of regulators whose qualitative and/or
expression abnormalities might impact on human diseases. In this view, the discovery of
expressed moRNAs in SET2 cells is intriguing.
In summary, we have extensively characterized the profile of short RNAs expressed in
SET2 cells, a model used for mechanistic and drug sensitivity studies in the field of
MPNs. This information could be useful for further characterization of the cell model and
future studies involving primary MPN cells. It will be key to understand how the
interplay of known and new miRNAs, isomiRs, and moRNAs contribute to the abnormal
regulation of cell proliferation that characterizes MPN cells and whether and how novel

112
drugs affect this complex system of regulators. Taken together, our results regarding
isomiRs and moRNA expression fit well in the “RNA in pieces” phenomenon(Berezikov
et al., 2011b): many transcripts undergo post-transcriptional cleavage to release specific,
functionally independent, fragments expanding the spectrum of regulatory RNAs
produced by the human genome and from single loci.

113
Reference List
Albert, R. (2005). Scale-free networks in cell biology. J. Cell. Sci. 118, 4947-4957.
Albert, R., Albert, I., and Nakarado, G.L. (2004). Structural vulnerability of the North
American power grid. Phys. Rev. E. Stat. Nonlin Soft Matter Phys. 69, 025103.
Alexiou, P., Maragkakis, M., Papadopoulos, G.L., Reczko, M., and Hatzigeorgiou, A.G.
(2009). Lost in translation: an assessment and perspective for computational microRNA
target identification Bioinformatics 25, 3049-3055.
Almaas, E. (2007). Biological impacts and context of network theory. J. Exp. Biol. 210,
1548-1558.
Ando, Y., Maida, Y., Morinaga, A., Burroughs, A.M., Kimura, R., Chiba, J., Suzuki, H.,
Masutomi, K., and Hayashizaki, Y. (2011). Two-step cleavage of hairpin RNA with 5'
overhangs by human DICER BMC Mol. Biol. 12, 6.
Asslaber, D., Pinon, J.D., Seyfried, I., Desch, P., Stocher, M., Tinhofer, I., Egle, A.,
Merkel, O., and Greil, R. (2010). microRNA-34a expression correlates with MDM2
SNP309 polymorphism and treatment-free survival in chronic lymphocytic leukemia
Blood 115, 4191-4197.
Axtell, M.J., Westholm, J.O., and Lai, E.C. (2011). Vive la difference: biogenesis and
evolution of microRNAs in plants and animals. Genome Biol. 12, 221.
Baek, D., Villen, J., Shin, C., Camargo, F.D., Gygi, S.P., and Bartel, D.P. (2008). The
impact of microRNAs on protein output Nature 455, 64-71.
Bagga, S., Bracht, J., Hunter, S., Massirer, K., Holtz, J., Eachus, R., and Pasquinelli, A.E.
(2005). Regulation by let-7 and lin-4 miRNAs results in target mRNA degradation Cell
122, 553-563.
Barabasi, A.L., and Albert, R. (1999). Emergence of scaling in random networks. Science
286, 509-512.
Bashir, T., and Pagano, M. (2003). Aberrant ubiquitin-mediated proteolysis of cell cycle
regulatory proteins and oncogenesis Adv. Cancer Res. 88, 101-144.

114
Basso, K., Margolin, A.A., Stolovitzky, G., Klein, U., Dalla-Favera, R., and Califano, A.
(2005a). Reverse engineering of regulatory networks in human B cells Nat. Genet. 37,
382-390.
Basso, K., Margolin, A.A., Stolovitzky, G., Klein, U., Dalla-Favera, R., and Califano, A.
(2005b). Reverse engineering of regulatory networks in human B cells. Nat. Genet. 37,
382-390.
Berezikov, E., Robine, N., Samsonova, A., Westholm, J.O., Naqvi, A., Hung, J.H.,
Okamura, K., Dai, Q., Bortolamiol-Becet, D., Martin, R., et al. (2011a). Deep annotation
of Drosophila melanogaster microRNAs yields insights into their processing,
modification, and emergence Genome Res. 21, 203-215.
Berezikov, E., Robine, N., Samsonova, A., Westholm, J.O., Naqvi, A., Hung, J.H.,
Okamura, K., Dai, Q., Bortolamiol-Becet, D., Martin, R., et al. (2011b). Deep annotation
of Drosophila melanogaster microRNAs yields insights into their processing,
modification, and emergence Genome Res. 21, 203-215.
Betel, D., Koppal, A., Agius, P., Sander, C., and Leslie, C. (2010). Comprehensive
modeling of microRNA targets predicts functional non-conserved and non-canonical sites
Genome Biol. 11, R90.
Bhaumik, D., Scott, G.K., Schokrpur, S., Patil, C.K., Campisi, J., and Benz, C.C. (2008).
Expression of microRNA-146 suppresses NF-kappaB activity with reduction of
metastatic potential in breast cancer cells. Oncogene 27, 5643-5647.
Biasiolo, M., Forcato, M., Possamai, L., Ferrari, F., Agnelli, L., Lionetti, M., Todoerti,
K., Neri, A., Marchiori, M., Bortoluzzi, S., and Bicciato, S. (2010). Critical analysis of
transcriptional and post-transcriptional regulatory networks in multiple myeloma. Pac.
Symp. Biocomput. 397-408.
Biasiolo, M., Sales, G., Lionetti, M., Agnelli, L., Todoerti, K., Bisognin, A., Coppe, A.,
Romualdi, C., Neri, A., and Bortoluzzi, S. (2011). Impact of Host Genes and Strand
Selection on miRNA and miRNA* Expression PLoS One 6, e23854.
Bortoluzzi, S., Biasiolo, M., and Bisognin, A. (2011). microRNA-offset RNAs
(moRNAs): by-product spectators or functional players? Trends in Molecular Medicine
Bortoluzzi, S., Bisognin, A., Biasolo, M., Guglielmelli, P., Biamonte, F., Norfo, R.,
Manfredini, R., and Vannucchi, A.M. (2012). Characterisation and discovery of novel
miRNAs and moRNAs in JAK2V617F mutated SET2 cells Blood
Brito, J.L., Walker, B., Jenner, M., Dickens, N.J., Brown, N.J., Ross, F.M., Avramidou,
A., Irving, J.A., Gonzalez, D., Davies, F.E., and Morgan, G.J. (2009). MMSET

115
deregulation affects cell cycle progression and adhesion regulons in t(4;14) myeloma
plasma cells. Haematologica 94, 78-86.
Brosnan, C.A., and Voinnet, O. (2009). The long and the short of noncoding RNAs Curr.
Opin. Cell Biol. 21, 416-425.
Bruchova, H., Merkerova, M., and Prchal, J.T. (2008). Aberrant expression of microRNA
in polycythemia vera Haematologica 93, 1009-1016.
Bruchova, H., Yoon, D., Agarwal, A.M., Mendell, J., and Prchal, J.T. (2007). Regulated
expression of microRNAs in normal and polycythemia vera erythropoiesis Exp. Hematol.
35, 1657-1667.
Burroughs, A.M., Ando, Y., de Hoon, M.J., Tomaru, Y., Suzuki, H., Hayashizaki, Y., and
Daub, C.O. (2011). Deep-sequencing of human Argonaute-associated small RNAs
provides insight into miRNA sorting and reveals Argonaute association with RNA
fragments of diverse origin RNA Biol. 8, 158-177.
Butte, A.J., and Kohane, I.S. (2000). Mutual information relevance networks: functional
genomic clustering using pairwise entropy measurements Pac. Symp. Biocomput. 418-
429.
Cai, Y., Yu, X., Hu, S., and Yu, J. (2009). A Brief Review on the Mechanisms of miRNA
Regulation Genomics, Proteomics & Bioinformatics 7, 147 <last_page> 154.
Calin, G.A., and Croce, C.M. (2009). Chronic lymphocytic leukemia: interplay between
noncoding RNAs and protein-coding genes Blood 114, 4761-4770.
Cameron, J.E., Fewell, C., Yin, Q., McBride, J., Wang, X., Lin, Z., and Flemington, E.K.
(2008a). Epstein-Barr virus growth/latency III program alters cellular microRNA
expression Virology 382, 257-266.
Cameron, J.E., Fewell, C., Yin, Q., McBride, J., Wang, X., Lin, Z., and Flemington, E.K.
(2008b). Epstein-Barr virus growth/latency III program alters cellular microRNA
expression Virology 382, 257-266.
Chang, K.H., Miller, N., Kheirelseid, E.A., Ingoldsby, H., Hennessy, E., Curran, C.E.,
Curran, S., Smith, M.J., Regan, M., McAnena, O.J., and Kerin, M.J. (2011a). MicroRNA-
21 and PDCD4 expression in colorectal cancer. Eur. J. Surg. Oncol. 37, 597-603.
Chang, K.H., Miller, N., Kheirelseid, E.A., Lemetre, C., Ball, G.R., Smith, M.J., Regan,
M., McAnena, O.J., and Kerin, M.J. (2011b). MicroRNA signature analysis in colorectal
cancer: identification of expression profiles in stage II tumors associated with aggressive
disease. Int. J. Colorectal Dis. 26, 1415-1422.

116
Cheng, C., Yan, K.K., Hwang, W., Qian, J., Bhardwaj, N., Rozowsky, J., Lu, Z.J., Niu,
W., Alves, P., Kato, M., Snyder, M., and Gerstein, M. (2011). Construction and analysis
of an integrated regulatory network derived from high-throughput sequencing data PLoS
Comput. Biol. 7, e1002190.
Chien, Y., and White, M.A. (2003). RAL GTPases are linchpin modulators of human
tumour-cell proliferation and survival EMBO Rep. 4, 800-806.
Chiusaroli, R., Knobler, H., Luxenburg, C., Sanjay, A., Granot-Attas, S., Tiran, Z.,
Miyazaki, T., Harmelin, A., Baron, R., and Elson, A. (2004). Tyrosine phosphatase
epsilon is a positive regulator of osteoclast function in vitro and in vivo. Mol. Biol. Cell
15, 234-244.
Chng, W.J., Kumar, S., Vanwier, S., Ahmann, G., Price-Troska, T., Henderson, K.,
Chung, T.H., Kim, S., Mulligan, G., Bryant, B., et al. (2007). Molecular dissection of
hyperdiploid multiple myeloma by gene expression profiling Cancer Res. 67, 2982-2989.
Cobb, B.S., Hertweck, A., Smith, J., O'Connor, E., Graf, D., Cook, T., Smale, S.T.,
Sakaguchi, S., Livesey, F.J., Fisher, A.G., and Merkenschlager, M. (2006). A role for
Dicer in immune regulation J. Exp. Med. 203, 2519-2527.
Colla, S., Tagliaferri, S., Morandi, F., Lunghi, P., Donofrio, G., Martorana, D., Mancini,
C., Lazzaretti, M., Mazzera, L., Ravanetti, L., et al. (2007). The new tumor-suppressor
gene inhibitor of growth family member 4 (ING4) regulates the production of
proangiogenic molecules by myeloma cells and suppresses hypoxia-inducible factor-1
alpha (HIF-1alpha) activity: involvement in myeloma-induced angiogenesis. Blood 110,
4464-4475.
Corcoran, D.L., Pandit, K.V., Gordon, B., Bhattacharjee, A., Kaminski, N., and Benos,
P.V. (2009). Features of mammalian microRNA promoters emerge from polymerase II
chromatin immunoprecipitation data PLoS One 4, e5279.
Crucitti, P., Latora, V., and Marchiori, M. (2004). Model for cascading failures in
complex networks. Phys. Rev. E. Stat. Nonlin Soft Matter Phys. 69, 045104.
Crucitti, P., Latora, V., Marchiori, M., and Rapisarda, A. (2003). Efficiency of scale-free
networks: error and attack tolerance. Physica A 320, 622-642.
Curtale, G., Citarella, F., Carissimi, C., Goldoni, M., Carucci, N., Fulci, V., Franceschini,
D., Meloni, F., Barnaba, V., and Macino, G. (2010). An emerging player in the adaptive
immune response: microRNA-146a is a modulator of IL-2 expression and activation-
induced cell death in T lymphocytes Blood 115, 265-273.

117
De Smet, R., and Marchal, K. (2010). Advantages and limitations of current network
inference methods Nat. Rev. Microbiol. 8, 717-729.
Didiano, D., and Hobert, O. (2008). Molecular architecture of a miRNA-regulated 3'
UTR. RNA 14, 1297-1317.
Dorogovt͡ sev, S.N., and Mendes, J.F.F. (2003). Evolution of networks: from biological
nets to the Internet and WWW (Oxford: Oxford University Press).
Dutta, K.K., Zhong, Y., Liu, Y.T., Yamada, T., Akatsuka, S., Hu, Q., Yoshihara, M.,
Ohara, H., Takehashi, M., Shinohara, T., et al. (2007). Association of microRNA-34a
overexpression with proliferation is cell type-dependent Cancer. Sci. 98, 1845-1852.
Eisen, M.B., Spellman, P.T., Brown, P.O., and Botstein, D. (1998). Cluster analysis and
display of genome-wide expression patterns. Proc. Natl. Acad. Sci. U. S. A. 95, 14863-
14868.
Emmert-Streib, F., and Dehmer, M. (2009). Information processing in the transcriptional
regulatory network of yeast: functional robustness. BMC Syst. Biol. 3, 35.
Enright, A.J., John, B., Gaul, U., Tuschl, T., Sander, C., and Marks, D.S. (2003a).
MicroRNA targets in Drosophila. Genome Biol. 5, R1.
Enright, A.J., John, B., Gaul, U., Tuschl, T., Sander, C., and Marks, D.S. (2003b).
MicroRNA targets in Drosophila Genome Biol. 5, R1.
Erson, A.E., and Petty, E.M. (2008). MicroRNAs in development and disease Clin.
Genet. 74, 296-306.
Esquela-Kerscher, A., and Slack, F.J. (2006). Oncomirs - microRNAs with a role in
cancer Nat. Rev. Cancer. 6, 259-269.
Faith, J.J., Hayete, B., Thaden, J.T., Mogno, I., Wierzbowski, J., Cottarel, G., Kasif, S.,
Collins, J.J., and Gardner, T.S. (2007). Large-scale mapping and validation of
Escherichia coli transcriptional regulation from a compendium of expression profiles
PLoS Biol. 5, e8.
Fasold, M., Langenberger, D., Binder, H., Stadler, P.F., and Hoffmann, S. (2011).
DARIO: a ncRNA detection and analysis tool for next-generation sequencing
experiments Nucleic Acids Res. 39, W112-7.
Fernandez-Valverde, S.L., Taft, R.J., and Mattick, J.S. (2010). Dynamic isomiR
regulation in Drosophila development RNA 16, 1881-1888.

118
Ferrari, F., Bortoluzzi, S., Coppe, A., Sirota, A., Safran, M., Shmoish, M., Ferrari, S.,
Lancet, D., Danieli, G.A., and Bicciato, S. (2007). Novel definition files for human
GeneChips based on GeneAnnot BMC Bioinformatics 8, 446.
Filipowicz, W., and Grosshans, H. (2011). The liver-specific microRNA miR-122:
biology and therapeutic potential Prog. Drug Res. 67, 221-238.
Fracchiolla, N.S., Colombo, G., Finelli, P., Maiolo, A.T., and Neri, A. (1998). EHT, a
new member of the MTG8/ETO gene family, maps on 20q11 region and is deleted in
acute myeloid leukemias. Blood 92, 3481-3484.
Friedman, R.C., Farh, K.K., Burge, C.B., and Bartel, D.P. (2009). Most mammalian
mRNAs are conserved targets of microRNAs Genome Res. 19, 92-105.
Fulci, V., Colombo, T., Chiaretti, S., Messina, M., Citarella, F., Tavolaro, S., Guarini, A.,
Foa, R., and Macino, G. (2009). Characterization of B- and T-lineage acute lymphoblastic
leukemia by integrated analysis of MicroRNA and mRNA expression profiles. Genes
Chromosomes Cancer 48, 1069-1082.
Garzon, R., Pichiorri, F., Palumbo, T., Visentini, M., Aqeilan, R., Cimmino, A., Wang,
H., Sun, H., Volinia, S., Alder, H., et al. (2007). MicroRNA gene expression during
retinoic acid-induced differentiation of human acute promyelocytic leukemia Oncogene
26, 4148-4157.
Gennarino, V.A., Sardiello, M., Avellino, R., Meola, N., Maselli, V., Anand, S., Cutillo,
L., Ballabio, A., and Banfi, S. (2009). MicroRNA target prediction by expression analysis
of host genes. Genome Res. 19, 481-490.
Golan, D., Levy, C., Friedman, B., and Shomron, N. (2010). Biased hosting of intronic
microRNA genes. Bioinformatics 26, 992-995.
Goncalves, D.U., Proietti, F.A., Ribas, J.G., Araujo, M.G., Pinheiro, S.R., Guedes, A.C.,
and Carneiro-Proietti, A.B. (2010). Epidemiology, treatment, and prevention of human T-
cell leukemia virus type 1-associated diseases Clin. Microbiol. Rev. 23, 577-589.
Grimson, A., Farh, K.K., Johnston, W.K., Garrett-Engele, P., Lim, L.P., and Bartel, D.P.
(2007a). MicroRNA targeting specificity in mammals: determinants beyond seed pairing
Mol. Cell 27, 91-105.
Grimson, A., Farh, K.K., Johnston, W.K., Garrett-Engele, P., Lim, L.P., and Bartel, D.P.
(2007b). MicroRNA targeting specificity in mammals: determinants beyond seed pairing.
Mol. Cell 27, 91-105.

119
Guan, D.G., Liao, J.Y., Qu, Z.H., Zhang, Y., and Qu, L.H. (2011). mirExplorer:
Detecting microRNAs from genome and next generation sequencing data using the
AdaBoost method with transition probability matrix and combined features. RNA Biol. 8,
Guglielmelli, P., Tozzi, L., Bogani, C., Iacobucci, I., Ponziani, V., Martinelli, G., Bosi,
A., Vannucchi, A.M., and AGIMM (AIRC-Gruppo Italiano Malattie Mieloproliferative)
Investigators. (2011). Overexpression of microRNA-16-2 contributes to the abnormal
erythropoiesis in polycythemia vera Blood 117, 6923-6927.
Guglielmelli, P., Tozzi, L., Pancrazzi, A., Bogani, C., Antonioli, E., Ponziani, V., Poli,
G., Zini, R., Ferrari, S., Manfredini, R., et al. (2007). MicroRNA expression profile in
granulocytes from primary myelofibrosis patients Exp. Hematol. 35, 1708-1718.
Guo, L., Liang, T., and Lu, Z. (2011). A comprehensive study of multiple mapping and
feature selection for correction strategy in the analysis of small RNAs from SOLiD
sequencing BioSystems 104, 87-93.
Hackenberg, M., Sturm, M., Langenberger, D., Falcon-Perez, J.M., and Aransay, A.M.
(2009). miRanalyzer: a microRNA detection and analysis tool for next-generation
sequencing experiments Nucleic Acids Res. 37, W68-76.
Hahne, J.C., Kummer, S., Heukamp, L.C., Fuchs, T., Gun, M., Langer, B., Von Ruecker,
A., and Wernert, N. (2009). Regulation of protein tyrosine kinases in tumour cells by the
transcription factor Ets-1 Int. J. Oncol. 35, 989-996.
Hecker, M., Lambeck, S., Toepfer, S., van Someren, E., and Guthke, R. (2009). Gene
regulatory network inference: data integration in dynamic models-a review BioSystems
96, 86-103.
Hermeking, H. (2010). The miR-34 family in cancer and apoptosis Cell Death Differ. 17,
193-199.
Holme, P., Kim, B.J., Yoon, C.N., and Han, S.K. (2002). Attack vulnerability of complex
networks Phys. Rev. E. Stat. Nonlin Soft Matter Phys. 65, 056109.
Hrstka, R., Coates, P.J., and Vojtesek, B. (2009). Polymorphisms in p53 and the p53
pathway: roles in cancer susceptibility and response to treatment J. Cell. Mol. Med. 13,
440-453.
Hu, Z., Shu, Y., Chen, Y., Chen, J., Dong, J., Liu, Y., Pan, S., Xu, L., Xu, J., Wang, Y., et
al. (2010). Genetic Polymorphisms in the pre-MicroRNA Flanking Region and Non-
Small-Cell Lung Cancer Survival Am. J. Respir. Crit. Care Med.
120
Huang da, W., Sherman, B.T., and Lempicki, R.A. (2009). Systematic and integrative
analysis of large gene lists using DAVID bioinformatics resources Nat. Protoc. 4, 44-57.
Huang, J., Wang, F., Argyris, E., Chen, K., Liang, Z., Tian, H., Huang, W., Squires, K.,
Verlinghieri, G., and Zhang, H. (2007a). Cellular microRNAs contribute to HIV-1 latency
in resting primary CD4+ T lymphocytes Nat. Med. 13, 1241-1247.
Huang, J.C., Babak, T., Corson, T.W., Chua, G., Khan, S., Gallie, B.L., Hughes, T.R.,
Blencowe, B.J., Frey, B.J., and Morris, Q.D. (2007b). Using expression profiling data to
identify human microRNA targets Nat. Methods 4, 1045-1049.
Huang, J.C., Morris, Q.D., and Frey, B.J. (2007c). Bayesian inference of MicroRNA
targets from sequence and expression data J. Comput. Biol. 14, 550-563.
Huang, X., Le, Q.T., and Giaccia, A.J. (2010). MiR-210--micromanager of the hypoxia
pathway Trends Mol. Med. 16, 230-237.
Hurst, D.R., Edmonds, M.D., Scott, G.K., Benz, C.C., Vaidya, K.S., and Welch, D.R.
(2009). Breast cancer metastasis suppressor 1 up-regulates miR-146, which suppresses
breast cancer metastasis. Cancer Res. 69, 1279-1283.
Inoue, K., Mallakin, A., and Frazier, D.P. (2007). Dmp1 and tumor suppression.
Oncogene 26, 4329-4335.
Iturria-Medina, Y., Sotero, R.C., Canales-Rodriguez, E.J., Aleman-Gomez, Y., and
Melie-Garcia, L. (2008). Studying the human brain anatomical network via diffusion-
weighted MRI and Graph Theory. Neuroimage 40, 1064-1076.
Jazdzewski, K., Liyanarachchi, S., Swierniak, M., Pachucki, J., Ringel, M.D., Jarzab, B.,
and de la Chapelle, A. (2009). Polymorphic mature microRNAs from passenger strand of
pre-miR-146a contribute to thyroid cancer Proc. Natl. Acad. Sci. U. S. A. 106, 1502-
1505.
Jeffries, C.D., Fried, H.M., and Perkins, D.O. (2010). Additional layers of gene
regulatory complexity from recently discovered microRNA mechanisms Int. J. Biochem.
Cell Biol. 42, 1236-1242.
Jeong, H., Mason, S.P., Barabasi, A.L., and Oltvai, Z.N. (2001). Lethality and centrality
in protein networks Nature 411, 41-42.
Jeong, H., Tombor, B., Albert, R., Oltvai, Z.N., and Barabasi, A.L. (2000). The large-
scale organization of metabolic networks Nature 407, 651-654.

121
Jiang, Q., Wang, Y., Hao, Y., Juan, L., Teng, M., Zhang, X., Li, M., Wang, G., and Liu,
Y. (2009). miR2Disease: a manually curated database for microRNA deregulation in
human disease Nucleic Acids Res. 37, D98-104.
Jin, W., Grant, J.R., Stothard, P., Moore, S.S., and Guan, L.L. (2009). Characterization of
bovine miRNAs by sequencing and bioinformatics analysis. BMC Mol. Biol. 10, 90.
John, B., Enright, A.J., Aravin, A., Tuschl, T., Sander, C., and Marks, D.S. (2004).
Human MicroRNA targets PLoS Biol. 2, e363.
Jongen-Lavrencic, M., Sun, S.M., Dijkstra, M.K., Valk, P.J., and Lowenberg, B. (2008).
MicroRNA expression profiling in relation to the genetic heterogeneity of acute myeloid
leukemia Blood 111, 5078-5085.
Kang, H.S., Lee, B.S., Yang, Y., Park, C.W., Ha, H.J., Pyun, K.H., and Choi, I. (1996).
Roles of protein phosphatase 1 and 2A in an IL-6-mediated autocrine growth loop of
human myeloma cells. Cell. Immunol. 168, 174-183.
Kaplan, M.H. (2005). STAT4: a critical regulator of inflammation in vivo Immunol. Res.
31, 231-242.
Kertesz, M., Iovino, N., Unnerstall, U., Gaul, U., and Segal, E. (2007). The role of site
accessibility in microRNA target recognition Nat. Genet. 39, 1278-1284.
Kim, S. (2005a). HuntING4 new tumor suppressors. Cell. Cycle 4, 516-517.
Kim, V.N. (2005b). MicroRNA biogenesis: coordinated cropping and dicing. Nat. Rev.
Mol. Cell Biol. 6, 376-385.
Kim, V.N., Han, J., and Siomi, M.C. (2009). Biogenesis of small RNAs in animals Nat.
Rev. Mol. Cell Biol. 10, 126-139.
Kozomara, A., and Griffiths-Jones, S. (2011). miRBase: integrating microRNA
annotation and deep-sequencing data Nucleic Acids Res. 39, D152-7.
Kraskov, A., Stogbauer, H., and Grassberger, P. (2004). Estimating mutual information
Phys. Rev. E. Stat. Nonlin Soft Matter Phys. 69, 066138.
Kuchenbauer, F., Mah, S.M., Heuser, M., McPherson, A., Ruschmann, J., Rouhi, A.,
Berg, T., Bullinger, L., Argiropoulos, B., Morin, R.D., et al. (2011). Comprehensive
analysis of mammalian miRNA* species and their role in myeloid cells Blood 118, 3350-
3358.

122
Kuhn, D.E., Martin, M.M., Feldman, D.S., Terry, A.V.,Jr, Nuovo, G.J., and Elton, T.S.
(2008). Experimental validation of miRNA targets. Methods 44, 47-54.
Langenberger, D., Bermudez-Santana, C., Hertel, J., Hoffmann, S., Khaitovich, P., and
Stadler, P.F. (2009). Evidence for human microRNA-offset RNAs in small RNA
sequencing data Bioinformatics 25, 2298-2301.
Lankat-Buttgereit, B., and Goke, R. (2009). The tumour suppressor Pdcd4: recent
advances in the elucidation of function and regulation. Biol. Cell. 101, 309-317.
Latora, V., and Marchiori, M. (2005). Vulnerability and protection of infrastructure
networks. Phys. Rev. E. Stat. Nonlin Soft Matter Phys. 71, 015103.
Latora, V., and Marchiori, M. (2001). Efficient behavior of small-world networks Phys.
Rev. Lett. 87, 198701.
Lee, R.C., Feinbaum, R.L., and Ambros, V. (1993). The C. elegans heterochronic gene
lin-4 encodes small RNAs with antisense complementarity to lin-14 Cell 75, 843-854.
Lewis, B.P., Burge, C.B., and Bartel, D.P. (2005). Conserved seed pairing, often flanked
by adenosines, indicates that thousands of human genes are microRNA targets Cell 120,
15-20.
Lewis, B.P., Shih, I.H., Jones-Rhoades, M.W., Bartel, D.P., and Burge, C.B. (2003).
Prediction of mammalian microRNA targets Cell 115, 787-798.
Lhakhang, T.W., and Chaudhry, M.A. (2011). Current approaches to micro-RNA analysis
and target gene prediction. J. Appl. Genet.
Li, F., Long, T., Lu, Y., Ouyang, Q., and Tang, C. (2004). The yeast cell-cycle network is
robustly designed. Proc. Natl. Acad. Sci. U. S. A. 101, 4781-4786.
Li, L., Chen, X.P., and Li, Y.J. (2010). MicroRNA-146a and human disease Scand. J.
Immunol. 71, 227-231.
Li, M., Marin-Muller, C., Bharadwaj, U., Chow, K.H., Yao, Q., and Chen, C. (2009).
MicroRNAs: control and loss of control in human physiology and disease World J. Surg.
33, 667-684.
Liang, S., Fuhrman, S., and Somogyi, R. (1998). Reveal, a general reverse engineering
algorithm for inference of genetic network architectures Pac. Symp. Biocomput. 18-29.

123
Lim, L.P., Lau, N.C., Garrett-Engele, P., Grimson, A., Schelter, J.M., Castle, J., Bartel,
D.P., Linsley, P.S., and Johnson, J.M. (2005). Microarray analysis shows that some
microRNAs downregulate large numbers of target mRNAs Nature 433, 769-773.
Lim, L.P., Lau, N.C., Weinstein, E.G., Abdelhakim, A., Yekta, S., Rhoades, M.W.,
Burge, C.B., and Bartel, D.P. (2003). The microRNAs of Caenorhabditis elegans Genes
Dev. 17, 991-1008.
Lindberg, S.R., Olsson, A., Persson, A.M., and Olsson, I. (2005). The Leukemia-
associated ETO homologues are differently expressed during hematopoietic
differentiation. Exp. Hematol. 33, 189-198.
Lionetti, M., Biasiolo, M., Agnelli, L., Todoerti, K., Mosca, L., Fabris, S., Sales, G.,
Deliliers, G.L., Bicciato, S., Lombardi, L., Bortoluzzi, S., and Neri, A. (2009).
Identification of microRNA expression patterns and definition of a microRNA/mRNA
regulatory network in distinct molecular groups of multiple myeloma. Blood 114, e20-6.
Lotterman, C.D., Kent, O.A., and Mendell, J.T. (2008). Functional integration of
microRNAs into oncogenic and tumor suppressor pathways Cell. Cycle 7, 2493-2499.
Lu, J., Getz, G., Miska, E.A., Alvarez-Saavedra, E., Lamb, J., Peck, D., Sweet-Cordero,
A., Ebert, B.L., Mak, R.H., Ferrando, A.A., et al. (2005). MicroRNA expression profiles
classify human cancers Nature 435, 834-838.
Luo, W., Friedman, M.S., Shedden, K., Hankenson, K.D., and Woolf, P.J. (2009). GAGE:
generally applicable gene set enrichment for pathway analysis BMC Bioinformatics 10,
161.
Maglott, D., Ostell, J., Pruitt, K.D., and Tatusova, T. (2005). Entrez Gene: gene-centered
information at NCBI Nucleic Acids Res. 33, D54-8.
Martello, G., Rosato, A., Ferrari, F., Manfrin, A., Cordenonsi, M., Dupont, S., Enzo, E.,
Guzzardo, V., Rondina, M., Spruce, T., et al. (2010). A MicroRNA targeting dicer for
metastasis control Cell 141, 1195-1207.
Maslov, S., and Sneppen, K. (2002). Specificity and stability in topology of protein
networks Science 296, 910-913.
Mayr, C., and Bartel, D.P. (2009). Widespread shortening of 3'UTRs by alternative
cleavage and polyadenylation activates oncogenes in cancer cells Cell 138, 673-684.
Medina, P.P., and Slack, F.J. (2008). microRNAs and cancer: an overview Cell. Cycle 7,
2485-2492.

124
Meiri, E., Levy, A., Benjamin, H., Ben-David, M., Cohen, L., Dov, A., Dromi, N.,
Elyakim, E., Yerushalmi, N., Zion, O., Lithwick-Yanai, G., and Sitbon, E. (2010).
Discovery of microRNAs and other small RNAs in solid tumors Nucleic Acids Res. 38,
6234-6246.
Merkerova, M., Belickova, M., and Bruchova, H. (2008). Differential expression of
microRNAs in hematopoietic cell lineages Eur. J. Haematol. 81, 304-310.
Mi, S., Lu, J., Sun, M., Li, Z., Zhang, H., Neilly, M.B., Wang, Y., Qian, Z., Jin, J., Zhang,
Y., et al. (2007). MicroRNA expression signatures accurately discriminate acute
lymphoblastic leukemia from acute myeloid leukemia Proc. Natl. Acad. Sci. U. S. A. 104,
19971-19976.
Mikula, M., Rubel, T., Karczmarski, J., Goryca, K., Dadlez, M., and Ostrowski, J. (2010).
Integrating proteomic and transcriptomic high-throughput surveys for search of new
biomarkers of colon tumors. Funct. Integr. Genomics
Milo, R., Shen-Orr, S., Itzkovitz, S., Kashtan, N., Chklovskii, D., and Alon, U. (2002).
Network motifs: simple building blocks of complex networks Science 298, 824-827.
Mitsuhashi, S., Shima, H., Tanuma, N., Sasa, S., Onoe, K., Ubukata, M., and Kikuchi, K.
(2005). Protein phosphatase type 2A, PP2A, is involved in degradation of gp130. Mol.
Cell. Biochem. 269, 183-187.
Mizuguchi, Y., Mishima, T., Yokomuro, S., Arima, Y., Kawahigashi, Y., Shigehara, K.,
Kanda, T., Yoshida, H., Uchida, E., Tajiri, T., and Takizawa, T. (2011). Sequencing and
bioinformatics-based analyses of the microRNA transcriptome in hepatitis B-related
hepatocellular carcinoma PLoS One 6, e15304.
Moreau, Y., Aerts, S., De Moor, B., De Strooper, B., and Dabrowski, M. (2003).
Comparison and meta-analysis of microarray data: from the bench to the computer desk
Trends Genet. 19, 570-577.
Motter, A.E., and Lai, Y.C. (2002). Cascade-based attacks on complex networks. Phys.
Rev. E. Stat. Nonlin Soft Matter Phys. 66, 065102.
Mraz, M., Pospisilova, S., Malinova, K., Slapak, I., and Mayer, J. (2009). MicroRNAs in
chronic lymphocytic leukemia pathogenesis and disease subtypes Leuk. Lymphoma 50,
506-509.
Mrazek, J., Kreutmayer, S.B., Grasser, F.A., Polacek, N., and Huttenhofer, A. (2007).
Subtractive hybridization identifies novel differentially expressed ncRNA species in
EBV-infected human B cells Nucleic Acids Res. 35, e73.

125
Nakayama, J., Yamamoto, M., Hayashi, K., Satoh, H., Bundo, K., Kubo, M., Goitsuka,
R., Farrar, M.A., and Kitamura, D. (2009). BLNK suppresses pre-B-cell leukemogenesis
through inhibition of JAK3 Blood 113, 1483-1492.
Navon, R., Wang, H., Steinfeld, I., Tsalenko, A., Ben-Dor, A., and Yakhini, Z. (2009).
Novel rank-based statistical methods reveal microRNAs with differential expression in
multiple cancer types. PLoS One 4, e8003.
Negrini, M., Nicoloso, M.S., and Calin, G.A. (2009). MicroRNAs and cancer--new
paradigms in molecular oncology. Curr. Opin. Cell Biol. 21, 470-479.
Nunez-Iglesias, J., Liu, C.C., Morgan, T.E., Finch, C.E., and Zhou, X.J. (2010). Joint
genome-wide profiling of miRNA and mRNA expression in Alzheimer's disease cortex
reveals altered miRNA regulation PLoS One 5, e8898.
Oberg, A.L., French, A.J., Sarver, A.L., Subramanian, S., Morlan, B.W., Riska, S.M.,
Borralho, P.M., Cunningham, J.M., Boardman, L.A., Wang, L., et al. (2011). miRNA
expression in colon polyps provides evidence for a multihit model of colon cancer PLoS
One 6, e20465.
Olena, A.F., and Patton, J.G. (2010). Genomic organization of microRNAs J. Cell.
Physiol. 222, 540-545.
Olive, V., Jiang, I., and He, L. (2010). mir-17-92, a cluster of miRNAs in the midst of the
cancer network. Int. J. Biochem. Cell Biol. 42, 1348-1354.
Papadopoulos, G.L., Alexiou, P., Maragkakis, M., Reczko, M., and Hatzigeorgiou, A.G.
(2009a). DIANA-mirPath: Integrating human and mouse microRNAs in pathways
Bioinformatics 25, 1991-1993.
Papadopoulos, G.L., Reczko, M., Simossis, V.A., Sethupathy, P., and Hatzigeorgiou,
A.G. (2009b). The database of experimentally supported targets: a functional update of
TarBase Nucleic Acids Res. 37, D155-8.
Parkinson, H., Kapushesky, M., Kolesnikov, N., Rustici, G., Shojatalab, M.,
Abeygunawardena, N., Berube, H., Dylag, M., Emam, I., Farne, A., et al. (2009).
ArrayExpress update--from an archive of functional genomics experiments to the atlas of
gene expression Nucleic Acids Res. 37, D868-72.
Peifer, M., and Polakis, P. (2000). Wnt signaling in oncogenesis and embryogenesis--a
look outside the nucleus Science 287, 1606-1609.
126
Petrocca, F., Vecchione, A., and Croce, C.M. (2008). Emerging role of miR-106b-
25/miR-17-92 clusters in the control of transforming growth factor beta signaling Cancer
Res. 68, 8191-8194.
Pichler, K., Schneider, G., and Grassmann, R. (2008). MicroRNA miR-146a and further
oncogenesis-related cellular microRNAs are dysregulated in HTLV-1-transformed T
lymphocytes Retrovirology 5, 100.
Pise-Masison, C.A., Radonovich, M., Dohoney, K., Morris, J.C., O'Mahony, D., Lee,
M.J., Trepel, J., Waldmann, T.A., Janik, J.E., and Brady, J.N. (2009). Gene expression
profiling of ATL patients: compilation of disease-related genes and evidence for TCF4
involvement in BIRC5 gene expression and cell viability Blood 113, 4016-4026.
Plikus, M.V., Zhang, Z., and Chuong, C.M. (2006). PubFocus: semantic
MEDLINE/PubMed citations analytics through integration of controlled biomedical
dictionaries and ranking algorithm BMC Bioinformatics 7, 424.
Ponting, C.P., and Belgard, T.G. (2010). Transcribed dark matter: meaning or myth?
Hum. Mol. Genet. 19, R162-8.
Potapov, A.P., Goemann, B., and Wingender, E. (2008). The pairwise disconnectivity
index as a new metric for the topological analysis of regulatory networks. BMC
Bioinformatics 9, 227.
Pouyet, L., and Carrier, A. (2010). Mutant mouse models of oxidative stress. Transgenic
Res. 19, 155-164.
Qiang, Y.W., Endo, Y., Rubin, J.S., and Rudikoff, S. (2003). Wnt signaling in B-cell
neoplasia Oncogene 22, 1536-1545.
Rebholz-Schuhmann, D., Kirsch, H., Arregui, M., Gaudan, S., Riethoven, M., and Stoehr,
P. (2007). EBIMed--text crunching to gather facts for proteins from Medline
Bioinformatics 23, e237-44.
Ro, S., Park, C., Young, D., Sanders, K.M., and Yan, W. (2007). Tissue-dependent paired
expression of miRNAs Nucleic Acids Res. 35, 5944-5953.
Roccaro, A.M., Sacco, A., Chen, C., Runnels, J., Leleu, X., Azab, F., Azab, A.K., Jia, X.,
Ngo, H.T., Melhem, M.R., et al. (2009). microRNA expression in the biology, prognosis,
and therapy of Waldenstrom macroglobulinemia Blood 113, 4391-4402.
Saggioro, D., Silic-Benussi, M., Biasiotto, R., D'Agostino, D.M., and Ciminale, V.
(2009). Control of cell death pathways by HTLV-1 proteins Front. Biosci. 14, 3338-3351.

127
Sales, G., Coppe, A., Bisognin, A., Biasiolo, M., Bortoluzzi, S., and Romualdi, C. (2010).
MAGIA, a web-based tool for miRNA and Genes Integrated Analysis. Nucleic Acids
Res. 38 Suppl, W352-9.
Savkovic, V., Gaiser, S., Iovanna, J.L., and Bodeker, H. (2004). The stress response of
the exocrine pancreas. Dig. Dis. 22, 239-246.
Schmeier, S., Schaefer, U., Essack, M., and Bajic, V.B. (2011). Network analysis of
microRNAs and their regulation in human ovarian cancer BMC Syst. Biol. 5, 183.
Sempere, L.F., Sokol, N.S., Dubrovsky, E.B., Berger, E.M., and Ambros, V. (2003).
Temporal regulation of microRNA expression in Drosophila melanogaster mediated by
hormonal signals and broad-Complex gene activity Dev. Biol. 259, 9-18.
Sethupathy, P., Megraw, M., and Hatzigeorgiou, A.G. (2006). A guide through present
computational approaches for the identification of mammalian microRNA targets. Nat.
Methods 3, 881-886.
Sharan, R., and Ideker, T. (2006). Modeling cellular machinery through biological
network comparison Nat. Biotechnol. 24, 427-433.
Shi, W., Hendrix, D., Levine, M., and Haley, B. (2009). A distinct class of small RNAs
arises from pre-miRNA-proximal regions in a simple chordate Nat. Struct. Mol. Biol. 16,
183-189.
Shruti, K., Shrey, K., and Vibha, R. (2011). Micro RNAs: tiny sequences with enormous
potential. Biochem. Biophys. Res. Commun. 407, 445-449.
Smyth, G.K. (2004). Linear models and empirical bayes methods for assessing
differential expression in microarray experiments Stat. Appl. Genet. Mol. Biol. 3,
Article3.
Sokol, N.S., Xu, P., Jan, Y.N., and Ambros, V. (2008). Drosophila let-7 microRNA is
required for remodeling of the neuromusculature during metamorphosis Genes Dev. 22,
1591-1596.
Stella, J., Bavaresco, L., Braganhol, E., Rockenbach, L., Farias, P.F., Wink, M.R.,
Azambuja, A.A., Barrios, C.H., Morrone, F.B., and Oliveira Battastini, A.M. (2010).
Differential ectonucleotidase expression in human bladder cancer cell lines. Urol. Oncol.
28, 260-267.
Steuer, R., Kurths, J., Daub, C.O., Weise, J., and Selbig, J. (2002). The mutual
information: detecting and evaluating dependencies between variables Bioinformatics 18
Suppl 2, S231-40.
128
Strogatz, S.H. (2001). Exploring complex networks Nature 410, 268-276.
Taft, R.J., Simons, C., Nahkuri, S., Oey, H., Korbie, D.J., Mercer, T.R., Holst, J., Ritchie,
W., Wong, J.J., Rasko, J.E., et al. (2010). Nuclear-localized tiny RNAs are associated
with transcription initiation and splice sites in metazoans Nat. Struct. Mol. Biol. 17,
1030-1034.
Taganov, K.D., Boldin, M.P., Chang, K.J., and Baltimore, D. (2006). NF-kappaB-
dependent induction of microRNA miR-146, an inhibitor targeted to signaling proteins of
innate immune responses Proc. Natl. Acad. Sci. U. S. A. 103, 12481-12486.
Tanuma, N., Shima, H., Nakamura, K., and Kikuchi, K. (2001). Protein tyrosine
phosphatase epsilonC selectively inhibits interleukin-6- and interleukin- 10-induced JAK-
STAT signaling. Blood 98, 3030-3034.
Taylor, B.S., Schultz, N., Hieronymus, H., Gopalan, A., Xiao, Y., Carver, B.S., Arora,
V.K., Kaushik, P., Cerami, E., Reva, B., et al. (2010). Integrative genomic profiling of
human prostate cancer Cancer. Cell. 18, 11-22.
Tomita, M., Tanaka, Y., and Mori, N. (2009). MicroRNA miR-146a is induced by
HTLV-1 tax and increases the growth of HTLV-1-infected T-cells. Int. J. Cancer
Tusher, V.G., Tibshirani, R., and Chu, G. (2001). Significance analysis of microarrays
applied to the ionizing radiation response Proc. Natl. Acad. Sci. U. S. A. 98, 5116-5121.
Umbach, J.L., and Cullen, B.R. (2010). In-depth analysis of Kaposi's sarcoma-associated
herpesvirus microRNA expression provides insights into the mammalian microRNA-
processing machinery J. Virol. 84, 695-703.
Umbach, J.L., Strelow, L.I., Wong, S.W., and Cullen, B.R. (2010). Analysis of rhesus
rhadinovirus microRNAs expressed in virus-induced tumors from infected rhesus
macaques Virology 405, 592-599.
Vannucchi, A.M., Guglielmelli, P., Rambaldi, A., Bogani, C., and Barbui, T. (2009).
Epigenetic therapy in myeloproliferative neoplasms: evidence and perspectives J. Cell.
Mol. Med. 13, 1437-1450.
Vazquez, A., Dobrin, R., Sergi, D., Eckmann, J.P., Oltvai, Z.N., and Barabasi, A.L.
(2004). The topological relationship between the large-scale attributes and local
interaction patterns of complex networks Proc. Natl. Acad. Sci. U. S. A. 101, 17940-
17945.
Visone, R., and Croce, C.M. (2009). MiRNAs and cancer Am. J. Pathol. 174, 1131-1138.

129
Visone, R., Rassenti, L.Z., Veronese, A., Taccioli, C., Costinean, S., Aguda, B.D.,
Volinia, S., Ferracin, M., Palatini, J., Balatti, V., et al. (2009). Karyotype-specific
microRNA signature in chronic lymphocytic leukemia Blood 114, 3872-3879.
Volinia, S., Calin, G.A., Liu, C.G., Ambs, S., Cimmino, A., Petrocca, F., Visone, R.,
Iorio, M., Roldo, C., Ferracin, M., et al. (2006). A microRNA expression signature of
human solid tumors defines cancer gene targets Proc. Natl. Acad. Sci. U. S. A. 103, 2257-
2261.
Wagner, A., and Fell, D.A. (2001). The small world inside large metabolic networks
Proc. Biol. Sci. 268, 1803-1810.
Wang, G., Kwan, B.C., Lai, F.M., Chow, K.M., Li, P.K., and Szeto, C.C. (2011).
Elevated levels of miR-146a and miR-155 in kidney biopsy and urine from patients with
IgA nephropathy. Dis. Markers 30, 171-179.
Wang, X., Wang, H.K., McCoy, J.P., Banerjee, N.S., Rader, J.S., Broker, T.R., Meyers,
C., Chow, L.T., and Zheng, Z.M. (2009a). Oncogenic HPV infection interrupts the
expression of tumor-suppressive miR-34a through viral oncoprotein E6 RNA 15, 637-
647.
Wang, X., Ye, L., Hou, W., Zhou, Y., Wang, Y.J., Metzger, D.S., and Ho, W.Z. (2009b).
Cellular microRNA expression correlates with susceptibility of monocytes/macrophages
to HIV-1 infection Blood 113, 671-674.
Wang, Z. (2010). MicroRNA: A matter of life or death World J. Biol. Chem. 1, 41-54.
Wasserman S., F.K. (1994). Social Networks Analysis. Cambridge
Watford, W.T., Hissong, B.D., Bream, J.H., Kanno, Y., Muul, L., and O'Shea, J.J. (2004).
Signaling by IL-12 and IL-23 and the immunoregulatory roles of STAT4 Immunol. Rev.
202, 139-156.
Westholm, J.O., and Lai, E.C. (2011). Mirtrons: microRNA biogenesis via splicing.
Biochimie
Wightman, B., Ha, I., and Ruvkun, G. (1993). Posttranscriptional regulation of the
heterochronic gene lin-14 by lin-4 mediates temporal pattern formation in C. elegans Cell
75, 855-862.
Winter, J., Jung, S., Keller, S., Gregory, R.I., and Diederichs, S. (2009a). Many roads to
maturity: microRNA biogenesis pathways and their regulation. Nat. Cell Biol. 11, 228-
234.

130
Winter, J., Jung, S., Keller, S., Gregory, R.I., and Diederichs, S. (2009b). Many roads to
maturity: microRNA biogenesis pathways and their regulation Nat. Cell Biol. 11, 228-
234.
Witkos, T.M., Koscianska, E., and Krzyzosiak, W.J. (2011). Practical Aspects of
microRNA Target Prediction. Curr. Mol. Med. 11, 93-109.
Wu, L., and Belasco, J.G. (2008). Let me count the ways: mechanisms of gene regulation
by miRNAs and siRNAs Mol. Cell 29, 1-7.
Xia, H., Qi, Y., Ng, S.S., Chen, X., Li, D., Chen, S., Ge, R., Jiang, S., Li, G., Chen, Y., et
al. (2009). microRNA-146b inhibits glioma cell migration and invasion by targeting
MMPs. Brain Res. 1269, 158-165.
Xiao, F., Zuo, Z., Cai, G., Kang, S., Gao, X., and Li, T. (2009a). miRecords: an integrated
resource for microRNA-target interactions Nucleic Acids Res. 37, D105-10.
Xiao, F., Zuo, Z., Cai, G., Kang, S., Gao, X., and Li, T. (2009b). miRecords: an
integrated resource for microRNA-target interactions Nucleic Acids Res. 37, D105-10.
Xin, F., Li, M., Balch, C., Thomson, M., Fan, M., Liu, Y., Hammond, S.M., Kim, S., and
Nephew, K.P. (2009). Computational analysis of microRNA profiles and their target
genes suggests significant involvement in breast cancer antiestrogen resistance
Bioinformatics 25, 430-434.
Yamada, Y., and Kamihira, S. (2005). Inactivation of tumor suppressor genes and the
progression of adult T-cell leukemia-lymphoma Leuk. Lymphoma 46, 1553-1559.
Yamakuchi, M., and Lowenstein, C.J. (2009). MiR-34, SIRT1 and p53: the feedback loop
Cell. Cycle 8, 712-715.
Yeung, M.L., Yasunaga, J., Bennasser, Y., Dusetti, N., Harris, D., Ahmad, N., Matsuoka,
M., and Jeang, K.T. (2008). Roles for microRNAs, miR-93 and miR-130b, and tumor
protein 53-induced nuclear protein 1 tumor suppressor in cell growth dysregulation by
human T-cell lymphotrophic virus 1. Cancer Res. 68, 8976-8985.
Zhang, C. (2008). MicroRNomics: a newly emerging approach for disease biology
Physiol. Genomics 33, 139-147.
Zhao, H., Kalota, A., Jin, S., and Gewirtz, A.M. (2009). The c-myb proto-oncogene and
microRNA-15a comprise an active autoregulatory feedback loop in human hematopoietic
cells Blood 113, 505-516.

131
Zhao, J.L., Rao, D.S., Boldin, M.P., Taganov, K.D., O'Connell, R.M., and Baltimore, D.
(2011). NF-kappaB dysregulation in microRNA-146a-deficient mice drives the
development of myeloid malignancies Proc. Natl. Acad. Sci. U. S. A. 108, 9184-9189.

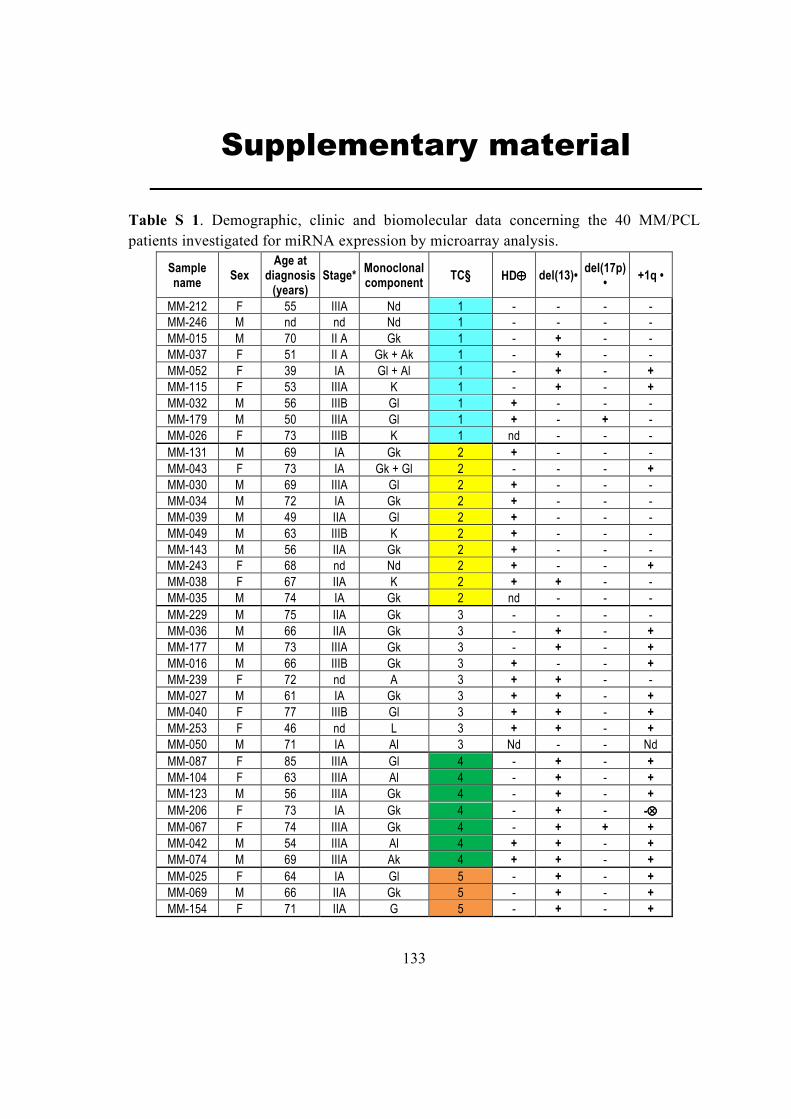
133
Supplementary material
Table S 1. Demographic, clinic and biomolecular data concerning the 40 MM/PCL
patients investigated for miRNA expression by microarray analysis.
Sample name
Sex Age at
diagnosis (years)
Stage* Monoclonal component
TC§ HD⊕⊕⊕⊕ del(13)• del(17p)
• +1q •
MM-212 F 55 IIIA Nd 1 - - - -
MM-246 M nd nd Nd 1 - - - -
MM-015 M 70 II A Gk 1 - + - -
MM-037 F 51 II A Gk + Ak 1 - + - -
MM-052 F 39 IA Gl + Al 1 - + - +
MM-115 F 53 IIIA K 1 - + - +
MM-032 M 56 IIIB Gl 1 + - - -
MM-179 M 50 IIIA Gl 1 + - + -
MM-026 F 73 IIIB K 1 nd - - -
MM-131 M 69 IA Gk 2 + - - -
MM-043 F 73 IA Gk + Gl 2 - - - +
MM-030 M 69 IIIA Gl 2 + - - -
MM-034 M 72 IA Gk 2 + - - -
MM-039 M 49 IIA Gl 2 + - - -
MM-049 M 63 IIIB K 2 + - - -
MM-143 M 56 IIA Gk 2 + - - -
MM-243 F 68 nd Nd 2 + - - +
MM-038 F 67 IIA K 2 + + - -
MM-035 M 74 IA Gk 2 nd - - -
MM-229 M 75 IIA Gk 3 - - - -
MM-036 M 66 IIA Gk 3 - + - +
MM-177 M 73 IIIA Gk 3 - + - +
MM-016 M 66 IIIB Gk 3 + - - +
MM-239 F 72 nd A 3 + + - -
MM-027 M 61 IA Gk 3 + + - +
MM-040 F 77 IIIB Gl 3 + + - +
MM-253 F 46 nd L 3 + + - +
MM-050 M 71 IA Al 3 Nd - - Nd
MM-087 F 85 IIIA Gl 4 - + - +
MM-104 F 63 IIIA Al 4 - + - +
MM-123 M 56 IIIA Gk 4 - + - +
MM-206 F 73 IA Gk 4 - + - -⊗⊗⊗⊗
MM-067 F 74 IIIA Gk 4 - + + +
MM-042 M 54 IIIA Al 4 + + - +
MM-074 M 69 IIIA Ak 4 + + - +
MM-025 F 64 IA Gl 5 - + - +
MM-069 M 66 IIA Gk 5 - + - +
MM-154 F 71 IIA G 5 - + - +
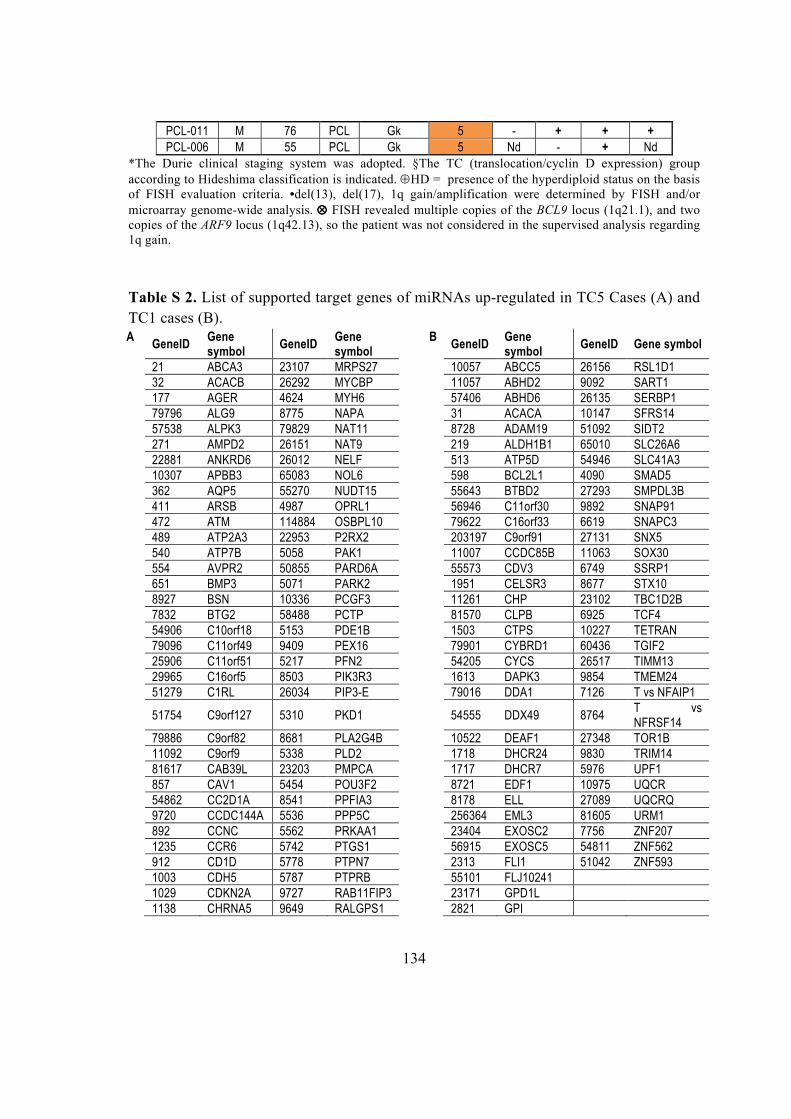
134
PCL-011 M 76 PCL Gk 5 - + + +
PCL-006 M 55 PCL Gk 5 Nd - + Nd
*The Durie clinical staging system was adopted. §The TC (translocation/cyclin D expression) group
according to Hideshima classification is indicated. ⊕HD = presence of the hyperdiploid status on the basis
of FISH evaluation criteria. •del(13), del(17), 1q gain/amplification were determined by FISH and/or
microarray genome-wide analysis. ⊗⊗⊗⊗ FISH revealed multiple copies of the BCL9 locus (1q21.1), and two
copies of the ARF9 locus (1q42.13), so the patient was not considered in the supervised analysis regarding
1q gain.
Table S 2. List of supported target genes of miRNAs up-regulated in TC5 Cases (A) and
TC1 cases (B).
A GeneID
Gene symbol
GeneID Gene symbol
B GeneID
Gene symbol
GeneID Gene symbol
21 ABCA3 23107 MRPS27 10057 ABCC5 26156 RSL1D1
32 ACACB 26292 MYCBP 11057 ABHD2 9092 SART1
177 AGER 4624 MYH6 57406 ABHD6 26135 SERBP1
79796 ALG9 8775 NAPA 31 ACACA 10147 SFRS14
57538 ALPK3 79829 NAT11 8728 ADAM19 51092 SIDT2
271 AMPD2 26151 NAT9 219 ALDH1B1 65010 SLC26A6
22881 ANKRD6 26012 NELF 513 ATP5D 54946 SLC41A3
10307 APBB3 65083 NOL6 598 BCL2L1 4090 SMAD5
362 AQP5 55270 NUDT15 55643 BTBD2 27293 SMPDL3B
411 ARSB 4987 OPRL1 56946 C11orf30 9892 SNAP91
472 ATM 114884 OSBPL10 79622 C16orf33 6619 SNAPC3
489 ATP2A3 22953 P2RX2 203197 C9orf91 27131 SNX5
540 ATP7B 5058 PAK1 11007 CCDC85B 11063 SOX30
554 AVPR2 50855 PARD6A 55573 CDV3 6749 SSRP1
651 BMP3 5071 PARK2 1951 CELSR3 8677 STX10
8927 BSN 10336 PCGF3 11261 CHP 23102 TBC1D2B
7832 BTG2 58488 PCTP 81570 CLPB 6925 TCF4
54906 C10orf18 5153 PDE1B 1503 CTPS 10227 TETRAN
79096 C11orf49 9409 PEX16 79901 CYBRD1 60436 TGIF2
25906 C11orf51 5217 PFN2 54205 CYCS 26517 TIMM13
29965 C16orf5 8503 PIK3R3 1613 DAPK3 9854 TMEM24
51279 C1RL 26034 PIP3-E 79016 DDA1 7126 T vs NFAIP1
51754 C9orf127 5310 PKD1
54555 DDX49 8764
T vs NFRSF14
79886 C9orf82 8681 PLA2G4B 10522 DEAF1 27348 TOR1B
11092 C9orf9 5338 PLD2 1718 DHCR24 9830 TRIM14
81617 CAB39L 23203 PMPCA 1717 DHCR7 5976 UPF1
857 CAV1 5454 POU3F2 8721 EDF1 10975 UQCR
54862 CC2D1A 8541 PPFIA3 8178 ELL 27089 UQCRQ
9720 CCDC144A 5536 PPP5C 256364 EML3 81605 URM1
892 CCNC 5562 PRKAA1 23404 EXOSC2 7756 ZNF207
1235 CCR6 5742 PTGS1 56915 EXOSC5 54811 ZNF562
912 CD1D 5778 PTPN7 2313 FLI1 51042 ZNF593
1003 CDH5 5787 PTPRB 55101 FLJ10241
1029 CDKN2A 9727 RAB11FIP3 23171 GPD1L
1138 CHRNA5 9649 RALGPS1 2821 GPI
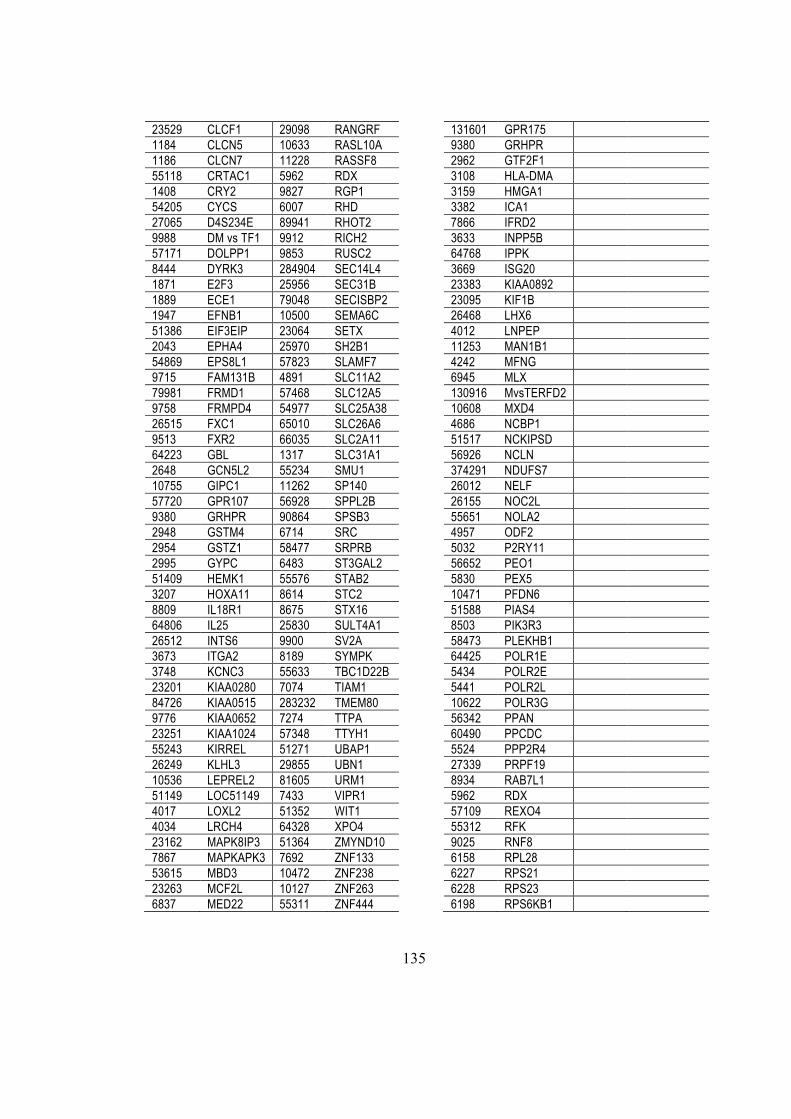
135
23529 CLCF1 29098 RANGRF 131601 GPR175
1184 CLCN5 10633 RASL10A 9380 GRHPR
1186 CLCN7 11228 RASSF8 2962 GTF2F1
55118 CRTAC1 5962 RDX 3108 HLA-DMA
1408 CRY2 9827 RGP1 3159 HMGA1
54205 CYCS 6007 RHD 3382 ICA1
27065 D4S234E 89941 RHOT2 7866 IFRD2
9988 DM vs TF1 9912 RICH2 3633 INPP5B
57171 DOLPP1 9853 RUSC2 64768 IPPK
8444 DYRK3 284904 SEC14L4 3669 ISG20
1871 E2F3 25956 SEC31B 23383 KIAA0892
1889 ECE1 79048 SECISBP2 23095 KIF1B
1947 EFNB1 10500 SEMA6C 26468 LHX6
51386 EIF3EIP 23064 SETX 4012 LNPEP
2043 EPHA4 25970 SH2B1 11253 MAN1B1
54869 EPS8L1 57823 SLAMF7 4242 MFNG
9715 FAM131B 4891 SLC11A2 6945 MLX
79981 FRMD1 57468 SLC12A5 130916 MvsTERFD2
9758 FRMPD4 54977 SLC25A38 10608 MXD4
26515 FXC1 65010 SLC26A6 4686 NCBP1
9513 FXR2 66035 SLC2A11 51517 NCKIPSD
64223 GBL 1317 SLC31A1 56926 NCLN
2648 GCN5L2 55234 SMU1 374291 NDUFS7
10755 GIPC1 11262 SP140 26012 NELF
57720 GPR107 56928 SPPL2B 26155 NOC2L
9380 GRHPR 90864 SPSB3 55651 NOLA2
2948 GSTM4 6714 SRC 4957 ODF2
2954 GSTZ1 58477 SRPRB 5032 P2RY11
2995 GYPC 6483 ST3GAL2 56652 PEO1
51409 HEMK1 55576 STAB2 5830 PEX5
3207 HOXA11 8614 STC2 10471 PFDN6
8809 IL18R1 8675 STX16 51588 PIAS4
64806 IL25 25830 SULT4A1 8503 PIK3R3
26512 INTS6 9900 SV2A 58473 PLEKHB1
3673 ITGA2 8189 SYMPK 64425 POLR1E
3748 KCNC3 55633 TBC1D22B 5434 POLR2E
23201 KIAA0280 7074 TIAM1 5441 POLR2L
84726 KIAA0515 283232 TMEM80 10622 POLR3G
9776 KIAA0652 7274 TTPA 56342 PPAN
23251 KIAA1024 57348 TTYH1 60490 PPCDC
55243 KIRREL 51271 UBAP1 5524 PPP2R4
26249 KLHL3 29855 UBN1 27339 PRPF19
10536 LEPREL2 81605 URM1 8934 RAB7L1
51149 LOC51149 7433 VIPR1 5962 RDX
4017 LOXL2 51352 WIT1 57109 REXO4
4034 LRCH4 64328 XPO4 55312 RFK
23162 MAPK8IP3 51364 ZMYND10 9025 RNF8
7867 MAPKAPK3 7692 ZNF133 6158 RPL28
53615 MBD3 10472 ZNF238 6227 RPS21
23263 MCF2L 10127 ZNF263 6228 RPS23
6837 MED22 55311 ZNF444 6198 RPS6KB1
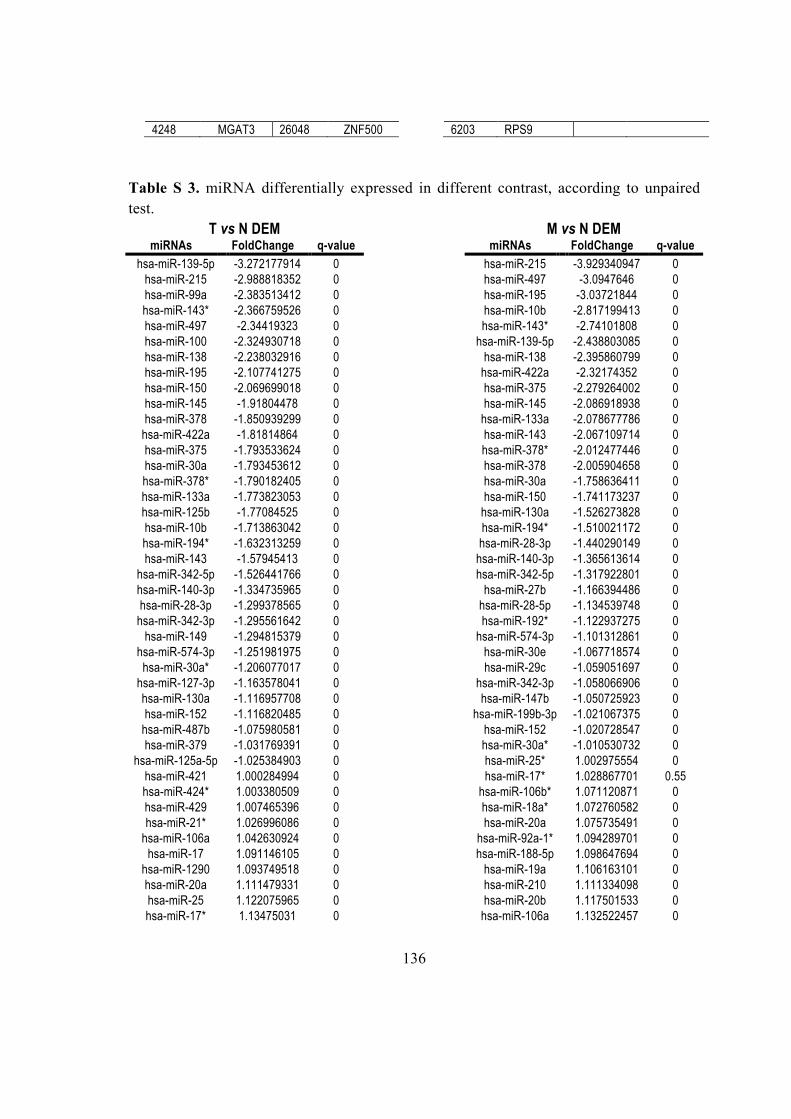
136
4248 MGAT3 26048 ZNF500 6203 RPS9
Table S 3. miRNA differentially expressed in different contrast, according to unpaired
test.
T vs N DEM M vs N DEM miRNAs FoldChange q-value miRNAs FoldChange q-value
hsa-miR-139-5p -3.272177914 0 hsa-miR-215 -3.929340947 0
hsa-miR-215 -2.988818352 0 hsa-miR-497 -3.0947646 0
hsa-miR-99a -2.383513412 0 hsa-miR-195 -3.03721844 0
hsa-miR-143* -2.366759526 0 hsa-miR-10b -2.817199413 0
hsa-miR-497 -2.34419323 0 hsa-miR-143* -2.74101808 0
hsa-miR-100 -2.324930718 0 hsa-miR-139-5p -2.438803085 0
hsa-miR-138 -2.238032916 0 hsa-miR-138 -2.395860799 0
hsa-miR-195 -2.107741275 0 hsa-miR-422a -2.32174352 0
hsa-miR-150 -2.069699018 0 hsa-miR-375 -2.279264002 0
hsa-miR-145 -1.91804478 0 hsa-miR-145 -2.086918938 0
hsa-miR-378 -1.850939299 0 hsa-miR-133a -2.078677786 0
hsa-miR-422a -1.81814864 0 hsa-miR-143 -2.067109714 0
hsa-miR-375 -1.793533624 0 hsa-miR-378* -2.012477446 0
hsa-miR-30a -1.793453612 0 hsa-miR-378 -2.005904658 0
hsa-miR-378* -1.790182405 0 hsa-miR-30a -1.758636411 0
hsa-miR-133a -1.773823053 0 hsa-miR-150 -1.741173237 0
hsa-miR-125b -1.77084525 0 hsa-miR-130a -1.526273828 0
hsa-miR-10b -1.713863042 0 hsa-miR-194* -1.510021172 0
hsa-miR-194* -1.632313259 0 hsa-miR-28-3p -1.440290149 0
hsa-miR-143 -1.57945413 0 hsa-miR-140-3p -1.365613614 0
hsa-miR-342-5p -1.526441766 0 hsa-miR-342-5p -1.317922801 0
hsa-miR-140-3p -1.334735965 0 hsa-miR-27b -1.166394486 0
hsa-miR-28-3p -1.299378565 0 hsa-miR-28-5p -1.134539748 0
hsa-miR-342-3p -1.295561642 0 hsa-miR-192* -1.122937275 0
hsa-miR-149 -1.294815379 0 hsa-miR-574-3p -1.101312861 0
hsa-miR-574-3p -1.251981975 0 hsa-miR-30e -1.067718574 0
hsa-miR-30a* -1.206077017 0 hsa-miR-29c -1.059051697 0
hsa-miR-127-3p -1.163578041 0 hsa-miR-342-3p -1.058066906 0
hsa-miR-130a -1.116957708 0 hsa-miR-147b -1.050725923 0
hsa-miR-152 -1.116820485 0 hsa-miR-199b-3p -1.021067375 0
hsa-miR-487b -1.075980581 0 hsa-miR-152 -1.020728547 0
hsa-miR-379 -1.031769391 0 hsa-miR-30a* -1.010530732 0
hsa-miR-125a-5p -1.025384903 0 hsa-miR-25* 1.002975554 0
hsa-miR-421 1.000284994 0 hsa-miR-17* 1.028867701 0.55
hsa-miR-424* 1.003380509 0 hsa-miR-106b* 1.071120871 0
hsa-miR-429 1.007465396 0 hsa-miR-18a* 1.072760582 0
hsa-miR-21* 1.026996086 0 hsa-miR-20a 1.075735491 0
hsa-miR-106a 1.042630924 0 hsa-miR-92a-1* 1.094289701 0
hsa-miR-17 1.091146105 0 hsa-miR-188-5p 1.098647694 0
hsa-miR-1290 1.093749518 0 hsa-miR-19a 1.106163101 0
hsa-miR-20a 1.111479331 0 hsa-miR-210 1.111334098 0
hsa-miR-25 1.122075965 0 hsa-miR-20b 1.117501533 0
hsa-miR-17* 1.13475031 0 hsa-miR-106a 1.132522457 0

137
hsa-miR-25* 1.149337691 0 hsa-miR-17 1.236828699 0
hsa-miR-552 1.208369576 0 hsa-miR-1275 1.250592958 0
hsa-miR-19a 1.221854517 0 hsa-miR-203 1.261763799 0
hsa-miR-92a-1* 1.227938987 0 hsa-miR-483-5p 1.359232784 0
hsa-miR-181d 1.282578776 0 hsa-miR-552 1.391223984 0
hsa-miR-29b-1* 1.328202727 0 hsa-miR-421 1.42187077 0
hsa-miR-203 1.389987787 0 hsa-miR-886-5p 1.463191451 0
hsa-miR-886-5p 1.46179031 0 hsa-miR-1308 1.593441466 0
hsa-miR-20b 1.468807073 0 hsa-miR-885-5p 1.625067821 0
hsa-miR-1246 1.775916675 0 hsa-miR-181d 1.657513172 0
hsa-miR-1308 1.857166271 0 hsa-miR-424* 1.689271681 0
hsa-miR-31 1.877829229 0.51 hsa-miR-224 1.747108666 0
hsa-miR-18b 1.909565741 0 hsa-miR-1290 1.998961285 0
hsa-miR-21 1.913670952 0 hsa-miR-18b 2.026686411 0
hsa-miR-18a 1.93394207 0 hsa-miR-18a 2.065786605 0
hsa-miR-503 1.950664843 0 hsa-miR-1246 2.384683531 0
hsa-miR-224 2.058520635 0 hsa-miR-182 2.388952962 0
hsa-miR-182 2.187797216 0 hsa-miR-503 2.616172225 0
hsa-miR-183 2.53733318 0 hsa-miR-183 2.693341196 0
hsa-miR-122 8.312462259 0
M vs T DEM miRNAs FoldChange q-value
hsa-miR-146a -1.379160258 0
hsa-miR-708 -1.292819562 0
hsa-miR-15a -1.212038005 0
hsa-miR-196a -1.166896704 0
hsa-miR-10b -1.103336371 0
hsa-miR-15b -1.068075875 0
hsa-miR-210 1.114739685 0
hsa-miR-99a 1.483966648 0
hsa-miR-885-5p 1.506612383 0
hsa-miR-100 1.753641519 0
hsa-miR-122 7.943847008 0
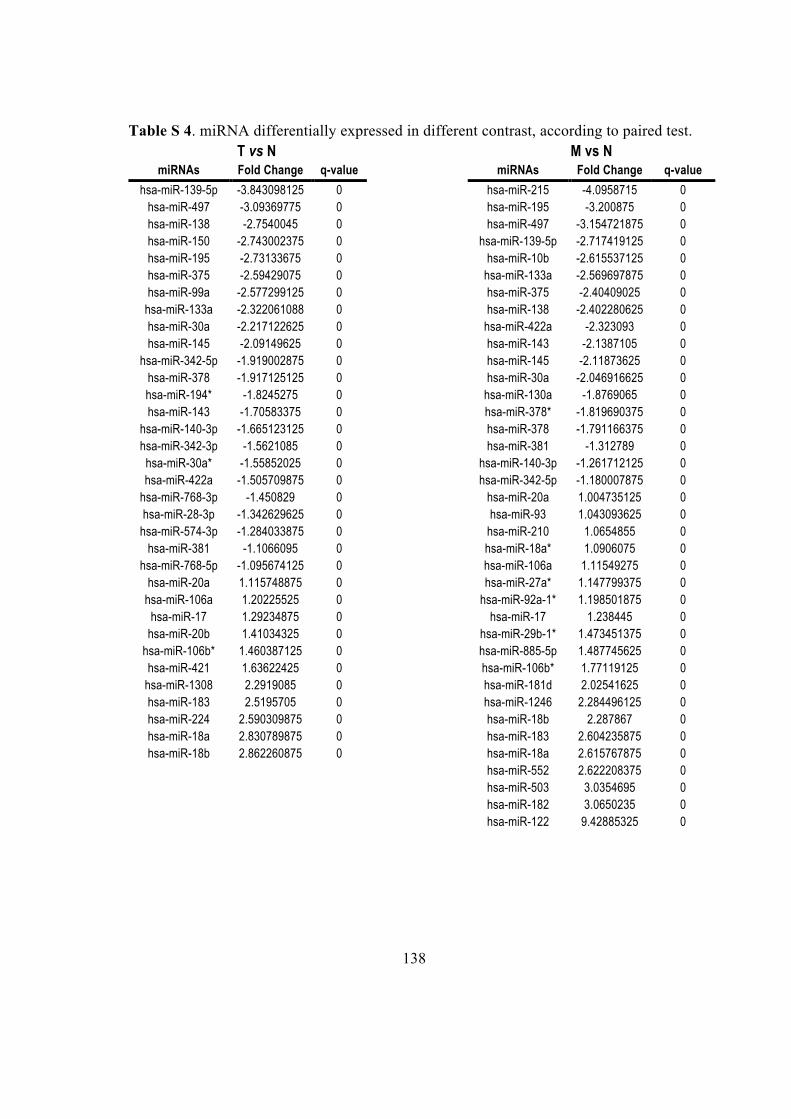
138
Table S 4. miRNA differentially expressed in different contrast, according to paired test.
T vs N M vs N miRNAs Fold Change q-value miRNAs Fold Change q-value
hsa-miR-139-5p -3.843098125 0 hsa-miR-215 -4.0958715 0
hsa-miR-497 -3.09369775 0 hsa-miR-195 -3.200875 0
hsa-miR-138 -2.7540045 0 hsa-miR-497 -3.154721875 0
hsa-miR-150 -2.743002375 0 hsa-miR-139-5p -2.717419125 0
hsa-miR-195 -2.73133675 0 hsa-miR-10b -2.615537125 0
hsa-miR-375 -2.59429075 0 hsa-miR-133a -2.569697875 0
hsa-miR-99a -2.577299125 0 hsa-miR-375 -2.40409025 0
hsa-miR-133a -2.322061088 0 hsa-miR-138 -2.402280625 0
hsa-miR-30a -2.217122625 0 hsa-miR-422a -2.323093 0
hsa-miR-145 -2.09149625 0 hsa-miR-143 -2.1387105 0
hsa-miR-342-5p -1.919002875 0 hsa-miR-145 -2.11873625 0
hsa-miR-378 -1.917125125 0 hsa-miR-30a -2.046916625 0
hsa-miR-194* -1.8245275 0 hsa-miR-130a -1.8769065 0
hsa-miR-143 -1.70583375 0 hsa-miR-378* -1.819690375 0
hsa-miR-140-3p -1.665123125 0 hsa-miR-378 -1.791166375 0
hsa-miR-342-3p -1.5621085 0 hsa-miR-381 -1.312789 0
hsa-miR-30a* -1.55852025 0 hsa-miR-140-3p -1.261712125 0
hsa-miR-422a -1.505709875 0 hsa-miR-342-5p -1.180007875 0
hsa-miR-768-3p -1.450829 0 hsa-miR-20a 1.004735125 0
hsa-miR-28-3p -1.342629625 0 hsa-miR-93 1.043093625 0
hsa-miR-574-3p -1.284033875 0 hsa-miR-210 1.0654855 0
hsa-miR-381 -1.1066095 0 hsa-miR-18a* 1.0906075 0
hsa-miR-768-5p -1.095674125 0 hsa-miR-106a 1.11549275 0
hsa-miR-20a 1.115748875 0 hsa-miR-27a* 1.147799375 0
hsa-miR-106a 1.20225525 0 hsa-miR-92a-1* 1.198501875 0
hsa-miR-17 1.29234875 0 hsa-miR-17 1.238445 0
hsa-miR-20b 1.41034325 0 hsa-miR-29b-1* 1.473451375 0
hsa-miR-106b* 1.460387125 0 hsa-miR-885-5p 1.487745625 0
hsa-miR-421 1.63622425 0 hsa-miR-106b* 1.77119125 0
hsa-miR-1308 2.2919085 0 hsa-miR-181d 2.02541625 0
hsa-miR-183 2.5195705 0 hsa-miR-1246 2.284496125 0
hsa-miR-224 2.590309875 0 hsa-miR-18b 2.287867 0
hsa-miR-18a 2.830789875 0 hsa-miR-183 2.604235875 0
hsa-miR-18b 2.862260875 0 hsa-miR-18a 2.615767875 0
hsa-miR-552 2.622208375 0
hsa-miR-503 3.0354695 0
hsa-miR-182 3.0650235 0
hsa-miR-122 9.42885325 0
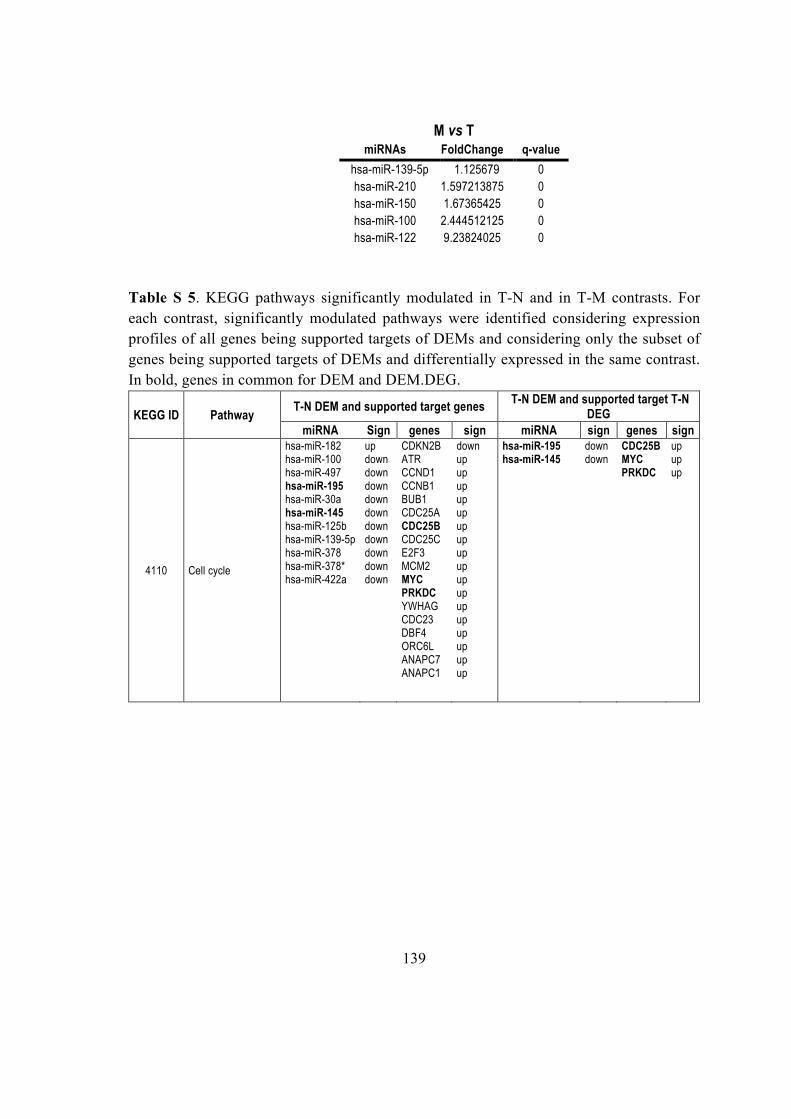
139
M vs T
miRNAs FoldChange q-value
hsa-miR-139-5p 1.125679 0
hsa-miR-210 1.597213875 0
hsa-miR-150 1.67365425 0
hsa-miR-100 2.444512125 0
hsa-miR-122 9.23824025 0
Table S 5. KEGG pathways significantly modulated in T-N and in T-M contrasts. For
each contrast, significantly modulated pathways were identified considering expression
profiles of all genes being supported targets of DEMs and considering only the subset of
genes being supported targets of DEMs and differentially expressed in the same contrast.
In bold, genes in common for DEM and DEM.DEG.
KEGG ID Pathway T-N DEM and supported target genes
T-N DEM and supported target T-N DEG
miRNA Sign genes sign miRNA sign genes sign
4110 Cell cycle
hsa-miR-182 hsa-miR-100 hsa-miR-497 hsa-miR-195 hsa-miR-30a hsa-miR-145 hsa-miR-125b hsa-miR-139-5p hsa-miR-378 hsa-miR-378* hsa-miR-422a
up down down down down down down down down down down
CDKN2B ATR CCND1 CCNB1 BUB1 CDC25A CDC25B CDC25C E2F3 MCM2 MYC PRKDC YWHAG CDC23 DBF4 ORC6L ANAPC7 ANAPC1
down up up up up up up up up up up up up up up up up up
hsa-miR-195 hsa-miR-145
down down
CDC25B MYC PRKDC
up up up
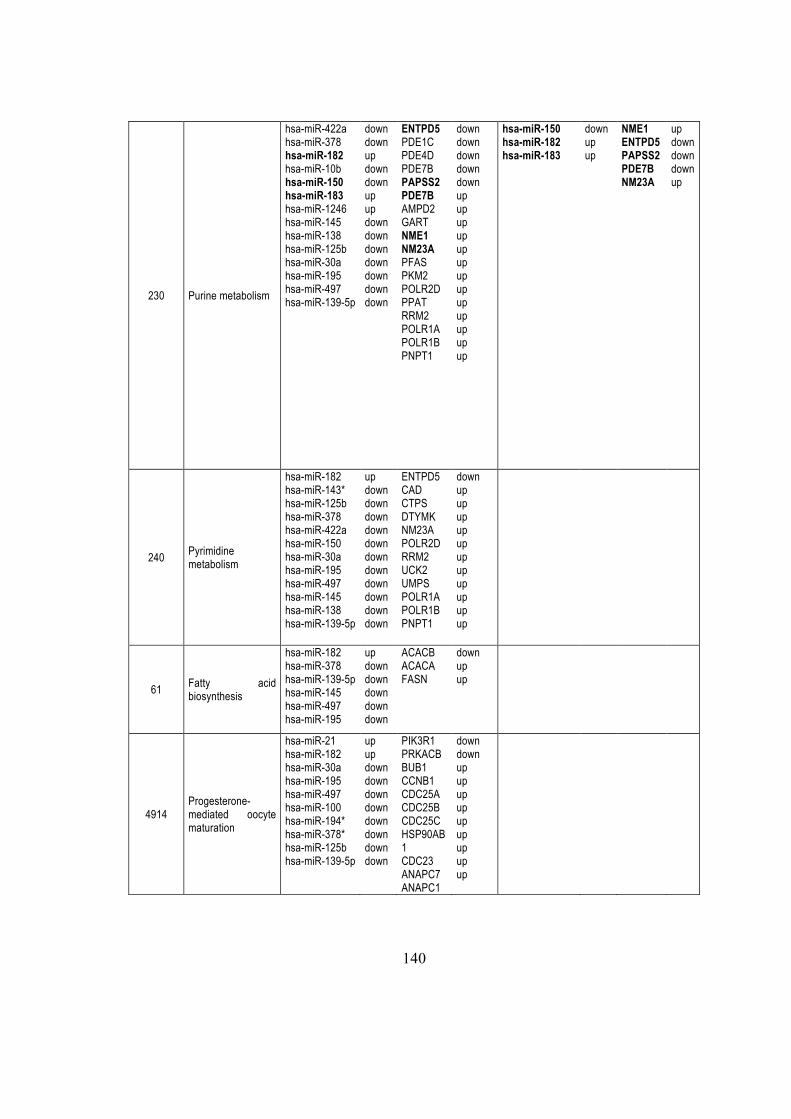
140
230 Purine metabolism
hsa-miR-422a hsa-miR-378 hsa-miR-182 hsa-miR-10b hsa-miR-150 hsa-miR-183 hsa-miR-1246 hsa-miR-145 hsa-miR-138 hsa-miR-125b hsa-miR-30a hsa-miR-195 hsa-miR-497 hsa-miR-139-5p
down down up down down up up down down down down down down down
ENTPD5 PDE1C PDE4D PDE7B PAPSS2 PDE7B AMPD2 GART NME1 NM23A PFAS PKM2 POLR2D PPAT RRM2 POLR1A POLR1B PNPT1
down down down down down up up up up up up up up up up up up up
hsa-miR-150 hsa-miR-182 hsa-miR-183
down up up
NME1 ENTPD5 PAPSS2 PDE7B NM23A
up down down down up
240 Pyrimidine metabolism
hsa-miR-182 hsa-miR-143* hsa-miR-125b hsa-miR-378 hsa-miR-422a hsa-miR-150 hsa-miR-30a hsa-miR-195 hsa-miR-497 hsa-miR-145 hsa-miR-138 hsa-miR-139-5p
up down down down down down down down down down down down
ENTPD5 CAD CTPS DTYMK NM23A POLR2D RRM2 UCK2 UMPS POLR1A POLR1B PNPT1
down up up up up up up up up up up up
61 Fatty acid biosynthesis
hsa-miR-182 hsa-miR-378 hsa-miR-139-5p hsa-miR-145 hsa-miR-497 hsa-miR-195
up down down down down down
ACACB ACACA FASN
down up up
4914 Progesterone-mediated oocyte maturation
hsa-miR-21 hsa-miR-182 hsa-miR-30a hsa-miR-195 hsa-miR-497 hsa-miR-100 hsa-miR-194* hsa-miR-378* hsa-miR-125b hsa-miR-139-5p
up up down down down down down down down down
PIK3R1 PRKACB BUB1 CCNB1 CDC25A CDC25B CDC25C HSP90AB1 CDC23 ANAPC7 ANAPC1
down down up up up up up up up up up
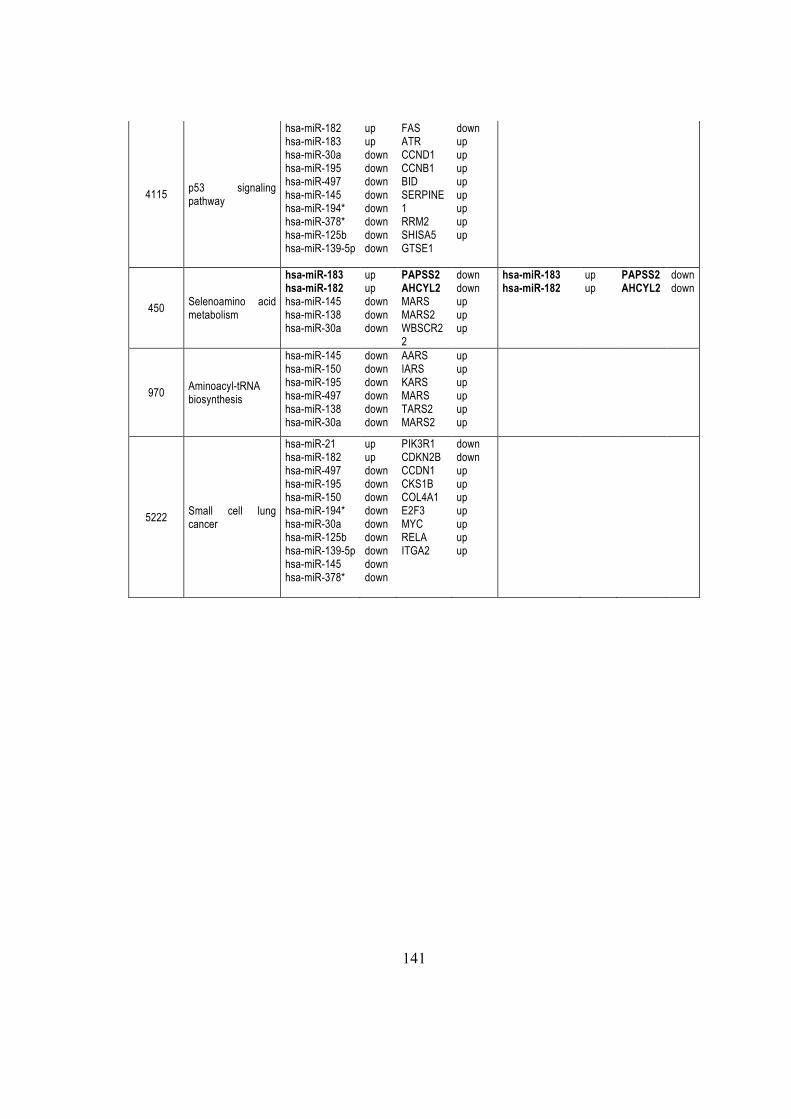
141
4115 p53 signaling pathway
hsa-miR-182 hsa-miR-183 hsa-miR-30a hsa-miR-195 hsa-miR-497 hsa-miR-145 hsa-miR-194* hsa-miR-378* hsa-miR-125b hsa-miR-139-5p
up up down down down down down down down down
FAS ATR CCND1 CCNB1 BID SERPINE1 RRM2 SHISA5 GTSE1
down up up up up up up up up
450 Selenoamino acid metabolism
hsa-miR-183 hsa-miR-182 hsa-miR-145 hsa-miR-138 hsa-miR-30a
up up down down down
PAPSS2 AHCYL2 MARS MARS2 WBSCR22
down down up up up
hsa-miR-183 hsa-miR-182
up up
PAPSS2 AHCYL2
down down
970 Aminoacyl-tRNA biosynthesis
hsa-miR-145 hsa-miR-150 hsa-miR-195 hsa-miR-497 hsa-miR-138 hsa-miR-30a
down down down down down down
AARS IARS KARS MARS TARS2 MARS2
up up up up up up
5222 Small cell lung cancer
hsa-miR-21 hsa-miR-182 hsa-miR-497 hsa-miR-195 hsa-miR-150 hsa-miR-194* hsa-miR-30a hsa-miR-125b hsa-miR-139-5p hsa-miR-145 hsa-miR-378*
up up down down down down down down down down down
PIK3R1 CDKN2B CCDN1 CKS1B COL4A1 E2F3 MYC RELA ITGA2
down down up up up up up up up
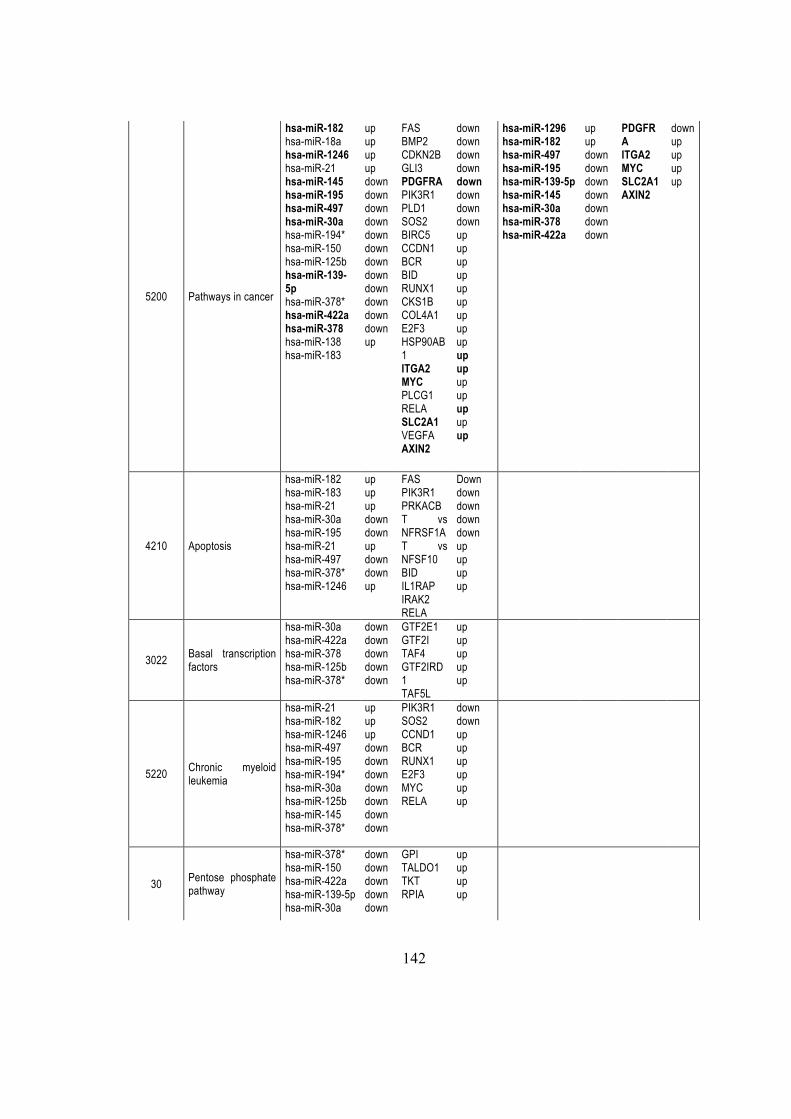
142
5200 Pathways in cancer
hsa-miR-182 hsa-miR-18a hsa-miR-1246 hsa-miR-21 hsa-miR-145 hsa-miR-195 hsa-miR-497 hsa-miR-30a hsa-miR-194* hsa-miR-150 hsa-miR-125b hsa-miR-139-5p hsa-miR-378* hsa-miR-422a hsa-miR-378 hsa-miR-138 hsa-miR-183
up up up up down down down down down down down down down down down down up
FAS BMP2 CDKN2B GLI3 PDGFRA PIK3R1 PLD1 SOS2 BIRC5 CCDN1 BCR BID RUNX1 CKS1B COL4A1 E2F3 HSP90AB1 ITGA2 MYC PLCG1 RELA SLC2A1 VEGFA AXIN2
down down down down down down down down up up up up up up up up up up up up up up up up
hsa-miR-1296 hsa-miR-182 hsa-miR-497 hsa-miR-195 hsa-miR-139-5p hsa-miR-145 hsa-miR-30a hsa-miR-378 hsa-miR-422a
up up down down down down down down down
PDGFRA ITGA2 MYC SLC2A1 AXIN2
down up up up up
4210 Apoptosis
hsa-miR-182 hsa-miR-183 hsa-miR-21 hsa-miR-30a hsa-miR-195 hsa-miR-21 hsa-miR-497 hsa-miR-378* hsa-miR-1246
up up up down down up down down up
FAS PIK3R1 PRKACB T vs NFRSF1A T vs NFSF10 BID IL1RAP IRAK2 RELA
Down down down down down up up up up
3022 Basal transcription factors
hsa-miR-30a hsa-miR-422a hsa-miR-378 hsa-miR-125b hsa-miR-378*
down down down down down
GTF2E1 GTF2I TAF4 GTF2IRD1 TAF5L
up up up up up
5220 Chronic myeloid leukemia
hsa-miR-21 hsa-miR-182 hsa-miR-1246 hsa-miR-497 hsa-miR-195 hsa-miR-194* hsa-miR-30a hsa-miR-125b hsa-miR-145 hsa-miR-378*
up up up down down down down down down down
PIK3R1 SOS2 CCND1 BCR RUNX1 E2F3 MYC RELA
down down up up up up up up
30 Pentose phosphate pathway
hsa-miR-378* hsa-miR-150 hsa-miR-422a hsa-miR-139-5p hsa-miR-30a
down down down down down
GPI TALDO1 TKT RPIA
up up up up
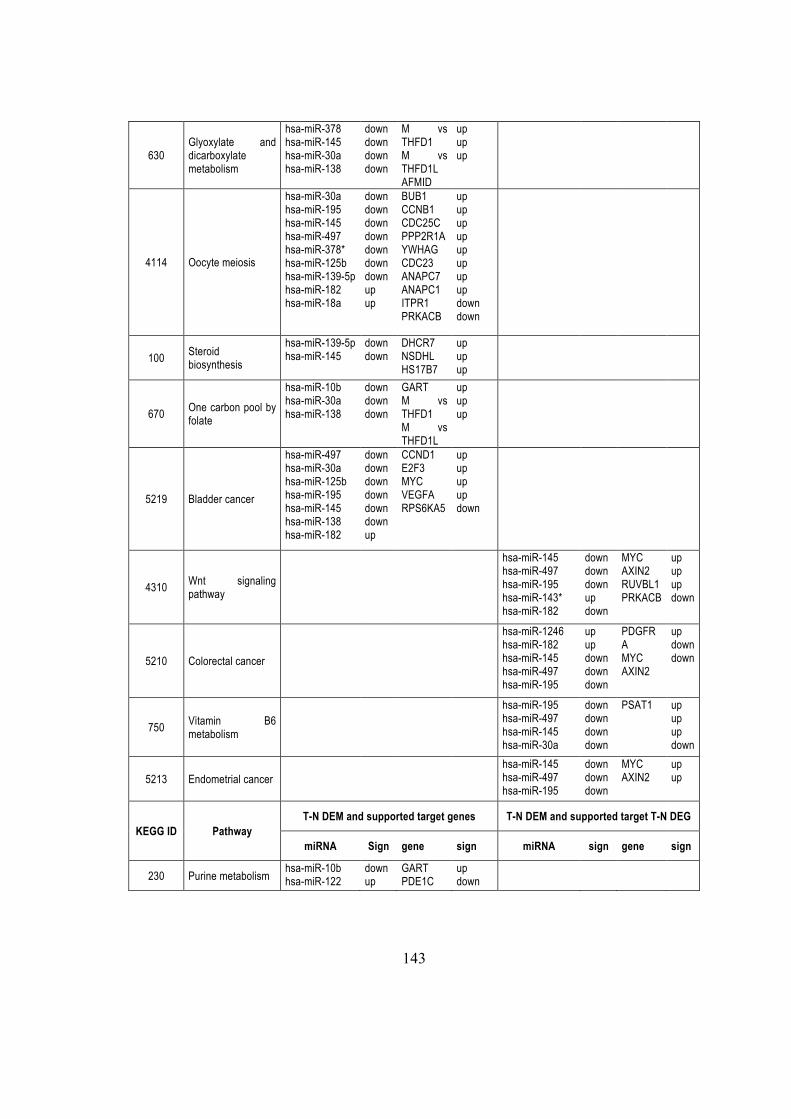
143
630 Glyoxylate and dicarboxylate metabolism
hsa-miR-378 hsa-miR-145 hsa-miR-30a hsa-miR-138
down down down down
M vs THFD1 M vs THFD1L AFMID
up up up
4114 Oocyte meiosis
hsa-miR-30a hsa-miR-195 hsa-miR-145 hsa-miR-497 hsa-miR-378* hsa-miR-125b hsa-miR-139-5p hsa-miR-182 hsa-miR-18a
down down down down down down down up up
BUB1 CCNB1 CDC25C PPP2R1A YWHAG CDC23 ANAPC7 ANAPC1 ITPR1 PRKACB
up up up up up up up up down down
100 Steroid biosynthesis
hsa-miR-139-5p hsa-miR-145
down down
DHCR7 NSDHL HS17B7
up up up
670 One carbon pool by folate
hsa-miR-10b hsa-miR-30a hsa-miR-138
down down down
GART M vs THFD1 M vs THFD1L
up up up
5219 Bladder cancer
hsa-miR-497 hsa-miR-30a hsa-miR-125b hsa-miR-195 hsa-miR-145 hsa-miR-138 hsa-miR-182
down down down down down down up
CCND1 E2F3 MYC VEGFA RPS6KA5
up up up up down
4310 Wnt signaling pathway
hsa-miR-145 hsa-miR-497 hsa-miR-195 hsa-miR-143* hsa-miR-182
down down down up down
MYC AXIN2 RUVBL1 PRKACB
up up up down
5210 Colorectal cancer
hsa-miR-1246 hsa-miR-182 hsa-miR-145 hsa-miR-497 hsa-miR-195
up up down down down
PDGFRA MYC AXIN2
up down down
750 Vitamin B6 metabolism
hsa-miR-195 hsa-miR-497 hsa-miR-145 hsa-miR-30a
down down down down
PSAT1 up up up down
5213 Endometrial cancer
hsa-miR-145 hsa-miR-497 hsa-miR-195
down down down
MYC AXIN2
up up
KEGG ID Pathway
T-N DEM and supported target genes T-N DEM and supported target T-N DEG
miRNA Sign gene sign miRNA sign gene sign
230 Purine metabolism hsa-miR-10b hsa-miR-122
down up
GART PDE1C
up down
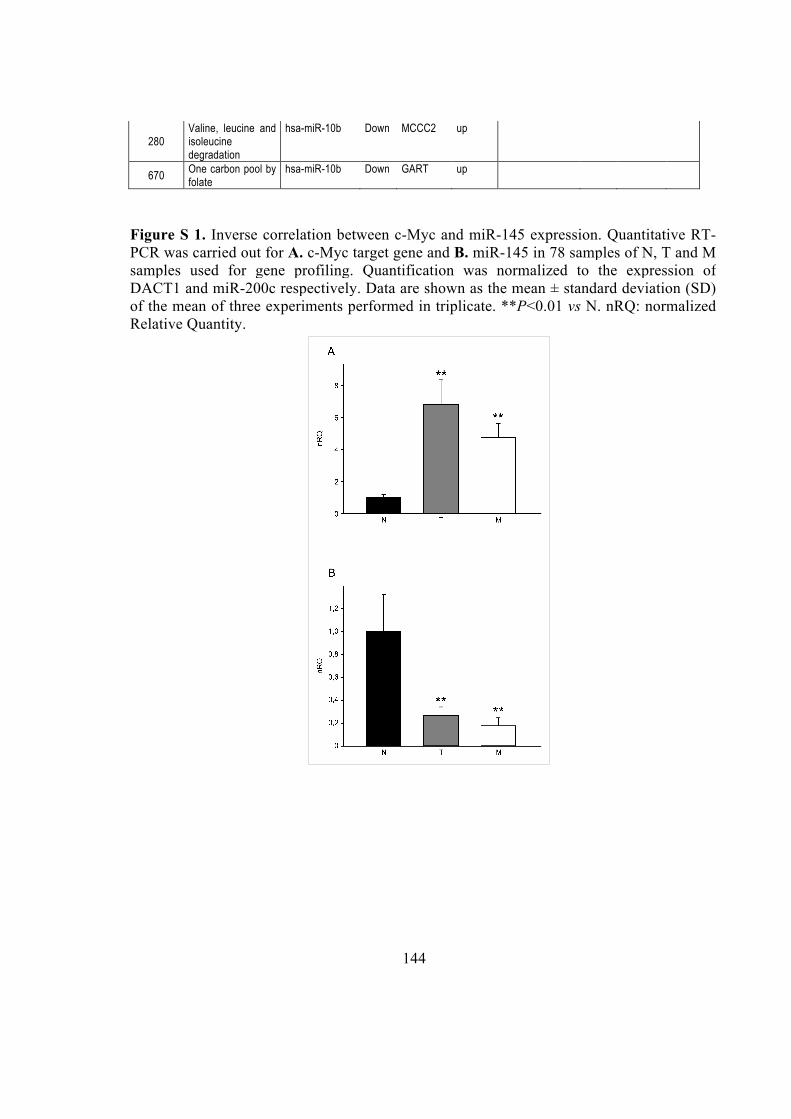
144
280 Valine, leucine and isoleucine degradation
hsa-miR-10b Down MCCC2 up
670 One carbon pool by folate
hsa-miR-10b Down GART up
Figure S 1. Inverse correlation between c-Myc and miR-145 expression. Quantitative RT-
PCR was carried out for A. c-Myc target gene and B. miR-145 in 78 samples of N, T and M
samples used for gene profiling. Quantification was normalized to the expression of
DACT1 and miR-200c respectively. Data are shown as the mean ± standard deviation (SD)
of the mean of three experiments performed in triplicate. **P<0.01 vs N. nRQ: normalized
Relative Quantity.

145
Table S 6. Biological process GO Terms significantly enriched in supported target gene
from miRNA differently expressed in ATLL versus resting CD4+.
Symbol GOBPID Pvalue Count Term
HSD3B1 SRD5A1 HSD17B6
GO:0006702 2,09E+09 3 androgen biosynthetic
process
CDC23 CCND1 PPP6C CDC7 CUL3 RB1
CDK2AP1 KPNA2 CDC6 APBB2 GAS1
GO:0051329 8,10E+09 11 interphase of mitotic cell
cycle
INCENP MYH9 RASA1 ROCK2 CCND1 CCNF CDC6 NEDD9 NEK3 RB1
TACC1 WEE1 SMC1A CDC7 CDC23
ARHGEF2 PDS5B PELO MIS12
GO:0051301 0,0002 19 cell division
MAP1B MAP4
ARHGEF2 MID1IP1
GO:0007026 0,0006 4 negative regulation of
microtubule depolymerization
SOAT1 DHCR24
PSEN1 ACHE
GO:0042982 0,0006 4 amyloid precursor protein metabolic
process KPNA2 CDC23 CCND1 PPP6C CDC7 CUL3 RB1
CDK2AP1
MYH9 SMC1A PDS5B CCNF CDC6 INCENP NEDD9 NEK3
WEE1 ARHGEF2 MIS12 SEH1L SPO11 ADCY3 APBB2 GAS1
GO:0022403 0,0007 24 cell cycle phase
AQP2 AVPR1A GO:0009415 0,0008 2 response to water
AQP2 AVPR1A GO:0042631 0,0008 2 cellular response to water deprivation
APBB2 GAS1
RB1 CDC7
GO:0033261 0,001 4 regulation of S phase
AGT LEPR
ADAM vs TS1 GO:0001542 0,001 3 ovulation from ovarian
follicle
APBB2 GAS1
RB1 GO:0045749 0,001 3 negative regulation of S phase of mitotic cell
cycle
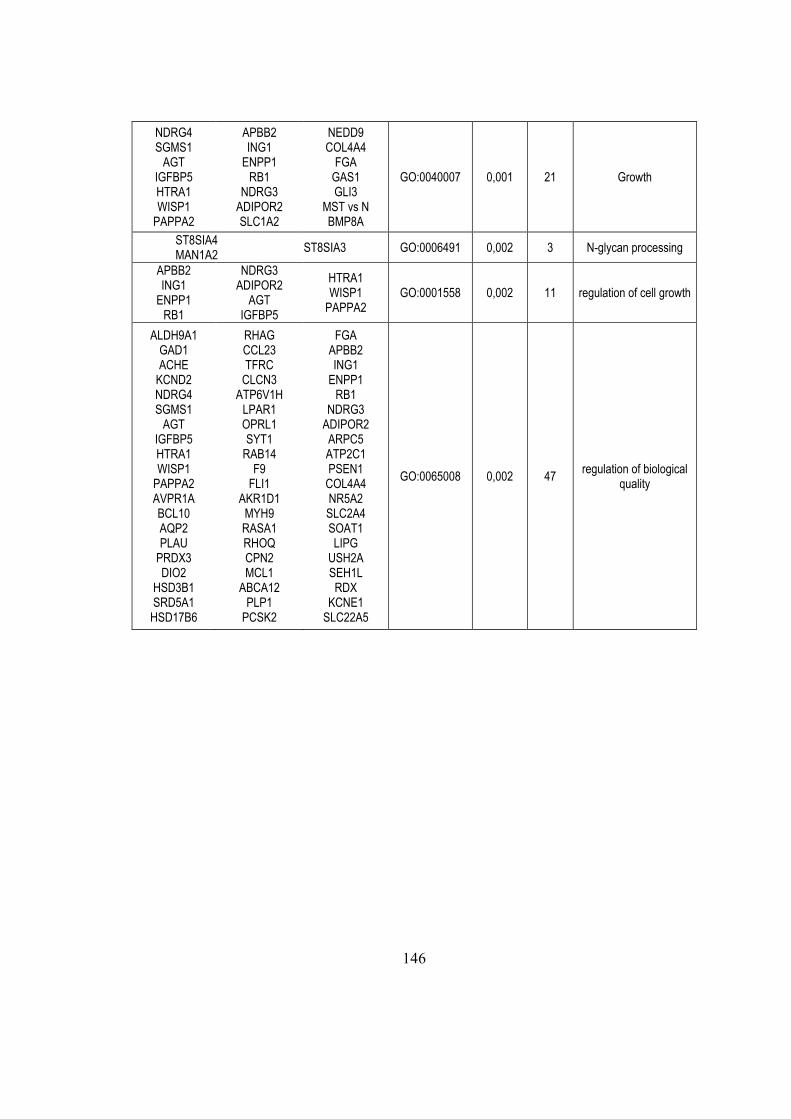
146
NDRG4 SGMS1 AGT
IGFBP5 HTRA1 WISP1 PAPPA2
APBB2 ING1 ENPP1 RB1
NDRG3 ADIPOR2 SLC1A2
NEDD9 COL4A4 FGA GAS1 GLI3
MST vs N BMP8A
GO:0040007 0,001 21 Growth
ST8SIA4 MAN1A2
ST8SIA3 GO:0006491 0,002 3 N-glycan processing
APBB2 ING1 ENPP1 RB1
NDRG3 ADIPOR2
AGT IGFBP5
HTRA1 WISP1 PAPPA2
GO:0001558 0,002 11 regulation of cell growth
ALDH9A1 GAD1 ACHE KCND2 NDRG4 SGMS1 AGT
IGFBP5 HTRA1 WISP1 PAPPA2 AVPR1A BCL10 AQP2 PLAU PRDX3 DIO2
HSD3B1 SRD5A1 HSD17B6
RHAG CCL23 TFRC CLCN3
ATP6V1H LPAR1 OPRL1 SYT1 RAB14 F9 FLI1
AKR1D1 MYH9 RASA1 RHOQ CPN2 MCL1
ABCA12 PLP1 PCSK2
FGA APBB2 ING1 ENPP1 RB1
NDRG3 ADIPOR2 ARPC5 ATP2C1 PSEN1 COL4A4 NR5A2 SLC2A4 SOAT1 LIPG USH2A SEH1L RDX
KCNE1 SLC22A5
GO:0065008 0,002 47 regulation of biological
quality
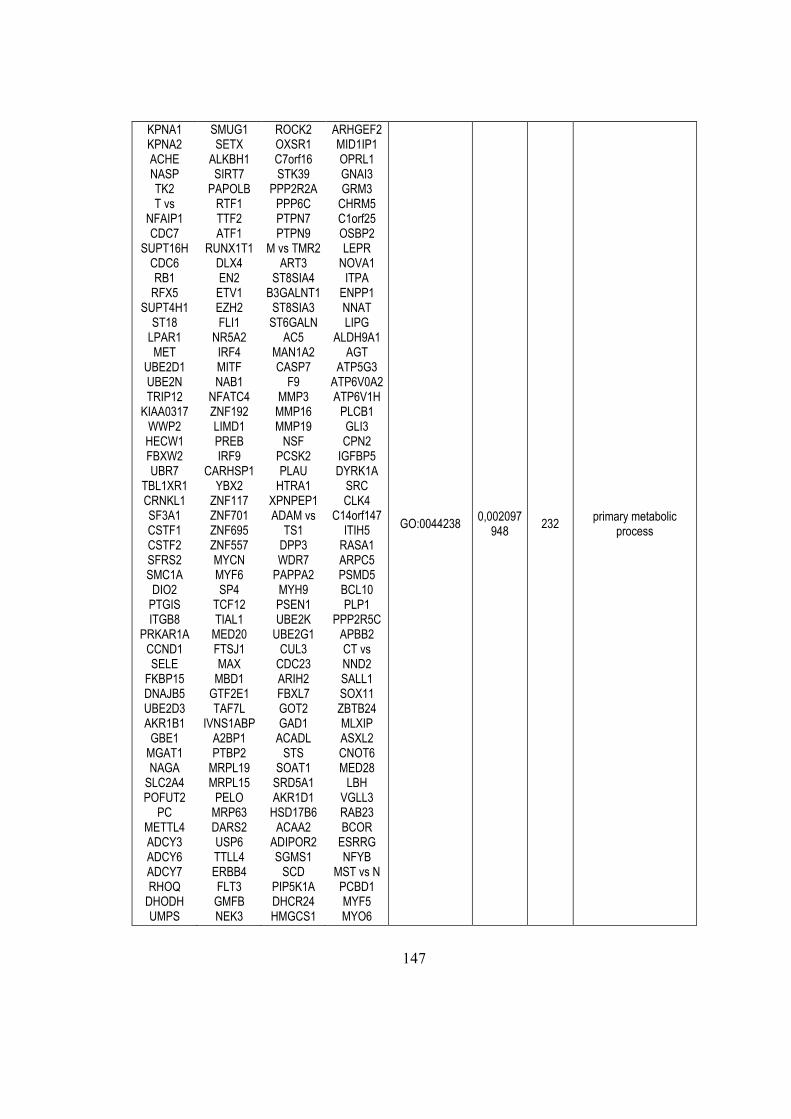
147
KPNA1 KPNA2 ACHE NASP TK2 T vs
NFAIP1 CDC7
SUPT16H CDC6 RB1 RFX5
SUPT4H1 ST18 LPAR1 MET
UBE2D1 UBE2N TRIP12
KIAA0317 WWP2 HECW1 FBXW2 UBR7
TBL1XR1 CRNKL1 SF3A1 CSTF1 CSTF2 SFRS2 SMC1A DIO2 PTGIS ITGB8
PRKAR1A CCND1 SELE
FKBP15 DNAJB5 UBE2D3 AKR1B1 GBE1 MGAT1 NAGA SLC2A4 POFUT2
PC METTL4 ADCY3 ADCY6 ADCY7 RHOQ DHODH UMPS SPO11
SMUG1 SETX
ALKBH1 SIRT7
PAPOLB RTF1 TTF2 ATF1
RUNX1T1 DLX4 EN2 ETV1 EZH2 FLI1
NR5A2 IRF4 MITF NAB1
NFATC4 ZNF192 LIMD1 PREB IRF9
CARHSP1 YBX2 ZNF117 ZNF701 ZNF695 ZNF557 MYCN MYF6 SP4
TCF12 TIAL1 MED20 FTSJ1 MAX MBD1 GTF2E1 TAF7L
IVNS1ABP A2BP1 PTBP2 MRPL19 MRPL15 PELO MRP63 DARS2 USP6 TTLL4 ERBB4 FLT3 GMFB NEK3
PRKAA2
ROCK2 OXSR1 C7orf16 STK39
PPP2R2A PPP6C PTPN7 PTPN9
M vs TMR2 ART3
ST8SIA4 B3GALNT1 ST8SIA3 ST6GALN
AC5 MAN1A2 CASP7 F9
MMP3 MMP16 MMP19 NSF
PCSK2 PLAU HTRA1
XPNPEP1 ADAM vs
TS1 DPP3 WDR7 PAPPA2 MYH9 PSEN1 UBE2K UBE2G1 CUL3 CDC23 ARIH2 FBXL7 GOT2 GAD1 ACADL STS
SOAT1 SRD5A1 AKR1D1 HSD17B6 ACAA2
ADIPOR2 SGMS1 SCD
PIP5K1A DHCR24 HMGCS1 HSD3B1
ARHGEF2 MID1IP1 OPRL1 GNAI3 GRM3 CHRM5 C1orf25 OSBP2 LEPR NOVA1 ITPA ENPP1 NNAT LIPG
ALDH9A1 AGT
ATP5G3 ATP6V0A2 ATP6V1H PLCB1 GLI3 CPN2 IGFBP5 DYRK1A SRC CLK4
C14orf147 ITIH5 RASA1 ARPC5 PSMD5 BCL10 PLP1
PPP2R5C APBB2 CT vs NND2 SALL1 SOX11 ZBTB24 MLXIP ASXL2 CNOT6 MED28 LBH
VGLL3 RAB23 BCOR ESRRG NFYB
MST vs N PCBD1 MYF5 MYO6 POU2F3
GO:0044238 0,002097
948 232
primary metabolic process
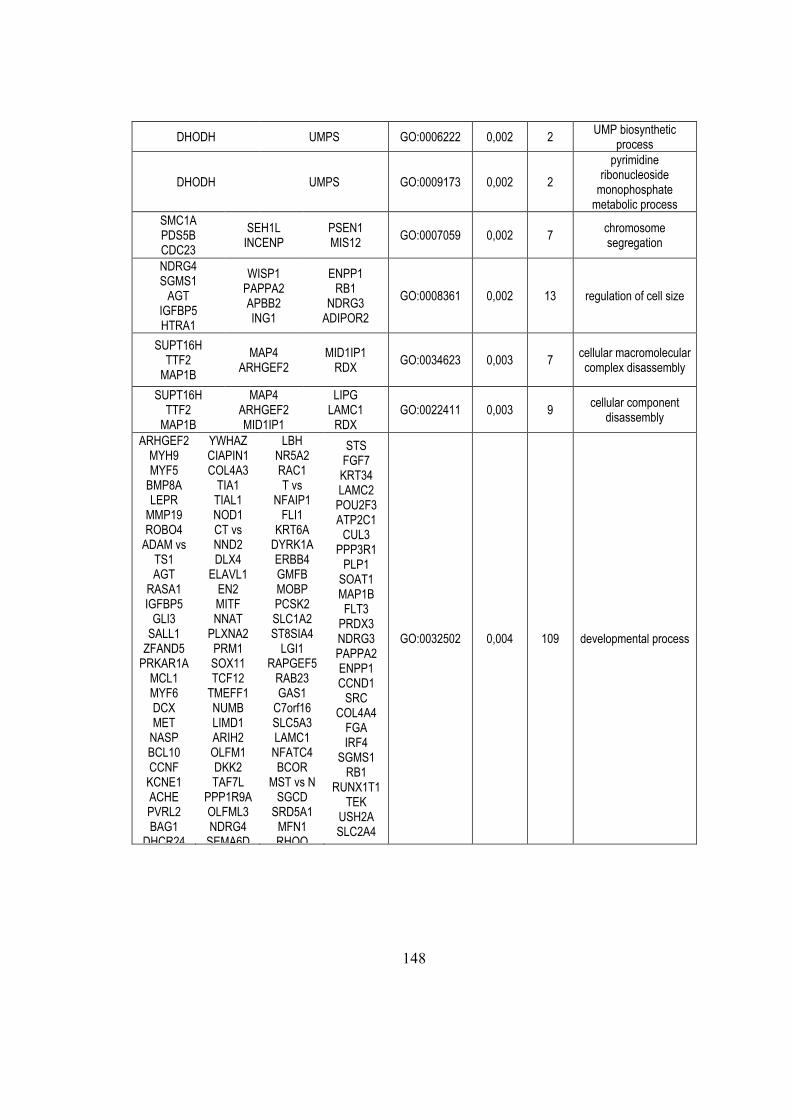
148
DHODH UMPS GO:0006222 0,002 2 UMP biosynthetic
process
DHODH UMPS GO:0009173 0,002 2
pyrimidine ribonucleoside monophosphate metabolic process
SMC1A PDS5B CDC23
SEH1L INCENP
PSEN1 MIS12
GO:0007059 0,002 7 chromosome segregation
NDRG4 SGMS1 AGT
IGFBP5 HTRA1
WISP1 PAPPA2 APBB2 ING1
ENPP1 RB1
NDRG3 ADIPOR2
GO:0008361 0,002 13 regulation of cell size
SUPT16H TTF2 MAP1B
MAP4 ARHGEF2
MID1IP1 RDX
GO:0034623 0,003 7 cellular macromolecular complex disassembly
SUPT16H TTF2 MAP1B
MAP4 ARHGEF2 MID1IP1
LIPG LAMC1 RDX
GO:0022411 0,003 9 cellular component
disassembly
ARHGEF2 MYH9 MYF5 BMP8A LEPR MMP19 ROBO4 ADAM vs
TS1 AGT
RASA1 IGFBP5 GLI3 SALL1 ZFAND5 PRKAR1A MCL1 MYF6 DCX MET NASP BCL10 CCNF KCNE1 ACHE PVRL2 BAG1
DHCR24
YWHAZ CIAPIN1 COL4A3 TIA1 TIAL1 NOD1 CT vs NND2 DLX4
ELAVL1 EN2 MITF NNAT
PLXNA2 PRM1 SOX11 TCF12 TMEFF1 NUMB LIMD1 ARIH2 OLFM1 DKK2 TAF7L
PPP1R9A OLFML3 NDRG4 SEMA6D
LBH NR5A2 RAC1 T vs
NFAIP1 FLI1
KRT6A DYRK1A ERBB4 GMFB MOBP PCSK2 SLC1A2 ST8SIA4 LGI1
RAPGEF5 RAB23 GAS1 C7orf16 SLC5A3 LAMC1 NFATC4 BCOR
MST vs N SGCD SRD5A1 MFN1 RHOQ
STS FGF7 KRT34 LAMC2 POU2F3 ATP2C1 CUL3
PPP3R1 PLP1 SOAT1 MAP1B FLT3 PRDX3 NDRG3 PAPPA2 ENPP1 CCND1 SRC
COL4A4 FGA IRF4
SGMS1 RB1
RUNX1T1 TEK
USH2A SLC2A4
GO:0032502 0,004 109 developmental process
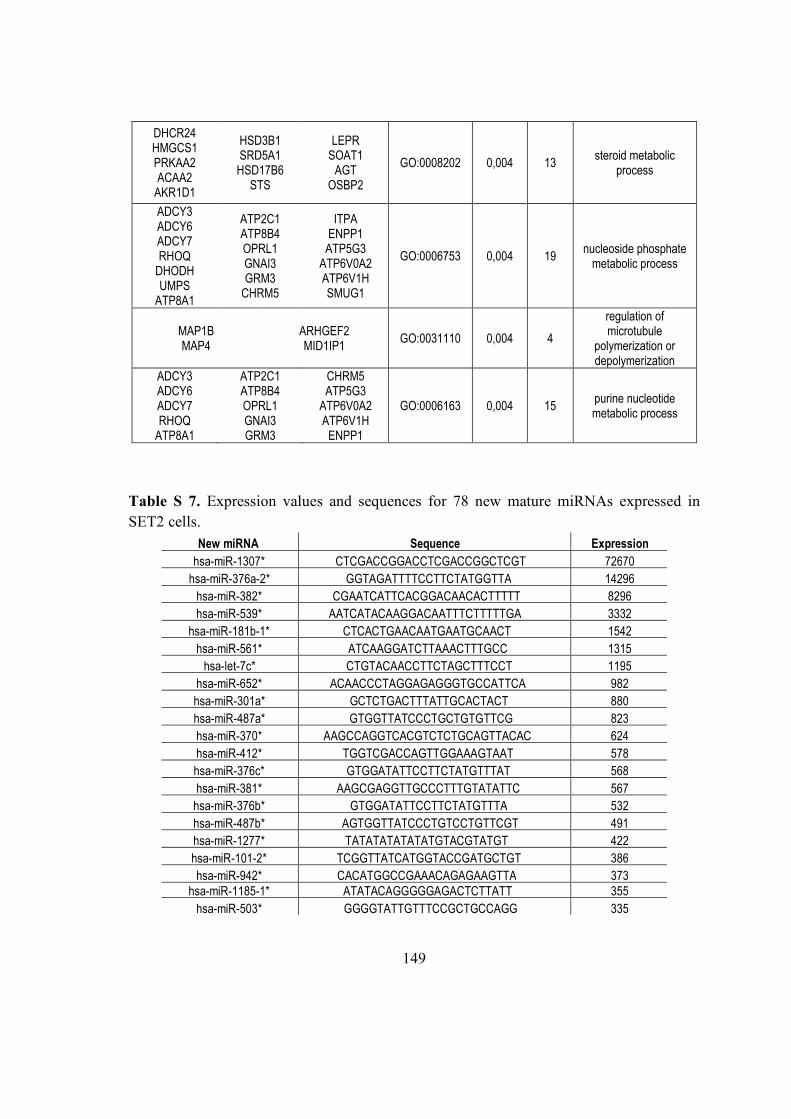
149
DHCR24 HMGCS1 PRKAA2 ACAA2 AKR1D1
HSD3B1 SRD5A1 HSD17B6
STS
LEPR SOAT1 AGT
OSBP2
GO:0008202 0,004 13 steroid metabolic
process
ADCY3 ADCY6 ADCY7 RHOQ DHODH UMPS ATP8A1
ATP2C1 ATP8B4 OPRL1 GNAI3 GRM3 CHRM5
ITPA ENPP1 ATP5G3
ATP6V0A2 ATP6V1H SMUG1
GO:0006753 0,004 19 nucleoside phosphate metabolic process
MAP1B MAP4
ARHGEF2 MID1IP1
GO:0031110 0,004 4
regulation of microtubule
polymerization or depolymerization
ADCY3 ADCY6 ADCY7 RHOQ ATP8A1
ATP2C1 ATP8B4 OPRL1 GNAI3 GRM3
CHRM5 ATP5G3
ATP6V0A2 ATP6V1H ENPP1
GO:0006163 0,004 15 purine nucleotide metabolic process
Table S 7. Expression values and sequences for 78 new mature miRNAs expressed in
SET2 cells.
New miRNA Sequence Expression
hsa-miR-1307* CTCGACCGGACCTCGACCGGCTCGT 72670
hsa-miR-376a-2* GGTAGATTTTCCTTCTATGGTTA 14296
hsa-miR-382* CGAATCATTCACGGACAACACTTTTT 8296
hsa-miR-539* AATCATACAAGGACAATTTCTTTTTGA 3332
hsa-miR-181b-1* CTCACTGAACAATGAATGCAACT 1542
hsa-miR-561* ATCAAGGATCTTAAACTTTGCC 1315
hsa-let-7c* CTGTACAACCTTCTAGCTTTCCT 1195
hsa-miR-652* ACAACCCTAGGAGAGGGTGCCATTCA 982
hsa-miR-301a* GCTCTGACTTTATTGCACTACT 880
hsa-miR-487a* GTGGTTATCCCTGCTGTGTTCG 823
hsa-miR-370* AAGCCAGGTCACGTCTCTGCAGTTACAC 624
hsa-miR-412* TGGTCGACCAGTTGGAAAGTAAT 578
hsa-miR-376c* GTGGATATTCCTTCTATGTTTAT 568
hsa-miR-381* AAGCGAGGTTGCCCTTTGTATATTC 567
hsa-miR-376b* GTGGATATTCCTTCTATGTTTA 532
hsa-miR-487b* AGTGGTTATCCCTGTCCTGTTCGT 491
hsa-miR-1277* TATATATATATATGTACGTATGT 422
hsa-miR-101-2* TCGGTTATCATGGTACCGATGCTGT 386
hsa-miR-942* CACATGGCCGAAACAGAGAAGTTA 373
hsa-miR-1185-1* ATATACAGGGGGAGACTCTTATT 355
hsa-miR-503* GGGGTATTGTTTCCGCTGCCAGG 335
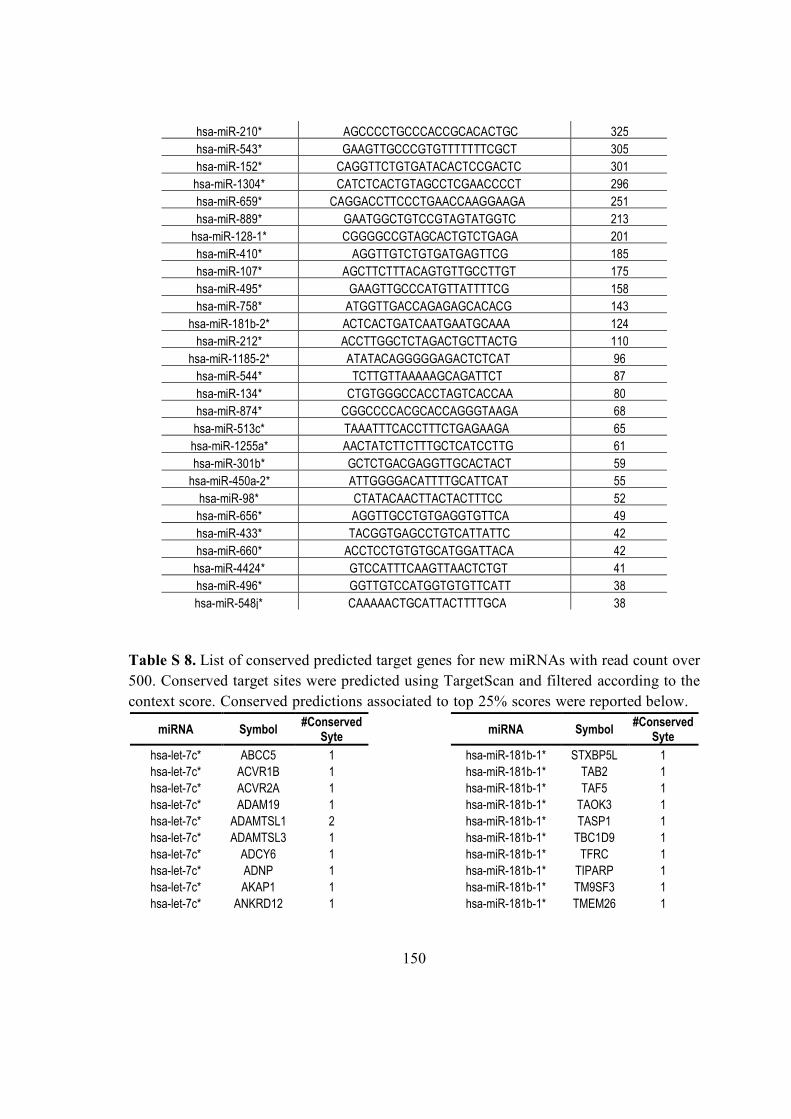
150
hsa-miR-210* AGCCCCTGCCCACCGCACACTGC 325
hsa-miR-543* GAAGTTGCCCGTGTTTTTTTCGCT 305
hsa-miR-152* CAGGTTCTGTGATACACTCCGACTC 301
hsa-miR-1304* CATCTCACTGTAGCCTCGAACCCCT 296
hsa-miR-659* CAGGACCTTCCCTGAACCAAGGAAGA 251
hsa-miR-889* GAATGGCTGTCCGTAGTATGGTC 213
hsa-miR-128-1* CGGGGCCGTAGCACTGTCTGAGA 201
hsa-miR-410* AGGTTGTCTGTGATGAGTTCG 185
hsa-miR-107* AGCTTCTTTACAGTGTTGCCTTGT 175
hsa-miR-495* GAAGTTGCCCATGTTATTTTCG 158
hsa-miR-758* ATGGTTGACCAGAGAGCACACG 143
hsa-miR-181b-2* ACTCACTGATCAATGAATGCAAA 124
hsa-miR-212* ACCTTGGCTCTAGACTGCTTACTG 110
hsa-miR-1185-2* ATATACAGGGGGAGACTCTCAT 96
hsa-miR-544* TCTTGTTAAAAAGCAGATTCT 87
hsa-miR-134* CTGTGGGCCACCTAGTCACCAA 80
hsa-miR-874* CGGCCCCACGCACCAGGGTAAGA 68
hsa-miR-513c* TAAATTTCACCTTTCTGAGAAGA 65
hsa-miR-1255a* AACTATCTTCTTTGCTCATCCTTG 61
hsa-miR-301b* GCTCTGACGAGGTTGCACTACT 59
hsa-miR-450a-2* ATTGGGGACATTTTGCATTCAT 55
hsa-miR-98* CTATACAACTTACTACTTTCC 52
hsa-miR-656* AGGTTGCCTGTGAGGTGTTCA 49
hsa-miR-433* TACGGTGAGCCTGTCATTATTC 42
hsa-miR-660* ACCTCCTGTGTGCATGGATTACA 42
hsa-miR-4424* GTCCATTTCAAGTTAACTCTGT 41
hsa-miR-496* GGTTGTCCATGGTGTGTTCATT 38
hsa-miR-548j* CAAAAACTGCATTACTTTTGCA 38
Table S 8. List of conserved predicted target genes for new miRNAs with read count over
500. Conserved target sites were predicted using TargetScan and filtered according to the
context score. Conserved predictions associated to top 25% scores were reported below.
miRNA Symbol #Conserved
Syte miRNA Symbol
#Conserved Syte
hsa-let-7c* ABCC5 1 hsa-miR-181b-1* STXBP5L 1
hsa-let-7c* ACVR1B 1 hsa-miR-181b-1* TAB2 1
hsa-let-7c* ACVR2A 1 hsa-miR-181b-1* TAF5 1
hsa-let-7c* ADAM19 1 hsa-miR-181b-1* TAOK3 1
hsa-let-7c* ADAMTSL1 2 hsa-miR-181b-1* TASP1 1
hsa-let-7c* ADAMTSL3 1 hsa-miR-181b-1* TBC1D9 1
hsa-let-7c* ADCY6 1 hsa-miR-181b-1* TFRC 1
hsa-let-7c* ADNP 1 hsa-miR-181b-1* TIPARP 1
hsa-let-7c* AKAP1 1 hsa-miR-181b-1* TM9SF3 1
hsa-let-7c* ANKRD12 1 hsa-miR-181b-1* TMEM26 1

151
hsa-let-7c* APC 1 hsa-miR-181b-1* TRA2A 1
hsa-let-7c* ARHGAP29 1 hsa-miR-181b-1* TRIM55 1
hsa-let-7c* ARID1B 1 hsa-miR-181b-1* TSC1 1
hsa-let-7c* ARID4B 2 hsa-miR-181b-1* TSN 1
hsa-let-7c* ARIH2 1 hsa-miR-181b-1* TTC33 1
hsa-let-7c* ARNT 1 hsa-miR-181b-1* UBA6 1
hsa-let-7c* ASAP1 1 hsa-miR-181b-1* UBE3C 1
hsa-let-7c* ASCL1 2 hsa-miR-181b-1* UBQLN2 1
hsa-let-7c* ATP1B1 1 hsa-miR-181b-1* USP50 1
hsa-let-7c* ATP2B4 1 hsa-miR-181b-1* VSNL1 1
hsa-let-7c* AUTS2 1 hsa-miR-181b-1* YWHAG 2
hsa-let-7c* AXIN1 1 hsa-miR-181b-1* ZNF804A 1
hsa-let-7c* B4GALT5 1 hsa-miR-301a* AP2B1 1
hsa-let-7c* BBC3 1 hsa-miR-301a* BMP2 1
hsa-let-7c* BCL11A 1 hsa-miR-301a* BNC2 1
hsa-let-7c* BCL7A 1 hsa-miR-301a* CCNT2 1
hsa-let-7c* BMI1 1 hsa-miR-301a* CDC23 1
hsa-let-7c* BNC2 1 hsa-miR-301a* CHD9 1
hsa-let-7c* BRD4 1 hsa-miR-301a* CUL3 1
hsa-let-7c* BTBD7 1 hsa-miR-301a* DDX3Y 1
hsa-let-7c* BTG1 1 hsa-miR-301a* EGR1 1
hsa-let-7c* C10orf140 1 hsa-miR-301a* EIF2S2 1
hsa-let-7c* C14orf43 1 hsa-miR-301a* ELOVL6 1
hsa-let-7c* C5orf53 1 hsa-miR-301a* FAM46A 1
hsa-let-7c* C7orf42 1 hsa-miR-301a* FOXJ2 1
hsa-let-7c* CACNA2D2 1 hsa-miR-301a* GABPA 1
hsa-let-7c* CALM2 1 hsa-miR-301a* GPR3 1
hsa-let-7c* CD9 1 hsa-miR-301a* HNF1B 2
hsa-let-7c* CDC27 1 hsa-miR-301a* KIAA1737 1
hsa-let-7c* CDC42SE2 1 hsa-miR-301a* KIAA2022 1
hsa-let-7c* CDH11 1 hsa-miR-301a* KLF12 1
hsa-let-7c* CDKN1C 1 hsa-miR-301a* MAP2K4 1
hsa-let-7c* CDYL 1 hsa-miR-301a* NFYB 1
hsa-let-7c* CELF5 1 hsa-miR-301a* NR2C2 1
hsa-let-7c* CITED2 2 hsa-miR-301a* NTM 1
hsa-let-7c* CLK1 1 hsa-miR-301a* NUAK1 1
hsa-let-7c* CLK2 1 hsa-miR-301a* OLFM3 1
hsa-let-7c* CLK4 1 hsa-miR-301a* PACRG 1
hsa-let-7c* COL13A1 1 hsa-miR-301a* PITPNB 1
hsa-let-7c* COLEC12 1 hsa-miR-301a* PKIA 1
hsa-let-7c* CREB5 1 hsa-miR-301a* RAB12 1
hsa-let-7c* CRMP1 1 hsa-miR-301a* RAB1A 1
hsa-let-7c* CSMD2 1 hsa-miR-301a* RRAS2 1
hsa-let-7c* CUL3 1 hsa-miR-301a* SERBP1 1
hsa-let-7c* CYFIP2 1 hsa-miR-301a* SGMS1 1
hsa-let-7c* DACH1 1 hsa-miR-301a* SHOC2 1
hsa-let-7c* DEK 1 hsa-miR-301a* SLC44A1 1
hsa-let-7c* DKK1 1 hsa-miR-301a* SSR3 1

152
hsa-let-7c* DLX6 1 hsa-miR-301a* TMEM189 1
hsa-let-7c* DMD 1 hsa-miR-301a* TRAF3 1
hsa-let-7c* DNAJA2 2 hsa-miR-301a* UNC13B 1
hsa-let-7c* DNAJC8 1 hsa-miR-301a* VEZF1 1
hsa-let-7c* DOCK4 1 hsa-miR-301a* ZFX 1
hsa-let-7c* DSCAML1 1 hsa-miR-370* ACVR2A 1
hsa-let-7c* DYRK4 1 hsa-miR-370* BCL11A 1
hsa-let-7c* E2F3 1 hsa-miR-370* BCL2L11 1
hsa-let-7c* E2F4 1 hsa-miR-370* C11orf87 1
hsa-let-7c* EIF4B 1 hsa-miR-370* CADM2 1
hsa-let-7c* ELL 1 hsa-miR-370* CCDC6 1
hsa-let-7c* ELMO1 1 hsa-miR-370* CEACAM1 1
hsa-let-7c* ELOVL5 1 hsa-miR-370* CEBPG 1
hsa-let-7c* EP300 1 hsa-miR-370* EIF2S1 1
hsa-let-7c* ERBB2IP 1 hsa-miR-370* FAM110B 1
hsa-let-7c* FAM108C1 1 hsa-miR-370* FAM193A 1
hsa-let-7c* FAM160B1 1 hsa-miR-370* FAM98A 1
hsa-let-7c* FAM49B 1 hsa-miR-370* FBXL7 1
hsa-let-7c* FAM60A 1 hsa-miR-370* HIF1A 1
hsa-let-7c* FAM76B 2 hsa-miR-370* HNRNPA0 1
hsa-let-7c* FBN2 1 hsa-miR-370* MCAM 1
hsa-let-7c* FBXL3 1 hsa-miR-370* NEK9 1
hsa-let-7c* FBXO21 1 hsa-miR-370* ORMDL2 1
hsa-let-7c* FBXO38 1 hsa-miR-370* PAPD7 1
hsa-let-7c* FBXW11 1 hsa-miR-370* PPP2R5A 1
hsa-let-7c* FERMT2 1 hsa-miR-370* PRKAB1 1
hsa-let-7c* FGF18 1 hsa-miR-370* RAB3GAP2 1
hsa-let-7c* FGF7 1 hsa-miR-370* RBM9 1
hsa-let-7c* FLI1 1 hsa-miR-370* SH2D2A 1
hsa-let-7c* FLRT2 1 hsa-miR-370* SH2D4B 1
hsa-let-7c* FOXF1 1 hsa-miR-370* SORBS2 2
hsa-let-7c* FOXO1 1 hsa-miR-370* SPATS2L 1
hsa-let-7c* FXR1 1 hsa-miR-370* SRPR 1
hsa-let-7c* FZD1 1 hsa-miR-370* TCAP 1
hsa-let-7c* GABBR2 1 hsa-miR-370* YPEL2 1
hsa-let-7c* GDF6 1 hsa-miR-370* ZBTB44 1
hsa-let-7c* GJC1 1 hsa-miR-370* ZFC3H1 1
hsa-let-7c* GNAI1 1 hsa-miR-376a-2* ACVR1 1
hsa-let-7c* GOLGA1 1 hsa-miR-376a-2* C4orf40 1
hsa-let-7c* GOPC 1 hsa-miR-376a-2* C6orf195 1
hsa-let-7c* GPM6A 2 hsa-miR-376a-2* CAPRIN1 1
hsa-let-7c* GPR126 1 hsa-miR-376a-2* CAPZB 1
hsa-let-7c* GRB10 1 hsa-miR-376a-2* CD47 1
hsa-let-7c* GRIA3 1 hsa-miR-376a-2* CHD9 1
hsa-let-7c* GRIN3A 1 hsa-miR-376a-2* CHL1 1
hsa-let-7c* GRPEL2 1 hsa-miR-376a-2* CNRIP1 1
hsa-let-7c* GTPBP2 1 hsa-miR-376a-2* CSMD2 1
hsa-let-7c* HAPLN1 1 hsa-miR-376a-2* DAZAP1 1
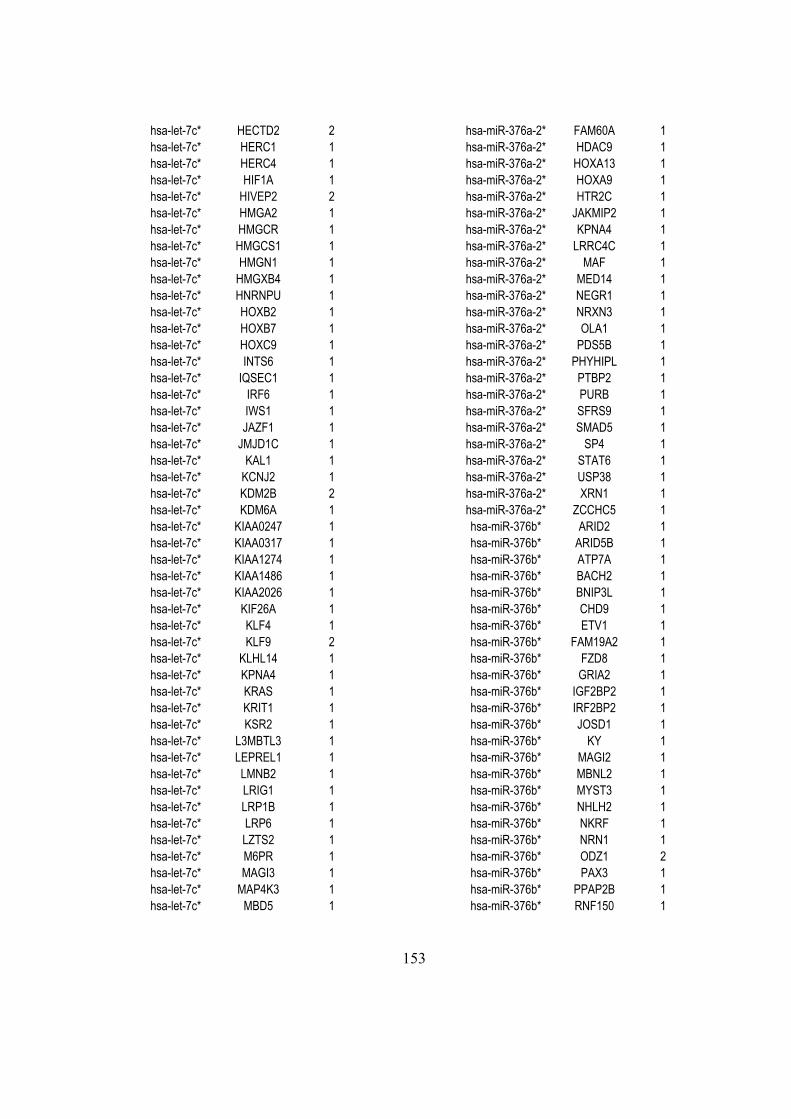
153
hsa-let-7c* HECTD2 2 hsa-miR-376a-2* FAM60A 1
hsa-let-7c* HERC1 1 hsa-miR-376a-2* HDAC9 1
hsa-let-7c* HERC4 1 hsa-miR-376a-2* HOXA13 1
hsa-let-7c* HIF1A 1 hsa-miR-376a-2* HOXA9 1
hsa-let-7c* HIVEP2 2 hsa-miR-376a-2* HTR2C 1
hsa-let-7c* HMGA2 1 hsa-miR-376a-2* JAKMIP2 1
hsa-let-7c* HMGCR 1 hsa-miR-376a-2* KPNA4 1
hsa-let-7c* HMGCS1 1 hsa-miR-376a-2* LRRC4C 1
hsa-let-7c* HMGN1 1 hsa-miR-376a-2* MAF 1
hsa-let-7c* HMGXB4 1 hsa-miR-376a-2* MED14 1
hsa-let-7c* HNRNPU 1 hsa-miR-376a-2* NEGR1 1
hsa-let-7c* HOXB2 1 hsa-miR-376a-2* NRXN3 1
hsa-let-7c* HOXB7 1 hsa-miR-376a-2* OLA1 1
hsa-let-7c* HOXC9 1 hsa-miR-376a-2* PDS5B 1
hsa-let-7c* INTS6 1 hsa-miR-376a-2* PHYHIPL 1
hsa-let-7c* IQSEC1 1 hsa-miR-376a-2* PTBP2 1
hsa-let-7c* IRF6 1 hsa-miR-376a-2* PURB 1
hsa-let-7c* IWS1 1 hsa-miR-376a-2* SFRS9 1
hsa-let-7c* JAZF1 1 hsa-miR-376a-2* SMAD5 1
hsa-let-7c* JMJD1C 1 hsa-miR-376a-2* SP4 1
hsa-let-7c* KAL1 1 hsa-miR-376a-2* STAT6 1
hsa-let-7c* KCNJ2 1 hsa-miR-376a-2* USP38 1
hsa-let-7c* KDM2B 2 hsa-miR-376a-2* XRN1 1
hsa-let-7c* KDM6A 1 hsa-miR-376a-2* ZCCHC5 1
hsa-let-7c* KIAA0247 1 hsa-miR-376b* ARID2 1
hsa-let-7c* KIAA0317 1 hsa-miR-376b* ARID5B 1
hsa-let-7c* KIAA1274 1 hsa-miR-376b* ATP7A 1
hsa-let-7c* KIAA1486 1 hsa-miR-376b* BACH2 1
hsa-let-7c* KIAA2026 1 hsa-miR-376b* BNIP3L 1
hsa-let-7c* KIF26A 1 hsa-miR-376b* CHD9 1
hsa-let-7c* KLF4 1 hsa-miR-376b* ETV1 1
hsa-let-7c* KLF9 2 hsa-miR-376b* FAM19A2 1
hsa-let-7c* KLHL14 1 hsa-miR-376b* FZD8 1
hsa-let-7c* KPNA4 1 hsa-miR-376b* GRIA2 1
hsa-let-7c* KRAS 1 hsa-miR-376b* IGF2BP2 1
hsa-let-7c* KRIT1 1 hsa-miR-376b* IRF2BP2 1
hsa-let-7c* KSR2 1 hsa-miR-376b* JOSD1 1
hsa-let-7c* L3MBTL3 1 hsa-miR-376b* KY 1
hsa-let-7c* LEPREL1 1 hsa-miR-376b* MAGI2 1
hsa-let-7c* LMNB2 1 hsa-miR-376b* MBNL2 1
hsa-let-7c* LRIG1 1 hsa-miR-376b* MYST3 1
hsa-let-7c* LRP1B 1 hsa-miR-376b* NHLH2 1
hsa-let-7c* LRP6 1 hsa-miR-376b* NKRF 1
hsa-let-7c* LZTS2 1 hsa-miR-376b* NRN1 1
hsa-let-7c* M6PR 1 hsa-miR-376b* ODZ1 2
hsa-let-7c* MAGI3 1 hsa-miR-376b* PAX3 1
hsa-let-7c* MAP4K3 1 hsa-miR-376b* PPAP2B 1
hsa-let-7c* MBD5 1 hsa-miR-376b* RNF150 1
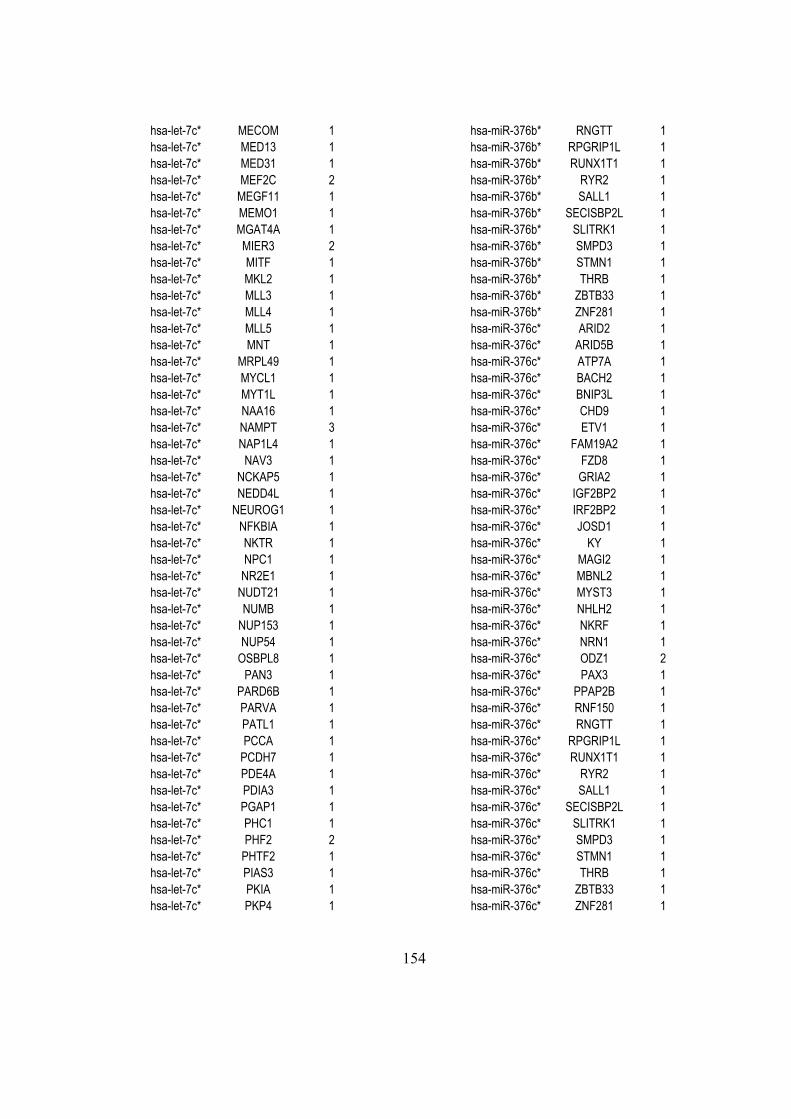
154
hsa-let-7c* MECOM 1 hsa-miR-376b* RNGTT 1
hsa-let-7c* MED13 1 hsa-miR-376b* RPGRIP1L 1
hsa-let-7c* MED31 1 hsa-miR-376b* RUNX1T1 1
hsa-let-7c* MEF2C 2 hsa-miR-376b* RYR2 1
hsa-let-7c* MEGF11 1 hsa-miR-376b* SALL1 1
hsa-let-7c* MEMO1 1 hsa-miR-376b* SECISBP2L 1
hsa-let-7c* MGAT4A 1 hsa-miR-376b* SLITRK1 1
hsa-let-7c* MIER3 2 hsa-miR-376b* SMPD3 1
hsa-let-7c* MITF 1 hsa-miR-376b* STMN1 1
hsa-let-7c* MKL2 1 hsa-miR-376b* THRB 1
hsa-let-7c* MLL3 1 hsa-miR-376b* ZBTB33 1
hsa-let-7c* MLL4 1 hsa-miR-376b* ZNF281 1
hsa-let-7c* MLL5 1 hsa-miR-376c* ARID2 1
hsa-let-7c* MNT 1 hsa-miR-376c* ARID5B 1
hsa-let-7c* MRPL49 1 hsa-miR-376c* ATP7A 1
hsa-let-7c* MYCL1 1 hsa-miR-376c* BACH2 1
hsa-let-7c* MYT1L 1 hsa-miR-376c* BNIP3L 1
hsa-let-7c* NAA16 1 hsa-miR-376c* CHD9 1
hsa-let-7c* NAMPT 3 hsa-miR-376c* ETV1 1
hsa-let-7c* NAP1L4 1 hsa-miR-376c* FAM19A2 1
hsa-let-7c* NAV3 1 hsa-miR-376c* FZD8 1
hsa-let-7c* NCKAP5 1 hsa-miR-376c* GRIA2 1
hsa-let-7c* NEDD4L 1 hsa-miR-376c* IGF2BP2 1
hsa-let-7c* NEUROG1 1 hsa-miR-376c* IRF2BP2 1
hsa-let-7c* NFKBIA 1 hsa-miR-376c* JOSD1 1
hsa-let-7c* NKTR 1 hsa-miR-376c* KY 1
hsa-let-7c* NPC1 1 hsa-miR-376c* MAGI2 1
hsa-let-7c* NR2E1 1 hsa-miR-376c* MBNL2 1
hsa-let-7c* NUDT21 1 hsa-miR-376c* MYST3 1
hsa-let-7c* NUMB 1 hsa-miR-376c* NHLH2 1
hsa-let-7c* NUP153 1 hsa-miR-376c* NKRF 1
hsa-let-7c* NUP54 1 hsa-miR-376c* NRN1 1
hsa-let-7c* OSBPL8 1 hsa-miR-376c* ODZ1 2
hsa-let-7c* PAN3 1 hsa-miR-376c* PAX3 1
hsa-let-7c* PARD6B 1 hsa-miR-376c* PPAP2B 1
hsa-let-7c* PARVA 1 hsa-miR-376c* RNF150 1
hsa-let-7c* PATL1 1 hsa-miR-376c* RNGTT 1
hsa-let-7c* PCCA 1 hsa-miR-376c* RPGRIP1L 1
hsa-let-7c* PCDH7 1 hsa-miR-376c* RUNX1T1 1
hsa-let-7c* PDE4A 1 hsa-miR-376c* RYR2 1
hsa-let-7c* PDIA3 1 hsa-miR-376c* SALL1 1
hsa-let-7c* PGAP1 1 hsa-miR-376c* SECISBP2L 1
hsa-let-7c* PHC1 1 hsa-miR-376c* SLITRK1 1
hsa-let-7c* PHF2 2 hsa-miR-376c* SMPD3 1
hsa-let-7c* PHTF2 1 hsa-miR-376c* STMN1 1
hsa-let-7c* PIAS3 1 hsa-miR-376c* THRB 1
hsa-let-7c* PKIA 1 hsa-miR-376c* ZBTB33 1
hsa-let-7c* PKP4 1 hsa-miR-376c* ZNF281 1
155
hsa-let-7c* PLEKHA5 1 hsa-miR-381* DDN 1
hsa-let-7c* PLS3 1 hsa-miR-381* PTPRU 1
hsa-let-7c* PPIP5K1 1 hsa-miR-382* AHCYL1 1
hsa-let-7c* PPP1R12A 1 hsa-miR-382* B4GALT5 1
hsa-let-7c* PPP1R3B 1 hsa-miR-382* BTRC 1
hsa-let-7c* PPP1R8 1 hsa-miR-382* C18orf34 1
hsa-let-7c* PPP1R9A 1 hsa-miR-382* CACNA1C 1
hsa-let-7c* PPP2R5C 2 hsa-miR-382* CFTR 1
hsa-let-7c* PPP3CB 1 hsa-miR-382* COL24A1 1
hsa-let-7c* PPP3R1 1 hsa-miR-382* CSMD3 1
hsa-let-7c* PRDM10 1 hsa-miR-382* EGR3 1
hsa-let-7c* PRKCE 1 hsa-miR-382* EIF4H 1
hsa-let-7c* PRPF40A 1 hsa-miR-382* ENAH 1
hsa-let-7c* PSMG2 1 hsa-miR-382* FZD4 1
hsa-let-7c* PTMA 1 hsa-miR-382* G3BP1 1
hsa-let-7c* PTPRB 1 hsa-miR-382* GJA1 1
hsa-let-7c* PUM1 1 hsa-miR-382* GPR85 1
hsa-let-7c* PUS7 1 hsa-miR-382* JAZF1 1
hsa-let-7c* QSER1 1 hsa-miR-382* LMO3 1
hsa-let-7c* R3HDM1 1 hsa-miR-382* MAPK6 1
hsa-let-7c* RAB10 1 hsa-miR-382* MEX3C 1
hsa-let-7c* RAB40B 1 hsa-miR-382* NFYB 1
hsa-let-7c* RAPGEF2 1 hsa-miR-382* NLGN1 1
hsa-let-7c* RBM16 1 hsa-miR-382* NOVA1 1
hsa-let-7c* RBM23 1 hsa-miR-382* NR3C1 1
hsa-let-7c* RBM27 1 hsa-miR-382* PARD6B 1
hsa-let-7c* RBM5 1 hsa-miR-382* PLAGL2 1
hsa-let-7c* RCAN2 1 hsa-miR-382* PRKD1 1
hsa-let-7c* RDX 1 hsa-miR-382* QKI 1
hsa-let-7c* REV1 1 hsa-miR-382* QSER1 1
hsa-let-7c* RGS7BP 1 hsa-miR-382* RC3H1 1
hsa-let-7c* RLF 1 hsa-miR-382* SFRS13A 1
hsa-let-7c* RNF139 1 hsa-miR-382* SNRK 1
hsa-let-7c* RNF38 1 hsa-miR-382* THRAP3 1
hsa-let-7c* RNPS1 1 hsa-miR-382* TRIM8 1
hsa-let-7c* ROPN1 1 hsa-miR-382* TRPS1 1
hsa-let-7c* RP11-35N6.1 2 hsa-miR-382* UBE2D2 1
hsa-let-7c* RPL29 1 hsa-miR-382* UBR3 1
hsa-let-7c* RRP1B 1 hsa-miR-382* YTHDF3 1
hsa-let-7c* RUNX2 1 hsa-miR-382* ZFC3H1 1
hsa-let-7c* RXRA 1 hsa-miR-382* ZNF10 1
hsa-let-7c* SAPS3 2 hsa-miR-382* ZNF281 1
hsa-let-7c* SCAMP5 1 hsa-miR-412* CCPG1 1
hsa-let-7c* SCRIB 1 hsa-miR-412* PCDH10 1
hsa-let-7c* SCRN1 1 hsa-miR-487a* AP3M1 1
hsa-let-7c* SCYL1 1 hsa-miR-487a* ATG2B 1
hsa-let-7c* SEC11A 1 hsa-miR-487a* CDC27 1
hsa-let-7c* SEC24D 1 hsa-miR-487a* CELF1 1
156
hsa-let-7c* SEPT3 1 hsa-miR-487a* CTNNA1 1
hsa-let-7c* SEPT7 1 hsa-miR-487a* CTNND2 1
hsa-let-7c* SERPINE2 1 hsa-miR-487a* DCX 1
hsa-let-7c* SERTAD4 1 hsa-miR-487a* DIXDC1 1
hsa-let-7c* SF3B3 1 hsa-miR-487a* GDF10 1
hsa-let-7c* SLAIN2 1 hsa-miR-487a* GRIA1 1
hsa-let-7c* SLC25A26 1 hsa-miR-487a* LAMC1 1
hsa-let-7c* SLC35D1 1 hsa-miR-487a* MAGT1 1
hsa-let-7c* SLC39A10 1 hsa-miR-487a* MECP2 1
hsa-let-7c* SLC5A12 1 hsa-miR-487a* NAP1L1 1
hsa-let-7c* SLC6A6 1 hsa-miR-487a* NUAK1 1
hsa-let-7c* SMARCC1 1 hsa-miR-487a* RSF1 1
hsa-let-7c* SMC6 1 hsa-miR-487a* SFRS2 1
hsa-let-7c* SNRPB2 1 hsa-miR-487a* SMARCA2 1
hsa-let-7c* SNRPD1 1 hsa-miR-487a* TPH2 1
hsa-let-7c* SNX25 1 hsa-miR-487a* UBE2D2 1
hsa-let-7c* SORBS2 1 hsa-miR-487a* UBTD2 1
hsa-let-7c* SORCS3 1 hsa-miR-487a* ZC3H7A 1
hsa-let-7c* SOX2 1 hsa-miR-539* ABTB2 1
hsa-let-7c* SOX3 1 hsa-miR-539* ANKS1B 1
hsa-let-7c* SOX4 1 hsa-miR-539* ARHGAP20 1
hsa-let-7c* SOX8 1 hsa-miR-539* ARHGAP26 1
hsa-let-7c* SP1 1 hsa-miR-539* ASAP2 1
hsa-let-7c* SP8 1 hsa-miR-539* ATP11C 1
hsa-let-7c* SPAST 1 hsa-miR-539* ATP8B1 1
hsa-let-7c* SREBF1 1 hsa-miR-539* BMI1 1
hsa-let-7c* SS18L1 1 hsa-miR-539* BOD1L 1
hsa-let-7c* STAG1 1 hsa-miR-539* C5orf41 1
hsa-let-7c* STAT5A 1 hsa-miR-539* C6orf106 1
hsa-let-7c* STX16 1 hsa-miR-539* CCNT2 1
hsa-let-7c* STXBP5L 1 hsa-miR-539* CHKA 1
hsa-let-7c* SUFU 1 hsa-miR-539* CNKSR3 1
hsa-let-7c* SUMO3 1 hsa-miR-539* CNR1 1
hsa-let-7c* SUZ12 1 hsa-miR-539* CREBZF 1
hsa-let-7c* SWAP70 1 hsa-miR-539* CSMD3 1
hsa-let-7c* SYVN1 1 hsa-miR-539* CUL4B 1
hsa-let-7c* TAB3 1 hsa-miR-539* DOCK4 1
hsa-let-7c* TACSTD2 1 hsa-miR-539* DYRK1A 1
hsa-let-7c* TANC1 1 hsa-miR-539* ENY2 1
hsa-let-7c* TBC1D12 1 hsa-miR-539* EVI5 1
hsa-let-7c* TBX18 1 hsa-miR-539* FSTL4 1
hsa-let-7c* TCERG1L 1 hsa-miR-539* GPM6A 1
hsa-let-7c* TCF4 1 hsa-miR-539* MAGI2 1
hsa-let-7c* THBD 1 hsa-miR-539* MEGF9 1
hsa-let-7c* THBS1 1 hsa-miR-539* NLK 1
hsa-let-7c* TLK1 2 hsa-miR-539* PDE4D 1
hsa-let-7c* TMEM2 1 hsa-miR-539* PDZD2 1
hsa-let-7c* TNFRSF11B 1 hsa-miR-539* PPP4R4 1
157
hsa-let-7c* TOX 1 hsa-miR-539* PRPF40A 1
hsa-let-7c* TP63 1 hsa-miR-539* PUM2 1
hsa-let-7c* TRA2B 1 hsa-miR-539* RC3H1 1
hsa-let-7c* TRIM2 1 hsa-miR-539* REPS2 1
hsa-let-7c* TRRAP 1 hsa-miR-539* RGS14 1
hsa-let-7c* TSHZ1 1 hsa-miR-539* RHOA 1
hsa-let-7c* UBE2E2 1 hsa-miR-539* RNF38 1
hsa-let-7c* UBE2F 1 hsa-miR-539* RNF44 1
hsa-let-7c* UBE2G1 1 hsa-miR-539* SEMA3C 1
hsa-let-7c* UBE2T 1 hsa-miR-539* SIRT1 1
hsa-let-7c* UBQLN2 1 hsa-miR-539* SMAD7 1
hsa-let-7c* USMG5 1 hsa-miR-539* SNRNP40 1
hsa-let-7c* UST 1 hsa-miR-539* SNX6 1
hsa-let-7c* VANGL2 1 hsa-miR-539* SOX9 1
hsa-let-7c* VEZF1 1 hsa-miR-539* SP3 1
hsa-let-7c* WDR33 1 hsa-miR-539* SPRED2 1
hsa-let-7c* WWC1 1 hsa-miR-539* STIM2 1
hsa-let-7c* YPEL2 1 hsa-miR-539* STYX 1
hsa-let-7c* ZBTB33 1 hsa-miR-539* TEAD1 1
hsa-let-7c* ZBTB39 1 hsa-miR-539* TMEM184B 1
hsa-let-7c* ZCCHC14 1 hsa-miR-539* TNPO1 1
hsa-let-7c* ZDHHC21 1 hsa-miR-539* TOP1 1
hsa-let-7c* ZHX2 1 hsa-miR-539* TRIB2 1
hsa-let-7c* ZHX3 1 hsa-miR-539* YPEL4 1
hsa-let-7c* ZIC5 1 hsa-miR-539* ZEB2 1
hsa-let-7c* ZNF638 1 hsa-miR-539* ZER1 1
hsa-let-7c* ZNF704 1 hsa-miR-539* ZNF217 1
hsa-let-7c* ZNF831 1 hsa-miR-561* ARHGAP5 1
hsa-let-7c* ZNRF3 1 hsa-miR-561* ASH1L 1
hsa-let-7c* ZZEF1 1 hsa-miR-561* BCL11B 1
hsa-miR-181b-1* ABCD3 1 hsa-miR-561* C9orf41 1
hsa-miR-181b-1* ACVR1C 1 hsa-miR-561* CCDC88A 1
hsa-miR-181b-1* ADCY6 1 hsa-miR-561* CLCN5 1
hsa-miR-181b-1* AHCYL1 1 hsa-miR-561* CNOT2 1
hsa-miR-181b-1* AKAP2 1 hsa-miR-561* DIP2B 1
hsa-miR-181b-1* ARHGAP5 1 hsa-miR-561* EIF3J 1
hsa-miR-181b-1* ARID1A 1 hsa-miR-561* ELOVL7 1
hsa-miR-181b-1* ARID1B 1 hsa-miR-561* FAM108B1 1
hsa-miR-181b-1* ARMC1 1 hsa-miR-561* FNTB 1
hsa-miR-181b-1* ATRX 2 hsa-miR-561* GALNT2 1
hsa-miR-181b-1* ATXN7L1 1 hsa-miR-561* GLO1 1
hsa-miR-181b-1* BPTF 1 hsa-miR-561* GOLT1A 1
hsa-miR-181b-1* C10orf140 1 hsa-miR-561* HIPK1 1
hsa-miR-181b-1* C11orf75 1 hsa-miR-561* HMGB1 1
hsa-miR-181b-1* C20orf194 1 hsa-miR-561* KCTD12 1
hsa-miR-181b-1* C21orf34 1 hsa-miR-561* KIAA0182 1
hsa-miR-181b-1* CA10 1 hsa-miR-561* KIT 1
hsa-miR-181b-1* CDC27 1 hsa-miR-561* LANCL3 1
158
hsa-miR-181b-1* CDK8 1 hsa-miR-561* MDGA2 1
hsa-miR-181b-1* CEP135 1 hsa-miR-561* MED1 1
hsa-miR-181b-1* CKS2 1 hsa-miR-561* MMP16 1
hsa-miR-181b-1* CPSF6 1 hsa-miR-561* NMNAT2 1
hsa-miR-181b-1* CSDE1 1 hsa-miR-561* NPAS4 1
hsa-miR-181b-1* CYR61 1 hsa-miR-561* NPEPPS 1
hsa-miR-181b-1* DDX3X 2 hsa-miR-561* ODZ1 1
hsa-miR-181b-1* DDX3Y 2 hsa-miR-561* PBRM1 1
hsa-miR-181b-1* DNAJB7 1 hsa-miR-561* PDE4DIP 1
hsa-miR-181b-1* E2F5 1 hsa-miR-561* PICALM 1
hsa-miR-181b-1* EIF4E 1 hsa-miR-561* PTPRB 1
hsa-miR-181b-1* FAF2 1 hsa-miR-561* RAC1 1
hsa-miR-181b-1* FAM176A 1 hsa-miR-561* RBM46 1
hsa-miR-181b-1* FNDC3B 1 hsa-miR-561* RDH10 1
hsa-miR-181b-1* FOXP1 1 hsa-miR-561* SDHC 1
hsa-miR-181b-1* FUT9 1 hsa-miR-561* SEC24A 1
hsa-miR-181b-1* GAPVD1 1 hsa-miR-561* SEPT7 1
hsa-miR-181b-1* GPATCH2 1 hsa-miR-561* SLC4A10 1
hsa-miR-181b-1* GRIA3 1 hsa-miR-561* SLC4A11 1
hsa-miR-181b-1* HECW2 1 hsa-miR-561* SMAD2 1
hsa-miR-181b-1* HELZ 1 hsa-miR-561* STK35 1
hsa-miR-181b-1* HEPACAM2 1 hsa-miR-561* SUZ12 1
hsa-miR-181b-1* KLF9 1 hsa-miR-561* TEAD1 1
hsa-miR-181b-1* KPNA1 1 hsa-miR-561* TRPC5 1
hsa-miR-181b-1* LMAN1 1 hsa-miR-561* TTN 1
hsa-miR-181b-1* MAMDC2 1 hsa-miR-561* WAPAL 1
hsa-miR-181b-1* MAP1B 1 hsa-miR-561* WDR26 1
hsa-miR-181b-1* MAPRE1 1 hsa-miR-561* WNT1 1
hsa-miR-181b-1* MATR3 1 hsa-miR-561* WWC3 1
hsa-miR-181b-1* MEF2C 1 hsa-miR-561* ZBTB47 1
hsa-miR-181b-1* MEX3B 1 hsa-miR-561* ZCCHC2 1
hsa-miR-181b-1* MIER3 1 hsa-miR-561* ZNF777 1
hsa-miR-181b-1* MOBKL1A 1 hsa-miR-561* ZNF804A 1
hsa-miR-181b-1* MYH10 1 hsa-miR-652* C8orf34 1
hsa-miR-181b-1* NAMPT 1 hsa-miR-652* CELF2 1
hsa-miR-181b-1* NAV3 1 hsa-miR-652* CPEB2 1
hsa-miR-181b-1* NHS 1 hsa-miR-652* ERBB4 1
hsa-miR-181b-1* NKAIN2 1 hsa-miR-652* FNBP1L 1
hsa-miR-181b-1* NMNAT2 1 hsa-miR-652* KHDRBS2 1
hsa-miR-181b-1* P4HA2 1 hsa-miR-652* KIAA1409 1
hsa-miR-181b-1* PALM2-AKAP2 1 hsa-miR-652* MACROD2 1
hsa-miR-181b-1* PDE4D 1 hsa-miR-652* MARCH4 1
hsa-miR-181b-1* PDE4DIP 1 hsa-miR-652* PAFAH1B1 1
hsa-miR-181b-1* PHC3 1 hsa-miR-652* PATZ1 1
hsa-miR-181b-1* PLCXD3 1 hsa-miR-652* PRKCA 1
hsa-miR-181b-1* PRDM10 1 hsa-miR-652* RCOR3 1
hsa-miR-181b-1* PTP4A2 1 hsa-miR-652* SNTB2 1

159
hsa-miR-181b-1* PURA 1 hsa-miR-652* TCF12 1
hsa-miR-181b-1* RAP2C 1 hsa-miR-652* TOP1 1
hsa-miR-181b-1* RER1 1 hsa-miR-652* TSPAN9 1
hsa-miR-181b-1* RIMKLB 1 hsa-miR-652* UBE2E2 1
hsa-miR-181b-1* RSRC2 1 hsa-miR-652* VEGFA 1
hsa-miR-181b-1* SEC11A 1 hsa-miR-652* YWHAG 1
hsa-miR-181b-1* SH2B2 1 hsa-miR-652* ZNF618 1
hsa-miR-181b-1* SLC1A2 1
hsa-miR-181b-1* SLITRK3 1
hsa-miR-181b-1* SON 1
hsa-miR-181b-1* SPTBN1 1


