Download - Measuring progress of the green economy
3
United Nations Environment ProgrammeP.O. Box 30552, Nairobi 00100 , Kenya
T: +254 (20) 762 1234F: +254 (20) 762 3927 E: [email protected]: www.unep.org
DRAFT WORKING PAPER
Acknowledgments This draft working paper was written by Andrea M. Bassi and Sheng Fulai, with contributions from Derek Eaton, Guido Sonnemann, Yacouba Gnegne and Joy Kim. Leigh-Ann Hurt, Ashibindu Singh, Ron Witt, Stefanos Fotiou and Jaap van Woerden provided comments. Kim Hyojoo provided research assistance. The views expressed in this paper do not necessarily represent those of UNEP. Copyright © United Nations Environment Programme, June 2012 This draft working paper may be reproduced in whole or in part and in any form for educational and non-profit purposes without special permission from the copyright holder, provided acknowledgement of the source is made. UNEP would appreciate receiving a copy of any publication that uses this publication as a source. No use of this draft working paper may be made for resale or for any other commercial purpose whatsoever without prior permission in writing from UNEP. Disclaimer The designations employed and the presentation of the material in this publication do not imply the expression of any opinion whatsoever on the part of the United Nations Environment Programme concerning the legal status of any country, territory, city or other area or of its authorities, or concerning delimitation of its frontiers or boundaries. Moreover, the views expressed do not necessarily represent the decision or stated policy of the United Nations Environment Programme, nor does citing of trade names or commercial processes constitute endorsement.
3
Measuring Progress towards a Green Economy
List of acronyms and abbreviations ............................................................................................ 4
Executive summary....................................................................................................................... 5
I. Introduction ........................................................................................................................... 6
II. Indicators for environmental issues and targets................................................................. 8
III. Indicators for policy interventions..................................................................................... 11
IV. Indicators for policy impacts on well-being and equity ................................................... 13 4.1 Well-being indicators...................................................................................................................... 14 4.2 Social equity indicators................................................................................................................... 16
V. Examples of policy instruments and related indicators ................................................... 19 5.1 Incentives ......................................................................................................................................... 19 5.2 Public procurement ........................................................................................................................ 19 5.3 Regulation........................................................................................................................................ 19 5.4 Education, training and skills development .................................................................................20
VI. Data needs and capacity building ...................................................................................... 21
VII. Ways forward...................................................................................................................... 23
References.................................................................................................................................... 25
4
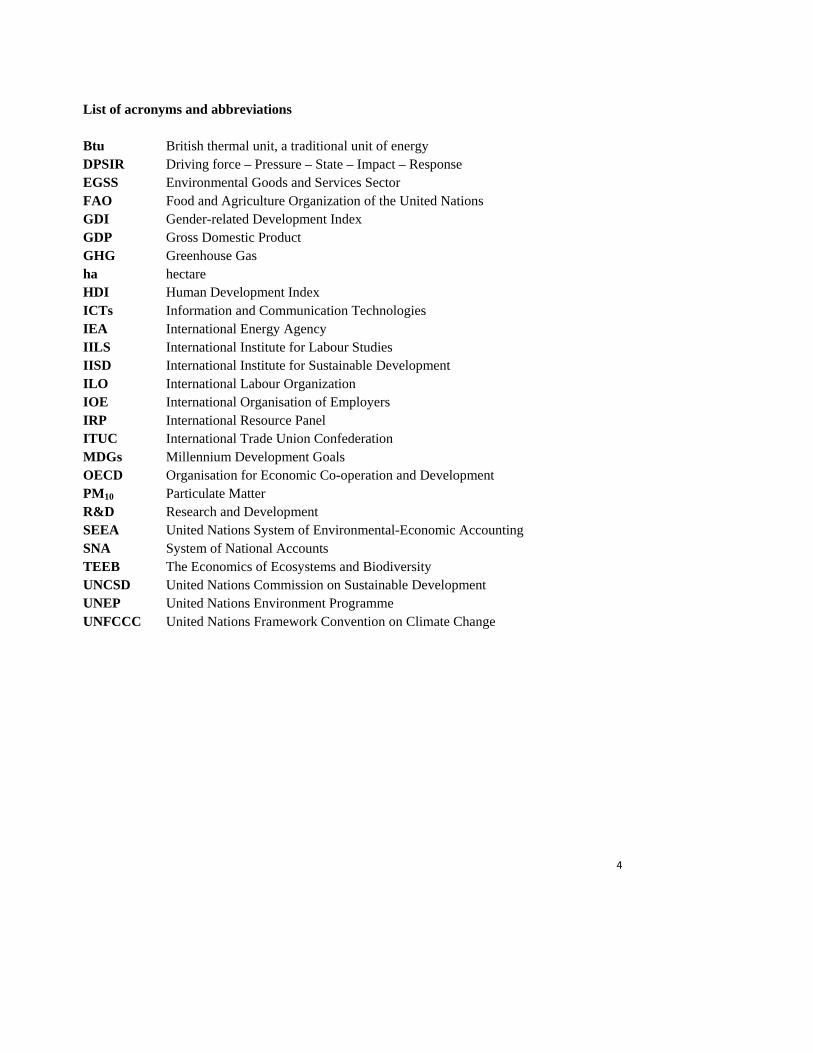
List of acronyms and abbreviations Btu British thermal unit, a traditional unit of energy DPSIR Driving force – Pressure – State – Impact – Response EGSS Environmental Goods and Services Sector FAO Food and Agriculture Organization of the United Nations GDI Gender-related Development Index GDP Gross Domestic Product GHG Greenhouse Gas ha hectare HDI Human Development Index ICTs Information and Communication Technologies IEA International Energy Agency IILS International Institute for Labour Studies IISD International Institute for Sustainable Development ILO International Labour Organization IOE International Organisation of Employers IRP International Resource Panel ITUC International Trade Union Confederation MDGs Millennium Development Goals OECD Organisation for Economic Co-operation and Development PM10 Particulate Matter R&D Research and Development SEEA United Nations System of Environmental-Economic Accounting SNA System of National Accounts TEEB The Economics of Ecosystems and Biodiversity UNCSD United Nations Commission on Sustainable Development UNEP United Nations Environment Programme UNFCCC United Nations Framework Convention on Climate Change
5
Executive summary The measurement of a green economy follows its definition. For the United Nations Environment Programme (UNEP), a green economy is one that results in improved human well-being and social equity while significantly reducing environmental risks and ecological scarcities. Various indicators are already available to reflect these aspects and show the extent to which progress has been made. A green economy is also considered more as a vehicle to deliver sustainable development than a destination in itself. Accordingly, indicators need to be placed in the context of making green economy policies and achieving sustainable development. Governments may choose environmental, economic or social issues as an entry point to adopting a green economy approach. For UNEP, it is natural to start with environmental issues. Indicators are needed to bring attention to the issues, set targets and track progress. From a global point of view, broad indicators could cover the areas of climate change, ecosystem management, resource efficiency, and chemicals and waste management. Within each of these areas, a few leading indicators may be identified. Under climate change, for example, the leading indicators may include carbon emissions, the share of renewable energy in the power supply, and energy consumption per capita. Once targets are established, policies are needed to address the issues and reach the target. In the green economy approach, a core policy instrument is the shift in investment towards green activities, to be supported by other enabling conditions such as fiscal reform, pricing policy, government procurement, and training for green skills. Indicators are available to show and track these policy ‘inputs’. Under fiscal policy, for example, indicators can show subsidy levels for fossil fuels, water and fisheries. Policies in a green economy approach are expected to not only address the main issues for which they are devised, but also generate co-benefits. If the issues we start with are environmental, then green economy policy interventions are expected to also contribute to human well-being and social equity. If we start with economic or social issues, similarly, policy interventions should generate co-benefits for other dimensions of sustainable development. Major components of well-being and social equity in connection with green economy policy interventions may include: employment, the growth of the environmental goods and services sector (EGSS) (because it would reduce environmental pressure, which would support improvement in human well-being), total wealth including human capital, natural capital and produced capital, access to key resources such as clean energy, water and sanitation, and health. Investing in clean technology, for example, is expected to generate jobs and income from the growth of the EGSS. Investing in ecosystem restoration is expected to enhance the value of natural capital, while training in green skills is expected to build up human capital, both adding to the total wealth of nations. For many countries, notably those in developing regions, it will be necessary to enhance their capacity to collect and evaluate data in order to use indicators in support of their policymaking for a green economy. Technical assistance and capacity building will be required in order to address the special needs of these countries and support the development of the necessary information systems.
6
I. Introduction In October 2008, UNEP launched a Green Economy Initiative consisting of research, advocacy and advisory services to governments. The objective is to motivate policymakers to support increased investments in environmentally significant sectors such as renewable energy, clean technologies, energy-efficient buildings, public transport, waste management and recycling, and sustainable management of land, water, forests, fisheries and tourism. To achieve this objective, the initiative focuses on demonstrating the contributions such ‘green’ investments can make to the growth of income and jobs and improved access by the poor to clean energy, safe water and sanitation, apart from reducing environmental pressure. As many countries are now embracing the green economy approach and designing related strategies, policies and investments, the issue of measurement has arisen. A typical question is how to measure a green economy. The answer to such a question demands an answer to the question of what is a green economy. UNEP defines a green economy as one that results in improved human well-being and social equity while significantly reducing environmental risks and ecological scarcities. Accordingly, human well-being and social equity as well as environmental risks and ecological scarcities need to be measured through indicators. Many elements of well-being and equity are already covered by existing indicators, such as those tracking the Millennium Development Goals (MDGs), the Human Development Index (HDI), and the set of Sustainable Development Indicators. Many elements of environmental risks and ecological scarcities are also covered by existing indicators, such as biophysical capacity, ecological footprints, greenhouse gas (GHG) emissions, air and water pollution, stocks of natural capital, and natural resource productivity (including energy). As illustrated in a United Nations interagency report on green economy1 and in the inter-governmental negotiations of the Rio+20 outcome document, there is growing consensus that a green economy should not be considered as a destination, but as one means of achieving sustainable development and poverty eradication. Based on this perspective, the measurement of a green economy need not only focus on the state of a green economy and how it is reached; it can also focus on the way a green economy as an approach is applied in policymaking processes to deliver such a global agenda. A major operational element of a green economy as an approach is its emphasis on: shifting public and private investments towards clean technologies and the strengthening of ecosystem services and the overall natural resource base; education and health services; and institutions that ensure social protection and equity. These policies and investments are also expected to generate income and jobs. The corresponding investment, income and job indicators, as well as policies such as subsidies and taxes, are largely available to capture such operational dimensions of a green economy.
1 United Nations Environment Management Group 2011.
7
This brochure introduces a framework for the use of indicators in developing and tracking green economy policies. The objective is to provide brief guidance on the use of indicators in major stages of policymaking using environmental issues as an illustrative entry point. Section 2 introduces the indicators for environmental issues and targets. Section 3 discusses indicators for environmental policy interventions. Section 4 focuses on indicators that show the impacts of policy interventions on well-being and social equity beyond the environmental realm. Examples of policies and the indicators that can be utilized to evaluate them are presented in section 5. Data needs and capacity building issues are highlighted in section 6, and the final section points to the next steps that could facilitate the use of this framework. Although the framework proposed in this brochure could be generally applied to countries in different regions and at different stages of development, the indicators illustrated here could and should be customized by all governments to meet their respective needs when embarking on a green economy approach. As each country faces unique issues that are heavily influenced by local context, the elaboration of how investments are to be undertaken, directed or stimulated needs to be tailored to local political, economic and institutional circumstances. Similarly, broad policy outcomes affecting well-being and social equity need to be defined and measured according to the local socio-economic and environmental context.
8
II. Indicators for environmental issues and targets Policymakers respond to priority issues or problems (including potential opportunities that may be missed if there is no policy intervention), which can range from environmental to economic and social realms, along with their interconnections. Indicators are a tool to identify, prioritize and track issues. They provide information on the historical and current state of the system, and highlight trends that can shed light on causality to better detect key drivers and pressures. The issue of climate change, for example, is reflected in the average temperature increase over the years, changes in precipitation patterns, and increasing sea levels. Indicators identifying underlying causes are often used to analyse policy issues. In the case of climate change, a core indicator is the concentration of carbon dioxide in the atmosphere, which is in turn simultaneously influenced by its sources (e.g. burning of fossil fuels, energy consumption) and carbon sinks (e.g. forests, or biomass in general, and soils). For an issue to become a priority in a policymaking process, it needs to be properly explained and substantiated. Bundling it with other policy issues is also helpful so that various issues can be addressed through a single gateway. From the perspective of UNEP, which has the mandate to lead on global environmental issues, the starting point to address a green economy approach is the environment. An economy cannot be green without addressing environmental issues in their various manifestations at different geographic levels. Any organization or government, however, may well choose economic or social issues as its entry point, which is fully consistent with the green economy approach. The most fundamental requirement is that policies to address sustainability issues be designed in a way that generates co-benefits across the three domains of sustainable development. Most, if not all, environmental issues have economic causes. A major framework for representing and quantifying the relationship between the economy and the environment is the United Nations System of Environmental-Economic Accounting (SEEA)2 (see box 1). The Driving force – Pressure – State – Impact – Response (DPSIR) framework originally developed by the European Environment Agency, the Organization for Economic Co-operation and Development (OECD) and the United Nations Commission for Sustainable Development (UNCSD) is another framework relating environmental impacts to economic activity (see table 1). It provides a step-wise description of the causal chain between economic activity and impacts, such as loss of biodiversity, ecosystem degradation or diminished human welfare or well-being. A report by the International Resource Panel (IRP),3 for example, reviews and summarizes scientific work relevant to the environmental impacts of resource consumption and economic activities using the DPSIR framework as a basis. It identifies two major drivers of environmental pressure:
2 UN 2012. 3 UNEP 2010b.
9
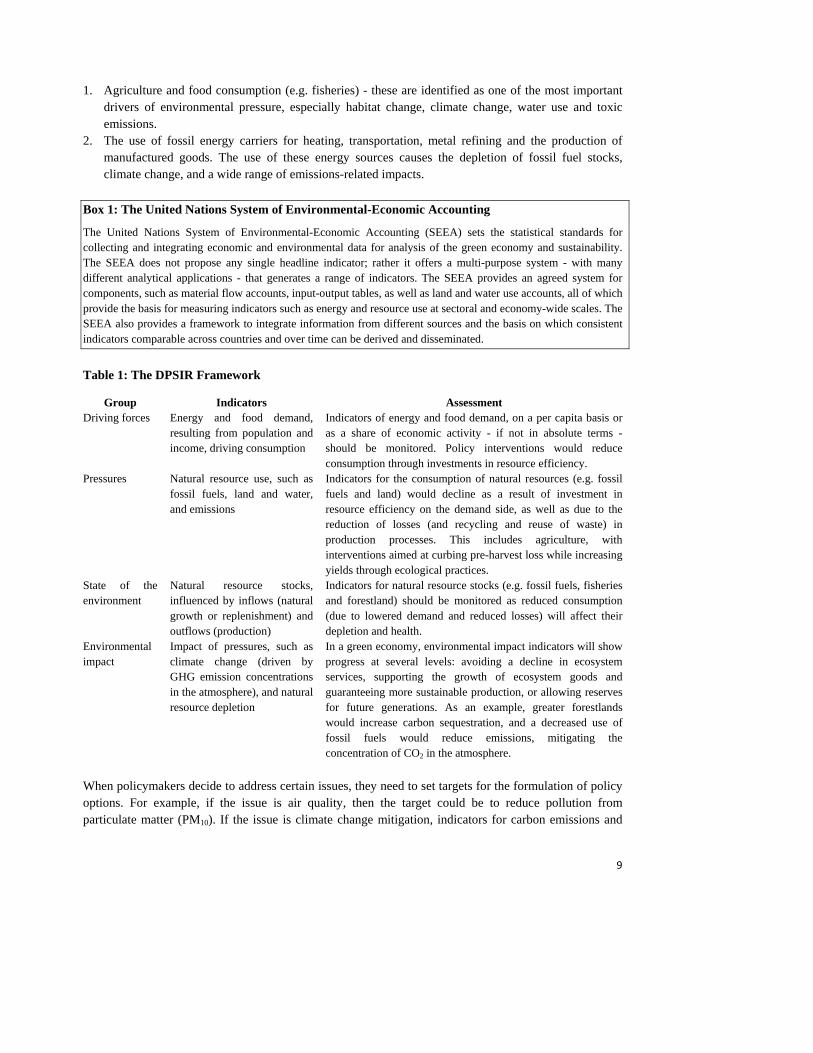
1. Agriculture and food consumption (e.g. fisheries) - these are identified as one of the most important drivers of environmental pressure, especially habitat change, climate change, water use and toxic emissions.
2. The use of fossil energy carriers for heating, transportation, metal refining and the production of manufactured goods. The use of these energy sources causes the depletion of fossil fuel stocks, climate change, and a wide range of emissions-related impacts.
Box 1: The United Nations System of Environmental-Economic Accounting
The United Nations System of Environmental-Economic Accounting (SEEA) sets the statistical standards for collecting and integrating economic and environmental data for analysis of the green economy and sustainability. The SEEA does not propose any single headline indicator; rather it offers a multi-purpose system - with many different analytical applications - that generates a range of indicators. The SEEA provides an agreed system for components, such as material flow accounts, input-output tables, as well as land and water use accounts, all of which provide the basis for measuring indicators such as energy and resource use at sectoral and economy-wide scales. The SEEA also provides a framework to integrate information from different sources and the basis on which consistent indicators comparable across countries and over time can be derived and disseminated. Table 1: The DPSIR Framework
Group Indicators Assessment Driving forces Energy and food demand,
resulting from population and income, driving consumption
Indicators of energy and food demand, on a per capita basis or as a share of economic activity - if not in absolute terms - should be monitored. Policy interventions would reduce consumption through investments in resource efficiency.
Pressures Natural resource use, such as fossil fuels, land and water, and emissions
Indicators for the consumption of natural resources (e.g. fossil fuels and land) would decline as a result of investment in resource efficiency on the demand side, as well as due to the reduction of losses (and recycling and reuse of waste) in production processes. This includes agriculture, with interventions aimed at curbing pre-harvest loss while increasing yields through ecological practices.
State of the environment
Natural resource stocks, influenced by inflows (natural growth or replenishment) and outflows (production)
Indicators for natural resource stocks (e.g. fossil fuels, fisheries and forestland) should be monitored as reduced consumption (due to lowered demand and reduced losses) will affect their depletion and health.
Environmental impact
Impact of pressures, such as climate change (driven by GHG emission concentrations in the atmosphere), and natural resource depletion
In a green economy, environmental impact indicators will show progress at several levels: avoiding a decline in ecosystem services, supporting the growth of ecosystem goods and guaranteeing more sustainable production, or allowing reserves for future generations. As an example, greater forestlands would increase carbon sequestration, and a decreased use of fossil fuels would reduce emissions, mitigating the concentration of CO2 in the atmosphere.
When policymakers decide to address certain issues, they need to set targets for the formulation of policy options. For example, if the issue is air quality, then the target could be to reduce pollution from particulate matter (PM10). If the issue is climate change mitigation, indicators for carbon emissions and
10
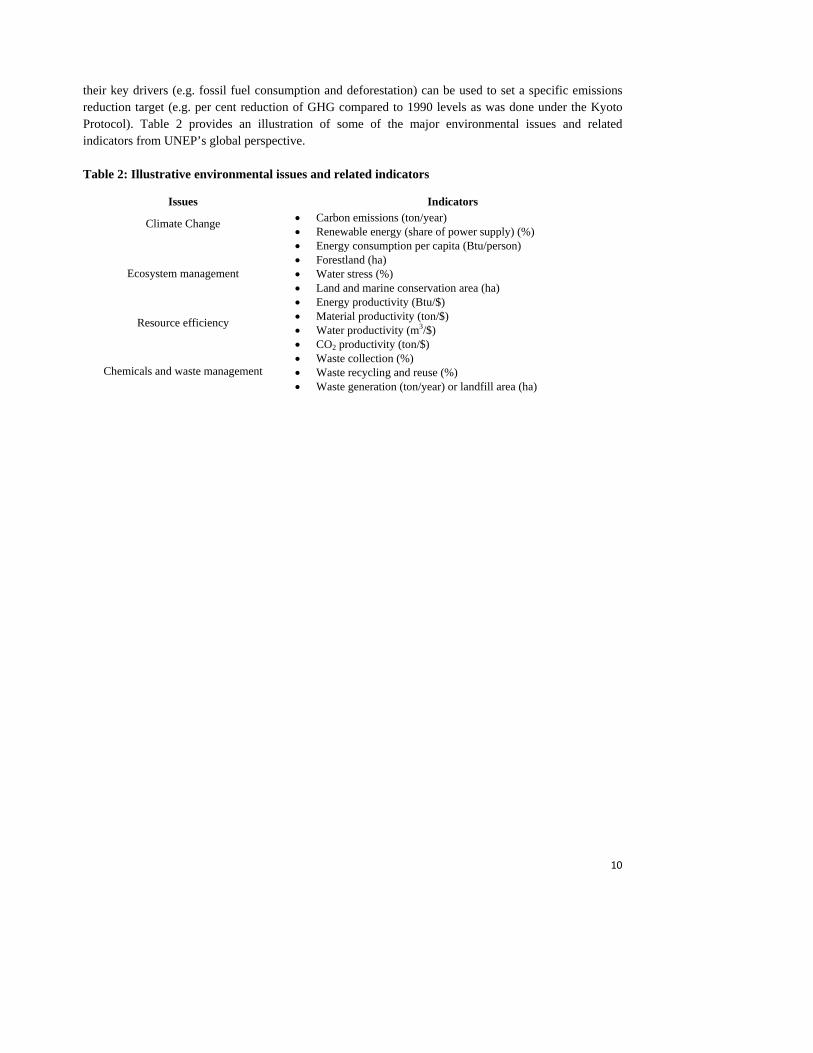
their key drivers (e.g. fossil fuel consumption and deforestation) can be used to set a specific emissions reduction target (e.g. per cent reduction of GHG compared to 1990 levels as was done under the Kyoto Protocol). Table 2 provides an illustration of some of the major environmental issues and related indicators from UNEP’s global perspective. Table 2: Illustrative environmental issues and related indicators
Issues Indicators
Climate Change
• Carbon emissions (ton/year) • Renewable energy (share of power supply) (%) • Energy consumption per capita (Btu/person)
Ecosystem management • Forestland (ha) • Water stress (%) • Land and marine conservation area (ha)
Resource efficiency
• Energy productivity (Btu/$) • Material productivity (ton/$) • Water productivity (m3/$) • CO2 productivity (ton/$)
Chemicals and waste management • Waste collection (%) • Waste recycling and reuse (%) • Waste generation (ton/year) or landfill area (ha)
11
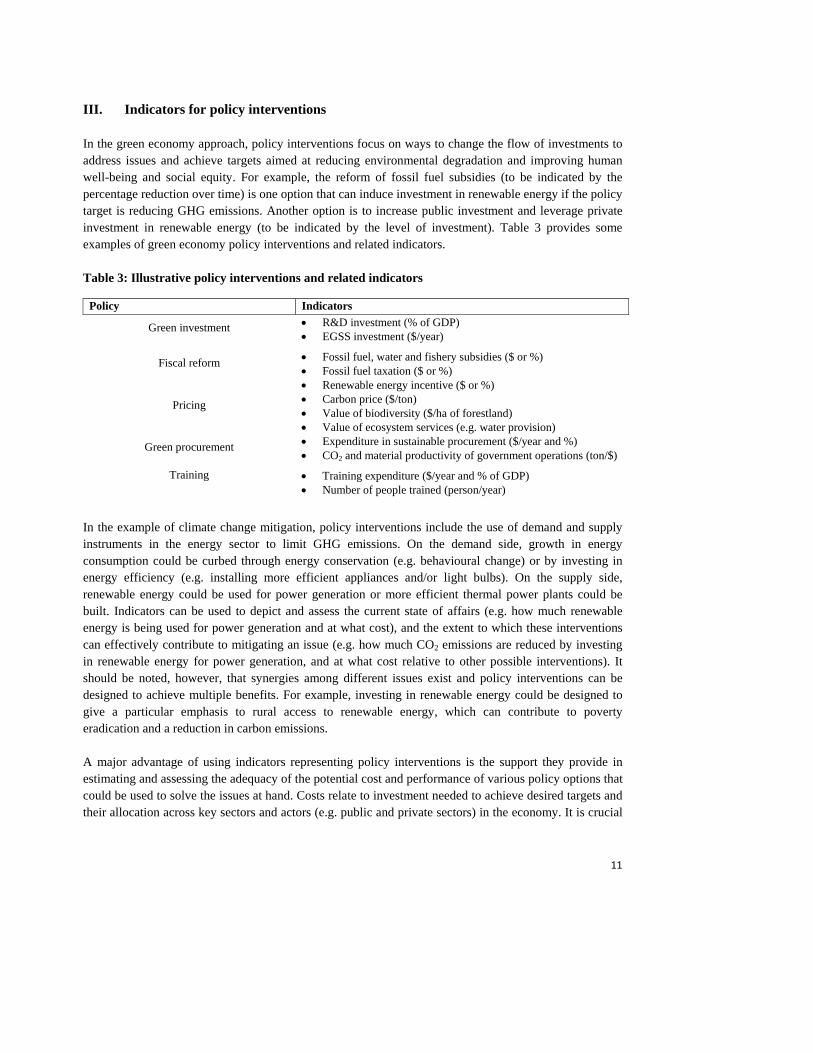
III. Indicators for policy interventions In the green economy approach, policy interventions focus on ways to change the flow of investments to address issues and achieve targets aimed at reducing environmental degradation and improving human well-being and social equity. For example, the reform of fossil fuel subsidies (to be indicated by the percentage reduction over time) is one option that can induce investment in renewable energy if the policy target is reducing GHG emissions. Another option is to increase public investment and leverage private investment in renewable energy (to be indicated by the level of investment). Table 3 provides some examples of green economy policy interventions and related indicators. Table 3: Illustrative policy interventions and related indicators
Policy Indicators
Green investment
• R&D investment (% of GDP) • EGSS investment ($/year)
Fiscal reform
• Fossil fuel, water and fishery subsidies ($ or %) • Fossil fuel taxation ($ or %) • Renewable energy incentive ($ or %)
Pricing
• Carbon price ($/ton) • Value of biodiversity ($/ha of forestland) • Value of ecosystem services (e.g. water provision)
Green procurement • Expenditure in sustainable procurement ($/year and %) • CO2 and material productivity of government operations (ton/$)
Training
• Training expenditure ($/year and % of GDP) • Number of people trained (person/year)
In the example of climate change mitigation, policy interventions include the use of demand and supply instruments in the energy sector to limit GHG emissions. On the demand side, growth in energy consumption could be curbed through energy conservation (e.g. behavioural change) or by investing in energy efficiency (e.g. installing more efficient appliances and/or light bulbs). On the supply side, renewable energy could be used for power generation or more efficient thermal power plants could be built. Indicators can be used to depict and assess the current state of affairs (e.g. how much renewable energy is being used for power generation and at what cost), and the extent to which these interventions can effectively contribute to mitigating an issue (e.g. how much CO2 emissions are reduced by investing in renewable energy for power generation, and at what cost relative to other possible interventions). It should be noted, however, that synergies among different issues exist and policy interventions can be designed to achieve multiple benefits. For example, investing in renewable energy could be designed to give a particular emphasis to rural access to renewable energy, which can contribute to poverty eradication and a reduction in carbon emissions. A major advantage of using indicators representing policy interventions is the support they provide in estimating and assessing the adequacy of the potential cost and performance of various policy options that could be used to solve the issues at hand. Costs relate to investment needed to achieve desired targets and their allocation across key sectors and actors (e.g. public and private sectors) in the economy. It is crucial
12
to evaluate the required investment under an investment strategy (i.e. capital investment), particularly when a government intends to promote private investment through the implementation of subsidies or new regulations (e.g. mandates). Further, the performance of the investment has to be carefully monitored and assessed, taking into account the potential to deliver (e.g. the maximum theoretical energy savings brought about by a new technology as well as its potential uptake on the market). Finally, the net cost/savings of the intervention should be estimated, comparing upfront investment and benefits (including avoided costs) accrued over time. The use of simulation models for integrated analysis could support the assessment of expected impacts and results; it could also carry out a quantitative risk and uncertainty analysis.4 A cost-benefit analysis is necessary to evaluate the net investment required to reach set targets, by actor or sector or across the whole economy. This analysis would generally compare investment and benefits (including avoided costs), depending on the issue to be solved. Using the climate change mitigation policy example, the adoption of energy-efficient technology requires upfront investments, but will reduce energy consumption and expenditure while potentially creating new jobs. Benefits and avoided costs can be compared using historical and current performance indicators from the sector to assess whether the investment can be sustained and how the economic burden can be shared between the main actors impacted by the intervention. However, at the macroeconomic level, the microeconomic concept of cost needs to be correctly understood. At the economy-wide level, a dollar spent is a dollar earned; what needs to be considered is where to spend the dollar so that it generates the highest return in environmental, social and economic terms. The green economy approach is about identifying those areas where the highest return can be generated. Once the investment required is estimated, policymakers can design options to allocate the amount across key economic sectors. Options include capital investment, incentives and regulations. Indicators can be used to evaluate the best policy option (or mix of policies) that would not excessively impact a single actor (e.g. households). For instance, regulations (e.g. mandates), in the absence of incentives, imply that the private sector would be required to place all the investment needed to comply with law (e.g. such as in the case of a mandate for the share of renewable energy in power generation, or the introduction of standards for vehicle fuel efficiency). Household investment and disposable income indicators could be used to evaluate whether the new policy would require a considerable reallocation of resources (possibly reducing consumption and savings) that could lead to negative economic impacts. In such a case, incentives could be introduced by the government. The effectiveness of such an intervention could be evaluated and monitored using indicators for government accounts, particularly those relating to annual deficit and debt.
4 Integrated simulation models, such as Threshold T21 developed by the Millennium Institute and used for the analysis of the impact of green economy investment in UNEP’s Green Economy Report, can support a cross-sectoral assessment of the costs and impacts of green economy interventions – concretely informing policy formulation and evaluation.
13
IV. Indicators for policy impacts on well-being and equity At the policy formulation stage, different policy options need to be presented with their respective projected outcomes across the environmental, social and economic domains. The indicators for these outcomes are additional to the primary targets associated with the initial issues identified. For example, if the policy target is reducing CO2 emissions per unit of GDP by a certain percentage over some period and one of the policy options is to invest one per cent of GDP in solar and wind energy technologies each year for the next 10 years, then the project outcome indicators include not only the emission reduction target, but also other effects that can result from this intervention, such as changes to income and jobs. If the green economy is accepted as an approach for sustainable development and poverty eradication, then the existing framework for sustainable development indicators and indicators for the MDGs provide a sound basis for the broad outcome indicators in connection with green economy policy interventions. Consistent with the green economy strategy, which is cross-sectoral by nature, the estimation of the impact of policy interventions on well-being and equity should originate from integrated monitoring and evaluation processes. Given that limited information is available on the broader impact of green economy interventions ex ante, the use of an integrated simulation model can effectively inform decision-making by forecasting the possible impact of various policy interventions, under varying assumptions, on well-being and human development. In this respect, a cross-sectoral analysis that fully incorporates social, economic and environmental indicators, and the relations existing among them (characterized by feedbacks, delays and non-linearity) would be needed in order to provide a coherent evaluation of impacts (including synergies and side effects) across a variety of sectors and indicators. This booklet takes environmental issues as an entry point and focuses on policy interventions that address those issues while ensuring positive effects on human well-being and social equity, apart from environmental improvement. Related indicators therefore focus on well-being and equity. If the entry point focuses on economic or social issues, then the composition of policy impacts may vary and could focus on environmental improvement and social equity or environmental improvement and economic well-being.
14
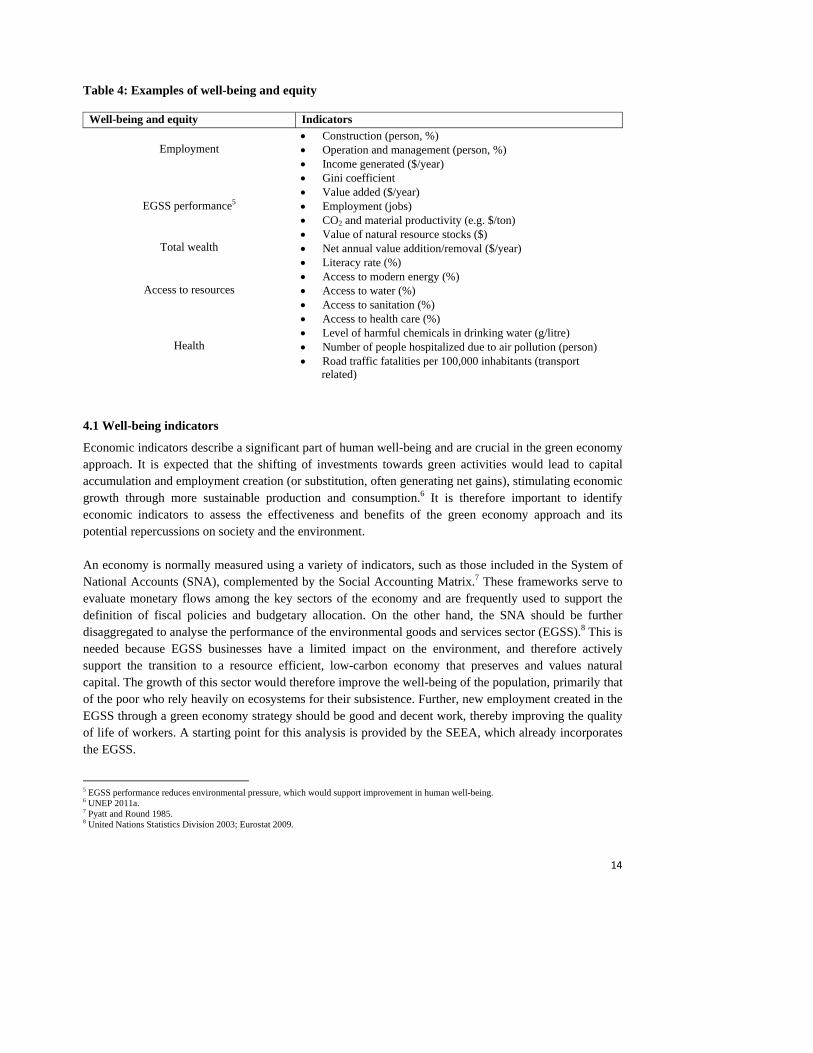
Table 4: Examples of well-being and equity
Well-being and equity Indicators
Employment
• Construction (person, %) • Operation and management (person, %) • Income generated ($/year) • Gini coefficient
EGSS performance5 • Value added ($/year) • Employment (jobs) • CO2 and material productivity (e.g. $/ton)
Total wealth • Value of natural resource stocks ($) • Net annual value addition/removal ($/year) • Literacy rate (%)
Access to resources
• Access to modern energy (%) • Access to water (%) • Access to sanitation (%) • Access to health care (%)
Health
• Level of harmful chemicals in drinking water (g/litre) • Number of people hospitalized due to air pollution (person) • Road traffic fatalities per 100,000 inhabitants (transport
related)
4.1 Well-being indicators
Economic indicators describe a significant part of human well-being and are crucial in the green economy approach. It is expected that the shifting of investments towards green activities would lead to capital accumulation and employment creation (or substitution, often generating net gains), stimulating economic growth through more sustainable production and consumption.6 It is therefore important to identify economic indicators to assess the effectiveness and benefits of the green economy approach and its potential repercussions on society and the environment. An economy is normally measured using a variety of indicators, such as those included in the System of National Accounts (SNA), complemented by the Social Accounting Matrix.7 These frameworks serve to evaluate monetary flows among the key sectors of the economy and are frequently used to support the definition of fiscal policies and budgetary allocation. On the other hand, the SNA should be further disaggregated to analyse the performance of the environmental goods and services sector (EGSS).8 This is needed because EGSS businesses have a limited impact on the environment, and therefore actively support the transition to a resource efficient, low-carbon economy that preserves and values natural capital. The growth of this sector would therefore improve the well-being of the population, primarily that of the poor who rely heavily on ecosystems for their subsistence. Further, new employment created in the EGSS through a green economy strategy should be good and decent work, thereby improving the quality of life of workers. A starting point for this analysis is provided by the SEEA, which already incorporates the EGSS.
5 EGSS performance reduces environmental pressure, which would support improvement in human well-being. 6 UNEP 2011a. 7 Pyatt and Round 1985. 8 United Nations Statistics Division 2003; Eurostat 2009.
15
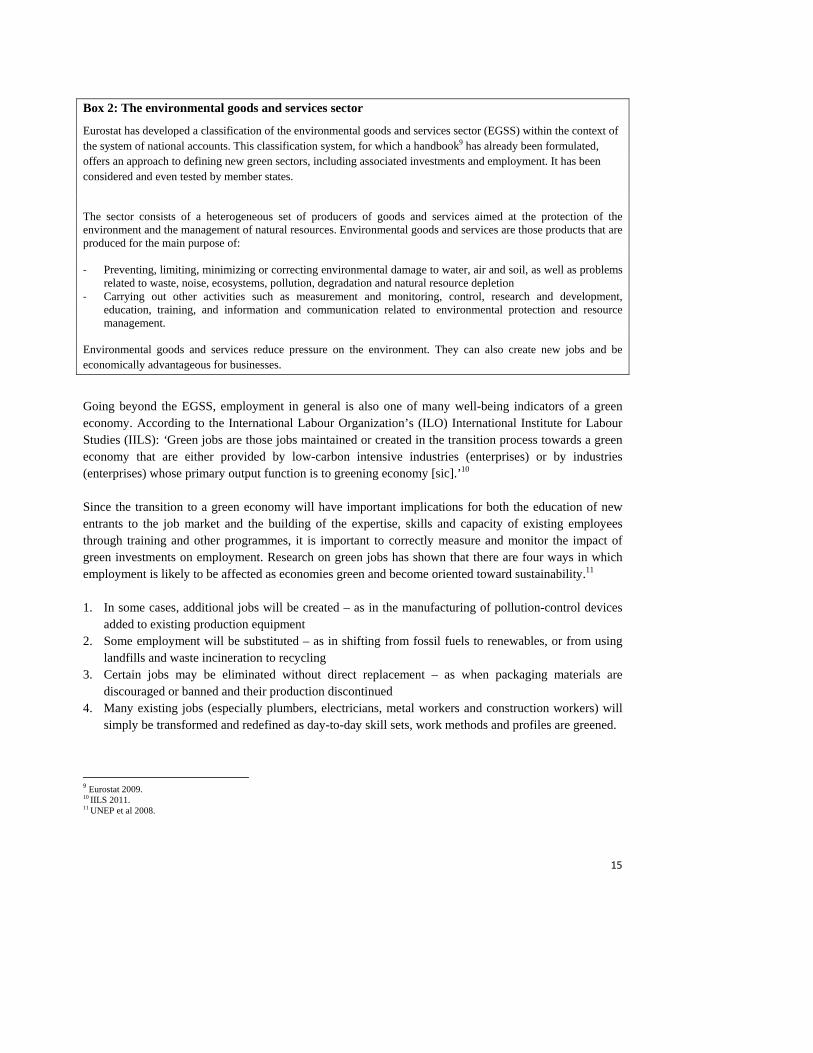
Box 2: The environmental goods and services sector
Eurostat has developed a classification of the environmental goods and services sector (EGSS) within the context of the system of national accounts. This classification system, for which a handbook9 has already been formulated, offers an approach to defining new green sectors, including associated investments and employment. It has been considered and even tested by member states.
The sector consists of a heterogeneous set of producers of goods and services aimed at the protection of the environment and the management of natural resources. Environmental goods and services are those products that are produced for the main purpose of: ‐ Preventing, limiting, minimizing or correcting environmental damage to water, air and soil, as well as problems
related to waste, noise, ecosystems, pollution, degradation and natural resource depletion ‐ Carrying out other activities such as measurement and monitoring, control, research and development,
education, training, and information and communication related to environmental protection and resource management.
Environmental goods and services reduce pressure on the environment. They can also create new jobs and be economically advantageous for businesses.
Going beyond the EGSS, employment in general is also one of many well-being indicators of a green economy. According to the International Labour Organization’s (ILO) International Institute for Labour Studies (IILS): ‘Green jobs are those jobs maintained or created in the transition process towards a green economy that are either provided by low-carbon intensive industries (enterprises) or by industries (enterprises) whose primary output function is to greening economy [sic].’10 Since the transition to a green economy will have important implications for both the education of new entrants to the job market and the building of the expertise, skills and capacity of existing employees through training and other programmes, it is important to correctly measure and monitor the impact of green investments on employment. Research on green jobs has shown that there are four ways in which employment is likely to be affected as economies green and become oriented toward sustainability.11 1. In some cases, additional jobs will be created – as in the manufacturing of pollution-control devices
added to existing production equipment 2. Some employment will be substituted – as in shifting from fossil fuels to renewables, or from using
landfills and waste incineration to recycling 3. Certain jobs may be eliminated without direct replacement – as when packaging materials are
discouraged or banned and their production discontinued 4. Many existing jobs (especially plumbers, electricians, metal workers and construction workers) will
simply be transformed and redefined as day-to-day skill sets, work methods and profiles are greened.
9 Eurostat 2009. 10 IILS 2011. 11 UNEP et al 2008.
16
Well-being indicators should be developed to capture the four elements above, including the nature of the employment created, lost and transformed – whether these jobs are green and decent. However, jobs in low-carbon or green industries are not necessarily safe and healthy jobs with adequate remuneration and social coverage. The dismantling and recycling of electronic parts by workers under conditions that do not meet recognized occupational health and safety standards would not qualify as green. The Green Jobs Report jointly published by UNEP, ILO, the International Trade Union Confederation (ITUC) and the International Organization of Employers (IOE) highlights that in addition to environmental considerations, green jobs also need to reflect ‘decent work’.12
Decent work is understood to:
• Be productive and secure • Ensure respect of labour rights • Provide an adequate income • Offer social protection, and • Include social dialogue, union freedom, collective bargaining and participation.
4.2 Social equity indicators
Social equity indicators refer to overall measures of human and social development, including dimensions such as poverty alleviation, equity, social inclusiveness, overall well-being, and inclusive wealth.13 They include a wide range of proposed sub-indicators, mostly to complement GDP with social, environmental and more detailed economic criteria. It should be empirically measurable and demonstrable that a green economy transition contributes to reducing poverty and enhancing social equality. Linking the pillars of sustainability suggests the use of measures of inclusive wealth. The green economy can have several direct and indirect positive impacts on human progress and well-being. These impacts - some of which are already measured and monitored by the MDGs - include: ‐ Direct social impact of interventions
• Improved access to energy and water (clean and potable), and improved sanitation - These can be achieved through efficiency measures that reduce the consumption of natural resources, creating the conditions for more sustainable consumption, both in terms of availability and quality (e.g. cleaner).
• Improved nutrition - Several studies indicate that agricultural yields would grow under ecological agriculture practices,14 increasing production and food available for consumption, or potentially reducing land use, and lowering pre-harvest losses.
12 UNEP et al. 2008. 13 Inclusive wealth, as developed in Arrow et al 2003, is where a nation can be seen as achieving sustainable development if social welfare (intergenerational well-being) is at least maintained. Social welfare is the aggregation of present value of all human well-being, current and future (including soil, water, biodiversity, buildings, education, etc.). The best available proxy for measuring social welfare is the measurement of the ‘value’ of all capital stocks (human, manufactured and natural). The sum of an economy’s capital stocks, weighted by their shadow prices for each capital component, is a measure of the country’s inclusive wealth. Therefore, a country is achieving sustainable development if its measure of inclusive wealth is non-declining. Hargroves, K. and M. Smith (2005). 14 Pretty, J. 2006.
Formatted: Space After: 0pt
17
• Increased employment, resulting in reduced poverty - Employment in emerging sectors is often higher than in consolidated ones, and natural capital conservation requires a dedicated and skilled workforce. This is the case of energy (if power capacity for renewables is produced domestically), and ecological agriculture practices, which are more labour intensive than conventional ones (+30%)15 and generate proportionally higher yield (between 74.7% and 83.7%).16
‐ Indirect social impact of interventions
• Reduced health problems and mortality due to (1) decreased use of fossil fuels for cooking in environments with low ventilation, (2) the shift to public transport modes as well as walking and cycling.
• Higher quality education and business-related skills, some of which would also contribute to improved Human Development Index (HDI) rankings and in many cases potentially better Gender-related Development Index (GDI) rankings as well.
• On top of HDI and GDI, several other aggregate indicators (e.g. MDGs) would improve under a green economy scenario. For instance, the conservation (or reduced use) of natural resource stocks would ensure that adjusted net savings would be higher.17
• The overall improved performance on social, economic and environmental indicators would lift the MDG indicators and other aggregate measures, such as the Genuine Progress Indicator.
It is worth noting that some of these indicators may be affected not only by direct and indirect impacts, but also by induced impacts of green economy interventions. These include higher - or more resilient and sustainable - economic growth, driven by lowered expenditure for the use of energy and water, generating more resources for the government (through taxation, resulting in higher budgetary expenditure) and households (increasing income and spending and/or investment and/or savings). Further to that, the ‘rebound effect’ is an additional example of a potentially indirect or induced impact. Evidence and studies suggest that higher GDP, income and access to water and energy would result in higher natural resource consumption intensity, thus potentially off-setting gains in resource productivity. Due to the many cross-sectoral impacts of green economy interventions, both direct and indirect, the use of a set of indicators is preferred to a composite index, especially concerning the evaluation of effects on well-being and equity. Box 3 summarizes the main challenges related to the use of a composite indicator, emphasizing the difficulty of objectively defining a rating system for the aggregate index and accounting for the interlinkages existing among key indicators.
15 Zieseme, J. 2007; Khan, Z. R. et al 2008. 16 Pretty, J. 2006. 17 Adjusted net savings are derived from the standard national accounting measure of gross saving by making four adjustments: (i) consumption of fixed capital is deducted to obtain net national saving; (ii) current public expenditure on education is added to account for investment in human capital; (iii) estimates of the depletion of a variety of natural resources are deducted to reflect the decline in asset values associated with extraction and depletion; (iv) deductions are made for damages from carbon dioxide and particulate emissions (World Bank 2002).
18
Box 3: Challenges of compound indicators
Due to the complexity of the socio-economic and environmental systems under analysis, populated by a variety of cross-sectoral relations and feedbacks, the assessment of progress towards sustainability with a single metric is a very difficult task. Attempting to do so is likely to send misleading policy messages, particularly if the compound indicators and indices are poorly constructed or misinterpreted. Since aggregated indices and rating systems are prone to subjectivity despite the relative objectivity of the methods employed in assessing sustainability, the existence of a value system is a prerequisite of any approach to measuring progress towards sustainability. However, the difficulty in either finding an absolute measure of value or obtaining consensus on which value system to use creates a controversy that so far has eluded resolution. Further, the models to be used should also capture interlinkages among indicators and phenomena considered. As a result, methodological pluralism coupled with stakeholder participation seems a safer and more objective way forward.18 If a particular policy option is adopted, then the associated outcome indicators will be used to monitor policy implementation and for evaluation at certain intervals or after the policy has been implemented. The differences between the projected outcomes and actual performance would inform future policy processes.
18 Hak, T. (2011).
19
V. Examples of policy instruments and related indicators To support and guide the transition to a green economy, public policies play a decisive role. This may take the form of incentives, regulation, or information and education. This section aims to highlight some of these policy options and related indicators. 5.1 Incentives
Governments can guide the behaviour of market participants through price signals by using economic incentive instruments such as pollution charge systems (taxes and fees), tradable permits, deposit refund systems, reduction of market barriers and phasing out of harmful subsidies. For example, by implementing feed-in tariffs for independent small producers of renewable energy, or reducing costs in mature sectors through incentives to transition to waste recycling and reuse in manufacturing, a government can encourage the transition to a green economy. Indicators can be used to evaluate and monitor the existence as well as the outcomes of policy incentives. These indicators include, for instance, share of taxes in end-use prices in the energy sector, production cost and market prices of certain goods and services (kept artificially low and potentially increasing), and their consumption (potentially decreasing if prices increase), as well as government account figures (for the foreseen reduction in public expenditure). 5.2 Public procurement
As an alternative to committing additional funding to the stimulation of the green economy, governments can also focus on how their existing spending is being used and foster sustainable public procurement.19 Indicators to monitor sustainable procurement include public expenditure on sustainable procurement. This may impact sectoral revenues and profits, which should be accrued more locally, employment creation, and reduced expenditures (such as on transport of goods and materials, by contracting local producers, but also costs for the operation and management of buildings, through efficiency improvements). The main areas that are currently impacted by sustainable public procurement include energy efficiency measures (e.g. double glazing and building insulation standards) and renewable energy supply (e.g. solar water heating and photovoltaic panels on rooftops). Sustainable procurement is already also extending to the use of products and materials (ranging from wood-based materials to metals employed in construction) produced domestically and/or sustainably (e.g. with a low-carbon profile).
5.3 Regulation
Regulatory mechanisms are an important tool in environmental policy. They can be effective in accelerating progress toward forest and land protection and cleaner water and air. For instance, a city may
19 Procurement of goods and services by governments and state-owned enterprises usually represents a large proportion of total public spending. Analysis in 2001 estimated that OECD countries spent between 13 and 20 per cent of their GDP on procurement of such goods and services. Although less data is available regarding procurement in developing countries, literature suggests similar and, in some cases, higher percentages (IISD 2008).
20
decide to achieve a certain level of environmental protection by adopting an air pollution, wastewater treatment or noise-level standard. It may also involve an obligation for new factories or new residential buildings to meet certain energy-efficiency standards. When regulatory tools are in place, they need to be monitored and well adjusted in order to achieve the policy objective at the least possible expense to the overall functioning of the economy. Governments can apply such a regulatory approach and will need to collect related statistics and compile indicators, although in general, information on regulation is of a qualitative nature and thus not always easy to evaluate. 5.4 Education, training and skills development
Transforming an economy into one that is resource-efficient and that produces optimal socio-economic results requires targeted policies and investments at levels ranging from society as a whole to individual citizens. For individuals, these would include targeting their ability to be employed productively and meaningfully in the economy and to adopt environmentally friendly behaviour in daily life. The use of quantitative indicators is important to understanding the social dimensions of a green economy and the potential impacts that educational interventions can have on poverty and well-being. Social impact, vulnerability and development opportunity metrics would be needed to identify eventual contributors, winners and losers. In a green economy scenario, these also depend on the choice of policies and related funding sources (e.g. public versus private), which may lead to synergies, but may also create side effects in certain contexts.
21
VI. Data needs and capacity building The development of a framework for indicators to inform all the key steps of policymaking using the green economy as an approach poses an important challenge: the needs and capacities of different countries, particularly developing countries, in collecting and evaluating the required data and developing appropriate indicators. Technical assistance and capacity building will be required in order to address the special needs of these countries and to support the development of the necessary information systems. Developing and implementing basic monitoring and data collection systems, be it statistical or based on remote sensing or other techniques, is a sine qua non. Improved access to information and communication technologies (ICTs) by these countries in the past decade has provided a unique platform and window of opportunity to initiate concrete actions in this respect.20 For example, as highlighted by the IRP, most countries use different approaches and data classification systems when defining and evaluating the impact of economic activities on the environment. In all areas (e.g. production, consumption, material flows) there is a significant opportunity to improve data and information by regularly providing more analysis and better data in an internationally consistent format. This would make it much easier to monitor progress, make cross-country and cross-sector analyses, and identify in more detail the economic drivers that are responsible for impacts and the factors that determine the success of policies. Comprehensive and harmonized data across countries and sectors are often not available. On the other hand, there are various international harmonized databases providing pieces of the overall picture, such as the International Energy Agency (IEA)’s energy database,21 the Food and Agriculture Organization of the United Nations (FAO) databases on land use, water use and agricultural production,22 and the United Nations Framework Convention on Climate Change (UNFCCC) greenhouse gas emission inventories.23 Along with these, there are various ongoing large research projects on data modelling and comparison, but these often lack a formal status. Overall there seems to be a clear window of opportunity to develop or improve harmonized integrated data sets in support of a green economy approach. In addition to supporting countries in building their capacity for basic data collection, international agencies could contribute to the further development of frameworks such as the SEEA and the Framework for Development of Environment Statistics, and by defining a clear framework to inform green economy policymaking processes and measuring progress towards sustainability. This requires programmatic support to national institutions from developing economies to improve their capacity to collect, organize, interpret and communicate relevant data.
20 The report Keeping promises, measuring results, produced in 2011 by the World Health Organization Commission on Information and Accountability for Women’s and Children’s Health, in conjunction with the International Telecommunications Union, highlighted the potential of ICTs to provide more accurate and timely data for monitoring and reviewing commitments, results and resources invested in improving women’s and children’s health at the global level (see www.everywomaneverychild.org). Similar approaches can be adopted to keep track and monitor green economy indicators. 21 Statistics of the International Energy Agency can be found at www.iea.org/stats/index.asp 22 Statistics of the Food and Agriculture Organization of the United Nations can be found at: www.fao.org/corp/statistics/en 23 Statistics of the United Nations Framework Convention on Climate Change can be found at: unfccc.int/ghg_data/items/3800.php

22
Public institutions can also learn from experience gained by responsible businesses in two main areas: (i) defining and applying core and additional indicators in their reporting systems; (ii) coupling the use of non-financial and financial information in emerging integrated reporting models.
23
VII. Ways forward In light of the upcoming Rio+20 – United Nations Conference on Sustainable Development - meeting and also considering the challenges currently being faced by most countries, decisive action is needed to move towards a greener and more sustainable future. Three key steps are necessary to effectively design solutions to current and upcoming challenges:
1. Identification of major sustainability issues, key causes and effects
2. Adoption of an integrated method for policymaking a. Development of a customized analysis framework b. Clear definition of key indicators c. Creation and collection of relevant data
3. Creation of capacity on data collection as well as on quantitative scenario analysis (modelling). Acknowledging that several indicators are available to measure a green economy and several proposals are emerging to assess progress towards sustainable development (e.g. from the UN Commission on Sustainable Development and the Bellagio Sustainability Assessment and Measurement Principles) this booklet focuses on the need for and use of indicators to better inform the policymaking needed to create and operationalize the green economy approach. As a consequence, it aims to contribute to the second of the three steps listed above. In this context, an immediate step that can be taken is a clear identification of the issues and the definition of the key indicators that can support green economy policymaking. Although certain overarching problems such as climate change affect all countries, such issues are generally of national nature. Thus international agreement should be sought on a framework for the use of indicators for the green economy approach, and possibly on a subset of core, or headline, indicators. This would facilitate international comparison and still allow for a high degree of customization at the country level, ensuring that all indicators are relevant for all countries and their respective circumstances. Of paramount importance is data collection and analysis. This is critical to the effectiveness of green economy policymaking and requires coordinated efforts to support developing countries in the creation of local capacity for data collection, analysis and communication. Skills in scenarios and systems analysis are also important to the effective carrying out of integrated policy formulation and evaluation exercises. At the request of governments, UNEP is providing green economy advisory services in 20 countries in Africa, Asia and the Pacific, Eastern Europe, Latin America and the Caribbean. The advisory services consist of policy advice, technical assistance and capacity building that are provided to countries in support of their national and regional efforts to transform and revitalize their economy. To be efficient and effective, an appropriate green economy measurement framework is needed to address the specific needs of policymakers in monitoring progress in this field of growing importance.

24
This booklet on green economy indicators takes a first step by identifying some tools that can help policymakers set their agenda and monitor progress in greening the economy. In this regard, it also constitutes a tool in the box of instruments UNEP is using to assist countries. More specifically, UNEP is ready to help countries define indicators and develop a national statistics framework in order to upgrade to the green economy and track progress.
25
References Arrow, K., P. Dasgupta, and K. Maler (2003): 'Evaluating Projects and Assessing Sustainable Development in Imperfect Economies', working paper of the Beijer International Institute of Ecological Economics, Stockholm. European Commission, International Monetary Fund, Organisation for Economic Co-operation and Development, United Nations, World Bank (2009): System of National Accounts 2008. Eurostat (2009): The Environmental Goods and Services Sector. A Data Collection Handbook. Hak, T. (2011): ‘Status report on composite indices of environmental sustainability’. Discussion Paper Prepared for UNEP and supervised by EWB/DEWA. Hargroves, K. and M. Smith (2005): The Natural Advantage of Nations: Business Opportunities, Innovation and Governance in the 21st Century, The Natural Edge Project, Earthscan, London. International Institute for Labour Studies (IILS) (2011): Defining “green”: Issues and considerations. IILS, International Institute for Sustainable Development (IISD) (2008): ‘Building Accountability and Transparency in Public Procurement’. IISD, Winnipeg. Khan, Z. R., C. A. O. Midega, D. M. Amudavi, E. M. Njuguna, J. W. Wanyama, and J. A. Pickett (2008): ‘Economic Performance of the “Push-Pull” Technology for Stemborer and Striga Control in Smallholder Farming Systems in Western Kenya’. Crop Protection 27: 1084-1097. OECD (2011): Towards Green Growth: Monitoring Progress, OECD Indicators. Pretty, J. (2006): ‘Agroecological Approaches to AgriculturalDevelopment’. Background paper for the World Development Report 2008. Putnam, R.D. (2004). ‘Education, diversity, social cohesion and “social capital” ’. Note for discussion submitted at the ‘Raising the quality of learning for all’ meeting of OECD education ministers, Dublin, 18-19. Pyatt G., and J. I. Round (1985): Social Accounting Matrices: A Basis for Planning. The World Bank, Washington D.C. The Economics of Ecosystems and Biodiversity (TEEB) (2010): Mainstreaming the economics of nature: A synthesis of the approach, conclusions and recommendations of TEEB. United Nations Environment Management Group (2011): Working Towards a Balanced and Inclusive Green Economy, A United Nations System-wide Perspective. United Nations Environment Programme (UNEP), International Labour Organization (ILO), International Organisation of Employers (IOE) and International Trade Union Confederation (ITUC) (2008): Green Jobs: Towards Decent Work in a Sustainable, Low-carbon World. UNEP, Geneva. United Nations Environment Programme (UNEP) (2009): Integrated Policymaking for Sustainable Development, A Reference Manual.
26
United Nations Environment Programme (UNEP) (2010a): Assessing the Environmental Impacts of Consumption and Production: Priority Products and Materials. A Report of the Working Group on the Environmental Impacts of Products and Materials to the International Panel for Sustainable Resource Management. Hertwich, E., E. van der Voet, S. Suh, A. Tukker, M. Huijbregts, P. Kazmierczyk, M. Lenzen, J. McNeely, Y. Moriguchi. United Nations Environment Programme (UNEP) (2010b): Assessing the Environmental Impacts of Consumption and Production: Priority Products and Materials. A Report of the Working Group on the Environmental Impacts of Products and Materials to the International Panel for Sustainable Resource Management. Hertwich, E., van der Voet, S. Suh, A. Tukker, M. Huijbregts, P. Kazmierczyk, M. Lenzen, J. McNeely, Y. Moriguchi. United Nations Environment Programme (UNEP) (2011a): Towards a Green Economy: Enabling Conditions Supporting the Transition to a Global Green Economy. United Nations Environment Programme (UNEP) (2011b): Towards a Green Economy: Pathways to Sustainable Development and Poverty Eradication. United Nations Environment Programme (UNEP) (2011c): Decoupling natural resource use and environmental impacts from economic growth. A Report of the Working Group on Decoupling to the International Resource Panel (IRP). Fischer-Kowalski, M., M. Swilling, E. U. von Weizsäcker, Y. Ren, Y. Moriguchi, W. Crane, F. Krausmann, F., N. Eisenmenger, S. Giljum, P. Hennicke, P. Romero Lankao, A. Siriban Manalang, S. Sewerin. United Nations Environment Management Group (2011): Working towards a Balanced and Inclusive Green Economy: A United Nations System-wide Perspective. United Nations, Geneva. See http://www.environmenthouse.ch/?q=fr/events/inter-agency-report-green-economy-presentation United Nations Environment Programme (UNEP) (2012): Green Economy Briefing Paper, Metrics & Indicators. United Nations Statistics Division (2003): Handbook of Integrated Environmental and Economic Accounting (SEEA). United Nations, New York. United Nations Statistics Division (2007): Extension of the Handbook on Integrated Environmental and Economic Accounting to Water (SEEA-W). United Nations, New York. World Bank (2002): Manual for Calculating Adjusted Net Savings, Environment Department. Bolt, K, M. Matete, and M. Clemens, World Bank: Washington DC. World Bank (2010): World Development Report 2010, Development and Climate Change. World Bank, Washington D.C. World Health Organization (2011): Keeping promises, measuring results. Produced by the Commission on Information and Accountability for Women’s and Children’s Health. See www.everywomaneverychild.org. Zieseme, J. (2007): ‘Energy Use in Organic Food Systems’. FAO International Conference on Organic Agriculture and Food Security. 3-5 May 2007. Rome.

United Nations Environment ProgrammeP.O. Box 30552, Nairobi 00100 , Kenya
T: +254 (20) 762 1234F: +254 (20) 762 3927 E: [email protected]: www.unep.org
For more information, contact:UNEP DTIEEconomics and Trade Branchchemin des Anémones 11-131219 Châtelaine/GenevaSwitzerlandT: +41 (0)22 917 82 43F: +41 (0)22 917 80 76www.unep.org/greeneconomy


