Measuring Michigan’s Graduation & Dropout
Rates
The Impact of the Four-Year Cohort
Margaret Merlyn Ropp Ph.D., DirectorCenter for Educational Performance & Information
Impetus for Change … The No Child Left Behind Act requires states to
use a graduation rate that tracks students from the beginning of high school to completion of a regular diploma in four years.
The National Governors Association convened a task force to help states develop a standard methodology to measure high school graduation rates.
All 50 governors committed to adopting the four-year cohort methodology to track state graduation rates.
Michigan will be the 17th state to implement the NGA Graduation Rate Compact.
What is a Cohort Rate ?
The Four-Year Cohort Rate tracks students starting in the 9th grade
Students are assigned to a cohort when they first start 9th grade.
The cohort is a group of students expected to graduate in the same year.
First-time 9th graders during the 2003-04 school year were assigned to the 2007 cohort.
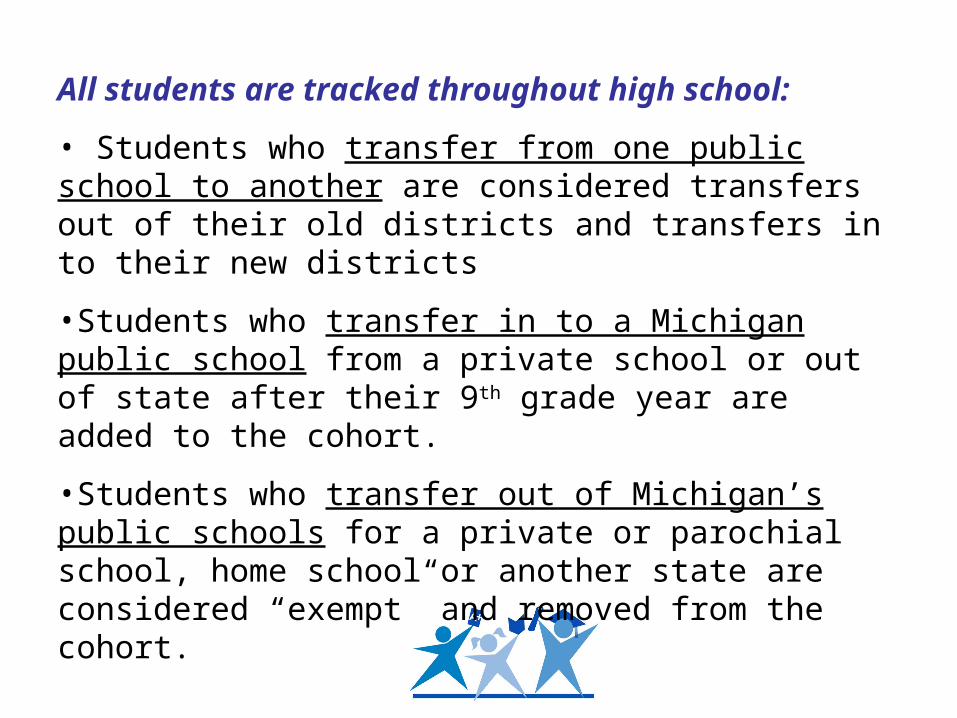
All students are tracked throughout high school:
• Students who transfer from one public school to another are considered transfers out of their old districts and transfers in to their new districts
•Students who transfer in to a Michigan public school from a private school or out of state after their 9th grade year are added to the cohort.
•Students who transfer out of Michigan’s public schools for a private or parochial school, home school or another state are considered “exempt” and removed from the cohort.
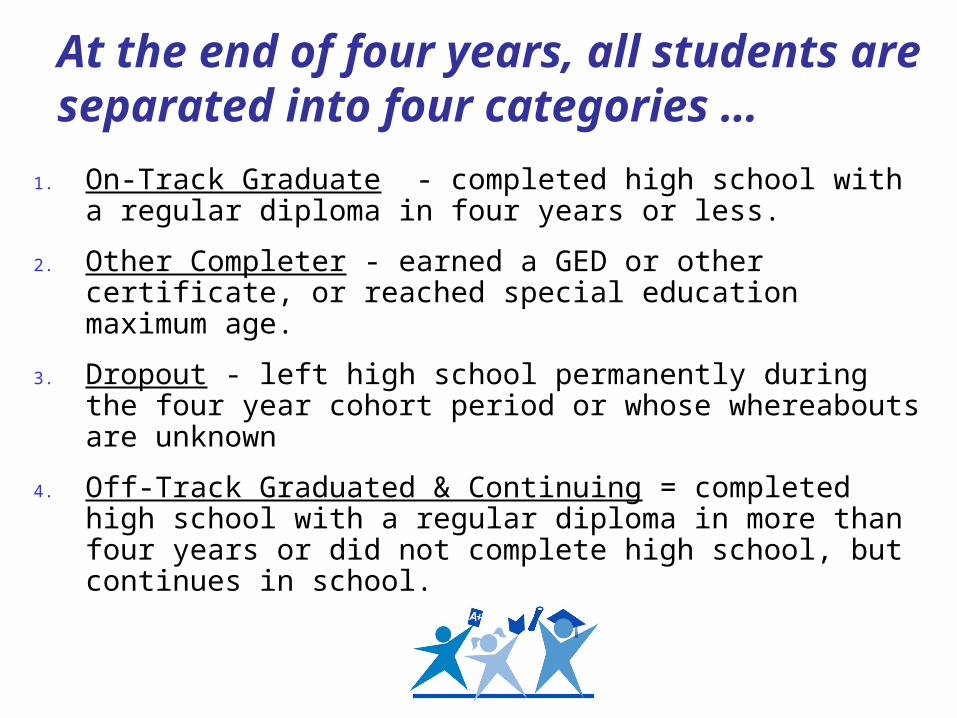
At the end of four years, all students are separated into four categories …
1. On-Track Graduate - completed high school with a regular diploma in four years or less.
2. Other Completer - earned a GED or other certificate, or reached special education maximum age.
3. Dropout - left high school permanently during the four year cohort period or whose whereabouts are unknown
4. Off-Track Graduated & Continuing = completed high school with a regular diploma in more than four years or did not complete high school, but continues in school.
The cohort total for a school or district is the
total number of students in these four categories.
Calculating a
Four-Year Cohort
Graduation Rate
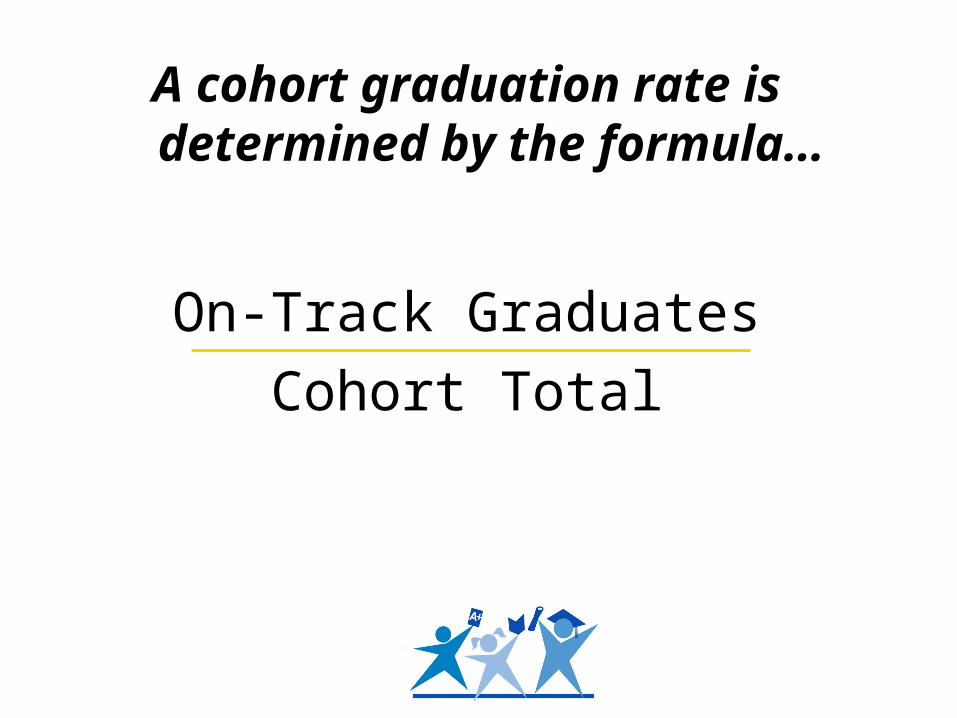
A cohort graduation rate is determined by the
formula…
On-Track GraduatesCohort Total
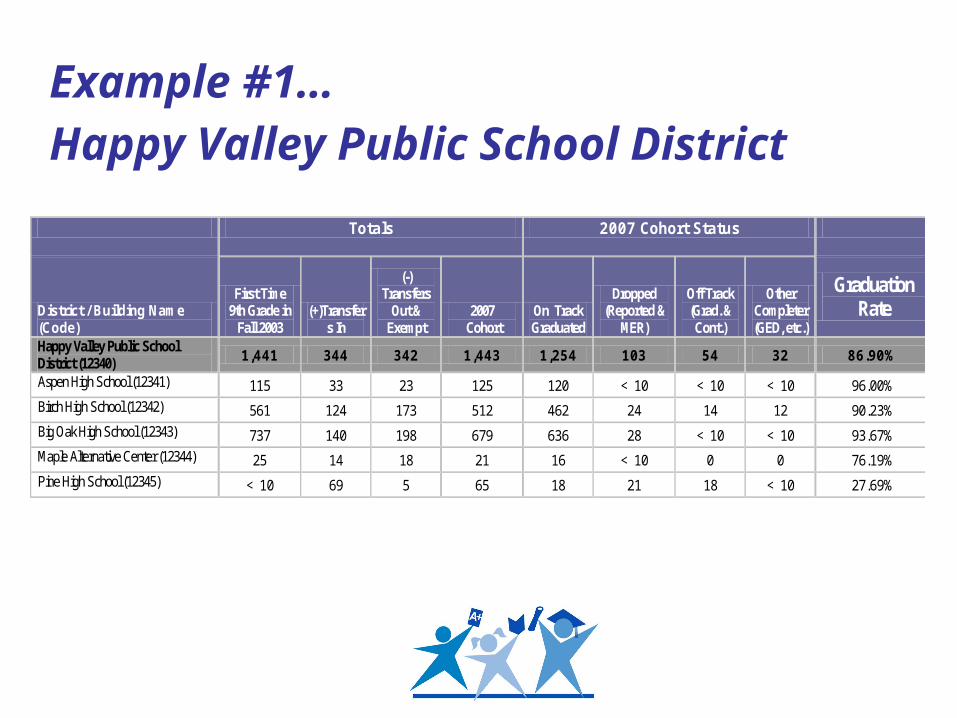
Example #1…Happy Valley Public School District
Totals 2007 Cohort Status
District / Building Name (Code)
First Time 9th Grade in
Fall 2003 (+)Transfer
s In
(-) Transfers
Out & Exempt
2007 Cohort
On Track Graduated
Dropped (Reported &
MER)
Off Track (Grad. & Cont.)
Other Completer (GED, etc.)
Graduation Rate
Happy Valley Public School District (12340) 1,441 344 342 1,443 1,254 103 54 32 86.90%
Aspen High School (12341) 115 33 23 125 120 < 10 < 10 < 10 96.00% Birch High School (12342) 561 124 173 512 462 24 14 12 90.23% Big Oak High School (12343) 737 140 198 679 636 28 < 10 < 10 93.67% Maple Alternative Center (12344) 25 14 18 21 16 < 10 0 0 76.19% Pine High School (12345) < 10 69 5 65 18 21 18 < 10 27.69%
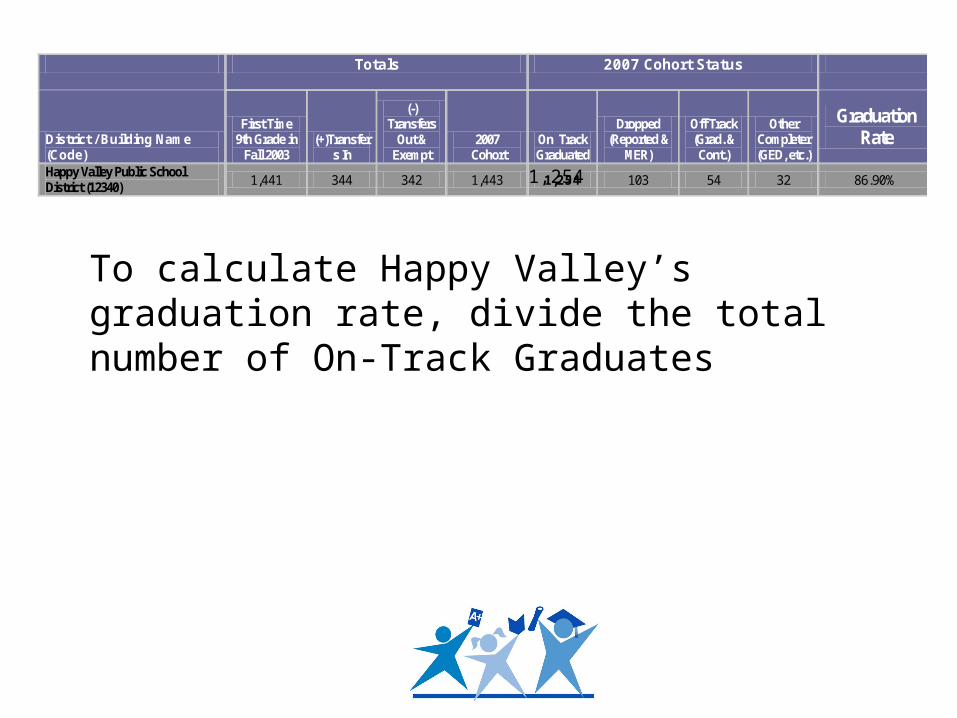
To calculate Happy Valley’s graduation rate, divide the total number of On-Track Graduates
Totals 2007 Cohort Status
District / Building Name (Code)
First Time 9th Grade in
Fall 2003 (+)Transfer
s In
(-) Transfers
Out & Exempt
2007 Cohort
On Track Graduated
Dropped (Reported &
MER)
Off Track (Grad. & Cont.)
Other Completer (GED, etc.)
Graduation Rate
Happy Valley Public School District (12340) 1,441 344 342 1,443 1,254 103 54 32 86.90%
1,254
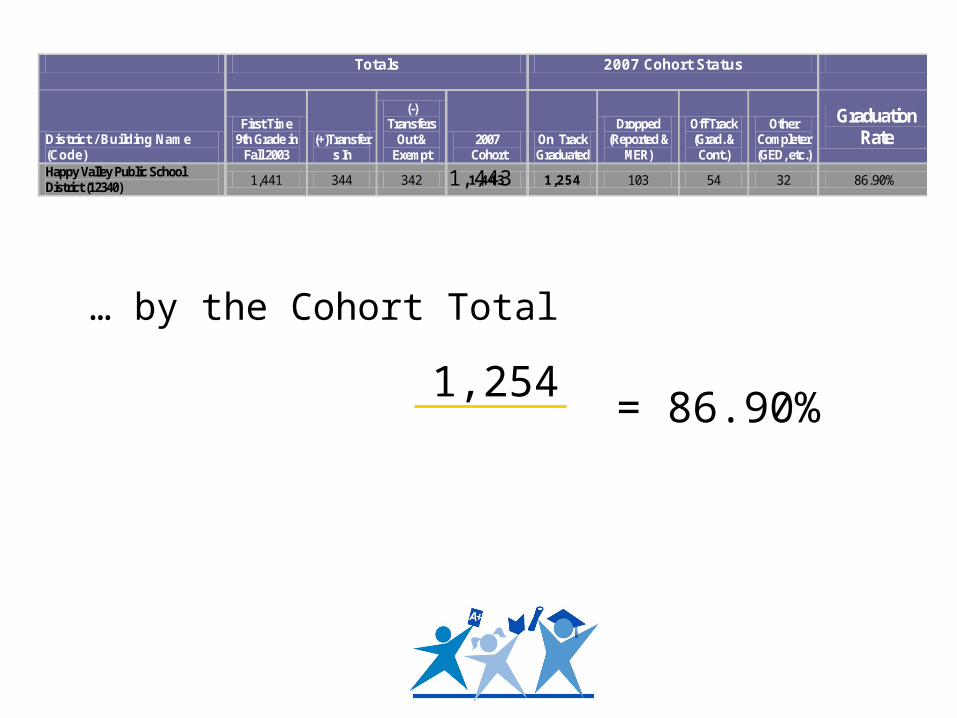
… by the Cohort Total
1,254
Totals 2007 Cohort Status
District / Building Name (Code)
First Time 9th Grade in
Fall 2003 (+)Transfer
s In
(-) Transfers
Out & Exempt
2007 Cohort
On Track Graduated
Dropped (Reported &
MER)
Off Track (Grad. & Cont.)
Other Completer (GED, etc.)
Graduation Rate
Happy Valley Public School District (12340) 1,441 344 342 1,443 1,254 103 54 32 86.90%
1,443
= 86.90%
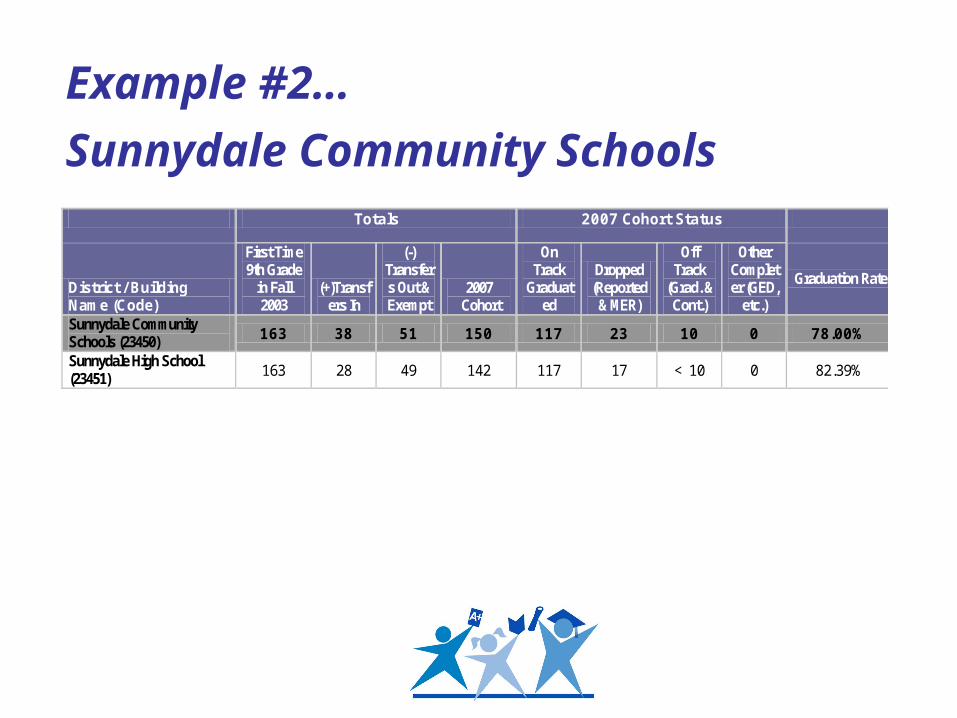
Example #2…
Sunnydale Community Schools Totals 2007 Cohort Status
District / Building Name (Code)
First Time 9th Grade
in Fall 2003
(+)Transfers In
(-) Transfers Out & Exempt
2007 Cohort
On Track
Graduated
Dropped (Reported
& MER)
Off Track
(Grad. & Cont.)
Other Completer (GED,
etc.)
Graduation Rate
Sunnydale Community Schools (23450) 163 38 51 150 117 23 10 0 78.00%
Sunnydale High School (23451) 163 28 49 142 117 17 < 10 0 82.39%
Calculating a
Four-Year Cohort
Dropout Rate
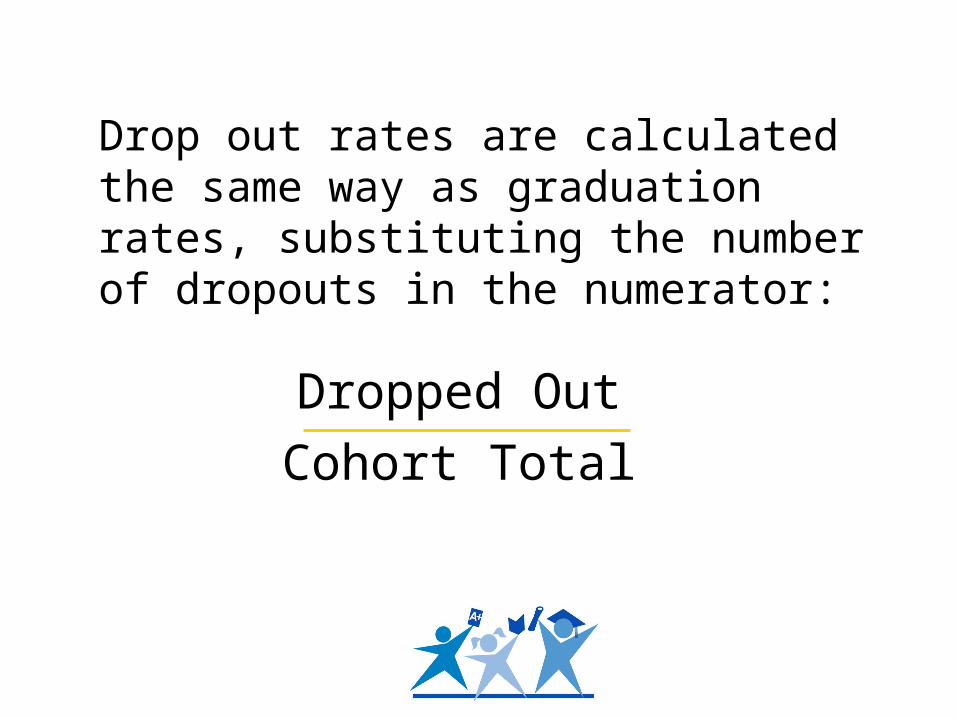
Drop out rates are calculated the same way as graduation rates, substituting the number of dropouts in the numerator:
Dropped OutCohort Total
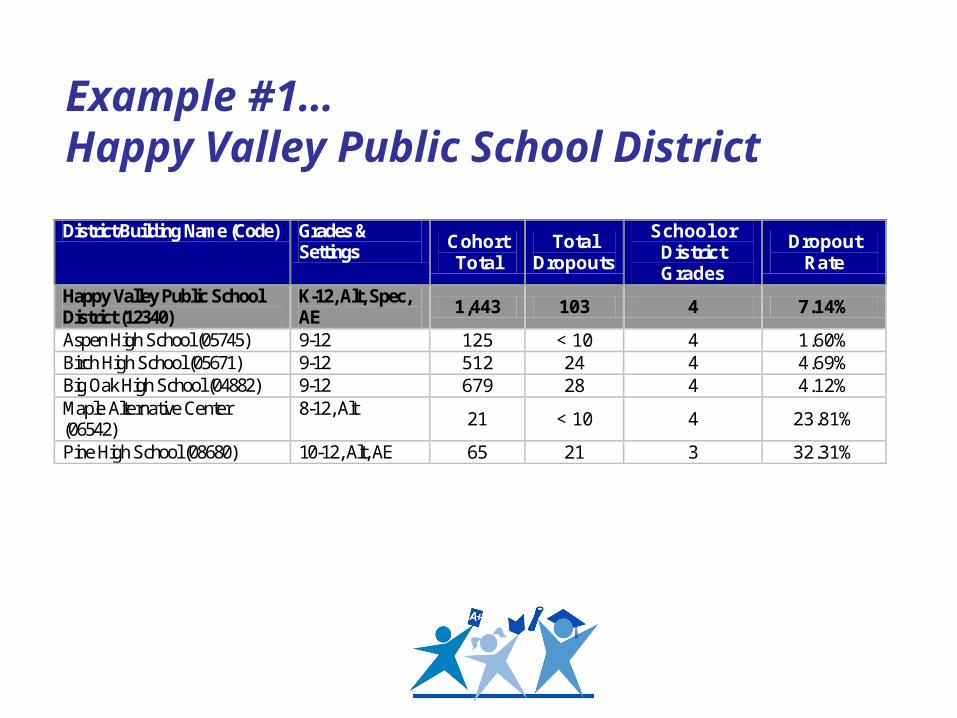
Example #1…Happy Valley Public School District
District/Building Name (Code) Grades & Settings Cohort
Total Total
Dropouts
School or District Grades
Dropout Rate
Happy Valley Public School District (12340)
K-12, Alt, Spec, AE
1,443 103 4 7.14%
Aspen High School (05745) 9-12 125 < 10 4 1.60% Birch High School (05671) 9-12 512 24 4 4.69% Big Oak High School (04882) 9-12 679 28 4 4.12% Maple Alternative Center (06542)
8-12, Alt 21 < 10 4 23.81%
Pine High School (08680) 10-12, Alt, AE 65 21 3 32.31%
Rates for Subgroups Four-year cohort graduation rates will also be calculated for subgroups in districts and the state, including:
race/ethnicity gender race/ethnicity by gender economically disadvantaged students with disabilities migrant limited English proficiency
Michigan’s Graduation and Dropout Rates
August 20, 2008


![The Radio Occultation Processing Package (ROPP) Overview ... · This document should be read in conjunction with the Product Requirements Document (PRD) [AD.2], the ROPP Architectural](https://cdn.vdocuments.site/doc/165x107/5f5317c41cfc5455cd358a72/the-radio-occultation-processing-package-ropp-overview-this-document-should.jpg)


