JOURNAL OF CONSUMER PSYCHOLOGY, 10(1&2), 55-69 Copyright ? 2001, Lawrence Erlbaum Associates, Inc.
Measurement
JOURNAL OF CONSUMER PSYCHOLOGY, 10(1&2), 55-69 Copyright ? 2001, Lawrence Erlbaum Associates, Inc.
Measurement
III.A. CRONBACH'S ALPHA ON TWO-ITEM SCALES
There seems to be disagreement in the field as to the best indi- cator of scale reliability when a scale is composed of two items. Although some academics believe that Cronbach's alpha should be used, others are certain that a correlation co- efficient should be used and that Cronbach's alpha is inappro- priate. Both sides to this issue base their arguments on the equation for Cronbach's alpha. So, is Cronbach's alpha or a correlation coefficient better at indicating reliability for a two-item scale and why? It would be great to have an answer to this because it is something that seems to come up in re- viewers' comments not infrequently.
Professor Charles Hulin University of Illinois
The question about the reliability or homogeneity of a two-item test given the correlation between the two items seems to have been made abit more complicated than it really needs to be or should be. Let us assume the items are parallel in the true score sense of parallel items (equal mean;, vari- ances, etc.). Then, the correlation between two items repre- sents the correlation of one half of the test with the other half ofthe test-the split-halfreliability of the test. Given this cor- relation, one should apply the Spearman Brown formula to estimate the reliability ofa test given its split halfreliability:
r = = (2* ln/2,1/2)/(l + /2,1/2),
where r. is the reliability of the total scale-the sum of the two items, and rn/,y is the split-half reliability; in this case, the correlation between the two items.
So, if your two items were correlated .80, the reliability of the total test, the sum ofthe two items, would be (2 x .80)/(1 + .80) = 1.60/1.80 = .888888 = .89. The uncorrected correlation between the two items (ry/,,) underestimates the reliability of the sum of the two items (r, ), because the former is based on the correlation of single items with each other. I do not see the need to apply Cronbach's alpha in this situation in which you already have the split-half reliability estimate for the test.
Professor Robert Cudeck University of Minnesota
To be concrete, assume that the items making up the scale are Likert-type variables scored on the integers 0 to 5, orwhen the midpoint is useful, scored from -2 to 2. Coefficient alpha can be derived from several different theoretical viewpoints, but perhaps the most common framework is the domain-sampling perspective in which items in the scale under study are viewed as being selected from a much larger collection of comparable items designed to measure a common domain. One way to in- terpret coefficient alpha is as an estimate ofthe correlation be- tween one scale, in practice the scale whose items the researcher has been studying, with a hypothetical alternative form that contains the same number of items. Another inter- pretation is that it is the average correlation of a scale with all possible scales having the same number of items that can be obtained from the domain. These interpretations ofalpha dem- onstrate that its usefulness depends on the connection to the domain. For this reason, alpha computed over two items is an unsatisfactory sampling of the much larger pool of items that are theoretically available. The problem is the lack of repre- sentation of a two-item scale of the larger domain. If the item correlations and variances are heterogeneous in the domain, a sample of only two items cannot detect the heterogeneity. The more desirable approach is to compute alpha on a set of 10 to 15 items, because a scale of this size is more likely to incorpo- rate the variability that exists in the domain.
The parallel forms approach to reliability assumes that the two scales have equal correlations with the true score, plus equal observed score variances and means. This is a strong model, but at least it is testable with short scales. In the con- text of this situation, however, the parallel forms approach would generally be preferred.
Editor: My general response to the coefficient alpha ques- tions follow these four specific alpha questions.
III.B. CAN A RELIABILITY COEFFICIENT BE TOO HIGH?
Is there a point at which the reliability of a scale as measured by the Cronbach's alpha score is too high? If the scale itself is
56 MEASUREMENT
one in which you would not want high reliability, a high alpha score may hurt you. One example could be for a sexism scale in which participants were supposed to report the extent to which they have experienced a number of different sexist situ- ations. We would not necessarily expect the experience of one event to be related to experiencing another event. In a case such as this, the reliability would be somewhat low, yet we may still want to sum the scores to give us an indication of how many events they experienced.
Professor Charles Hulin University of Illinois
Yes, Virginia, there is a point at which the homogeneity of a scale, as measured by Cronbach's alpha, becomes too large. Unfortunately, this point cannot be given to any researchers as a rule of thumb or much of any other estimate. It depends on (gasp!) theory and other things most of us are not com- fortable dealing with. We can find the roots of the argument that too much homogeneity can have negative consequences in the writings of Cronbach and Gleser (1957) in their dis- cussion of the bandwidth-fidelity paradox. Essentially, they argued that any behavioral criterion is going to be influenced (caused) by multiple factors. If a test of ability can approxi- mately match the factor structure of the behavior, the corre- lation will be larger than if the test is a factor-pure measure of one ability. The paradox arises when one has to balance a fixed and finite testing time against the needs to have a broad bandwidth test to maximize test validity. With a fixed testing time, one can measure one factor or dimension very pre- cisely with a great deal of fidelity, or one can measure a broad bandwidth of abilities.
A less technical discussion of this can be found in
Humphrey (1985) when he argued for theory-relevant heter- ogeneity in measures of human ability. The use of Humphrey's principles require that researchers and test con- structors have a good idea of the relevant facets or compo- nents of the ability dimension they are assessing. Theory-relevant heterogeneity can be built in while still maintaining the requirement of one dominant factor in the test or scale. These relatively heterogeneous measures, within the limits of theory, will normally have stronger rela- tions with behavioral criteria. Roznowski and Hanisch (1990) applied the principals of systematic, theory-relevant heterogeneity to attitude measures. Their empirical data support the usefulness of building in such heterogeneity.
Of course, heterogeneity in tests or scales means esti- mates of homogeneity of the items will be low relative to what they may have been had the researchers concentrated their efforts on developing highly homogeneous measures of relatively narrow abilities. The benefits will be paid in the coin of, usually, improved empirical relations with other measures. It bears repeating here that systematic, theory-rel-
evant heterogeneity is not an excuse for sloppy test or scale construction. There should be reasons for including each facet or component that is built into the test (e.g., see Roznowski & Hulin, 1992). These reasons should be articu- lated. The relatively low homogeneity estimates that are generated as a result of this deliberate measurement strategy should be neither a surprise nor a reason to double or triple the number of items or revise the entire item pool to increase homogeneity.
So, although a rule of thumb cannot be provided for what a reasonable coefficient alpha may be, the mindless striving for homogeneity of tests or scales is often done at the expense of empirical usefulness of the resulting scales. Coefficients of homogeneity for any test or scale must be evaluated against the purpose of the test or scale, the construct being estimated, and the number of items in the test. Intelligence and, indeed, all hu- man abilities are behavioral traits. Behaviors in different situa- tions are correlated but not redundant. I may be able to define "oxymoronic" but not spell "receive," but this latter is not a ref- utation ofthe unidimensionality ofthe construct; it is more ofa demonstration of the heterogeneity of the indicators of even the well-defined and studied construct of verbal ability.
REFERENCES
Cronbach, Lee J., & Gleser, Goldine C. (1957). Psychological tests andper- sonnel decisions. Urbana: University of Illinois Press.
Humphreys, Lloyd G. (1985). General intelligence: An integration of factor, test, and simplex theory. In B. B. Wolman (Ed.), Handbook of intelli-
gence: Theories, measurements, and applications (pp. 15-35). New York: Wiley.
Roznowski, Mary A., & Hanisch, Kathy A. (1990). Building systematic het-
erogeneity into job attitudes and behavior measures. Journal of Voca- tional Behavior, 36, 361-375.
Roznowski, Mary A., & Hulin, Charles L. (1992). The scientific merit of valid measures of general constructs with special reference to job satis- faction and job withdrawal. In C. J. Cranny and P. C. Smith (Eds.), Job
satisfaction: How people feel about their jobs and how it affects their
performance (pp. 77-89). New York: Free Press.
Professor Richard Netemeyer Louisiana State University
The answer to this question depends on several issues. I focus on three of these issues here and their interrelations: (a) scale
length and average level of interitem correlation, (b) overredundancy of item wording, and (c) unidimensionality and construct complexity. Furthermore, given length restric- tions, the answer I give represents an extremely oversimpli- fied response. The interested reader is strongly urged to consult several writings on the subject (Bearden & Nete-
meyer, 1998; Boyle, 1991; Carver, 1989; Churchill & Peter, 1984; Clark & Watson, 1995; Cortina, 1993; DeVillis, 1991; Gerbing & Anderson, 1988; Miller, 1995; Nunnally, 1978; Nunnally & Bernstein, 1994; Peter & Churchill, 1986; Peter-
MEASUREMENT 57
son, 1994; Raykov, 1997; Robinson, Shaver, & Wrightsman, 1991; Spector, 1992).
First, a widely advocated level of adequacy for Cronbach's (1951) alpha is .70. (This is likely due to Nunnally's, 1978, text on psychometric theory being extensively quoted; Cortina, 1993; Peterson, 1994.) The reason I mention this .70 level is that it seems to be advocated quite a bit regardless of the three issues mentioned previously. Coefficient alpha gives us information about the extent to which each item in a set correlates with other items in that set. It is a function of both scale length and the average level of interitem correlation. The formula for alpha suggests that as the number of items in- crease and the average interitem correlations increase (ceteris paribus), alpha will increase. Furthermore, the number of items in a scale can have a pronounced effect at lower levels of interitem correlation. For example, in his meta-analyses, Pe- terson found that the mean alpha level for a 3-item scale with an average interitem correlation of.47 was .73. If the .47 level of interitem correlation is applied to a 9-item scale, this 9-item scale would exhibit an alpha level of.89. However, for the 9-item scales reviewed, Peterson found an average interitem correlation of.31 and an average alpha level of .80. (Cortina, 1993, and DeVillis, 1991, also demonstrate this ef- fect.) In sum, in attempting to increase the coefficient alpha of a scale, the quality of items may be more important than the quantity of items.
Related to the previous issue is the overredundancy of item wording. The quality of items referred to earlier re- flects not only a higher level of interitem correlations, but the degree to which individual scale items are worded too similarly-that is, overredundancy (e.g., Bearden & Netemeyer, 1998; Boyle, 1991; Clark & Watson, 1995). Al- though similarity of items and some level of redundancy is necessary to tap a construct's domain, several items that are essentially only slight wording modifications will reflect re- dundancy as well as internal consistency. That is, adding items to a scale worded in a highly similar manner to exist- ing items will tend to increase coefficient alpha without sub- stantively contributing to internal consistency. Any increase in alpha is due to the highly redundant wording of new items that may not substantively contribute to tapping the domain of the construct. (See Clark & Watson's discussion of the "attenuation paradox" pertaining to this issue.)
Finally, dimensionality and construct complexity must be considered. Internal consistency is concerned with the degree of interrelatedness among items, and unidimensionality (i.e., homogeneity) assesses if the items underlie a single factor or construct. It is quite possible for a set of items to be interrelated but not homogeneous. As such, coefficient alpha is not a measure of unidimensionality. Many researchers feel that alpha should be used to assess in- ternal consistency only after unidimensionality is estab- lished (e.g., Cortina, 1993; Gerbing & Anderson, 1988; Hattie, 1985; Miller, 1995). Furthermore, although it has been demonstrated that alpha does decrease as a function of
multidimensionality, alpha can still be high in spite of low interitem correlations and multidimensionality as the num- ber of items increase (Cortina, 1993).
In sum, maximizing Cronbach's alpha is a commendable goal in scale construction. However, this goal must be tem- pered by considering scale length and average interitem correlations, redundancy of item wording, and scale dimensionality-complexity. Alpha can be too high if it re- flects only a large number of items or extreme wording re- dundancy among items. Although, to my knowledge, no "hard" statistical criteria exist as to what is the minimum or maximum number of items in a scale, what is a minimum ac- ceptable alpha, or what is an acceptable level of average interitem correlations, several rules of thumb exist. For ex- ample, Robinson et al. (1991) advocated an alpha level of .80 or better and average interitem correlations of .30 or better as exemplary. Clark and Watson (1995) advocated av- erage interitem correlations of .15 to .50 across constructs, and for narrowly defined constructs, they advocated a range of.40 to .50 for average interitem correlations. They also ad- vocated a coefficient alpha level of at least .80 for a new scale. However, once the .80 benchmark is achieved, adding items is of little utility to internal consistency, particularly with a narrowly defined construct. With such constructs, four or five items could suffice.
In my opinion, these rules of thumb represent sound ad- vice but also must be tempered by good common sense. Does an item appear to tap the definitional content domain of the construct (i.e., face validity) as well as have an acceptable level of correlation with the other items in the scale? Do the items you have collectively tap the domain of the construct? Does an item tap one dimension or is itjust as highly related to another dimension? These questions must also be answered before adhering to rules of thumb for internal consistency.
REFERENCES
Bearden, William 0., & Netemeyer, Richard G. (1998). Chapter one: Intro- duction. In William O. Bearden & Richard G. Netemeyer (Eds.), Handbook of marketing scales (2nd ed., pp. 1-9). Thousand Oaks, CA: Sage.
Boyle, Gerald J. (1991). Does item homogeneity indicate internal consis- tency or item redundancy in psychometric scales? Personality and Indi- vidual Differences, 3, 291-294.
Carver, Charles S. (1989). How should multi-faceted personality constructs be tested? Issues illustrated by self-monitoring, attributional style, and
hardiness.JournalofPersonalityandSocialPsychology, 56,577-585. Churchill, Gilbert A., & Peter, J. Paul. (1984). Research design effects on the
reliability of rating scales: A meta-analysis. Journal of Marketing Re- search, 21, 360-375.
Clark, Lee Anna, & Watson, David. (1995). Constructing validity: Basic is- sues in scale development. Psychological Assessment, 7, 309-319.
Cortina, Jose M. (1993). What is coefficient alpha? An examination oftheory and application. Journal of Applied Psychology, 78, 98-104.
Cronbach, Lee J. (1951). Coefficient alpha and the internal structure of tests. Psychometrika, 31, 93-96.
58 MEASUREMENT 58 MEASUREMENT
DeVillis, Robert F. (1991). Scale development: Theory and application. Newbury Park, CA: Sage.
Gerbing, David W., & Anderson, James C. (1988). An updated paradigm for scale development incorporating unidimensionality and its assessment. Journal of Marketing Research, 25, 186-192.
Hattie, John. (1985). Methodology review: Assessing unidimensionality of tests and items. Applied Psychological Measurement, 9, 139-164.
Miller, Michael B. (1995). Coefficient alpha: A basic introduction from the perspectives of classical test theory and structural equation modeling. Structural Equation Modeling, 2, 255-273.
Nunnally, Jum. (1978). Psychometric theory (2nd ed.). New York: McGraw-Hill.
Nunnally, Jum, & Bernstein, Ira H. (1994). Psychometric theory (3rd ed.). New York: McGraw-Hill.
Peter, J. Paul, & Churchill, Gilbert A. (1986). Relationships among research design choices and psychometric properties of rating scales: A meta-analysis. Journal of Marketing Research, 23, 1-10.
Peterson, Robert J. (1994). A meta-analysis of Cronbach's coefficient alpha. Journal of Consumer Research, 21, 381-391.
Raykov, Tenko. (1997). Scale reliability, Cronbach's coefficient alpha, and violations of essential tau-equivalence with fixed congeneric compo- nents. Multivariate Behavioral Research, 32, 392-353.
Robinson, John P., Shaver, Phillip R., & Wrightsman, Lawrence S. (1991). Criteria for scale selection and evaluation. In John P. Robinson, Phillip R. Shaver, & Lawrence S. Wrightsman (Eds.), Measures ofpersonality and social psychological attitudes (pp. 1-15). San Diego, CA: Aca- demic.
Spector, Paul E. (1992). Summated rating-scale construction: An introduc- tion. Newbury Park, CA: Sage.
Professor Robert Cudeck University of Minnesota
Some measurement problems are concerned with traits that are highly variable. The assessment of mood in a population that is emotionally labile is one such domain. The measure- ment of pain in a population of chronically ill patients is an- other. In both cases, the trait or behavior under investigation is expected to vary considerably across settings and occasions even before the measurement problem is considered. If a mea- surement system were used that was extremely accurate, the scores from the test would fluctuate because the trait itself changes. In cases such as this, the standard regarding what constitutes a good measurement should not be consistency in the usual sense. After all, unlike knowledge in a cognitive do- main, which is a stable trait, mood or the experience of pain are by definition variable. Consequently, classical reliability estimation such as coefficient alpha is not the standard by which to judge the quality of the measurements. Put another way, if the trait under investigation is known to be variable, consistent measurements that do not show the actual variabil- ity are a kind of evidence that the test is inaccurate. In this sense, it certainly is possible for a scale to have reliability that is too high.
A better approach is to view the issue as a problem of content validity. One seeks a broadly representative collec- tion of attitudes or behavioral markers such that features of the trait under investigation are adequately sampled by the
assessment device. For example, major features in the sub- jective experience of pain such as its onset, duration, chronicity, threshold, contributing factors, or bodily loca- tion probably would be included in a comprehensive pain scale. Not all of these factors would be present, or be expe- rienced to the same degree of severity, in each pain episode. However, a broadly representative pain scale would cer- tainly be deficient if one or more of these associated fea- tures were excluded from the instrument.
III.C. WHY CONDUCT A FACTOR ANALYSIS AND THEN COMPUTE
AN ALPHA?
Why do so many articles conduct a factor analysis and then report Cronbach's alpha for each of the factors? I would think the very fact that the items factor together guarantees that the Cronbach's alpha will be at least reasonable. Am I missing something?
Professor Charles Hulin University of Illinois
Researchers report coefficient alpha after they have con- ducted a factor analysis of their items because, although they have just demonstrated that the items appear to cluster to- gether into these factors, there is the question ofjust how ho- mogeneous the resulting factors and resulting scales are likely to be. Of course, these alphas are likely to be a decided overestimate of the homogeneity of the scale in use on a dif- ferent sample because they have just optimized the "bejeebers" out of everything in the analysis by finding the factors (or components) that account for the maximum of the common variance (or variance). Put more delicately and tech- nically, they have very likely overfit their model, the factor model, to their sample data. The degree ofoverfitting depends on the number of items and the number of respondents to the items. A ratio of 10:1 or 15:1, respondents to items, is usually sufficient to ensure only mild overfitting.
Professor Robert Cudeck University of Minnesota
It is somewhat counterintuitive, but a reliable test need not conform to a one-factor model, and conversely, items that do fit a single common factor may have low reliability. Conse- quently, factor analysis and reliability assessment are often both valuable in the construction and evaluation of tests. The information each generates is complementary and not en- tirely redundant. Items in a reliable test may be, and often are, multifactoral. One wants a test to sample, a cohesive do-
MEASUREMENT 59 MEASUREMENT 59
main ofbehavior, or information, and to do so in a way that is repeatable. There is nothing in this objective that limits the test items to being unidimensional. Consider a structured evaluation of managerial performance on the job. Hopefully, this instrument assesses behavior, skill, and effort of manag- ers in an accurate way. Obviously, the activities of a success- ful manager cover a range of different behaviors, such as dealing with employees, interactions with supervisors, qual- ity, and timeliness of task delivery. The analysis of a com- prehensive assessment instrument may well show that more than one factor is operating in adequate managerial perfor- mance. It is still desirable that the overall evaluation proce- dure show high reliability. After all, although there are several facets required to perform well as an effective super- visor, it is still a single job category.
Factor analysis is often used to identify homogeneous sets of items that will be used in a measuring scale. It is conceptu- ally appealing when items are unidimensional. Even if a group of items has been identified as unifactoral, the internal consistency of the collection need not be high. Test reliability is a function of the number of items. Therefore, if only a few items have been identified as homogeneous by a factor analy- sis, their reliability may not be high.
III.D. WHY USE ALPHA IF IT IS NOT A GOOD MEASURE OF
UNIDIMENSIONALITY?
If Cronbach's alpha is not a good measure of unidimen- sionality, why do people rely on it so much?
Editor: A response to this specific question follows some general statements here on coefficient alpha. In addition, readers may be interested in a recent article that discusses al- pha (Cortina, 1993), and generally useful texts on alpha and other measurement issues include Allen and Yen (1979), Anastasi (1982), and Ghiselli, Campbell, and Zedeck (1981). (In this discussion, the terms Cronbach's coefficient alpha, coefficient alpha, Cronbach 's alpha, and alpha are all meant to represent the same index of reliability.)
Let us begin by reviewing the equation for coefficient al- pha, to see what it looks like and to rearrange it in a few ways to try to illuminate difference aspects of the reliability index. Then it will be easier to briefly address each of the specific questions posed. The equation for alpha, as defined by Cronbach (1951, p. 299, Equation 2), is
n
n _ a= 1--I
n-1 C2r
<
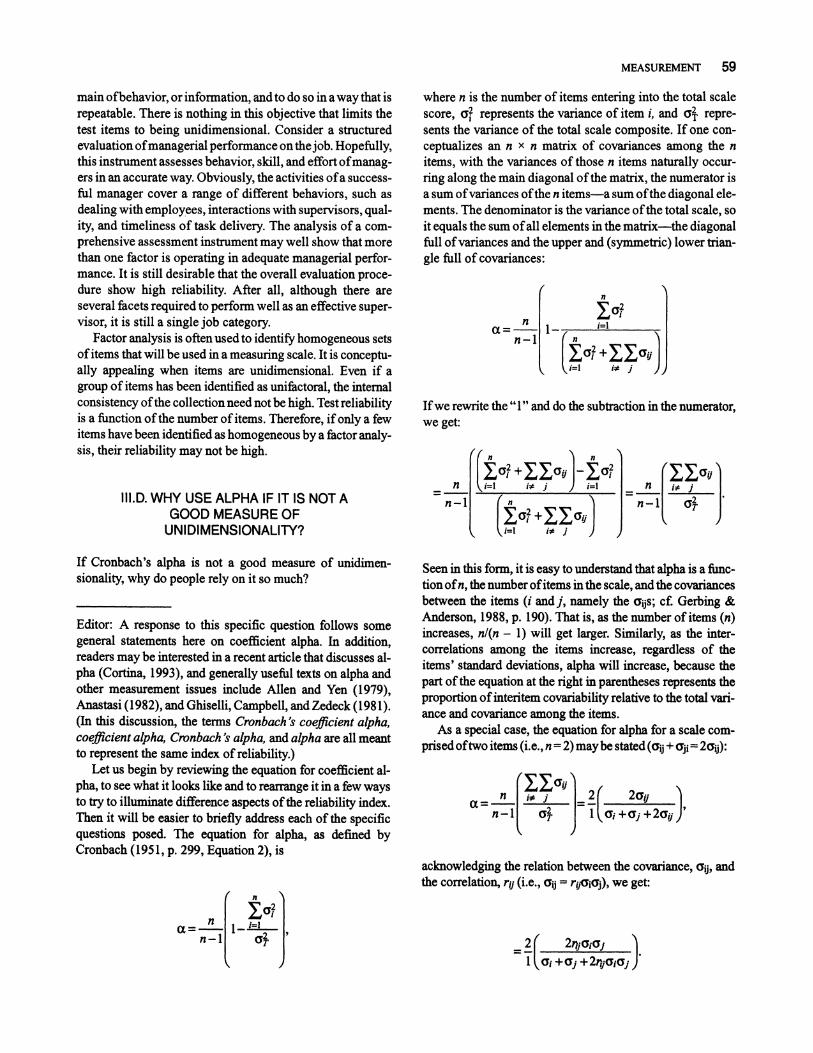
where n is the number of items entering into the total scale score, a2 represents the variance of item i, and oA repre- sents the variance of the total scale composite. If one con- ceptualizes an n x n matrix of covariances among the n items, with the variances of those n items naturally occur- ring along the main diagonal of the matrix, the numerator is a sum of variances of the n items-a sum of the diagonal ele- ments. The denominator is the variance of the total scale, so it equals the sum of all elements in the matrix-the diagonal full of variances and the upper and (symmetric) lower trian- gle full of covariances:
where n is the number of items entering into the total scale score, a2 represents the variance of item i, and oA repre- sents the variance of the total scale composite. If one con- ceptualizes an n x n matrix of covariances among the n items, with the variances of those n items naturally occur- ring along the main diagonal of the matrix, the numerator is a sum of variances of the n items-a sum of the diagonal ele- ments. The denominator is the variance of the total scale, so it equals the sum of all elements in the matrix-the diagonal full of variances and the upper and (symmetric) lower trian- gle full of covariances:
If we rewrite the "1" and do the subtraction in the numerator, we get: If we rewrite the "1" and do the subtraction in the numerator, we get:
Seen in this form, it is easy to understand that alpha is a func- tion ofn, the number of items in the scale, and the covariances between the items (i and j, namely the oijs; cf. Gerbing & Anderson, 1988, p. 190). That is, as the number of items (n) increases, nl(n - 1) will get larger. Similarly, as the inter- correlations among the items increase, regardless of the items' standard deviations, alpha will increase, because the part of the equation at the right in parentheses represents the proportion ofinteritem covariability relative to the total vari- ance and covariance among the items.
As a special case, the equation for alpha for a scale com- prised oftwo items (i.e., n = 2) may be stated (aij + aji = 2aij):
acknowledging the relation between the covariance, oij, and the correlation, ry (i.e., ij = roij,oj), we get:
=2 2rio4ia )J 1 Ci +a(j -+2jCSi(ji)
acknowledging the relation between the covariance, oij, and the correlation, ry (i.e., ij = roij,oj), we get:
=2 2rio4ia )J 1 Ci +a(j -+2jCSi(ji)
60 MEASUREMENT
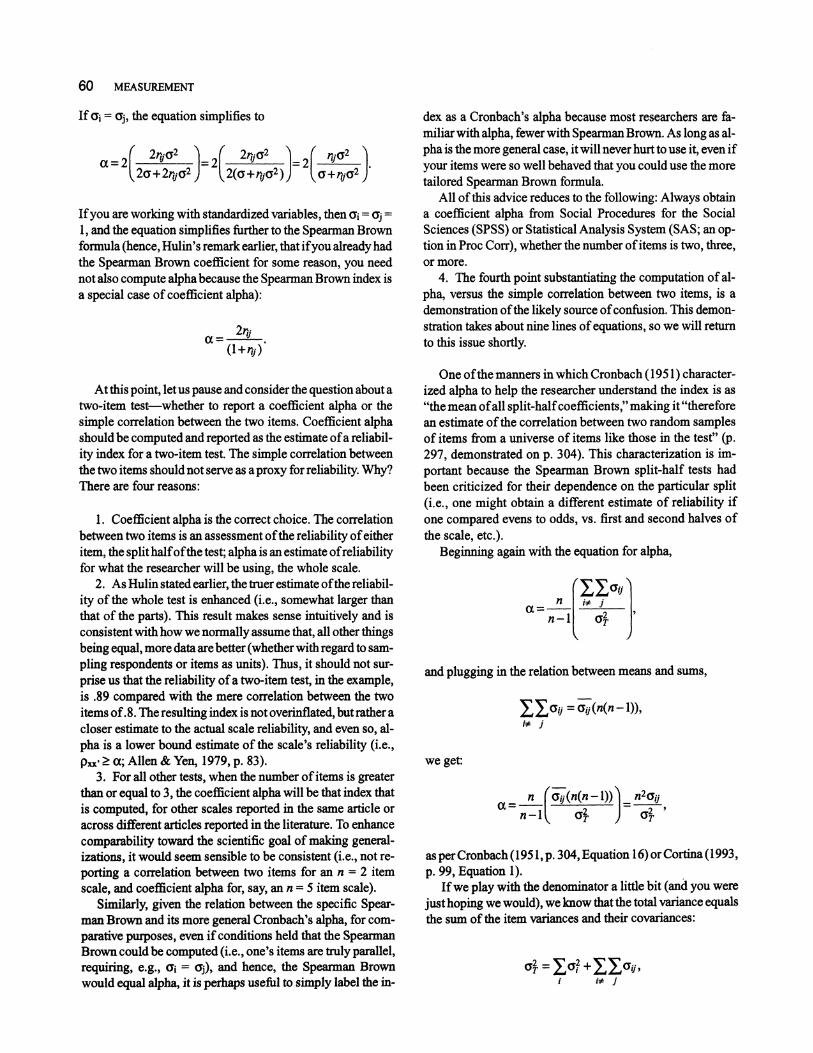
If ai = aj, the equation simplifies to
a=2 2iU2 2 2noa2 2 r02 20+2rja 2 2(a + rj2) (a+rja2 )
If you are working with standardized variables, then oi = oj = 1, and the equation simplifies further to the Spearman Brown formula (hence, Hulin's remark earlier, that if you already had the Spearman Brown coefficient for some reason, you need not also compute alpha because the Spearman Brown index is a special case of coefficient alpha):
a= (l+nj)
At this point, let us pause and consider the question about a two-item test-whether to report a coefficient alpha or the simple correlation between the two items. Coefficient alpha should be computed and reported as the estimate of a reliabil- ity index for a two-item test. The simple correlation between the two items should not serve as a proxy for reliability. Why? There are four reasons:
1. Coefficient alpha is the correct choice. The correlation between two items is an assessment of the reliability of either item, the split halfofthe test; alpha is an estimate ofreliability for what the researcher will be using, the whole scale.
2. As Hulin stated earlier, the truer estimate of the reliabil- ity of the whole test is enhanced (i.e., somewhat larger than that of the parts). This result makes sense intuitively and is consistent with how we normally assume that, all other things being equal, more data are better (whether with regard to sam- pling respondents or items as units). Thus, it should not sur- prise us that the reliability of a two-item test, in the example, is .89 compared with the mere correlation between the two items of.8. The resulting index is not overinflated, but rather a closer estimate to the actual scale reliability, and even so, al- pha is a lower bound estimate of the scale's reliability (i.e., p,xx' a; Allen & Yen, 1979, p. 83).
3. For all other tests, when the number of items is greater than or equal to 3, the coefficient alpha will be that index that is computed, for other scales reported in the same article or across different articles reported in the literature. To enhance
comparability toward the scientific goal of making general- izations, it would seem sensible to be consistent (i.e., not re- porting a correlation between two items for an n = 2 item scale, and coefficient alpha for, say, an n = 5 item scale).
Similarly, given the relation between the specific Spear- man Brown and its more general Cronbach's alpha, for com- parative purposes, even if conditions held that the Spearman Brown could be computed (i.e., one's items are truly parallel, requiring, e.g., oi = aj), and hence, the Spearman Brown would equal alpha, it is perhaps useful to simply label the in-
dex as a Cronbach's alpha because most researchers are fa- miliar with alpha, fewer with Spearman Brown. As long as al- pha is the more general case, it will never hurt to use it, even if your items were so well behaved that you could use the more tailored Spearman Brown formula.
All of this advice reduces to the following: Always obtain a coefficient alpha from Social Procedures for the Social Sciences (SPSS) or Statistical Analysis System (SAS; an op- tion in Proc Corr), whether the number of items is two, three, or more.
4. The fourth point substantiating the computation of al-
pha, versus the simple correlation between two items, is a demonstration of the likely source of confusion. This demon- stration takes about nine lines of equations, so we will return to this issue shortly.
One of the manners in which Cronbach (1951) character- ized alpha to help the researcher understand the index is as "the mean of all split-half coefficients," making it "therefore an estimate of the correlation between two random samples of items from a universe of items like those in the test" (p. 297, demonstrated on p. 304). This characterization is im-
portant because the Spearman Brown split-half tests had been criticized for their dependence on the particular split (i.e., one might obtain a different estimate of reliability if one compared evens to odds, vs. first and second halves of the scale, etc.).
Beginning again with the equation for alpha,
and plugging in the relation between means and sums,
SCCa = ay(n(n - 1)), i j
we get:
n (U(n(n- 1)) n20a a =2-- a=n-l o2T = 2
as per Cronbach(1951, p. 304, Equation 16) or Cortina (1993, p. 99, Equation 1).
If we play with the denominator a little bit (and you were
just hoping we would), we know that the total variance equals the sum of the item variances and their covariances:
2T = 2 +Z aij, ii j
MEASUREMENT 61
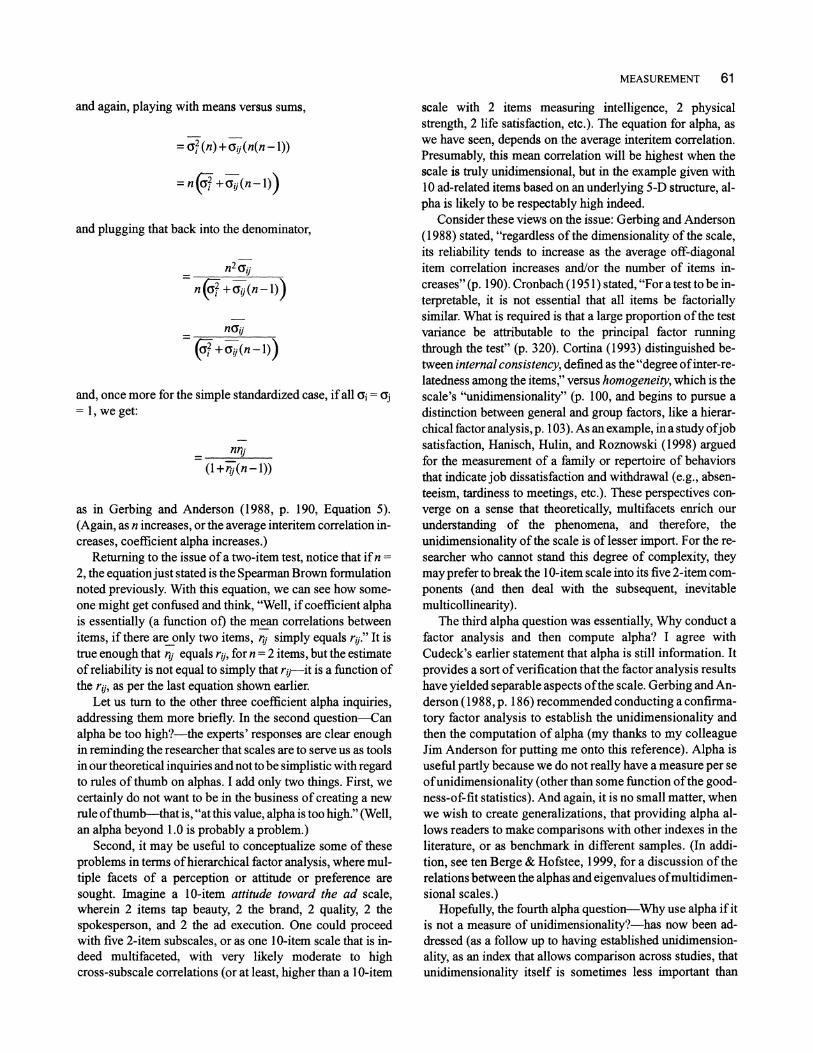
and again, playing with means versus sums,
= 2 (n) + (i(n(n - 1))
=n +:y(n-1)
and plugging that back into the denominator,
n2ij
(a + ij(n-l))
and, once more for the simple standardized case, if all oi = oj = 1, we get:
nrij (1 +r(n -1))
as in Gerbing and Anderson (1988, p. 190, Equation 5). (Again, as n increases, or the average interitem correlation in- creases, coefficient alpha increases.)
Returning to the issue of a two-item test, notice that if n 2, the equationjust stated is the Spearman Brown formulation noted previously. With this equation, we can see how some- one might get confused and think, "Well, if coefficient alpha is essentially (a function of) the mean correlations between items, if there are_only two items, rj simply equals r/i." It is true enough that rj equals ri, for n = 2 items, but the estimate of reliability is not equal to simply that rj--it is a function of the rij, as per the last equation shown earlier.
Let us turn to the other three coefficient alpha inquiries, addressing them more briefly. In the second question-Can alpha be too high?-the experts' responses are clear enough in reminding the researcher that scales are to serve us as tools in our theoretical inquiries and not to be simplistic with regard to rules of thumb on alphas. I add only two things. First, we certainly do not want to be in the business of creating a new rule ofthumb-that is, "at this value, alpha is too high." (Well, an alpha beyond 1.0 is probably a problem.)
Second, it may be useful to conceptualize some of these problems in terms of hierarchical factor analysis, where mul- tiple facets of a perception or attitude or preference are sought. Imagine a 10-item attitude toward the ad scale, wherein 2 items tap beauty, 2 the brand, 2 quality, 2 the spokesperson, and 2 the ad execution. One could proceed with five 2-item subscales, or as one 10-item scale that is in- deed multifaceted, with very likely moderate to high cross-subscale correlations (or at least, higher than a 10-item
scale with 2 items measuring intelligence, 2 physical strength, 2 life satisfaction, etc.). The equation for alpha, as we have seen, depends on the average interitem correlation. Presumably, this mean correlation will be highest when the scale is truly unidimensional, but in the example given with 10 ad-related items based on an underlying 5-D structure, al- pha is likely to be respectably high indeed.
Consider these views on the issue: Gerbing and Anderson (1988) stated, "regardless of the dimensionality of the scale, its reliability tends to increase as the average off-diagonal item correlation increases and/or the number of items in- creases" (p. 190). Cronbach (1951) stated, "For a test to be in- terpretable, it is not essential that all items be factorially similar. What is required is that a large proportion of the test variance be attributable to the principal factor running through the test" (p. 320). Cortina (1993) distinguished be- tween internal consistency, defined as the "degree of inter-re- latedness among the items," versus homogeneity, which is the scale's "unidimensionality" (p. 100, and begins to pursue a distinction between general and group factors, like a hierar- chical factor analysis, p. 103). As an example, in a study ofjob satisfaction, Hanisch, Hulin, and Roznowski (1998) argued for the measurement of a family or repertoire of behaviors that indicate job dissatisfaction and withdrawal (e.g., absen- teeism, tardiness to meetings, etc.). These perspectives con- verge on a sense that theoretically, multifacets enrich our understanding of the phenomena, and therefore, the unidimensionality of the scale is of lesser import. For the re- searcher who cannot stand this degree of complexity, they may prefer to break the 10-item scale into its five 2-item com- ponents (and then deal with the subsequent, inevitable multicollinearity).
The third alpha question was essentially, Why conduct a factor analysis and then compute alpha? I agree with Cudeck's earlier statement that alpha is still information. It provides a sort of verification that the factor analysis results have yielded separable aspects of the scale. Gerbing and An- derson (1988, p. 186) recommended conducting a confirma- tory factor analysis to establish the unidimensionality and then the computation of alpha (my thanks to my colleague Jim Anderson for putting me onto this reference). Alpha is useful partly because we do not really have a measure per se of unidimensionality (other than some function of the good- ness-of-fit statistics). And again, it is no small matter, when we wish to create generalizations, that providing alpha al- lows readers to make comparisons with other indexes in the literature, or as benchmark in different samples. (In addi- tion, see ten Berge & Hofstee, 1999, for a discussion of the relations between the alphas and eigenvalues of multidimen- sional scales.)
Hopefully, the fourth alpha question-Why use alpha if it is not a measure of unidimensionality?-has now been ad- dressed (as a follow up to having established unidimension- ality, as an index that allows comparison across studies, that unidimensionality itself is sometimes less important than
62 MEASUREMENT 62 MEASUREMENT
other theoretical goals that may motivate the use of multifac- eted scales, etc.).
Researchers may also find the perspectives of generaliz- ability theory interesting, conceptualizing the sampling of items from a theoretical domain, the sampling of participants' responses under different testing conditions, and so on, built within the framework of random-effects analysis of variance modeling (cf. Cronbach, Gleser, Nanda, & Rajaratnam, 1972; Suen, 1990).
Once more, the bottom line is, compute a coefficient alpha from SAS or SPSS on any scale that has two or more items, even after having conducted factor analyses, and keep in mind that sometimes scales that are not unidimensional can never- theless be extremely useful.
REFERENCES
Allen, Mary J., & Yen, Wendy M. (1979). Introduction to measurement the- ory. Monterey, CA: Brooks/Cole.
Anastasi, Anne. (1982). Psychological testing (5th ed.). New York: Macmillan.
Cortina, Jose M. (1993). What is coefficient alpha? An examination oftheory and applications. Journal of Applied Psychology, 78, 98-104.
Cronbach, Lee J. (1951). Coefficient alpha and the internal structure of tests. Psychometrika, 16, 297-334.
Cronbach, Lee J., Gleser, Goldine C., Nanda, Harinder, & Rajaratnam, Nageswari. (1972). The dependability of behavioral measurements: Theory ofgeneralizabilityfor scores andprofiles. New York: Wiley.
Gerbing, David W., & Anderson, James C. (1988). An updated paradigm for scale development incorporating unidimensionality and its assessment. Journal of Marketing Research, 25, 186-192.
Ghiselli, Edwin E., Campbell, John P., & Zedeck, Sheldon. (1981). Measure- ment theoryfor the behavioral sciences. San Francisco: Freeman.
Hanisch, Kathy A., Hulin, Charles L., & Roznowski, Mary. (1998). The im-
portance of individuals' repertoires of behaviors: The scientific appro- priateness of studying multiple behaviors and general attitudes. Journal of Organizational Behavior, 19, 463-480.
Suen, Hoi K. (1990). Principles of test theories. Hillsdale, NJ: Lawrence Erlbaum Associates, Inc.
ten Berge, Jos M. F., & Hofstee, Willem K. B. (1999). Coefficients alpha and reliabilities of unrotated and rotated components. Psychometrika, 64, 83-90.
III.E. HOW TO COMBINE MULTIPLE ITEMS INTO A COMPOSITE SCORE
I am doing quantitative survey research involving dimensions of climate, culture, and attitude. In reviewing related articles, organizational scores for multi-item constructs are typically computed by equally weighting and averaging the item scores. A significant amount of marketing-focused work has been similarly structured (e.g., Jaworski & Kohli, 1993).
However, using SPSS, one can derive factor scores that are the product of the standardized values for each item and the corresponding factor score coefficient. Doing so seems valu- able, because more contributory items (to that factor) get more weight in the resultant score. A weighted group-unit
mean can then be calculated. Therefore, my question is, why is this method not used much? Is there a downside to it that I am not comprehending?
REFERENCE
Jaworski, Bernard J., & Kohli, Ajay K. (1993). Market orientation: Anteced- ents and consequences. Journal of Marketing, 57, 53-70.
Professor William R. Dillon Southern Methodist University
In essence, the question is whether equally weighted summated scores are in some sense inferior to a more sophis- ticated procedure of computing factor scores that have some kind of optimal weighting properties. Obviously, the question of how to compute summated scores beg the question of how they are going to be used. However, let us assume that they will be used to test weak or strong causal theories. Some re- cent work strongly suggests that equally weighted summated scores will do very well indeed. McDonald (1997), in investi- gating the properties of partial least squares (PLS) and its re- lation to the factor analytic model, showed that equally weighted summated scores are optimal in the sense that no other weighted combination will do better.
REFERENCE
McDonald, Roderick P. (1997). Haldane's lungs: A case study in path analy- sis. Multivariate Behavioral Research, 32, 1-38.
Professor Roderick McDonald University of Illinois
In fact, both options-(a) taking an average item score or (b) estimating factor scores on a factor identified with a construct or attribute-have an upside and a downside. With the first
option, the advantage is that the score commonly has an abso- lute modal meaning. Thus, in a set of Likert items we can read a respondent's average score as a modal tendency to strongly agree, agree, and so on. (Ease of computation barely counts these days.) The disadvantage, on the face of it, is that the score is not optimal-it is not the most efficient estimator of the attribute. With the second option, the factor score esti-
mate-preferably the Maximum Likelihood/General Least
Squares estimate, not the "shrunken" regression estimate
commonly offered by computer programs (McDonald, 1999)-is optimal and gives a standard error of estimate, but the weights are data dependent and possibly not themselves reliable. Fortunately, as in most cases in which we compare weighted composite scores with unweighted average scores,
MEASUREMENT 63
the correlation between the two will be well above .9, so it makes no difference which we use (cf. Henry Kaiser's law: "It don't make no nevermind").
What matters is a careful confirmatory factor analysis to verify that the test is homogeneous-that is, the items mea- sure just one common factor (or latent trait or construct or at- tribute). After that, I recommend averaging the item scores to give a meaningful scale and getting their reliability from the factor loadings of their covariance matrix, or, as the usual quick and dirty alternative, using the Guttman-Cronbach's alpha as a lower bound to reliability (McDonald, 1999).
REFERENCE
McDonald, Roderick P. (1999). Test theory: A unified treatment. Mahwah, NJ: Lawrence Erlbaum Associates, Inc.
A related questions follows: When should multiple obser- vations from a participant be averaged to create a single re- sponse from that individual (because of the concern that multiple responses from the same person are always corre- lated-or at least always vulnerable to concerns about the failure of independence), and when should those responses be analyzed as separate variables?
Professor Roderick McDonald University of Illinois
The brief answer is that it depends on the object of the study, which is usually known beforehand, and on the structure of the data, which is not. Let us suppose that the object of the study is to use the multiple observations-m independent variables-in a regression equation for a dependent variable. Textbooks do not always mention the known fact that even if the independent variables are strictly multicollinear and the equations of the regression cannot be solved uniquely for the regression coefficients, the error variance and squared multi- ple correlation can still be computed (using a generalized in- verse technology). The squared multiple correlation is an upper limit to the predictive power of averaged subsets of items chosen to avoid multicollinearity and to give regression coefficients with acceptably small standard errors. There are possibly a lot of bad regression programs out there, so one must find a program that uses a generalized inverse when needed and tells you that it gets a squared multiple correlation as an invariant when the regression coefficients are arbitrary or poorly estimated.
It may seem as though showing by common factor analysis that the independent variables, or subsets of them, are homo- geneous would justify forming the corresponding item sums as a way to avoid multicollinearity. However, it is perfectly possible in theory that the unique parts of the items jointly predict the dependent variable, whereas the common factor
has nothing to do with prediction. Failure to recognize this fact has produced pseudo-paradoxical statements in the test theory literature to the effect that a test's predictive validity cannot exceed its reliability, yet for optimal prediction we should maximize validity (i.e., choose items that are maxi- mally correlated with the criterion) and minimize reliability (i.e., choose items that are minimally correlated with each other; see McDonald, 1999). (Also, see this bandwidth-fidel- ity paradox discussed in this special issue in response to the coefficient alpha questions.)
However, again, as in my answer to the previous question, it is likely, though exceptions occur and should be looked for, that the law of"it don't make no nevermind" applies. If in an application we find that the simple squared correlation of the unweighted item sum with the dependent variable is negligi- bly smaller than the multiple correlation, then it does not mat- ter what combinations or what weights we use. I recommend in exploratory work that the investigator should always check these two limits.
Of course, for those fearless investigators who want to in- terpret each (standardized or unstandardized) regression weight as a measure of causal effect, something further needs to be said. A reasonable strategy (though all strategies can fail) is as follows: First, do a confirmatory factor analysis of the independent variables, then verify that their unique parts do not add to prediction. We may then use the resulting homo- geneous subtests as substantively understandable causal vari- ables whose effect sizes can be compared if the correlations between the factors are near enough to negligible. Multiple regression without a careful structural analysis is not a good technique for explanatory purposes.
REFERENCE
McDonald, Roderick P. (1999). Test theory: A unified treatment. Mahwah, NJ: Lawrence Erlbaum Associates, Inc.
Editor: The formation of a composite (an average of a scale's items) may be preferred to the modeling of the individual component items for two reasons: First, an average, whether over respondents or items, lends stability (literally enhanced reliability here) to the resultant composite variable (cf. Li, 1997). Second, the composite can be simpler, both to concep- tualize and communicate and to use in models. For example, a univariate analysis of variance on a composite is likely to be easier to understand than a multivariate analysis of variance modeling the multiple items simultaneously; a regression with multiple items as predictors may seem easy to under- stand, but the inherent multicollinearity in this scenario makes most of us skittish. Even a structural equations model (SEM), an approach to data analysis created as a perfect part- nership of a measurement model and a structural model, seems to behave with somewhat more stability in the presence
64 MEASUREMENT 64 MEASUREMENT
of parsimony (in this case, simplifying the measurement end of the model). We theorize about constructs that we acknowl- edge to be not directly observable, and we know that the mea- surement of any particular variable is errorful, and so encourage the use of multiple items to begin to converge to- ward greater clarity in measurement. Although a composite is not the measurement of a construct, its greater reliability means that the particular idiosyncracies of the component items have less power to yield misleading results.
REFERENCE
Li, Heng. (1997). A unifying expression for the maximal reliability of a linear composite. Psychometrika, 62, 245-249.
III.F. SUMMED SCALES AND WHAT IS A "REFLECTIVE" OR "FORMATIVE"
INDICATOR?
In our study, we use mental simulation to elicit responses to a service failure. We model relationship trust and commitment as mediators of relationship dissolution behaviors and use LISREL to test models in which the effects of service failure affect and cognition on exit and voice behaviors are fully and partially mediated by trust and commitment.
One reviewer asked whether we collapsed items in our scales to form reflective indicators for several of the variables in our model. The reviewer also used the term formative indi- cators and suggested that if sample size is a problem, we could use a "summate for each construct in our model."
We have consulted a variety of sources, including several statisticians who claim familiarity with the nuances of SEM, but have been unable to clarify what reflective and formative indicators are, whether the terms represent different analyti- cal approaches, and, if they do, why one approach may be more suitable to our circumstances than the other. We can
speculate with some confidence about what a summate is but would also find it useful to obtain some guidance about how
using summates as measures of model constructs changes a LISREL analysis and how this approach compares to the use of reflective and formative indicators.
Professor William R. Dillon Southern Methodist University
First, with respect to reflective and informative indicators, it is not surprising that traditionally trained statisticians may not be familiar with the terminology. Reflective indicators are consistent with the specification used in the factor analytic model, wherein an observed measure is presumed to be deter- mined by a latent factor and a uniqueness factor. Items are
presumed to be sampled from the domain of the latent con-
struct and in this sense are reflective. Formative indicators, on the other hand, are consistent with a principal components specification, wherein the latent variable is defined as a linear combination of manifest items. In this case, we can say that the items form the latent variable.
Second, with respect to how summated scores change a LISREL analysis and how this approach compares to reflec- tive and formative indicators, I am not sure I know what you are asking. LISREL assumes reflective indicators, either indi- vidual items or summated scores, where in the latter case no measurement model is assumed. It can be shown that under certain conditions the measurement model (i.e., how the con- struct is operationalized) can change with no effect on struc- tural parameters (see Kumar & Dillon, 1987), although these conditions may not hold very often in practice. Formative in- dicators are generally used in PLS analysis.
REFERENCE
Kumar, Ajith, & Dillon, William R. (1987). The interaction of measurement and structure in simultaneous equation models with unobservable vari- ables. Journal of Marketing Research, 24, 98-105.
Professor Roderick McDonald University of Illinois
I will regard this as two questions: (a) What does the author do when a reviewer makes an obscure remark without ref- erences?, and (b) If we guess what a summate is, how should it behave?
In answering the first question, ideally, a reviewer should
recognize what is well known and what is not and should err on the side of giving references for ideas that may not be well and widely known. In a case such as this, reasonable inquiry does not turn up a source for a string of fancy jargon words used by the reviewer. (I searched my cortex and recalled edu- cational evaluation jargon concerning formative and summative evaluation-but educators do not seem to be "re- flective" evaluators. This terminology may have crept over into someone's measurement work by an unfortunate process akin to rumor. My research assistant did a keyword search and found nothing relevant.) In any such case, the author should
ask, through the editor, for a reference from the reviewer.
Concerning the second question, I am not confident in
speculating as to what was in the reviewer's mind as a referent for sulmmate (noun), but let us suppose it is a clever jargon word for sum score. In SEM, we actually face a difficult di- lemma: (a) We can keep multiple indicators of attributes, measured as latent variables, and find generally strong causal relations between these "true" measures of them. Doing so tells us only how well we could predict if we invented per- fect-infinitely long-tests and how badly we have in fact measured. This information is good if we are doing pure be-
MEASUREMENT 65 MEASUREMENT 65
havioral science, but perhaps not useful in applied sciences. (b) We can use (weighted or unweighted) sums and find gen- erally weak causal relations between attributes as best as we are able to measure them, and possibly get reliabilities in a separate analysis of item covariances or by the Guttman- Cronbach lower bound alpha (see McDonald's responses to the coefficient alpha questions in this issue). If we have a large enough set of indicators, these choices will make very little difference. However, most investigators, following the law of least effort, try to use as few measures of an attribute as possi- ble in SEMs. This practice, along with the commonly unrec- ognized problem of equivalent models, is a major reason why this technology does not seem to be working out very well in applications. McDonald (1996) gave algebra for the compari- son of models using latent variables with models using (weighted) sum scores.
REFERENCE
McDonald, Roderick P. (1996). Path analysis with composite variables. Multivariate Behavioral Research, 31, 239-270.
III.G. CONVEYING THE MEAN AND VARIANCE OF VARIABLES IN A
COMPOSITE SCORE
Customer satisfaction with some purchase (e.g., a hotel) is of- ten assumed to depend on customers' performance percep- tions with regard to the attributes of the purchase (e.g., the check-in speed, the room, the restaurant, etc.). That is, cus- tomer satisfaction is a function of the level of the performance ratings. However, many firms seem to believe that homogene- ity (i.e., consistency) in such perceptions is very important. As a result, they attempt to standardize things. The assump- tion seems to be this (in terms of operationalizations): If Cus- tomerA rates the performance of the hotels' features {5, 5, 5}, it is better than if Customer B rates them {7, 5, 3}. Customer A, then, has a higher level of consistency in his or her ratings than Customer B, yet their total score is the same.
I have tried to operationalize homogeneity of this type in several ways, but I get only moderate associations with cus- tomer satisfaction on a global level. When I am controlling for the levels of perceived performance, the association almost disappears. What is wrong? Are firms wrong in their standard- ization efforts, do customers tolerate variation more than we believe, or is something wrong with the operationalization?
Professor William Bearden University of South Carolina
To begin, firms standardize procedures in an attempt to achieve consistent service quality and service delivery. Using
To begin, firms standardize procedures in an attempt to achieve consistent service quality and service delivery. Using
your example, you are correct that Customer A (with perfor- mance ratings of {5, 5, 5} on three attributes) and Customer B (with performance ratings of {7, 5, 3} on the same three at- tributes) have equal total customer satisfaction scores if ag- gregated (summed or averaged) across the three attribute ratings. And, Customer A does have greater homogeneity in her or his ratings as you suggest. However, as you recognize, homogeneity in and of itself is not necessarily desirable. Spe- cifically, scores such as 4, 4, 4 or 3, 3, 3 or 2, 2, 2 or 1, 1, 1 are homogeneous, but clearly not satisfactory.
Summing or averaging across diverse attributes will gen- erally reveal modest, significant correlations with overall judgments of satisfaction or service quality. This finding is certainly well documented in the attitude literature in which summed belief-by-evaluation scores across attributes are cor- related with overall attitude measures (e.g., Attitudeact or Aobject). Meta-analyses reveal average correlations well be- low 1.00, typically from 0.30 to 0.60. Similar results hold in the satisfaction and service quality literature as well. For ex- ample, Teas (1993, p. 27) reported various model correlations with global satisfaction that range from 0.588 to 0.753.
From a practical standpoint, the individual attribute scores remain insightful for at least the following reasons:
1. Low scores on individual attributes (e.g., the "3" for the third hotel attribute or service aspect for Customer B) suggest specific sources of dissatisfaction, particularly if found con- sistently when considered across patrons. These diagnostic insights are critical and go well beyond efforts to predict over- all satisfaction from summed attribute scores.
2. Relatedly, scores on individual items also suggest where the greatest improvements in satisfaction can be ob- tained and which represent the areas deserving greatest atten- tion in service recovery efforts.
3. In addition, the negative aspects of service delivery suggested by low attribute scores are most noteworthy. The notion that negative information is heavily weighted is well recognized in the decision-making literature.
The satisfaction and service quality literature has tried any number of alternative models incorporating different weights, predictor variables (e.g., expectations, performance ratings), and model configurations (e.g., Iacobucci, Ostrom, & Grayson, 1995; Spreng, MacKenzie, & Olshavsky, 1996). This extant literature is considerable. I have found the follow- ing more recent articles to be very useful and to address to varying degrees the issues you have raised. Of note, the article by Hartline and Ferrell (1996) considered hotels specifically.
REFERENCES
Hartline, Michael D., & Ferrell, O. C. (1996). The management of cus- tomer-contact service employees: An empirical investigation. Journal of Marketing, 60, 52-70.
Hartline, Michael D., & Ferrell, O. C. (1996). The management of cus- tomer-contact service employees: An empirical investigation. Journal of Marketing, 60, 52-70.
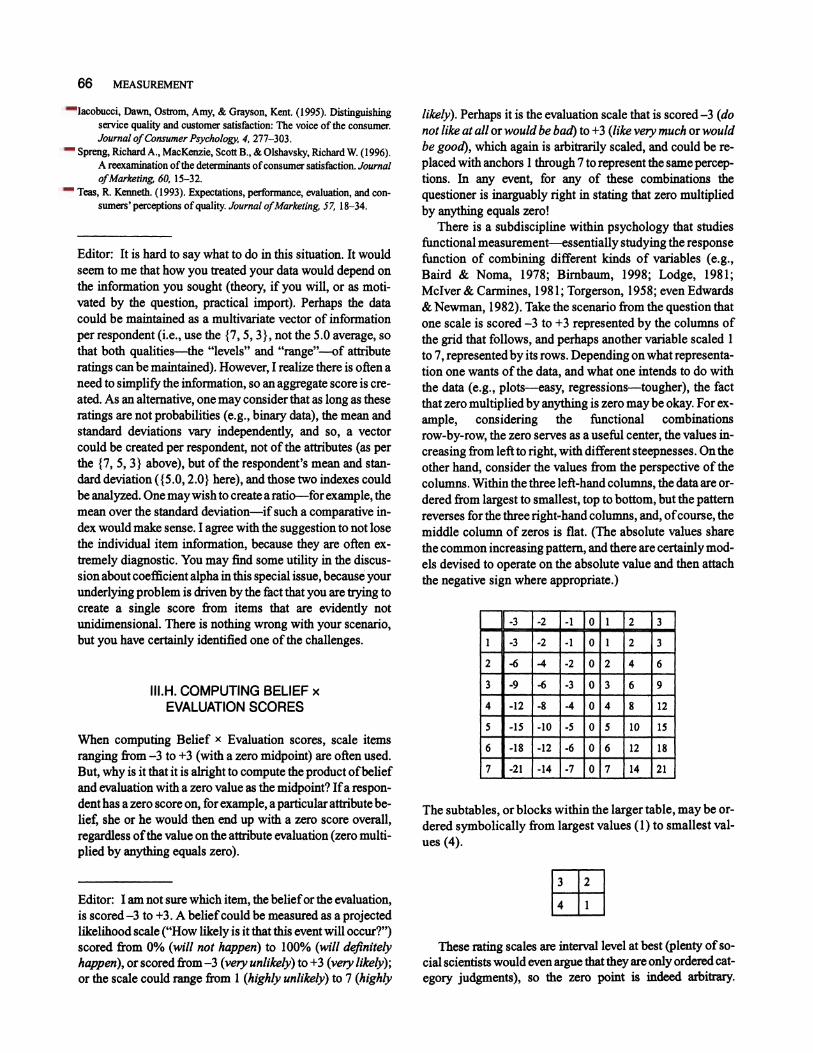
66 MEASUREMENT 66 MEASUREMENT
lacobucci, Dawn, Ostrom, Amy, & Grayson, Kent. (1995). Distinguishing service quality and customer satisfaction: The voice of the consumer. Journal of Consumer Psychology, 4, 277-303.
Spreng, Richard A., MacKenzie, Scott B., & Olshavsky, Richard W. (1996). A reexamination of the determinants of consumer satisfaction. Journal of Marketing, 60, 15-32.
Teas, R. Kenneth. (1993). Expectations, performance, evaluation, and con- sumers' perceptions of quality. Journal of Marketing, 57, 18-34.
Editor: It is hard to say what to do in this situation. It would seem to me that how you treated your data would depend on the information you sought (theory, if you will, or as moti- vated by the question, practical import). Perhaps the data could be maintained as a multivariate vector of information per respondent (i.e., use the {7, 5, 3}, not the 5.0 average, so that both qualities-the "levels" and "range"-of attribute ratings can be maintained). However, I realize there is often a need to simplify the information, so an aggregate score is cre- ated. As an alternative, one may consider that as long as these ratings are not probabilities (e.g., binary data), the mean and standard deviations vary independently, and so, a vector could be created per respondent, not of the attributes (as per the {7, 5, 3} above), but of the respondent's mean and stan- dard deviation ({5.0, 2.0} here), and those two indexes could be analyzed. One may wish to create a ratio-for example, the mean over the standard deviation-if such a comparative in- dex would make sense. I agree with the suggestion to not lose the individual item information, because they are often ex- tremely diagnostic. You may find some utility in the discus- sion about coefficient alpha in this special issue, because your underlying problem is driven by the fact that you are trying to create a single score from items that are evidently not unidimensional. There is nothing wrong with your scenario, but you have certainly identified one of the challenges.
III.H. COMPUTING BELIEF x EVALUATION SCORES
When computing Belief x Evaluation scores, scale items ranging from -3 to +3 (with a zero midpoint) are often used. But, why is it that it is alright to compute the product of belief and evaluation with a zero value as the midpoint? If a respon- dent has a zero score on, for example, a particular attribute be- lief, she or he would then end up with a zero score overall, regardless of the value on the attribute evaluation (zero multi- plied by anything equals zero).
Editor: I am not sure which item, the belief or the evaluation, is scored -3 to +3. A belief could be measured as a projected likelihood scale ("How likely is it that this event will occur?") scored from 0% (will not happen) to 100% (will definitely happen), or scored from -3 (very unlikely) to +3 (very likely); or the scale could range from 1 (highly unlikely) to 7 (highly
likely). Perhaps it is the evaluation scale that is scored -3 (do not like at all or would be bad) to +3 (like very much or would be good), which again is arbitrarily scaled, and could be re- placed with anchors 1 through 7 to represent the same percep- tions. In any event, for any of these combinations the questioner is inarguably right in stating that zero multiplied by anything equals zero!
There is a subdiscipline within psychology that studies functional measurement-essentially studying the response function of combining different kinds of variables (e.g., Baird & Noma, 1978; Birnbaum, 1998; Lodge, 1981; Mclver & Carmines, 1981; Torgerson, 1958; even Edwards & Newman, 1982). Take the scenario from the question that one scale is scored -3 to +3 represented by the columns of the grid that follows, and perhaps another variable scaled 1 to 7, represented by its rows. Depending on what representa- tion one wants of the data, and what one intends to do with the data (e.g., plots-easy, regressions-tougher), the fact that zero multiplied by anything is zero may be okay. For ex- ample, considering the functional combinations row-by-row, the zero serves as a useful center, the values in- creasing from left to right, with different steepnesses. On the other hand, consider the values from the perspective of the columns. Within the three left-hand columns, the data are or- dered from largest to smallest, top to bottom, but the pattern reverses for the three right-hand columns, and, of course, the middle column of zeros is flat. (The absolute values share the common increasing pattern, and there are certainly mod- els devised to operate on the absolute value and then attach the negative sign where appropriate.)
-3 -2 -1 0 1 2 3
1 -3 -2 -1 0 1 2 3
2 -6 -4 -2 0 2 4 6
3 -9 -6 -3 0 3 6 9
4 -12 -8 -4 0 4 8 12
5 -15 -10 -5 0 5 10 15
6 -18 -12 -6 0 6 12 18
7 -21 -14 -7 0 7 14 21
-3 -2 -1 0 1 2 3
1 -3 -2 -1 0 1 2 3
2 -6 -4 -2 0 2 4 6
3 -9 -6 -3 0 3 6 9
4 -12 -8 -4 0 4 8 12
5 -15 -10 -5 0 5 10 15
6 -18 -12 -6 0 6 12 18
7 -21 -14 -7 0 7 14 21
The subtables, or blocks within the larger table, may be or- dered symbolically from largest values (1) to smallest val- ues (4).
3 2
4 1
These rating scales are interval level at best (plenty of so- cial scientists would even argue that they are only ordered cat- egory judgments), so the zero point is indeed arbitrary.
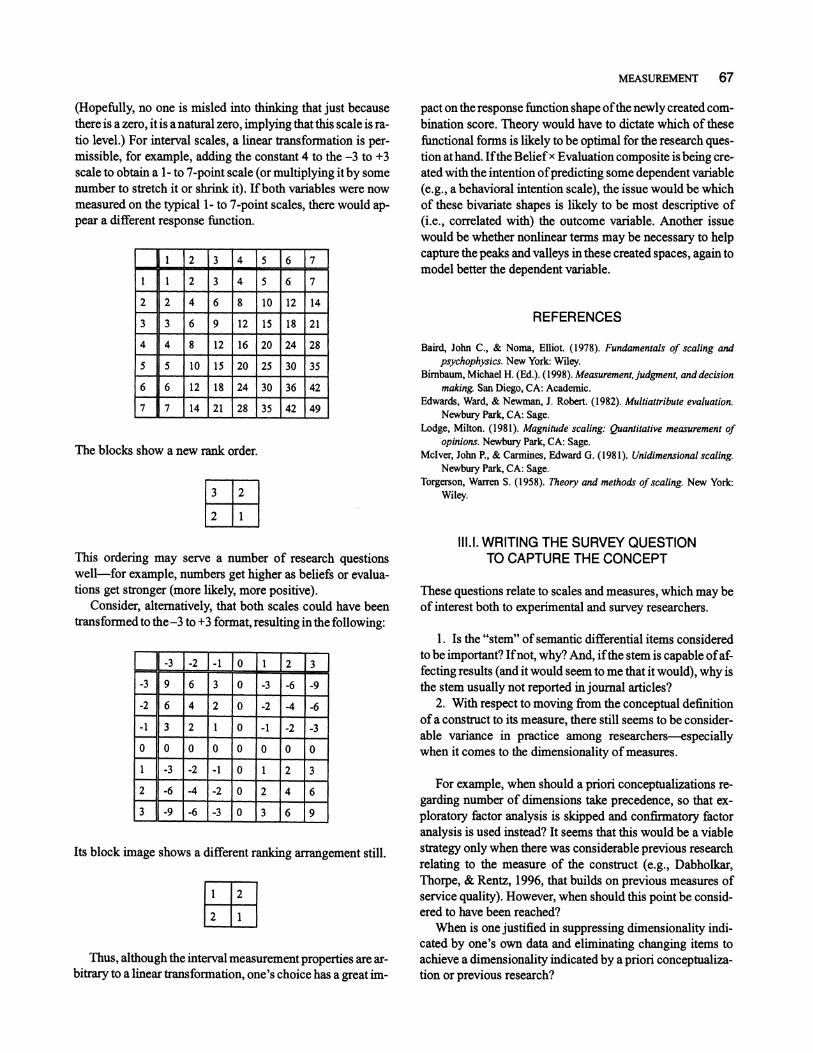
MEASUREMENT 67 MEASUREMENT 67
(Hopefully, no one is misled into thinking that just because there is a zero, it is a natural zero, implying that this scale is ra- tio level.) For interval scales, a linear transformation is per- missible, for example, adding the constant 4 to the -3 to +3 scale to obtain a 1- to 7-point scale (or multiplying it by some number to stretch it or shrink it). If both variables were now measured on the typical 1- to 7-point scales, there would ap- pear a different response function.
(Hopefully, no one is misled into thinking that just because there is a zero, it is a natural zero, implying that this scale is ra- tio level.) For interval scales, a linear transformation is per- missible, for example, adding the constant 4 to the -3 to +3 scale to obtain a 1- to 7-point scale (or multiplying it by some number to stretch it or shrink it). If both variables were now measured on the typical 1- to 7-point scales, there would ap- pear a different response function.
1 2 3 4 5 6 7 m , -- --- . . - . .. . - -
1 1 2 3 4 5 6 7
2 2 4 6 8 10 12 14
3 3 6 9 12 15 18 21
4 4 8 12 16 20 24 28
5 5 10 15 20 25 30 35
6 6 12 18 24 30 36 42
7 7 14 21 28 35 42 49
1 2 3 4 5 6 7 m , -- --- . . - . .. . - -
1 1 2 3 4 5 6 7
2 2 4 6 8 10 12 14
3 3 6 9 12 15 18 21
4 4 8 12 16 20 24 28
5 5 10 15 20 25 30 35
6 6 12 18 24 30 36 42
7 7 14 21 28 35 42 49
The blocks show a new rank order.
3 2
2 1
This ordering may serve a number of research questions well-for example, numbers get higher as beliefs or evalua- tions get stronger (more likely, more positive).
Consider, alternatively, that both scales could have been transformed to the -3 to +3 format, resulting in the following:
-3 -2 -1 0 1 2 3
-3 9 6 3 0 -3 -6 -9
-2 6 4 2 0 -2 -4 -6
-1 3 2 1 0 -1 -2 -3
0 O O O O O O 0
1 -3 -2 -1 0 1 2 3
2 -6 -4 -2 0 2 4 6
3 -9 -6 -3 0 3 6 9
-3 -2 -1 0 1 2 3
-3 9 6 3 0 -3 -6 -9
-2 6 4 2 0 -2 -4 -6
-1 3 2 1 0 -1 -2 -3
0 O O O O O O 0
1 -3 -2 -1 0 1 2 3
2 -6 -4 -2 0 2 4 6
3 -9 -6 -3 0 3 6 9
Its block image shows a different ranking arrangement still.
1 2
2 1
Thus, although the interval measurement properties are ar- bitrary to a linear transformation, one's choice has a great im-
Its block image shows a different ranking arrangement still.
1 2
2 1
Thus, although the interval measurement properties are ar- bitrary to a linear transformation, one's choice has a great im-
pact on the response function shape of the newly created com- bination score. Theory would have to dictate which of these functional forms is likely to be optimal for the research ques- tion at hand. If the Belief x Evaluation composite is being cre- ated with the intention of predicting some dependent variable (e.g., a behavioral intention scale), the issue would be which of these bivariate shapes is likely to be most descriptive of (i.e., correlated with) the outcome variable. Another issue would be whether nonlinear terms may be necessary to help capture the peaks and valleys in these created spaces, again to model better the dependent variable.
REFERENCES
Baird, John C., & Noma, Elliot. (1978). Fundamentals of scaling and psychophysics. New York: Wiley.
Bimbaum, Michael H. (Ed.). (1998). Measurement, judgment, and decision making. San Diego, CA: Academic.
Edwards, Ward, & Newman, J. Robert. (1982). Multiattribute evaluation. Newbury Park, CA: Sage.
Lodge, Milton. (1981). Magnitude scaling: Quantitative measurement of opinions. Newbury Park, CA: Sage.
Mclver, John P., & Carmines, Edward G. (1981). Unidimensional scaling. Newbury Park, CA: Sage.
Torgerson, Warren S. (1958). Theory and methods of scaling. New York: Wiley.
111.1. WRITING THE SURVEY QUESTION TO CAPTURE THE CONCEPT
These questions relate to scales and measures, which may be of interest both to experimental and survey researchers.
1. Is the "stem" of semantic differential items considered to be important? Ifnot, why? And, if the stem is capable of af- fecting results (and it would seem to me that it would), why is the stem usually not reported in journal articles?
2. With respect to moving from the conceptual definition of a construct to its measure, there still seems to be consider- able variance in practice among researchers-especially when it comes to the dimensionality of measures.
For example, when should a priori conceptualizations re- garding number of dimensions take precedence, so that ex- ploratory factor analysis is skipped and confirmatory factor analysis is used instead? It seems that this would be a viable strategy only when there was considerable previous research relating to the measure of the construct (e.g., Dabholkar, Thorpe, & Rentz, 1996, that builds on previous measures of service quality). However, when should this point be consid- ered to have been reached?
When is one justified in suppressing dimensionality indi- cated by one's own data and eliminating changing items to achieve a dimensionality indicated by a priori conceptualiza- tion or previous research?
68 MEASUREMENT
REFERENCE
Dabholkar, Pratibha A., Thorpe, Dayle I., & Rentz, Joseph 0. (1996). A mea- sure of service quality for retail stores: Scale development and valida- tion. Journal of the Academy of Marketing Science, 24, 3-16.
Professor William Bearden University of South Carolina
This problem submission raised two distinct questions: (a) Is the stem important in the use of semantic differential mea- surement items?, and (b) How does one handle problems en- countered in the use of existing scales or measurement inventories when conceptual dimensionality and unidimen-
sionality occur? In response to the first question, the term stem is assumed
in this brief response to refer to the introductory statement or written context that directs the respondent, as objects, con-
cepts, and products are evaluated by a series of bipolar adjec- tives or adjective sets. As originally developed, the perceived meaning of the semantic differential adjective sets are often viewed as reflecting one of three components: potency, activ-
ity, and evaluation. Evaluation is the most frequently studied
component in marketing. Clearly, the stem could affect re-
sponses to a set of semantic differential items, and, more im-
portant, these instructive statements, as implied by your question, indeed should be described in academic journals. Frequently, however, the stem is shown in an appendix or ta- ble or reproduced in the Method section of many articles. As one noteworthy example, consider Zaichkowsky's (1985) original Personal Involvement Inventory (pp. 349-350):
The purpose of this study is to measure a person's in- volvement or interest in (various products they regu- larly purchase or have purchased in the past). To take this measure, we need you to judge various (products) against a series of descriptive scales according to how YOU perceive the product you will be shown. Here is how you are to use these scales: (instructions and exam-
ples were then given for using or marking the positions across the seven-place scaled response format).
Be sure that you check every scale for every (prod- uct); do not omit any.
Never put more than one check mark on a single scale.
Make each item a separate and independent judg- ment. Work at a fairly high speed through the question- naire. Do not worry or puzzle over items. It is your first impressions, the immediate feelings about the items, that we want. On the other hand, please do not be care- less, because we want your true impressions.
Mehrabian and Russell's (1974, pp. 206-215) Pleasure Arousal Dominance (PAD) scale (i.e., the Dimensions ofEmo-
tions scale) represents another frequently cited example. One set of instructions used to introduce the PAD items follows:
Each pair of words below describes a feeling dimen- sion. Some of the pairs might seem unusual, but you may generally feel more one way than another. So, for each pair, put a check mark to show how you feel about
. Please take your time so as to arrive at a real characteristic description of your feelings.
REFERENCES
Mehrabian, Albert, & Russell, James. (1974). An approach to environmental psychology. Cambridge, MA: MIT Press.
Zaichkowsky, Judith Lynne. (1985). Measuring the involvement construct. Journal of Consumer Research, 12, 341-352.
The answer to the second question (How does one handle
problems encountered in the use of existing scales or mea- surement inventories when conceptual dimensionality and
unidimensionality occur?) addresses situations in which re- searchers are applying or using previously published mea- sures that may or may not have conceptually distinct dimensions. That is, problems can occur in the use of existing measures when a priori multiple dimensions do not replicate or when scales assumed to be unidimensional are found em-
pirically on new data to have multiple dimensions. These are
very complex issues that cannot be answered completely in a brief response. I have found the articles cited in the following to be helpful and representative of the many articles and books written on scale development and the measurement of multidimensional constructs.
To begin, you are correct in your conclusion that dimen-
sionality of multi-item scales designed to operationalize unobservable constructs is handled unevenly by consumer re-
searchers, as well as researchers in other disciplines. To some
extent, initial measurement evaluation (i.e., immediately fol-
lowing data collection for a project in which a previously pub- lished measure was assessed) using confirmatory factor
analysis (CFA) assumes that the applied multidimensional scale is valid. More important, this assumption is dependent on the quality of the conceptual underpinings of the construct and the quality of the original scale development procedures (cf. Churchill, 1979). Users of existing measures should eval- uate the original sources and other uses of the scale. Blind use of previously used items or measures can lead to disappoint- ing results, as the quality and depth of scale development var- ies dramatically.
As an example, consider an existing well-crafted two-fac- tor scale with multiple items per dimension. The validity of the measure may be assessed using the new data and CFA
procedures. These analyses enable the scale user to evaluate variance extracted, construct reliability, item reliability, discriminant validity, and overall model fit. These analyses
MEASUREMENT 69
are described by Anderson and Gerbing (1988), Browne and Cudeck (1993), Fornell and Larcker (1981), and McDonald (1981), among many others.
As the author of this question acknowledges, what hap- pens when the evidence in support of the existing scale is not supportive based on the new sample data? If the a priori factor structure is clearly not evident in the new data, the item set may be reanalyzed using exploratory factor analysis in an at- tempt to identify meaningful factors or dimensions that underly this authors' data. Reliability estimates and the items used to develop any new variables should be clearly described in the Method section of the article. Obviously, such disap- pointing replications represent red flags to journal article reviewers. As such, extensive revisions to prior scale dimen- sionality are questionable.
On other occasions, individual items will possess low reli- ability or load highly on the wrong factor. In these instances, one or a few items may well be deleted, whereas the original factor structure is maintained. These revisions should also be reported in the Method section or in a footnote within the arti- cle. In addition, and from my experience, lengthy scales when applied to new data seldom replicate exactly. Multiple factors even for previously hypothesized unidimensional scales and unreliable items are commonplace. As well-known exam- ples, one needs only consider the extensive factor analyses of the original involvement scale (Zaichkowsky, 1985) and the SERVQUAL instrument (e.g., Parasuraman, Berry, & Zeithaml, 1994). Likewise, excellent model fit for a replica- tion of the multidimensional and higher order Service Quality Scale for Retail Stores (Dabholkar, Thorpe, & Rentz, 1996) that you inquired about using new data and for new stores may well not occur.
REFERENCES
Anderson, James C., & Gerbing, David W. (1988). Structural equation mod- eling in practice: A review and recommended two-step approach. Psy- chological Bulletin, 103, 411-423.
Browne, Michael W., & Cudeck, Robert. (1993). Alternative ways of assess- ing model fit. In Kenneth A. Bollen & John S. Long (Eds.), Testing structural equation models (pp. 136-162). Newbury Park, CA: Sage.
Churchill, Gilbert A., Jr. (1979). A paradigm for developing better measures of marketing constructs. Journal of Marketing Research, 16, 64-73.
Dabholkar, Pratibha A., Thorpe, Dayle I., & Rentz, Joseph 0. (1996). A mea- sure of service quality for retail stores: Scale development and valida- tion. Journal of the Academy of Marketing Science, 24, 3-16.
Fomell, Claes, & Larcker, David F. (1981). Evaluating structural equation models with unobservable variables and measurement error. Journal of Marketing Research, 18, 39-50.
McDonald, Roderick P. (1981). The dimensionality oftests and items. British Journal of Mathematical and Statistical Psychology, 34, 100-117.
Parasuraman, A., Berry, Leonard, & Zeithaml, Valarie. (1994). Reassess- ment of expectations as a comparison standard in measuring service
quality: Implications for further research. Journal of Marketing, 58, 111-124.
Zaichkowsky, Judith Lynne. (1985). Measuring the involvement construct. Journal of Consumer Research, 12, 341-352.
Professor William R. Dillon Southern Methodist University
My answer to the second question entertains that the use of confirmatory factor analysis is, in large measure, predi- cated on the researcher having strong theory to rely on. However, as we all know too well, one's theories are rarely as strong as we would like. Thus, the dilemma is whether we should allow the dimensionality to be driven by one's own data or use the dimensionality as dictated by theory or previous research. In addressing this question, there are some obvious issues that should be considered, although there are not any precise analytics that provide a clear road map. First, if previous research is available, it is always sage to compare the samples, method of administration, and the factor extraction and rotation procedures used. Dimensionality can be acutely influenced by outliers, the extraction method, and the choice of rotation. With respect to eliminating items to achieve a particular dimensionality, I think this is dangerous, especially if practiced blatantly. This practice more often than not results in constructs de- fined by few indicators (three or four or not more than five). The danger is that the construct loses its original in- tended meaning and instead becomes isomorphic with the few items used in its operationalization.


