This presentation contains "forward-looking statements" within the meaning of applicable securities laws, including statements relating to life of
mine production plans, exploration plans and the growth and strategy of Mandalay. Actual results and developments may differ materially from
those contemplated by these statements depending on, among other things: exploration results or production results not meeting management’s
expectations; capital, production and operating cost results not meeting current plans; and changes in commodity prices and general market and
economic conditions. The factors identified above are not intended to represent a complete list of the factors that could affect Mandalay. A
description of additional risks that could result in actual results and developments differing from those contemplated by forward looking
statements in this news release can be found under the heading “Risk Factors” in Mandalay’s annual information form dated March 30, 2016 and
in its final prospectus dated July 18, 2016, copies of which are available under Mandalay's profile at www.sedar.com. Although Mandalay has
attempted to identify important factors that could cause actual actions, events or results to differ materially from those described in forward-
looking statements, there may be other factors that cause actions, events or results not to be as anticipated, estimated or intended. There can be
no assurance that forward-looking statements will prove to be accurate, as actual results and future events could differ materially from those
anticipated in such statements. Accordingly, readers should not place undue reliance on forward-looking statements.
Quality Control and AssuranceQuality control and assurance programs are implemented in line with the standards of National Instrument 43-101.
The exploration programs at Costerfield and Björkdal are supervised by Chris Gregory (Member, Australian Institute of Geoscientists, VP of
Operational Geology for Mandalay and a “Qualified Person” as defined under National Instrument 43-101. Mr. Gregory regularly visits Costerfield
and Björkdal, and supervises the collection and interpretation of scientific and technical information contained in this presentation.
The exploration programs at the Cerro Bayo and Challacollo projects are supervised by Scott Manske, Chief Cordilleran Geologist of Mandalay
Resources, and an Oregon registered Professional Geologist. A “Qualified Person” as defined by NI 43-101, he has reviewed and approved the
technical and scientific information on these projects contained in the presentation.
Dr. Mark Sander (Member: AusIMM), President and CEO of Mandalay, has visited the Costerfield, Cerro Bayo, Challacollo, and Björkdal and
has supervised the preparation of this presentation.
All currency references in US$ unless otherwise indicated
Forward-looking Statements
2
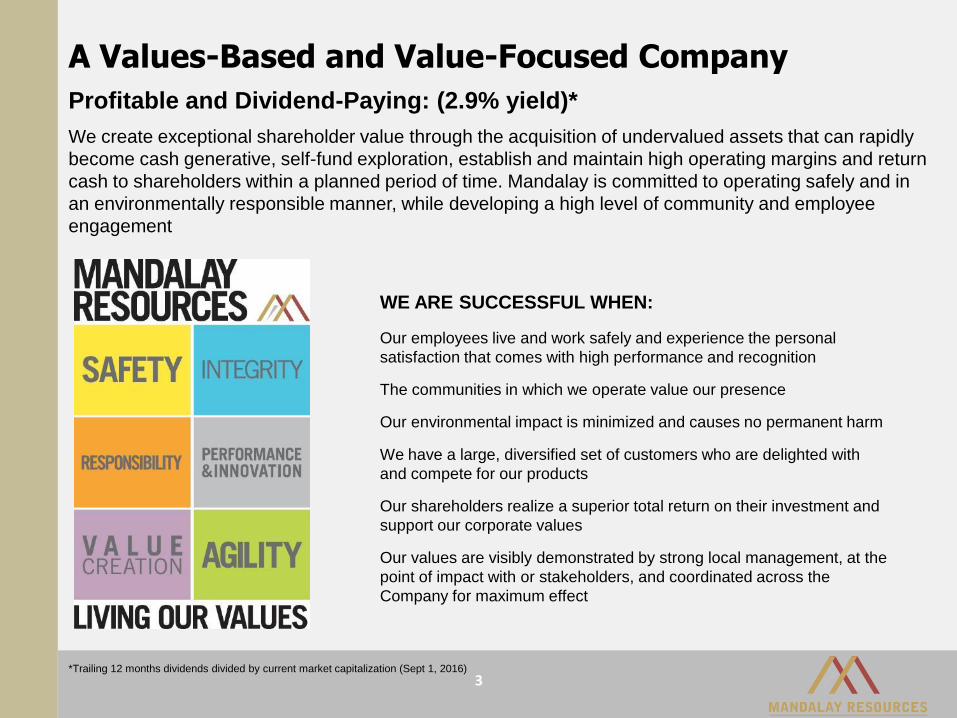
A Values-Based and Value-Focused Company
We create exceptional shareholder value through the acquisition of undervalued assets that can rapidly
become cash generative, self-fund exploration, establish and maintain high operating margins and return
cash to shareholders within a planned period of time. Mandalay is committed to operating safely and in
an environmentally responsible manner, while developing a high level of community and employee
engagement
WE ARE SUCCESSFUL WHEN:
Our employees live and work safely and experience the personal
satisfaction that comes with high performance and recognition
The communities in which we operate value our presence
Our environmental impact is minimized and causes no permanent harm
We have a large, diversified set of customers who are delighted with
and compete for our products
Our shareholders realize a superior total return on their investment and
support our corporate values
Our values are visibly demonstrated by strong local management, at the
point of impact with or stakeholders, and coordinated across the
Company for maximum effect
Profitable and Dividend-Paying: (2.9% yield)*
*Trailing 12 months dividends divided by current market capitalization (Sept 1, 2016)
3
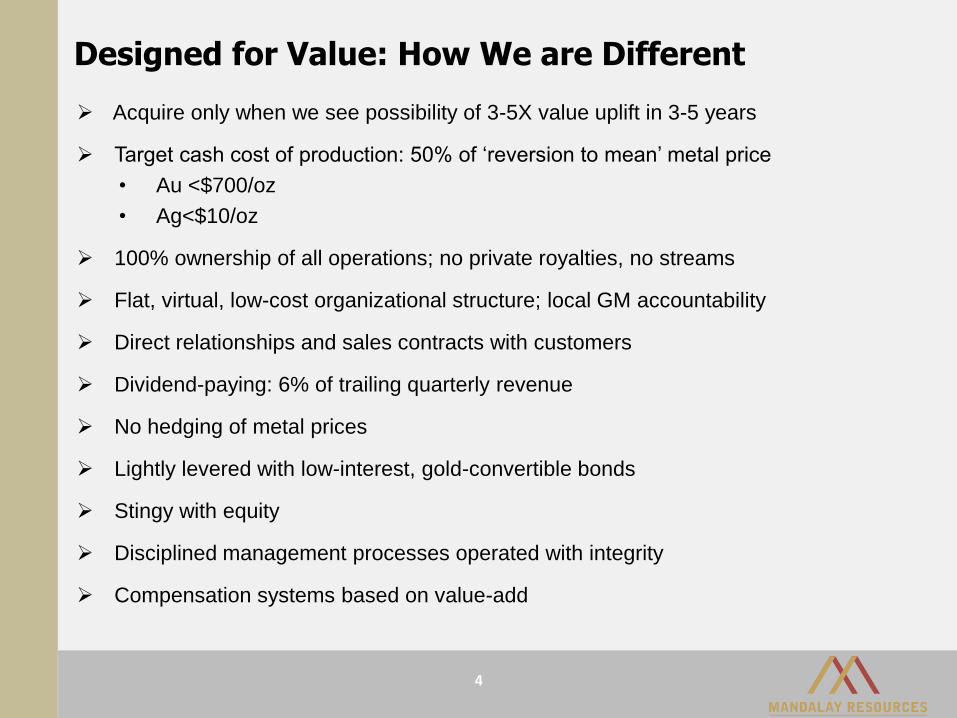
Designed for Value: How We are Different
Acquire only when we see possibility of 3-5X value uplift in 3-5 years
Target cash cost of production: 50% of ‘reversion to mean’ metal price
• Au <$700/oz
• Ag<$10/oz
100% ownership of all operations; no private royalties, no streams
Flat, virtual, low-cost organizational structure; local GM accountability
Direct relationships and sales contracts with customers
Dividend-paying: 6% of trailing quarterly revenue
No hedging of metal prices
Lightly levered with low-interest, gold-convertible bonds
Stingy with equity
Disciplined management processes operated with integrity
Compensation systems based on value-add
4
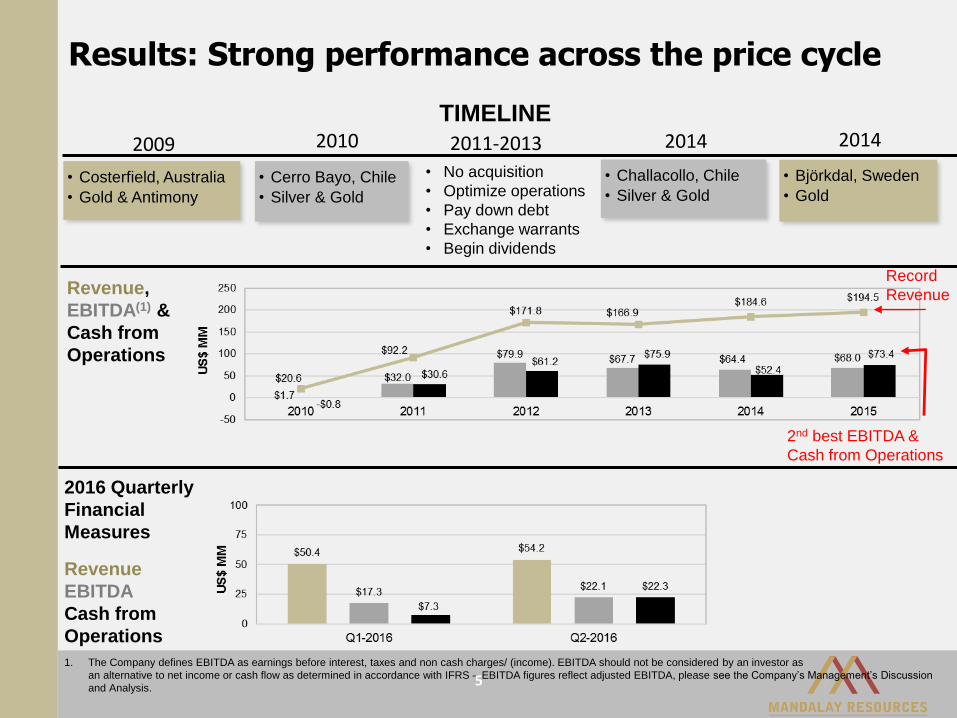
2009
• Costerfield, Australia
• Gold & Antimony
2010
• Cerro Bayo, Chile
• Silver & Gold
2014
• Challacollo, Chile
• Silver & Gold
2014
• Björkdal, Sweden
• Gold
Results: Strong performance across the price cycle
1. The Company defines EBITDA as earnings before interest, taxes and non cash charges/ (income). EBITDA should not be considered by an investor as
an alternative to net income or cash flow as determined in accordance with IFRS – EBITDA figures reflect adjusted EBITDA, please see the Company’s Management’s Discussion
and Analysis.
TIMELINE
2016 Quarterly
Financial
Measures
Revenue,
EBITDA(1) &
Cash from
Operations
Revenue
EBITDA
Cash from
Operations
Record
Revenue
2nd best EBITDA &
Cash from Operations
• No acquisition
• Optimize operations
• Pay down debt
• Exchange warrants
• Begin dividends
2011-2013
5
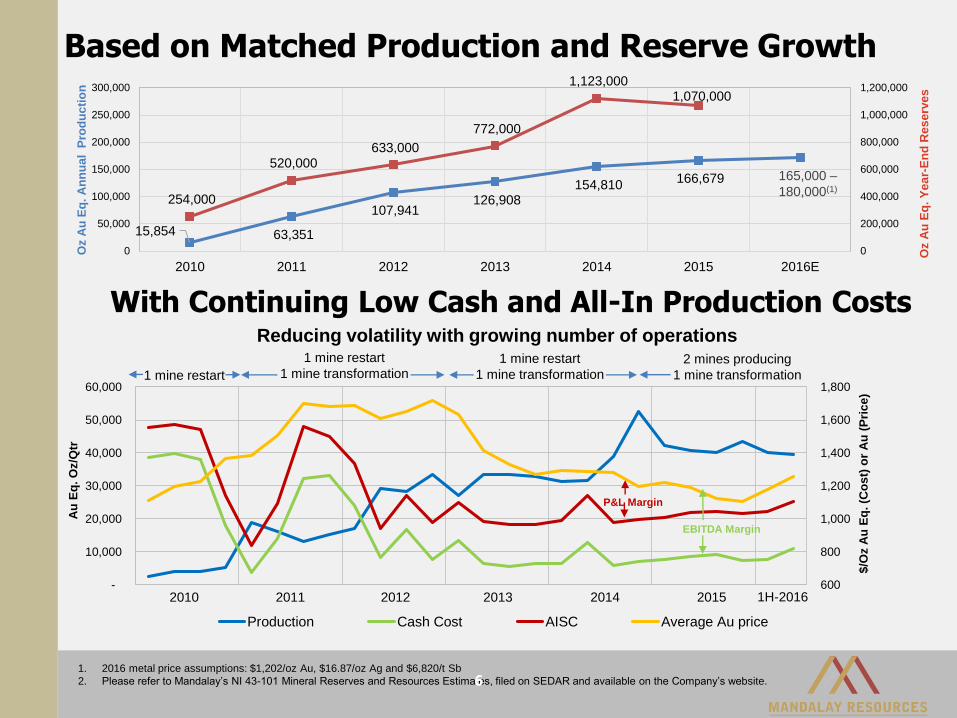
1. 2016 metal price assumptions: $1,202/oz Au, $16.87/oz Ag and $6,820/t Sb
2. Please refer to Mandalay’s NI 43-101 Mineral Reserves and Resources Estimates, filed on SEDAR and available on the Company’s website.6
Based on Matched Production and Reserve Growth
6
15,854 63,351
107,941 126,908
154,810 166,679
254,000
520,000 633,000
772,000
1,123,000 1,070,000
0
200,000
400,000
600,000
800,000
1,000,000
1,200,000
0
50,000
100,000
150,000
200,000
250,000
300,000
2010 2011 2012 2013 2014 2015 2016E
Oz A
u E
q.
Ye
ar-
En
d R
es
erv
es
Oz A
u E
q.
An
nu
al
Pro
du
cti
on
165,000 –
180,000(1)
With Continuing Low Cash and All-In Production Costs
$/O
z A
u E
q. (C
os
t) o
r A
u (
Pri
ce
)
600
800
1,000
1,200
1,400
1,600
1,800
-
10,000
20,000
30,000
40,000
50,000
60,000
Production Cash Cost AISC Average Au price
Au
Eq
. O
z/Q
tr
Reducing volatility with growing number of operations
1 mine restart
1 mine restart
1 mine transformation1 mine restart
1 mine transformation2 mines producing
1 mine transformation
P&L Margin
EBITDA Margin
2010 2011 2012 2013 2014 2015 1H-2016
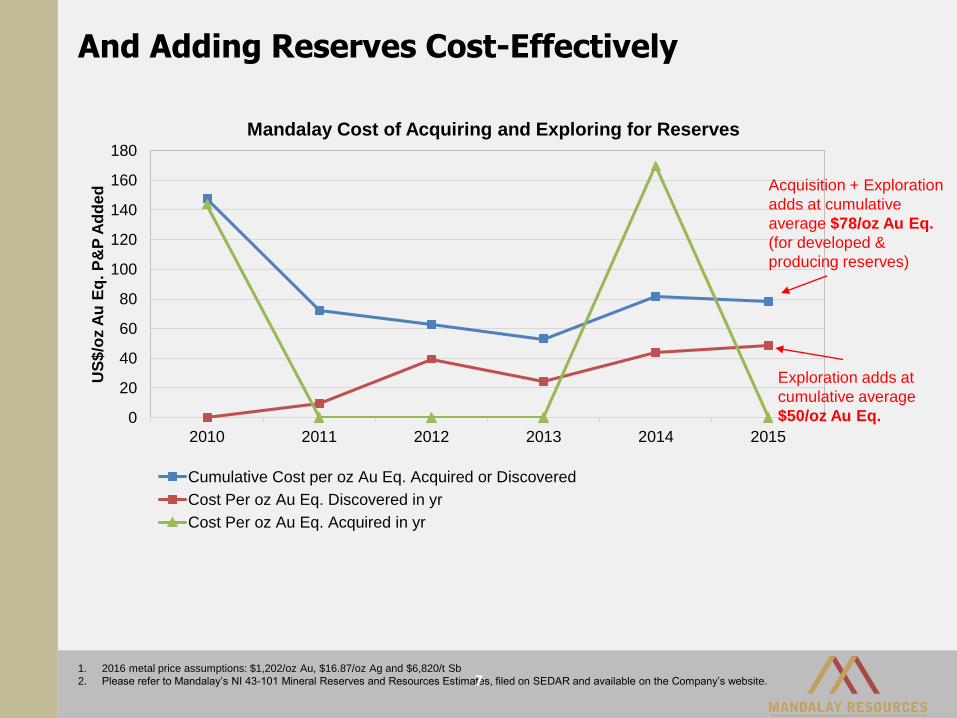
And Adding Reserves Cost-Effectively
1. 2016 metal price assumptions: $1,202/oz Au, $16.87/oz Ag and $6,820/t Sb
2. Please refer to Mandalay’s NI 43-101 Mineral Reserves and Resources Estimates, filed on SEDAR and available on the Company’s website.7
0
20
40
60
80
100
120
140
160
180
2010 2011 2012 2013 2014 2015
US
$/o
z A
u E
q. P
&P
Ad
ded
Mandalay Cost of Acquiring and Exploring for Reserves
Cumulative Cost per oz Au Eq. Acquired or Discovered
Cost Per oz Au Eq. Discovered in yr
Cost Per oz Au Eq. Acquired in yr
Exploration adds at
cumulative average
$50/oz Au Eq.
Acquisition + Exploration
adds at cumulative
average $78/oz Au Eq.
(for developed &
producing reserves)
0
2
4
6
8
10
12
14
16
18
20
-$20,000
$0
$20,000
$40,000
$60,000
$80,000
$100,000
Sep-09 Sep-10 Sep-11 Sep-12 Sep-13 Sep-14 Sep-15
Volu
me (
mill
ions)
Invest
ment
Valu
e
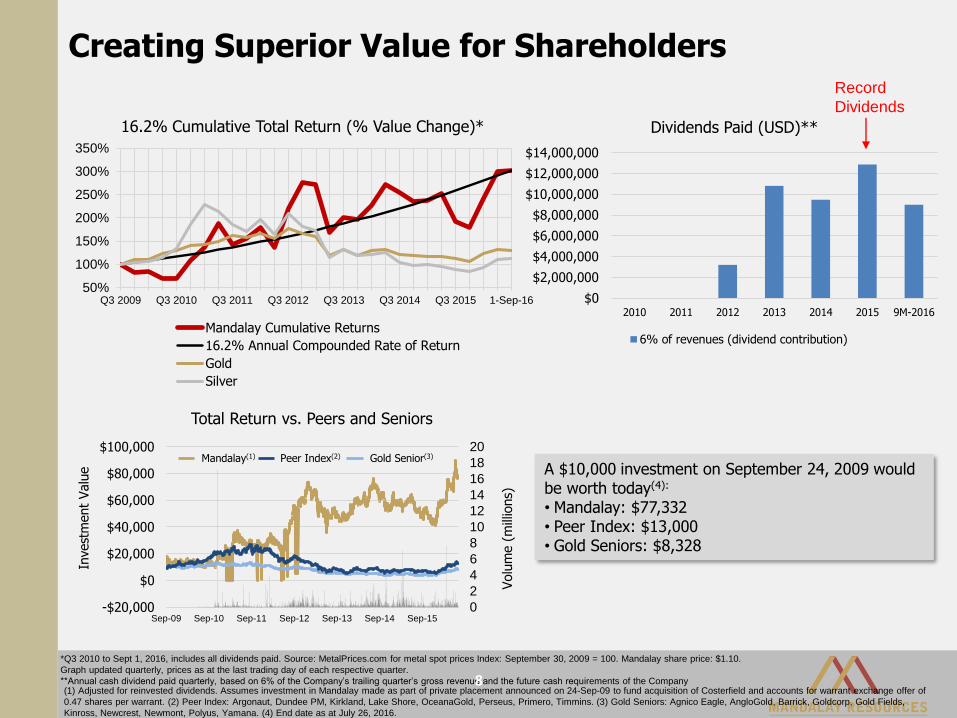
(1) Adjusted for reinvested dividends. Assumes investment in Mandalay made as part of private placement announced on 24-Sep-09 to fund acquisition of Costerfield and accounts for warrant exchange offer of
0.47 shares per warrant. (2) Peer Index: Argonaut, Dundee PM, Kirkland, Lake Shore, OceanaGold, Perseus, Primero, Timmins. (3) Gold Seniors: Agnico Eagle, AngloGold, Barrick, Goldcorp, Gold Fields,
Kinross, Newcrest, Newmont, Polyus, Yamana. (4) End date as at July 26, 2016.
Creating Superior Value for Shareholders
$0
$2,000,000
$4,000,000
$6,000,000
$8,000,000
$10,000,000
$12,000,000
$14,000,000
2010 2011 2012 2013 2014 2015 9M-2016
Dividends Paid (USD)**
6% of revenues (dividend contribution)
16.2% Cumulative Total Return (% Value Change)*
*Q3 2010 to Sept 1, 2016, includes all dividends paid. Source: MetalPrices.com for metal spot prices Index: September 30, 2009 = 100. Mandalay share price: $1.10.
Graph updated quarterly, prices as at the last trading day of each respective quarter.
**Annual cash dividend paid quarterly, based on 6% of the Company’s trailing quarter’s gross revenue and the future cash requirements of the Company
Mandalay(1) Peer Index(2) Gold Senior(3)
Total Return vs. Peers and Seniors
A $10,000 investment on September 24, 2009 would be worth today(4):
• Mandalay: $77,332• Peer Index: $13,000• Gold Seniors: $8,328
8
Record
Dividends
50%
100%
150%
200%
250%
300%
350%
Q3 2009 Q3 2010 Q3 2011 Q3 2012 Q3 2013 Q3 2014 Q3 2015 1-Sep-16
Mandalay Cumulative Returns
16.2% Annual Compounded Rate of Return
Gold
Silver
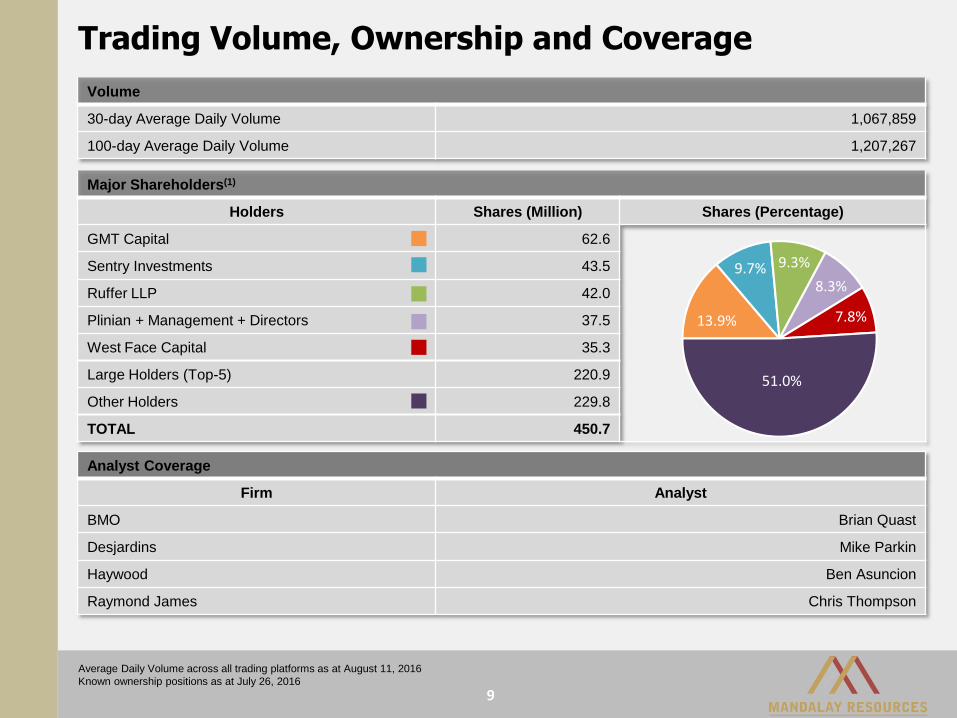
Trading Volume, Ownership and Coverage
Major Shareholders(1)
Holders Shares (Million) Shares (Percentage)
GMT Capital 62.6
Sentry Investments 43.5
Ruffer LLP 42.0
Plinian + Management + Directors 37.5
West Face Capital 35.3
Large Holders (Top-5) 220.9
Other Holders 229.8
TOTAL 450.7
Analyst Coverage
Firm Analyst
BMO Brian Quast
Desjardins Mike Parkin
Haywood Ben Asuncion
Raymond James Chris Thompson
Volume
30-day Average Daily Volume 1,067,859
100-day Average Daily Volume 1,207,267
13.9%
9.7% 9.3%
8.3%
7.8%
51.0%
9
Average Daily Volume across all trading platforms as at August 11, 2016
Known ownership positions as at July 26, 2016
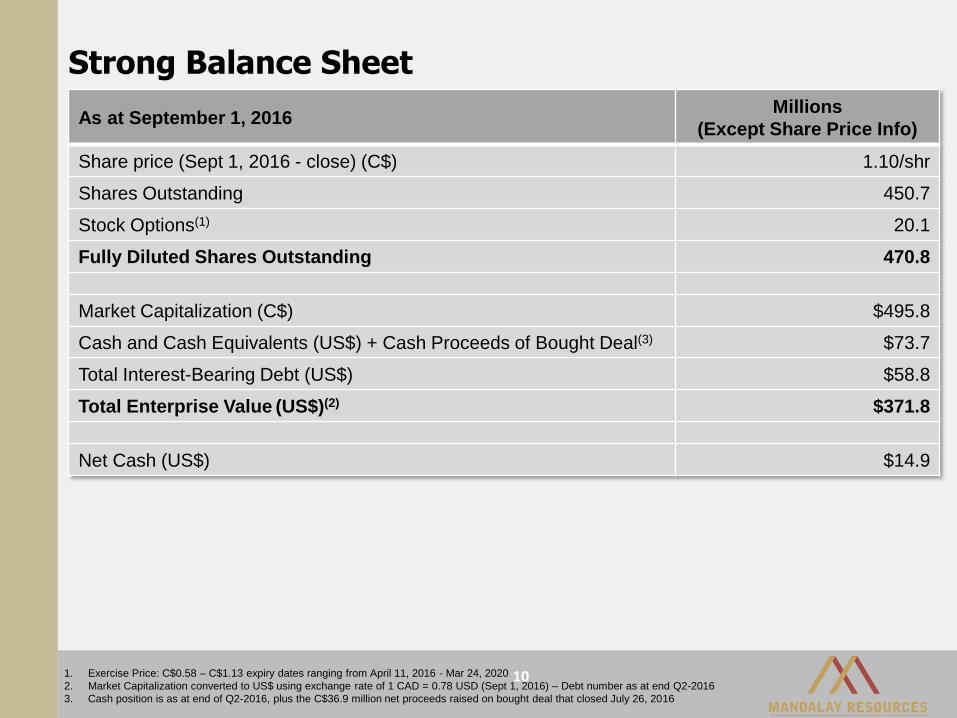
As at September 1, 2016 Millions
(Except Share Price Info)
Share price (Sept 1, 2016 - close) (C$) 1.10/shr
Shares Outstanding 450.7
Stock Options(1) 20.1
Fully Diluted Shares Outstanding 470.8
Market Capitalization (C$) $495.8
Cash and Cash Equivalents (US$) + Cash Proceeds of Bought Deal(3) $73.7
Total Interest-Bearing Debt (US$) $58.8
Total Enterprise Value (US$)(2) $371.8
Net Cash (US$) $14.9
Strong Balance Sheet
1. Exercise Price: C$0.58 – C$1.13 expiry dates ranging from April 11, 2016 - Mar 24, 2020
2. Market Capitalization converted to US$ using exchange rate of 1 CAD = 0.78 USD (Sept 1, 2016) – Debt number as at end Q2-2016
3. Cash position is as at end of Q2-2016, plus the C$36.9 million net proceeds raised on bought deal that closed July 26, 2016
10
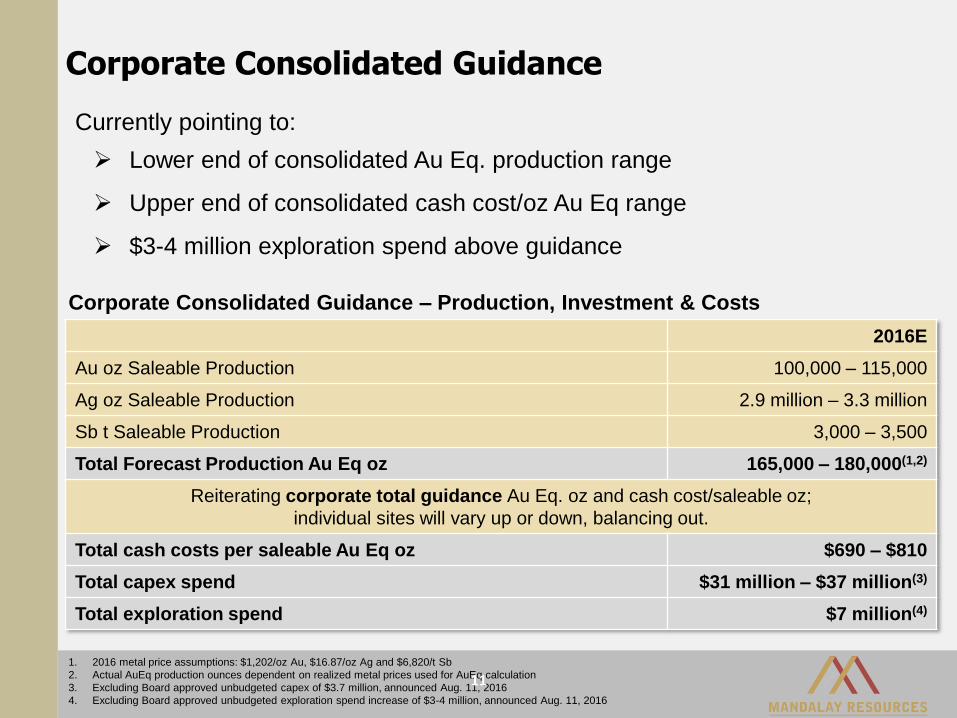
Corporate Consolidated Guidance
2016E
Au oz Saleable Production 100,000 – 115,000
Ag oz Saleable Production 2.9 million – 3.3 million
Sb t Saleable Production 3,000 – 3,500
Total Forecast Production Au Eq oz 165,000 – 180,000(1,2)
Reiterating corporate total guidance Au Eq. oz and cash cost/saleable oz;
individual sites will vary up or down, balancing out.
Total cash costs per saleable Au Eq oz $690 – $810
Total capex spend $31 million – $37 million(3)
Total exploration spend $7 million(4)
1. 2016 metal price assumptions: $1,202/oz Au, $16.87/oz Ag and $6,820/t Sb
2. Actual AuEq production ounces dependent on realized metal prices used for AuEq calculation
3. Excluding Board approved unbudgeted capex of $3.7 million, announced Aug. 11, 2016
4. Excluding Board approved unbudgeted exploration spend increase of $3-4 million, announced Aug. 11, 2016
11
Corporate Consolidated Guidance – Production, Investment & Costs
Currently pointing to:
Lower end of consolidated Au Eq. production range
Upper end of consolidated cash cost/oz Au Eq range
$3-4 million exploration spend above guidance
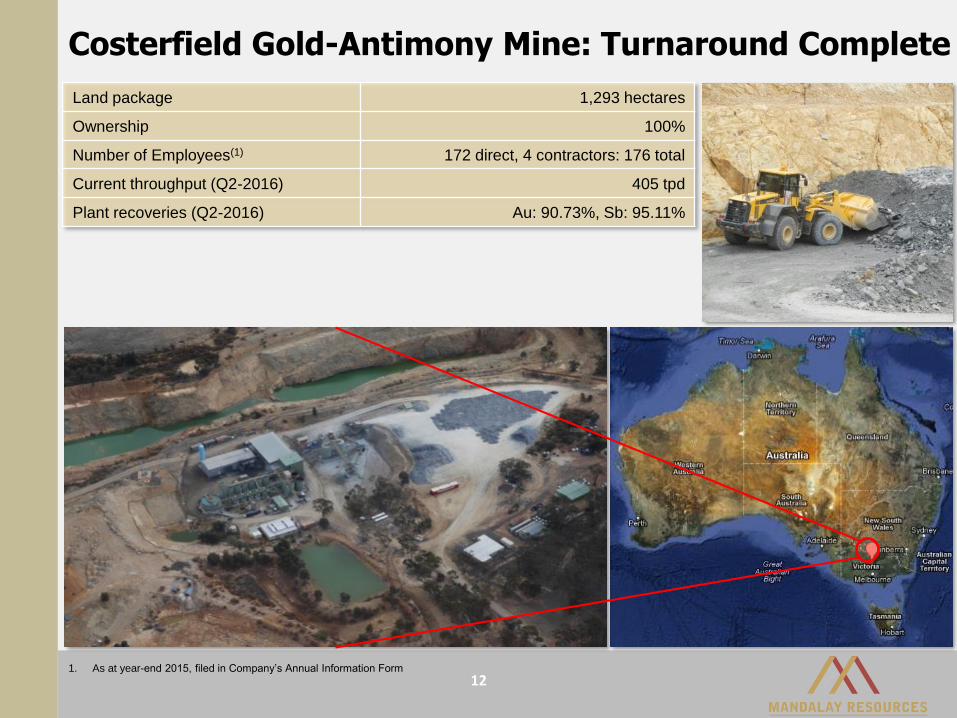
Costerfield Gold-Antimony Mine: Turnaround Complete
Land package 1,293 hectares
Ownership 100%
Number of Employees(1) 172 direct, 4 contractors: 176 total
Current throughput (Q2-2016) 405 tpd
Plant recoveries (Q2-2016) Au: 90.73%, Sb: 95.11%
1. As at year-end 2015, filed in Company’s Annual Information Form
12
13
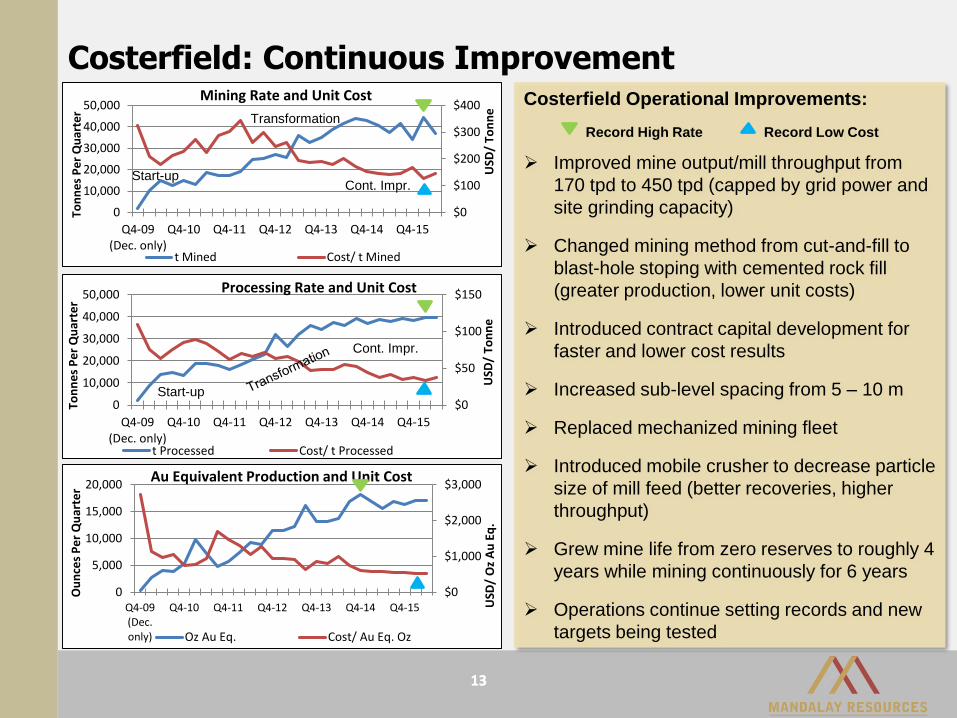
Costerfield: Continuous Improvement
$0
$100
$200
$300
$400
0
10,000
20,000
30,000
40,000
50,000
Q4-09(Dec. only)
Q4-10 Q4-11 Q4-12 Q4-13 Q4-14 Q4-15
USD
/ To
nn
e
Ton
nes
Pe
r Q
uar
ter
Mining Rate and Unit Cost
t Mined Cost/ t Mined
$0
$50
$100
$150
0
10,000
20,000
30,000
40,000
50,000
Q4-09(Dec. only)
Q4-10 Q4-11 Q4-12 Q4-13 Q4-14 Q4-15
USD
/ To
nn
e
Ton
ne
s P
er
Qu
arte
r
Processing Rate and Unit Cost
t Processed Cost/ t Processed
Cont. Impr.
Start-up
$0
$1,000
$2,000
$3,000
0
5,000
10,000
15,000
20,000
Q4-09(Dec.only)
Q4-10 Q4-11 Q4-12 Q4-13 Q4-14 Q4-15 USD
/ O
z A
u E
q.
Ou
nce
s P
er
Qu
arte
r
Au Equivalent Production and Unit Cost
Oz Au Eq. Cost/ Au Eq. Oz
Costerfield Operational Improvements:
Record High Rate Record Low Cost
Improved mine output/mill throughput from
170 tpd to 450 tpd (capped by grid power and
site grinding capacity)
Changed mining method from cut-and-fill to
blast-hole stoping with cemented rock fill
(greater production, lower unit costs)
Introduced contract capital development for
faster and lower cost results
Increased sub-level spacing from 5 – 10 m
Replaced mechanized mining fleet
Introduced mobile crusher to decrease particle
size of mill feed (better recoveries, higher
throughput)
Grew mine life from zero reserves to roughly 4
years while mining continuously for 6 years
Operations continue setting records and new
targets being tested
13
Start-up
Transformation
Cont. Impr.
14
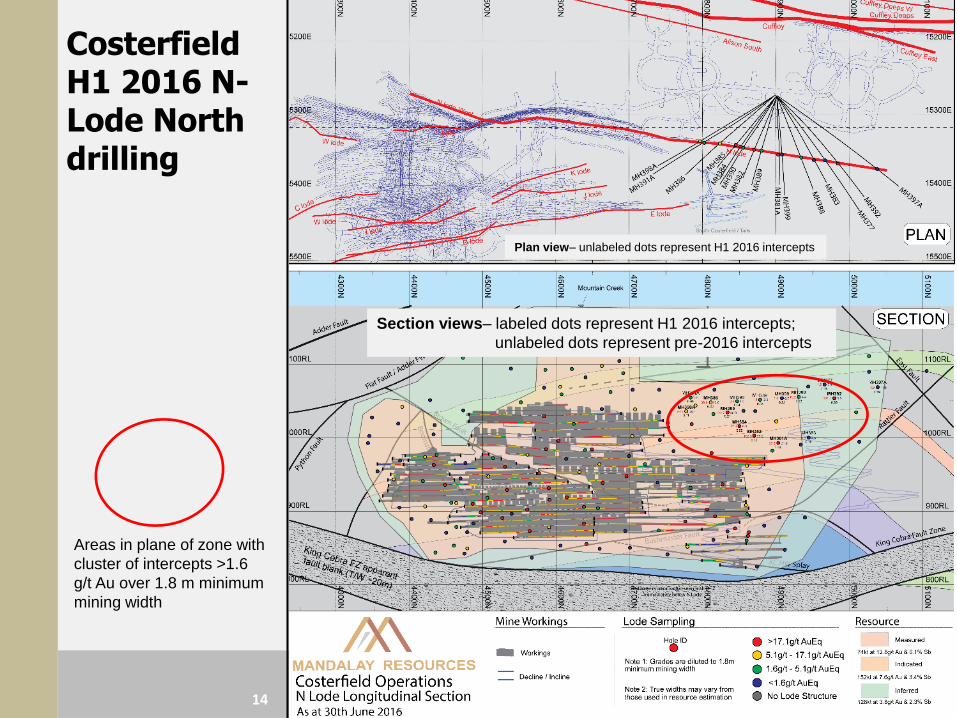
Costerfield H1 2016 N-Lode North drilling
Areas in plane of zone with
cluster of intercepts >1.6
g/t Au over 1.8 m minimum
mining width
Section views– labeled dots represent H1 2016 intercepts;
unlabeled dots represent pre-2016 intercepts
Plan view– unlabeled dots represent H1 2016 intercepts
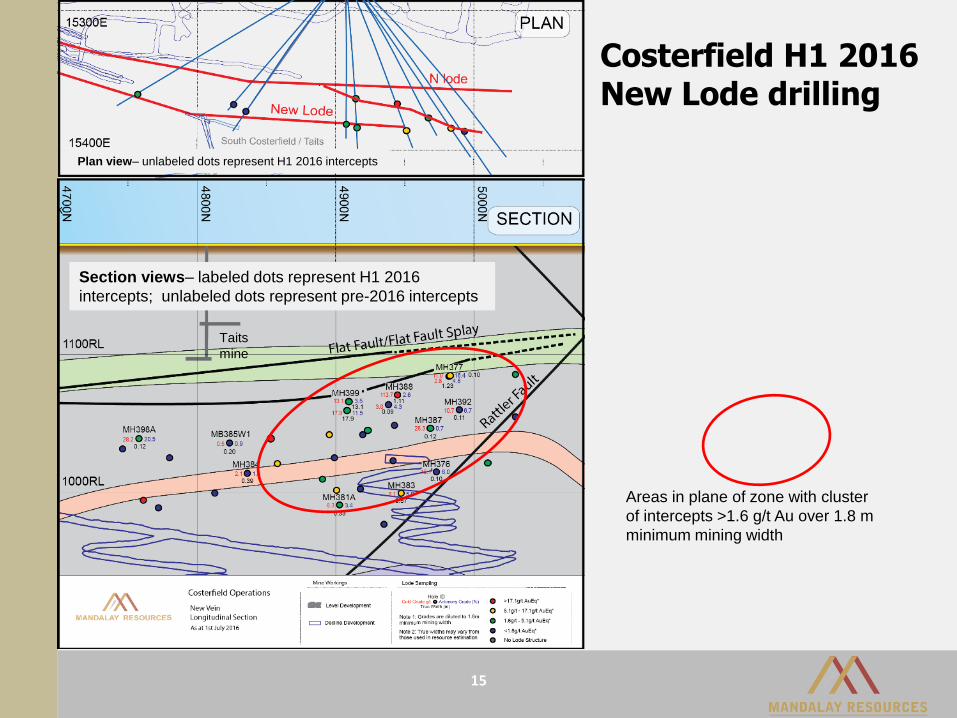
Costerfield H1 2016 New Lode drilling
15
Plan view– unlabeled dots represent H1 2016 intercepts
Areas in plane of zone with cluster
of intercepts >1.6 g/t Au over 1.8 m
minimum mining width
Section views– labeled dots represent H1 2016
intercepts; unlabeled dots represent pre-2016 intercepts
Taits
mine
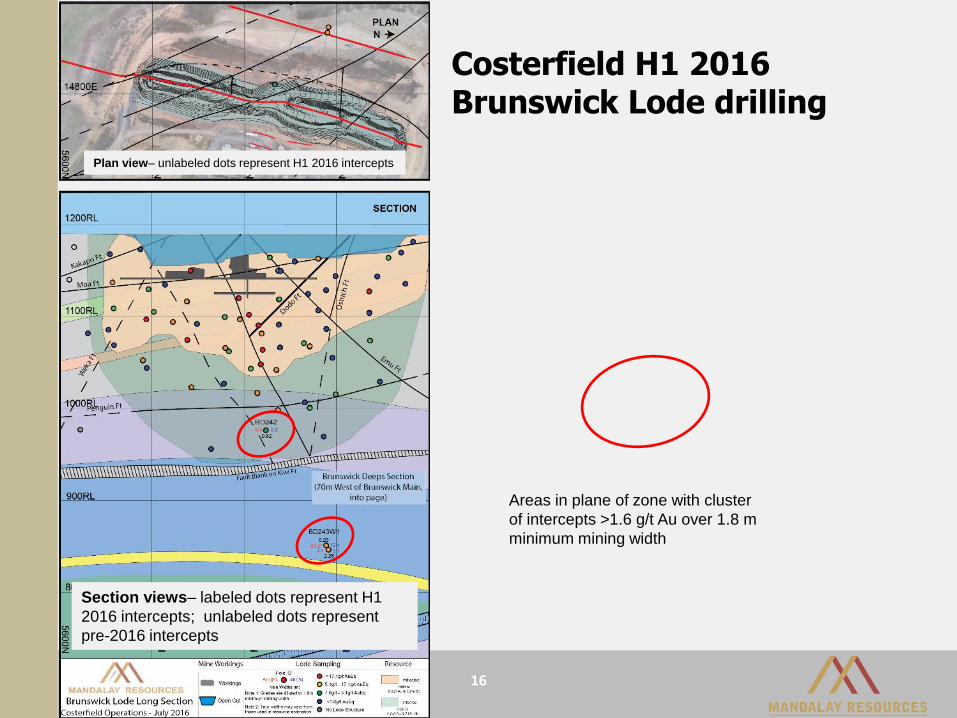
Costerfield H1 2016 Brunswick Lode drilling
16
Plan view– unlabeled dots represent H1 2016 intercepts
Areas in plane of zone with cluster
of intercepts >1.6 g/t Au over 1.8 m
minimum mining width
Section views– labeled dots represent H1
2016 intercepts; unlabeled dots represent
pre-2016 intercepts
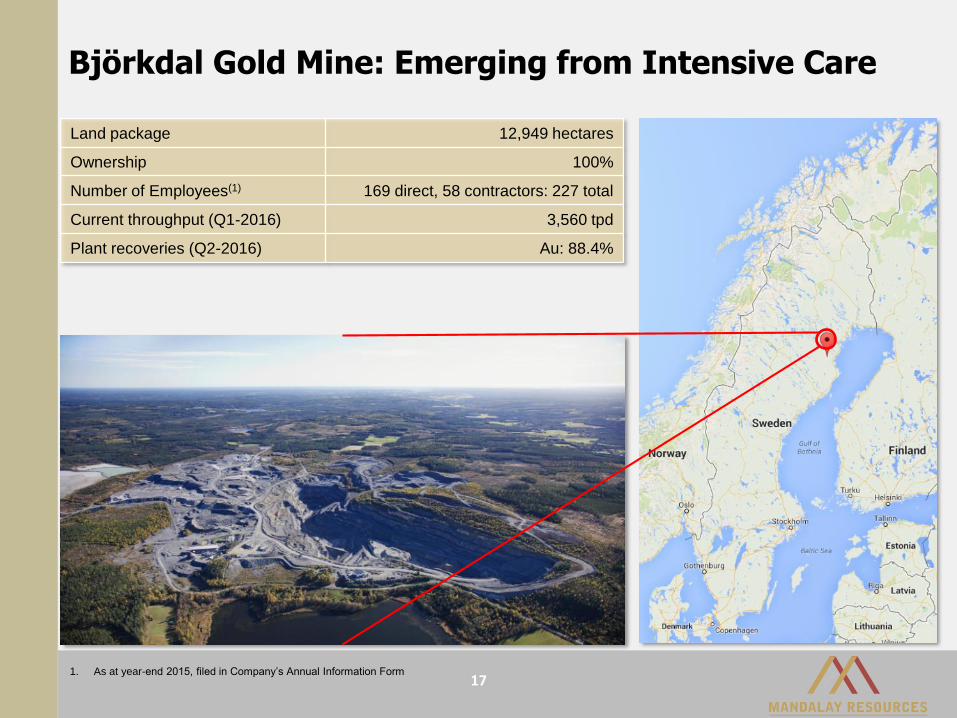
Björkdal Gold Mine: Emerging from Intensive Care
Land package 12,949 hectares
Ownership 100%
Number of Employees(1) 169 direct, 58 contractors: 227 total
Current throughput (Q1-2016) 3,560 tpd
Plant recoveries (Q2-2016) Au: 88.4%
1. As at year-end 2015, filed in Company’s Annual Information Form17
18
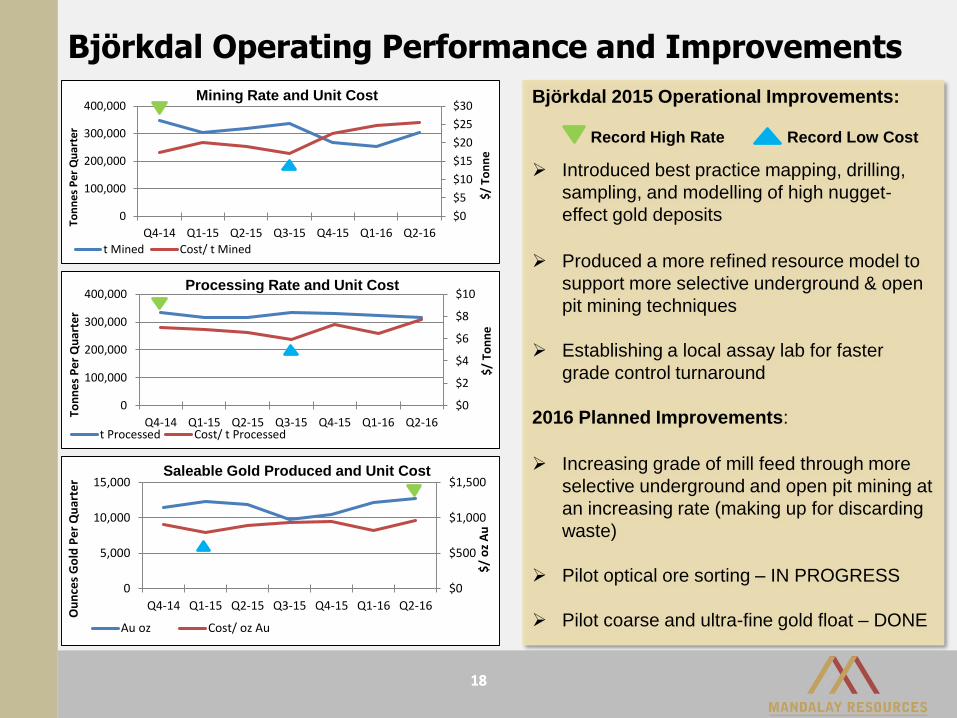
Björkdal Operating Performance and Improvements
$0
$5
$10
$15
$20
$25
$30
0
100,000
200,000
300,000
400,000
Q4-14 Q1-15 Q2-15 Q3-15 Q4-15 Q1-16 Q2-16
$/
Ton
ne
Ton
ne
s P
er Q
ua
rter
Mining Rate and Unit Cost
t Mined Cost/ t Mined
$0
$2
$4
$6
$8
$10
0
100,000
200,000
300,000
400,000
Q4-14 Q1-15 Q2-15 Q3-15 Q4-15 Q1-16 Q2-16
$/
Ton
ne
Ton
ne
s P
er
Qu
arte
r
Processing Rate and Unit Cost
t Processed Cost/ t Processed
$0
$500
$1,000
$1,500
0
5,000
10,000
15,000
Q4-14 Q1-15 Q2-15 Q3-15 Q4-15 Q1-16 Q2-16
$/
oz
Au
Ou
nce
s G
old
Pe
r Q
uar
ter
Saleable Gold Produced and Unit Cost
Au oz Cost/ oz Au
Björkdal 2015 Operational Improvements:
Record High Rate Record Low Cost
Introduced best practice mapping, drilling,
sampling, and modelling of high nugget-
effect gold deposits
Produced a more refined resource model to
support more selective underground & open
pit mining techniques
Establishing a local assay lab for faster
grade control turnaround
2016 Planned Improvements:
Increasing grade of mill feed through more
selective underground and open pit mining at
an increasing rate (making up for discarding
waste)
Pilot optical ore sorting – IN PROGRESS
Pilot coarse and ultra-fine gold float – DONE
18
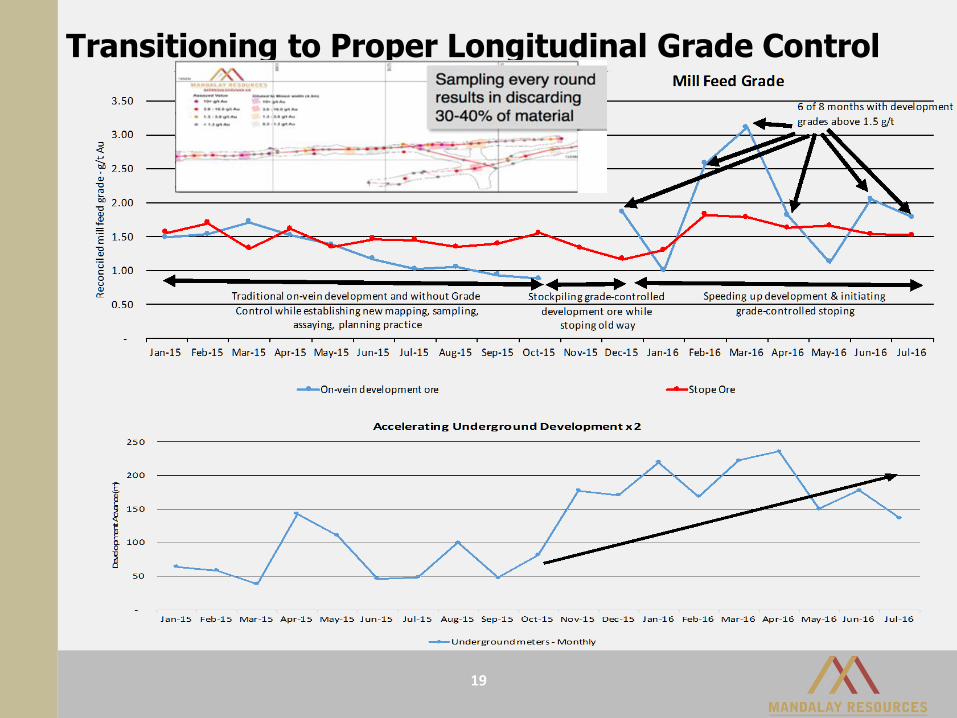
Transitioning to Proper Longitudinal Grade Control
19
Sampling every round results in
discarding 30-40% of material
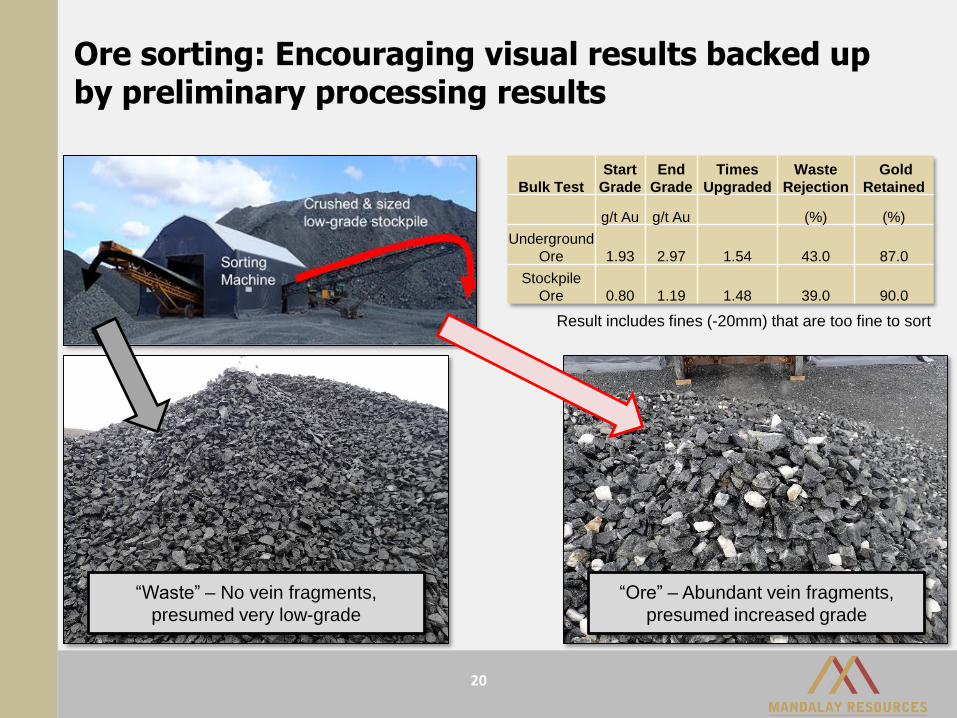
Ore sorting: Encouraging visual results backed up by preliminary processing results
20
“Ore” – Abundant vein fragments,
presumed increased grade
“Waste” – No vein fragments,
presumed very low-grade
Bulk Test
Start
Grade
End
Grade
Times
Upgraded
Waste
Rejection
Gold
Retained
g/t Au g/t Au (%) (%)
Underground
Ore 1.93 2.97 1.54 43.0 87.0
Stockpile
Ore 0.80 1.19 1.48 39.0 90.0
Result includes fines (-20mm) that are too fine to sort
Björkdal Processing Improvements
21
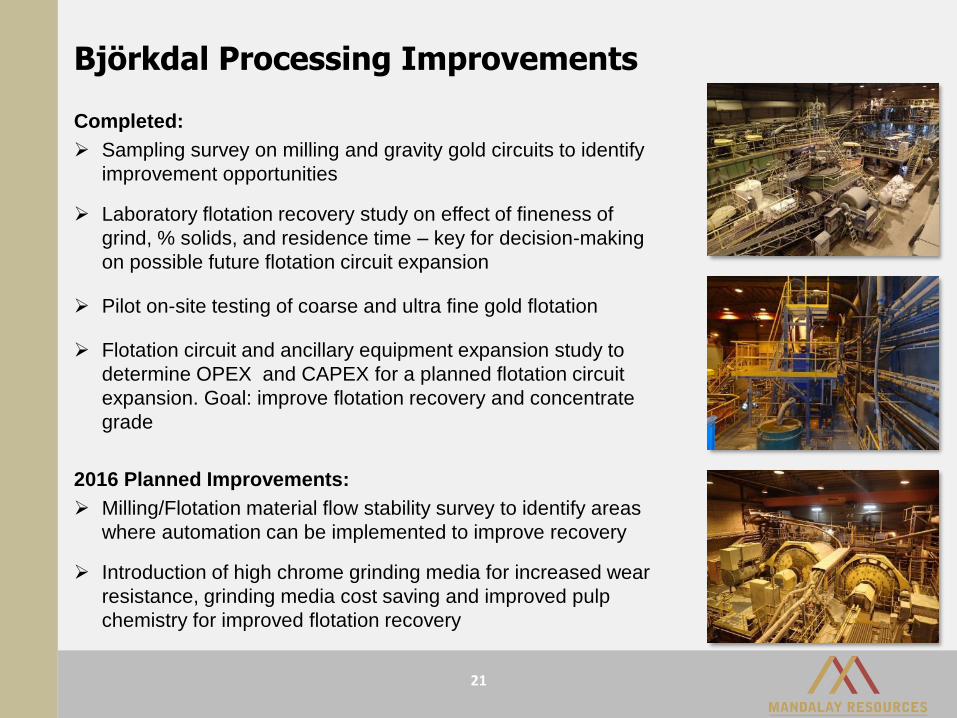
Completed:
Sampling survey on milling and gravity gold circuits to identify
improvement opportunities
Laboratory flotation recovery study on effect of fineness of
grind, % solids, and residence time – key for decision-making
on possible future flotation circuit expansion
Pilot on-site testing of coarse and ultra fine gold flotation
Flotation circuit and ancillary equipment expansion study to
determine OPEX and CAPEX for a planned flotation circuit
expansion. Goal: improve flotation recovery and concentrate
grade
2016 Planned Improvements:
Milling/Flotation material flow stability survey to identify areas
where automation can be implemented to improve recovery
Introduction of high chrome grinding media for increased wear
resistance, grinding media cost saving and improved pulp
chemistry for improved flotation recovery
22
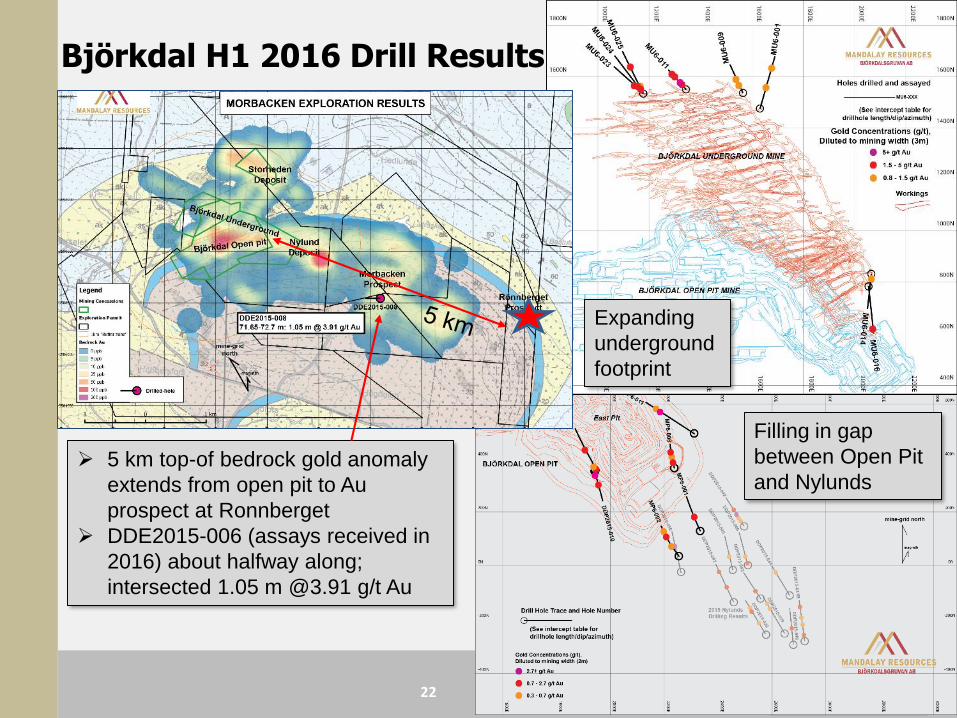
Björkdal H1 2016 Drill Results
Filling in gap
between Open Pit
and Nylunds
Expanding
underground
footprint
5 km top-of bedrock gold anomaly
extends from open pit to Au
prospect at Ronnberget
DDE2015-006 (assays received in
2016) about halfway along;
intersected 1.05 m @3.91 g/t Au
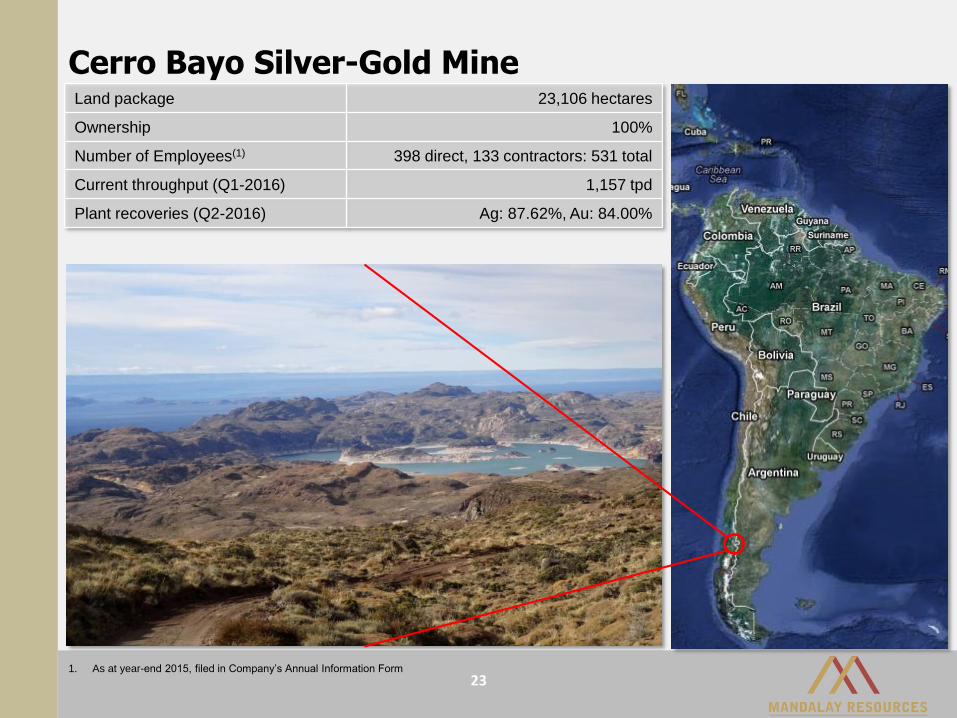
Cerro Bayo Silver-Gold MineLand package 23,106 hectares
Ownership 100%
Number of Employees(1) 398 direct, 133 contractors: 531 total
Current throughput (Q1-2016) 1,157 tpd
Plant recoveries (Q2-2016) Ag: 87.62%, Au: 84.00%
1. As at year-end 2015, filed in Company’s Annual Information Form
23
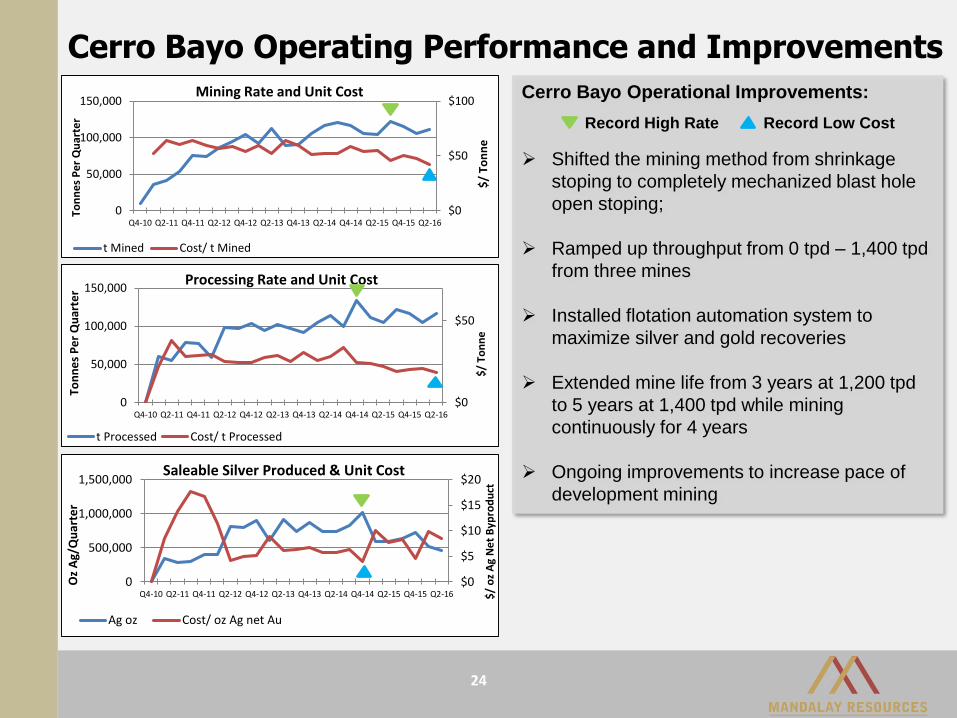
Cerro Bayo Operating Performance and Improvements
$0
$50
$100
0
50,000
100,000
150,000
Q4-10 Q2-11 Q4-11 Q2-12 Q4-12 Q2-13 Q4-13 Q2-14 Q4-14 Q2-15 Q4-15 Q2-16
$/
Ton
ne
Ton
ne
s P
er Q
ua
rter
Mining Rate and Unit Cost
t Mined Cost/ t Mined
$0
$50
0
50,000
100,000
150,000
Q4-10 Q2-11 Q4-11 Q2-12 Q4-12 Q2-13 Q4-13 Q2-14 Q4-14 Q2-15 Q4-15 Q2-16
$/
Ton
ne
Ton
ne
s P
er
Qu
arte
r
Processing Rate and Unit Cost
t Processed Cost/ t Processed
$0
$5
$10
$15
$20
0
500,000
1,000,000
1,500,000
Q4-10 Q2-11 Q4-11 Q2-12 Q4-12 Q2-13 Q4-13 Q2-14 Q4-14 Q2-15 Q4-15 Q2-16 $/
oz
Ag
Ne
t B
ypro
du
ct
Oz
Ag/
Qu
arte
r
Saleable Silver Produced & Unit Cost
Ag oz Cost/ oz Ag net Au
Cerro Bayo Operational Improvements:
Shifted the mining method from shrinkage
stoping to completely mechanized blast hole
open stoping;
Ramped up throughput from 0 tpd – 1,400 tpd
from three mines
Installed flotation automation system to
maximize silver and gold recoveries
Extended mine life from 3 years at 1,200 tpd
to 5 years at 1,400 tpd while mining
continuously for 4 years
Ongoing improvements to increase pace of
development mining
24
Record High Rate Record Low Cost
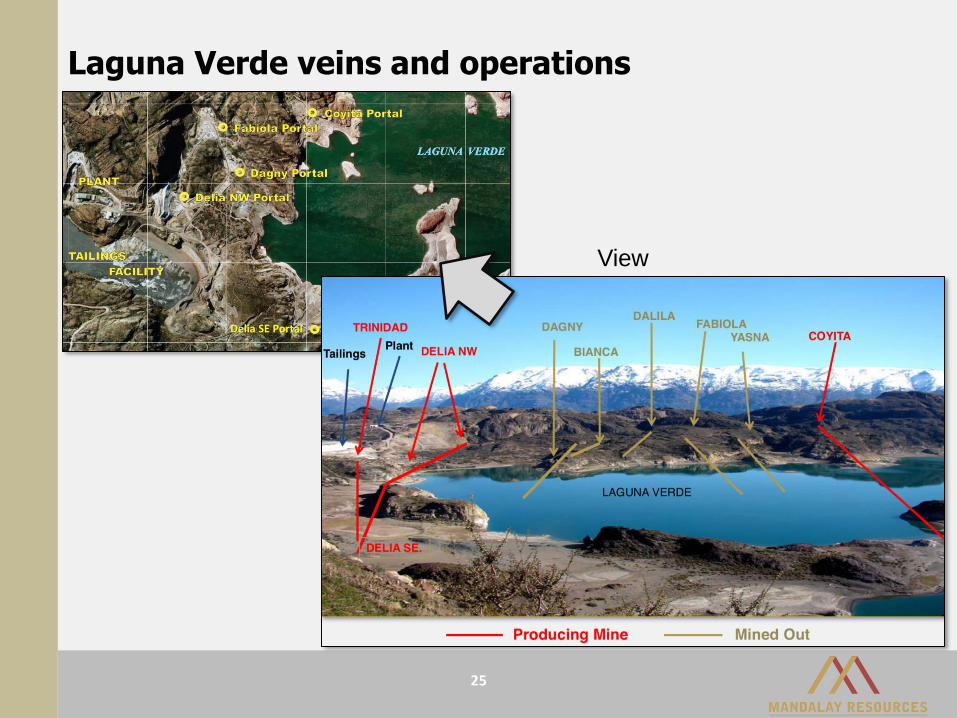
25
Laguna Verde veins and operations
View
Delia SE Portal
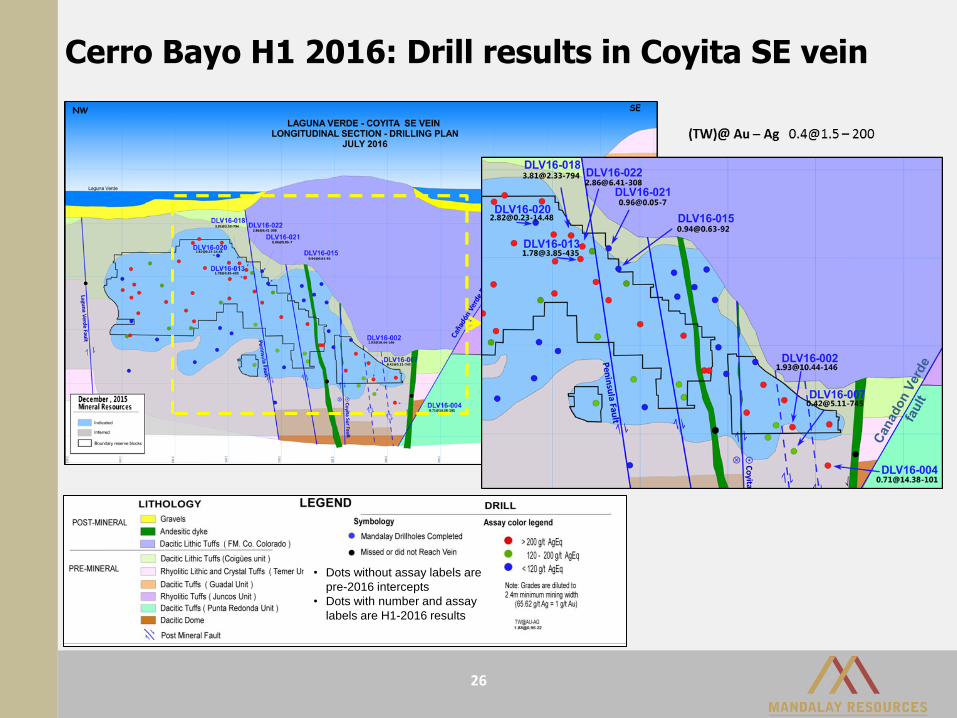
Cerro Bayo H1 2016: Drill results in Coyita SE vein
26
• Dots without assay labels are
pre-2016 intercepts
• Dots with number and assay
labels are H1-2016 results
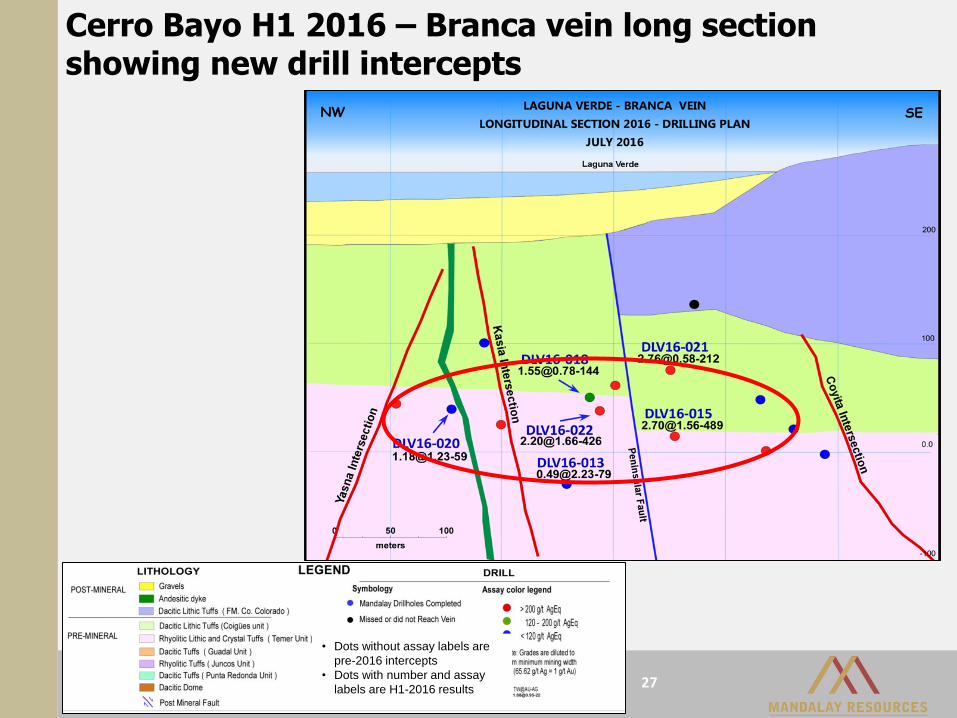
27
Cerro Bayo H1 2016 – Branca vein long section showing new drill intercepts
• Dots without assay labels are
pre-2016 intercepts
• Dots with number and assay
labels are H1-2016 results
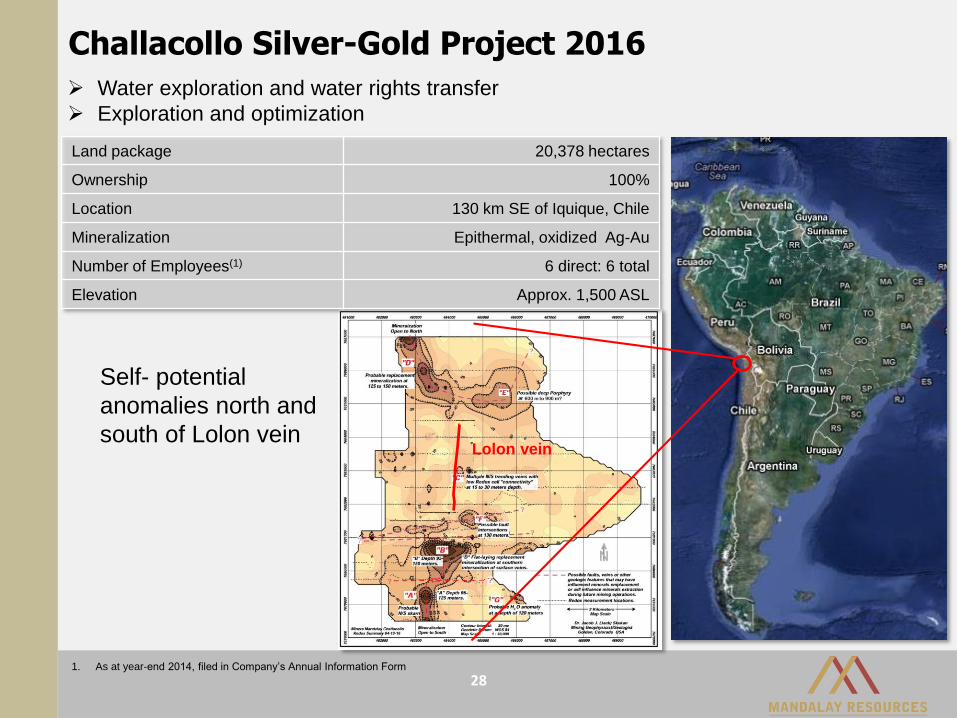
Challacollo Silver-Gold Project 2016
Land package 20,378 hectares
Ownership 100%
Location 130 km SE of Iquique, Chile
Mineralization Epithermal, oxidized Ag-Au
Number of Employees(1) 6 direct: 6 total
Elevation Approx. 1,500 ASL
1. As at year-end 2014, filed in Company’s Annual Information Form
28
Water exploration and water rights transfer
Exploration and optimization
Self- potential
anomalies north and
south of Lolon veinLolon vein
29
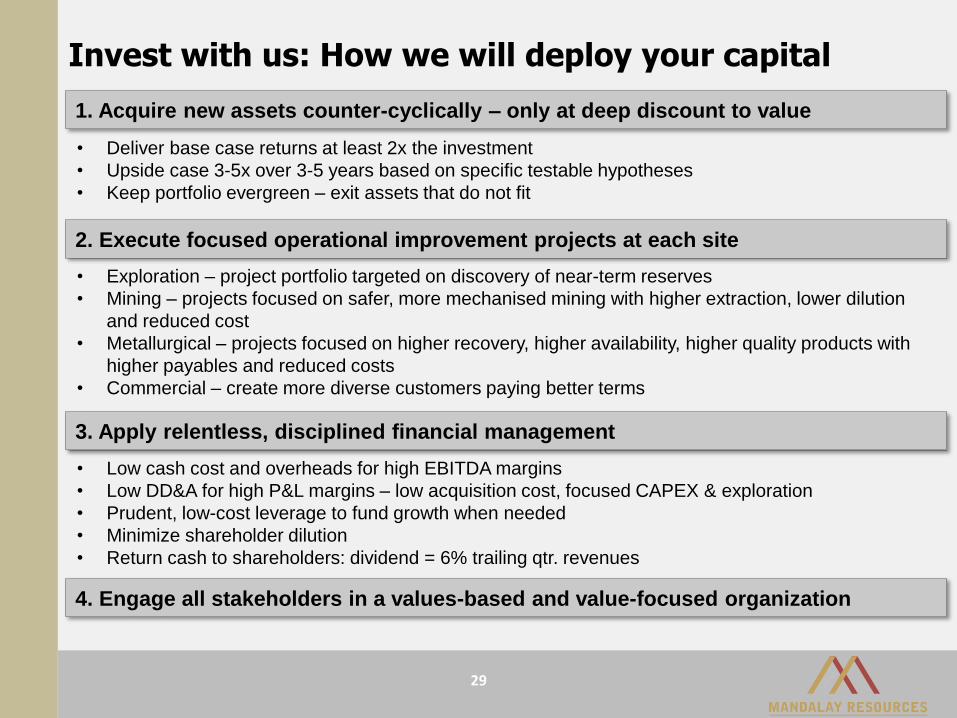
Invest with us: How we will deploy your capital
1. Acquire new assets counter-cyclically – only at deep discount to value
• Deliver base case returns at least 2x the investment
• Upside case 3-5x over 3-5 years based on specific testable hypotheses
• Keep portfolio evergreen – exit assets that do not fit
2. Execute focused operational improvement projects at each site
3. Apply relentless, disciplined financial management
• Exploration – project portfolio targeted on discovery of near-term reserves
• Mining – projects focused on safer, more mechanised mining with higher extraction, lower dilution
and reduced cost
• Metallurgical – projects focused on higher recovery, higher availability, higher quality products with
higher payables and reduced costs
• Commercial – create more diverse customers paying better terms
• Low cash cost and overheads for high EBITDA margins
• Low DD&A for high P&L margins – low acquisition cost, focused CAPEX & exploration
• Prudent, low-cost leverage to fund growth when needed
• Minimize shareholder dilution
• Return cash to shareholders: dividend = 6% trailing qtr. revenues
4. Engage all stakeholders in a values-based and value-focused organization
For more information, please contact:
Greg DiTomaso
Director, Investor Relations
Tel: 647.260.1566
Email: [email protected]
Company Website: www.mandalayresources.com
Twitter: @MandalayAuAg


