This article was downloaded by: [University of New Mexico]On: 27 November 2014, At: 10:49Publisher: Taylor & FrancisInforma Ltd Registered in England and Wales Registered Number: 1072954 Registered office:Mortimer House, 37-41 Mortimer Street, London W1T 3JH, UK
Communications in Soil Science and PlantAnalysisPublication details, including instructions for authors and subscriptioninformation:http://www.tandfonline.com/loi/lcss20
Long‐Term Integrated Nutrient Managementfor Rice‐Based Cropping Pattern: Effect onGrowth, Yield, Nutrient Uptake, NutrientBalance Sheet, and Soil FertilityP. K. Saha a , M. Ishaque b , M. A. Saleque b , M. A. M. Miah b , G. M.Panaullah b & N. I. Bhuiyan ba Bangladesh Rice Research Institute (BRRI) , Comilla, Bangladeshb Soil Science Division , Bangladesh Rice Research Institute , Gazipur,BangladeshPublished online: 19 Mar 2007.
To cite this article: P. K. Saha , M. Ishaque , M. A. Saleque , M. A. M. Miah , G. M. Panaullah & N. I. Bhuiyan(2007) Long‐Term Integrated Nutrient Management for Rice‐Based Cropping Pattern: Effect on Growth,Yield, Nutrient Uptake, Nutrient Balance Sheet, and Soil Fertility, Communications in Soil Science and PlantAnalysis, 38:5-6, 579-610, DOI: 10.1080/00103620701215718
To link to this article: http://dx.doi.org/10.1080/00103620701215718
PLEASE SCROLL DOWN FOR ARTICLE
Taylor & Francis makes every effort to ensure the accuracy of all the information (the “Content”)contained in the publications on our platform. However, Taylor & Francis, our agents, and ourlicensors make no representations or warranties whatsoever as to the accuracy, completeness, orsuitability for any purpose of the Content. Any opinions and views expressed in this publicationare the opinions and views of the authors, and are not the views of or endorsed by Taylor &Francis. The accuracy of the Content should not be relied upon and should be independentlyverified with primary sources of information. Taylor and Francis shall not be liable for anylosses, actions, claims, proceedings, demands, costs, expenses, damages, and other liabilitieswhatsoever or howsoever caused arising directly or indirectly in connection with, in relation to orarising out of the use of the Content.
This article may be used for research, teaching, and private study purposes. Any substantialor systematic reproduction, redistribution, reselling, loan, sub-licensing, systematic supply, ordistribution in any form to anyone is expressly forbidden. Terms & Conditions of access and usecan be found at http://www.tandfonline.com/page/terms-and-conditions

Long-Term Integrated NutrientManagement for Rice-Based Cropping
Pattern: Effect on Growth, Yield, NutrientUptake, Nutrient Balance Sheet, and
Soil Fertility
P. K. Saha
Bangladesh Rice Research Institute (BRRI), Comilla, Bangladesh
M. Ishaque, M. A. Saleque, M. A. M. Miah, G. M. Panaullah,
and N. I. Bhuiyan
Soil Science Division, Bangladesh Rice Research Institute, Gazipur,
Bangladesh
Abstract: A 7-year-long field trial was conducted on integrated nutrient management
for a dry season rice (Boro)–green manure (GM)–wet season rice (T. Aman) cropping
system at the Bangladesh Rice Research Institute Farm, Gazipur during 1993–1999.
Five packages of inorganic fertilizers, cow dung (CD), and GM dhaincha (Sesbania
aculeata) were evaluated for immediate and residual effect on crop productivity,
nutrient uptake, soil-nutrient balance sheet, and soil-fertility status. Plant height,
active tiller production, and grain and straw yields were significantly increased as a
result of the application of inorganic fertilizer and organic manure. Usually, the soil-
test-based (STB) fertilizer doses for a high-yield goal produced the highest grain
yield of 6.39 t ha21 (average of 7 years) in Boro rice. Application of CD at the rate
of 5 t ha21 (oven-dry basis) once a year at the time of Boro transplanting supplemented
50% of the fertilizer nutrients other than nitrogen (N) in the subsequent crop of the
cropping pattern. A positive effect of GM on the yield of T. Aman rice was
observed. Following GM, the application of reduced doses of phosphorus (P),
potassium (K), sulfur (S), and zinc (Zn) to the second crop (T. Aman) did not
reduce yield, indicating the beneficial residual effect of fertilizer applied to the first
Received 13 August 2004, Accepted 20 January 2006
Address correspondence to P. K. Saha, Bangladesh Rice Research Institute (BRRI),
Regional Station, Shashongacha, G.P.O. Box No. 58, Comilla 3500, Bangladesh.
E-mail: [email protected]
Communications in Soil Science and Plant Analysis, 38: 579–610, 2007
Copyright # Taylor & Francis Group, LLC
ISSN 0010-3624 print/1532-2416 online
DOI: 10.1080/00103620701215718
579
Dow
nloa
ded
by [
Uni
vers
ity o
f N
ew M
exic
o] a
t 10:
49 2
7 N
ovem
ber
2014
crop (Boro rice) of the cropping pattern. The comparable yield of T. Aman was also
observed with reduced fertilizer dose in CD-treated plots. The total P, K, and S
uptake (kg/ha/yr) in the unfertilized plot under an irrigated rice system gradually
decreased over the years. The partial nutrient balance in the unfertilized plot (T1)
was negative for all the nutrients. In the fertilized plots, there was an apparent
positive balance of P, S, and Zn but a negative balance of N and K. This study
showed that the addition of organic manure (CD, dhaincha) gave more positive
balances. In the T4c treatment at 0–15 cm, the application of chemical fertilizers
along with the organic manures increased soil organic carbon by (C) 0.71%. The
highest concentration of total N was observed with T4c followed by T4d and T4b,
where CD was applied in Boro season and dhaincha GM was incorporated in T.
Aman season. The sixfold increase in soil-available P in T4b-, T4c-, T4a-treated plots
was due to the addition of CD. Dhaincha GM with the combination of chemical ferti-
lizer helps to mobilize soil-available P by 3 to 6 ppm. The highest amount of soil-
available S was found in T4c- and T4a-treated plots. It was 2.5 times higher than that
of the initial soil. The application of CD and dhaincha GM along with chemical ferti-
lizers not only increased organic C, total N, available P, and available S but also
increased exchangeable K, available Zn, available iron (Fe), and available
manganese (Mn) in soil.
Keywords: Cow dung, fertilizers, green manure, nutrient balance sheet, rice, pro-
duction, soil fertility
INTRODUCTION
Soil is the natural media for plant growth. Plant nutrients in soil, whether
naturally endowed or artificially maintained, are a major determinant of the
success or failure of a crop production system. The crop sector of Bangladesh
agriculture must bear the responsibility, above all else, of producing enough
food to meet the requirements of the country’s ever-growing population.
The pressing need is to achieve substantially higher crop yield than the
present yield levels from the limited land resources on a sustainable basis.
A crop production system with high-yield targets cannot be sustainable
unless nutrient inputs to soil are at least balanced against nutrient removal
by crops (Bhuiyan 1991). Proper soil-fertility management, therefore, is of
prime importance in an endeavor to increase crop productivity. The
problem is that not many of the farmers are blessed with fertile soils to till.
Available data indicate that the fertility of most of the soils has deteriorated
over the years (Karim, Miah, and Razia 1994; Ali, Shaheed, and Kubota
1997), which is responsible for stagnating and, in some cases, even
declining crop yields (Anonymous 1996; Cassman et al. 1995). The use of
chemical fertilizers as a supplemental source of nutrients has been increasing
steadily in Bangladesh, but this is true only for the three primary major
nutrients, nitrogen (N), phosphorus (P), and potassium (K). Again, even
these three fertilizers are usually not applied in balanced proportions by
P. K. Saha et al.580
Dow
nloa
ded
by [
Uni
vers
ity o
f N
ew M
exic
o] a
t 10:
49 2
7 N
ovem
ber
2014
most of the farmers (Anonymous 1997). It is now well known that sulfur (S)
and zinc (Zn) deficiencies occur, especially in wetland rice soils in many parts
of the country due to unbalanced fertilization (Portch and Islam 1984).
Although the need for the application of S and Zn fertilizers along with
NPK fertilizers is recognized by agricultural research and extension workers
and many farmers, S and Zn fertilization is rarely done as required, which
has led to aggravation of the S and Zn problems in many soils.
Another very important factor to consider in improving crop productivity is
the soil organic matter. Available reports indicate that most soils in Bangladesh
have low organic matter content, usually less than 2% (Bhuiyan 1991).
Moreover, the organic matter content of the soils is declining with time
because of poor attention to its improvement and maintenance. Frequent
tillage operations for high cropping intensity enhance decomposition of soil
organic matter. Again, the addition of organic materials to soil through
farmyard manure, composts, and organic residues has been reduced consider-
ably because a major portion of these residues is used as fuel by the rural popu-
lation. It is now believed by many that the low and declining organic matter
content is one of the reasons for the low productivity of many of the soils.
Thus, the need for proper soil organic matter management cannot be overem-
phasized in view of the low organic matter content of the soils. A judicious inte-
gration of macro- and micronutrients along with organic residues including
green manure (GM) is needed to sustainably increase crop production in Ban-
gladesh. Application of organic materials, especially Cowdung (CD), along
with chemical fertilizers increases cereal crop yields (Saha et al. 1998; Saha
1985). Application of GM and CD may sustain rice yield and substitute for
chemical fertilizer. A review study on the use of GM showed that GM could
increase rice yield by up to 3.3 t ha21, with an average of about 1 t ha21 (Ali
1993). Inclusion of a GM crop within the cropping system deserves consider-
ation for development of an integrated inorganic–organic soil-fertilization
program for higher crop yield and for better soil health.
In tropical Asian countries such as Bangladesh, soil-fertility-management
research of cropping systems based on GM and their medium- or long-term
residual effects is relatively new (Bhuiyan 1995). Farid et al. (1994) and
Saha et al. (1998) reported that inclusion of GM between wheat and rice
increased yields of both rice and wheat.
The present study was conducted with an integrated nutrient management
approach in a rice–rice system in Grey terrace soil in Madhupur Tract [agro-
ecological zone (AEZ) 28]. Different inorganic nutrients, organic manure
(CD), and organic residues including dhaincha GM along with their
immediate and residual effects have been evaluated in this trial. An attempt
to relate nutrient uptake by the MV rice crops and nutrient balances was under-
taken in this study. The main objectives of the present study were to know the
changes of crop productivity, nutrient uptake, soil-nutrient balance sheet, and
soil-fertility status under the influence of different fertilizer management
practices in a Boro–GM–T Aman cropping pattern.
Nutrient Management for Rice 581
Dow
nloa
ded
by [
Uni
vers
ity o
f N
ew M
exic
o] a
t 10:
49 2
7 N
ovem
ber
2014

MATERIALS AND METHODS
A long-termfield trial, withBoro–GM–T.Aman cropping system,was conducted
at the Bangladesh Rice Research Institute (BRRI) Farm, Gazipur (lat. 238590 N,long. 908240 E, 30 m above mean sea level) during the period 1993–1999. The
average temperature ranges from 7.28C in winter to 36.78C in summer. The
mean annual rainfall is about 2000 mm. The soil of the experimental field has a
silty clay loam texture (sand 21%, silt 45%, and clay 35%) and a slightly acidic
pH (6.6). The other soil parameters were as follows: CEC 23 cmol kg21 soil,
exchangeable calcium (Ca) 7.16 cmol kg21 soil, exchangeable magnesium (Mg)
1.99 cmol kg21 soil, exchangeable potassium (K) 0.16 cmol kg21 soil, organic
carbon (C) 12.8 g kg21, total nitrogen (N) 1.0 g kg21, available phosphorus (P)
(modifiedOlsen’s) 6mgkg21, available sulfur (S) [0.01MCaH2(PO4)2 extraction]
14 mg kg21, and available zinc (Zn) (DTPA extraction) 2.69 mg kg21.
The experiment was laid out in a modified split-plot designwith three repli-
cations. The treatments for the first crop of the cropping pattern (Boro, BRRI
dhan29) were no fertilizer (T1); fertilization following the Bangladesh Agricul-
tural Research Council (BARC) fertilizer-recommendation guide (Anonymous
1987) for medium-yield goal (MYG) for the particular area (T2); soil-test-based
(STB) fertilizer recommendation for high-yield goal (HYG) (T3); T3þ CD at
the rate of 5 t ha21 on an oven-dry basis (T4); and local farmers’ practice
(T5). Dhaincha (S. aculeata) was the second crop (Kharif I) grown as a GM.
In T. Aman, the third crop in the cropping sequence, each original plot under
treatments T2, T3, and T4 was divided into four subplots. The treatments for
these subplots were full inorganic fertilizer doses as for the first crop without
GM (T2a, T3a, T4a), full inorganic fertilizer doses plus GM (T2b, T3b, T4b),
60% N and 50% other nutrient rates of full inorganic fertilizer doses plus
GM (T2c, T3c, T4c), and 60% N only plus GM (T2d, T3d, T4d). The detailed
treatment descriptions of the experiment are presented in Table 1.
The sources of N, P, K, S, and Znwere urea, triple superphosphate, muriate of
potash, gypsum, and zinc sulfate, respectively. Fertilizerswere applied to eachcrop
(except dhaincha) according to treatments listed in Table 1. In treatment T4, CD at
5 t ha21 (oven-dry basis) was applied once a year before transplanting Boro rice.
One third of the N and all of the P, K, S, and Zn were applied at the time of
final land preparation in both Boro and T. Aman seasons. The remaining two
thirds of the N were applied in two equal installments: 25–30 days (Boro) and
20–25 days (T. Aman) after transplanting and 7 days before panicle initiation
stage in both seasons. The variety of Boro was BRRI dhan29 in all the years of
the experiment; for T. Aman, BR 11 was used in 1993–1998 and BRRI dhan31
was used in 1999. Three or four 45-day-old (Boro) and 30-day-old (T. Aman)
seedlings were transplanted in hills 20 cm apart and in rows 20 cm apart.
The dhaincha (S. aculeata)was grown as GM in appropriate plots between
Boro and T. Aman seasons. Seeds were sown by broadcasting at a rate of 50 kg
ha21 in the first week of May. Fifty-five-day-old dhaincha plants (10–12 t ha21
on a fresh-weight basis) were incorporated 7–8 days prior to planting T. Aman.
P. K. Saha et al.582
Dow
nloa
ded
by [
Uni
vers
ity o
f N
ew M
exic
o] a
t 10:
49 2
7 N
ovem
ber
2014
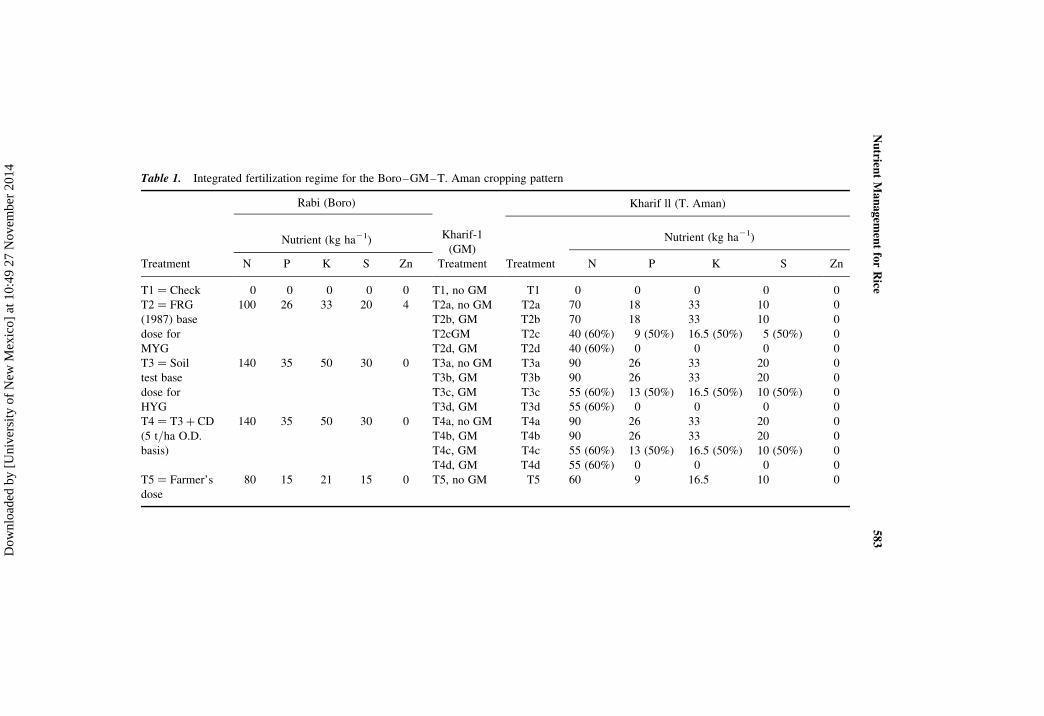
Table 1. Integrated fertilization regime for the Boro–GM–T. Aman cropping pattern
Treatment
Rabi (Boro)
Nutrient (kg ha21) Kharif-1
(GM)
Treatment
Kharif ll (T. Aman)
Treatment
Nutrient (kg ha21)
N P K S Zn N P K S Zn
T1 ¼ Check 0 0 0 0 0 T1, no GM T1 0 0 0 0 0
T2 ¼ FRG
(1987) base
dose for
MYG
100 26 33 20 4 T2a, no GM T2a 70 18 33 10 0
T2b, GM T2b 70 18 33 10 0
T2cGM T2c 40 (60%) 9 (50%) 16.5 (50%) 5 (50%) 0
T2d, GM T2d 40 (60%) 0 0 0 0
T3 ¼ Soil
test base
dose for
HYG
140 35 50 30 0 T3a, no GM T3a 90 26 33 20 0
T3b, GM T3b 90 26 33 20 0
T3c, GM T3c 55 (60%) 13 (50%) 16.5 (50%) 10 (50%) 0
T3d, GM T3d 55 (60%) 0 0 0 0
T4 ¼ T3þ CD
(5 t/ha O.D.basis)
140 35 50 30 0 T4a, no GM T4a 90 26 33 20 0
T4b, GM T4b 90 26 33 20 0
T4c, GM T4c 55 (60%) 13 (50%) 16.5 (50%) 10 (50%) 0
T4d, GM T4d 55 (60%) 0 0 0 0
T5 ¼ Farmer’s
dose
80 15 21 15 0 T5, no GM T5 60 9 16.5 10 0
Nutrien
tManagem
entforRice
583
Dow
nloa
ded
by [
Uni
vers
ity o
f N
ew M
exic
o] a
t 10:
49 2
7 N
ovem
ber
2014
Appropriate cultural and management practices including plant-protec-
tion measures were followed during each growing season. The plot size was
4 m � 4 m. The crops were harvested at maturity from a 2.5 m � 2 m area.
Plant height from 20 randomly selected plants in each plot and panicle
number from 16 random hills per plot were recorded at maturity in the first
3 years (1993–1995) of the experiment. Grain yields (14% moisture) and
straw yields (oven-dry basis) were recorded in each growing season of the
experiment. In the last four years (1996–1999) of the experiment, a portion
of straw and grain samples in each growing season were analyzed. Straw
and grain samples were oven dried at 708C+ 58C for 3 days and then
ground in a Willey Mill. These samples were analyzed for P, K, S, and Zn
content by digesting with di-acid mixture of nitric and perchloric acid at the
ratio 5:2 following the method described by Yoshida et al. (1976) and N by
micro-Kjeldahl distillation method (Yoshida et al. 1976).
Initial composite soil samples from the two layers (0–15 cm and 16–30 cm
deep) from the 30 spots of the main field were collected prior to fertilizer appli-
cation in the first crop (Boro) of 1993. After harvesting the 21st crop (T. Aman)
of 1999, composite soil samples from the two layers (0–15 cm and 16–30 cm
deep) from the six spots of each of the experimental plots were collected. The
soil samples were air dried, ground to pass through a 2-mm sieve, and analyzed
for texture (Day 1965), pH (1:2.5) (Jackson 1962), organic carbon (C) by the
Black and Walkley method (Walkley and Black 1965), total N by the micro-
Kjeldahl distillation method (Bremner 1960), available P by the modified
Olsen’s method (Watanabe and Olsen 1965), exchangeable K by the 1 N
ammonium acetate (pH 7.0) method (Pratt 1965), available S by 0.01 M Ca
(H2PO4)2 extraction (Hunter 1984) and available Zn, available Fe, available
Cu, and available Mn by DTPA extraction (Pratt 1965).
Statistical analyses were performed as a randomized complete block
design, because it was not a full split-plot (the control and the farmers’
practice plots were not split), and means were compared by a least significant
difference (LSD) test. Economic analyses were done for net benefit and
benefit–cost ratio for different treatment combinations (Saha et al. 1998).
The “partial” nutrient balance, including only major inputs (fertilizer,
nutrient content in irrigation water, biological nitrogen fixation, etc.) and
major outputs (nutrient removal by crops) were considered.
RESULTS AND DISCUSSION
Growth and Yields
Plant height, panicle production, and grain and straw yields significantly
increased as a result of the application of different combinations of
inorganic and organic fertilizer including GM (Tables 2–4).
P. K. Saha et al.584
Dow
nloa
ded
by [
Uni
vers
ity o
f N
ew M
exic
o] a
t 10:
49 2
7 N
ovem
ber
2014

In the Boro crop of the experiment (1993–1995), the height of BRRI dhan
29 in the control plot (T1) was 78.0 cm (mean of 3 years), whereas the highest
plant height of 98.8 cm (mean of 3 years) was found with the STB dose (T3).
The BARC (Bangladesh Agricultural Research Council), FRG (Fertilizer
Recommendation Guide), (Anonymous 1987) (T2) gave slightly shorter plant
height than the STB dose. The average plant height of FP (Farmer’s practice)
(T5) was 91.8 cm. The plant heights in treatments T3 and T4 were not signifi-
cantly different from one another; however, T3 plant height was significantly
higher than T2, T5, and T1 (Table 2). The application of CD along with the
STB dose (T4) produced a similar plant height.
In the T. Aman season (1993–1995), the average plant height of BR11
ranged from 83.4 cm in the control plot to 114.8 cm in the T4b plot (in which
the STB dose chemical fertilizer was applied and Sesbania was incorporated
before T. Aman transplanting and CD was applied in the previous Boro crop)
(Table 2). The values of plant height in most subplots were not statistically
different.
In the Boro season (1993–1995), the average panicle m22 of BRRI
dhan29 in the control plot (T1) was 211, which was significantly increased
to 306 with the application of the BARC dose (T2), and was 352 with the appli-
cation of CD along with the STB (T4) (Table 2). The STB dose (T3) produced
a slightly lower panicle number than T4. The panicles produced with T3 and T4
Table 2. Effects of different fertilizer packages on the some growth parameters of rice
in a Boro–GM–T. aman cropping pattern (average of 3 years, 1993–1995)
Boro T. Aman
Treatment
Plant height
(cm)
Panicle no.
(m22) Treatment
Plant height
(cm)
Panicle no.
(m22)
T1 78.0 211 T1 83.4 167
T2 95.4 306 T2a 105.7 225
T2b 109.4 253
T2c 109.6 246
T2d 102.6 229
T3 98.8 339 T3a 109.3 241
T3b 114.4 248
T3c 112.0 239
T3d 109.2 241
T4 98.3 352 T4a 108.6 237
T4b 114.8 255
T4c 113.2 262
T4d 108.1 256
T5 91.8 283 T5 101.1 233
LSD0.05 2.4 32 LSD0.05 6.7 14
CV (%) 1.5 6.2 CV (%) 3.8 3.7
Nutrient Management for Rice 585
Dow
nloa
ded
by [
Uni
vers
ity o
f N
ew M
exic
o] a
t 10:
49 2
7 N
ovem
ber
2014

Table 3. Effects of different fertilizer-management packages on the grain and straw
yields of rice t ha21 in a Boro–GM–T. Aman cropping pattern (average of 7 years,
1993–1999)
Variable
treatment n
Grain yield
(t ha21)
Straw yield
(t ha21)
T. Aman
T1 21 2.13 2.16
T2a 21 3.96 4.24
T2b 21 4.35 4.94
T2c 21 4.19 4.63
T2d 21 3.77 4.07
T3a 21 4.10 4.75
T3b 21 4.09 5.19
T3c 21 4.12 4.88
T3d 21 3.92 4.42
T4a 21 4.38 4.70
T4b 21 4.35 5.61
T4c 21 4.16 5.19
T4d 21 4.06 4.54
T5 21 3.70 3.96
LSD0.05 0.18 0.21
Year
1993 42 4.12 5.83
1994 42 4.87 4.65
1995 42 4.34 4.10
1996 42 3.56 4.59
1997 42 3.38 3.80
1998 42 4.11 3.91
1999 42 3.26 4.76
LSD0.05 0.27 0.20
Boro
T1 21 3.17 2.57
T2 21 5.64 4.76
T3 21 6.39 5.59
T4 21 6.57 5.73
T5 21 5.14 4.21
LSD0.05 0.16 0.17
Year
1993 15 4.45 4.24
1994 15 5.94 4.13
1995 15 6.28 4.18
1996 15 6.04 6.08
1997 15 5.33 4.91
1998 15 4.80 4.51
1999 15 4.83 3.92
0.19 0.20
P. K. Saha et al.586
Dow
nloa
ded
by [
Uni
vers
ity o
f N
ew M
exic
o] a
t 10:
49 2
7 N
ovem
ber
2014
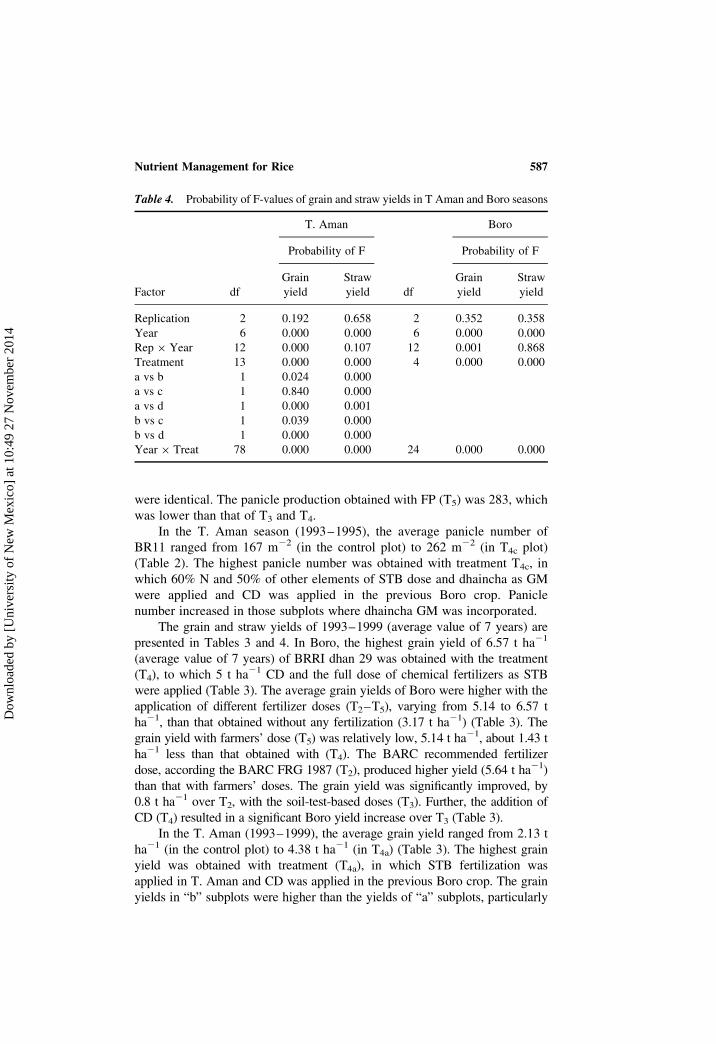
were identical. The panicle production obtained with FP (T5) was 283, which
was lower than that of T3 and T4.
In the T. Aman season (1993–1995), the average panicle number of
BR11 ranged from 167 m22 (in the control plot) to 262 m22 (in T4c plot)
(Table 2). The highest panicle number was obtained with treatment T4c, in
which 60% N and 50% of other elements of STB dose and dhaincha as GM
were applied and CD was applied in the previous Boro crop. Panicle
number increased in those subplots where dhaincha GM was incorporated.
The grain and straw yields of 1993–1999 (average value of 7 years) are
presented in Tables 3 and 4. In Boro, the highest grain yield of 6.57 t ha21
(average value of 7 years) of BRRI dhan 29 was obtained with the treatment
(T4), to which 5 t ha21 CD and the full dose of chemical fertilizers as STB
were applied (Table 3). The average grain yields of Boro were higher with the
application of different fertilizer doses (T2–T5), varying from 5.14 to 6.57 t
ha21, than that obtained without any fertilization (3.17 t ha21) (Table 3). The
grain yield with farmers’ dose (T5) was relatively low, 5.14 t ha21, about 1.43 t
ha21 less than that obtained with (T4). The BARC recommended fertilizer
dose, according the BARC FRG 1987 (T2), produced higher yield (5.64 t ha21)
than that with farmers’ doses. The grain yield was significantly improved, by
0.8 t ha21 over T2, with the soil-test-based doses (T3). Further, the addition of
CD (T4) resulted in a significant Boro yield increase over T3 (Table 3).
In the T. Aman (1993–1999), the average grain yield ranged from 2.13 t
ha21 (in the control plot) to 4.38 t ha21 (in T4a) (Table 3). The highest grain
yield was obtained with treatment (T4a), in which STB fertilization was
applied in T. Aman and CD was applied in the previous Boro crop. The grain
yields in “b” subplots were higher than the yields of “a” subplots, particularly
Table 4. Probability of F-values of grain and straw yields in T Aman and Boro seasons
T. Aman Boro
Probability of F Probability of F
Factor df
Grain
yield
Straw
yield df
Grain
yield
Straw
yield
Replication 2 0.192 0.658 2 0.352 0.358
Year 6 0.000 0.000 6 0.000 0.000
Rep � Year 12 0.000 0.107 12 0.001 0.868
Treatment 13 0.000 0.000 4 0.000 0.000
a vs b 1 0.024 0.000
a vs c 1 0.840 0.000
a vs d 1 0.000 0.001
b vs c 1 0.039 0.000
b vs d 1 0.000 0.000
Year � Treat 78 0.000 0.000 24 0.000 0.000
Nutrient Management for Rice 587
Dow
nloa
ded
by [
Uni
vers
ity o
f N
ew M
exic
o] a
t 10:
49 2
7 N
ovem
ber
2014
in T2 (Table 3). The beneficial effect of in situ dhaincha growing was remark-
able at a low dose of fertilizer application. In daincha GM plots, no noticeable
yield loss occurred as a result of the application of 60% Nþ 50% reduced
doses of PKS fertilizers, indicating a possible beneficial residual effect of
these fertilizers applied to the first crop (Boro) of the cropping sequence
(Table 3). However, it appeared from a comparison of yield between “c” and
“d” subplots that N application alone (reduced dose) would not be sufficient,
but that P, K, and S doses would also be required (Table 3). In other words,
the residual effect alone of the fertilizers applied to the first crop (Boro) was
not sufficient to achieve a high yield in the subsequent rice crop; supplementary
fertilization with N, P, K, and S at least in reduced doses, was necessary. The
significant effect of GM, grown in Kharif-I (2.2 t ha21 on an oven-dry basis
(average of 7 years) was observed in Kharif-II (i.e., in T. Aman). The residual
effect of CD was seen in the subsequent T. Aman crop (Table 3).
The average straw yield of Boro was higher with the application of
different fertilizer doses (T2–T5), varying from 4.21 to 5.73 t ha21, versus
that obtained without any fertilization (2.57 t ha21). The trend of the effect
of different fertilizer doses on the straw yield was similar to that of the
grain yield (Table 3).
In the T. Aman (1993–1999), the average straw yield ranged from 2.16 t
ha21 (in the control plot) to 5.61 t ha21 (in T4b) (Table 3). The highest straw
yield was obtained with treatment (T4b), in which dhaincha was incorporated
as GM, a full dose of chemical fertilizer as STB was applied in T. Aman, and
CD was applied in the previous Boro crop. The straw yields in “b” subplots
were superior to that of “a” subplot (Table 3). The straw yields in “b”, “c”,
and “d” subplots were gradually decreased according to the decreasing
amount of inorganic fertilizers in those subplots.
Cost and Return
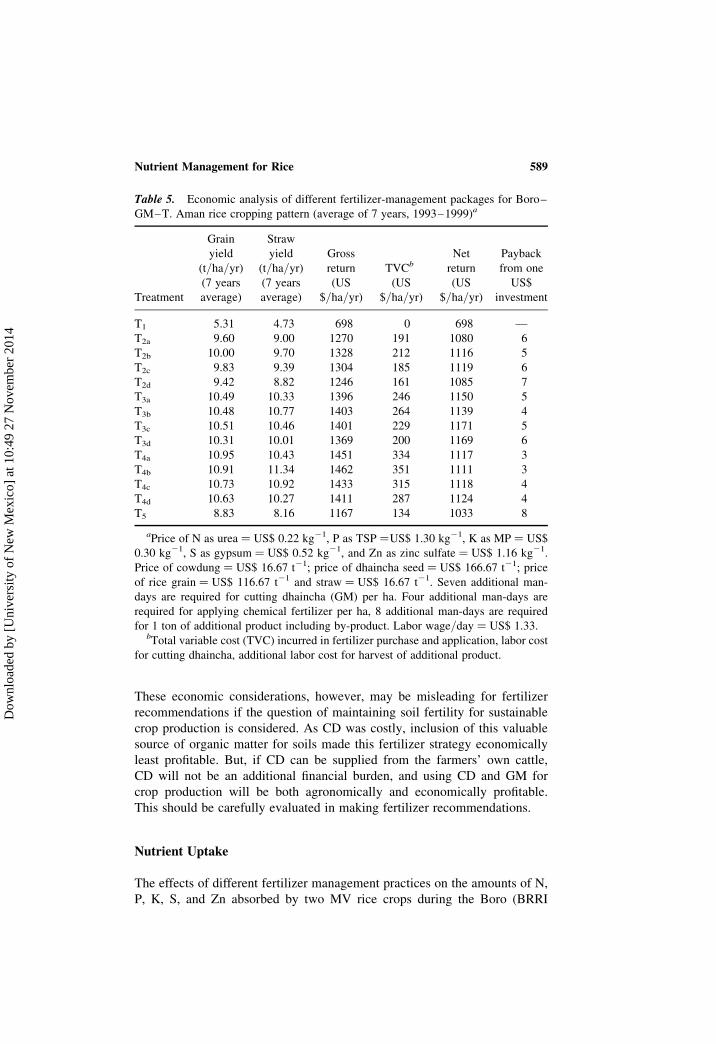
An economic analysis of different fertilizer management systems was done
assuming that the variable cost except fertilizer and manure purchase and
costs involved in handling and application, labor cost for cutting dhaincha,
and additional labor cost for harvest of additional product were the same for
all the treatments. Benefit–cost ratio (BCR) was calculated on the basis of the
additional benefits due to the fertilizer and/or manure application. Table 5
shows the economic analysis of Boro–GM–T. Aman cropping pattern at
BRRI, Gazipur (average of 7 years). The application of fertilizer increased
gross and net return in all the treatments. The gross return from the control
plot was only about $698 U.S., and the application of fertilizer increased the
gross return, which ranged from $1167 in T5 to $1462 in T4b. The highest net
return of $1171 was obtained with T3c compared to the net return with the FP
of $1033. The economic fertilizer package for the moderate-resource-based
farmer would be T2d and for the high-resource-based farmer T3d (Table 5).
P. K. Saha et al.588
Dow
nloa
ded
by [
Uni
vers
ity o
f N
ew M
exic
o] a
t 10:
49 2
7 N
ovem
ber
2014
These economic considerations, however, may be misleading for fertilizer
recommendations if the question of maintaining soil fertility for sustainable
crop production is considered. As CD was costly, inclusion of this valuable
source of organic matter for soils made this fertilizer strategy economically
least profitable. But, if CD can be supplied from the farmers’ own cattle,
CD will not be an additional financial burden, and using CD and GM for
crop production will be both agronomically and economically profitable.
This should be carefully evaluated in making fertilizer recommendations.
Nutrient Uptake
The effects of different fertilizer management practices on the amounts of N,
P, K, S, and Zn absorbed by two MV rice crops during the Boro (BRRI
Table 5. Economic analysis of different fertilizer-management packages for Boro–
GM–T. Aman rice cropping pattern (average of 7 years, 1993–1999)a
Treatment
Grain
yield
(t/ha/yr)(7 years
average)
Straw
yield
(t/ha/yr)(7 years
average)
Gross
return
(US
$/ha/yr)
TVCb
(US
$/ha/yr)
Net
return
(US
$/ha/yr)
Payback
from one
US$
investment
T1 5.31 4.73 698 0 698 —
T2a 9.60 9.00 1270 191 1080 6
T2b 10.00 9.70 1328 212 1116 5
T2c 9.83 9.39 1304 185 1119 6
T2d 9.42 8.82 1246 161 1085 7
T3a 10.49 10.33 1396 246 1150 5
T3b 10.48 10.77 1403 264 1139 4
T3c 10.51 10.46 1401 229 1171 5
T3d 10.31 10.01 1369 200 1169 6
T4a 10.95 10.43 1451 334 1117 3
T4b 10.91 11.34 1462 351 1111 3
T4c 10.73 10.92 1433 315 1118 4
T4d 10.63 10.27 1411 287 1124 4
T5 8.83 8.16 1167 134 1033 8
aPrice of N as urea ¼ US$ 0.22 kg21, P as TSP ¼US$ 1.30 kg21, K as MP ¼ US$
0.30 kg21, S as gypsum ¼ US$ 0.52 kg21, and Zn as zinc sulfate ¼ US$ 1.16 kg21.
Price of cowdung ¼ US$ 16.67 t21; price of dhaincha seed ¼ US$ 166.67 t21; price
of rice grain ¼ US$ 116.67 t21 and straw ¼ US$ 16.67 t21. Seven additional man-
days are required for cutting dhaincha (GM) per ha. Four additional man-days are
required for applying chemical fertilizer per ha, 8 additional man-days are required
for 1 ton of additional product including by-product. Labor wage/day ¼ US$ 1.33.bTotal variable cost (TVC) incurred in fertilizer purchase and application, labor cost
for cutting dhaincha, additional labor cost for harvest of additional product.
Nutrient Management for Rice 589
Dow
nloa
ded
by [
Uni
vers
ity o
f N
ew M
exic
o] a
t 10:
49 2
7 N
ovem
ber
2014

dhan29) and T. Aman (BR11/BRRI dhan31) seasons in the last 4 years of theexperiment (1996–1999) are presented in Tables 6–10. About 80 to 85% of
the K, 30 to 35% of the P, and 40 to 50% of the S absorbed by rice remains
in the vegetative parts at maturity (Yoshida 1981; Mohapatra, Misra, and
Sarkunan 1993; Dobermann et al. 1996; Dobermann, Sta.Cruz, and
Cassman 1996b). In the long-term experiment, intertreatment ranges of
nutrient concentration in straw at harvest in the Boro season were 0.45 to
0.74% N, 0.08 to 0.11% P, 1.30 to 1.63% K, 0.05 to 0.10% S, and 145
to 186 ppm Zn and in grain were 1.02 to 1.26% N, 0.20 to 0.30% P, 0.21 to
0.38% K, 0.03 to 0.14% S, and 90 to 120 ppm Zn. In T. Aman season in
straw at harvest, these were 0.44 to 0.95% N, 0.06 to 0.14% P, 0.90 to
1.20% K, 0.03 to 0.09% S, and 80 to 124 ppm Zn and in grain were 1.12 to
1.43% N, 0.26 to 0.30% P, 0.17 to 0.20% K, 0.08 to 0.12% S, and 20 to 80
ppm Zn. These analysis results confirmed the data obtained by Dobermann
et al. (1998). The nutrient contents and uptake varied widely with the treat-
ments and yield levels. It was observed that the K content in straw was
generally low in T. Aman seasons.
There was significant variation in nutrient uptake with different nutrient-
management practices (Tables 6–10). Essentially, the higher nutrient uptake
was observed in those treatments that produced the higher biomass. Mineral
uptake by rice is associated with biomass production (Matsushima 1964).
As the production (grainþ straw) was higher in STB-treated plots, the
nutrient uptake was also higher in these plots (Tables 6–10). Some improve-
ment in nutrient uptake was observed in plots where organic or GM with full
or some reduced fertilizer doses were applied.
N Uptake
The effects of the different fertilizer management practices on the N uptake
(kg/ha) in a Boro (BRRI dhan29)–GM (Dhaincha)–T. Aman (BR11/BRRIdhan31) cropping pattern during the last 4 years of the experiment (1996–
1999) are presented in Table 6. In the Boro season, in 1996 the N uptake
varied from 54 kg N/ha (T1) to 116 kg N/ha (T5). The N uptake significantly
increased with the treated plots over the control plot (T1). The highest N
uptake was observed in the farmers’ practice (T5) following T4 (STBþ CD)
and T3 (STB). In the succeeding 3 years (1997–1999), the highest N uptake
was found with the treatment T3 (STB) followed by T4 (STBþ CD) (Table 6).
In the T. Aman season, in most of the years of the experiment (1996,
1998, and 1999), the highest N uptake was found with the treatment T4b,
where dhaincha as GM was incorporated with STB dose in T. Aman season
and CD was added in the previous Boro crop. In general, it was observed
that the N uptake were higher in those subtreatments, in which dhaincha
was incorporated with the full doses of chemical fertilizers.
P. K. Saha et al.590
Dow
nloa
ded
by [
Uni
vers
ity o
f N
ew M
exic
o] a
t 10:
49 2
7 N
ovem
ber
2014

Table 6. Effect of different fertilizer packages on the N uptake (kg/ha) in a Boro (BRRI dhan29)–GM (Dhaincha)–T. Aman (BR11/BRRI dhan31)cropping pattern (1996–1999), BRRI, Gazipur
1996 1997 1998 1999
Boro T. Aman Boro T. Aman Boro T. Aman Boro T. Aman
Treat.
N
uptake
(kg/ha) Tr.
N
uptake
(kg/ha) Tr.
N
uptake
(kg/ha) Tr.
N
uptake
(kg/ha) Tr.
N
uptake
(kg/ha) Tr.
N
uptake
(kg/ha) Tr.
N
uptake
(kg/ha) Tr.
N
uptake
(kg/ha)
T1 54 T1 40 T1 42 T1 24 T1 39 T1 29 T1 43 T1 39
T2 98 T2a 68 T2 79 T2a 61 T2 89 T2a 68 T2 90 T2a 73
T2b 82 T2b 55 T2b 80 T2b 104
T2c 76 T2c 53 T2c 69 T2c 87
T2d 61 T2d 39 T2d 46 T2d 84
T3 110 T3a 71 T3 122 T3a 76 T3 95 T3a 72 T3 109 T3a 83
T3b 78 T3b 67c T3b 98 T3b 85
T3c 75 T3c 58 T3c 68 T3c 91
T3d 72 T3d 48 T3d 58 T3d 87
T4 112 T4a 72 T4 120 T4a 80 T4 102 T4a 79 T4 111 T4a 86
T4b 84 T4b 72 T4b 103 T4b 96
T4c 75 T4c 62 T4c 87 T4c 98
T4d 65 T4d 53 T4d 68 T4d 103
T5 116 T5 59 T5 74 T5 51 T5 80 T5 51 T5 77 T5 76
LSD0.05 4.56 — 2.58 — 1.92 — 4.77 — 16.07 — 4.36 — 5.64 — 9.14
CV(%) 2.66 — 2.24 — 1.25 — 5.07 — 11.33 — 3.81 — 3.75 — 6.53
Nutrien
tManagem
entforRice
591
Dow
nloa
ded
by [
Uni
vers
ity o
f N
ew M
exic
o] a
t 10:
49 2
7 N
ovem
ber
2014

Table 7. Effect of different fertilizer packages on the P uptake (kg/ha) in a Boro (BRRI dhan29)–GM (Dhaincha)–T. Aman (BR11/BRRI dhan31)cropping pattern (1996–1999), BRRI, Gazipur
1996 1997 1998 1999
Boro T. Aman Boro T. Aman Boro T. Aman Boro T. Aman
Treat.
P
uptake
(kg/ha) Tr.
P
uptake
(kg/ha) Tr.
P
uptake
(kg/ha) Tr.
P
uptake
(kg/ha) Tr.
P
uptake
(kg/ha) Tr.
P
uptake
(kg/ha) Tr.
P
uptake
(kg/ha) Tr.
P
uptake
(kg/ha)
T1 11.8 T1 8.5 T1 10.6 T1 4.7 T1 7.3 T1 6.3 T1 12.6 T1 7.8
T2 21.2 T2a 14.2 T2 17.0 T2a 13.0 T2 16.7 T2a 13.7 T2 19.3 T2a 13.0
T2b 17.2 T2b 12.7 T2b 16.6 T2b 16.7
T2c 15.6 T2c 10.2 T2c 15.1 T2c 14.4
T2d 12.8 T2d 8.1 T2d 11.9 T2d 12.1
T3 23.9 T3a 14.7 T3 24.8 T3a 17.0 T3 19.2 T3a 15.8 T3 22.3 T3a 16.5
T3b 15.9 T3b 14.4 T3b 18.0 T3b 14.1
T3c 15.4 T3c 10.8 T3c 15.5 T3c 15.5
T3d 14.7 T3d 9.7 T3d 13.7 T3d 14.1
T4 24.3 T4a 15.0 T4 24.2 T4a 16.5 T4 19.3 T4a 18.7 T4 23.5 T4a 19.5
T4b 17.2 T4b 15.6 T4b 18.6 T4b 16.1
T4c 15.4 T4c 12.8 T4c 15.8 T4c 18.6
T4d 13.5 T4d 11.3 T4d 13.6 T4d 17.0
T5 25.1 T5 12.3 T5 16.4 T5 9.3 T5 15.4 T5 12.6 T5 17.2 T5 13.3
LSD0.05 1.34 — 1.22 — 0.40 — 1.54 — 3.78 — 0.94 — 2.36 — 1.98
CV(%) 3.60 — 5.10 — 1.24 — 7.87 — 13.85 — 3.88 — 7.11 — 8.04
P.K.Sahaet
al.
592
Dow
nloa
ded
by [
Uni
vers
ity o
f N
ew M
exic
o] a
t 10:
49 2
7 N
ovem
ber
2014
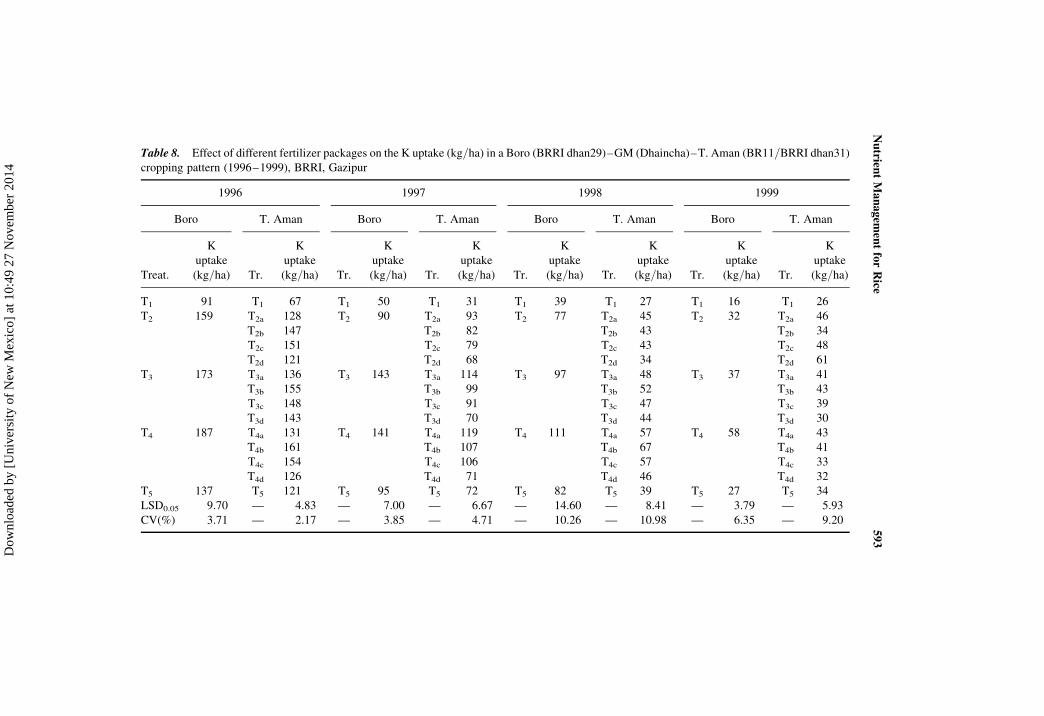
Table 8. Effect of different fertilizer packages on the K uptake (kg/ha) in a Boro (BRRI dhan29)–GM (Dhaincha)–T. Aman (BR11/BRRI dhan31)cropping pattern (1996–1999), BRRI, Gazipur
1996 1997 1998 1999
Boro T. Aman Boro T. Aman Boro T. Aman Boro T. Aman
Treat.
K
uptake
(kg/ha) Tr.
K
uptake
(kg/ha) Tr.
K
uptake
(kg/ha) Tr.
K
uptake
(kg/ha) Tr.
K
uptake
(kg/ha) Tr.
K
uptake
(kg/ha) Tr.
K
uptake
(kg/ha) Tr.
K
uptake
(kg/ha)
T1 91 T1 67 T1 50 T1 31 T1 39 T1 27 T1 16 T1 26
T2 159 T2a 128 T2 90 T2a 93 T2 77 T2a 45 T2 32 T2a 46
T2b 147 T2b 82 T2b 43 T2b 34
T2c 151 T2c 79 T2c 43 T2c 48
T2d 121 T2d 68 T2d 34 T2d 61
T3 173 T3a 136 T3 143 T3a 114 T3 97 T3a 48 T3 37 T3a 41
T3b 155 T3b 99 T3b 52 T3b 43
T3c 148 T3c 91 T3c 47 T3c 39
T3d 143 T3d 70 T3d 44 T3d 30
T4 187 T4a 131 T4 141 T4a 119 T4 111 T4a 57 T4 58 T4a 43
T4b 161 T4b 107 T4b 67 T4b 41
T4c 154 T4c 106 T4c 57 T4c 33
T4d 126 T4d 71 T4d 46 T4d 32
T5 137 T5 121 T5 95 T5 72 T5 82 T5 39 T5 27 T5 34
LSD0.05 9.70 — 4.83 — 7.00 — 6.67 — 14.60 — 8.41 — 3.79 — 5.93
CV(%) 3.71 — 2.17 — 3.85 — 4.71 — 10.26 — 10.98 — 6.35 — 9.20
Nutrien
tManagem
entforRice
593
Dow
nloa
ded
by [
Uni
vers
ity o
f N
ew M
exic
o] a
t 10:
49 2
7 N
ovem
ber
2014

Table 9. Effect of different fertilizer packages on the S nutrient uptake (kg/ha) in a Boro (BRRI dhan29)–GM (Dhaincha)–T. Aman BR11/BRRIdhan31) cropping pattern (1996–1999), BRRI, Gazipur
1996 1997 1998 1999
Boro T. Aman Boro T. Aman Boro T. Aman Boro T. Aman
Treat.
S
uptake
(kg/ha) Tr.
S
uptake
(kg/ha) Tr.
S
uptake
(kg/ha) Tr.
S
uptake
(kg/ha) Tr.
S
uptake
(kg/ha) Tr.
S
uptake
(kg/ha) Tr.
S
uptake
(kg/ha) Tr.
S
uptake
(kg/ha)
T1 7.2 T1 5.8 T1 6.8 T1 3.6 T1 4.9 T1 2.4 T1 1.7 T1 3.5
T2 13.2 T2a 9.9 T2 13.7 T2a 9.2 T2 10.1 T2a 6.6 T2 3.3 T2a 10.6
T2b 12.0 T2b 8.3 T2b 7.4 T2b 9.0
T2c 11.4 T2c 7.5 T2c 5.8 T2c 8.0
T2d 8.9 T2d 6.2 T2d 5.2 T2d 5.2
T3 14.9 T3a 10.5 T3 20.5 T3a 14.2 T3 12.1 T3a 8.5 T3 4.0 T3a 10.9
T3b 11.8 T3b 12.5 T3b 7.9 T3b 13.0
T3c 11.2 T3c 9.9 T3c 8.3 T3c 10.6
T3d 10.8 T3d 8.4 T3d 5.3 T3d 7.8
T4 14.9 T4a 10.4 T4 18.7 T4a 14.4 T4 15.2 T4a 9.3 T4 4.4 T4a 12.7
T4b 12.6 T4b 13.6 T4b 8.5 T4b 10.5
T4c 11.5 T4c 10.4 T4c 6.9 T4c 14.4
T4d 9.5 T4d 8.8 T4d 6.0 T4d 7.4
T5 15.5 T5 8.7 T5 13.9 T5 8.4 T5 10.4 T5 5.1 T5 2.7 T5 8.0
LSD0.05 1.26 — 0.66 — 3.60 — 1.18 — 2.02 — 0.67 — 0.34 — 1.46
CV(%) 5.49 — 3.87 — 13.78 — 7.43 — 10.93 — 6.09 — 6.08 — 9.44
P.K.Sahaet
al.
594
Dow
nloa
ded
by [
Uni
vers
ity o
f N
ew M
exic
o] a
t 10:
49 2
7 N
ovem
ber
2014

Table 10. Effect of different fertilizer packages on the Zn uptake (kg/ha) in a Boro (BRRI dhan29)–GM (Dhaincha)–T. Aman (BR11/BRRIdhan31) cropping pattern (1996–1999), BRRI, Gazipur
1996 1997 1999
Boro T. Aman Boro T. Aman Boro T. Aman
Treat.
Zn
uptake
(kg/ha) Tr.
Zn
uptake
(kg/ha) Tr.
Zn
uptake
(kg/ha) Tr.
Zn
uptake
(kg/ha) Tr.
Zn
uptake
(kg/ha) Tr.
Zn
uptake
(kg/ha)
T1 0.19 T1 0.15 T1 0.31 T1 0.10 T1 0.63 T1 0.26
T2 0.34 T2a 0.26 T2 0.47 T2a 0.27 T2 1.24 T2a 0.57
T2b 0.31 T2b 0.24 T2b 0.62
T2c 0.30 T2c 0.24 T2c 0.60
T2d 0.23 T2d 0.22 T2d 0.35
T3 0.38 T3a 0.27 T3 0.71 T3a 0.36 T3 1.39 T3a 0.47
T3b 0.31 T3b 0.32 T3b 0.39
T3c 0.30 T3c 0.28 T3c 0.59
T3d 0.28 T3d 0.24 T3d 0.49
T4 0.38 T4a 0.27 T4 0.72 T4a 0.38 T4 1.47 T4a 0.62
T4b 0.33 T4b 0.37 T4b 0.65
T4c 0.31 T4c 0.32 T4c 0.73
T4d 0.25 T4d 0.26 T4d 0.77
T5 0.40 T5 0.23 T5 0.39 T5 0.23 T5 1.03 T5 0.79
LSD0.05 0.02 — 0.05 — 0.06 — 0.05 — 0.18 — 0.10
CV(%) 4.68 — 11.18 — 5.93 — 12.68 — 8.95 — 10.67
Note: In 1998, Zn uptake was not determined.
Nutrien
tManagem
entforRice
595
Dow
nloa
ded
by [
Uni
vers
ity o
f N
ew M
exic
o] a
t 10:
49 2
7 N
ovem
ber
2014
P Uptake
The effects of the different fertilizer management practices on the P uptake
(kg/ha) in a Boro (BRRI dhan29)–GM (Dhaincha)–T. Aman (BR11/BRRIdhan31) cropping pattern during the last 4 years of the experiment (1996–
1999) are presented in the Table 7. In the Boro season in 1996, the P
uptake (kg/ha) ranged from 11.8 (T1) to 25.1 (T5). The P uptake significantly
increased with the treated plots over the control plot (T1). But the increase of
the P uptake in the treatments T3, T4, and T5 were identical. The P uptake in
the treatment T2 was lower than that of T3, T4, and T5. In the most of the years
of the experiment, the highest P uptake was found with the treatments T3 and
T4, followed by T2.
In the T. Aman season, in the most of the years of the experiment, the
highest P uptake was found with the treatment T4a/T4b, where CD was
added in the previous Boro crop. In 1996, the P uptake ranged from 8.5
(T1) to 17.2 kg P/ha (T4b/T2b). Like N uptake in general, it was observed
that the P uptake was also higher in those subtreatments, where dhaincha
was incorporated with the full and 50% reduced doses of chemical fertilizers
in the T. Aman season. It indicated that the incorporation of dhaincha helped
to add P nutrient.
The value of the total P uptake (kg/ha/yr) in the control plot (T1) under
the crop BR11 gradually decreased over the years (1996–1998). The value
(total P uptake) was recovered when another genotype BRRI dhan31 was
grown (treatment T1; Table 7).
K Uptake
The effects of the different fertilizer management practices on the K uptake
(kg/ha) in a Boro (BRRI dhan29)–GM (Dhaincha)–T. Aman (BR11/BRRIdhan31) cropping pattern during the last 4 years of the experiment (1996–
1999) are presented in Table 8. In the Boro season in 1996, the K uptake
(kg/ha) ranged from 91 (T1) to 187 (T4). Like P uptake, the K uptake signifi-
cantly increased because of the application of different packages of fertilizers
(Table 8). The highest K uptake, 187 kg/ha, was found with the treatment T4
(STBþ CD), followed by T3 (STB) (173), and T2 (BARC guide) (159). It was
137 kg/ha in the case of T5 (FP). A similar trend was also found in the suc-
ceeding 3 years (1997–1999).
In the T. Aman season in 1996, it ranged from 67 (T1) to 161 kg/ha (T4b).
The highest K uptake (161 kg/ha) was obtained with treatment T4b, followed
by T3b (155) and T4c (154). In general, the K uptake was higher in those
subplots where dhaincha was incorporated. A similar trend was also found
in the succeeding years (1997–1999) (Table 8). The value of the total K
uptake (kg/ha/yr) in unfertilized plot (T1) gradually decreased over the
years (Table 8).
P. K. Saha et al.596
Dow
nloa
ded
by [
Uni
vers
ity o
f N
ew M
exic
o] a
t 10:
49 2
7 N
ovem
ber
2014

S Uptake
The effects of the different fertilizer-management practices on the S uptake
(kg/ha) in a Boro (BRRI dhan29)–GM (Dhaincha)–T. Aman (BR11/BRRIdhan31) cropping pattern during the last 4 years of the experiment (1996–
1999) are presented in Table 9. In the Boro season in 1996, the S uptake
ranged from 7.2 (T1) to 15.5 kg/ha (T5). Because of the application of
different packages of fertilizers, the S uptake significantly increased over
the control plot (T1). The increase of S uptake among the treatments T3, T4,
and T5 were identical, but it was significantly lower in the T2 treatment. In
the succeeding 3 years (1997–1999), the highest S uptake was found with
the treatment T4 (STBþ CD). In the last year (1999) of the experiment, the
S uptake was 1.7 kg/ha in the control plot (T1) (Table 9). Among the treat-
ments, treatment T4 yielded the highest S uptake (4.4 kg/ha), followed by
T3 (4.0) and T2 (3.3) (Table 9). The differences among the treatments were
significant.
In the T. Aman season in 1996, the S uptake ranged from 5.8 (T1) to 12.6
kg/ha (T4b). The S uptake significantly increased because of the application of
the different packages of fertilizers over the control plot (T1). The highest S
uptake (12.6 kg/ha) was observed with treatment T4b (STBþ CDþGM),
followed by T2b (12.0). Generally, it was marked that the S uptake was
higher in those subplots where dhaincha as GM was incorporated. A similar
trend was also observed in the succeeding years (1997–1999). Like K, the
value of the total S uptake (kg/ha/yr) in the unfertilized plot (T1) gradually
decreased over the years (Table 9).
Zn Uptake
The effects of the different fertilizer-management practices on the Zn uptake
(kg/ha) in a Boro (BRRI dhan29)–GM (Dhaincha)–T. Aman (BR11/BRRIdhan31) cropping pattern during the last 3 years of the experiment (1996,
1997, and1999) are presented in the Table 10. In the Boro season in 1996,
the Zn uptake (kg/ha) ranged from 0.19 (T1) to 0.40 kg/ha (T5). Because
of the application of the different packages of fertilizers, the Zn uptake signifi-
cantly increased over the control plot (T1). The highest Zn uptake (0.40 kg/ha)was observed with treatment T5 (FP), followed by T4/T3 (0.38) and T2 (0.34).
In the next two years (1997 and 1999), in Boro season, the highest Zn uptake
was observed with treatment T4, followed by T3, but the difference between
the treatments T4 and T3 was identical. The Zn uptake (kg/ha) was signifi-cantly lower with the treatment T2 (BARC guide) than that of T3 and T4.
In the T. Aman season in 1996, the Zn uptake ranged from 0.15 (T1) to
0.33 kg/ha (T4b). The highest Zn uptake (0.33 kg/ha) was observed with
the treatment T4b in which dhaincha as GM was incorporated. Generally,
the Zn uptake was higher in those subplots where dhaincha was incorporated.
Nutrient Management for Rice 597
Dow
nloa
ded
by [
Uni
vers
ity o
f N
ew M
exic
o] a
t 10:
49 2
7 N
ovem
ber
2014
It indicates that dhaincha helps to add Zn nutrient. A similar trend was also
observed in 1997 and 1999 (Table 10).
Apparent Nutrient Balances and Management Practices
We used a simplified approach for calculating partial net N, P, K, S, and Zn
balances based on major inputs: fertilizers [including organic manure (CD)
and GM (dhaincha)], added nutrients through irrigation water, biological
nitrogen fixation (BNF), and major outputs (aboveground plant uptake). The
results of the four cropcycles of the last 4 years (1996–1999) of the field
experiments are presented in Tables 11 and 12.
The apparent nutrient balance in the control plot (T1) was negative for all
the nutrients, because no fertilizer was added there (Table 11). The crops of
the control plot mined 230 kg N/ha, 67.2 kg P/ha, 290 kg K/ha, and 35.9
kg S/ha in 4 years and 1.64 kg Zn/ha in 3 years. In the fertilized plots,
there was an apparent positive balance of P, S, and Zn but a negative
balance of N and K. Earlier studies conducted by Karim, Miah, and Razia
(1994) and Bhuiyan(1992) also indicated the negative nutrient balances for
N and K.
N Balance
Nitrogen replenishment through chemical fertilizer, GM, and CD addition
either singly or in combination was not enough to balance N removal by
crops because much of the applied N was lost from the soil. The N balance
thus was negative: 185 (T4d) to 290 kg N/ha (T3a) in the 4 years
(Table 11). However, the subtreatments where CD and GM were added
showed a less negative balance of N. Nitrogen is subjected to loss through vol-
atilization, denitrification, and surface run-off during heavy rain; therefore, the
theoretical balance of N in tropical soil may not be so useful, unless the
residual N of the previous crop is utilized by the subsequent crop.
P Balance
The apparent P balance in the soil resulted from the different fertilizer-
management practices ranged from 223.2 (T5) to 260 kg P/ha (T4b) in 4
years. T2a, where fertilizer was applied according to the BARC fertilizer
guide, yielded a positive balance of P by 50.3 kg/ha in 4 years; incorporation
of dhaincha as GM into it (i.e., T2b) increased P balance to 55.4 kg/ha in 4
years. The reduction of P fertilizer application by 50% and 100% from the
treatment T2b reduced P balance to 27.3 and 1.7 kg/ha in 4 years, respectively.The application of STB fertilizer (T3a) increased apparent P balance to 92.2
kg/ha in 4 years, and the addition of dhaincha along with it further
increased P balance to 108.2 kg/ha in 4 years. The addition of CD along
P. K. Saha et al.598
Dow
nloa
ded
by [
Uni
vers
ity o
f N
ew M
exic
o] a
t 10:
49 2
7 N
ovem
ber
2014

Table 11. Effect of different fertilizer packages on the soil-nutrient apparent balance sheet in the Boro (BRRI dhan29)–GM (Dhaincha)–T. Aman
(BR11/BRRI dhan31) cropping pattern (1996–1999), BRRI, Gazipur
Na Pa Ka Sa Znb
Treatment Addedc Uptake Balance Added Uptake Balance Added Uptake Balance Added Uptake Balance Added Uptake Balance
Nutrient elements (kg/ha)T1 80 310 2230 2.4 69.6 267.2 56.4 347 2290.6 0 35.9 235.9 0 1.64 21.64
T2a 352 626 2274 178.4 128.1 50.3 320.4 670 2349.6 120 76.6 43.4 12 3.15 8.85
T2b 429 677 2248 192.8 137.4 55.4 452.4 664 2211.6 183.2 77.0 106.2 12.09 3.22 8.87
T2c 381 641 2260 156.8 129.5 27.3 386.4 679 2292.6 163.2 73.0 90.2 12.09 3.19 8.9
T2d 381 586 2205 120.8 119.1 1.7 320.4 642 2321.6 143.2 65.8 77.4 12.09 2.85 9.24
T3a 448 738 2290 246.4 154.2 92.2 388.4 789 2400.6 200 95.6 104.4 0 3.58 23.58
T3b 525 764 2239 260.8 152.6 108.2 520.4 799 2278.6 263.2 96.7 166.5 0.09 3.5 23.41
T3c 469 728 2259 208.8 147.4 61.4 454.4 775 2320.6 223.2 91.5 131.7 0.09 3.65 23.56
T3d 469 701 2232 156.8 142.4 14.4 388.4 737 2348.6 183.2 83.8 99.4 0.09 3.49 23.4
T4a 528 762 2234 404.4 161.0 243.4 656.4 847 2190.6 226 100 126 1.77 3.84 22.07
T4b 605 800 2195 418.8 158.8 260.0 788.4 973 2184.6 289.2 98.4 190.8 1.86 3.92 22.06
T4c 549 767 2218 366.8 153.9 212.9 722.4 847 2124.6 249.2 96.4 152.8 1.86 3.93 22.07
T4d 549 734 2185 314.8 146.7 168.1 656.4 772 2115.6 209.2 84.9 124.3 1.86 3.85 21.99
T5 304 584 2280 98.4 121.6 223.2 206.4 607 2400.6 100 72.7 27.3 0 3.07 23.07
aIt is the grand total of 4 years (1996–1999).bIt is the grand total of 3 years.c40% of applied fertilizer/manure N was considered effective.
Nutrien
tManagem
entforRice
599
Dow
nloa
ded
by [
Uni
vers
ity o
f N
ew M
exic
o] a
t 10:
49 2
7 N
ovem
ber
2014
with STB (T4a) increased apparent P balance to 243.4 kg/ha in 4 years. The
highest P balance of 260 kg/ha in 4 years was obtained with the treatment
T4b, where CD was applied along with STB doses and dhaincha as GM was
incorporated. The reduction of P fertilizer application by 100% from the
treatment T4b reduced P balance to 168.1 kg/ha in 4 years (Table 11) (i.e.,
42.0 kg/ha/yr). It indicates that the considerable P balance in soil, which
was the equivalent amount of the yearly P uptake by crops (Table 7) in the
Boro–GM–T. Aman cropping sequence, may be achieved by successfully
substituted by CD and dhaincha incorporation for chemical P fertilizer. Phos-
phorus at the rate of 26 kg P/ha in Boro season and 18 kg P/ha in T. Aman
season was enough to maintain the P balance and even to build up soil P up
to 50.3 kg P/ha in 4 years (see treatment T2a; Table 11) (i.e., on average,
22 kg P/ha/season had a partial net P gain of 6.3 kg P/ha/season). Thistype of result was obtained by Dobermann et al. (1998). They reported that
the fertilizer P rates used (17 to 25 kg P/ha) were large enough to maintain
the P balance or even to build up soil P up to 4.9 kg P/ha/season.
K Balance
Unlike P, the apparent balance of K in soil was highly negative. The
magnitude of the negative K balance ranged from 2400.6 (T3a/T5) to
2115.6 kg/ha (T4d) in 4 years. The incorporation of dhaincha as GM
tended to favor K balance by 120 to 140 kg/ha in 4 years (see T3a, T3b,
T2a, and T2b in Table 11). The application of CD favored K balance by
about 210 kg/ha in 4 years. The addition of CD along with dhaincha in
STB treatment gave a less negative balance of K (Table 11). This result is
confirmed by another study (Saha et al. 2003). The addition of CD at the
rate of 5 t/ha (oven-dry basis) along with an STB dose showed a less
negative balance of K in the long-term field experiment. A negative balance
of K may lead to K deficiency in soil in the long run. These results
confirmed the reports by Huang, Li, and Xie (1990), Tiwari (1985),
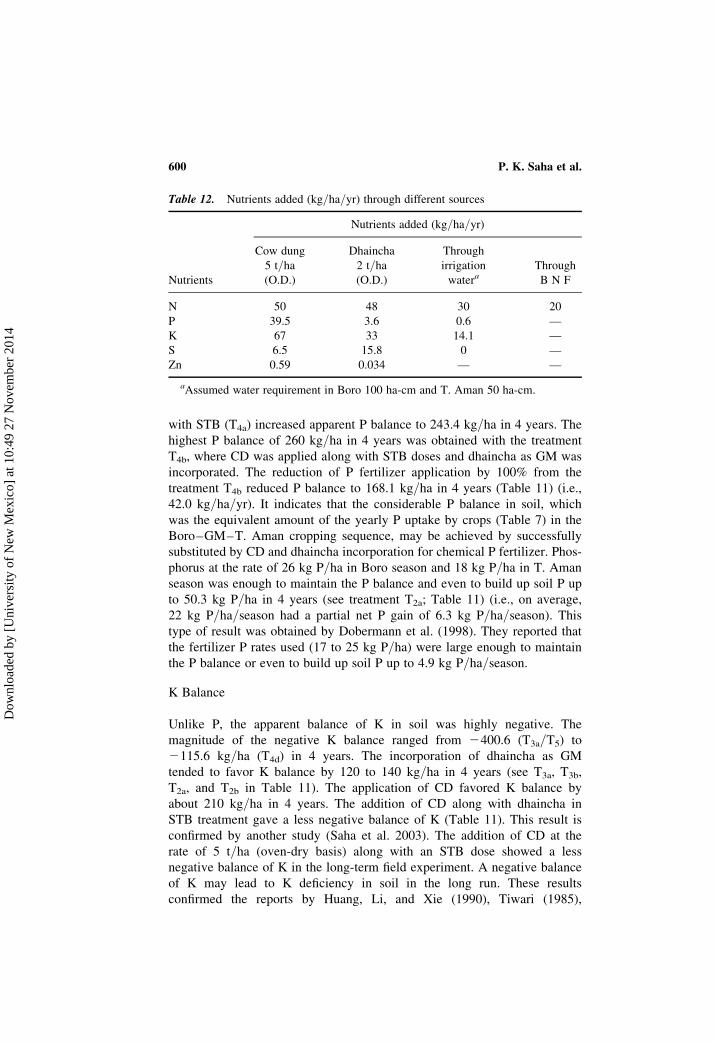
Table 12. Nutrients added (kg/ha/yr) through different sources
Nutrients added (kg/ha/yr)
Nutrients
Cow dung
5 t/ha(O.D.)
Dhaincha
2 t/ha(O.D.)
Through
irrigation
wateraThrough
B N F
N 50 48 30 20
P 39.5 3.6 0.6 —
K 67 33 14.1 —
S 6.5 15.8 0 —
Zn 0.59 0.034 — —
aAssumed water requirement in Boro 100 ha-cm and T. Aman 50 ha-cm.
P. K. Saha et al.600
Dow
nloa
ded
by [
Uni
vers
ity o
f N
ew M
exic
o] a
t 10:
49 2
7 N
ovem
ber
2014
Mohanty and Mandal (1989), Prasad (1993), and Saha et al. (2003), indicating
negative K balances and ongoing K depletion in many irrigated rice systems.
The K fertilizer dose, therefore, needs to be fixed with caution. From this
study, it was concluded that if the CD and dhaincha may be added to the
soil, the negative K balance may be narrower.
S Balance
Like P, the apparent S balance in the soil resulted from the different fertilizer
management practices ranged from 27.3 (T5) to 190.8 kg S/ha (T4b) in 4 years.
T2a, where fertilizer was applied according to the BARC guide, yielded a
positive balance of S by 43.4 kg/ha in 4 years; incorporation of dhaincha as
GM into it (i.e., T2b) increased S balance to 106.2 kg/ha in 4 years. The
reduction of S fertilizer application by 50% and 100% from the treatment
T2b reduced S balance to 90.2 and 77.4 kg/ha in 4 years, respectively. The
application of STB fertilizer (T3a) increased apparent S balance to 104.4
kg/ha in 4 years, and the addition of dhaincha along with it further
increased S balance to 166.5 kg/ha in 4 years. The addition of CD along
with STB (T4a) increased apparent S balance to 126 kg/ha in 4 years. The
highest S balance of 190.8 kg/ha in 4 years was obtained with the
treatment T4b, where CD was applied along with STB doses and dhaincha
as GM was incorporated. The reduction of S fertilizer application by 50%
from the treatment T4b, reduced S balance to 152.8 kg/ha in 4 years
(Table 11) (i.e., 38.2 kg/ha/yr). The considerable S balance in soil, which
was the equivalent amount of the yearly S uptake by crops (Table 9) in
Boro–GM–T. Aman cropping sequence, may be achieved by 50% success-
fully substituting CD and dhaincha for chemical S fertilizer.
Zn Balance
The apparent balance of Zn in soil was negative, except the treatments T2a,
T2b, T2c, and T2d, where Zn fertilizer was applied only in the Boro season
according to the BARC guide yielded a positive balance of Zn by 8.85 to
9.24 kg/ha in 3 years. The magnitude of Zn balance ranged from–3.58
(T3a) to 9.24 kg/ha (T2d) in 3 years. The application of CD along with STB
showed a less negative balance of Zn. However, the incorporation of
dhaincha as GM did not show any positive effect on the Zn balance (Table 11).
Soil Fertility Status
Perceptible changes in soil characteristics and soil nutrient status occurred
through the use of varying fertilizer packages in the dry season rice
(Boro)–GM dhaincha (S. aculeata)–wet season rice (T. Aman) cropping
pattern (Tables 13 and 14).
Nutrient Management for Rice 601
Dow
nloa
ded
by [
Uni
vers
ity o
f N
ew M
exic
o] a
t 10:
49 2
7 N
ovem
ber
2014

Soil pH
Table 13 shows that pH ranged from 6.0 (T3b/T4b) to 6.8 (T3c) at the depth of
0–15 cm and 7.0 (T4a) to 7.5 (T3d) at the depth of 16–30 cm. The initial soil
Table 13. Postharvest soil pH, organic carbon, and some macronutrient status (N, P,
K, S) at the different depths due to varying fertilizer packages used for 7 years in a
Boro–GM–T. Aman cropping pattern, BRRI, Gazipur (1993–1999)
Treatment
pH
(1 : 2.5)
Organic
carbon (%)
Total
N (%)
Available
P (ppm)
Exch.K
(meq/100 g soil)
Available
S (ppm)
0–15 cm
Initial soil 6.6 1.28 0.10 6.17 0.16 13.92
T1 6.7 0.98 0.11 8.14 0.17 16.46
T2a 6.6 0.99 0.11 13.28 0.19 22.98
T2b 6.4 1.22 0.12 18.67 0.19 21.33
T2c 6.5 1.33 0.12 12.49 0.18 18.11
T2d 6.7 1.30 0.13 11.43 0.18 17.29
T3a 6.5 1.14 0.12 23.47 0.19 27.19
T3b 6.0 1.25 0.13 29.65 0.18 26.75
T3c 6.8 1.15 0.11 19.13 0.20 22.88
T3d 6.6 1.29 0.12 11.17 0.20 20.58
T4a 6.3 1.36 0.11 37.21 0.19 32.48
T4b 6.0 1.38 0.14 40.37 0.19 27.99
T4c 6.1 1.71 0.16 37.54 0.20 34.98
T4d 6.1 1.70 0.15 29.41 0.20 27.78
T5 6.4 1.07 0.10 9.87 0.17 23.15
LSD 0.05 0.27 0.21 0.015 2.85 0.027 3.20
CV (%) 2.5 9.8 7.8 8.3 8.6 9.4
16–30 cm
Initial soil 7.3 0.75 0.08 1.95 0.17 6.93
T1 7.4 0.37 0.04 7.52 0.18 15.85
T2a 7.1 0.67 0.05 6.61 0.18 14.41
T2b 7.1 0.75 0.06 10.32 0.17 16.67
T2c 7.2 0.73 0.06 8.58 0.17 14.74
T2d 7.2 0.70 0.07 9.85 0.16 9.67
T3a 7.3 0.63 0.06 8.19 0.16 11.12
T3b 7.3 0.45 0.06 11.89 0.18 11.52
T3c 7.4 0.64 0.05 12.69 0.18 11.59
T3d 7.5 0.56 0.06 5.46 0.18 8.64
T4a 7.0 0.39 0.07 5.03 0.19 18.52
T4b 7.1 0.60 0.07 9.39 0.17 17.77
T4c 7.1 0.54 0.07 6.83 0.17 12.83
T4d 7.2 0.59 0.06 6.58 0.19 12.28
T5 7.4 0.62 0.07 4.61 0.18 13.65
LSD 0.05 0.22 0.18 0.019 2.02 0.029 1.93
CV (%) 1.8 17.5 18.5 15.7 9.6 9.5
P. K. Saha et al.602
Dow
nloa
ded
by [
Uni
vers
ity o
f N
ew M
exic
o] a
t 10:
49 2
7 N
ovem
ber
2014

pH was 6.6 at 0–15 cm and 7.3 at 16–30 cm. After 7 years, pH increases
slightly up to 6.7 at 0–15 cm and 7.4 at 16–30 cm in the control plot (T1),
where no fertilizer was applied. The use of the full doses of chemical fertili-
zers alone (T2a/T3a) appeared to have a slight soil pH depression effect in 0–
15 cm. A significant soil pH depression effect was found in treatments T3b
and T4b (pH ¼ 6.0), where dhaincha GM was incorporated along with the
full doses of chemical fertilizers as STB (T3a). The addition of CD along
with the full doses of chemical fertilizers (T4a) also appeared to have a
slight pH depression effect (Table 13). It was most probably due to
released organic acid from biomass of dhaincha and CD. These results
confirmed the reports reported by Beri, Meelu, and Khind (1989). They
reported that the pH values of soils collected after final harvest were
slightly lower than those of soils at 70 days after sowing (DAS) of
Sesbania. The reduction of P, K, and S chemical fertilizers by 50% and
100% from the treatment (T2b) did not influence the pH value. A similar
trend was also found in the cases of T3c and T3d. There was a significant
depression effect in pH values in T4c and T4d when dhaincha GM was incor-
porated with the reduced doses of chemical fertilizer in T. Aman season and
Table 14. Postharvest soil micronutrient status (available Zn, Fe, Cu, and Mn) at
different depths due to varying fertilizer packages used for 7 years for a Boro–GM–
T. Aman cropping pattern, BRRI, Gazipur (1993–1999)
Treatment
Available Zn
(ppm)
Available Fe
(ppm)
Available Cu
(ppm)
Available Mn
(ppm)
0–15
cm
16–30
cm
0–15
cm
16–30
cm
0–15
cm
16–30
cm
0–15
cm
16–30
cm
Initial soil 2.69 0.86 72 44 4.11 3.80 79 46
T1 2.84 1.29 70 29 4.55 3.61 48 27
T2a 5.51 2.53 91 27 4.68 4.06 77 41
T2b 6.70 2.74 93 27 4.46 3.98 63 39
T2c 6.96 3.16 89 29 4.72 4.02 68 48
T2d 6.14 3.60 68 30 4.59 3.84 66 43
T3a 4.23 3.68 105 24 4.46 3.45 86 47
T3b 5.16 3.49 115 19 4.46 3.80 93 44
T3c 4.77 3.12 100 26 4.33 3.89 88 34
T3d 3.17 3.12 77 34 4.37 3.93 57 33
T4a 5.42 2.85 116 26 4.64 3.84 92 39
T4b 5.71 1.19 97 31 4.37 3.80 89 28
T4c 6.02 1.61 114 24 4.95 3.40 99 35
T4d 5.95 1.43 117 36 4.90 3.76 114 38
T5 2.86 1.14 79 29 4.31 3.91 57 48
LSD 0.05 0.97 0.70 9.9 4.5 0.50 0.39 8.9 4.9
CV (%) 11.7 17.4 6.3 9.2 6.6 6.1 6.8 7.4
Nutrient Management for Rice 603
Dow
nloa
ded
by [
Uni
vers
ity o
f N
ew M
exic
o] a
t 10:
49 2
7 N
ovem
ber
2014

CD was applied in the previous Boro crop. A similar trend in pH was also
observed in the lower layer (16–30 cm deep) (Table 13).
Soil Organic Carbon
Organic carbon (C) in soils varied significantly as influenced by the use of
varying fertilizer packages. Organic C ranged from 0.98% (T1) to 1.71%
(T4c) at 0–15 cm and 0.37% (T1) to 0.75% (T2b/initial soil) at 16–30 cm.
In the initial soil, organic C was 1.28% at 0–15 cm and 0.75% at 16–30
cm. After 7 years, organic C decreased significantly up to 0.98% at 0–15
cm and 0.37% at 16–30 cm in the control plot (T1), where no fertilizer was
applied. The use of chemical fertilizer alone (T2a/T3a) did not show any
positive influence on the organic C (Table 13), but the combined application
of dhaincha along with chemical fertilizers (T2b, T2c, T2d, T3b, and T3d) or CD
along with chemical fertilizers (T4a) brought about some increase in the soil
organic C level at 0–15 cm (Table 13). The significantly highest percentage
of organic C (1.71) at 0–15 cm was accumulated in treatment T4c, followed
by T4d, where dhaincha was incorporated along with the reduced doses of
chemical fertilizers in the T. Aman season and CD was added in the
previous Boro season (Table 13). Rao and Gill (1995) and Kader et al.
(2000) also observed a considerable beneficial influence from growing
dhaincha as soil C.
Total N
In the intertreatments, the total N in soil ranged from 0.10% (initial soil/T5)
to 0.16% (T4c) at 0–15 cm and 0.04% (T1) to 0.08% (initial soil) at 16–30
cm. Like organic C, the significantly highest amount of total N was
observed with T4c followed by T4d, where CD was applied in the Boro
season and dhaincha was incorporated along with the reduced doses of
chemical fertilizers in the T. Aman season (Table 13). It might be due to
accumulated organic C. It is remarkable that the amount of organic C
was also higher in these treatments at 0–15 cm (Table 13). In general,
the amount of total N was higher in those subtreatments, where dhaincha
GM was incorporated (Table 13). These findings support the results
obtained by Kader et al. (2000). The findings of Jenny and Kleter (1965)
also support the idea that a system would benefit from receiving a
continuous supply of N from the associated legume crops either by biologi-
cal N fixation and current transfer or by decay and decomposition of root
nodules.
Available P
The most remarkable thing about the nutrient status was the change in
available P content of the soil. The available P increased or decreased
P. K. Saha et al.604
Dow
nloa
ded
by [
Uni
vers
ity o
f N
ew M
exic
o] a
t 10:
49 2
7 N
ovem
ber
2014

appreciably depending on whether P was applied and on the level of P appli-
cation. Thus, available P in soil resulted from the different fertilizer-manage-
ment practices, ranging from 6.17 ppm (initial soil) to 40.37 ppm (T4b) at 0–
15 cm and 1.95 ppm (initial soil) to 12.69 ppm (T3c) at 16–30 cm. After 7
years, in the control plot (T1), where no fertilizer was applied, a slight accumu-
lation of available P was observed in both the layers. But at 0–15 cm; the
difference was identical. T2a, where P fertilizer at 26 kg P/ha in the Boro
season and 18 kg P/ha in the T. Aman season per year was applied
according to the BARC guide, yielded a significantly positive accumulation
of available soil P by 13.28 ppm. Incorporation of dhaincha GM into it (i.e.,
T2b) increased significantly available P to 18.67 ppm. The reduction of P fer-
tilizer application by 50% and 100% from treatment T2b reduced available P to
12.49 and 11.43 ppm, respectively. The application of STB fertilizer (T3a) sig-
nificantly increased available P to 23.47 ppm, and the addition of dhaincha
GM along with it further significantly increased available P to 29.65 ppm.
The addition of CD along with STB dose (T4a) significantly increased
available P to 37.21 ppm. The significantly highest amount of available P
(40.37 ppm) was obtained with the treatment T4b, where dhaincha GM was
incorporated along with STB doses in the T. Aman season and CD was
applied along with STB doses in the previous Boro season. The higher
amount of available soil P (37.21–40.37 ppm) was found in T4a-, T4c-, and
T4b-treated plots (Table 13). This was six times higher than that of the
initial soil, due to the application of CD, as it had a good amount of total P
(0.50–0.79%) (Anonymous 1997; Saha et al. 2004). It is remarkable that
the available P content at 0–15 cm in subplots where dhaincha was incorpor-
ated was comparable to that of subplots where no dhaincha was added. The
difference was statistically significant. From this observation, it indicates
that dhaincha with the combination of chemical fertilizer helps to mobilize
soil available P by 3–6 ppm (Table 13).
Exchangeable K
A little influence of some fertilizer-management practices on the exchange-
able K was observed (Table 13). The exchangeable K ranged from
0.16 (initial soil) to 0.20 meq/100 g soil (T4c/T4d) at 0–15 cm and 0.16
(T2d) to 0.19 meq/100 g soil (T4a) at 16–30 cm (Table 13). In the initial
soil, exchangeable K was 0.16 meq/100 g soil at 0–15 cm and 0.17
meq/100 g soil at 16–30 cm. After 7 years, it increased slightly to 0.17
meq/100 g soil at 0–15 cm and 0.18 meq/100 g soil at 16–30 cm in
the control plot (T1), where no fertilizer was added, but the difference
was identical. A slightly higher amount of exchangeable K at 0–15 cm
was obtained in those subplots, where chemical fertilizers and organic
manure (CD and dhaincha GM) were added in comparison with T1 and
initial soil (Table 13).
Nutrient Management for Rice 605
Dow
nloa
ded
by [
Uni
vers
ity o
f N
ew M
exic
o] a
t 10:
49 2
7 N
ovem
ber
2014
Available S
Like available P, the available S in soil resulted from different fertilizer-
management practices and ranged from 13.92 ppm (initial soil) to 34.98
ppm (T4c) at 0–15 cm and 6.93 ppm (initial soil) to 18.52 ppm (T4a) at 16–
30 cm (Table 13). After 7 years, in the control plot (T1), where no fertilizer
was added, a slight accumulation of available S was observed in both the
layers, but at 0–15 cm, there was not a significant difference. T2a, where fer-
tilizer was applied according to the BARC guide, yielded a significantly
positive accumulation of available S by 22.98 ppm. The incorporation of
dhaincha GM into it did not show any positive influence (Table 13). The
reduction of P, K, and S fertilizer application by 50% and 100% from
treatment T2b reduced available S to 18.11 ppm and 17.29 ppm, respectively.
The application of STB fertilizer (T3a) increased significantly available S to
27.19 ppm. The addition of dhaincha GM along with it did not show any
positive influence (Table 13). A positive influence was found when CD was
added along with it. The addition of CD along with it (T4a) increased signifi-
cantly available S to 32.48 ppm. The significantly highest amount of available
S (34.98 ppm) was obtained with the treatment T4c, where CD was applied
along with STB in Boro season and dhaincha GM was incorporated along
with 50% reduced doses of P, K, and S in T. Aman season. This was 2.5
times higher than that of the initial soil, probably due to higher organic C
(i.e., organic matter content) (Table 13).
Available Zn
The available Zn in soil resulted from the different fertilizer-management
practices and ranged from 2.69 ppm (initial soil) to 6.96 ppm (T2c) at 0–15
cm and 0.86 ppm (initial soil) to 3.68 ppm (T3a) at 16–30 cm. After 7
years, in the control plot (T1), where no fertilizer was applied, a slight accumu-
lation of available Zn was observed in both the layers. Statistically, the differ-
ence was identical. Only Boro season in T2a, where Zn (4 kg/ha) was appliedaccording to the BARC guide, yielded a significantly positive accumulation of
available Zn by 5.51 ppm. Incorporation of dhaincha GM into it (i.e., T2b) sig-
nificantly increased available Zn to 6.70 ppm. The reduction of P, K, and S
fertilizer application by 50% and 100% from treatment T2b did not
influence the accumulation of the available Zn. The significantly highest
amount of available Zn (6.96 ppm) was obtained with treatment T2c
followed by T2d, where Zn (4 kg/ha) was added in Boro season and
dhaincha GM was incorporated in T. Aman season. The application of STB
fertilizer (T3a), where Zn was not added, significantly increased available
Zn to 4.23 ppm, but it was lower than that of T2a, where Zn was added. The
incorporation of dhaincha GM along with the STB dose slightly increased
available Zn to 5.16 ppm, but the difference was identical. The addition of
P. K. Saha et al.606
Dow
nloa
ded
by [
Uni
vers
ity o
f N
ew M
exic
o] a
t 10:
49 2
7 N
ovem
ber
2014
CD along with STB dose significantly increased available Zn to 5.42 ppm
(Table 14). The incorporation of dhaincha GM into it also slightly improved
the accumulation of available Zn further up to 6.20 ppm (T4c) (Table 14).
Available Iron
The available iron (Fe) in soil resulting from the different fertilizer-
management practices ranged from 68 ppm (T2d) to 117 ppm (T4d) at 0–15
cm and 19 ppm (T3b) to 44 ppm (initial soil) at 16–30 cm (Table 14). After
7 years, in the control plot (T1), where no fertilizer was added, a slight
depression of available Fe was observed in both the layers. But at 0–15 cm,
the difference was identical. T2a, where fertilizer was applied according to
the BARC guide, yielded a statistically positive accumulation of available
Fe by 91 ppm. Incorporation of dhaincha GM into it (i.e., T2b) increased
slightly the amount of available Fe to 93 ppm, but the difference was
identical. The reduction of P-K-S fertilizer application by 50% and 100%
from treatment T2b reduced available Fe to 89 ppm and 68 ppm, respectively.
The application of STB fertilizer (T3a) significantly increased available Fe to
105 ppm, and the addition of dhaincha GM along with it further increased
available Fe to 115 ppm, but the difference was identical. The addition of
CD along with STB (T4a) significantly increased available Fe to 116 ppm
(Table 14). The addition of dhaincha GM into it (T4b) significantly
decreased the available Fe to 97 ppm. The reduction of P, K, and S fertilizer
application by 50% and 100% from treatment T4b did not reduce the amount of
available Fe. The amount of available Fe in these subtreatments (T4c, T4d) was
the same as T4a, probably due to accumulated higher amounts of organic C
(i.e., organic matter in these sub-treatments) (Table 13).
Available Copper
The use of chemical fertilizers alone or with the combination of organic
manure (CD, dhaincha GM) appeared to have a slight increase effect on the
soil-available copper (Cu), but this increase was not significant. The soil-
available Cu ranged from 4.11 ppm (initial soil) to 4.95 ppm (T4c) at 0–15
cm and 3.40 ppm (T4c) to 4.06 ppm (T2a) at 16–30 cm (Table 14). In the
initial soil, available Cu was 4.11 ppm at 0–15 cm and 3.80 ppm at 16–30
cm. After 7 years, there was a tendency to increase available Cu by 4.55
ppm at 0–15 cm in the control plot (T1), where no fertilizer was added, but
the difference was identical.
Available Manganese
The available manganese (Mn) in soil resulting from the different fertilizer-
management practices ranged from 48 ppm (T1) to 114 ppm (T4d) at 0–15
cm and 27 ppm (T1) to 48 ppm (T2c/T5) at 16–30 cm. After 7 years, in the
Nutrient Management for Rice 607
Dow
nloa
ded
by [
Uni
vers
ity o
f N
ew M
exic
o] a
t 10:
49 2
7 N
ovem
ber
2014

control plot (T1), where no fertilizer was added, a significantly decreased
amount of available Mn was in both layers (Table 14). T2a, where fertilizer
was applied according to the BARC guidelines, appeared to have a signifi-
cantly positive accumulation of available Mn to 77 ppm. Incorporation of
dhaincha GM into it (i.e., T2b) significantly decreased available Mn to 63
ppm. The reduction of P, K, and S fertilizer application by 50% and 100%
from treatment T2b did not reduce the amount of available Mn. The application
of STB fertilizer (T3a) slightly increased available Mn to 86 ppm, and the
addition of dhaincha GM along with it further increased available Mn to 93
ppm, but the difference was identical. The addition of CD along with STB
(T4a) slightly increased available Mn to 92 ppm. The significantly highest
amount of available Mn (114 ppm) was obtained with the treatment T4d,
followed by T4c, where CD was applied along with STB dose in Boro
season and dhaincha GM was incorporated with the reduced doses of P, K,
and S fertilizers in T. Aman season, probably due to accumulated higher
amount of organic C (i.e., organic matter) (Table 14).
CONCLUSIONS
Plant height, panicle production, and grain and straw yields significantly
increased because of the application of different combinations of inorganic
and organic fertilizer including GM (dhaincha). Application of CD at a rate
of 5 t ha21 (oven-dry basis) along with chemical fertilizer (STB dose) in
Boro season, followed by GM with dhaincha (in Kharif-I season), and then
growing T. Aman (in Kharif-II season) with reduced doses of chemical ferti-
lizer (60% N, 50% P, 50% K, and 50% S) in a long-term experiment substan-
tially increased rice production. This fertilizer-management system should be
encouraged for sustainable crop production.
Considerable P and S balances in soils, which were the equivalent amount
of the yearly P and S uptake by crops, in the Boro–GM–T. Aman cropping
sequence, may be achieved by successfully substituting CD and dhaincha
incorporation (in long term use) for 50% of chemical P and S fertilizer.
The application of CD and dhaincha GM along with chemical fertilizers
not only increased organic C, total N, available P, and available S but also
increased exchangeable K, available Zn, available Fe, and available Mn
in soil.
Dhaincha GM with the combination of chemical fertilizer helps to
mobilize soil-available P by 3–6 ppm.
REFERENCES
Ali, M. (1993) An economic evaluation of green manure use in the rice based farmingsystem Terminal Report. Social Sciences Division, IRRI: Los Banos, Laguna,Philippines.
P. K. Saha et al.608
Dow
nloa
ded
by [
Uni
vers
ity o
f N
ew M
exic
o] a
t 10:
49 2
7 N
ovem
ber
2014
Ali, M.M., Shaheed, S.M., and Kubota, D. (1997) Soil degradation during the period
1967–1995 in Bangladesh. II. Selected chemical characters. Soil Sci. Plant Nutr.,
43: 879–890.
Anonymous (1987) Fertilizer Recommendation Guide. Farmgate, Dhaka, Bangladesh:
BARC.
Anonymous (1996) Annual Report for 1996 Gazipur, Bangladesh: Bangladesh Rice
Research Institute.
Anonymous (1997) Fertilizer Recommendation Guide, 1997. BARC: Farmgate,
Dhaka, Bangladesh.
Beri, V., Meelu, O.P., and Khind, C.S. (1989) Studies on Sesbania aculeate pers, as
green manure for N accumulation and substitution of fertilizer N in wet land rice.
Trop. Agric., 66 (3): 209–212.
Bhuiyan, N.I. (1991) Issues concerning declining/stagnating productivity in Bangla-
desh agriculture. In The National Workshop on Risk Management in Bangladesh
Agriculture. BARC: Dhaka, Bangladesh.
Bhuiyan, N.I. (1992) Intensive cropping and soil nutrient balance in Bangladesh. In
Proceedings of Inter Congress Commission IV International Society of Soil
Science, Dhaka, Bangladesh.
Bhuiyan, N.I. (1995) Long-term soil fertility management in rice-wheat system.
Bremner, J.M. (1960) Determination of nitrogen in soil by the Kjeldahl method.
J. Agric. Sci., 55: 11–33.
Cassman, K.G., De Datta, S.K., Olk, D.C., Alcantra, J., Samson, M., Descalsota, J., and
Dizon, M. (1995) Yield decline and the nitrogen economy of long-term experiment
on continuous, irrigated rice systems in the tropics. In Soil Management: Experimen-
tal Basis for Sustainability and Environmental Quality; Lal, R. and Stewart, B.A.
(eds.), Lewis Publishers: London, U. K, 181–222.
Day, P.R. (1965) Particle fractionation and particle size analysis. In Methods of Soil
Analysis; Black, C.A. (ed.), ASA: Madison, Wisc.
Dobermann, A., Cassman, K.G., Mamaril, C.P., and Sheehy, J.E. (1998) Management
of phosphorus, potassium, and sulfur in intensive, irrigated lowland rice. Field Crops
Res., 56: 113–138.
Dobermann, A., Cassman, K.G., Sta.Cruz., P.C., Adviento, M.A.A., and
Pampolino, M.F. (1996) Fertilizer inputs, nutrient balance, and soil nutrient-
supplying power in intensive, irrigated rice systems,: III. Phosphorus. Nutrient
Cycl. Agroecosyst. 46: 111–125.
Dobermann, A., Sta.Cruz., P.C., and Cassman, K.G. (1996) Fertilizer inputs, nutrient
balance, and soil nutrient-supplying power in intensive, irrigated rice systems:
I. Potassium uptake and K balance. Nutrient Cycl. Agroecosyst, 46: 1–10.
Farid, A.T.M., Ahmed, J.U., Anwar, M.N., and Islam, M.S. (1994Integrated Fertilizer
management in rice-wheat cropping system. Bangladesh J. Agril. Res., 19 (1):
60–65.
Huang, J.N., Li, J.P., and Xie, S. (1990) A study of nutrient balance in different
cropping systems on a lateritic red soil. J. South China Agric. Univ., 13: 7–14.
Hunter, A.H. (1984) Soil Fertility Analytical Services in Bangladesh; BARC/IADS.Jackson, M.L. (1962) Soil Chemical Analysis); Prentice Hall: Englewood Cliffs, N.J.
Jenny, A.B. and Kleter, H.J. (1965) Some effect of associated growth on grass and
clover under field conditions. Netherland J. Agric. Sci., 13: 280–310.
Kader, M.A., Khan, M.A.H., Hasan, M.A., and Khondker, S. (2000) Effects of jute-
Sesbania association on growth and yield of jute and soil properties. Bangladesh
J. Agric. Sci., 27 (1): 77–81.
Nutrient Management for Rice 609
Dow
nloa
ded
by [
Uni
vers
ity o
f N
ew M
exic
o] a
t 10:
49 2
7 N
ovem
ber
2014

Karim, Z., Miah, M.M.U., and Razia, S. (1994) Fertilizer in the national economy andsustainable environmental development. Asia Pacific J. Environ. Dev., 1: 48–67.
Matsushima, S. (1964) Nitrogen requirements at different stages of growth. In TheMinerals Nutrition of the Rice Plant; John Hopkins University Press: Baltimore,MD, 199–218.
Mohanty, S.K. and Mandal, L.N. (1989) Transformation and budgeting of N, P, and Kin soils for rice cultivation. Oryza, 26: 213–231.
Mohapatra, A.R., Misra, A.K., and Sarkunan, V. (1993) Absorption pattern ofsecondary nutrients and micronutrients by high-yielding rice (Oryza sativa)varieties. Indian J. Agric. Sci., 63: 586–588.
Portch, S. and Islam, M.S. (1984) Nutrient status of some of the more important agri-cultural soils of Bangladesh. Proceedings of the Inter Congress Meeting of Commis-sion IV on Soil Test Response Correlation Studies, BARC: Dhaka, Bangladesh,97–107.
Prasad, B.L. (1993) Effect of continuous application of potassium on crop yields andpotassium availability under different cropping sequences in calcareous soil.J. Potassium Res., 9: 48–54.
Pratt, P.F. (1965) Potassium. In Methods of Soil Analysis. Black, C.A. (ed.), ASA:Madison, Wisc., USA.
Rao, D.L.N. and Gill, H.S. (1995) Biomass and biofertilizer production by Sesbaniacannabina in alkaline soil. Bioresource Technology, 53 (2): 169–172.
Saha, P.K. (1985) Rice Soils in the Lower Part of the Danube and Their ReclamationPh. D. Thesis. Odessa State University: Odessa, USSR.
Saha, P.K., Saleque, M.A., Bhuiyan, N.I., and Panaullah, G.M. (1998) Integrated fer-tilizer management for rice–wheat cropping system in Old Himalayan PiedmontPlain. Progressive Agriculture, 9 (1–2): 163–167.
Saha, P.K., Islam, R., Miah, M.A.M., and Bhuiyan, N.I. (2003) Integrated nutrientmanagement for rice production in Old Meghna estuarine floodplain. BangladeshJ. Agric. Res., 28 (4): 521–531.
Saha, P.K., Hossain, A.T.M.S., Naher, U.A., and Saleque, M.A. (2004) Nutrient com-position of some manure and crop residues. Bangladesh J. Agric. Res., 29 (1):165–168.
Tiwari, K.N. (1985) Changes in potassium status of alluvial soils under intensivecropping. Fert. News, 30 (9): 17–24.
Walkley, A. and Black, C.A. (1965) Organic carbon. In Methods of Soil Analysis;Black, C.A. (ed.), Agronomy 9, Part 2 American Society of Agronomy: Madison,Wisc., USA, 1367–1378.
Watanabe, F.S. and Olsen, S.R. (1965) Test of an ascorbic acid method for determiningphosphorus in water and NaHCO3 extracts from soil. Soil Sci. Soc. Am. Proc., 29:677–678.
Yoshida, S., Douglas, A.F., Cock, J.H., and Gomez, K.A. (1976) Laboratory Manualfor Physiological Studies of Rice; IRRI: Las Banos, Layuna, Philippines, 14–18,27–34.
Yoshida, S. (1981) Fundamentals of Rice Crop Science. International Rice ResearchInstitute: Manila, Philippines.
P. K. Saha et al.610
Dow
nloa
ded
by [
Uni
vers
ity o
f N
ew M
exic
o] a
t 10:
49 2
7 N
ovem
ber
2014


