Download - Lipid composition of oats (Avena sativa L.)
Lipid Composition of Oats (Avena sativa L.) 1 M.R. SAHASRABUDHE, Food Research Institute, Agriculture Canada, Ottawa, Ontario. KIA 0C6
ABSTRACT
Compositions of lipids extracted from a sample of Hinoat oat by seven solvent systems and that ex- tracted with chloroform/methanol (2:1 v/v) from six selected cultivars representing high and low lipid contents are reported. Lipid components (steryl esters, triglycerides, partial glycerides, free fatty acids, glycolipids and phospholipids) were separated by silicic acid column chromatography and thin layer chromatography and quanti tated by GLC analysis of fat ty acids and phosphorus determinations. Twelve oat cultivars were examined for the fat ty acid com- position of lipid extracted with n-hexane. Lipids ex- tracted from Hinoat by different solvent systems ranged from 5.6 to 8.8%. Quantitative distribution of lipid components extracted with chloroform/ methanol from six cultivars containing 4.6 to 11.6% lipid showed a significant correlation (3' = 0.99) be- tween the total lipid and the neutral lipid content. Phospholipid content was similar in all cultivars, but glycolipids showed a two-fold increase in high lipid oats. Triglycerides contained less palmitic and more oleic acid than the glycolipids or phospholipids. Nine glycolipids and 11 phospholipids have been identi- fied, and the polar lipid composition of Hinoat oat is presented.
INTRODUCTION
In recent years oats (Avena sativa L.) have shown a potential as a source of edible oil. A number of surveys report a wide range (2-12%) of oil in oats (1-5). It has also been indicated that oil contents are under genetic control, suggesting that the oil content might be increased (6,7). Kalbasi-Ashtari and Hammond (8) showed that oat oil was comparable to soybean oil in stability; however, the degumming and refining losses from oat oil were high be- cause of the higher precentages of components other than triglycerides in the crude oil and the occurrence of free
1Cont r ibu t ion No. 368 f r o m the Food Research Ins t i tu te ,Agr i - cu l ture Canada , Ot tawa .
fat ty acids (FFA). Available information on lipid compo- nents of oat is not complete. Aylward and Showier (9) isolated the glyceride fraction and two phosphatide frac- tions. Price and Parsons (10) identfied some polar lipids by thin layer chromatography (TLC). Youngs et al. (11) reported the distribution of several lipid components in oat groat fractions of two cultivars. In a study with nine strains of oats, de la Roche et al. (5) showed that high lipid oats contain a greater proport ion of triglycerides and a lower proport ion of phospholipids than the low lipid oats.
This investigation was undertaken to further elucidate the composit ion of oat lipids and reports: (a) a column chromatographic procedure for the separation of lipid classes; (b) the composit ion of oat lipid extracted by different solvent systems; and (c) the composition of lipid extracted with chloroform/methanol (2:1) and from six selected cultivars of oat.
EXPERIMENTAL PROCEDURES
Materials and Their Preparation
Twelve oat cultivars (Table I) grown at the Central Experimental Farm, Agriculture Canada, Ottawa were used in this study. Samples of oat were dehulled immediately following harvest and the groates stored at -20 C. One hundred g (fresh weight) samples of groats were ground in a laboratory coffee grinder (Braun No. 4024) and analysed in duplicate for moisture, lipid extracted by n-hexane and protein by nitrogen determination in the defatted residue (12).
Extraction of Lipids
Required samples were ground as described above and extracted separately with solvents as follows. (A.) Soxhlet extraction: 40 to 50 g samples (fresh weight) were extracted for 16 hr separately with n-hexane, n-hexane- diethyl ether (80:20 v/v), 85% aqueous methanol or chloro- form-methanol (2:1 v/v). (B.) Fi f ty g samples (fresh weight) were extracted separately with other solvents as follows: three times with water-saturated butanol (WSB), (1:5 sample wt/solvent vol.), for 1 hr with vigorous agitation at
T A B L E I
Moisture , Protein, Lipid and Fa t ty Acid Co mp o s i t i o n o f 12 Strains o f Oa ts
No. Strain Moisutre Protein a Lipid b Fa t ty acids %
% % % 14:0 16:0 18:0 18:1 18:2 18:3 o the r c
1 2 3 4 5 6 7 8 9
10 11 12
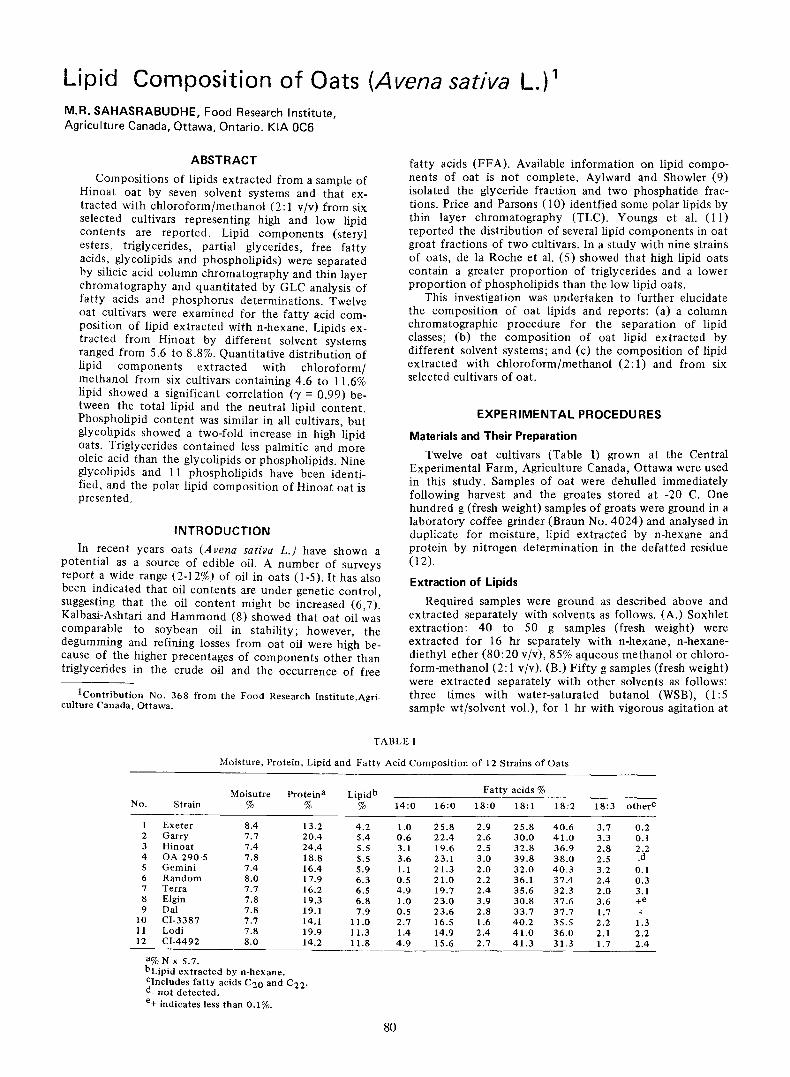
Exe te r 8.4 13.2 4.2 1.0 25 .8 2.9 25 .8 40 .6 3.'7 0.2 Gar ry 7.7 20.4 5.4 0.6 22.4 2.6 30.0 41 .0 3.3 0.1 H inoa t 7.4 24.4 5.5 3.1 19.6 2.5 32.8 36.9 2.8 2.2 OA-290-5 7.8 18.8 5.5 3.6 23.1 3.0 39.8 38.0 2.5 _d G e m i n i 7.4 16.4 5.9 1.1 21.3 2.0 32 .0 40 .3 3.2 0.1 R a n d o m 8.0 17.9 6.3 0.5 21.0 2.2 36.1 37.4 2.4 0.3 Terra 7.7 16.2 6.5 4.9 19.7 2.4 35.6 32.3 2.0 3.1 Elgin 7.8 19.3 6.8 1.0 23.0 3.9 30.8 37.6 3.6 +e Dal 7.8 19.1 7.9 0.5 23 .6 2.8 33.7 37.7 1.7 + CI-3387 7.7 14.1 11.0 2.'7 16.5 1.6 40 .2 35.5 2.2 1.3 Lodi 7.8 19.9 11.3 1.4 14.9 2.4 41 .0 36.0 2.1 2.2 CI-4492 8.0 14.2 11.8 4.9 15.6 2.7 41 .3 31.3 1.7 2.4
a % N x 5.7. bLipid extracted by n-hexane . Clncludes f a t t y acids C20 and C22. d_ no t de t e c t e d . e+ indicates less than 0.1%.
80
FEBRUARY, 1979 S A H A S R A B U D H E : O A T L I P I D S 8 ]
room temperature; ethyl alcohol-water (80: 20) or isopropyl alcohol (1:5, sample wt/solvent vol.) under reflux. The extracts were centrigufed to remove insoluble material and evaporated to dryness on a rotary evaporator. All solvents were reagent grade and were used without further purifi- cation. The dry residues in the solvent extracts were purified by separation of the lipid in a biphasic system con- sisting of chloroform/methanol/water (2: 1:0.8), and the chloroform layer was evaporated to dryness on a rotary evaporator.
In the comparative study with six different cultivars, oat groats were ground and extracted with chloroform/ methanol (2:1 v/v) and the lipid fraction purified as de- scribed above,
Separation of Lipid Classes by Silicic Acid Column Chromatography (SCC)
A one g sample of the purified lipid was fractionated on a 29 g silicic acid column described by Sahasrubudhe et al. (13). The various lipid classes were eluted in 10.5 ml frac- tions in 170 x 25 ml tubes on a LKB fraction collector by successive development with solvents of increasing polarity. Neutral lipids were eluted with 300 ml each of benzene, benzene/diethyl ether (9:1) and diethyl ether. Polar lipids were eluted with successive application of chloroform (200 ml), chloroform containing 5% Acetone (100 ml), acetone (200 ml), acetone with 10% methyl alcohol (100 ml) and methyl alcohol (400 ml). Each fraction was evaporated under a stream of nitrogen, weighed and pooled into 8 to 12 groups representing each major peak and analysed as described below.
Thin Layer Chromatography (TLC)
The total purified lipid and the pooled fractions were separated on precoated silica gel plates (REDI-COAT-2D Supelco Inc.). The solvent systems used were as follows: I. Diethylether/benzene/ethanol/acetic acid (40:50:2:0.2); II. n-Hexane/diethyl ether (96:4); III. Chloroform/ methanol/water (65:25:4); IV. Chloroform/methanol/ ammonia (cone.) (65:35:5). The neutral lipids were developed first with solvent system I, air dried and rede- veloped in the same direction with system II. The polar lipids were separated singly and two dimensionally using systems III and IV.
Lipids were detected on TLC plates by iodine absorp- tion, by charring with 50% sulfuric acid or by spraying with specific spray reagents (14). Phosphorus was deter- mined by the method of Morrison (15). Identities of gly- colipids were established with Rf values and specific spray reagents (a-napthol).
Gas Liquid Chromatography (G LC)
Fatty acid methyl esters were analysed on a Hewiett- Packard model 5750 gas chromatograph equipped with dual flame ionization detectors and a Hewlett-Packard model 3373B integrator. The columns were 6 ft x 1/8" stainless steel packed with 10% SP22PSP polyester on 100:200 mesh support (Supelco Inc., Bellefonte,Pa.)and operated at 200 C under a nitrogen flow rate of 18 ml/min.
Each major fraction and subfraction under individual peaks obtained from SCC was further analysed by TLC and GLC. In fraction "B," FFA were separated from mono- and di-glycerides and free sterols by TLC before analysis by GLC. Quantitative estimation of polar lipids was achieved by the analysis of fatty acids and of phosphorus in the total fraction as well as in material scraped from TLC plates developed in a single direction. Two dimensional TLC with solvent systems III and IV was used for separation and identification of polar lipids.
16o-
80;
70-
60
A
40
HN
B
F G
20 4O 6~ 80 100 120 140 160 180
TUeE NUMSERS
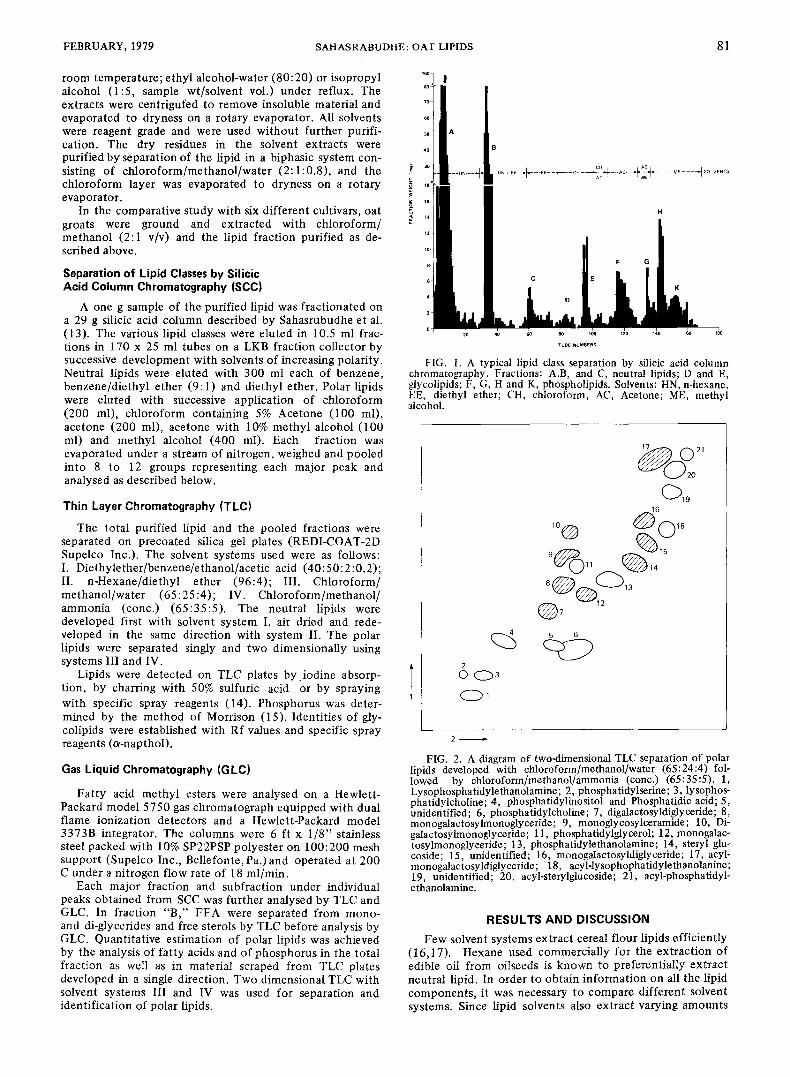
FIG. l. A typical lipid class separation by silicic acid column chromatography. Fractions: A,B, and C, neutral lipids; D and E, ~ycolipids; F, G, H and K, phospholipids. Solvents: HN, n-hexane, EE, diethyl ether; CH, chloroform, AC, Acetone; ME, methyl alcohol.
2 0 C33 CZ~,
(~)20 (~319
10@ ~6~18
%15 9 ( ~ 11 ~14
5 6
FIG. 2. A diagram of two-dimensional TLC separation of polar lipids developed with chloroform/methanol/water (65:24:4)fol- lowed by chloroform/methanol/ammonia (cone.) (65:35:5). 1, Lysophosphatidylethanolamine; 2, phosphatidylserine; 3, lysophos- phatidylcholine; 4, phosphatidylinositol and Phosphatidic acid; 5, unidentified; 6, phosphatidylcholine; 7, digalactosyldiglyceride; 8, monogalactosylmonoglyceride; 9, monoglycosylceramide; 10, Di- galactosylmonoglyceride; 11, phosphatidylglycerol; 12, monogalac- tosylmonoglyeeride; 13, phosphatidytethanolamine; 14, steryl glu- coside; 15, unidentified; 16, monogalactosyldiglyceride; 17, acyl- monogalactosyldiglyceride; 18, acyl-lysophophatidylethanolanine; 19, unidentified; 20, acyl-sterylglucoside; 21, acyl-phosphatidyl- ethanolamine.
RESULTS AND DISCUSSION Few solvent systems extract cereal flour lipids efficiently
(16,17). Hexane used commercially for the extraction of edible oil from oitseeds is known to preferentially extract neutral lipid. In order to obtain information on all the lipid components, it was necessary to compare different solvent systems. Since lipid solvents also extract varying amounts
82 JOURNAL OF THE AMERICAN OIL CHEMISTS' SOCIETY VOL. 56
TABLE II
Polar Lipid Composition of Hinoat Oat
Glycolipids
Monogalactosylmonoglyceride 6.2 Monogatactosyldigly cerid e 18.5 Digalact osylmonogly cerides 4.8 Digalact osyldiglyceride 41.5 Sterylglucoside 7.0 Others 22.0
100.0
Phospholipids
Phosphatidylcholine 29,9 Phosphatidic acid Phosphatidylinosit ol 3.9 Phosphatidylglycerol 9.5 Phosphatidylethanolamine 14,8 Phosphatidylserine 3.2
Lysophosphatidyleth anolamine Lysophosphatidylserine 20.4 Lysophosphatidylcholine
Others 19,0 100.0
of nonlipid impurities, all extracts were purified by sepa- ration in a biphasic system consisting of chloroform/ methanol/water (2:1:0.8). Initially 12 oat cultivars were extracted with hexane to obtain the variation in the lipid content. Six cultivars were selected on the basis of varia- tions in lipid and protein contents for a detailed study. Chloroform/methanol (2:1) was chosen as the solvent system because it extracted a major portion of all lipid classes and also because of the ease of Soxhlet extraction procedure.
Figure 1 shows a typical separation of lipid classes by SCC. TG were completely eluted in fraction A (Tube No.s 1-30). Separation of sterol esters was not always clear cut, but sterol esters appeared in the first three tubes and were analyzed separately. Partial glycerides (MDG) and FFA appeared in fraction "B" (Tube No.s 31-54); free sterols and an unknown glycolipid eluted in fraction "C" (Tube No. s 55-75); the major glycolipids (GL) including steryl glucosides (SG) appeared in fraction " D " and " E " (Tube No. s 76-95; 96-115). Phosphotipids (PL) eluted in four major fractions F, G, H and K.
Glycolipids eluted in two distinct fractions showing a clear separation from the PL. The major glycolipids were
monogalactosyldiglyceride (MGDG) and digalactosyldi- glyceride (DGDG). Fraction designated MGDG showed 74% fatty acid; similarly DGDG had 45% and digalactosylmono- gtyceride (DGMG) 30% fatty acids comparable to theori- tical values.
Although there was some overlapping, phosphatidyl- ethanolamine (PE) and phosphatidylserine (PS) appeared in " F " (Tube No. s 116-131); phosphatidylglycerol (PA), phosphatidylinositol (PI) and phosphatidic acid (PA) appeared in " G " (Tube No.S 13 2-140); phosphatidylcholine (PC) eluted in " H " (Tube No. s 141-i48) and lysophospha- tidylethanolamine and lysophosphatidylcholine appeared in " K " (Tube No. s 149-165).
Figure 2 is a composite schematic diagram of polar lipids separated by two dimensional TLC. The diagram was pre- pared by superimposing spots from all fractions of polar lipids. Shaded spots represent glycolipids. All cultivars examined gave similar polar lipid patterns. The unknown lipid etuted with neutral lipid in fraction "C'" gave a posi- tive a-napthol test indicating it to be a glycolipid, The fatty acid content determined by GLC was found to be 74%. A similar component has been shown to be present in wheat flours by MacMurray and Morrison (16), which they demonstrated to be an esterified monogalactosyldiglyceride (AMGDG).
Among the 21 polar lipid spots separated by TLC, l0 were glycolipids and 11 phospholipids of which 9 glyco- lipids and all phospholipids have been identified (Fig. 2). Phosphatdylinositol and phosphatidic acid appeared to- gether in spot No.4. Monogalactosylmonoglycerides appeared in two separate spots (No. s 8 and 12), presumably containing different fatty acids which were not confirmed. Polar lipid composition of Hinoat oat (Table II) was ob- tained by combining the data from SCC, TLC, GLC and phosphorus determinations. The major GL in Hinoat were DGDG and MGDG, making up 60% of the total GL. Nine PL account for 81% of the total. Others include N-acyl deri- vatives which were not estimated.
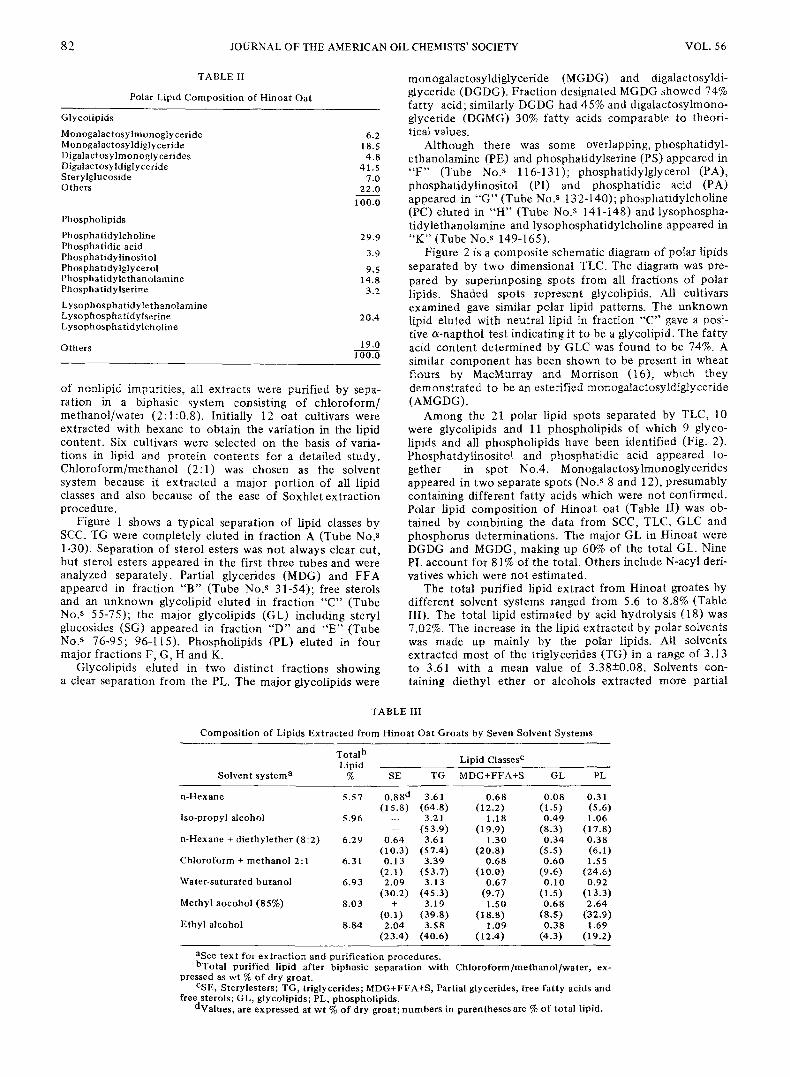
The total purified lipid extract from Hinoat groates by different solvent systems ranged from 5.6 to 8.8% (Table III). The total lipid estimated by acid hydrolysis (18) was 7.02%. The increase in the lipid extracted by polar solvents was made up mainly by the polar lipids. All solvents extracted most of the triglycerides (TG) in a range of 3.13 to 3.61 with a mean value of 3.38-+0.08. Solvents con- taining diethyl ether or alcohols extracted more partial
TABLE III
Composition of Lipids Extracted from Hinoat Oat Groats by Seven Solvent Systems
Total b Lipid Lipid Classes c
Solvent system a % SE TG MDG+FFA+S GL PL
n-Hexane 5.57 0.88 d 3.61 0.68 0.08 0.31 (15.8) (64.8) (12.2) (1.5) (5.6)
Iso-propyl alcohol 5.96 --- 3.21 1.18 0.49 1.06 -- (53.9) (19.9) (8.3) (17.8)
n-Hexane + diethylether (8:2) 6.29 0.64 3.61 1.30 0.34 0.38 (10.3) (57.4) (20.8) (5.5) (6.1)
Chloroform + methanol 2:1 6.31 0.13 3.39 0.68 0.60 1.55 (2.1) (53.7) (10.0) (9.6) (24.6)
Water-saturated butanol 6.93 2.09 3.13 0.67 0.10 0.92 (30.2) (45.3) (9.7) (1.5) (13.3)
Methyl aocohol (85%) 8.03 + 3.19 1.50 0.68 2.64 (0.1) (39.8) (18.8) (8.5) (32.9)
Ethyl alcohol 8.84 2.04 3.58 1.09 0.38 1.69 (23.4) (40.6) (12.4) (4.3) (19.2)
aSee text for extraction and purification procedures. bTotal purified lipid after biphasic separation with Chloroform/methanol/water, ex-
pressed as wt % of dry groat. CSE, Sterylesters; TG, triglycerides; MDG+FFA+S, Partial glycerides, free fatty acids and
free sterols; GL, glyeolipids; PL, phospholipids. dValues, are expressed at wt % of dry groat; numbers in parentheses are % of total lipid.
FEBRUARY, 1979 SAHASRABUDHE: OAT LIPIDS
TABLE IV
Lipid Composi t ion of Six Strains of Oat a
83
Exeter Hinoat OA-290-5 Terra Lodi CI-4492
Lipid Classes
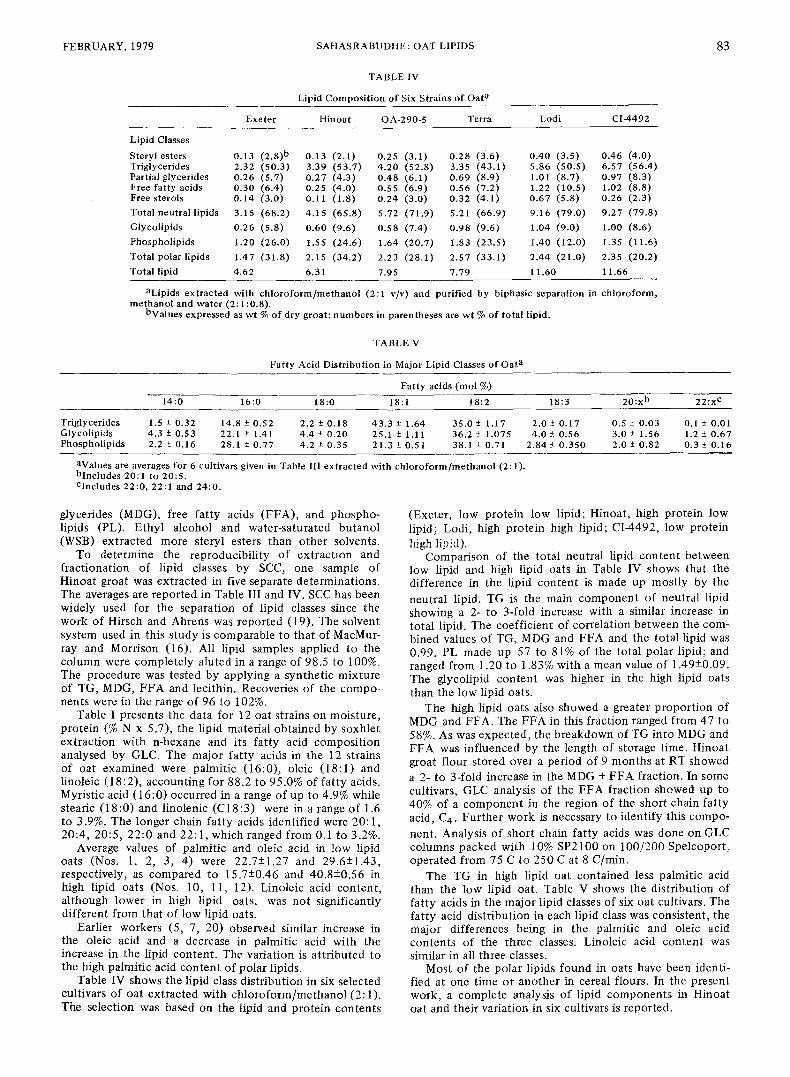
S tery les ters 0.13 (2.8) b 0.13 (2.1) 0.25 (3.1) 0.28 (3.6) 0.40 (3.5) 0.46 (4.0) Triglycerides 2.32 (50.3) 3.39 (53.7) 4.20 (52.8) 3.35 (43.1) 5,86 (50.5) 6.57 (56.4) Par t ia lglycer ides 0.26 (5.7) 0.27 (4.3) 0.48 (6.1) 0.69 (8.9) 1.01 (8.7) 0.97 (8.3) Free fatty acids 0.30 (6.4) 0.25 (4.0) 0.55 (6.9) 0.56 (7.2) 1.22 (10.5) 1.02 (8.8) Free sterols 0.14 (3.0) 0.11 (1.8) 0.24 (3.0) 0.32 (4.1) 0.67 (5.8) 0.26 (2.3)
Total neu t ra l l ip ids 3.15 (68.2) 4.15 (65.8) 5.72 (71.9) 5.21 (66.9) 9.16 (79.0) 9.27 (79.8)
Glycolipids 0.26 (5.8) 0.60 (9.6) 0.58 (7.4) 0.98 (9.6) 1.04 (9.0) 1.00 (8.6)
Phospholipids 1.20 (26.0) t .55 (24.6) 1.64 (20.7) 1.83 (23.5) 1.40 (12.0) 1.35 (11.6)
T o t a l p o l a r l i p i d s 1.47 (31.8) 2.15 (34.2) 2.23 (28.1) 2.57 (33.1) 2.44 (21.0) 2.35 (20.2)
Total lipid 4.62 6.31 7.95 7.79 11.60 11.66
aLipids extracted with chloroform/methanol (2:1 v/v) and purified by biphasic separation in chloroform, methanol and water (2:1:0.8).
bValues expressed as wt % of dry groat; numbers in parentheses are wt % of total lipid.
TABLE V
Fat ty Acid Distr ibution in Major Lipid Classes of Oat a
Fat ty acids (mol %)
14:0 16:0 18:0 18:1 18:2 18:3 20:x b 22:x c
Triglycerides 1.5 -+ 0.32 14.8 • 0.52 2.2 • 0.18 43.3 • 1.64 35.0 +- 1.17 2.0 • 0.17 0.5 -+ 0.03 0.1 • 0.01 Glycolipids 4.3 • 0.53 22.1 • 1.41 4.4 • 0.20 25.1 • 1.11 36.2 • 1.075 4 .0• 0.56 3 .0• 1.56 1.2 • 0.67 Phospholipids 2.2 • 0.16 28.1 • 0.77 4.2 • 0.35 21.3 + 0.51 38.1 • 0.71 2.84 • 0.350 2.0 • 0.82 0.3 • 0.16
aValues are averages for 6 cultivars given in Table III extracted with chloroform/methanol (2: 1). bIncludes 20:1 to 20:S. CIncludes 22:0, 22:1 and 24:0.
glycerides (MDG), free fatty acids (FFA), and phospho- lipids (PL). Ethyl alcohol and water-saturated butanol (WSB) extracted more steryl esters than other solvents.
To determine the reproducibility of extraction and fractionation of lipid classes by SCC, one sample of Hinoat groat was extracted in five separate determinations. The averages are reported in Table III and IV. SCC has been widely used for the separation of lipid classes since the work of Hirsch and Ahrens was reported (19). The solvent system used in this study is comparable to that of MacMur- ray and Morrison (16). All lipid samples applied to the column were completely aluted in a range of 98.5 to 100%. The procedure was tested by applying a synthetic mixture of TG, MDG, FFA and lecithin. Recoveries of the compo- nents were in the range of 96 to 102%.
Table I presents the data for 12 oat strains on moisture, protein (% N x 5.7), the lipid material obtained by soxhlet extraction with n-hexane and its fatty acid composition analysed by GLC. The major fatty acids in the 12 strains of oat examined were palmitic (16:0), oleic (18:1) and linoleie (18:2), accounting for 88.2 to 95.0% of fatty acids. Myristic acid (16:0) occurred in a range of up to 4.9% while stearic (18:0) and linolenic (C18:3) were in a range of 1.6 to 3.9%. The longer chain fatty acids identified were 20: 1, 20:4, 20:5, 22:0 and 22: 1, which ranged from 0.1 to 3.2%.
Average values of palmitic and oleic acid in low lipid oats (Nos. 1, 2, 3, 4) were 22.7+-I.27 and 29.6-+1.43, respectively, as compared to 15.7+-0.46 and 40.8+0.56 in high lipid oats (Nos. 10, 11, 12). Linoleic acid content, although lower in high lipid oats, was not significantly different from that of low lipid oats.
Earlier workers (5, 7, 20) observed similar increase in the oleic acid and a decrease in palmitic acid with the increase in the lipid content. The variation is attributed to the high palmitic acid content of polar lipids.
Table IV shows the lipid class distribution in six selected cultivars of oat extracted with chloroform/methanol (2: 1). The selection was based on the lipid and protein contents
(Exeter, low protein low lipid; Hinoat, high protein low lipid; Lodi, high protein high lipid; CI-4492, low protein high lipid).
Comparison of the total neutral lipid content between low lipid and high lipid oats in Table IV shows that the difference in the lipid content is made up mostly by the neutral lipid. TG is the main component of neutral lipid showing a 2- to 3-fold increase with a similar increase in total lipid. The coefficient of correlation between the com- bined values of TG, MDG and FFA and the total lipid was 0.99. PL made up 57 to 81% of the total polar lipid; and ranged from 1.20 to 1.83% with a mean value of 1.49+-0.09. The glycolipid content was higher in the high lipid oats than the low lipid oats.
The high lipid oats also showed a greater proportion of MDG and FFA. The FFA in this fraction ranged from 47 to 58%. As was expected, the breakdown of TG into MDG and FFA was influenced by the length of storage time. Hinoat groat flour stored over a period of 9 months at RT showed a 2- to 3-fold increase in the MDG + FFA fraction. In some cultivars, GLC analysis of the FFA fraction showed up to 40% of a component in the region of the short chain fatty acid, C4. Further work is necessary to identify this compo-
nent. Analysis of short chain fatty acids was done on GLC columns packed with 10% SP2100 on 100/200 Spelcoport, operated from 75 C to 250 C at 8 C/min.
The TG in high lipid oat contained less palmitic acid than the low lipid oat. Table V shows the distribution of fatty acids in the major lipid classes of six oat cultivars. The fatty acid distribution in each lipid class was consistent, the major differences being in the palmitic and oleic acid contents of the three classes. Linoleic acid content was similar in all three classes.
Most of the polar lipids found in oats have been identi- fied at one time or another in cereal flours. In the present work, a complete analysis of lipid components in Hinoat oat and their variation in six cultivars is reported.
8 4 JOURNAL OF THE AMERICAN OIL CHEMISTS' SOCIETY VOL. 56
ACKNOWLEDGMENTS
Samples of oats were kindly provided by V. Burrows, Ottawa Re- search Station; technical assistance by Z.P. Collins, M. Hammill (de- ceased) and A. Koenig. Dr. M. Kates, University of Ottawa, gave valuable suggestions.
REFERENCES
1. Hutchinson, J.B., and H.F. Martin, J. Agric. Sci. 45:411 (1955).
2. Brown, C.M., D.E. Alexander, and G.G. Cramer, Crop Sei. 6:190 (1966).
3. Brown, C.M., and J.C. Craddock, Ibid. 12:514 (1972). 4. Frey, K.J., and E.G. Hammond , JAOCS 52:358 (1975). 5. de la Roche, I.A., V.D. Burrows, and E.I.H. McKenzie, Crop
Sci. 17:145 (1977). 6. Baker, R.J., and R.I.H. McKenzie, Ibid. 12:201 ( i972) . 7. Forsberg, R.A., V.L. Youngs, and H.L. Shands, Crop Sci.
14:221 (1974). 8. Kalbasi-Ashtari, A., and E.G. Hammond , JAOCS 54:305
(1977). 9. Alyward, F., and A.J. Showier, J. Sci. Food Agric. 13:492
(1962). 10. Price, P.B., and J.G. Parsons, JAOCS 52:490 (1975). 11. Youngs, V.L., M. Piisk/ilcli, and R.R. Smith, Cereal Chem.
54:803 (1977). 12. Ward, G.M., and F.B. Johns ton , "Chemical Methods of Plant
Science," Canada Depar tment of Agriculture Publication 1064, 1962, p. 10.
13. Sahasrabudhe, M.R., J.J. Legari, and W.P. McKinley, J. Assoc. Off. Agric. Chem. 49:337 (1966).
14. Renkonen, O., and A. Luukkonen , in "Lipid Chromatographic Analysis ," Vol. I, Edited by G.V. Marinetti, Marcel Dekker Inc., New York, 1976, p. 6.
15. Morrison, W,R., Anal, Biochem. 7:218 (1964). 16. MacMurray, T.A., and W.R. Morrison, J. Sci. Food Agric.
21:520 (1970). 17. Wooton, M.J., J. Sei. Food Agric. 17:297 (1966). 18. "Official and Tentative me thods of Association of Analytical
Chemists ," 1 l t h Edition, AOAC, Washington, Method 14.019. 19. Hirsch, J., and E.H. Ahrens, Jr., J. Biol. Chem. 233:311
(1958). 20. Welch, R.W., J. Sci. Food Agric. 26:429 (1975).
[ R e c e i v e d A u g u s t 16, 1 9 7 8 ]


