801
Environmental Toxicology and Chemistry, Vol. 18, No. 4, pp. 801–810, 1999q 1999 SETAC
Printed in the USA0730-7268/99 $9.00 1 .00
LIFE-CYCLE FRAMEWORK FOR ASSESSMENT OF SITE REMEDIATION OPTIONS:CASE STUDY
CYNTHIA A. PAGE,† MIRIAM L. DIAMOND,*† MONICA CAMPBELL,‡ and STEPHEN MCKENNA§†Department of Geography, University of Toronto, Toronto, Ontario M5S 3G3, Canada
‡Toronto Public Health, North York Civic Centre, 5100 Yonge Street, North York, Ontario M2N 5V7, Canada§Community and Neighbourhood Services, Toronto Public Health, City of Toronto, 277 Victoria Street, Toronto,
Ontario M5B 1W1, Canada
(Received 1 September 1997; Accepted 16 June 1998)
Abstract—An adaptation of life-cycle assessment for contaminated site remediation activities was used to examine a lead-contam-inated site remediated by excavation and disposal. The study indicated emissions and impacts associated with energy consumption(transportation of contaminated soil to hazardous and nonhazardous sites), solid waste production (contaminated soil and sludge),land use at four sites (the contaminated site, two disposal sites, and a borrow pit for clean fill), and potential toxicity from emissionsand contaminants remaining on-site. These impacts were drawn from an inventory compiled mainly from proprietary consultants’reports, and related to impacts through several stressor–impact models; the process-related indicators of global warming potential,solid waste burden, and ecological and human toxicity potential; and site-related indicators of land use and residual human toxicityburden. Ecological and human toxicity potentials were estimated using the Mackay level III model for southern Ontario, Canada,adapted for metals. The life-cycle approach proved useful for identifying potential impacts occurring at local, regional, and globalscales, over all activities and locations affected by the remediation.
Keywords—Life-cycle inventory Life-cycle impact assessment Site remediation Contaminated sites Toxicityassessment
INTRODUCTION
Contaminated sites can present short- and long-term risksto environmental and human health. The choice of remediationapproaches to mitigate these risks depends on factors such asduration of remediation, cost, and effectiveness of the methodused for the contaminants involved. Associated with each re-mediation option, however, are inherent burdens that may alsocontribute to environmental and human health risks.
To examine the potential environmental and human healthimplications of remediation options, a life-cycle framework(LCF) has been developed by Diamond et al. [1]. The frame-work is systematic, is based on life-cycle thinking, and in-cludes two complementary approaches of differing complex-ity: a simpler, qualitative life-cycle management (LCM) anda more rigorous, quantitative life-cycle assessment (LCA) ap-proach. Diamond et al. [1] illustrated the LCM approach byapplication to six generic remediation technologies. That anal-ysis provided insight into sources of potential impacts (e.g.,life-cycle stages or activities) associated with each technologyand broadened consideration of impacts beyond the contam-inated site and time horizon of major clean-up activities. Theyalso described modifications to existing LCA methods [2–4]for application to contaminated site remediation that yield asystematic and quantitative analysis of remediation activitiesfrom cradle-to-grave.
This paper analyzes remediation activities at a contaminatedsite using the LCA-based approach. Our objective was first,to illustrate and evaluate LCA for site remediation and second,
* To whom correspondence may be addressed([email protected]).
to draw attention to impacts not usually considered when usingparticular remediation methods.
The case study considered in this paper was a parcel ofland contaminated predominantly with lead. The remediationapproach examined is known as excavation and disposal ordig and haul. A small area was also treated using the riskmanagement approach of capping. This case study was chosenbecause it uses common remediation methods and case studydata of high quality and completeness were accessible. Ex-cavation and off-site disposal is used frequently because it iscost effective, convenient, reduces the mobility of contami-nants through landfill containment, and is generally acceptableto the community surrounding the remediation site. However,this option does not reduce contaminant toxicity or volume,and dust and fugitive air emissions may be generated [5].Capping contains contaminants on-site but does not reducecontaminant volume. Investigating the case study from a life-cycle perspective provides new insights into these and otheraspects of a widely used remedial approach.
METHOD
The assessment approach used here is based on existingLCA methods [2–6] with boundaries, process descriptions,data issues, life-cycle stages, and impact assessment modifi-cations described by Diamond et al. [1]. The analysis is pre-sented according to the LCA components of initiation, inven-tory assessment, impact assessment, and interpretation [2].
Briefly, initiation involves defining the goal of the study,bounding the scope of the study, describing the remediationactivities through process flow diagrams, explaining data is-sues, and describing assumptions. Inventory assessment as-sembles data on raw materials and energy consumption, air-
802 Environ. Toxicol. Chem. 18, 1999 C.A. Page et al.
borne and waterborne emissions, and solid waste associatedwith the remediation and related activities. Impact assessmentlinks inventory items with impact indicators in order to esti-mate potential process-related and site-related impacts. Finally,interpretation analyzes the remediation activities that contrib-ute most to the environmental burden of the process(es) asestimated by the selected impact indicators. A full analysis ofthe approach and case study is contained in a report by Dia-mond et al. [6].
INITIATION
Goal definition
The two main purposes of this study were to examine asite remediation process from a life-cycle perspective, andassess and evaluate the LCA method itself. Specifically, weillustrate the application of life-cycle thinking to remediationactivities, determine the inventory associated with these ac-tivities, and link the inventory with potential impacts, with theobjective of broadening the environmental and human healthconsiderations beyond the site itself.
Boundaries and scope of study
The site, located in the greater Toronto, Ontario, Canada,area, was extensively contaminated with lead and, secondarily,with arsenic, cadmium, and polyaromatic hydrocarbons(PAHs). In addition to the contaminated soil, on-site buildingsand paving were contaminated. Most of the site was decom-missioned to residential standards; one lead-contaminated areawas capped with asphalt and access to a PAH-contaminatedsection was permanently restricted. Contaminated soil andsludge were discarded in hazardous and nonhazardous wastedisposal facilities located in southern Ontario. Clean backfillwas obtained from another location in southern Ontario. Theduration of site remediation, from the beginning of soil ex-cavation to final backfilling, was approximately 75 weeks, in-cluding a shut-down period.
The geographic boundary of the study is southern Ontario,encompassing all sites affected by clean-up activities. Tem-porally, the life cycle for this case study begins with reme-diation activities and extends over a 25-year time horizon,which is intended to capture longer term effects that couldarise from various disposal scenarios and allow for inclusionof potential impacts regardless of time dependency [1].
The scope of the study is limited to an investigation ofspecific stages of the site remediation life cycle, including siteprocessing, raw materials acquisition, waste treatment, andtransportation. We have not elaborated on post-site processingand monitoring activities because of their minor role overallnor have we included site decommissioning activities such asdecontaminating building surfaces and dismantling and de-molishing on-site building structures.
Data issues, assumptions, and peer review
For this study, the data were largely facility-specific andproprietary, coming from primary sources. The consultants’reports, in particular the final project completion report, werethe major sources of the data. Personal communications withkey individuals involved in the remediation project were an-other important source of data. Because the data are from aspecific remediation project, deviations or variations in datahave not been smoothed out. Publicly accessible data fromsecondary sources are noted as appropriate. Secondary datasources (e.g., transportation emission factors) reflect the geo-
graphic specificity of southern Ontario and the time period of1992 to 1993. The consultants’ reports and analyses were as-sumed to be complete and accurate.
An initial analysis of mass contribution [2] was conductedto determine the relevance of the various material streams. Theanalysis revealed that the system was dominated by the haz-ardous soil excavated and clean fill brought in (.35% and.47% of total mass contribution, respectively). However, themass contribution analysis alone was not used as a method fordetermining data inclusion. Rather, we investigated most as-pects of excavation and disposal because it is difficult to judgethe environmental relevance of various remediation aspects atthis formative stage. For example, special consideration of leadwas made despite its mass contribution, because of its toxicityand role as the major on-site contaminant.
As discussed by Diamond et al. [1], several alternativefunctional units exist for an analysis of site remediation ac-tivities; however, none are ideal. For this study, the data arepresented on a per site basis. Other functional units that couldbe used include land area, volume or mass of treated soil, withthe choice of functional unit largely dependent on the goal ofthe study.
The information contained within this paper has benefitedfrom extensive peer review during the process of conductingthe study. Remediation experts and consultants associated withthe case study examined the inventory data, LCA practitionersreviewed the modified LCA method, and toxicology expertscritiqued the environmental and human health toxicity assess-ment approach.
INVENTORY ASSESSMENT
Process flow diagrams
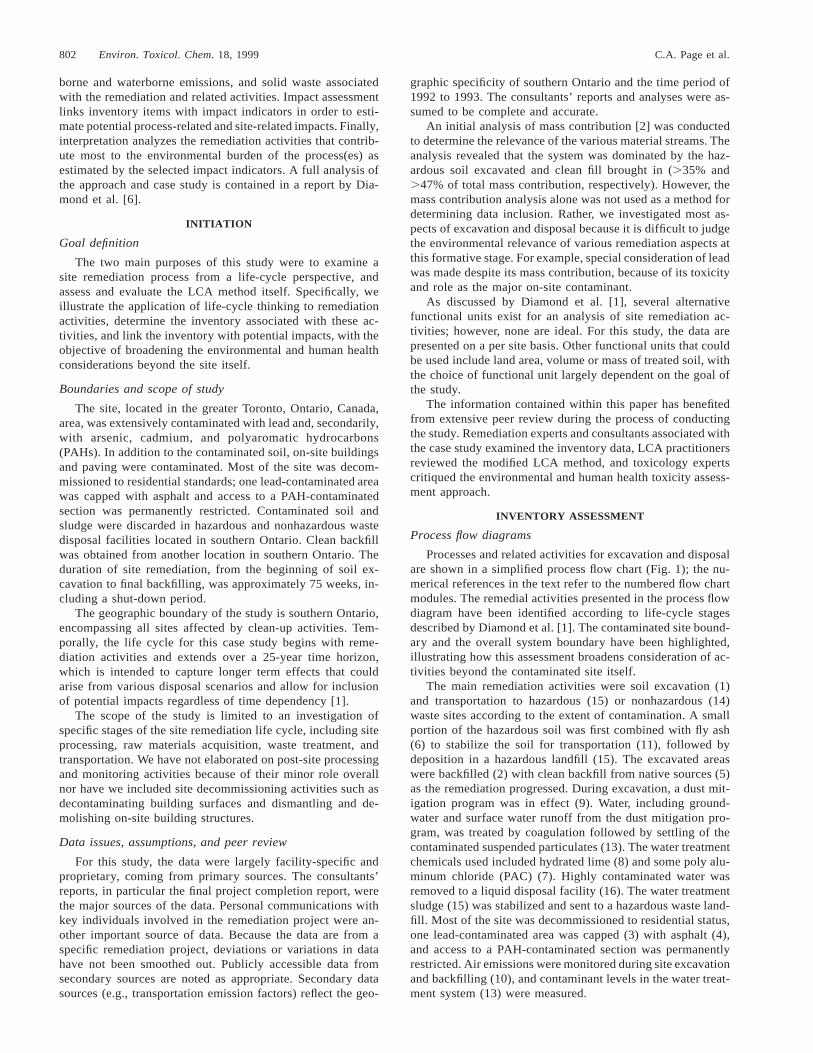
Processes and related activities for excavation and disposalare shown in a simplified process flow chart (Fig. 1); the nu-merical references in the text refer to the numbered flow chartmodules. The remedial activities presented in the process flowdiagram have been identified according to life-cycle stagesdescribed by Diamond et al. [1]. The contaminated site bound-ary and the overall system boundary have been highlighted,illustrating how this assessment broadens consideration of ac-tivities beyond the contaminated site itself.
The main remediation activities were soil excavation (1)and transportation to hazardous (15) or nonhazardous (14)waste sites according to the extent of contamination. A smallportion of the hazardous soil was first combined with fly ash(6) to stabilize the soil for transportation (11), followed bydeposition in a hazardous landfill (15). The excavated areaswere backfilled (2) with clean backfill from native sources (5)as the remediation progressed. During excavation, a dust mit-igation program was in effect (9). Water, including ground-water and surface water runoff from the dust mitigation pro-gram, was treated by coagulation followed by settling of thecontaminated suspended particulates (13). The water treatmentchemicals used included hydrated lime (8) and some poly alu-minum chloride (PAC) (7). Highly contaminated water wasremoved to a liquid disposal facility (16). The water treatmentsludge (15) was stabilized and sent to a hazardous waste land-fill. Most of the site was decommissioned to residential status,one lead-contaminated area was capped (3) with asphalt (4),and access to a PAH-contaminated section was permanentlyrestricted. Air emissions were monitored during site excavationand backfilling (10), and contaminant levels in the water treat-ment system (13) were measured.
Site remediation life-cycle framework: Case study Environ. Toxicol. Chem. 18, 1999 803
Fig. 1. Schematic of case study remediation activities.
Inventory results and discussion
Items associated with all activities included within the flowdiagram (Fig. 1) were included in the inventory with the ex-ception of the following, because of a lack of data or theirminor contribution: PAC production (7), and consequently theinputs of bauxite, chlorine, and limestone, with associatedemissions and energy consumption; emissions associated withasphalt laying are addressed qualitatively only; inputs and out-puts, including energy use associated with monitoring site ex-cavation and backfilling (10); and water treatment (12). Al-though environmental releases from land disposal facilitiesmay be included [3], emissions from hazardous and nonhaz-ardous waste landfills were not included because of a lack ofappropriate data.
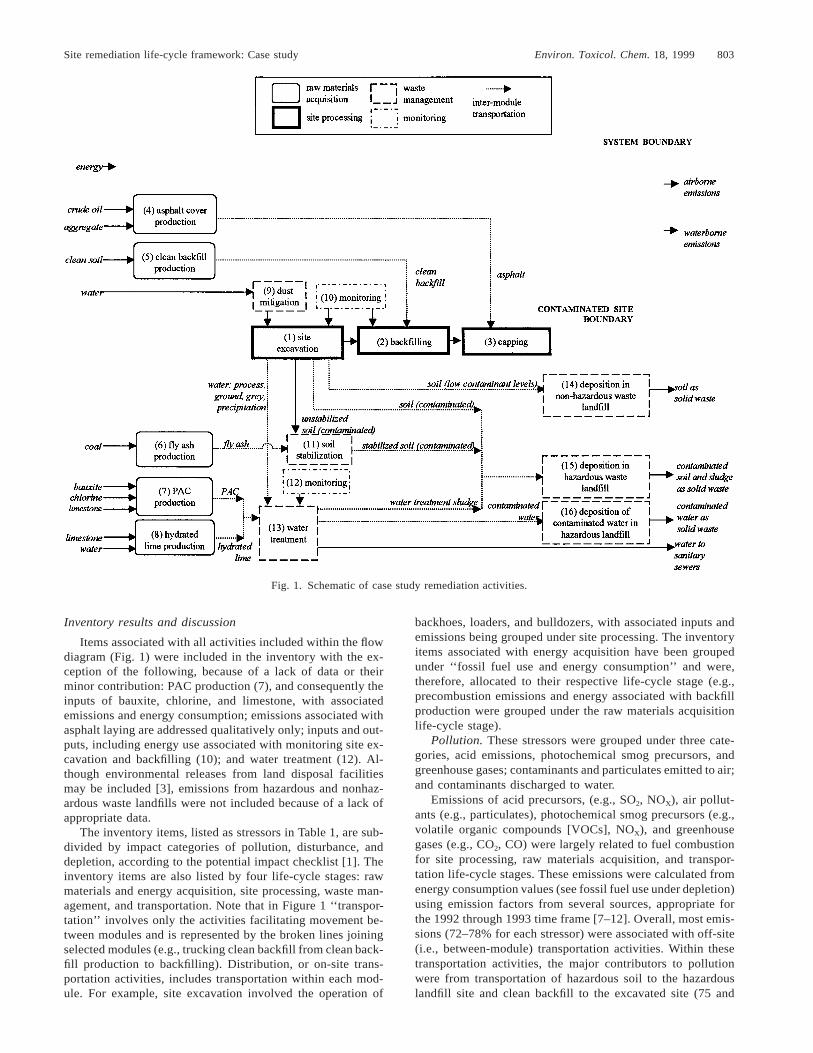
The inventory items, listed as stressors in Table 1, are sub-divided by impact categories of pollution, disturbance, anddepletion, according to the potential impact checklist [1]. Theinventory items are also listed by four life-cycle stages: rawmaterials and energy acquisition, site processing, waste man-agement, and transportation. Note that in Figure 1 ‘‘transpor-tation’’ involves only the activities facilitating movement be-tween modules and is represented by the broken lines joiningselected modules (e.g., trucking clean backfill from clean back-fill production to backfilling). Distribution, or on-site trans-portation activities, includes transportation within each mod-ule. For example, site excavation involved the operation of
backhoes, loaders, and bulldozers, with associated inputs andemissions being grouped under site processing. The inventoryitems associated with energy acquisition have been groupedunder ‘‘fossil fuel use and energy consumption’’ and were,therefore, allocated to their respective life-cycle stage (e.g.,precombustion emissions and energy associated with backfillproduction were grouped under the raw materials acquisitionlife-cycle stage).
Pollution. These stressors were grouped under three cate-gories, acid emissions, photochemical smog precursors, andgreenhouse gases; contaminants and particulates emitted to air;and contaminants discharged to water.
Emissions of acid precursors, (e.g., SO2, NOX), air pollut-ants (e.g., particulates), photochemical smog precursors (e.g.,volatile organic compounds [VOCs], NOX), and greenhousegases (e.g., CO2, CO) were largely related to fuel combustionfor site processing, raw materials acquisition, and transpor-tation life-cycle stages. These emissions were calculated fromenergy consumption values (see fossil fuel use under depletion)using emission factors from several sources, appropriate forthe 1992 through 1993 time frame [7–12]. Overall, most emis-sions (72–78% for each stressor) were associated with off-site(i.e., between-module) transportation activities. Within thesetransportation activities, the major contributors to pollutionwere from transportation of hazardous soil to the hazardouslandfill site and clean backfill to the excavated site (75 and
804 Environ. Toxicol. Chem. 18, 1999 C.A. Page et al.
Table 1. Summary of life-cycle inventory itemsa
Stressor category Stressor
Life-cycle stages
Raw materialsacquisition
Siteprocessing
Wastemanagement Transportation
PollutionAcid emissions/photochemical
smog precursorsNOx (kg)SO2 (kg)Particulates (kg)VOC (kg)
3,120800285615
2,950776276597
————
20,7005,5501,9503,900
Greenhouse gases CO2 (kg)CxHy (kg)CO (kg)NOx (kg)b
334,000270
7,2603,120
265,000240
7,0402,950
————
1,880,0001,280
50,40020,700
Contaminants/particulates to air Coarse dust (kg)Lead (kg)
——
1,4003.57
——
Contaminants in surface andgroundwater
Fluorine (kg)Silver (kg)Aluminum (kg)Arsenic (kg)Cadmium (kg)Chromium (kg)Copper (kg)Iron (kg)Lead (kg)Phosphorus (kg)Zinc (kg)BOD (kg)
————————————
————————————
4.510.05
1165.811.600.40
13.555091.1
6.1113.060.0
————————————
TSS (kg) — — 4,530 —
DisturbanceAquifer quality stressors Groundwater (kg) — — 8,000,000 —
DepletionFossil fuel use/energy
consumptionDiesel (GJ)Oil (GJ)Natural gas (GJ)Coal (GJ)Nuclear (GJ)
3,56085.411.50.8141.64
3,450————
—————
16,700————
Hydro (GJ)Precombustion (GJ)Other fuel (GJ)Coal (raw material) (kg)Crude oil (raw material) (kg)
0.357401
—300,000
26,100
—380
1.05——
—————
—1,830———
Solid waste Nonhazardous soil (kg)Hazardous soil (kg)Hazardous sludge (kg)
———
———
12,400,00050,380,000
95,000
———
Hazardous water (kg)Mineral waste (kg)Ash (kg)Inert chemicals/industrial
waste (kg)
—21520742.9
—16919236.8
108,000———
—5,3401,030
197
Drillings/cuttings (kg) 36.3 — — —Water useMineral/soil use
Water (kg)Aggregate (kg)Clean soil (kg)Limestone (kg)
195235,000
67,500,0001,080
————
3,430,000———
————
a VOC 5 volatile organic compound; TSS 5 total suspended solids; GJ 5 gigajoule.b Listed again for illustrative purposes.
20% of the transportation life-cycle stage CO2 emissions, re-spectively). Transportation of nonhazardous waste, water treat-ment sludge, and other materials contributed negligibleamounts.
Within the raw materials acquisition life-cycle stage, themajority of air emissions were related to clean backfill pro-duction (e.g., 82% of total CO2; 97% of NOX and CXHY; 100%of CO and particulates). Asphalt production, however, con-tributed 42% of methane emissions, but hydrated lime pro-duction contributed negligibly. Potential emissions from as-phalt-laying (e.g., benzene, PAHs, lead, total particulates and
particulate matter less than 10 mm diameter [PM10], CO, SO2
[13,14]) have not been quantified. For site processing, themajority (.96%) of pollution emissions were related to siteexcavation activities.
Excavation and backfilling activities contributed to partic-ulate emissions to air (e.g., coarse dust and lead associatedwith airborne particles). These emissions were measured asdustfall and total lead in dustfall, and reported on a monthlybasis over the duration of the remediation activities, includingthe shut-down period.
In the discharged wastewater, the concentrations of several
Site remediation life-cycle framework: Case study Environ. Toxicol. Chem. 18, 1999 805
contaminants were determined, for example, BOD and totalsuspended solids, aluminum, arsenic, iron, and lead. Waterfrom several sources was collected and treated together: waterfor dust mitigation (e.g., wetting the excavation site, washingtrucks), gray water (e.g., showers and laundry), rainfall, andgroundwater. It was not possible to distinguish between waterused for remediation versus decommissioning activities, withthe latter being outside the process boundary. Thus, the totalamount of contaminants discharged in the water is potentiallygreater than that associated with only excavation and disposalactivities.
Disturbance. Disturbance refers to on- and off-site disrup-tion, degradation or restriction of land, and degradation ofgroundwater quality. Off-site land quantity (e.g., related towaste disposal), and water and backfill use are discussed underdepletion. The disturbance stressor categories may be groupedinto disturbances to land through nonremediation of land orapplication of an impervious surface, and aquifer stressors. Atthe contaminated site, regions remain contaminated and a por-tion of the site was capped. Overall, 28% of the site area hascontaminants at depth and/or is paved. The major stressor tothe aquifer was associated with the removal of approximately8,000 m3 of groundwater and capping that restricts recharge.
Depletion. More than 70% of all fossil fuel and energyconsumption was associated with the transportation life-cyclestage. Of this, transporting hazardous soil consumed the great-est proportion of energy (75% of transportation energy). Foroff-site transportation (i.e., between modules), fossil fuel usewas estimated using information from transportation logs (e.g.,payload, vehicle type, and haulage route), energy consumptionfactors [8–10,15], and mode of travel considered. Most of thefossil fuel use and energy consumption for raw materials ac-quisition and site processing was associated with distribution(i.e., on-site transportation).
Throughout the project, diesel fuel was the main energytype used, followed by natural gas and electricity, with elec-tricity coming from the Ontario grid (comprised of 45% nu-clear, 32% hydro, 23% coal). Hydrated lime production usesenergy to mine the limestone and raise it to decompositiontemperature [16–18], using natural gas, transportation fuels,and electricity. Asphalt production requires energy to produceasphalt, mine mineral aggregates, and prepare asphalt–aggre-gate mixes [13,19]. The energy associated with the productionof fly ash, as discussed below, was not included in the analysis.
Fly ash and asphalt are by-products of coal combustion[20] and crude soil refining [19,21], respectively. Here, the flyash originated from a local utility, where approximately 0.073tonnes of ash is produced per tonne of coal. Because the pur-pose of coal combustion is predominantly energy production,fly ash may be considered as a waste or coproduct. The totalamount of coal used to produce fly ash was allocated on amass basis [22], which appears in Table 1 as ‘‘coal (raw ma-terial),’’ with no assigned environmental burdens (i.e., zeroallocation). Similarly, asphalt is one of many petroleum prod-ucts produced from crude oil [19] and again, allocation ofcrude oil and the fraction of energy use allotted to asphaltproduction was made on a mass basis [22].
Solid waste was produced from site excavation, where 82%of the excavated soil was considered hazardous and depositedin hazardous landfill. In addition, contaminated wastewater andwater treatment sludge were removed from the site and land-filled. Other solid wastes produced such as mineral waste, ash,
inert chemicals, drillings, and cuttings were associated withthe precombustion of fossil fuels [7,10,18].
Process water, estimated at 3,430 m3, was used for manyactivities, including dust mitigation. In addition, water wasused in the production of hydrated lime [16], although thisamount is negligible in comparison to the total amount ofprocess water used on-site.
Finally, mineral and soil use included the aggregate usedfor the asphalt cap [13], limestone used in the production ofhydrated lime [16], and clean soil taken from a borrow pit tobackfill the excavated site.
IMPACT ASSESSMENT
Life-cycle impact assessment (LCIA) is used to evaluatethe potential impacts of stressors on ecosystems, human health,and natural resources. Quantitative impact indicators are usedas surrogates of these impacts and are few [18] in comparisonto the comprehensive coverage presented in the potential im-pact checklist [1]. In this study, the impact assessment includesprocess- and site-related impacts.
Process-related potential impacts
Global warming potential and solid waste burden impactindicators. Global warming potential (GWP) is an index re-flecting the contribution of various greenhouse gas emissionsto atmospheric global warming, weighted relative to carbondioxide. For this study, radiative forcing values were derivedfrom the Intergovernmental Panel on Climate Change (IPCC)[23], with a time horizon of 100 years and expressed as a CO2-equivalent mass. The total GWP for the case study was 3.773 106 kg CO2-equivalent (i.e., on a per site basis).
Solid waste burden (SWB) is a cumulative measure of solidwastes emitted from all life-cycle stages, expressed in massunits. Although SWB does not relate directly to an impact anddoes not capture the number of sites affected, it is indicativeof land consumption for disposal, total material use, and thepotential for chemical emissions from disposal sites. Twomethods for calculating SWB have been used for this study:SWBA includes all solid wastes generated from all life-cyclestages; SWBB excludes all soils (e.g., hazardous and nonhaz-ardous soil) and sludges coming from the site itself, and in-cludes only mineral waste, ash, inert chemicals, industrialwaste, and drillings and cuttings. The SWBA is approximately63,000 tonnes, whereas SWBB is only 7.46 tonnes.
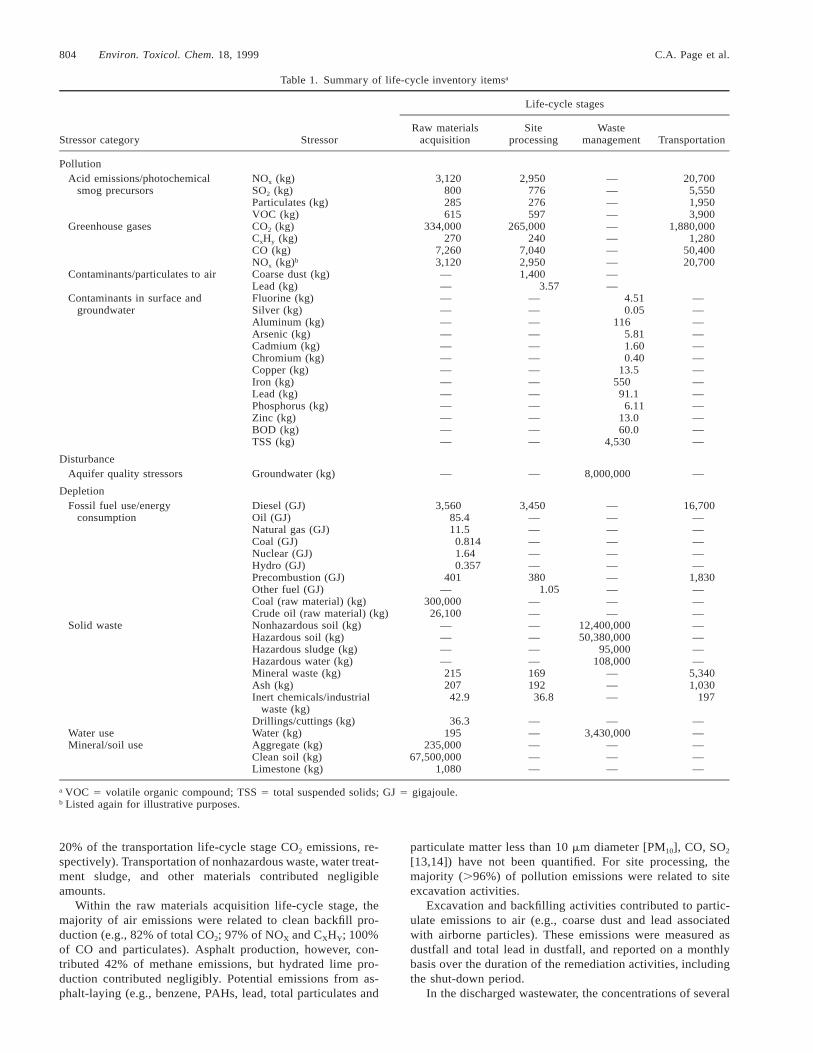
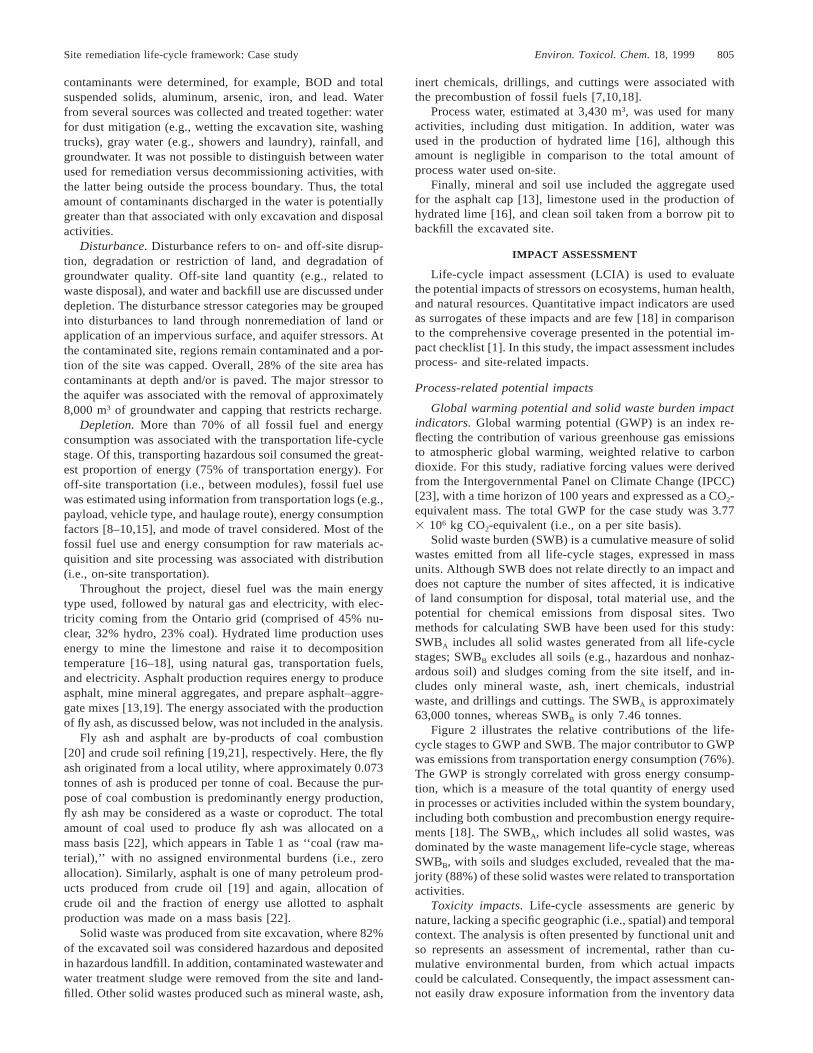
Figure 2 illustrates the relative contributions of the life-cycle stages to GWP and SWB. The major contributor to GWPwas emissions from transportation energy consumption (76%).The GWP is strongly correlated with gross energy consump-tion, which is a measure of the total quantity of energy usedin processes or activities included within the system boundary,including both combustion and precombustion energy require-ments [18]. The SWBA, which includes all solid wastes, wasdominated by the waste management life-cycle stage, whereasSWBB, with soils and sludges excluded, revealed that the ma-jority (88%) of these solid wastes were related to transportationactivities.
Toxicity impacts. Life-cycle assessments are generic bynature, lacking a specific geographic (i.e., spatial) and temporalcontext. The analysis is often presented by functional unit andso represents an assessment of incremental, rather than cu-mulative environmental burden, from which actual impactscould be calculated. Consequently, the impact assessment can-not easily draw exposure information from the inventory data
806 Environ. Toxicol. Chem. 18, 1999 C.A. Page et al.
Fig. 2. Distribution of indicators among life-cycle stages.
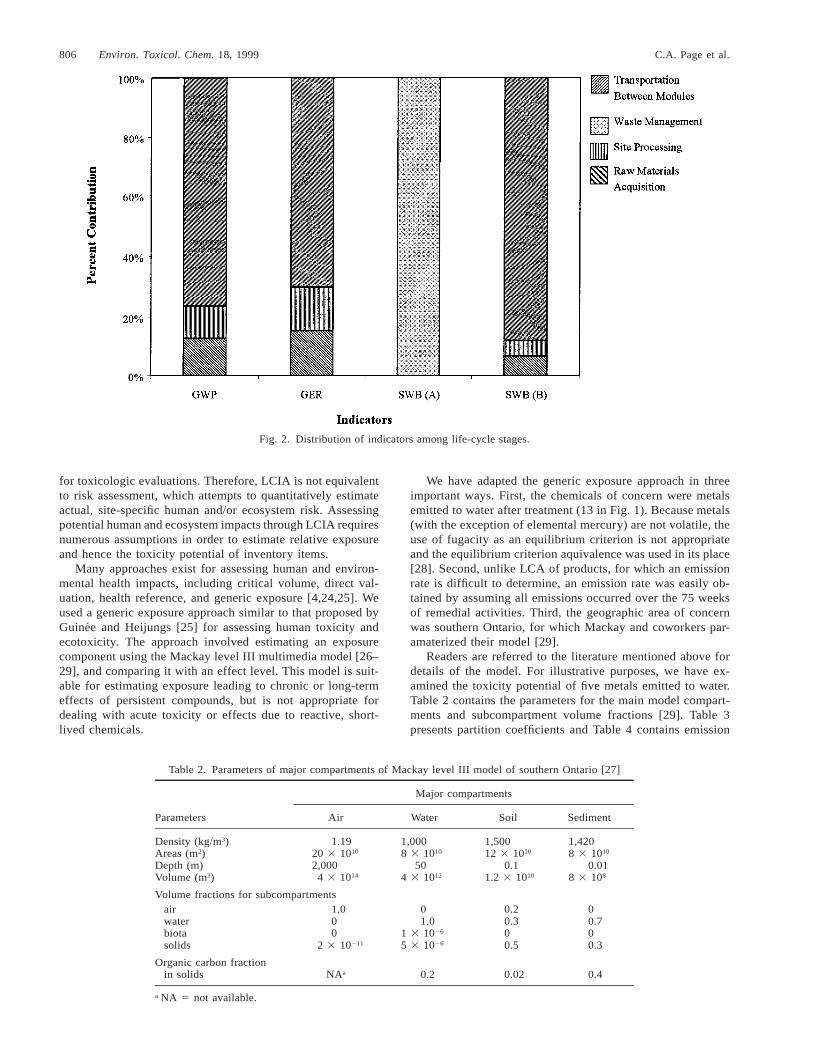
Table 2. Parameters of major compartments of Mackay level III model of southern Ontario [27]
Parameters
Major compartments
Air Water Soil Sediment
Density (kg/m3)Areas (m2)Depth (m)Volume (m3)
1.1920 3 1010
2,0004 3 1014
1,0008 3 1010
504 3 1012
1,50012 3 1010
0.11.2 3 1010
1,4208 3 1010
0.018 3 108
Volume fractions for subcompartmentsairwaterbiotasolids
1.000
2 3 10211
01.0
1 3 1026
5 3 1026
0.20.300.5
00.700.3
Organic carbon fractionin solids NAa 0.2 0.02 0.4
a NA 5 not available.
for toxicologic evaluations. Therefore, LCIA is not equivalentto risk assessment, which attempts to quantitatively estimateactual, site-specific human and/or ecosystem risk. Assessingpotential human and ecosystem impacts through LCIA requiresnumerous assumptions in order to estimate relative exposureand hence the toxicity potential of inventory items.
Many approaches exist for assessing human and environ-mental health impacts, including critical volume, direct val-uation, health reference, and generic exposure [4,24,25]. Weused a generic exposure approach similar to that proposed byGuinee and Heijungs [25] for assessing human toxicity andecotoxicity. The approach involved estimating an exposurecomponent using the Mackay level III multimedia model [26–29], and comparing it with an effect level. This model is suit-able for estimating exposure leading to chronic or long-termeffects of persistent compounds, but is not appropriate fordealing with acute toxicity or effects due to reactive, short-lived chemicals.
We have adapted the generic exposure approach in threeimportant ways. First, the chemicals of concern were metalsemitted to water after treatment (13 in Fig. 1). Because metals(with the exception of elemental mercury) are not volatile, theuse of fugacity as an equilibrium criterion is not appropriateand the equilibrium criterion aquivalence was used in its place[28]. Second, unlike LCA of products, for which an emissionrate is difficult to determine, an emission rate was easily ob-tained by assuming all emissions occurred over the 75 weeksof remedial activities. Third, the geographic area of concernwas southern Ontario, for which Mackay and coworkers par-amaterized their model [29].
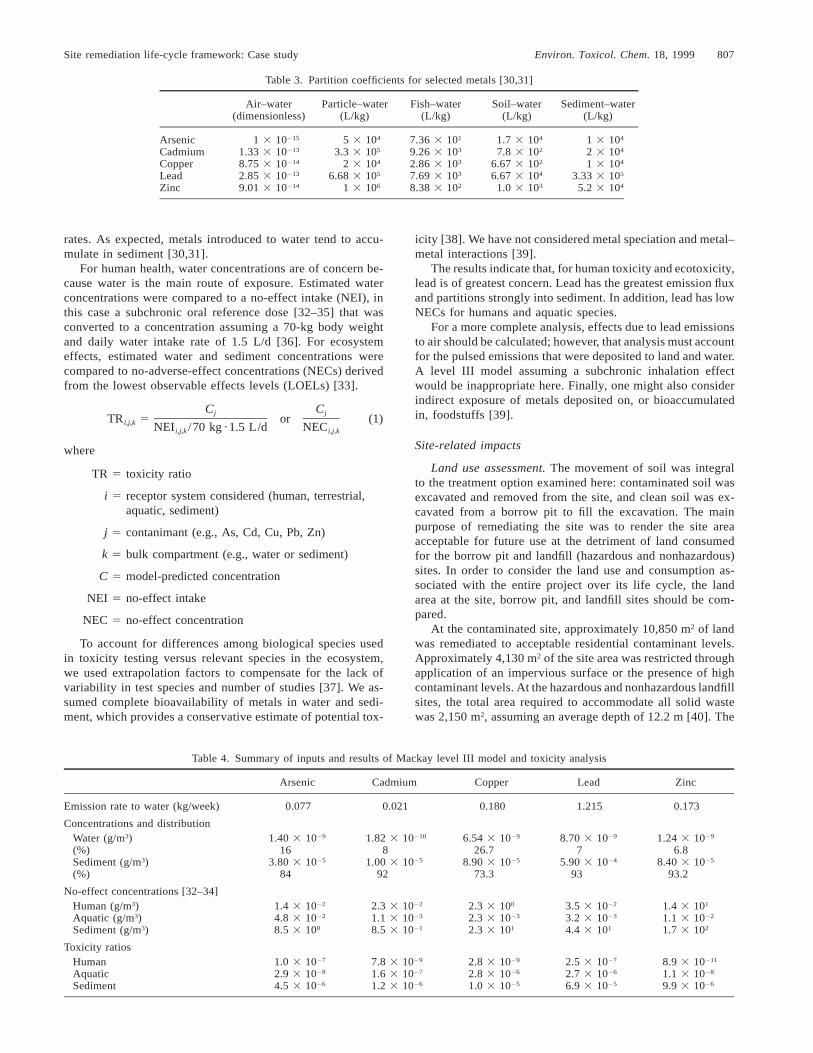
Readers are referred to the literature mentioned above fordetails of the model. For illustrative purposes, we have ex-amined the toxicity potential of five metals emitted to water.Table 2 contains the parameters for the main model compart-ments and subcompartment volume fractions [29]. Table 3presents partition coefficients and Table 4 contains emission
Site remediation life-cycle framework: Case study Environ. Toxicol. Chem. 18, 1999 807
Table 3. Partition coefficients for selected metals [30,31]
Air–water(dimensionless)
Particle–water(L/kg)
Fish–water(L/kg)
Soil–water(L/kg)
Sediment–water(L/kg)
ArsenicCadmiumCopperLeadZinc
1 3 10215
1.33 3 10213
8.75 3 10214
2.85 3 10213
9.01 3 10214
5 3 104
3.3 3 105
2 3 104
6.68 3 105
1 3 106
7.36 3 101
9.26 3 103
2.86 3 103
7.69 3 103
8.38 3 102
1.7 3 104
7.8 3 102
6.67 3 102
6.67 3 104
1.0 3 103
1 3 104
2 3 104
1 3 104
3.33 3 105
5.2 3 104
Table 4. Summary of inputs and results of Mackay level III model and toxicity analysis
Arsenic Cadmium Copper Lead Zinc
Emission rate to water (kg/week) 0.077 0.021 0.180 1.215 0.173
Concentrations and distributionWater (g/m3)(%)Sediment (g/m3)(%)
1.40 3 1029
163.80 3 1025
84
1.82 3 10210
81.00 3 1025
92
6.54 3 1029
26.78.90 3 1025
73.3
8.70 3 1029
75.90 3 1024
93
1.24 3 1029
6.88.40 3 1025
93.2
No-effect concentrations [32–34]Human (g/m3)Aquatic (g/m3)Sediment (g/m3)
1.4 3 1022
4.8 3 1022
8.5 3 100
2.3 3 1022
1.1 3 1023
8.5 3 1021
2.3 3 100
2.3 3 1023
2.3 3 101
3.5 3 1022
3.2 3 1023
4.4 3 101
1.4 3 101
1.1 3 1022
1.7 3 102
Toxicity ratiosHumanAquaticSediment
1.0 3 1027
2.9 3 1028
4.5 3 1026
7.8 3 1029
1.6 3 1027
1.2 3 1026
2.8 3 1029
2.8 3 1026
1.0 3 1025
2.5 3 1027
2.7 3 1026
6.9 3 1025
8.9 3 10211
1.1 3 1028
9.9 3 1026
rates. As expected, metals introduced to water tend to accu-mulate in sediment [30,31].
For human health, water concentrations are of concern be-cause water is the main route of exposure. Estimated waterconcentrations were compared to a no-effect intake (NEI), inthis case a subchronic oral reference dose [32–35] that wasconverted to a concentration assuming a 70-kg body weightand daily water intake rate of 1.5 L/d [36]. For ecosystemeffects, estimated water and sediment concentrations werecompared to no-adverse-effect concentrations (NECs) derivedfrom the lowest observable effects levels (LOELs) [33].
C Cj jTR 5 or (1)i,j,k NEI /70 kg · 1.5 L/d NECi,j,k i,j,k
where
TR 5 toxicity ratio
i 5 receptor system considered (human, terrestrial,aquatic, sediment)
j 5 contanimant (e.g., As, Cd, Cu, Pb, Zn)
k 5 bulk compartment (e.g., water or sediment)
C 5 model-predicted concentration
NEI 5 no-effect intake
NEC 5 no-effect concentration
To account for differences among biological species usedin toxicity testing versus relevant species in the ecosystem,we used extrapolation factors to compensate for the lack ofvariability in test species and number of studies [37]. We as-sumed complete bioavailability of metals in water and sedi-ment, which provides a conservative estimate of potential tox-
icity [38]. We have not considered metal speciation and metal–metal interactions [39].
The results indicate that, for human toxicity and ecotoxicity,lead is of greatest concern. Lead has the greatest emission fluxand partitions strongly into sediment. In addition, lead has lowNECs for humans and aquatic species.
For a more complete analysis, effects due to lead emissionsto air should be calculated; however, that analysis must accountfor the pulsed emissions that were deposited to land and water.A level III model assuming a subchronic inhalation effectwould be inappropriate here. Finally, one might also considerindirect exposure of metals deposited on, or bioaccumulatedin, foodstuffs [39].
Site-related impacts
Land use assessment. The movement of soil was integralto the treatment option examined here: contaminated soil wasexcavated and removed from the site, and clean soil was ex-cavated from a borrow pit to fill the excavation. The mainpurpose of remediating the site was to render the site areaacceptable for future use at the detriment of land consumedfor the borrow pit and landfill (hazardous and nonhazardous)sites. In order to consider the land use and consumption as-sociated with the entire project over its life cycle, the landarea at the site, borrow pit, and landfill sites should be com-pared.
At the contaminated site, approximately 10,850 m2 of landwas remediated to acceptable residential contaminant levels.Approximately 4,130 m2 of the site area was restricted throughapplication of an impervious surface or the presence of highcontaminant levels. At the hazardous and nonhazardous landfillsites, the total area required to accommodate all solid wastewas 2,150 m2, assuming an average depth of 12.2 m [40]. The
808 Environ. Toxicol. Chem. 18, 1999 C.A. Page et al.
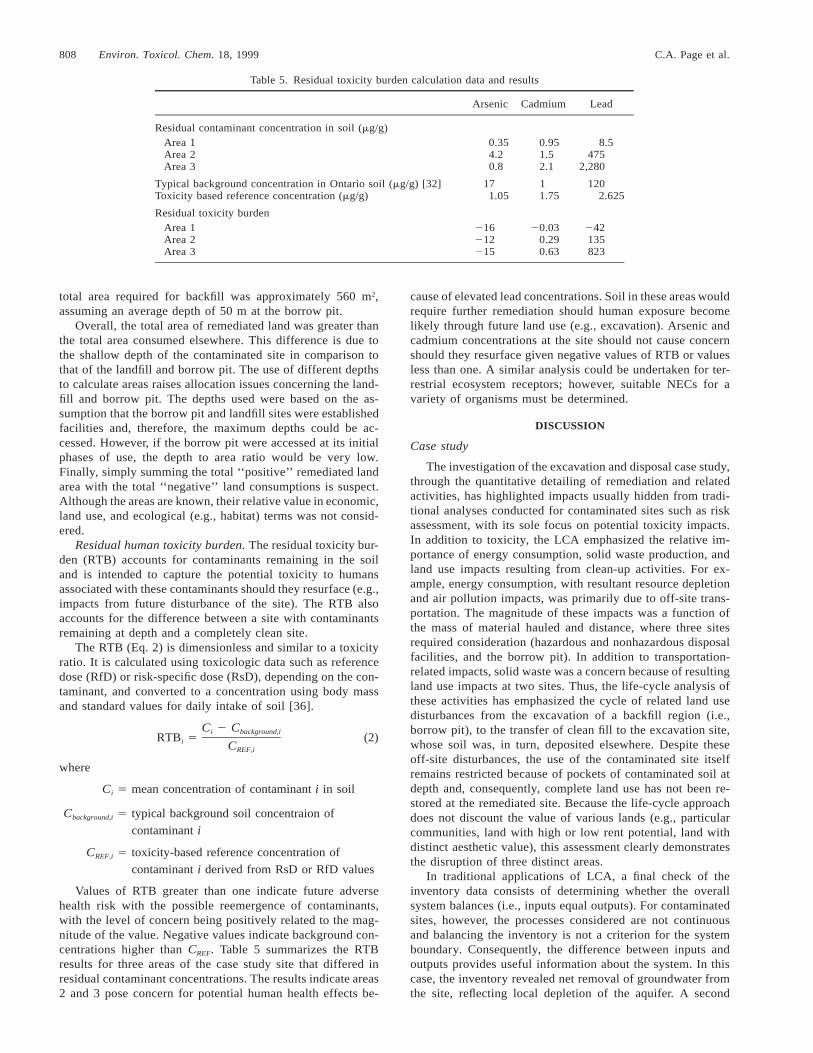
Table 5. Residual toxicity burden calculation data and results
Arsenic Cadmium Lead
Residual contaminant concentration in soil (mg/g)Area 1Area 2Area 3
0.354.20.8
0.951.52.1
8.5475
2,280
Typical background concentration in Ontario soil (mg/g) [32]Toxicity based reference concentration (mg/g)
171.05
11.75
1202.625
Residual toxicity burdenArea 1Area 2Area 3
216212215
20.030.290.63
242135823
total area required for backfill was approximately 560 m2,assuming an average depth of 50 m at the borrow pit.
Overall, the total area of remediated land was greater thanthe total area consumed elsewhere. This difference is due tothe shallow depth of the contaminated site in comparison tothat of the landfill and borrow pit. The use of different depthsto calculate areas raises allocation issues concerning the land-fill and borrow pit. The depths used were based on the as-sumption that the borrow pit and landfill sites were establishedfacilities and, therefore, the maximum depths could be ac-cessed. However, if the borrow pit were accessed at its initialphases of use, the depth to area ratio would be very low.Finally, simply summing the total ‘‘positive’’ remediated landarea with the total ‘‘negative’’ land consumptions is suspect.Although the areas are known, their relative value in economic,land use, and ecological (e.g., habitat) terms was not consid-ered.
Residual human toxicity burden. The residual toxicity bur-den (RTB) accounts for contaminants remaining in the soiland is intended to capture the potential toxicity to humansassociated with these contaminants should they resurface (e.g.,impacts from future disturbance of the site). The RTB alsoaccounts for the difference between a site with contaminantsremaining at depth and a completely clean site.
The RTB (Eq. 2) is dimensionless and similar to a toxicityratio. It is calculated using toxicologic data such as referencedose (RfD) or risk-specific dose (RsD), depending on the con-taminant, and converted to a concentration using body massand standard values for daily intake of soil [36].
C 2 Ci background,iRTB 5 (2)i CREF,i
where
C 5 mean concentration of contaminant i in soili
C 5 typical background soil concentraion ofbackground,i
contaminant i
C 5 toxicity-based reference concentration ofREF,i
contaminant i derived from RsD or RfD values
Values of RTB greater than one indicate future adversehealth risk with the possible reemergence of contaminants,with the level of concern being positively related to the mag-nitude of the value. Negative values indicate background con-centrations higher than CREF. Table 5 summarizes the RTBresults for three areas of the case study site that differed inresidual contaminant concentrations. The results indicate areas2 and 3 pose concern for potential human health effects be-
cause of elevated lead concentrations. Soil in these areas wouldrequire further remediation should human exposure becomelikely through future land use (e.g., excavation). Arsenic andcadmium concentrations at the site should not cause concernshould they resurface given negative values of RTB or valuesless than one. A similar analysis could be undertaken for ter-restrial ecosystem receptors; however, suitable NECs for avariety of organisms must be determined.
DISCUSSION
Case study
The investigation of the excavation and disposal case study,through the quantitative detailing of remediation and relatedactivities, has highlighted impacts usually hidden from tradi-tional analyses conducted for contaminated sites such as riskassessment, with its sole focus on potential toxicity impacts.In addition to toxicity, the LCA emphasized the relative im-portance of energy consumption, solid waste production, andland use impacts resulting from clean-up activities. For ex-ample, energy consumption, with resultant resource depletionand air pollution impacts, was primarily due to off-site trans-portation. The magnitude of these impacts was a function ofthe mass of material hauled and distance, where three sitesrequired consideration (hazardous and nonhazardous disposalfacilities, and the borrow pit). In addition to transportation-related impacts, solid waste was a concern because of resultingland use impacts at two sites. Thus, the life-cycle analysis ofthese activities has emphasized the cycle of related land usedisturbances from the excavation of a backfill region (i.e.,borrow pit), to the transfer of clean fill to the excavation site,whose soil was, in turn, deposited elsewhere. Despite theseoff-site disturbances, the use of the contaminated site itselfremains restricted because of pockets of contaminated soil atdepth and, consequently, complete land use has not been re-stored at the remediated site. Because the life-cycle approachdoes not discount the value of various lands (e.g., particularcommunities, land with high or low rent potential, land withdistinct aesthetic value), this assessment clearly demonstratesthe disruption of three distinct areas.
In traditional applications of LCA, a final check of theinventory data consists of determining whether the overallsystem balances (i.e., inputs equal outputs). For contaminatedsites, however, the processes considered are not continuousand balancing the inventory is not a criterion for the systemboundary. Consequently, the difference between inputs andoutputs provides useful information about the system. In thiscase, the inventory revealed net removal of groundwater fromthe site, reflecting local depletion of the aquifer. A second
Site remediation life-cycle framework: Case study Environ. Toxicol. Chem. 18, 1999 809
example is that more clean materials were used to remediatethe site than waste removed, indicating a net depletion of landand mineral resources.
Although every attempt was made at constructing a com-plete analysis, several omissions in the inventory and impactassessment may limit the final conclusions drawn from thisanalysis. For example, many of the environmental effects re-sulting from the remediation method have long-term effectsthat were not fully captured by the analysis. Although haz-ardous waste containment may require limited resources andhave few effects in the short term, these effects, and resourcesrequired to minimize the effects, occur over the long term.Similarly, disturbance at the backfill site and contaminantsremaining at the remediated site will result in long-term im-pacts. No plans were in effect for restoring the asphalt cap infuture, although this will undoubtedly be necessary in orderto minimize potential toxicity impacts. Other inventory omis-sions have been noted above, and rationalized by an analysisof mass contribution (e.g., emissions related to laying asphalt,inputs and outputs associated with monitoring site excavationand backfilling). Estimating all omitted inventory items, in-cluding a nonlinear extrapolation over the 25-year time bound-ary, was beyond the scope of this project, and remains an areafor further work. At a minimum, this exercise has resulted inthe qualitative assessment of these activities, which is an im-provement over assessment methods that do not evaluate im-pacts throughout the life cycle of an activity.
As with most LCAs, the interpretation of the inventorythrough the impact assessment was constrained by the limitednumber of stressor–impact models [18,41]. For example, fur-ther work is required to develop an indicator(s) related to landuse that imparts information on habitat alteration, the viabilityof land to support various functions, and land stagnation [1].We have addressed, but not adequately captured these impactsthrough the land use and SWB metrics. As a contribution tothe impact assessment, the categories of process- and site-related stressor impacts were developed to clarify the natureand source of impacts, along with toxicity measures suitablefor each category.
LCA method
This study has revealed several challenges in using an LCA-based approach for contaminated sites. In the initiation or scop-ing phase, determining particular activities and processes tobe included within the system boundary required considerablejudgment; however, the goal of the study and definitions oflife-cycle stages proved useful for guiding decisions (e.g., in-clusion or exclusion of decommissioning activities that werenumerous and often interrelated with the soil remediation ac-tivities). The definition of the system boundary is an essentialstep that is necessary before the inventory component is at-tempted, yet it requires an in-depth understanding of all relatedremediation activities that often comes through conducting theinventory analysis. The time horizon of 25 years was intendedto capture longer term effects; however, these effects proveddifficult to estimate and were either not included or inade-quately included within this study (e.g., emissions from thehazardous waste landfill).
The life-cycle stages developed by Diamond et al. [1] forcontaminated site remediation activities were adequate for de-scribing the case study. Post-site processing and monitoringwere not developed because of their minor role in this study.Although monitoring played a minor role in the inventory, it
provided essential information (e.g., concentrations of contam-inants in air, dustfall measures) from which inventory datawere derived.
Site-specific remediation data, as mentioned, were takenlargely from consultants’ reports. Although the entire inven-tory and subsequent interpretation were reviewed by reme-diation consultants and a panel of experts, the process of sum-marizing data for the public forum, such as this paper, obscuresthe transparency of the data, which is an unfortunate, yet typ-ical, feature of LCA studies relying on proprietary data. Forexample, certain reagents were proprietary and thus it was notpossible to determine constituents, let alone inputs and outputsfor production. This lack of information, although noted, con-tributed to gaps in the overall inventory, which again is typicalof many LCA case studies. The presentation of inventory dataaccording to the checklist format proved useful for linkinginventory items to stressors and, conceptually, to their potentialimpacts and clarifies the distribution of the inventory itemsrelative to life-cycle stage.
The impact assessment was restricted to a limited numberof potential impact indicators that have been developed: GWP,SWB, multimedia contaminant fate and toxicity, land use as-sessment, and RTB. These impact indicators, although few,provide essential information to help interpret the inventory.Here, we have contributed to developing multimedia contam-inant fate and toxicity estimates for metals, and have distin-guished these effects from those due to contaminants remain-ing on-site, for which the RTB is introduced. The multimediaassessment accounts for the environmental fate of persistentcontaminants and represents a more realistic evaluation of con-taminant impacts than a nonfate indicator model such as crit-ical volumes. Residual toxicity burden accounts for contam-inants remaining on-site, and reflects their potential toxicityshould they resurface.
In summary, this paper presents an application of an LCA-based method to site remediation activities that has highlightedimportant aspects associated with the remedial option. TheLCA has produced a quantitative assessment upon which de-cisions and choices can be made and opportunities for im-provement can be identified. The relative contributions of thelife-cycle stages to the overall impacts of the entire remediationapproach have been clarified. The case study illustrates theutility and feasibility of taking a life-cycle approach to analyzea process such as site remediation.
Overall, the case study results indicated that remediationof localized contaminated soil has resulted in burdens on local(e.g., contaminants remaining on-site, aquifer depletion), re-gional (e.g., land or space consumption, mineral consumption,air pollution, potential ecotoxicity and human health impacts),and global scales (e.g., acid rain, global warming, ozone de-pletion, energy source depletion). Thus, the effects of the ex-cavation and disposal remediation option extend beyond thecontaminated site itself, and only become evident when ana-lyzed from a life-cycle perspective.
Acknowledgement—We thank Gilles Castonguay (Ontario Ministryof Environment and Energy) and Ron Lall (environmental consultant)for their contributions to the study, and Gary Pringle for assistingthroughout the study and reviewing the paper. The Ontario Ministryof Environment and Energy’s Environmental Technologies Programfunded the research. Julie Phillips and Judy Josefowicz assisted withpreparing the manuscript.
810 Environ. Toxicol. Chem. 18, 1999 C.A. Page et al.
REFERENCES
1. Diamond ML, Page CA, Campbell M, McKenna S, Lall R. 1999.Life-cycle framework for assessment of site remediation options:Method and generic survey. Environ Toxicol Chem 18:788–800.
2. Canadian Standards Association. 1994. Environmental life cycleassessment. CAN/CSA-Z 760. Toronto, ON.
3. Society of Environmental Toxicology and Chemistry. 1991. Atechnical framework for life-cycle assessment. Workshop Report.SETAC, Pensacola, FL, USA.
4. Society of Environmental Toxicology and Chemistry. 1993. Aconceptual framework for life-cycle impact assessment. Work-shop Report. SETAC, Pensacola, FL, USA.
5. U.S. Environmental Protection Agency. 1991. Selection of controltechnologies for remediation of lead battery recycling sites. EPA/590/2-91/014. Washington, DC.
6. Diamond ML, Page CA, Campbell M, McKenna S. 1998. Life-cycle framework for assessment of site remediation options. FinalReport. PIBS 3613E. Ontario Ministry of Environment, Toronto,ON, Canada.
7. Jacques AP. 1992. Canada’s greenhouse gas emissions: Estimatedfor 1990. EPS 5/AP/4. Environment Canada, Ottawa, ON.
8. Ontario Round Table on Environment and Economy. 1992. Sec-toral task force report: Transportation. ORTEE, Toronto, ON,Canada.
9. Transport Concepts. 1995. External costs of truck and train. Broth-erhood of Maintenance of Way Employees, Ottawa, ON, Canada.
10. National Energy Board. 1994. Canadian energy: Supply and de-mand 1993–2010. Technical Report. Calgary, AB, Canada.
11. Khan AM. 1991. Energy and environmental factors in freighttransportation. National Economic Research Branch, Ottawa, ON,Canada.
12. Covery DB, Friend MJ, Shulhan GM. 1976. Energy equivalentsfor current and prospective automotive fuels in Canada. NationalResearch Council Canada, Ottawa, ON.
13. Gerhartz W, ed. 1985. Asphalt and bitumen. In Ullmann’s En-cyclopedia of Industrial Chemistry, 5th ed, Vol A3. VCH Pub-lishers, Deerfield, FL, USA, pp 185–187.
14. U.S. Environmental Protection Agency. 1994. Evaluation of emis-sions from paving asphalt. U.S. EPA Control Technol Cent News6(3).
15. Garret TK. 1994. Automotive Fuels and Fuel Systems, Vol. 2—Diesel. Society of Automotive Engineers, Warrendale, PA, USA.
16. McKetta J, ed. 1988. Lime: Calcincation principles. In Encyclo-pedia of Chemical Processing and Design, Vol 28. Marcel Dek-ker, New York, NY, USA, pp 119–138.
17. John Wiley & Sons. 1978. Flocculating agents. In Kirk-OthmerEncyclopedia of Chemical Technology, Vol 10, 3rd ed. New York,NY, USA, pp 496–499.
18. Young SB. 1996. Assessment of environmental life-cycle ap-proach for industrial materials and products. Ph.D. thesis. Uni-versity of Toronto, Toronto, ON, Canada.
19. Meyers R, ed. 1996. Handbook of Petroleum Refining Processes.McGraw Hill, New York, NY, USA.
20. McGraw-Hill. 1984. Perry’s Chemical Engineers’ Handbook, 5thed. New York, NY, USA.
21. John Wiley & Sons. 1992. Asphalt. In Kirk-Othmer Encyclopediaof Chemical Technology, Vol 3, 4th ed. New York, NY, USA,pp 715–716.
22. Henshaw CL. 1994. Co-product allocation in life-cycle assess-ment. Proceedings, Annual Meeting, Society of Environmental
Toxicology and Chemistry–Europe, Brussels, Belgium, February24–25, pp 120–121.
23. Houghton JT, et al., eds. 1995. Climate Change 1994: RadiativeForcing of Climate Change and an Evaluation of the IPCC IS92Emission Scenarios. Cambridge University Press, Cambridge,UK.
24. International Life Sciences Institute. 1996. Human Health ImpactAssessment in Life Cycle Assessment: Analysis by an ExpertPanel. ILSI Health and Environmental Sciences Institute, Wash-ington, DC.
25. Guinee JB, Heijungs R. 1993. A proposal for the classificationof toxic substances within the framework of life cycle assessmentof products. Chemosphere 26:1925–1944.
26. Jia CQ, Di Guardo A, Mackay D. 1996. Toxics release inven-tories: Opportunities for improved presentation and interpretation.Environ Sci Technol 30:86a–91a.
27. Mackay D, Paterson S, Shiu WY. 1992. Generic models for eval-uating the regional fate of chemicals. Chemosphere 24:695–717.
28. Mackay D, Diamond ML. 1989. Application of the QWASI (quan-titative water air sediment interaction) fugacity model to the dy-namics of organic and inorganic chemicals in lakes. Chemosphere18:1343–1365.
29. Mackay D, Paterson S. 1991. Evaluating the multimedia fate oforganic chemicals: Level III fugacity model. Environ Sci Technol25:427–436.
30. Ling H, Diamond ML, Mackay D. 1993. Application of the QWA-SI fugacity/aquivalence model to assessing sources and fate ofcontaminants in Hamilton Harbour. J Great Lakes Res 19:582–602.
31. Diamond ML, Mackay D, Poulton DJ, Stride FS. 1994. Devel-opment of a mass balance model of the fate of 17 chemicals inthe Bay of Quinte. J Great Lakes Res 20:643–666.
32. Livett EA. 1988. Geochemical monitoring of atmospheric heavymetal pollution: Theory and applications. Adv Ecol Res 18:65–77.
33. Ontario Ministry of Environment and Energy. 1996. Rationalefor the development and application of generic soil, groundwaterand sediment criteria for use at contaminated sites in Ontario.Toronto, ON, Canada.
34. U.S. Environmental Protection Agency. 1992. HEAST (healtheffects assessment summary table). U.S. EPA Computer Data-base. Washington, DC.
35. U.S. Environmental Protection Agency. 1993. IRIS (integratedrisk information system). U.S. EPA Computer Database. Wash-ington, DC.
36. Health Canada. 1995. Investigating Human Exposure to Con-taminants in the Environment: Handbook for Exposure Calcu-lations. Ottawa, ON.
37. U.S. Environmental Protection Agency. 1984. Estimating concernlevels for concentrations of chemical substances in the environ-ment. Environmental Effects Branch, Washington, DC.
38. Campbell GC, Tessier A. 1996. Ecotoxicology of metals in theaquatic environment: Geochemical aspects. In Newman MC, Ja-goe CJ, eds, Ecotoxicology, A Hierarchical Treatment. Lewis,Chelsea, MI, USA.
39. Newman MC, McIntosh AW. 1991. Metal Ecotoxicology: Con-cepts and Applications. Lewis, Chelsea, MI, USA.
40. Laidlaw Environmental Services. 1995. Environmental assess-ment: Landfill service continuation. EA Document 4. Ottawa, ON,Canada.
41. Society of Environmental Toxicology and Chemistry. 1997. Life-cycle impact assessment: The state-of-the-art. SETAC, Pensacola,FL, USA.


