Irrigation Water Salinity and Crop ProductionSTEPHEN R. GRATTAN, Plant-Water Relations Specialist, University of California, Davis
Irrigation water quality can have a profound impact on crop production. All irrigationwater contains dissolved mineral salts, but the concentration and composition of thedissolved salts vary depending on the source of the irrigation water. For example,snow melt or water supplies from the Sierra Nevada contain very small amounts ofsalt whereas groundwater or wastewater typically has higher salt levels. Too muchsalt can reduce or even prohibit crop production while too little salt can reducewater infiltration, which indirectly affects the crop. An understanding of the qualityof water used for irrigation and its potential negative impacts on crop growth isessential to avoid problems and to optimize production. For more information onany of the issues found in this publication, please contact your local University ofCalifornia Cooperative Extension office.
D I S S O LV E D S A LT SDissolved salts in irrigation water form ions. The most common salts in irrigationwater are table salt (sodium chloride, NaCl), gypsum (calcium sulfate, CaSO4),Epsom salts (magnesium sulfate, MgSO4), and baking soda (sodium bicarbonate,NaHCO3). Salts dissolve in water and form positive ions (cations) and negative ions(anions). The most common cations are calcium (Ca2+), magnesium (Mg2+), andsodium (Na+) while the most common anions are chloride (Cl-), sulfate (SO4
2-),and bicarbonate (HCO3
-). The ratios of these ions, however, vary from one watersupply to another. Potassium (K+), carbonate (CO3
2-), and nitrate (NO3-) also exist
in water supplies, but concentrations of these constituents are comparatively low. Inaddition, some irrigation waters, particularly from groundwater sources, containboron at levels that may be detrimental to certain crops.
It should be noted that substantial salinization potential is realized through nat-ural weathering and dissolution of soil parent materials, and these salt contributionswill attenuate or augment irrigation water ionic constituents.
C H A R A C T E R I Z I N G S A L I N I T YThere are two common water quality assessments that characterize the salinity ofirrigation water. The salinity of irrigation water is sometimes reported as the totalsalt concentration or total dissolved solids (TDS). The units of TDS are usuallyexpressed in milligrams of salt per liter (mg/L) of water. This term is still used bycommercial analytical laboratories and represents the total number of milligrams ofsalt that would remain after 1liter of water is evaporated to dryness. TDS is also oftenreported as parts per million (ppm) and is the same numerically as mg/L. The higherthe TDS, the higher the salinity of the water.
The other measurement that is documented in water quality reports from com-mercial labs is specific conductance, also called electrical conductivity (EC). EC is amuch more useful measurement than TDS because it can be made instantaneouslyand easily by irrigators or farm managers in the field. Salts that are dissolved in water
PUBLICATION 8066 FWQP REFERENCE SHEET 9.10
UNIVERSITY OF CALIFORNIAAgriculture and Natural Resourceshttp://anrcatalog.ucdavis.edu
In partnership with
http://www.nrcs.usda.gov
Farm Water Quality Planning
A Water Quality and Technical Assistance Program
for California Agriculture
http://waterquality.ucanr.org
This REFERENCE SHEET is part ofthe Farm Water QualityPlanning (FWQP) series,
developed for a short coursethat provides training for grow-
ers of irrigated crops who areinterested in implementing
water quality protection prac-tices. The short course teaches
the basic concepts of water-sheds, nonpoint source pollution
(NPS), self-assessment tech-niques, and evaluation tech-
niques. Management goals andpractices are presented for avariety of cropping systems.
Irrigation Water Salinity and Crop Reproduction 2ANR Publication 8066
conduct electricity, and, therefore, the salt content in the water is directly related tothe EC. The EC can be reported based on the irrigation water source (ECw) or onthe saturated soil extract (ECe). Units of EC reported by labs are usually in mil-limhos per centimeter (mmhos/cm) or decisiemens per meter (dS/m). Onemmho/cm = 1 dS/m. EC is also reported in micrommhos per centimeter(µmhos/cm). 1 µmho = 1⁄1000 mmho.
Often conversions between ECw and TDS are made, but caution is advisedbecause conversion factors depend both on the salinity level and composition of thewater. For example:
TDS (mg/L) = 640 x ECw (dS/m) when ECw < 5 dS/m
TDS (mg/L) = 800 x ECw (dS/m) when ECw > 5 dS/m
Sulfate salts do not conduct electricity in the same way as other types of salts.Therefore, if water contains large quantities of sulfate salts, the conversion factorsare invalid and must be adjusted upward.
I R R I G AT I O N W AT E R S A L I N I T Y, S O I L S A L I N I T Y, A N DL E A C H I N G
Many irrigation water supplies contain a substantial amount of salt. For example, awater source with an EC of 1.0 mmho/cm, a quality suitable for irrigation of mostcrops, contains nearly 1 ton of salt in every acre-foot of water applied. Irrigation cancontribute a substantial amount of salt to a field over the season.
Salts accumulate in the rootzone by two processes: the upward movement of ashallow saline-water table and salts left in the soil due to insufficient leaching. Tocontrol salinity from high saline water tables, drains must be installed in the field.To battle against salts that accumulate in the rootzone from the irrigation water, thesoil must be adequately leached.
Leaching is the process of applying more water to the field than can be held bythe soil in the crop rootzone such that the excess water drains below the root sys-tem, carrying salts with it. The more water that is applied in excess of the crop waterrequirement, the less salinity there is left in the rootzone despite the fact that moresalt has actually been added to the field. The term leaching fraction (LF) is used torelate the fraction or percent of water applied to the field that actually drains belowthe rootzone. For example, if 1 acre-foot of water is applied to 1 acre of land, and0.1 acre-foot drains below the rootzone, the leaching fraction is 1⁄10 (10 percent).
Below are some useful relationships between the salinity in irrigation water(electrical conductivity of irrigation water, ECw) and the average rootzone salinity(ECe). These relationships were developed by Ayers and Westcot (1985) and assumesteady state conditions. ECe is the electrical conductivity of the saturated soil paste(soil samples are saturated with distilled water, the soil water is then extracted, andthe EC is measured on the extracted water). These relationships predict what willhappen over the long term if the leaching fractions indicated are achieved andassuming that the ECe in the rootzone increases with depth (which would be evi-dence of leaching).
LF 10% leads to ECw x 2.1 = ECe
LF 15-20% leads to ECw x 1.5 = ECe
LF 30% leads to ECw = ECe
Irrigation Water Salinity and Crop Reproduction 3ANR Publication 8066
E S T I M AT I N G Y I E L D P O T E N T I A LHow could you use these relationships to estimate the yield potential? Maas andGrattan (1999) provide an extensive list of salinity coefficients for a number of hor-ticultural and agronomic crops. These coefficients consist of a threshold and slope.The salinity threshold (a) is the maximum average soil salinity (ECe) the crop cantolerate in the rootzone without a decline in yield. The slope coefficient (b) is thepercent loss in relative yield the crop will experience for every unit increase in ECeabove the threshold. Using these coefficients, the yield potential (% Yield) can beestimated from the following expression:
% Yield = 100 – b (ECe – a)
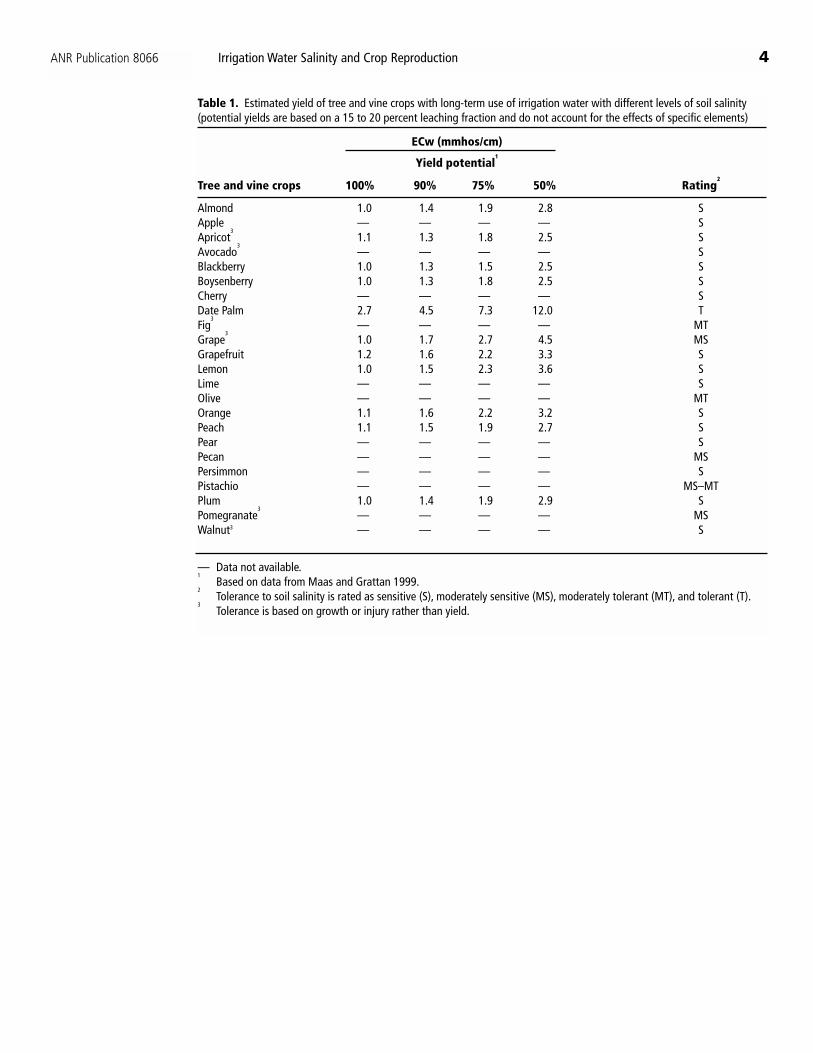
Tables 1 and 2 provide water quality guidelines for the most commonly growncrops in California. Table 1 assumes that the soil is well drained and that an LF of15 to 20 percent is achieved. It is based on the formulas above and provides guide-lines for trees and vines. Table 2 provides the same type of guidelines for vegetableand row crops. These tables provide the salinity level in the irrigation water (ECw)that, if used continuously to achieve an LF of 15 to 20 percent, would result in yieldpotentials of 100, 90, 75, and 50 percent. The ECw values at 100% yield representthe poorest quality water that, if used continuously, will produce ECe levels equal tothe salinity thresholds. For example, lettuce has the following salinity coefficients:
a = 1.3 dS/m
and
b = 13 when expressed as ECe
If the average rootzone ECe throughout the season was 3.2 dS/m, then the yieldpotential is 75 percent. If the average rootzone salinity value of 3.2 is then convert-ed to irrigation water salinity assuming an LF of 15 to 20 percent, ECw is 2.1 dS/m.The guidelines also assume that all other factors such as fertility, irrigation schedul-ing, and pest control are managed to optimize crop performance.
It is important to note that most of the experiments that were used to generatethese guidelines were conducted in the interior regions of California where the cli-mate is hot and dry during the summer. Crops grown in the coastal regions wherethe climate is milder will likely tolerate greater salinities than indicated above.Furthermore, much of the groundwater used for irrigation in coastal areas ofCalifornia contains high levels of dissolved gypsum, which elevates the salinity ofthe water. However, crops irrigated with this water do not suffer the same detri-mental effects as Cl-dominated waters with an equal EC.
In fields where salinity has increased in the rootzone to damaging levels, recla-mation leaching is recommended. A common rule of thumb is that the salinity in thetop 1 foot of the rootzone can be reduced 80 to 90 percent by intermittently apply-ing 1 acre-foot of water per acre of land.
Irrigation Water Salinity and Crop Reproduction 4ANR Publication 8066
Table 1. Estimated yield of tree and vine crops with long-term use of irrigation water with different levels of soil salinity(potential yields are based on a 15 to 20 percent leaching fraction and do not account for the effects of specific elements)
ECw (mmhos/cm)
Yield potential1
Tree and vine crops 100% 90% 75% 50% Rating2
Almond 1.0 1.4 1.9 2.8 SApple — — — — SApricot
31.1 1.3 1.8 2.5 S
Avocado3
— — — — SBlackberry 1.0 1.3 1.5 2.5 SBoysenberry 1.0 1.3 1.8 2.5 SCherry — — — — SDate Palm 2.7 4.5 7.3 12.0 TFig
3— — — — MT
Grape3
1.0 1.7 2.7 4.5 MSGrapefruit 1.2 1.6 2.2 3.3 SLemon 1.0 1.5 2.3 3.6 SLime — — — — SOlive — — — — MTOrange 1.1 1.6 2.2 3.2 SPeach 1.1 1.5 1.9 2.7 SPear — — — — SPecan — — — — MSPersimmon — — — — SPistachio — — — — MS–MTPlum 1.0 1.4 1.9 2.9 SPomegranate
3— — — — MS
Walnut3 — — — — S
— Data not available.1
Based on data from Maas and Grattan 1999.2
Tolerance to soil salinity is rated as sensitive (S), moderately sensitive (MS), moderately tolerant (MT), and tolerant (T).3
Tolerance is based on growth or injury rather than yield.
Irrigation Water Salinity and Crop Reproduction 5ANR Publication 8066
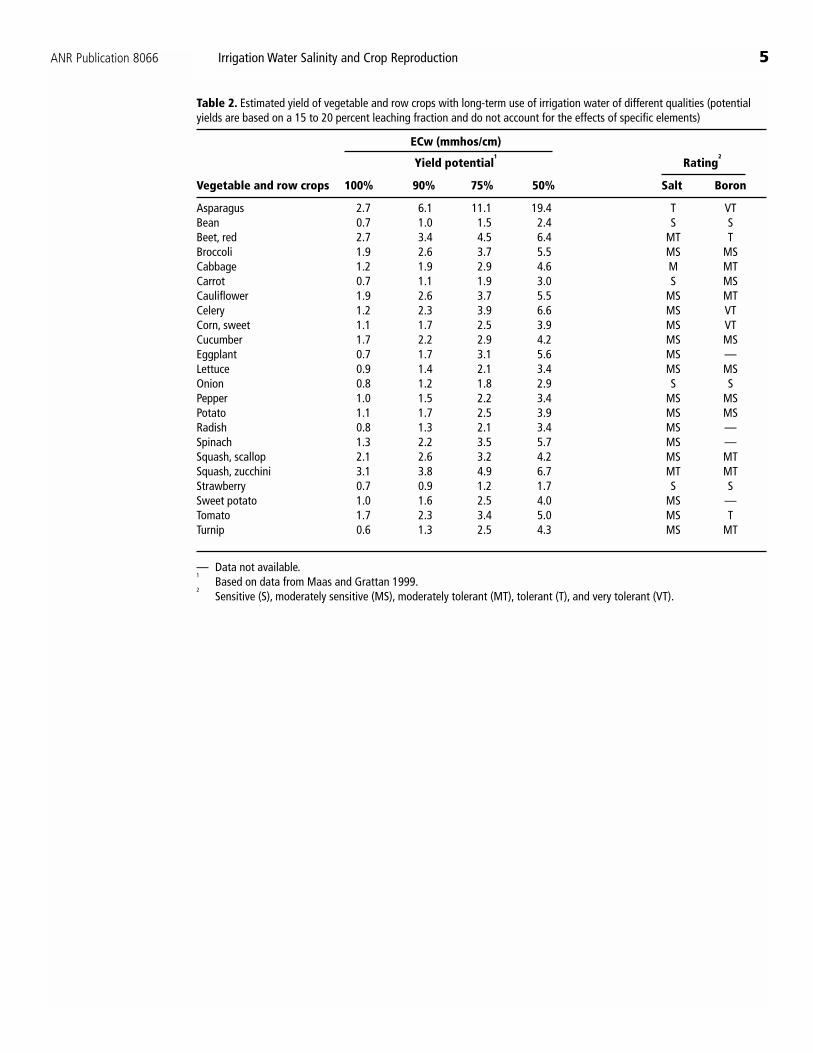
Table 2. Estimated yield of vegetable and row crops with long-term use of irrigation water of different qualities (potentialyields are based on a 15 to 20 percent leaching fraction and do not account for the effects of specific elements)
ECw (mmhos/cm)
Yield potential1
Rating2
Vegetable and row crops 100% 90% 75% 50% Salt Boron
Asparagus 2.7 6.1 11.1 19.4 T VT Bean 0.7 1.0 1.5 2.4 S S Beet, red 2.7 3.4 4.5 6.4 MT T Broccoli 1.9 2.6 3.7 5.5 MS MS Cabbage 1.2 1.9 2.9 4.6 M MT Carrot 0.7 1.1 1.9 3.0 S MS Cauliflower 1.9 2.6 3.7 5.5 MS MT Celery 1.2 2.3 3.9 6.6 MS VT Corn, sweet 1.1 1.7 2.5 3.9 MS VT Cucumber 1.7 2.2 2.9 4.2 MS MS Eggplant 0.7 1.7 3.1 5.6 MS — Lettuce 0.9 1.4 2.1 3.4 MS MS Onion 0.8 1.2 1.8 2.9 S S Pepper 1.0 1.5 2.2 3.4 MS MS Potato 1.1 1.7 2.5 3.9 MS MS Radish 0.8 1.3 2.1 3.4 MS — Spinach 1.3 2.2 3.5 5.7 MS — Squash, scallop 2.1 2.6 3.2 4.2 MS MT Squash, zucchini 3.1 3.8 4.9 6.7 MT MT Strawberry 0.7 0.9 1.2 1.7 S S Sweet potato 1.0 1.6 2.5 4.0 MS — Tomato 1.7 2.3 3.4 5.0 MS T Turnip 0.6 1.3 2.5 4.3 MS MT
— Data not available.1
Based on data from Maas and Grattan 1999.2
Sensitive (S), moderately sensitive (MS), moderately tolerant (MT), tolerant (T), and very tolerant (VT).
Irrigation Water Salinity and Crop Reproduction 6ANR Publication 8066
C R O P T O X I C I T Y T O S P E C I F I C E L E M E N T SIn addition to salinity, some crops are injured by certain elements, notably sodium(Na+), chloride (Cl-), and boron (B). With drip and furrow irrigation, chloride andsodium injury do not generally occur in vegetable and row crops unless salinity inirrigation water is severe. Leaf injury can occur in strawberries, however, particular-ly under hot, dry conditions. Under sprinkler irrigation, injury may occur to wettedleaves of susceptible plants such as pepper, potatoes, and tomato if the ECw exceeds1.5 mmhos/cm.
Some vegetable and row crops are sensitive to boron. Generally, leaf injury mustbe severe to cause reduced yields and crop quality. Long-term use of irrigation watercontaining more than 0.5 ppm boron can reduce the yields of bean, onion, garlic,and strawberry; 0.7 ppm can reduce the yields of broccoli, carrot, potato, and let-tuce; and concentrations greater than 2 ppm can reduce yields of cabbage and cau-liflower.
Under cool, moist climatic conditions, greater levels of boron can be tolerated,and for short-term use, boron levels given here can be doubled. In addition, soilproperties influence the time it takes for injury to occur. The finer the soil texture,the longer it will take for injury to occur.
Unlike most annual crops, tree and vine crops are generally sensitive to boron,chloride, and sodium toxicity. Tolerances vary among varieties and rootstocks.Tolerant varieties and rootstocks resist the uptake and accumulation of toxic ions inthe stem and leaf tissue. Continued use of irrigation water with boron concentra-tions in excess of 0.75 ppm can reduce the yields of grapes and many deciduous treeand fruit crops. This represents a threshold concentration and does not imply thatirrigation water with boron at or slightly above this level cannot be used successfully.
Chloride moves readily with the soil water and is taken up by the roots. It is thentransported to the stems and leaves. Sensitive berries and avocado rootstocks can toler-ate only up to 120 ppm of chloride, while grapes can tolerate up to 700 ppm or more.
The ability of a tree to tolerate sodium varies considerably. Sodium injury onavocado, citrus, and stone-fruit trees has been reported at concentrations as low as115 ppm. Initially, sodium is retained in the roots and lower trunk, but after 3 to 4years the conversion of sapwood to heartwood apparently releases the accumulatedsodium, which then moves to the leaves causing leaf burn.
I N F I LT R AT I O N O F I R R I G AT I O N W AT E RThere are two water quality parameters to consider when assessing irrigation waterquality for potential water infiltration problems. These are the ECw and the sodiumadsorption ratio (SAR). The SAR is an indicator of the amount of sodium in thewater relative to calcium and magnesium. The higher the ratio of sodium to calciumplus magnesium, the higher the SAR. Both a low salt content (low ECw) and highSAR can mean there is a high potential for permeability or water infiltration problems.
A low ECw or high SAR can act separately or collectively to disperse soil aggre-gates, which in turn reduces the number of large pores in the soil. These large poresare responsible for aeration and drainage. A negative effect from the breakdown ofsoil aggregates is soil sealing and crust formation. Below is a table that can be usedto assess the likelihood of potential water infiltration problems based on both ECwand SAR.
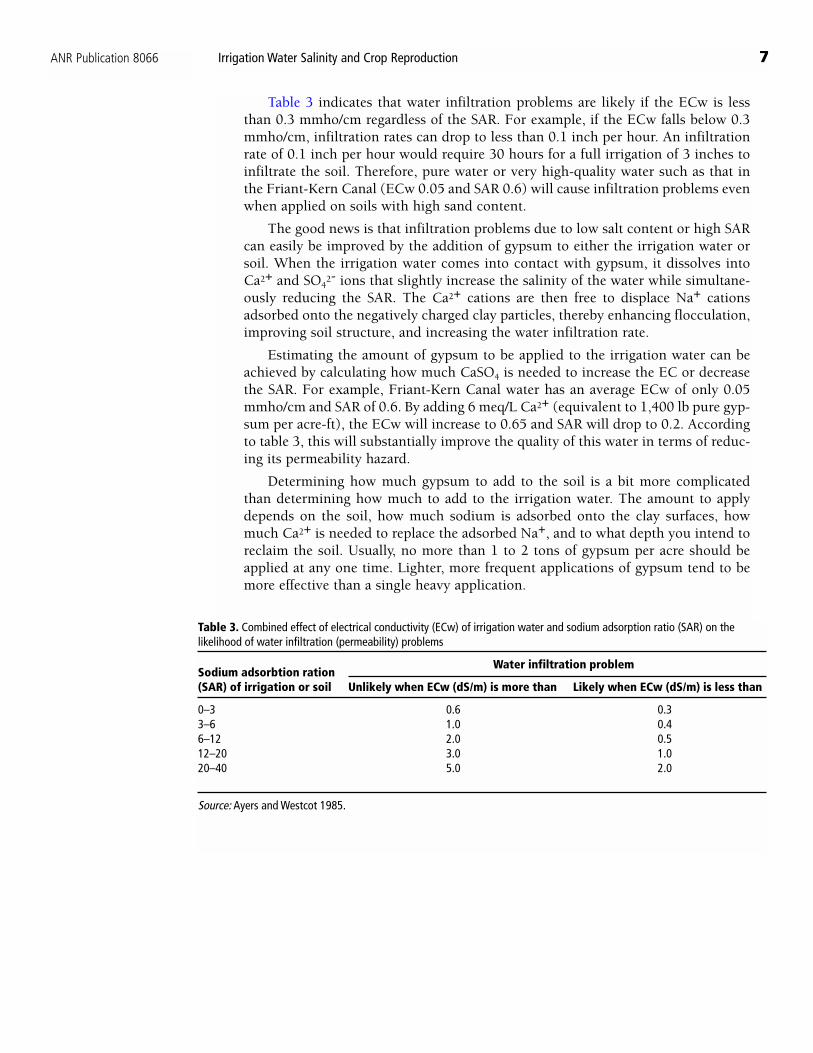
Table 3 indicates that water infiltration problems are likely if the ECw is lessthan 0.3 mmho/cm regardless of the SAR. For example, if the ECw falls below 0.3mmho/cm, infiltration rates can drop to less than 0.1 inch per hour. An infiltrationrate of 0.1 inch per hour would require 30 hours for a full irrigation of 3 inches toinfiltrate the soil. Therefore, pure water or very high-quality water such as that inthe Friant-Kern Canal (ECw 0.05 and SAR 0.6) will cause infiltration problems evenwhen applied on soils with high sand content.
The good news is that infiltration problems due to low salt content or high SARcan easily be improved by the addition of gypsum to either the irrigation water orsoil. When the irrigation water comes into contact with gypsum, it dissolves intoCa2+ and SO4
2- ions that slightly increase the salinity of the water while simultane-ously reducing the SAR. The Ca2+ cations are then free to displace Na+ cationsadsorbed onto the negatively charged clay particles, thereby enhancing flocculation,improving soil structure, and increasing the water infiltration rate.
Estimating the amount of gypsum to be applied to the irrigation water can beachieved by calculating how much CaSO4 is needed to increase the EC or decreasethe SAR. For example, Friant-Kern Canal water has an average ECw of only 0.05mmho/cm and SAR of 0.6. By adding 6 meq/L Ca2+ (equivalent to 1,400 lb pure gyp-sum per acre-ft), the ECw will increase to 0.65 and SAR will drop to 0.2. Accordingto table 3, this will substantially improve the quality of this water in terms of reduc-ing its permeability hazard.
Determining how much gypsum to add to the soil is a bit more complicatedthan determining how much to add to the irrigation water. The amount to applydepends on the soil, how much sodium is adsorbed onto the clay surfaces, howmuch Ca2+ is needed to replace the adsorbed Na+, and to what depth you intend toreclaim the soil. Usually, no more than 1 to 2 tons of gypsum per acre should beapplied at any one time. Lighter, more frequent applications of gypsum tend to bemore effective than a single heavy application.
Irrigation Water Salinity and Crop Reproduction 7ANR Publication 8066
Table 3. Combined effect of electrical conductivity (ECw) of irrigation water and sodium adsorption ratio (SAR) on thelikelihood of water infiltration (permeability) problems
Sodium adsorbtion ration Water infiltration problem
(SAR) of irrigation or soil Unlikely when ECw (dS/m) is more than Likely when ECw (dS/m) is less than
0–3 0.6 0.3 3–6 1.0 0.4 6–12 2.0 0.5 12–20 3.0 1.0 20–40 5.0 2.0
Source: Ayers and Westcot 1985.
Irrigation Water Salinity and Crop Reproduction 8ANR Publication 8066
O T H E R W AT E R Q U A L I T Y C O N S T I T U E N T SIrrigation water supplies, particularly those from wells, can contain other constituentsthat may affect water quality. Of particular concern are nitrate (NO3
-) and bicarbonate(HCO3
-).
Nitrates are often measured as NO3-N, which refers to the nitrogen concentration inthe water that is in the nitrate form. From a public health perspective, there are con-cerns when excessive levels of nitrates are found in domestic wells. The public drinkingwater standard is set at 10 mg/L (or ppm) NO3-N. From an irrigation perspective, NO3
-
in the groundwater can be viewed as a resource. For example, 27 pounds of nitrogen isapplied to a field with each acre-foot of water if the water supply contains 10 ppm NO3-N (45 ppm when expressed as NO3
-). It is important that the grower with water of suchquality reduces the nitrogen application rates in the field accordingly to accommodatethis extra input of nitrogen. Should this be ignored, there may be problems associatedwith excessive vegetative growth and contamination of the groundwater.
Excessive amounts of bicarbonate can also be problematic. In fields that are irri-gated with low-pressure systems, such as drip or mini-sprinklers, calcite or scale canbuild up near the orifice of the sprinkler or emitter, which can reduce the water dis-charge. This type of problem can be corrected by injecting acid-forming materials(such as sulfuric acid) in the irrigation water. In addition, bicarbonate could increasethe SAR of the soil water by precipitating calcium and magnesium. This can be cor-rected by frequent gypsum applications to the soil surface.
R E F E R E N C E SAyers, R. S., and D. W. Westcot. 1985. Water quality for agriculture. Food and
Agricultural Organization (FAO) of the United Nations. FAO Irrigation andDrainage Paper 29.
Maas, E. V., and S. R. Grattan. 1999. Crop yields as affected by salinity. In R. W. Skaggsand J. van Schilfgaarde, eds., Agricultural Drainage. Agron. Monograph 38. ASA,CSSA, SSSA, Madison, WI.
Hanson, B., S. R. Grattan, and A. Fulton. 1999. Agricultural salinity and drainage.Oakland: University of California Division of Agriculture and Natural ResourcesPublication 3375.
F O R M O R E I N F O R M AT I O NYou’ll find detailed information on many aspects of turfgrass management in thesetitles and in other UC ANR products:
Agricultural Salinity and Drainage, Publication 3375
Irrigation and Drainage, Slide Set 93/105
Drip Irrigation for Row Crops, Publication 3376
To order these products, visit our online catalog at http://anrcatalog.ucdavis.eduYou can also place orders by mail, phone, or fax, or request a printed catalog of publications, slide sets, and videos from
University of CaliforniaAgriculture and Natural ResourcesCommunication Services6701 San Pablo Avenue, 2nd FloorOakland, CA 94608-1239
Telephone: (800) 994-8849 or (510) 642-2431FAX: (510) 643-5470E-mail inquiries: [email protected]
An electronic version of this publication is available on the ANR Communication Services website athttp://anrcatalog.ucdavis.edu
Publication 8066
©2002 by the Regents of the University of California, Division of Agriculture and Natural Resources. All rights reserved.
The University of California prohibits discrimination against or harassment of any person employed by orseeking employment with the University on the basis of race, color, national origin, religion, sex, physicalor mental disability, medical condition (cancer-related or genetic characteristics), ancestry, marital status,age, sexual orientation, citizenship, or status as a covered veteran (special disabled veteran, Vietnam-eraveteran or any other veteran who served on active duty during a war or in a campaign or expedition forwhich a campaign badge has been authorized). University Policy is intended to be consistent with the pro-visions of applicable State and Federal laws.
Inquiries regarding the University’s nondiscrimination policies may be directed to the Affirmative Action/StaffPersonnel Services Director, University of California, Agriculture and Natural Resources, 300 Lakeside Drive,6th floor, Oakland, CA 94612-3550; (510) 987-0096. For a free catalog of other publications, telephone(800) 994-8849. For help downloading this publication, call (530) 754-5112.
pr-06/02-GM/VFG
This publication has been anonymously peer reviewed for technical accuracy by University of California scien-tists and other qualified professionals. This review process was managed by the ANR Associate Editor for NaturalResources.
Irrigation Water Salinity and Crop Reproduction 9ANR Publication 8066


