Water Quality for Irrigated Agriculture Water Quality for Irrigated Agriculture ----
Salinity/Salinity/SodicitySodicity FocusFocus
Troy Bauder, John Troy Bauder, John StednickStednick, , Timothy Gates, Lorenz SutherlandTimothy Gates, Lorenz Sutherland
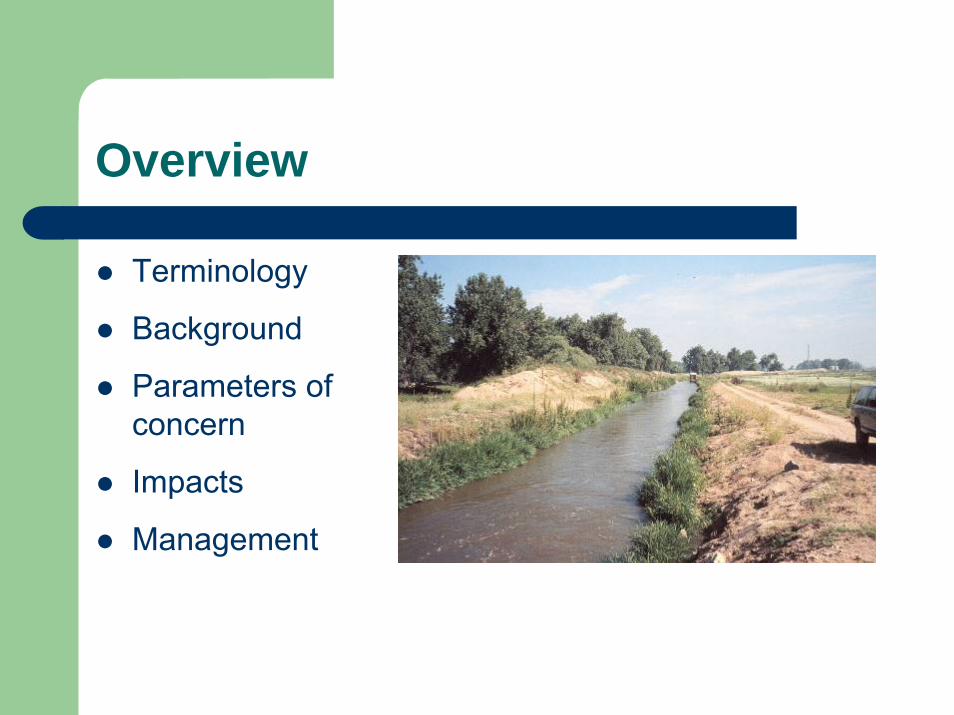
Overview
Terminology
Background
Parameters of concern
Impacts
Management
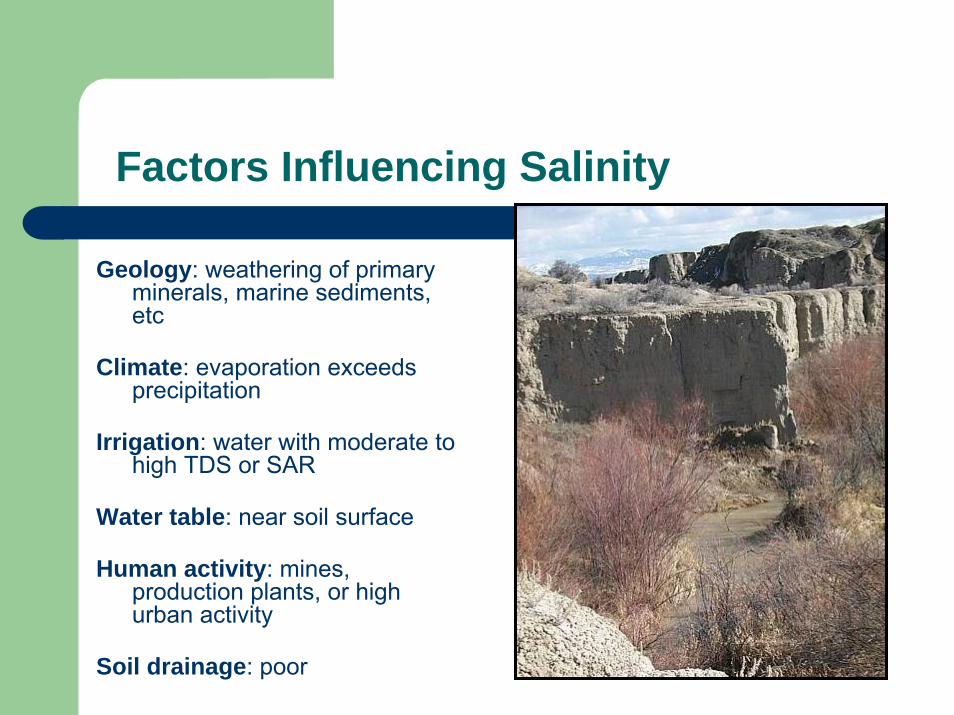
Factors Influencing Salinity
Geology: weathering of primary minerals, marine sediments, etc
Climate: evaporation exceeds precipitation
Irrigation: water with moderate to high TDS or SAR
Water table: near soil surface
Human activity: mines, production plants, or high urban activity
Soil drainage: poor
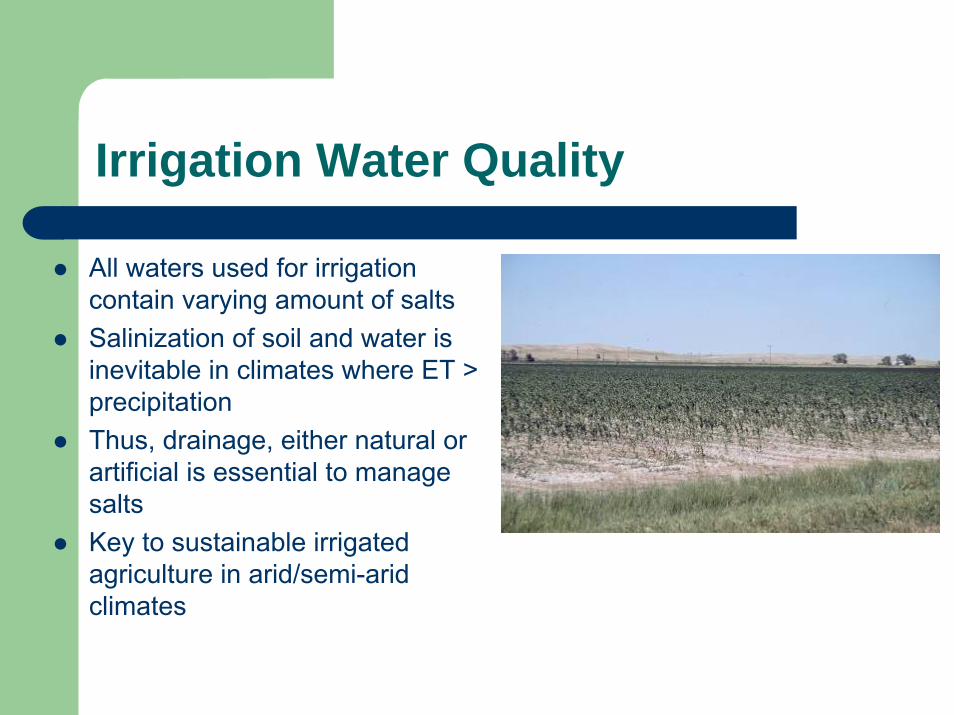
Irrigation Water Quality
All waters used for irrigation contain varying amount of saltsSalinization of soil and water is inevitable in climates where ET > precipitationThus, drainage, either natural or artificial is essential to manage saltsKey to sustainable irrigated agriculture in arid/semi-arid climates
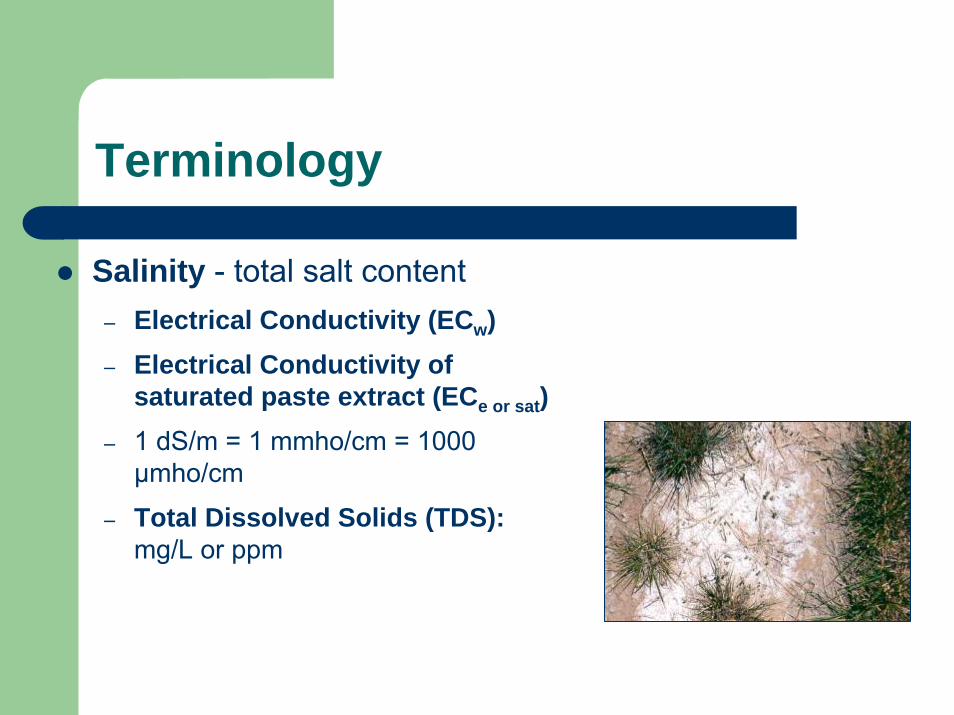
Terminology
Salinity - total salt content– Electrical Conductivity (ECw)– Electrical Conductivity of
saturated paste extract (ECe or sat)– 1 dS/m = 1 mmho/cm = 1000
µmho/cm
– Total Dissolved Solids (TDS):mg/L or ppm
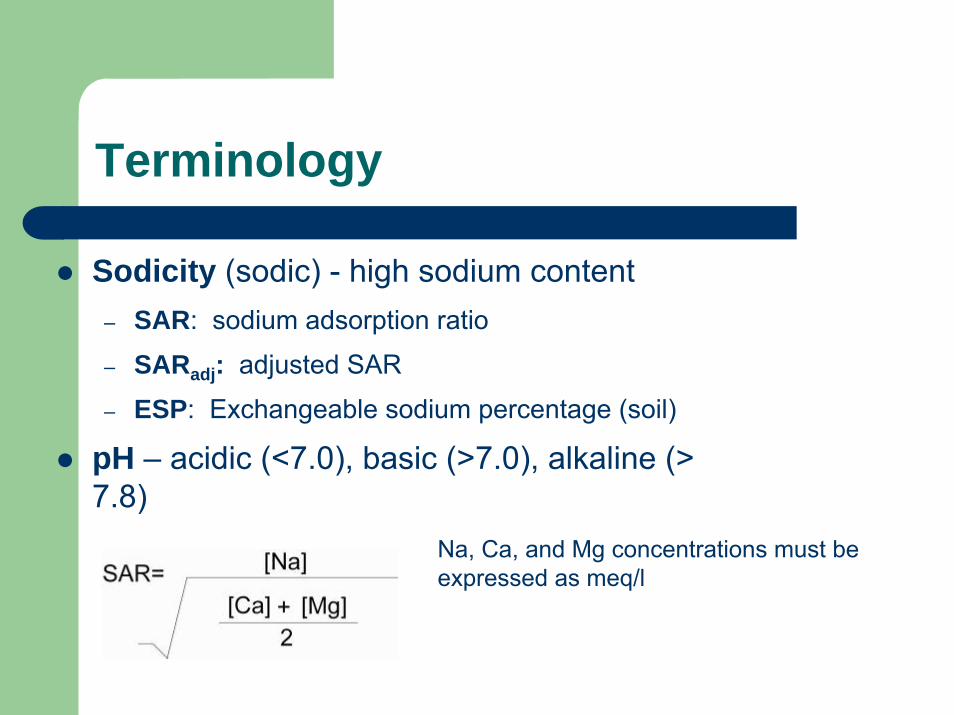
Terminology
Sodicity (sodic) - high sodium content– SAR: sodium adsorption ratio
– SARadj: adjusted SAR
– ESP: Exchangeable sodium percentage (soil)
pH – acidic (<7.0), basic (>7.0), alkaline (> 7.8)
Na, Ca, and Mg concentrations must be expressed as meq/l
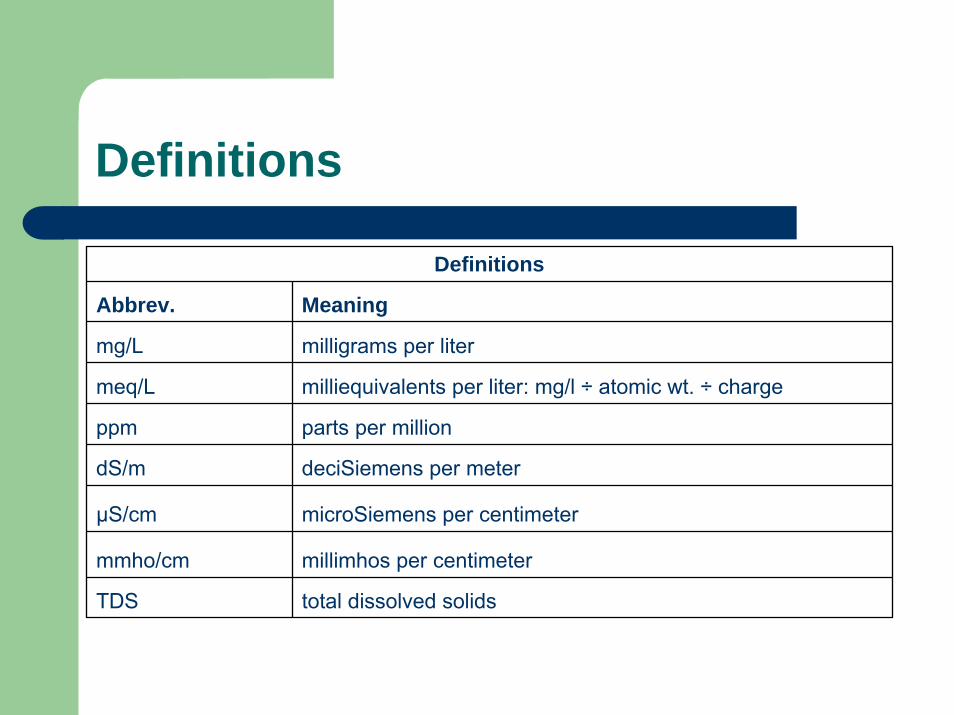
Definitions
Definitions
Abbrev. Meaning
mg/L milligrams per liter
meq/L milliequivalents per liter: mg/l ÷ atomic wt. ÷ charge
ppm parts per million
dS/m deciSiemens per meter
µS/cm microSiemens per centimeter
mmho/cm millimhos per centimeter
TDS total dissolved solids
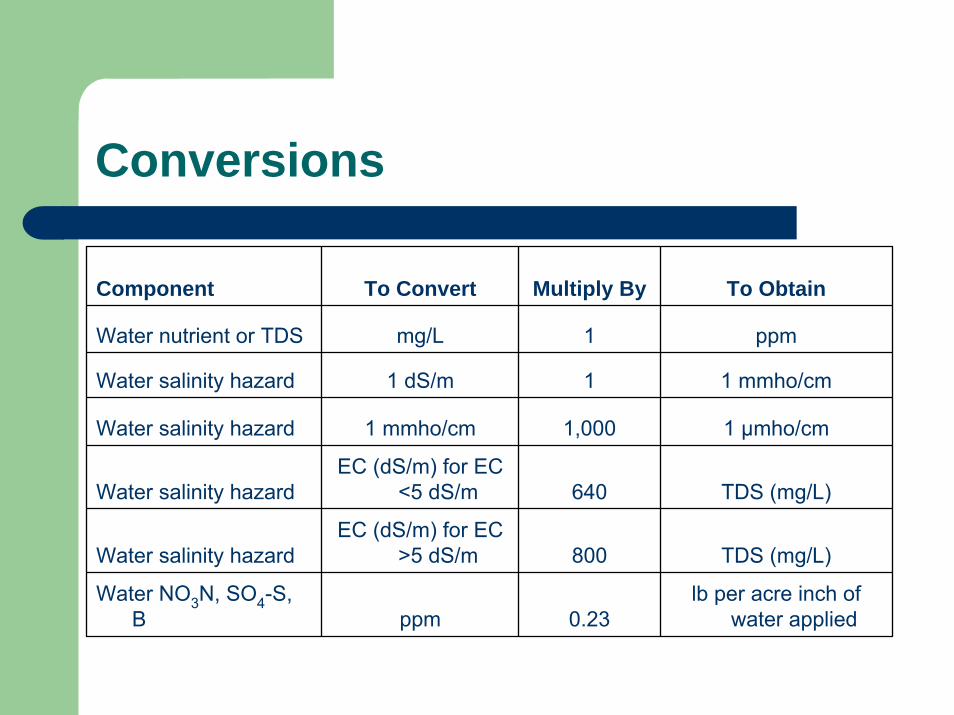
Conversions
Component To Convert Multiply By To Obtain
Water nutrient or TDS mg/L 1 ppm
Water salinity hazard 1 dS/m 1 1 mmho/cm
Water salinity hazard 1 mmho/cm 1,000 1 µmho/cm
Water salinity hazardEC (dS/m) for EC
<5 dS/m 640 TDS (mg/L)
Water salinity hazardEC (dS/m) for EC
>5 dS/m 800 TDS (mg/L)
Water NO3N, SO4-S, B ppm 0.23
lb per acre inch of water applied
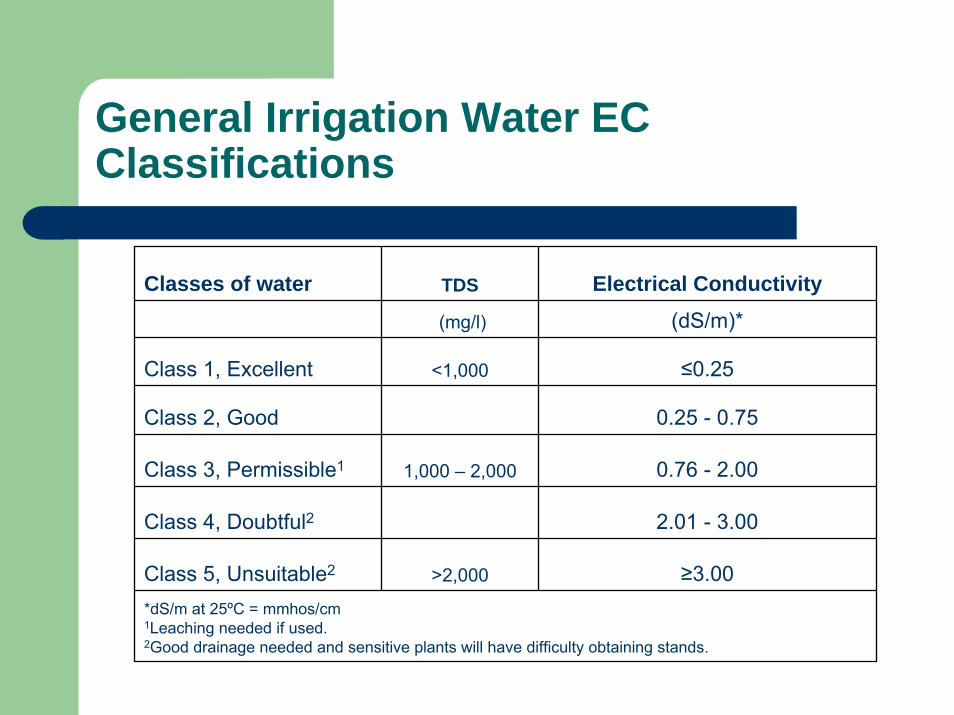
General Irrigation Water EC Classifications
Classes of water TDS Electrical Conductivity
(mg/l)
<1,000
1,000 – 2,000
>2,000
(dS/m)*
Class 1, Excellent ≤0.25
Class 2, Good 0.25 - 0.75
Class 3, Permissible1 0.76 - 2.00
Class 4, Doubtful2 2.01 - 3.00
Class 5, Unsuitable2 ≥3.00*dS/m at 25ºC = mmhos/cm1Leaching needed if used.2Good drainage needed and sensitive plants will have difficulty obtaining stands.
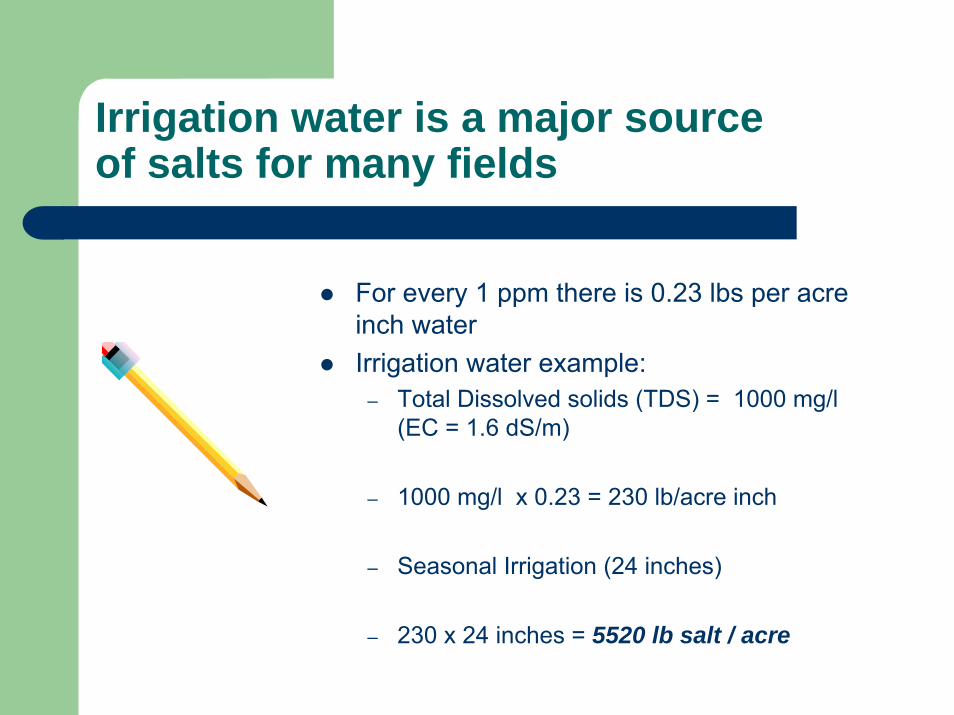
Irrigation water is a major source of salts for many fields
For every 1 ppm there is 0.23 lbs per acre inch waterIrrigation water example:
– Total Dissolved solids (TDS) = 1000 mg/l (EC = 1.6 dS/m)
– 1000 mg/l x 0.23 = 230 lb/acre inch
– Seasonal Irrigation (24 inches)
– 230 x 24 inches = 5520 lb salt / acre
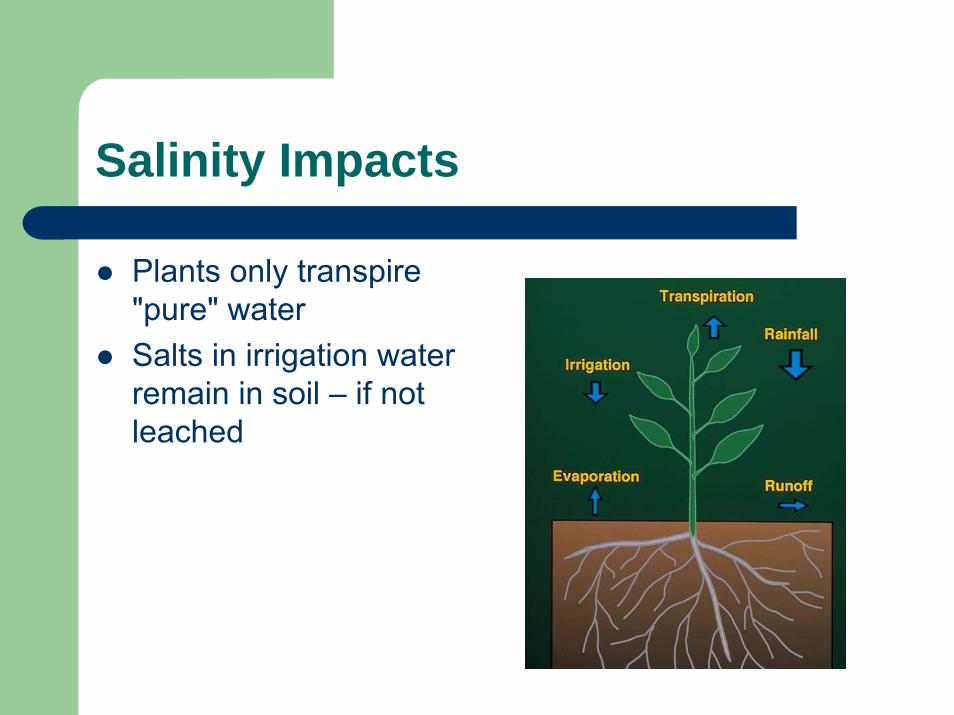
Salinity Impacts
Plants only transpire "pure" waterSalts in irrigation water remain in soil – if not leached
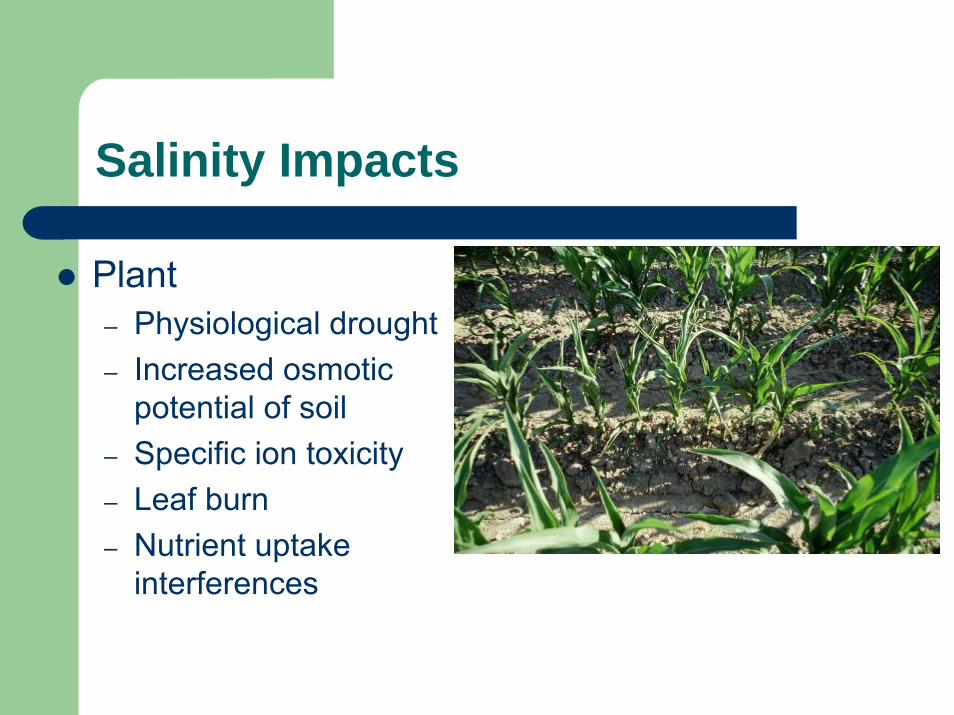
Salinity Impacts
Plant – Physiological drought– Increased osmotic
potential of soil– Specific ion toxicity– Leaf burn– Nutrient uptake
interferences
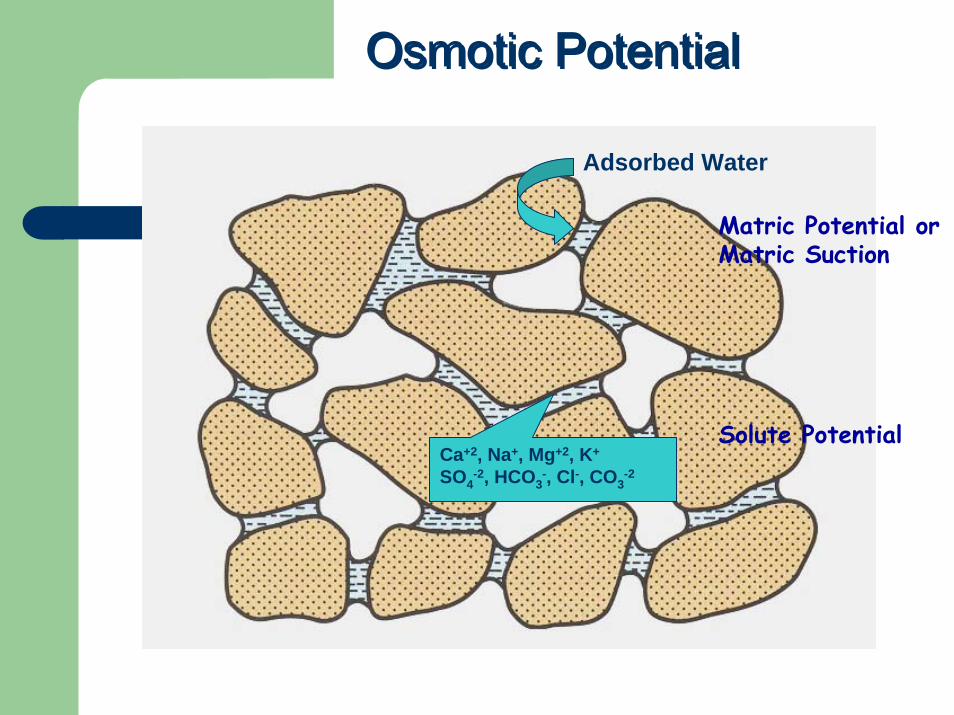
Osmotic PotentialOsmotic Potential
Adsorbed Water
Ca+2, Na+, Mg+2, K+
SO4-2, HCO3
-, Cl-, CO3-2
Matric Potential or Matric Suction
Solute Potential
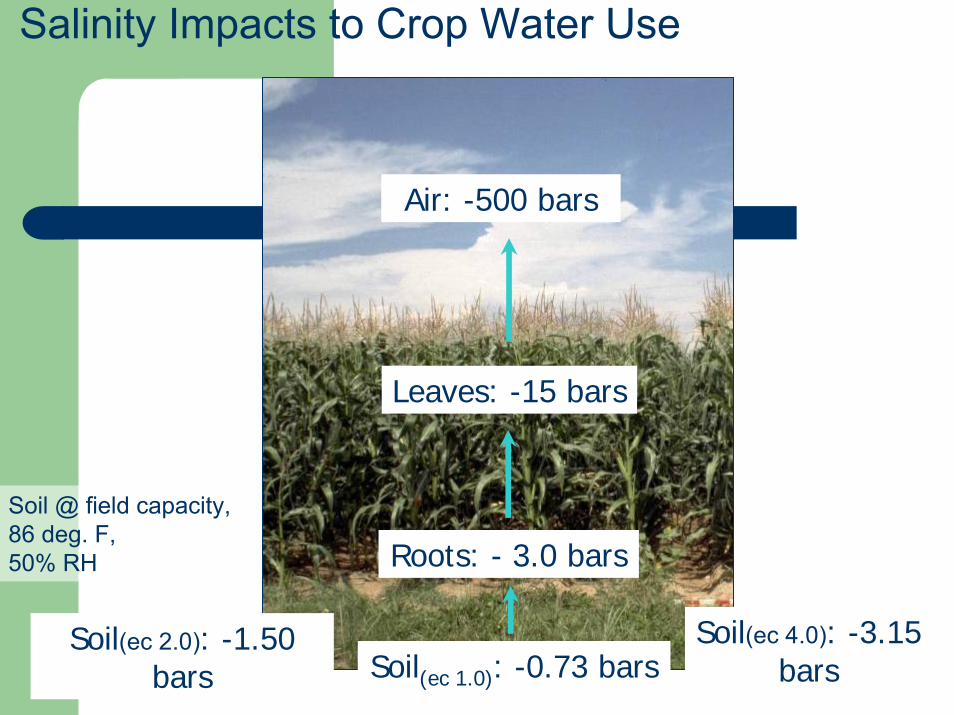
Salinity Impacts to Crop Water Use
Soil(ec 1.0): -0.73 bars
Roots: - 3.0 bars
Leaves: -15 bars
Air: -500 bars
Soil @ field capacity, 86 deg. F, 50% RH
Soil(ec 4.0): -3.15 bars
Soil(ec 2.0): -1.50 bars
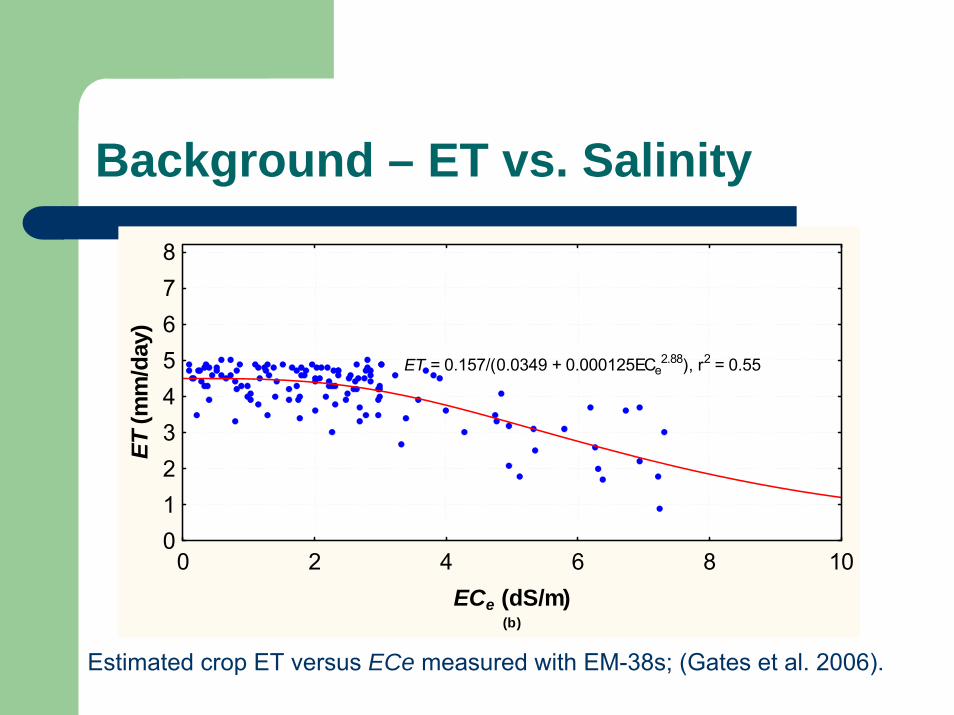
Background – ET vs. Salinity
0 2 4 6 8 10ECe (dS/m)
(b)
012345678
ET (m
m/d
ay)
ET = 0.157/(0.0349 + 0.000125ECe2.88), r2 = 0.55
Estimated crop ET versus ECe measured with EM-38s; (Gates et al. 2006).
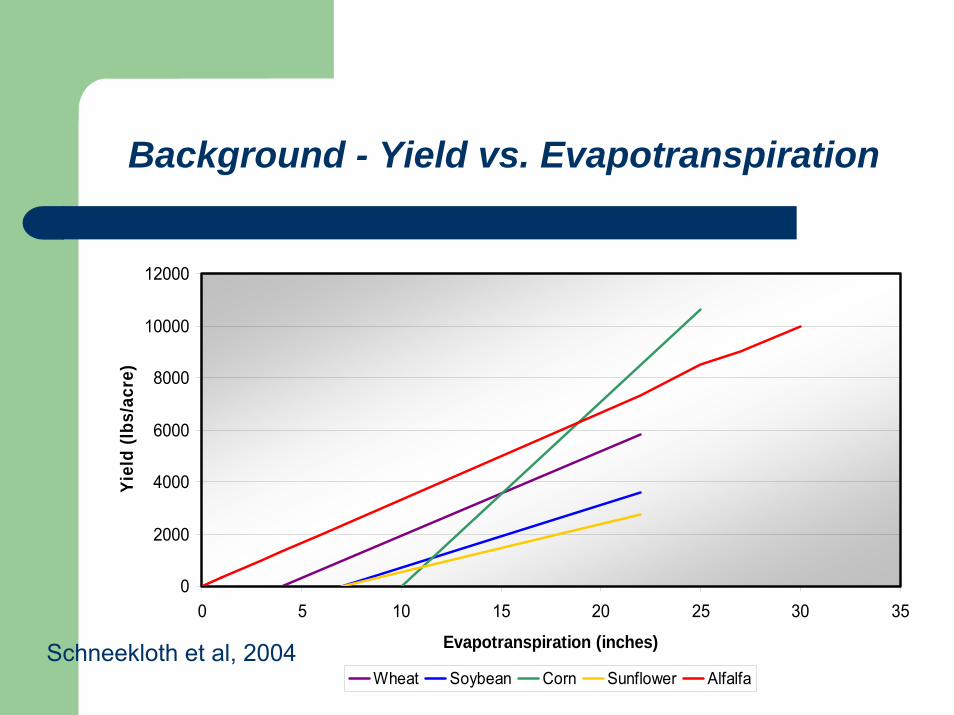
Background - Yield vs. Evapotranspiration
0
2000
4000
6000
8000
10000
12000
0 5 10 15 20 25 30 35
Evapotranspiration (inches)
Yiel
d (lb
s/ac
re)
Wheat Soybean Corn Sunflower AlfalfaSchneekloth et al, 2004
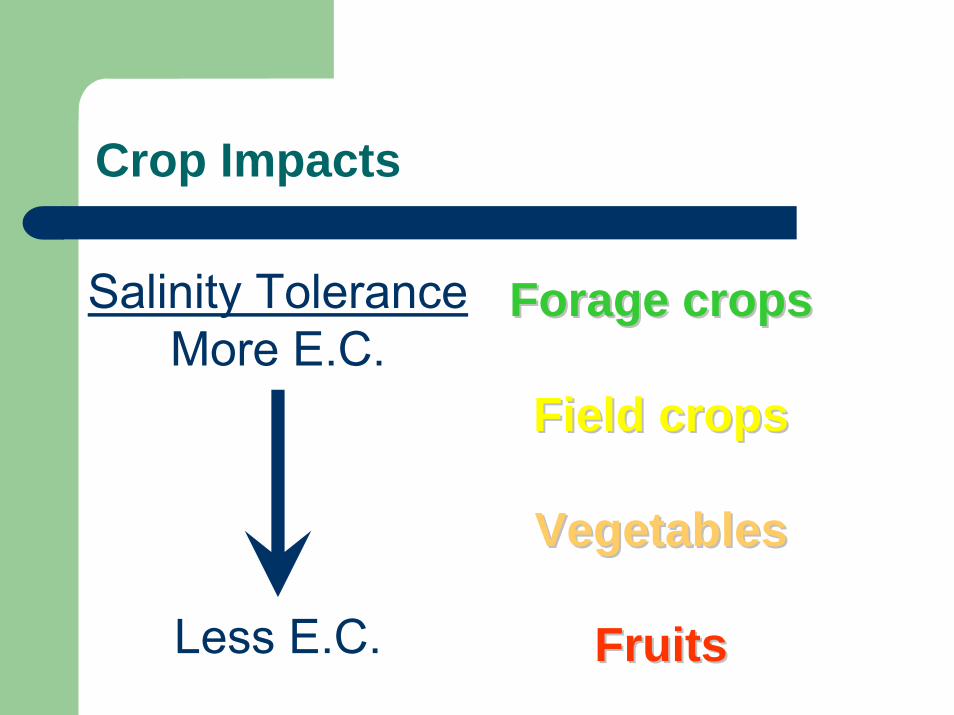
Crop Impacts
Forage cropsForage crops
Field cropsField crops
VegetablesVegetables
FruitsFruits
Salinity ToleranceMore E.C.
Less E.C.
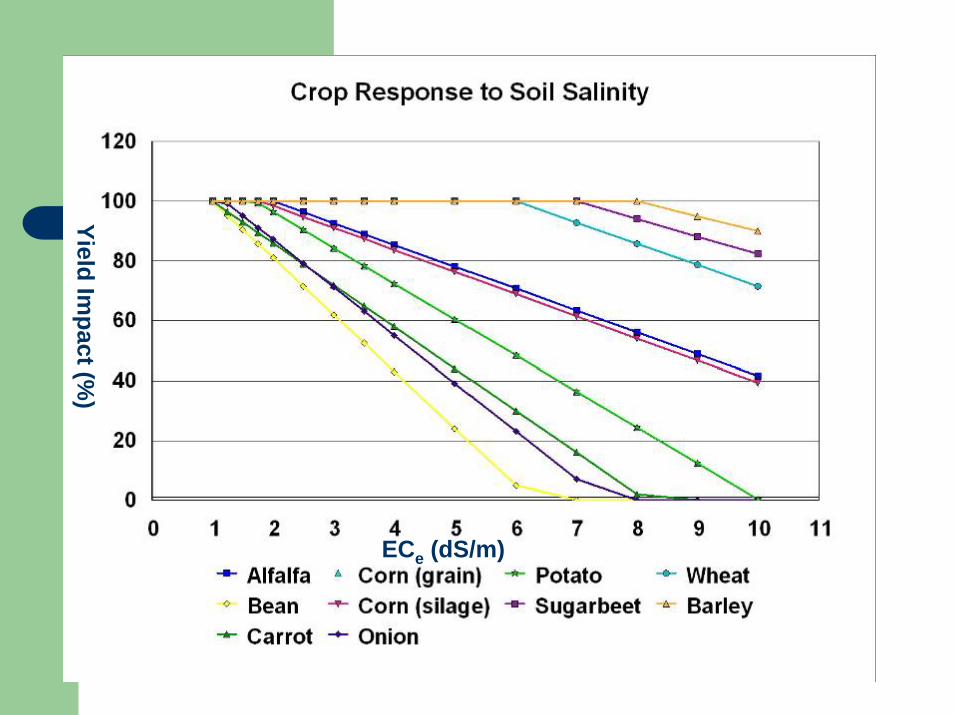
ECe (dS/m)
Yield Impact (%
)
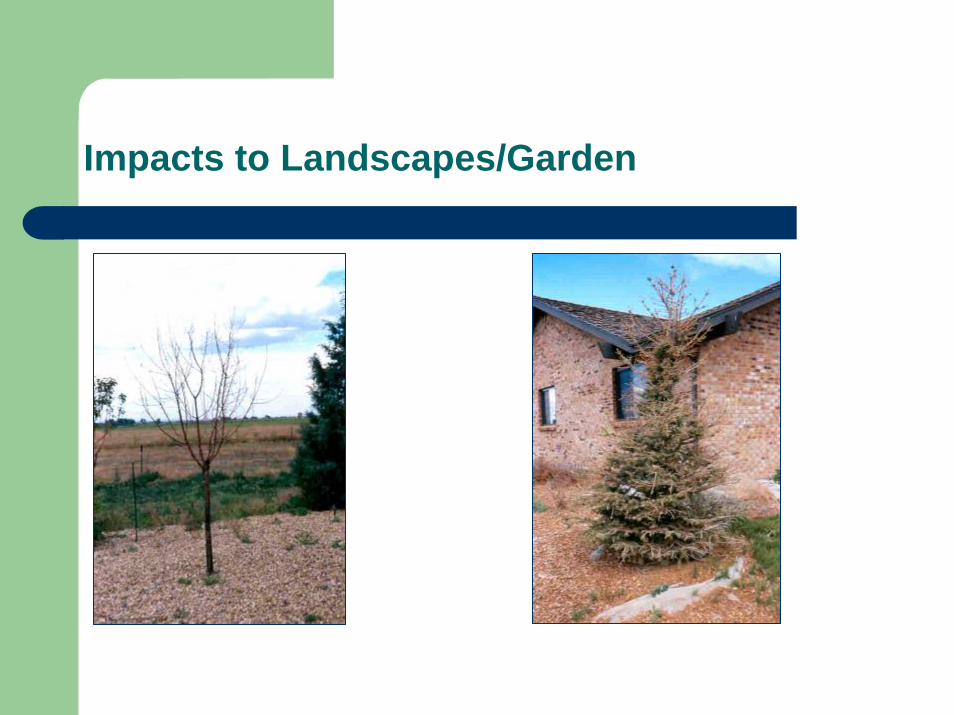
Impacts to Landscapes/Garden
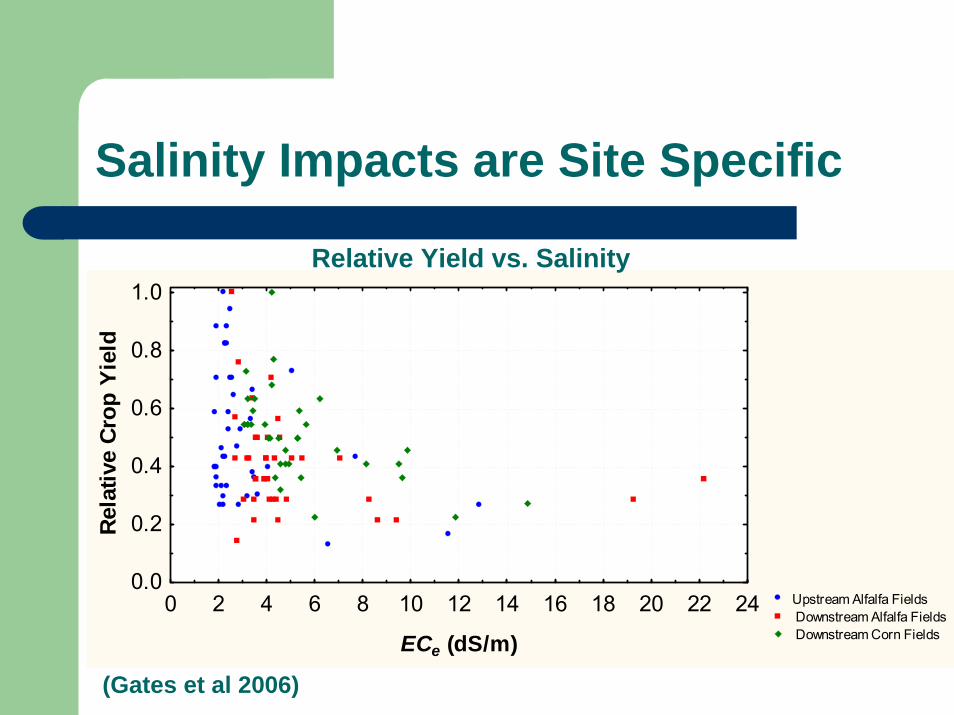
Salinity Impacts are Site Specific
Upstream Alfalfa Fields Downstream Alfalfa Fields Downstream Corn Fields
0 2 4 6 8 10 12 14 16 18 20 22 24
ECe (dS/m)
0.0
0.2
0.4
0.6
0.8
1.0
Rela
tive
Crop
Yie
ld
Relative Yield vs. Salinity
(Gates et al 2006)
Irrigation Water Quality – Specific Ion Concerns and Toxicities
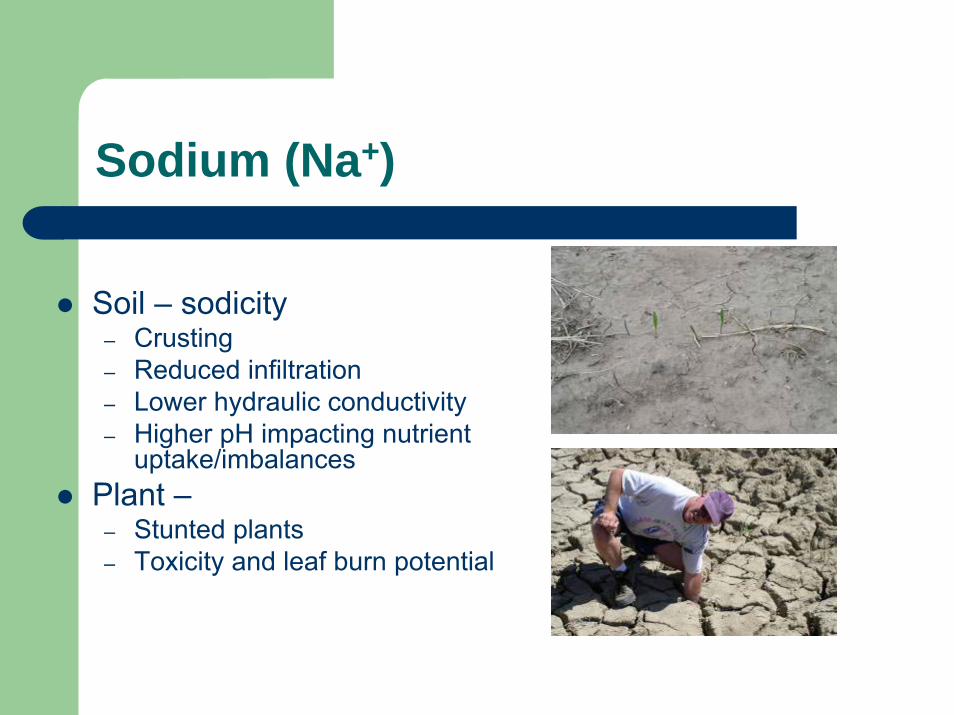
Sodium (Na+)
Soil – sodicity– Crusting– Reduced infiltration– Lower hydraulic conductivity– Higher pH impacting nutrient
uptake/imbalancesPlant –
– Stunted plants– Toxicity and leaf burn potential
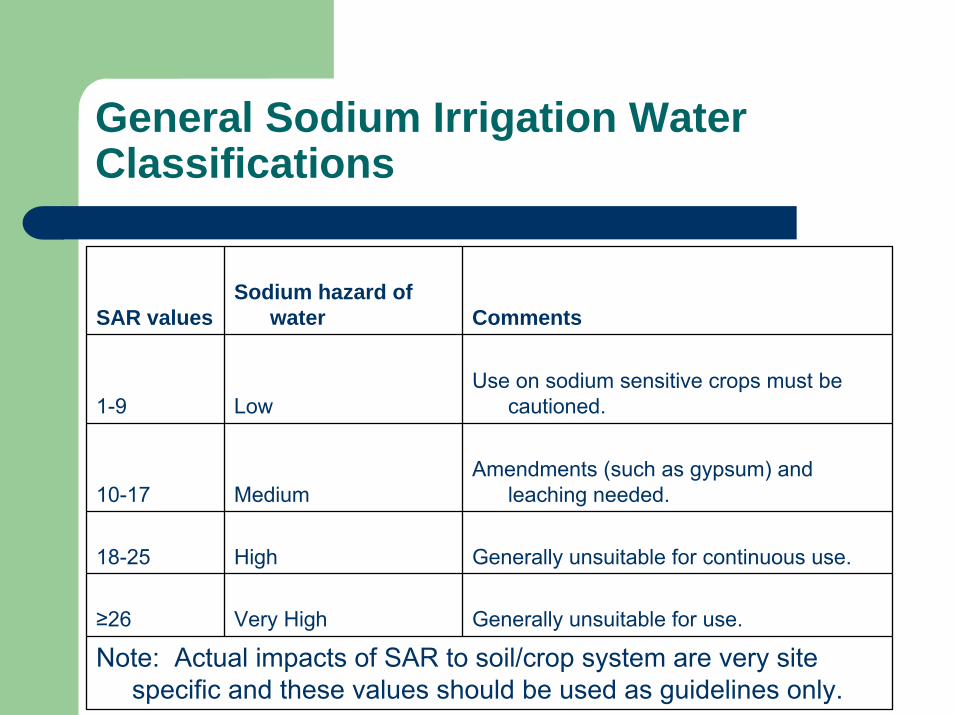
General Sodium Irrigation Water Classifications
SAR valuesSodium hazard of
water Comments
1-9 LowUse on sodium sensitive crops must be
cautioned.
10-17 MediumAmendments (such as gypsum) and
leaching needed.
18-25 High Generally unsuitable for continuous use.
≥26 Very High Generally unsuitable for use.
Note: Actual impacts of SAR to soil/crop system are very site specific and these values should be used as guidelines only.
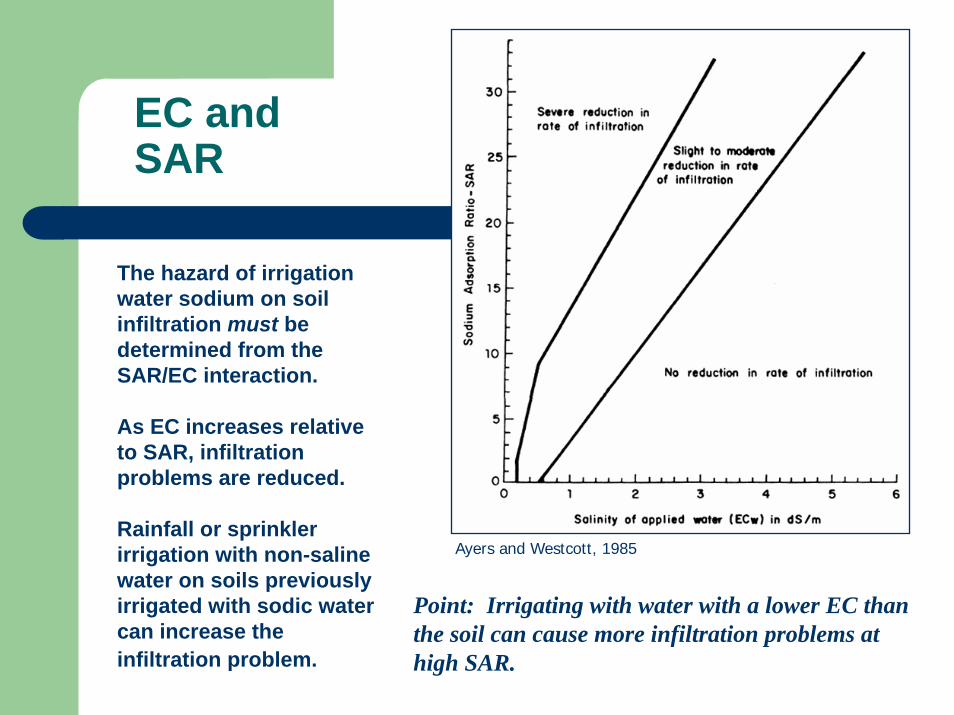
EC and SAR
The hazard of irrigation water sodium on soil infiltration must be determined from the SAR/EC interaction.
As EC increases relative to SAR, infiltration problems are reduced.
Rainfall or sprinkler irrigation with non-saline water on soils previously irrigated with sodic water can increase the infiltration problem.
Ayers and Westcott, 1985
Point: Irrigating with water with a lower EC than the soil can cause more infiltration problems at high SAR.
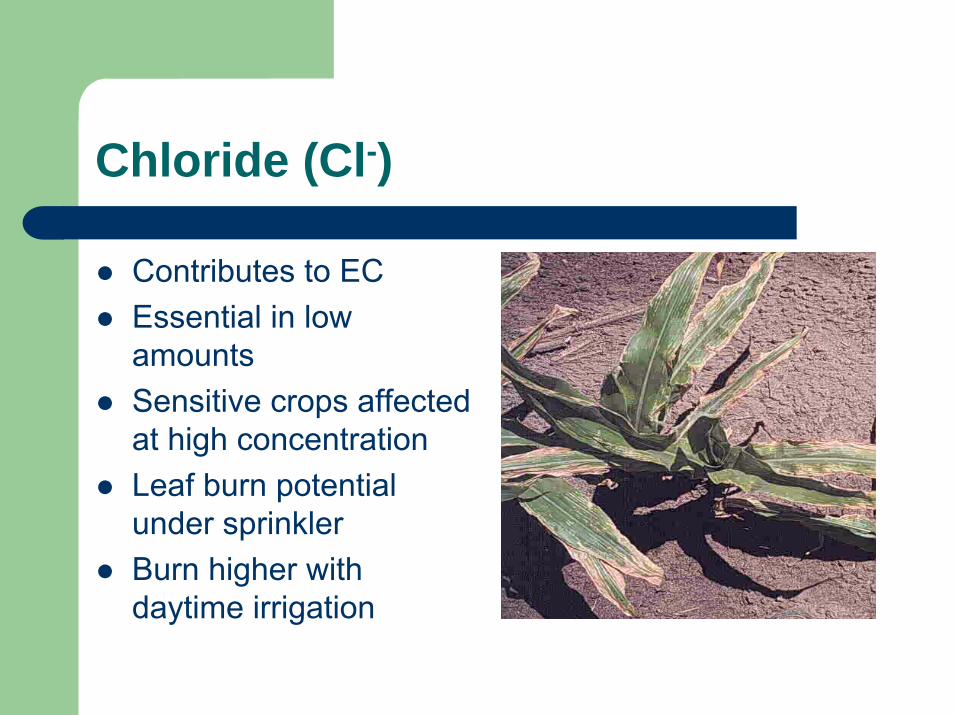
Chloride (Cl-)
Contributes to ECEssential in low amountsSensitive crops affected at high concentrationLeaf burn potential under sprinklerBurn higher with daytime irrigation
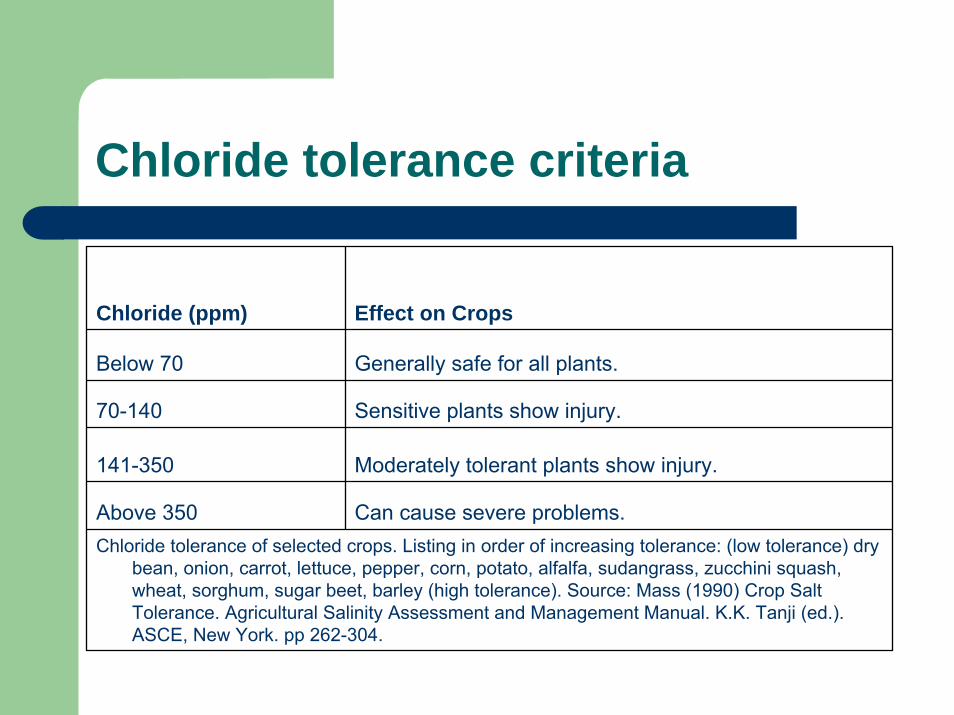
Chloride tolerance criteria
Chloride (ppm) Effect on Crops
Below 70 Generally safe for all plants.
70-140 Sensitive plants show injury.
141-350 Moderately tolerant plants show injury.
Above 350 Can cause severe problems.Chloride tolerance of selected crops. Listing in order of increasing tolerance: (low tolerance) dry
bean, onion, carrot, lettuce, pepper, corn, potato, alfalfa, sudangrass, zucchini squash, wheat, sorghum, sugar beet, barley (high tolerance). Source: Mass (1990) Crop Salt Tolerance. Agricultural Salinity Assessment and Management Manual. K.K. Tanji (ed.). ASCE, New York. pp 262-304.
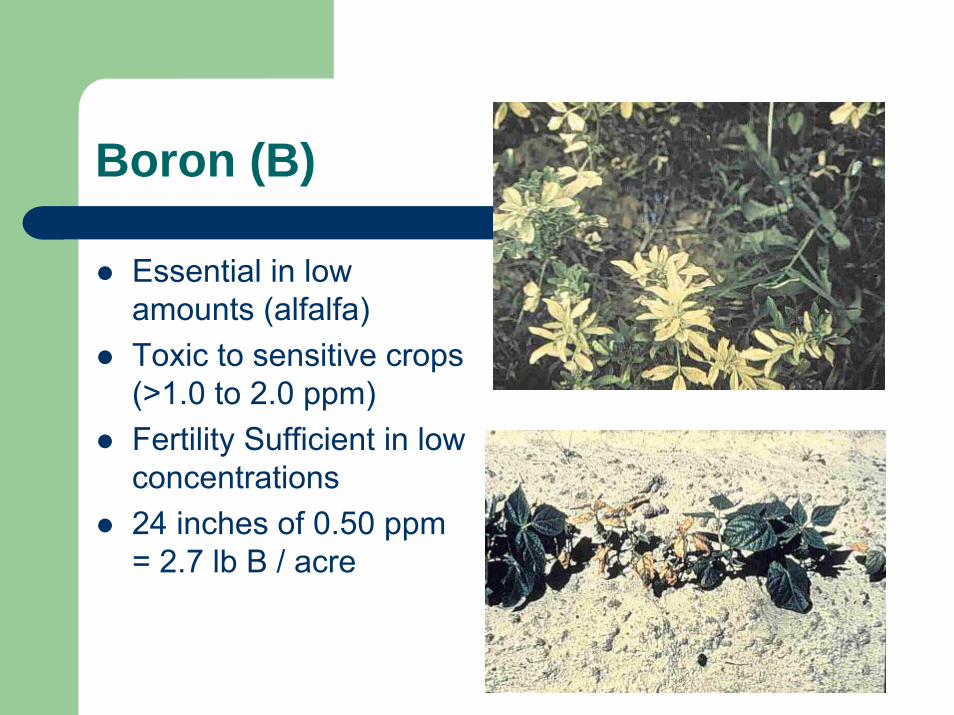
Boron (B)
Essential in low amounts (alfalfa)Toxic to sensitive crops (>1.0 to 2.0 ppm)Fertility Sufficient in low concentrations24 inches of 0.50 ppm= 2.7 lb B / acre
pH, Carbonate, and bicarbonate (alkalinity)
pH > 8.5High HCO3
- cause Ca2+
& Mg2+ to form insoluble minerals leaving Na.Will exacerbate sodicsoil conditions
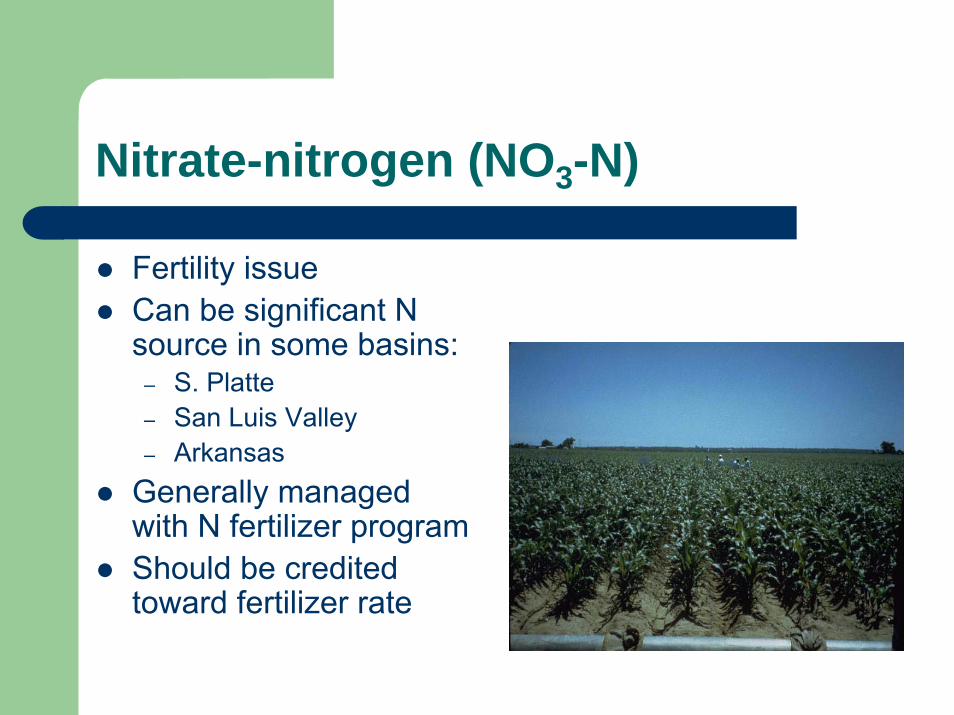
Nitrate-nitrogen (NO3-N)
Fertility issueCan be significant N source in some basins:
– S. Platte– San Luis Valley– Arkansas
Generally managed with N fertilizer programShould be credited toward fertilizer rate
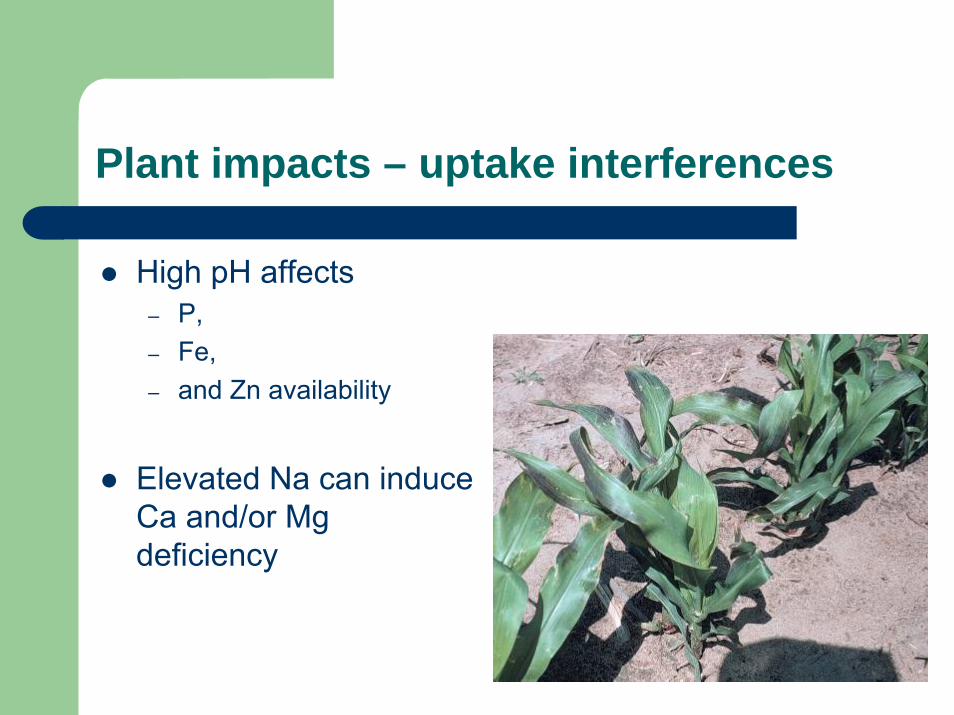
Plant impacts – uptake interferences
High pH affects – P, – Fe, – and Zn availability
Elevated Na can induce Ca and/or Mg deficiency
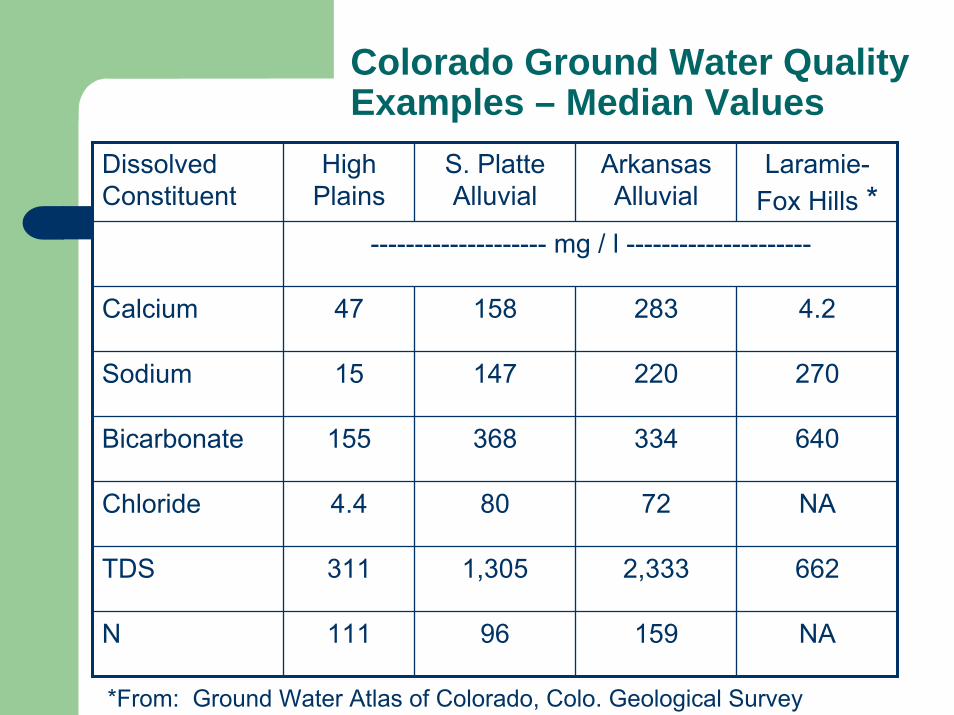
Colorado Ground Water Quality Examples – Median Values
Dissolved Constituent
High Plains
S. Platte Alluvial
Arkansas Alluvial
Laramie-Fox Hills *
-------------------- mg / l ---------------------
TDS 311 1,305 2,333 662
Calcium 47 158 283 4.2
Sodium 15 147 220 270
Bicarbonate 155 368 334 640
Chloride 4.4 80 72 NA
N 111 96 159 NA
*From: Ground Water Atlas of Colorado, Colo. Geological Survey
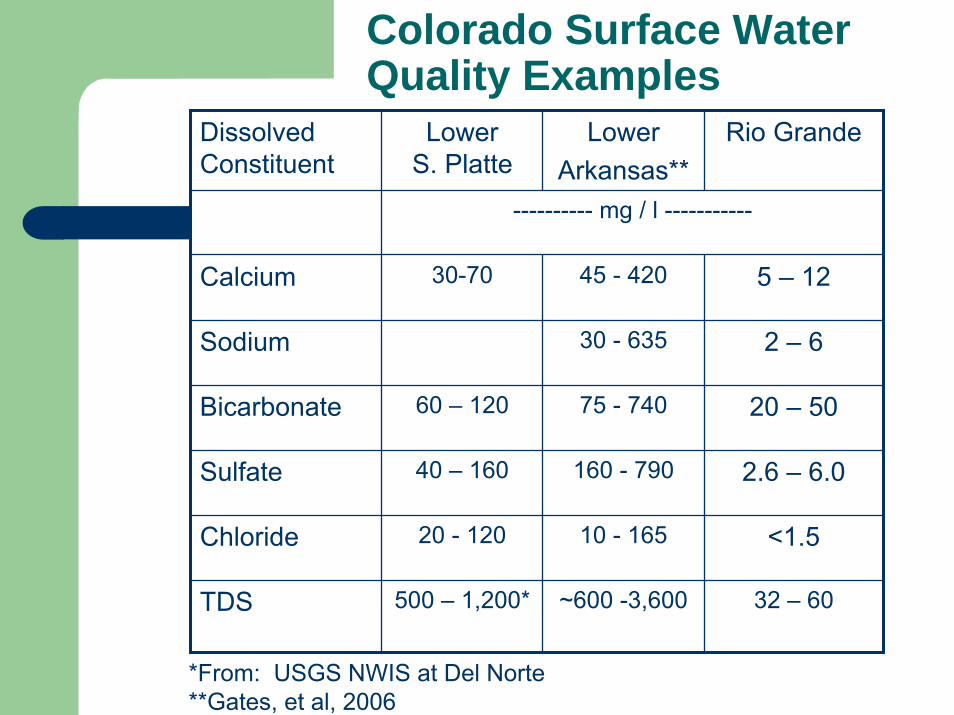
Colorado Surface Water Quality Examples
Dissolved Constituent
Lower S. Platte
LowerArkansas**
Rio Grande
---------- mg / l -----------
Calcium 30-70 45 - 420 5 – 12
Sodium 30 - 635 2 – 6
Bicarbonate 60 – 120 75 - 740 20 – 50
Sulfate 40 – 160 160 - 790 2.6 – 6.0
Chloride 20 - 120 10 - 165 <1.5
TDS 500 – 1,200* ~600 -3,600 32 – 60
*From: USGS NWIS at Del Norte**Gates, et al, 2006
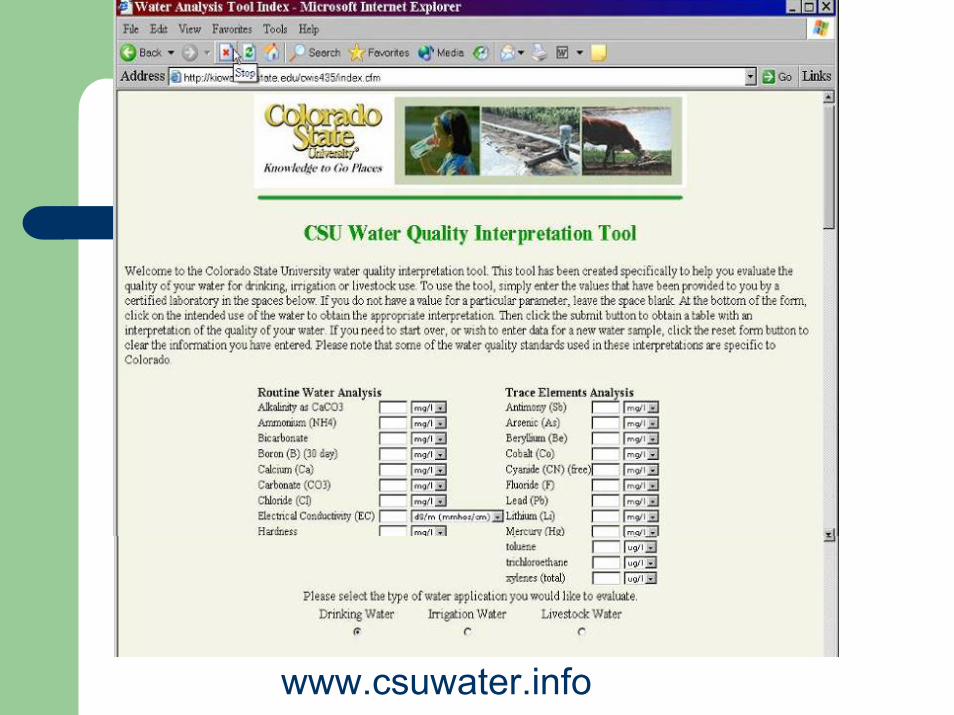
www.csuwater.info
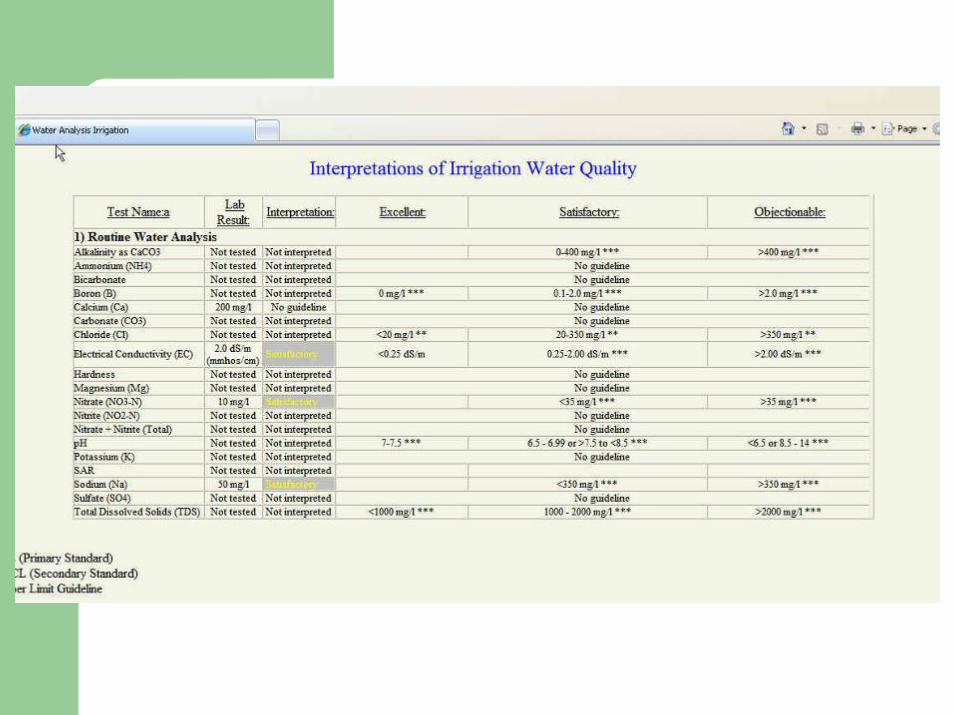
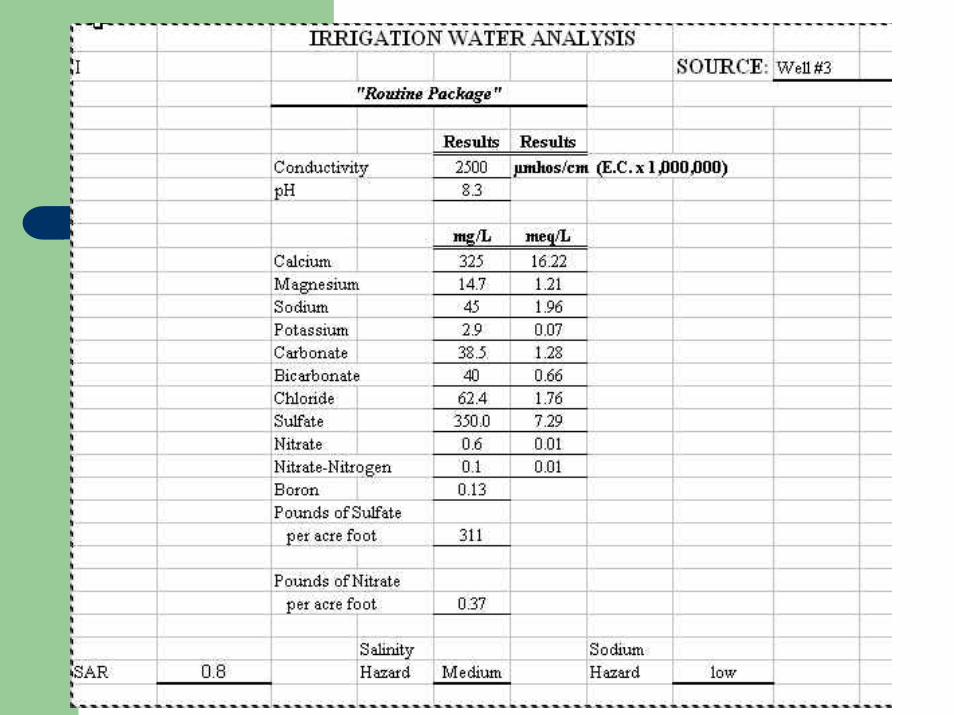
Example Water Report 2
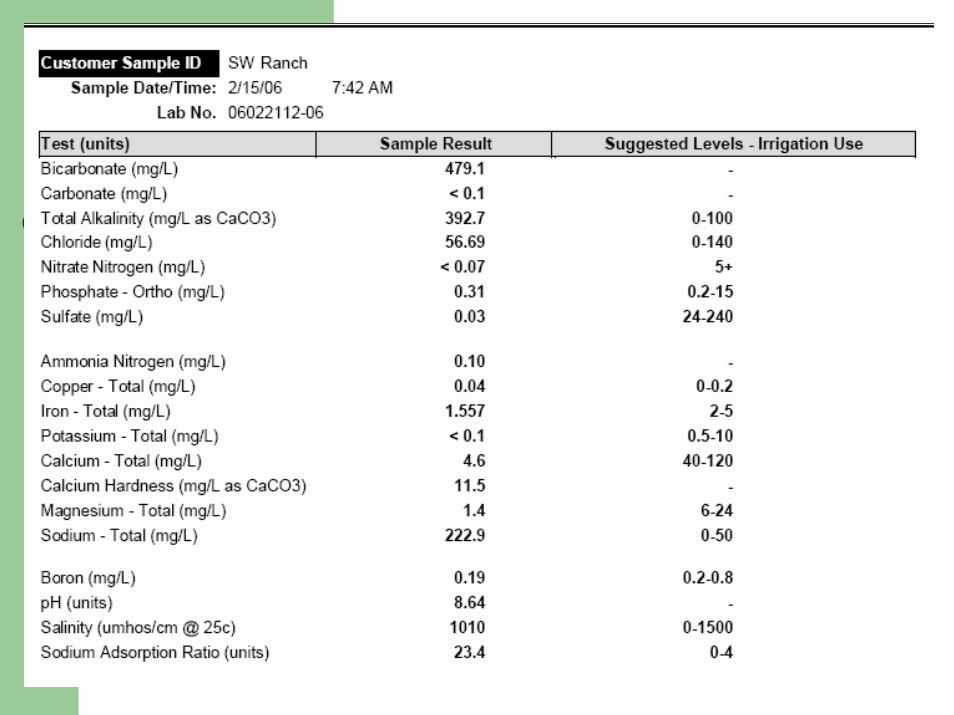
Example Water Report
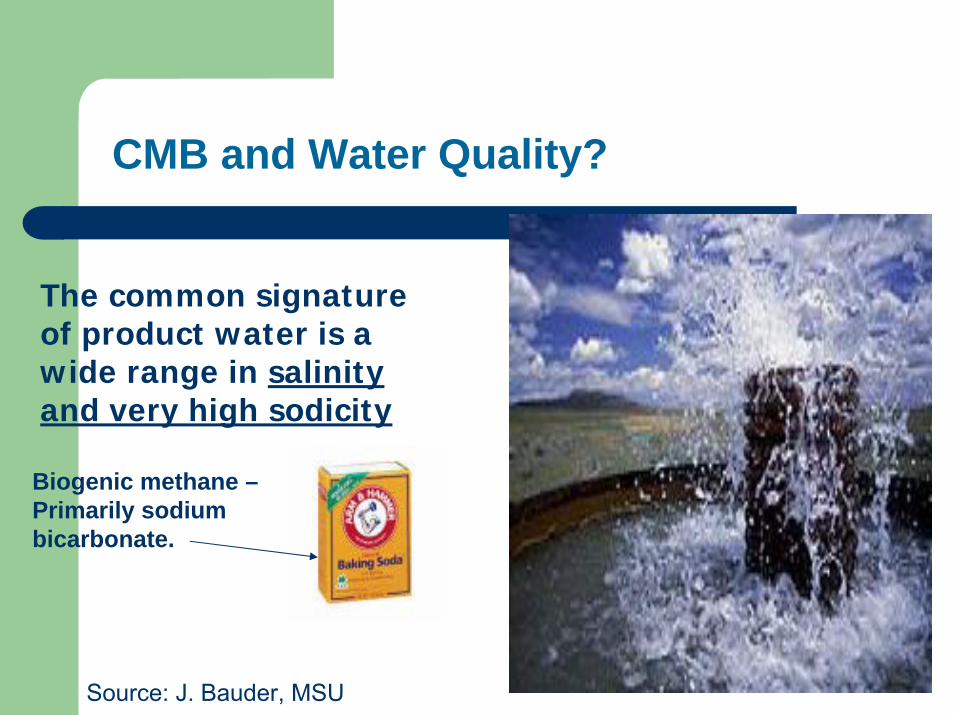
The common signature of product water is a wide range in salinity and very high sodicity
CMB and Water Quality?
Biogenic methane –Primarily sodium bicarbonate.
Source: J. Bauder, MSU
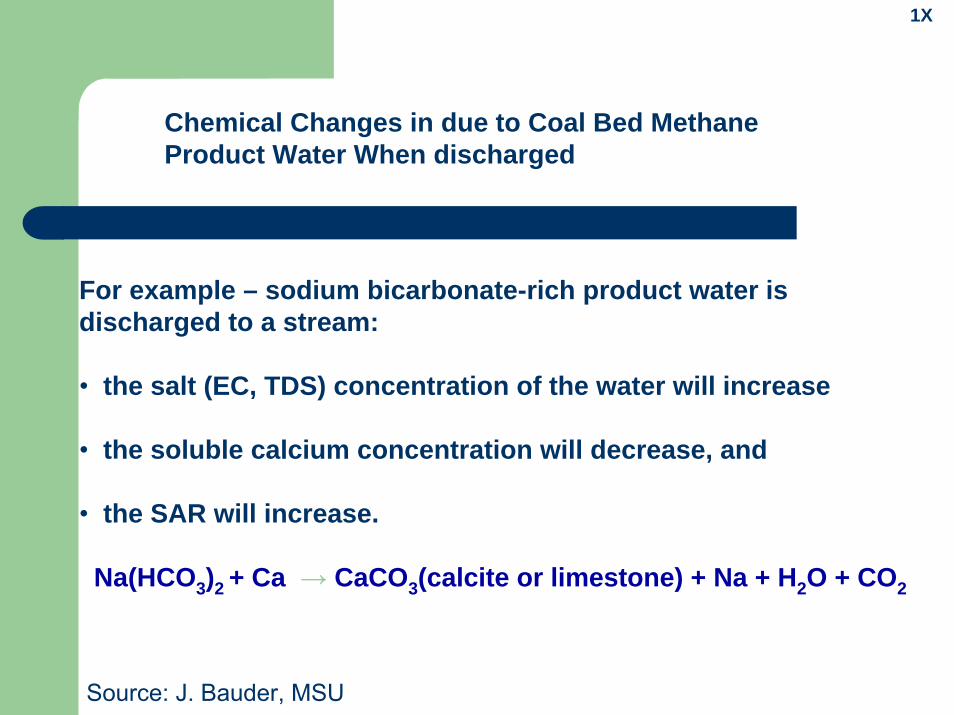
Chemical Changes in due to Coal Bed Methane Product Water When discharged
For example – sodium bicarbonate-rich product water is discharged to a stream:
• the salt (EC, TDS) concentration of the water will increase
• the soluble calcium concentration will decrease, and
• the SAR will increase.
Na(HCO3)2 + Ca → CaCO3(calcite or limestone) + Na + H2O + CO2
1X
Source: J. Bauder, MSU
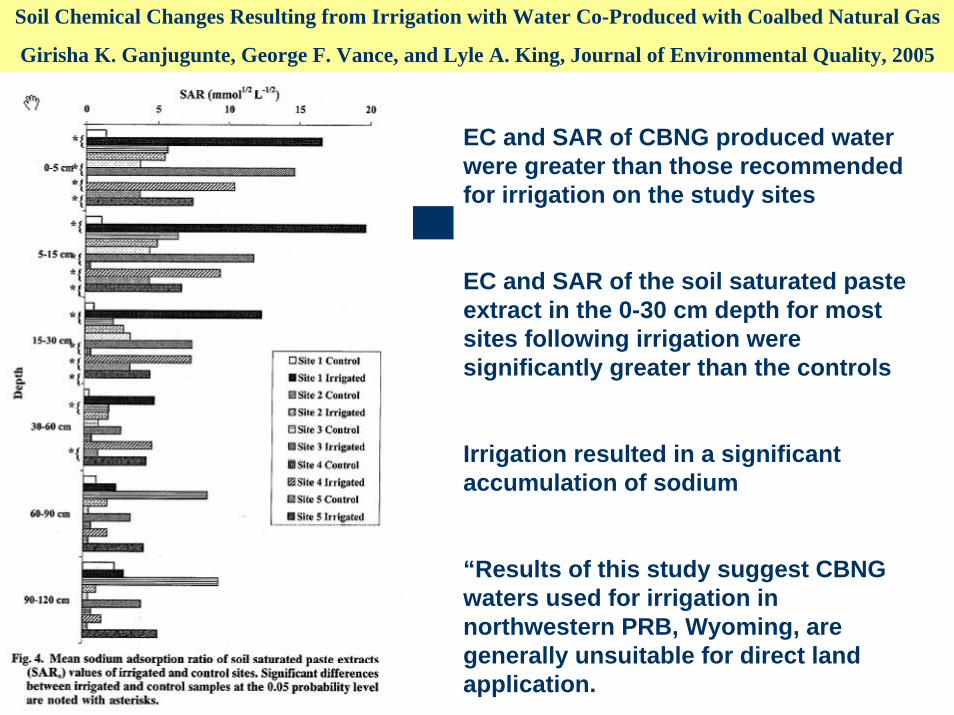
EC and SAR of CBNG produced water were greater than those recommended for irrigation on the study sites
EC and SAR of the soil saturated paste extract in the 0-30 cm depth for most sites following irrigation were significantly greater than the controls
Irrigation resulted in a significant accumulation of sodium
“Results of this study suggest CBNG waters used for irrigation in northwestern PRB, Wyoming, are generally unsuitable for direct land application.
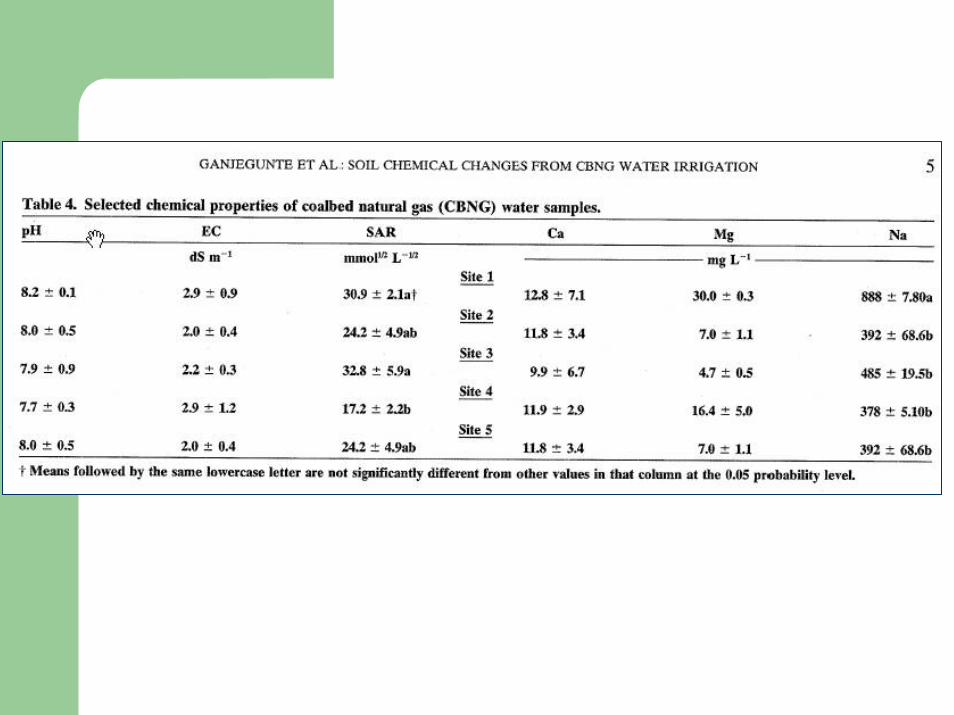
Soil Chemical Changes Resulting from Irrigation with Water Co-Produced with Coalbed Natural Gas
Girisha K. Ganjugunte, George F. Vance, and Lyle A. King, Journal of Environmental Quality, 2005
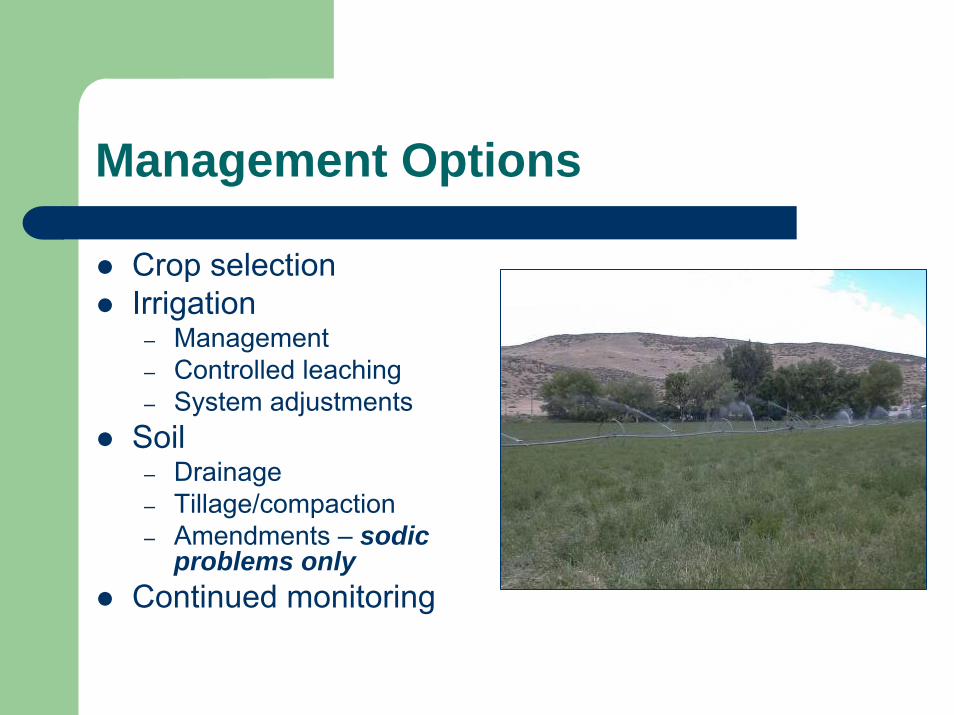
Management Options
Crop selectionIrrigation
– Management– Controlled leaching– System adjustments
Soil– Drainage– Tillage/compaction– Amendments – sodic
problems onlyContinued monitoring
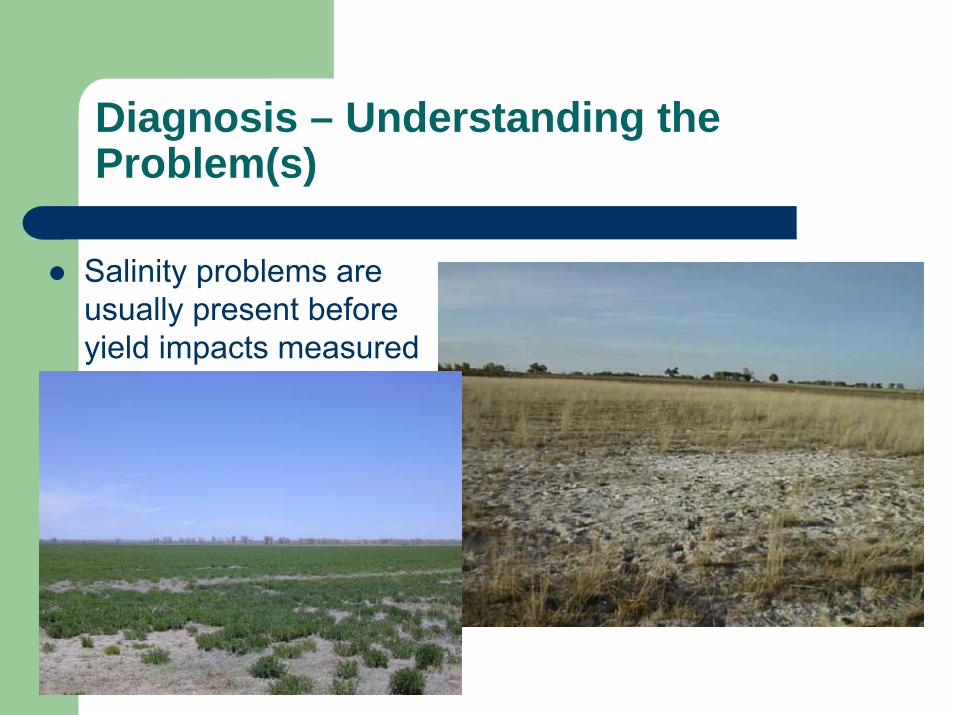
Diagnosis – Understanding the Problem(s)
Salinity problems are usually present before yield impacts measured
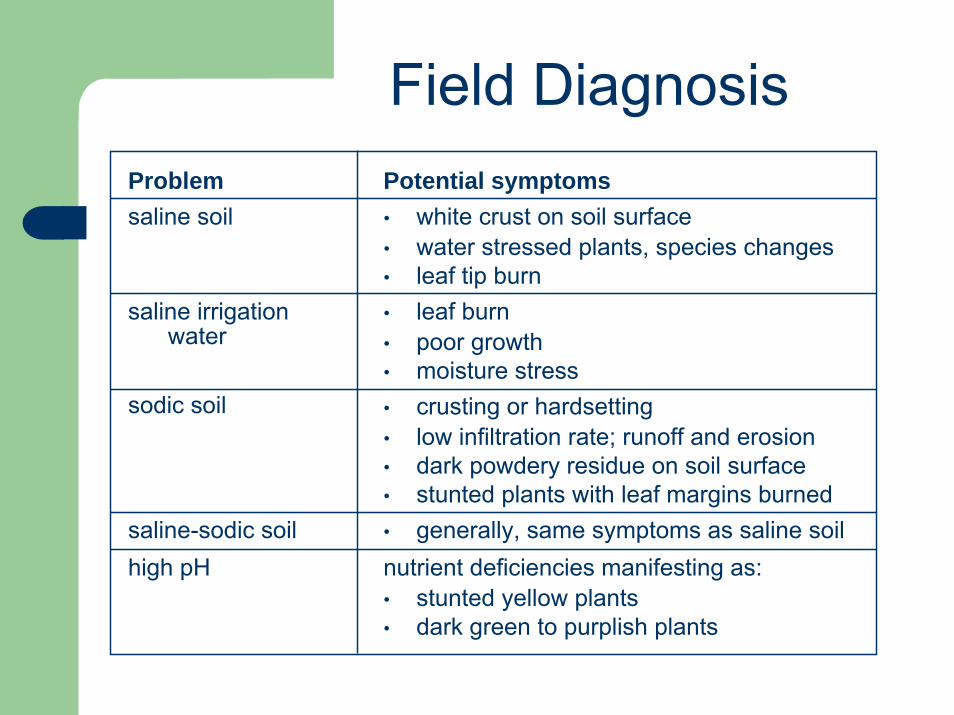
Field DiagnosisPotential symptoms• white crust on soil surface• water stressed plants, species changes• leaf tip burn• leaf burn• poor growth• moisture stress• crusting or hardsetting• low infiltration rate; runoff and erosion• dark powdery residue on soil surface• stunted plants with leaf margins burned• generally, same symptoms as saline soilnutrient deficiencies manifesting as: • stunted yellow plants• dark green to purplish plants
Problemsaline soil
saline irrigationwater
sodic soil
saline-sodic soilhigh pH
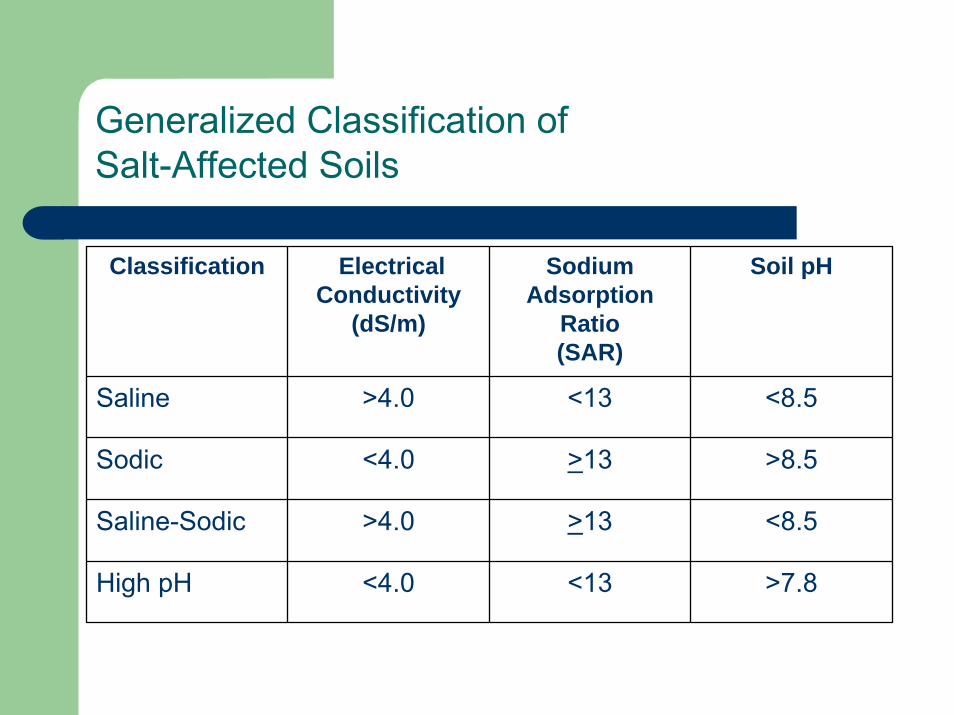
Generalized Classification of Salt-Affected Soils
Classification ElectricalConductivity
(dS/m)
Sodium Adsorption
Ratio (SAR)
Soil pH
Saline >4.0 <13 <8.5
Sodic <4.0 >13 >8.5
Saline-Sodic >4.0 >13 <8.5
High pH <4.0 <13 >7.8
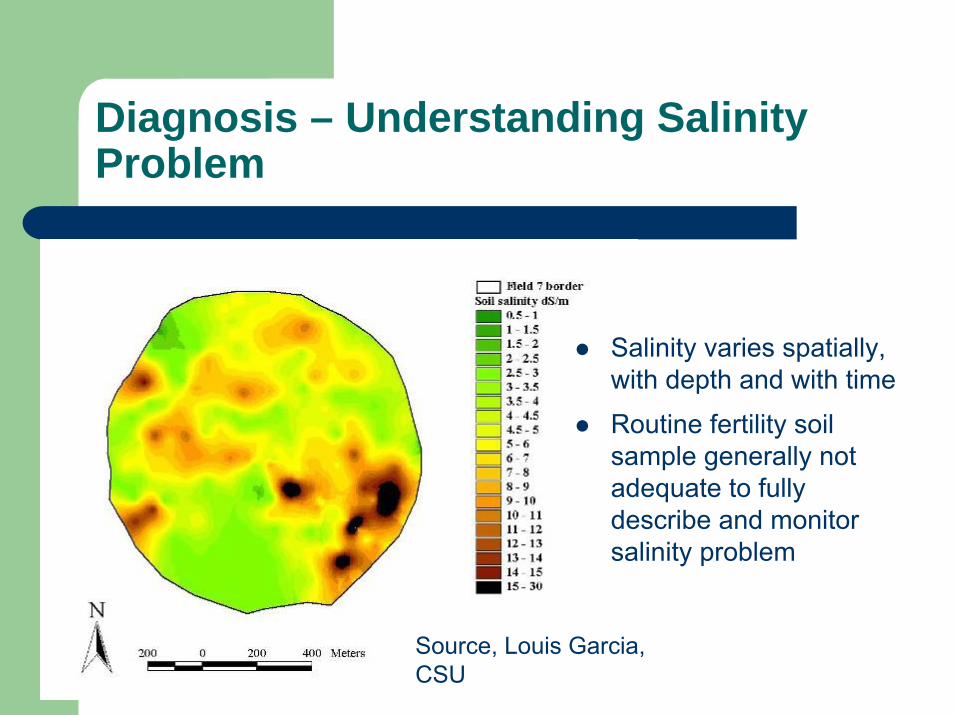
Diagnosis – Understanding Salinity Problem
Source, Louis Garcia, CSU
Salinity varies spatially, with depth and with time
Routine fertility soil sample generally not adequate to fully describe and monitor salinity problem
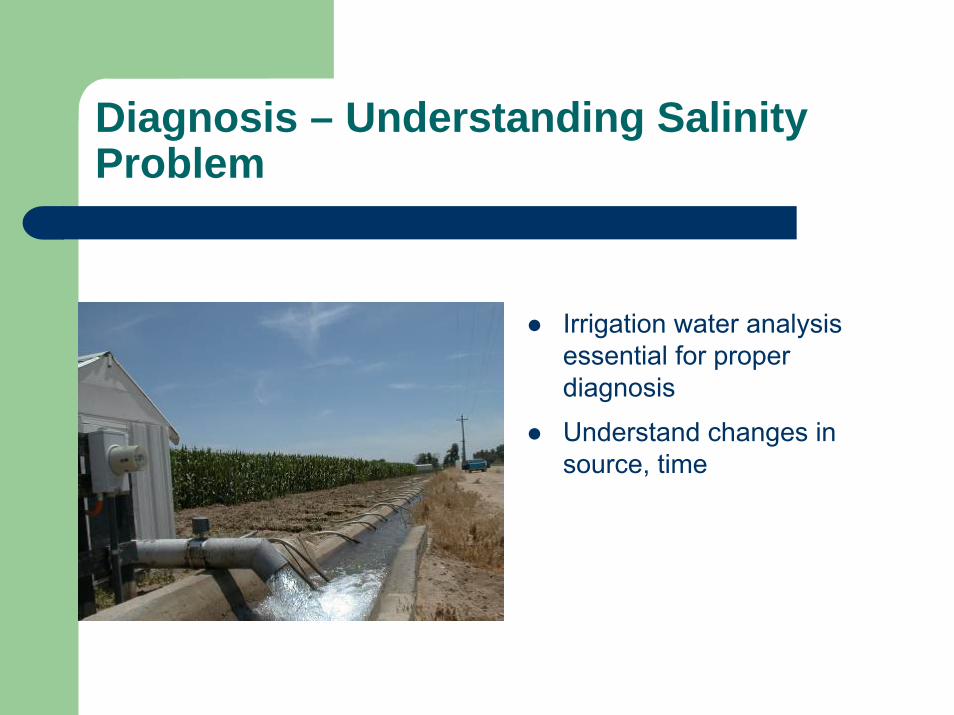
Diagnosis – Understanding Salinity Problem
Irrigation water analysis essential for proper diagnosis
Understand changes in source, time
Summary
Most Colorado irrigation water contains some level of saltConcentration and type of salt should direct management adjustmentsUsing saline/sodic irrigation water can decrease productivity and crop choicesUsing saline/sodic water will increase cost of production for most cropping systemsSalinity/sodicity impacts are site specific


