Monitoring the water content of your soil will help you decide how much water to apply and when to apply it. Soil water sensors can give the informa-tion you need to:
• optimize production
• conserve water
• reduce environmental impacts
• save money
Monitoring the soil’s moisture will help you schedule irrigation in order to avoid applying too little or too much water; which under irrigation will reduce crop yields. Overirrigation can also:
• increase water and energy costs
• leach fertilizers below the root zone
• erode soil
• move soil particles and chemicals to drainage ditches
• result in unnecessary labor costs
By understanding basic soil water concepts, the strengths and weaknesses of different types of soil water sensors, and methods of installing them, you can irrigate crops more efficiently, improve water conservation, and make your farm more profitable.
* AssociateProfessorandExtensionAgriculturalEngineeringSpecialist,AssociateProfessorandExtensionAgriculturalEngineeringSpecialist,andExtensionAssociate,respectively,TheTexasA&MUniversitySys-tem;ResearchSoilScientist,USDA–ARSConservationandProductionResearchLaboratory,Bushland,TX;ResearchSoilScientist,ExtensionIrrigationSpecialist,WashingtonStateUniversity;IrrigatedAgricultureResearchandExtensionCenter,Prosser,WA
Juan M. Enciso, Dana Porter, Steven R. Evett, Xavier Périès, and Troy Peters*
E-61808/12
IrrigationMonitoring with
Soil Water Sensors
2
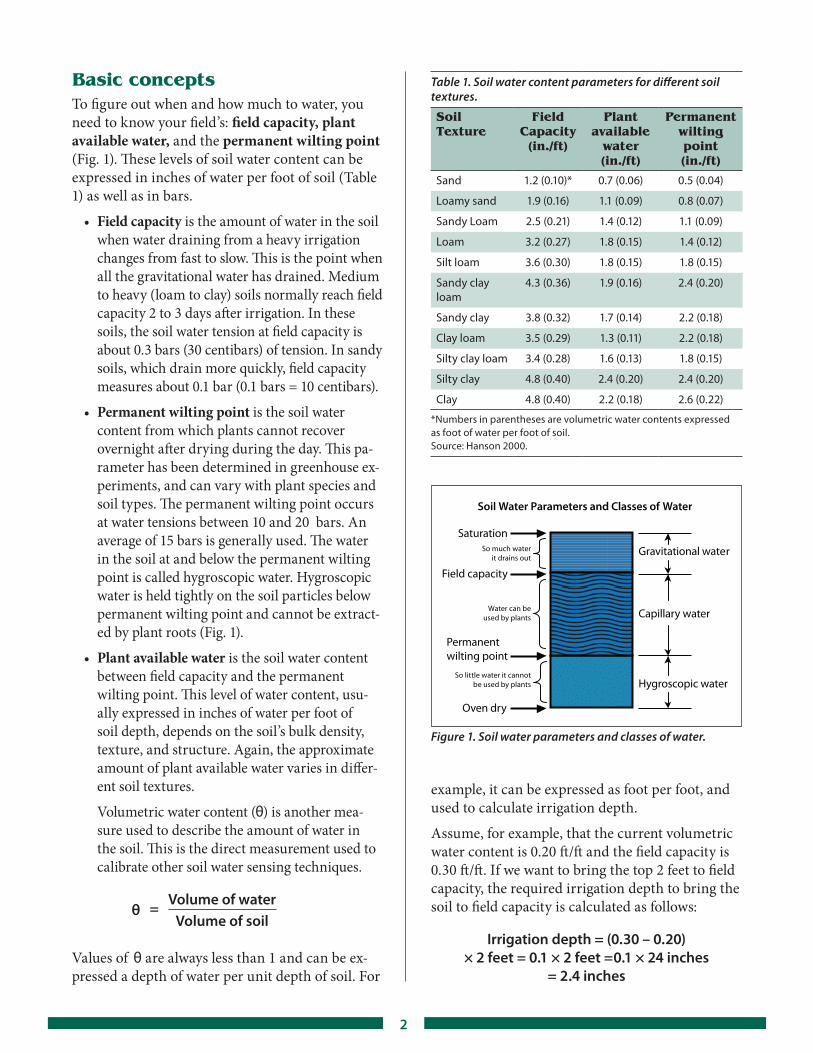
Basic conceptsTo figure out when and how much to water, you need to know your field’s: field capacity, plant available water, and the permanent wilting point (Fig. 1). These levels of soil water content can be expressed in inches of water per foot of soil (Table 1) as well as in bars.
• Field capacity is the amount of water in the soil when water draining from a heavy irrigation changes from fast to slow. This is the point when all the gravitational water has drained. Medium to heavy (loam to clay) soils normally reach field capacity 2 to 3 days after irrigation. In these soils, the soil water tension at field capacity is about 0.3 bars (30 centibars) of tension. In sandy soils, which drain more quickly, field capacity measures about 0.1 bar (0.1 bars = 10 centibars).
• Permanent wilting point is the soil water content from which plants cannot recover overnight after drying during the day. This pa-rameter has been determined in greenhouse ex-periments, and can vary with plant species and soil types. The permanent wilting point occurs at water tensions between 10 and 20 bars. An average of 15 bars is generally used. The water in the soil at and below the permanent wilting point is called hygroscopic water. Hygroscopic water is held tightly on the soil particles below permanent wilting point and cannot be extract-ed by plant roots (Fig. 1).
• Plant available water is the soil water content between field capacity and the permanent wilting point. This level of water content, usu-ally expressed in inches of water per foot of soil depth, depends on the soil’s bulk density, texture, and structure. Again, the approximate amount of plant available water varies in differ-ent soil textures.
Volumetric water content (θ) is another mea-sure used to describe the amount of water in the soil. This is the direct measurement used to calibrate other soil water sensing techniques.
θ = Volume of water
Volume of soil
Values of θ are always less than 1 and can be ex-pressed a depth of water per unit depth of soil. For
Table 1. Soil water content parameters for different soil textures.
Soil Texture
Field Capacity(in./ft)
Plant available
water(in./ft)
Permanent wilting point (in./ft)
Sand 1.2(0.10)* 0.7(0.06) 0.5(0.04)
Loamysand 1.9(0.16) 1.1(0.09) 0.8(0.07)
SandyLoam 2.5(0.21) 1.4(0.12) 1.1(0.09)
Loam 3.2(0.27) 1.8(0.15) 1.4(0.12)
Siltloam 3.6(0.30) 1.8(0.15) 1.8(0.15)
Sandyclayloam
4.3(0.36) 1.9(0.16) 2.4(0.20)
Sandyclay 3.8(0.32) 1.7(0.14) 2.2(0.18)
Clayloam 3.5(0.29) 1.3(0.11) 2.2(0.18)
Siltyclayloam 3.4(0.28) 1.6(0.13) 1.8(0.15)
Siltyclay 4.8(0.40) 2.4(0.20) 2.4(0.20)
Clay 4.8(0.40) 2.2(0.18) 2.6(0.22)
*Numbersinparenthesesarevolumetricwatercontentsexpressedasfootofwaterperfootofsoil.Source:Hanson2000.
example, it can be expressed as foot per foot, and used to calculate irrigation depth.
Assume, for example, that the current volumetric water content is 0.20 ft/ft and the field capacity is 0.30 ft/ft. If we want to bring the top 2 feet to field capacity, the required irrigation depth to bring the soil to field capacity is calculated as follows:
Irrigation depth = (0.30 – 0.20) × 2 feet = 0.1 × 2 feet =0.1 × 24 inches
= 2.4 inches
Soil Water Parameters and Classes of Water
Saturation
Permanentwilting point
Field capacity
Oven dry
Water can beused by plants
So little water it cannotbe used by plants
Gravitational water
Hygroscopic water
Capillary water
So much waterit drains out
Figure 1. Soil water parameters and classes of water.
3
If we want to know how much water the soil con-tains at 0.20 ft/ft plant available soil water, the avail-able water depth can be calculated accordingly:
Water depth = 0.20 × 2 feet = 0.20 × 24 inches = 4.8 inches
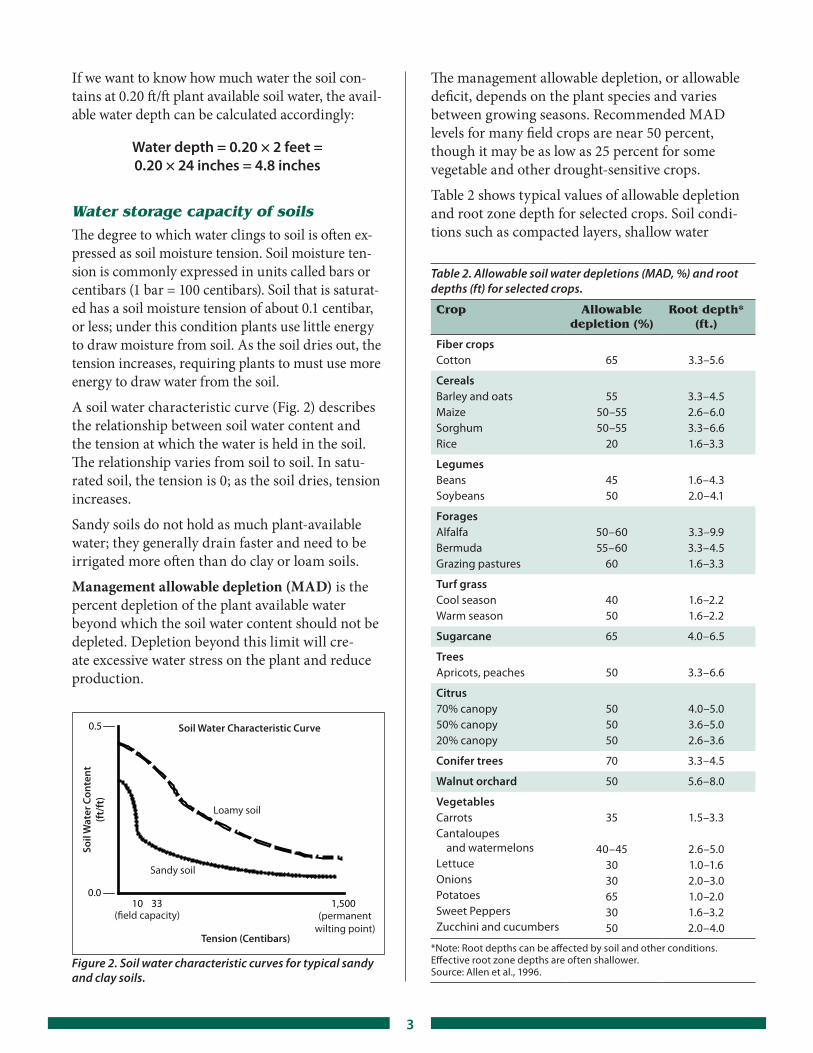
Water storage capacity of soilsThe degree to which water clings to soil is often ex-pressed as soil moisture tension. Soil moisture ten-sion is commonly expressed in units called bars or centibars (1 bar = 100 centibars). Soil that is saturat-ed has a soil moisture tension of about 0.1 centibar, or less; under this condition plants use little energy to draw moisture from soil. As the soil dries out, the tension increases, requiring plants to must use more energy to draw water from the soil.
A soil water characteristic curve (Fig. 2) describes the relationship between soil water content and the tension at which the water is held in the soil. The relationship varies from soil to soil. In satu-rated soil, the tension is 0; as the soil dries, tension increases.
Sandy soils do not hold as much plant-available water; they generally drain faster and need to be irrigated more often than do clay or loam soils.
Management allowable depletion (MAD) is the percent depletion of the plant available water beyond which the soil water content should not be depleted. Depletion beyond this limit will cre-ate excessive water stress on the plant and reduce production.
10 33 1,500 0.0
0.5 Soil Water Characteristic Curve
Tension (Centibars)
Soil
Wat
er C
onte
nt(f
t/ft
)
Loamy soil
Sandy soil
(�eld capacity) (permanent wilting point)
Figure 2. Soil water characteristic curves for typical sandy and clay soils.
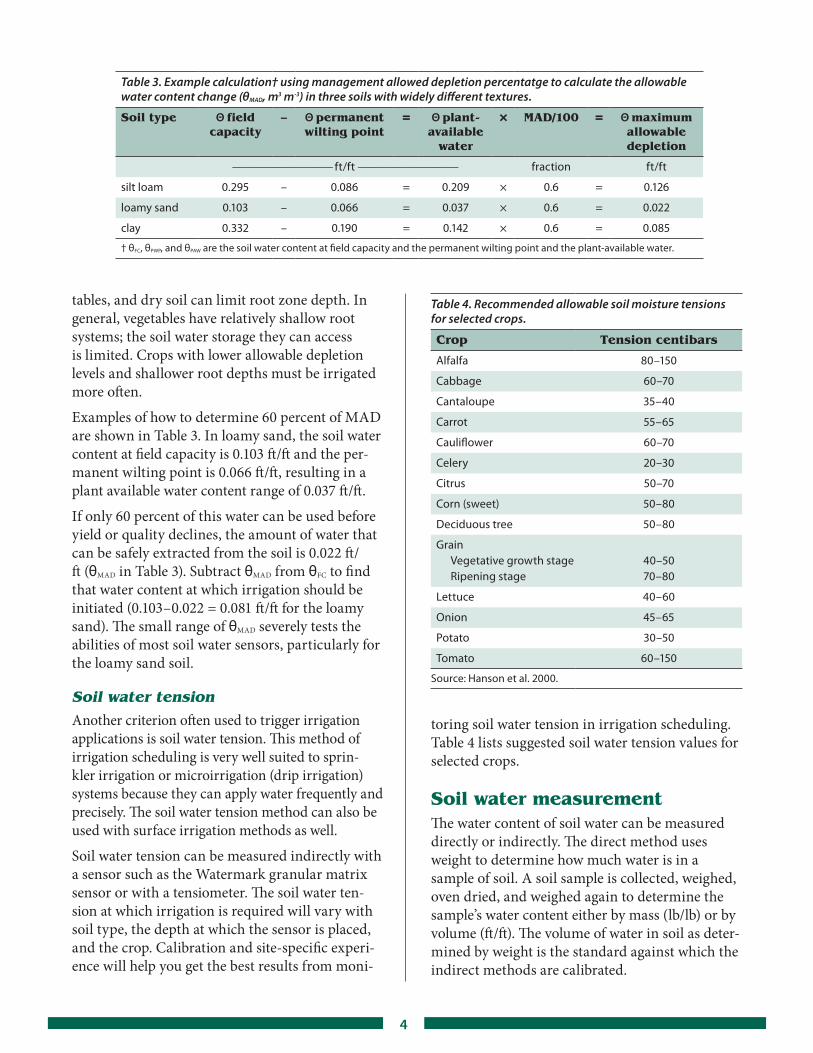
The management allowable depletion, or allowable deficit, depends on the plant species and varies between growing seasons. Recommended MAD levels for many field crops are near 50 percent, though it may be as low as 25 percent for some vegetable and other drought-sensitive crops.
Table 2 shows typical values of allowable depletion and root zone depth for selected crops. Soil condi-tions such as compacted layers, shallow water
Table 2. Allowable soil water depletions (MAD, %) and root depths (ft) for selected crops.
Crop Allowable depletion (%)
Root depth* (ft.)
Fiber cropsCotton 65 3.3–5.6
CerealsBarleyandoatsMaizeSorghumRice
5550–5550–55
20
3.3–4.52.6–6.03.3–6.61.6–3.3
LegumesBeansSoybeans
4550
1.6–4.32.0–4.1
ForagesAlfalfaBermudaGrazingpastures
50–6055–60
60
3.3–9.93.3–4.51.6–3.3
Turf grassCoolseasonWarmseason
4050
1.6–2.21.6–2.2
Sugarcane 65 4.0–6.5
TreesApricots,peaches 50 3.3–6.6
Citrus70%canopy50%canopy20%canopy
505050
4.0–5.03.6–5.02.6–3.6
Conifer trees 70 3.3–4.5
Walnut orchard 50 5.6–8.0
VegetablesCarrotsCantaloupesandwatermelonsLettuceOnionsPotatoesSweetPeppersZucchiniandcucumbers
35
40–453030653050
1.5–3.3
2.6–5.01.0–1.62.0–3.01.0–2.01.6–3.22.0–4.0
*Note:Rootdepthscanbeaffectedbysoilandotherconditions.Effectiverootzonedepthsareoftenshallower.Source:Allenetal.,1996.
4
tables, and dry soil can limit root zone depth. In general, vegetables have relatively shallow root systems; the soil water storage they can access is limited. Crops with lower allowable depletion levels and shallower root depths must be irrigated more often.
Examples of how to determine 60 percent of MAD are shown in Table 3. In loamy sand, the soil water content at field capacity is 0.103 ft/ft and the per-manent wilting point is 0.066 ft/ft, resulting in a plant available water content range of 0.037 ft/ft.
If only 60 percent of this water can be used before yield or quality declines, the amount of water that can be safely extracted from the soil is 0.022 ft/ft (θMAD in Table 3). Subtract θMAD from θFC to find that water content at which irrigation should be initiated (0.103–0.022 = 0.081 ft/ft for the loamy sand). The small range of θMAD severely tests the abilities of most soil water sensors, particularly for the loamy sand soil.
Soil water tensionAnother criterion often used to trigger irrigation applications is soil water tension. This method of irrigation scheduling is very well suited to sprin-kler irrigation or microirrigation (drip irrigation) systems because they can apply water frequently and precisely. The soil water tension method can also be used with surface irrigation methods as well.
Soil water tension can be measured indirectly with a sensor such as the Watermark granular matrix sensor or with a tensiometer. The soil water ten-sion at which irrigation is required will vary with soil type, the depth at which the sensor is placed, and the crop. Calibration and site-specific experi-ence will help you get the best results from moni-
Table 4. Recommended allowable soil moisture tensions for selected crops.
Crop Tension centibars
Alfalfa 80–150
Cabbage 60–70
Cantaloupe 35–40
Carrot 55–65
Cauliflower 60–70
Celery 20–30
Citrus 50–70
Corn(sweet) 50–80
Deciduoustree 50–80
GrainVegetativegrowthstageRipeningstage
40–5070–80
Lettuce 40–60
Onion 45–65
Potato 30–50
Tomato 60–150
Source:Hansonetal.2000.
toring soil water tension in irrigation scheduling. Table 4 lists suggested soil water tension values for selected crops.
Soil water measurementThe water content of soil water can be measured directly or indirectly. The direct method uses weight to determine how much water is in a sample of soil. A soil sample is collected, weighed, oven dried, and weighed again to determine the sample’s water content either by mass (lb/lb) or by volume (ft/ft). The volume of water in soil as deter-mined by weight is the standard against which the indirect methods are calibrated.
Table 3. Example calculation† using management allowed depletion percentatge to calculate the allowable water content change (θMAD, m3 m-3) in three soils with widely different textures.
Soil type Θ field capacity
– Θ permanent wilting point
= Θ plant-available
water
× MAD/100 = Θ maximum allowable depletion
—————————ft/ft————————— fraction ft/ft
siltloam 0.295 – 0.086 = 0.209 × 0.6 = 0.126
loamysand 0.103 – 0.066 = 0.037 × 0.6 = 0.022
clay 0.332 – 0.190 = 0.142 × 0.6 = 0.085
†θFC,θPWP,andθPAWarethesoilwatercontentatfieldcapacityandthepermanentwiltingpointandtheplant-availablewater.
5
Several indirect methods can also be used to sense soil water content or tension. Studies comparing direct and indirect methods have found that:
• All soil water sensing methods must be cali-brated, despite the efforts of manufacturers to provide calibration curves.
• Only the neutron probe and conventional time domain reflectrometry (both expensive and difficult), are accurate enough for scheduling irrigation using the MAD procedure.
• The capacitance methods are sensitive to soil temperature, salinity, clay content and type, and microscale soil structure. This makes them unreliable for MAD irrigation scheduling. They may be used to follow wetting and drying patterns over time and they allow you to detect wetting fronts from irrigation at the depths of sensor installation.
The sensors that respond to soil water tension also require calibration except for the tensiometer, which is a direct method. The case examples here are intended for instruction only and are not a recommendation.
Gypsum blocks and granular matrix sensors Gypsum block sensors measure the water content of soil at whatever depth they are set. They do this by measuring the electrical resistance between two circles of wire mesh that are embedded in a porous block of gypsum (plaster of Paris, CaSO4). Granu-lar matrix sensors work in essentially the same way, but their block is made of different sized sand particles rather than of gypsum. While sand is inert, gypsum dissolves over time and changes the block’s porosity. This change causes the gypsum block’s sensors to respond differently to soil water tension.
How it works
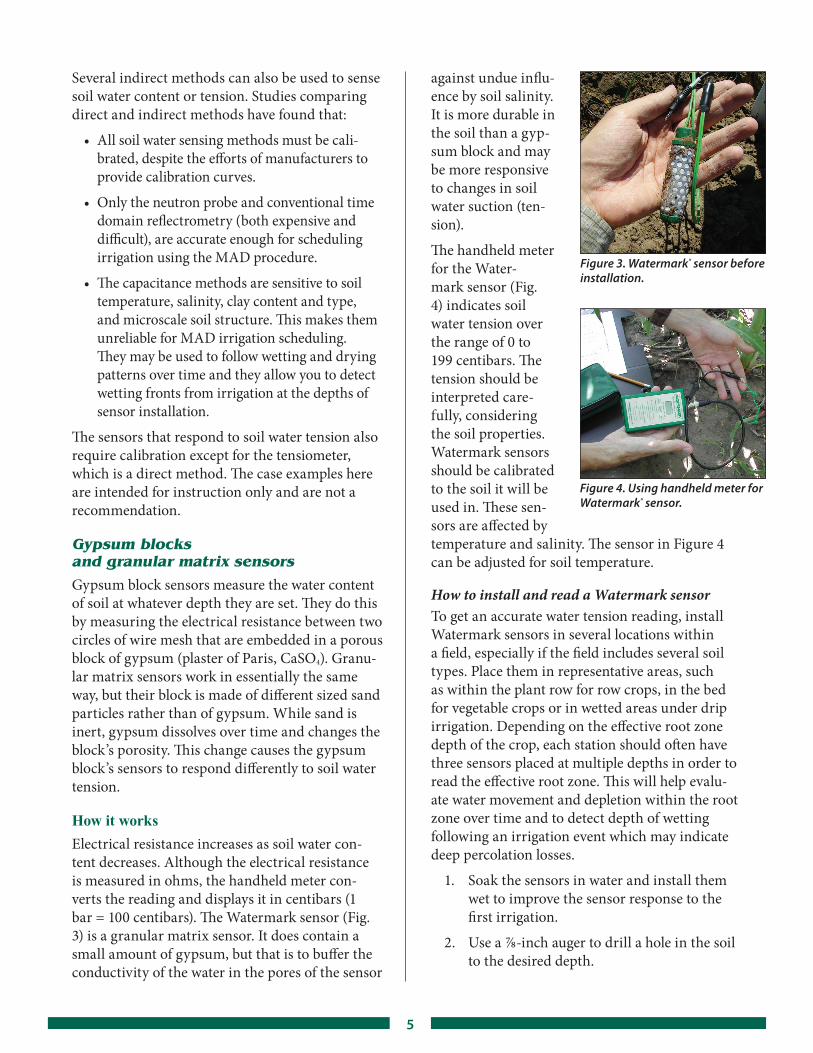
Electrical resistance increases as soil water con-tent decreases. Although the electrical resistance is measured in ohms, the handheld meter con-verts the reading and displays it in centibars (1 bar = 100 centibars). The Watermark sensor (Fig. 3) is a granular matrix sensor. It does contain a small amount of gypsum, but that is to buffer the conductivity of the water in the pores of the sensor
against undue influ-ence by soil salinity. It is more durable in the soil than a gyp-sum block and may be more responsive to changes in soil water suction (ten-sion).
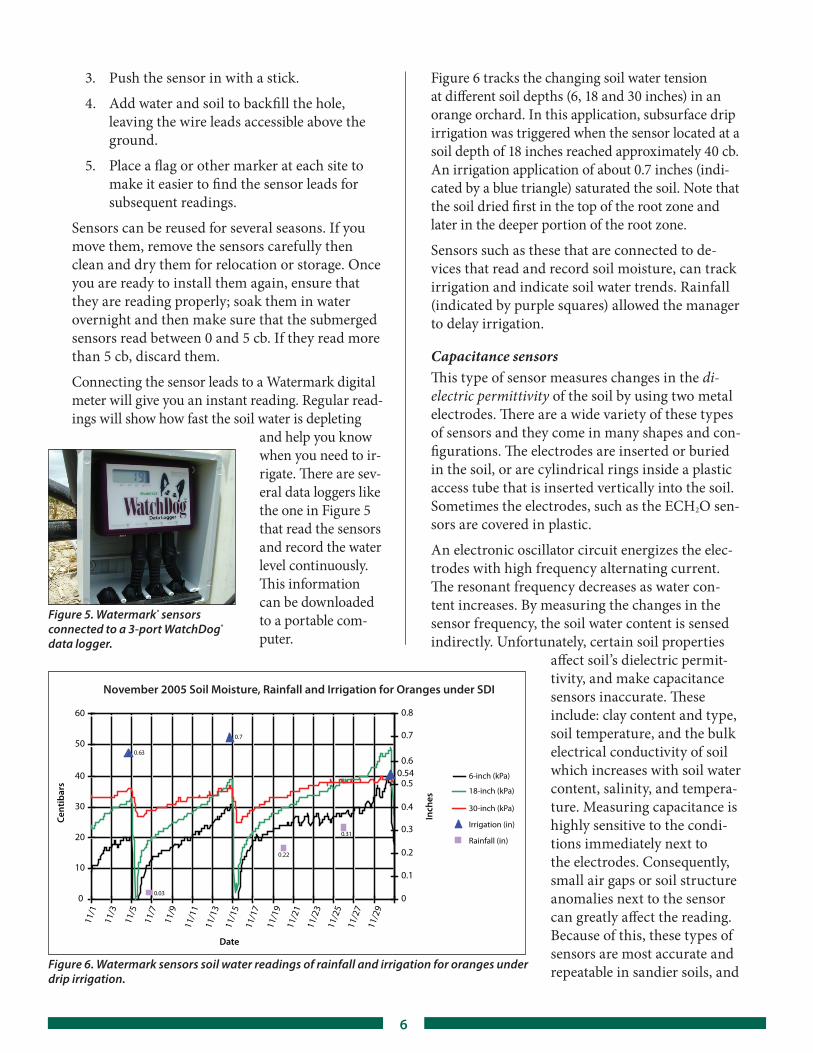
The handheld meter for the Water-mark sensor (Fig. 4) indicates soil water tension over the range of 0 to 199 centibars. The tension should be interpreted care-fully, considering the soil properties. Watermark sensors should be calibrated to the soil it will be used in. These sen-sors are affected by temperature and salinity. The sensor in Figure 4 can be adjusted for soil temperature.
How to install and read a Watermark sensorTo get an accurate water tension reading, install Watermark sensors in several locations within a field, especially if the field includes several soil types. Place them in representative areas, such as within the plant row for row crops, in the bed for vegetable crops or in wetted areas under drip irrigation. Depending on the effective root zone depth of the crop, each station should often have three sensors placed at multiple depths in order to read the effective root zone. This will help evalu-ate water movement and depletion within the root zone over time and to detect depth of wetting following an irrigation event which may indicate deep percolation losses.
1. Soak the sensors in water and install them wet to improve the sensor response to the first irrigation.
2. Use a 7/8-inch auger to drill a hole in the soil to the desired depth.
Figure 3. Watermark® sensor before installation.
Figure 4. Using handheld meter for Watermark® sensor.
6
3. Push the sensor in with a stick.
4. Add water and soil to backfill the hole, leaving the wire leads accessible above the ground.
5. Place a flag or other marker at each site to make it easier to find the sensor leads for subsequent readings.
Sensors can be reused for several seasons. If you move them, remove the sensors carefully then clean and dry them for relocation or storage. Once you are ready to install them again, ensure that they are reading properly; soak them in water overnight and then make sure that the submerged sensors read between 0 and 5 cb. If they read more than 5 cb, discard them.
Connecting the sensor leads to a Watermark digital meter will give you an instant reading. Regular read-ings will show how fast the soil water is depleting
and help you know when you need to ir-rigate. There are sev-eral data loggers like the one in Figure 5 that read the sensors and record the water level continuously. This information can be downloaded to a portable com-puter.
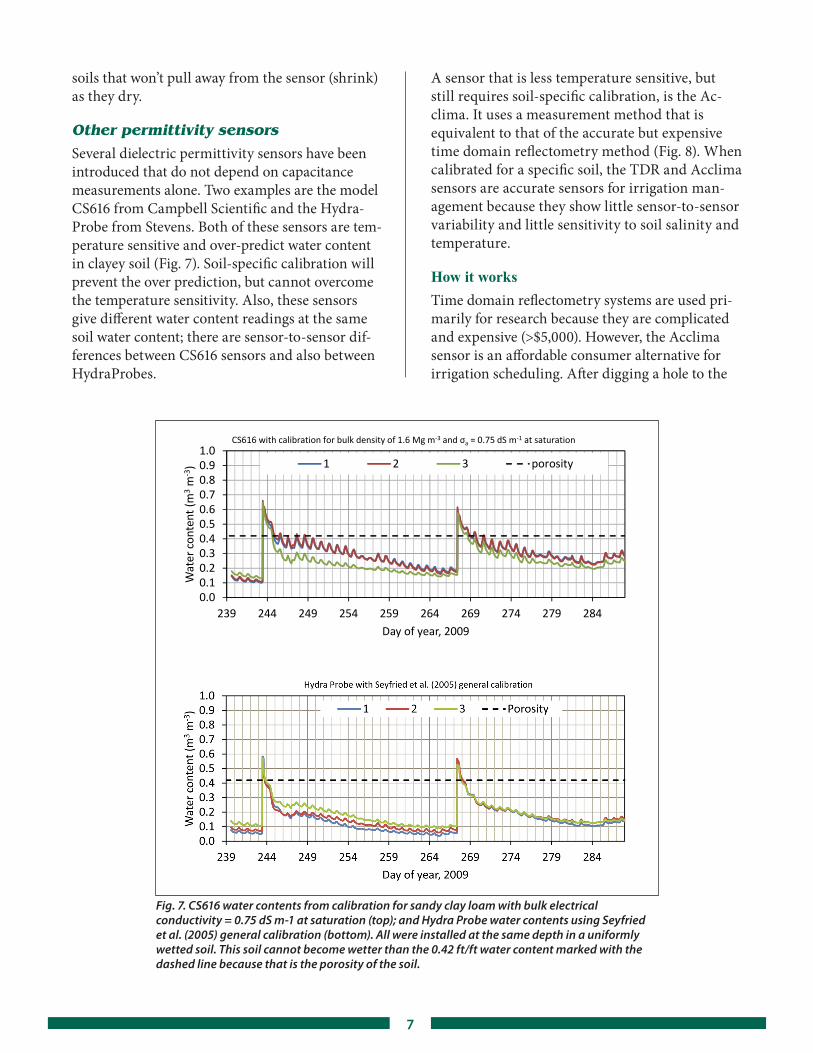
Figure 6 tracks the changing soil water tension at different soil depths (6, 18 and 30 inches) in an orange orchard. In this application, subsurface drip irrigation was triggered when the sensor located at a soil depth of 18 inches reached approximately 40 cb. An irrigation application of about 0.7 inches (indi-cated by a blue triangle) saturated the soil. Note that the soil dried first in the top of the root zone and later in the deeper portion of the root zone.
Sensors such as these that are connected to de-vices that read and record soil moisture, can track irrigation and indicate soil water trends. Rainfall (indicated by purple squares) allowed the manager to delay irrigation.
Capacitance sensors This type of sensor measures changes in the di-electric permittivity of the soil by using two metal electrodes. There are a wide variety of these types of sensors and they come in many shapes and con-figurations. The electrodes are inserted or buried in the soil, or are cylindrical rings inside a plastic access tube that is inserted vertically into the soil. Sometimes the electrodes, such as the ECH2O sen-sors are covered in plastic.
An electronic oscillator circuit energizes the elec-trodes with high frequency alternating current. The resonant frequency decreases as water con-tent increases. By measuring the changes in the sensor frequency, the soil water content is sensed indirectly. Unfortunately, certain soil properties
affect soil’s dielectric permit-tivity, and make capacitance sensors inaccurate. These include: clay content and type, soil temperature, and the bulk electrical conductivity of soil which increases with soil water content, salinity, and tempera-ture. Measuring capacitance is highly sensitive to the condi-tions immediately next to the electrodes. Consequently, small air gaps or soil structure anomalies next to the sensor can greatly affect the reading. Because of this, these types of sensors are most accurate and repeatable in sandier soils, and
Figure 5. Watermark® sensors connected to a 3-port WatchDog® data logger.
0.63
0.7
0.54
0.03
0.22
0.31
0
11/1
11/3
11/5
11/7
11/9
11/1
111
/13
11/1
511
/17
11/1
911
/21
11/2
311
/25
11/2
711
/29
10
20
30
40
50
60
Cent
ibar
s
0
0.8
0.7
Date
0.6
0.5
0.4
0.3
0.2
0.1
Inch
es
6-inch (kPa)
18-inch (kPa)
30-inch (kPa)
Irrigation (in)
Rainfall (in)
November 2005 Soil Moisture, Rainfall and Irrigation for Oranges under SDI
Figure 6. Watermark sensors soil water readings of rainfall and irrigation for oranges under drip irrigation.
7
soils that won’t pull away from the sensor (shrink) as they dry.
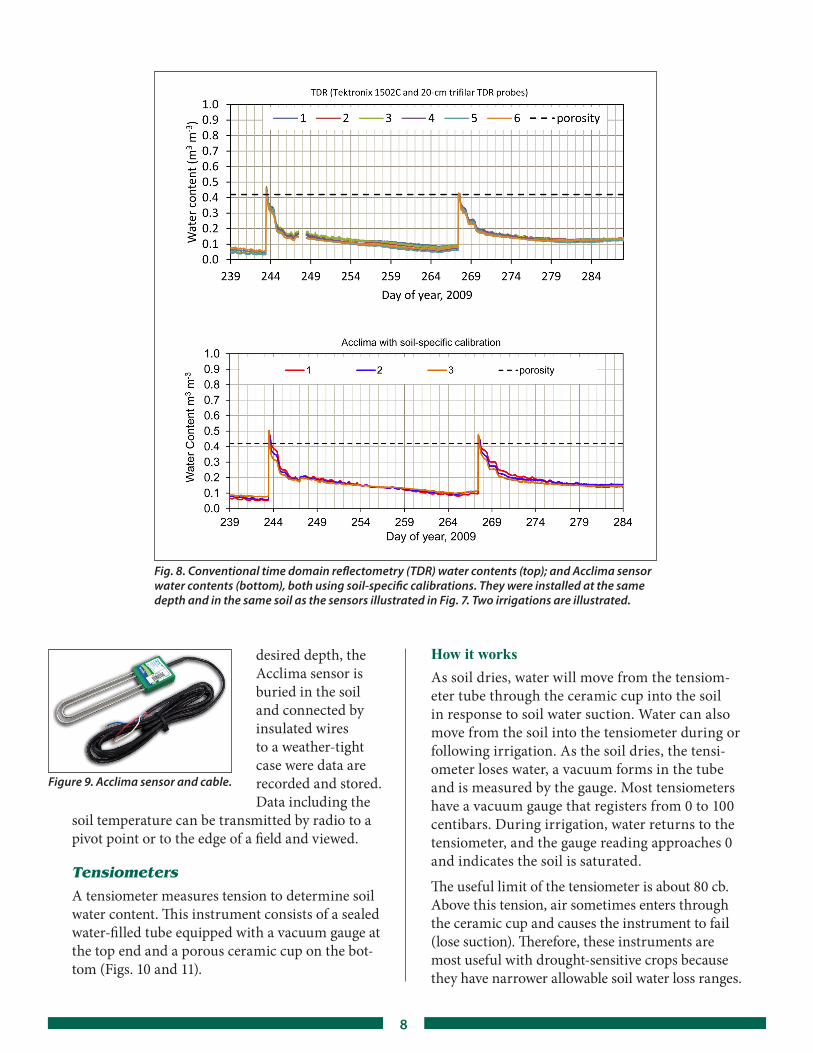
Other permittivity sensorsSeveral dielectric permittivity sensors have been introduced that do not depend on capacitance measurements alone. Two examples are the model CS616 from Campbell Scientific and the Hydra-Probe from Stevens. Both of these sensors are tem-perature sensitive and over-predict water content in clayey soil (Fig. 7). Soil-specific calibration will prevent the over prediction, but cannot overcome the temperature sensitivity. Also, these sensors give different water content readings at the same soil water content; there are sensor-to-sensor dif-ferences between CS616 sensors and also between HydraProbes.
A sensor that is less temperature sensitive, but still requires soil-specific calibration, is the Ac-clima. It uses a measurement method that is equivalent to that of the accurate but expensive time domain reflectometry method (Fig. 8). When calibrated for a specific soil, the TDR and Acclima sensors are accurate sensors for irrigation man-agement because they show little sensor-to-sensor variability and little sensitivity to soil salinity and temperature.
How it works
Time domain reflectometry systems are used pri-marily for research because they are complicated and expensive (>$5,000). However, the Acclima sensor is an affordable consumer alternative for irrigation scheduling. After digging a hole to the
0.00.10.20.30.40.50.60.70.80.91.0
239 244 249 254 259 264 269 274 279 284
Water co
nten
t (m
3m
‐3)
Day of year, 2009
1 2 3 porosity
CS616 with calibration for bulk density of 1.6 Mg m‐3 and σa = 0.75 dS m‐1 at saturation
Fig. 7. CS616 water contents from calibration for sandy clay loam with bulk electrical conductivity = 0.75 dS m-1 at saturation (top); and Hydra Probe water contents using Seyfried et al. (2005) general calibration (bottom). All were installed at the same depth in a uniformly wetted soil. This soil cannot become wetter than the 0.42 ft/ft water content marked with the dashed line because that is the porosity of the soil.
8
desired depth, the Acclima sensor is buried in the soil and connected by insulated wires to a weather-tight case were data are recorded and stored. Data including the
soil temperature can be transmitted by radio to a pivot point or to the edge of a field and viewed.
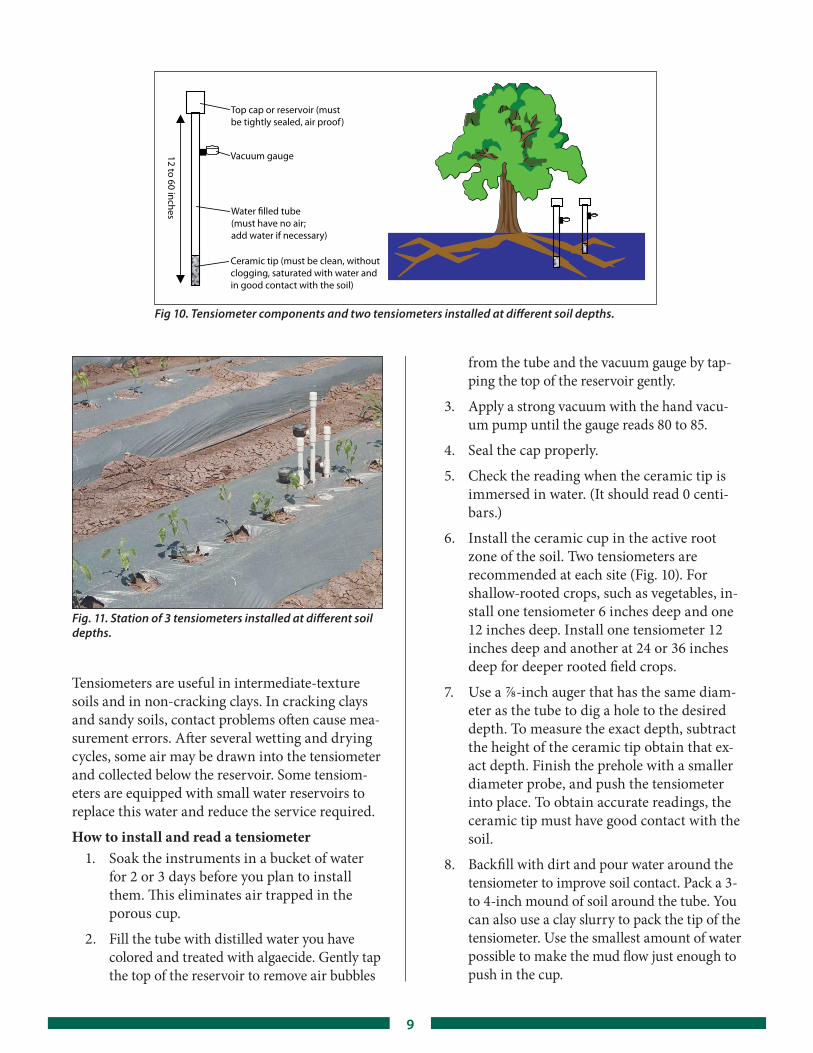
TensiometersA tensiometer measures tension to determine soil water content. This instrument consists of a sealed water-filled tube equipped with a vacuum gauge at the top end and a porous ceramic cup on the bot-tom (Figs. 10 and 11).
Figure 9. Acclima sensor and cable.
How it works
As soil dries, water will move from the tensiom-eter tube through the ceramic cup into the soil in response to soil water suction. Water can also move from the soil into the tensiometer during or following irrigation. As the soil dries, the tensi-ometer loses water, a vacuum forms in the tube and is measured by the gauge. Most tensiometers have a vacuum gauge that registers from 0 to 100 centibars. During irrigation, water returns to the tensiometer, and the gauge reading approaches 0 and indicates the soil is saturated.
The useful limit of the tensiometer is about 80 cb. Above this tension, air sometimes enters through the ceramic cup and causes the instrument to fail (lose suction). Therefore, these instruments are most useful with drought-sensitive crops because they have narrower allowable soil water loss ranges.
Fig. 8. Conventional time domain reflectometry (TDR) water contents (top); and Acclima sensor water contents (bottom), both using soil-specific calibrations. They were installed at the same depth and in the same soil as the sensors illustrated in Fig. 7. Two irrigations are illustrated.
9
Tensiometers are useful in intermediate-texture soils and in non-cracking clays. In cracking clays and sandy soils, contact problems often cause mea-surement errors. After several wetting and drying cycles, some air may be drawn into the tensiometer and collected below the reservoir. Some tensiom-eters are equipped with small water reservoirs to replace this water and reduce the service required.
How to install and read a tensiometer1. Soak the instruments in a bucket of water
for 2 or 3 days before you plan to install them. This eliminates air trapped in the porous cup.
2. Fill the tube with distilled water you have colored and treated with algaecide. Gently tap the top of the reservoir to remove air bubbles
from the tube and the vacuum gauge by tap-ping the top of the reservoir gently.
3. Apply a strong vacuum with the hand vacu-um pump until the gauge reads 80 to 85.
4. Seal the cap properly.
5. Check the reading when the ceramic tip is immersed in water. (It should read 0 centi-bars.)
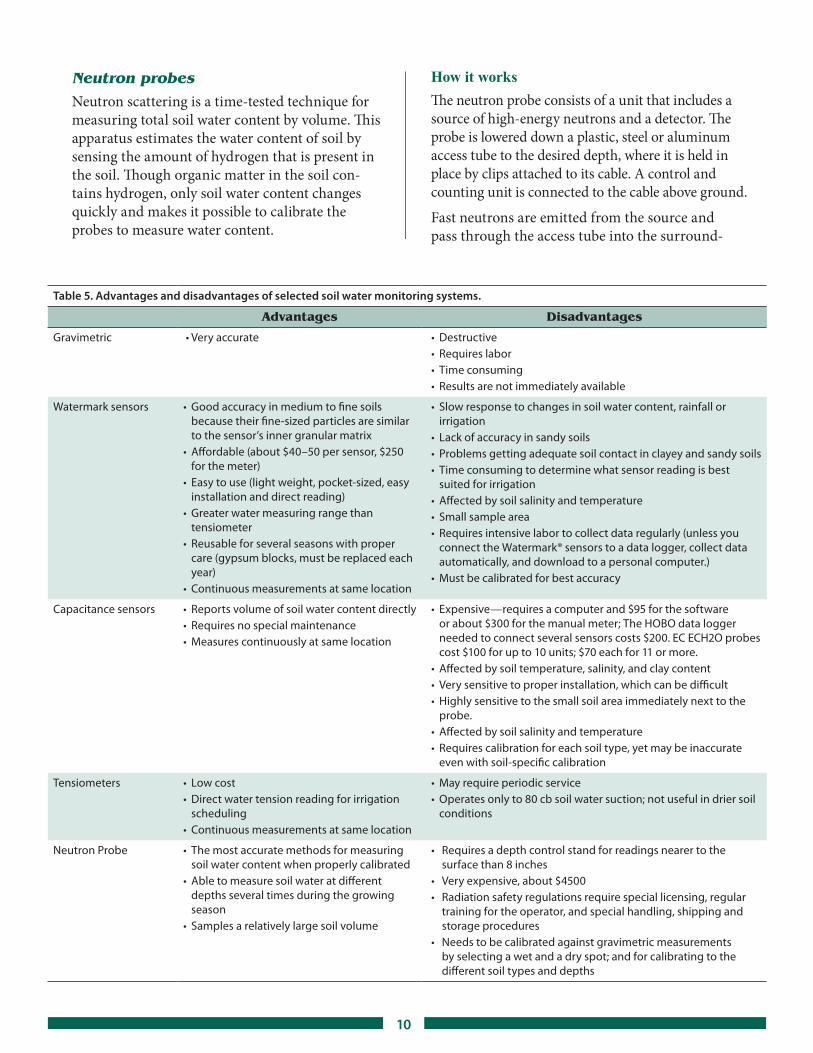
6. Install the ceramic cup in the active root zone of the soil. Two tensiometers are recommended at each site (Fig. 10). For shallow-rooted crops, such as vegetables, in-stall one tensiometer 6 inches deep and one 12 inches deep. Install one tensiometer 12 inches deep and another at 24 or 36 inches deep for deeper rooted field crops.
7. Use a 7/8-inch auger that has the same diam-eter as the tube to dig a hole to the desired depth. To measure the exact depth, subtract the height of the ceramic tip obtain that ex-act depth. Finish the prehole with a smaller diameter probe, and push the tensiometer into place. To obtain accurate readings, the ceramic tip must have good contact with the soil.
8. Backfill with dirt and pour water around the tensiometer to improve soil contact. Pack a 3- to 4-inch mound of soil around the tube. You can also use a clay slurry to pack the tip of the tensiometer. Use the smallest amount of water possible to make the mud flow just enough to push in the cup.
Top cap or reservoir (must be tightly sealed, air proof)
Vacuum gauge
Water �lled tube (must have no air;add water if necessary)
Ceramic tip (must be clean, without clogging, saturated with water and in good contact with the soil)
12 to 60 inches
Fig 10. Tensiometer components and two tensiometers installed at different soil depths.
Fig. 11. Station of 3 tensiometers installed at different soil depths.
10
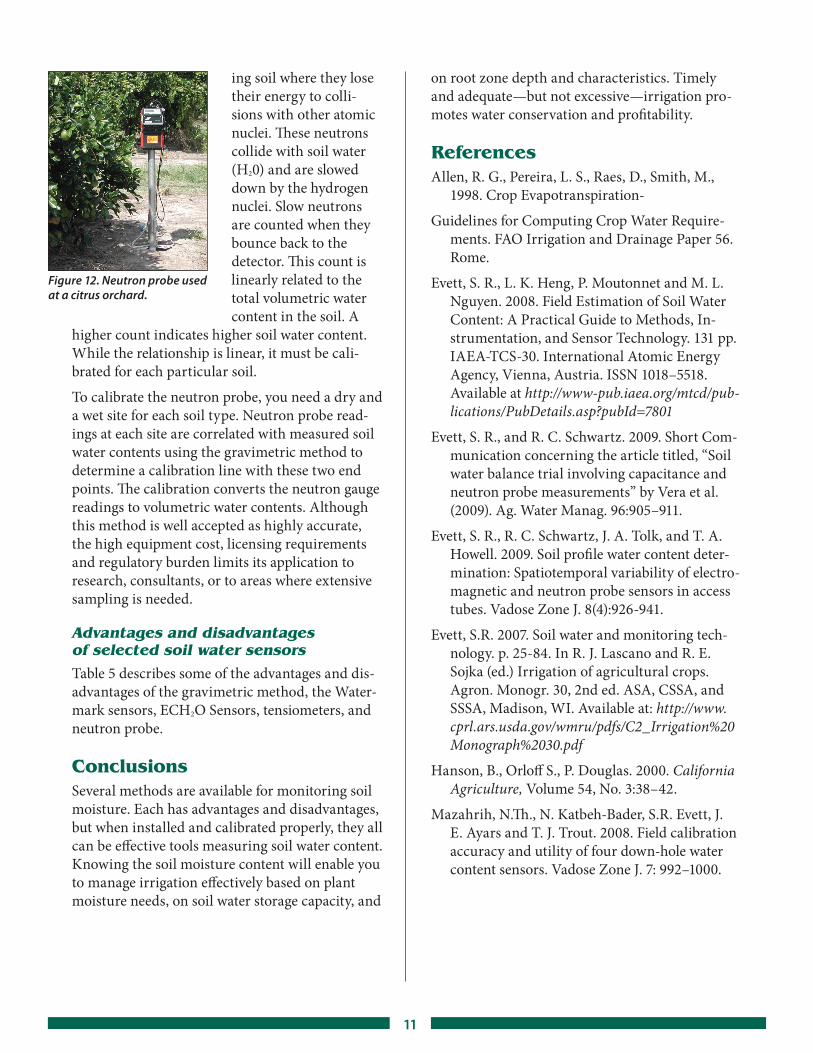
Table 5. Advantages and disadvantages of selected soil water monitoring systems.
Advantages Disadvantages
Gravimetric •Veryaccurate • Destructive• Requireslabor• Timeconsuming• Resultsarenotimmediatelyavailable
Watermarksensors • Goodaccuracyinmediumtofinesoilsbecausetheirfine-sizedparticlesaresimilartothesensor’sinnergranularmatrix
•Affordable(about$40–50persensor,$250forthemeter)
• Easytouse(lightweight,pocket-sized,easyinstallationanddirectreading)
• Greaterwatermeasuringrangethantensiometer
• Reusableforseveralseasonswithpropercare(gypsumblocks,mustbereplacedeachyear)
• Continuousmeasurementsatsamelocation
• Slowresponsetochangesinsoilwatercontent,rainfallorirrigation
• Lackofaccuracyinsandysoils• Problemsgettingadequatesoilcontactinclayeyandsandysoils• Timeconsumingtodeterminewhatsensorreadingisbest
suitedforirrigation• Affectedbysoilsalinityandtemperature• Smallsamplearea• Requiresintensivelabortocollectdataregularly(unlessyou
connecttheWatermark®sensorstoadatalogger,collectdataautomatically,anddownloadtoapersonalcomputer.)
• Mustbecalibratedforbestaccuracy
Capacitancesensors • Reportsvolumeofsoilwatercontentdirectly• Requiresnospecialmaintenance• Measurescontinuouslyatsamelocation
• Expensive—requiresacomputerand$95forthesoftwareorabout$300forthemanualmeter;TheHOBOdataloggerneededtoconnectseveralsensorscosts$200.ECECH2Oprobescost$100forupto10units;$70eachfor11ormore.
• Affectedbysoiltemperature,salinity,andclaycontent• Verysensitivetoproperinstallation,whichcanbedifficult• Highlysensitivetothesmallsoilareaimmediatelynexttothe
probe.• Affectedbysoilsalinityandtemperature• Requirescalibrationforeachsoiltype,yetmaybeinaccurate
evenwithsoil-specificcalibration
Tensiometers • Lowcost• Directwatertensionreadingforirrigation
scheduling• Continuousmeasurementsatsamelocation
• Mayrequireperiodicservice• Operatesonlyto80cbsoilwatersuction;notusefulindriersoil
conditions
NeutronProbe • Themostaccuratemethodsformeasuringsoilwatercontentwhenproperlycalibrated
• Abletomeasuresoilwateratdifferentdepthsseveraltimesduringthegrowingseason
• Samplesarelativelylargesoilvolume
• Requiresadepthcontrolstandforreadingsnearertothesurfacethan8inches
• Veryexpensive,about$4500• Radiationsafetyregulationsrequirespeciallicensing,regular
trainingfortheoperator,andspecialhandling,shippingandstorageprocedures
• Needstobecalibratedagainstgravimetricmeasurementsbyselectingawetandadryspot;andforcalibratingtothedifferentsoiltypesanddepths
Neutron probesNeutron scattering is a time-tested technique for measuring total soil water content by volume. This apparatus estimates the water content of soil by sensing the amount of hydrogen that is present in the soil. Though organic matter in the soil con-tains hydrogen, only soil water content changes quickly and makes it possible to calibrate the probes to measure water content.
How it works
The neutron probe consists of a unit that includes a source of high-energy neutrons and a detector. The probe is lowered down a plastic, steel or aluminum access tube to the desired depth, where it is held in place by clips attached to its cable. A control and counting unit is connected to the cable above ground.
Fast neutrons are emitted from the source and pass through the access tube into the surround-
11
Figure 12. Neutron probe used at a citrus orchard.
ing soil where they lose their energy to colli-sions with other atomic nuclei. These neutrons collide with soil water (H20) and are slowed down by the hydrogen nuclei. Slow neutrons are counted when they bounce back to the detector. This count is linearly related to the total volumetric water content in the soil. A
higher count indicates higher soil water content. While the relationship is linear, it must be cali-brated for each particular soil.
To calibrate the neutron probe, you need a dry and a wet site for each soil type. Neutron probe read-ings at each site are correlated with measured soil water contents using the gravimetric method to determine a calibration line with these two end points. The calibration converts the neutron gauge readings to volumetric water contents. Although this method is well accepted as highly accurate, the high equipment cost, licensing requirements and regulatory burden limits its application to research, consultants, or to areas where extensive sampling is needed.
Advantages and disadvantages of selected soil water sensors Table 5 describes some of the advantages and dis-advantages of the gravimetric method, the Water-mark sensors, ECH2O Sensors, tensiometers, and neutron probe.
ConclusionsSeveral methods are available for monitoring soil moisture. Each has advantages and disadvantages, but when installed and calibrated properly, they all can be effective tools measuring soil water content. Knowing the soil moisture content will enable you to manage irrigation effectively based on plant moisture needs, on soil water storage capacity, and
on root zone depth and characteristics. Timely and adequate—but not excessive—irrigation pro-motes water conservation and profitability.
ReferencesAllen, R. G., Pereira, L. S., Raes, D., Smith, M.,
1998. Crop Evapotranspiration-
Guidelines for Computing Crop Water Require-ments. FAO Irrigation and Drainage Paper 56. Rome.
Evett, S. R., L. K. Heng, P. Moutonnet and M. L. Nguyen. 2008. Field Estimation of Soil Water Content: A Practical Guide to Methods, In-strumentation, and Sensor Technology. 131 pp. IAEA-TCS-30. International Atomic Energy Agency, Vienna, Austria. ISSN 1018–5518. Available at http://www-pub.iaea.org/mtcd/pub-lications/PubDetails.asp?pubId=7801
Evett, S. R., and R. C. Schwartz. 2009. Short Com-munication concerning the article titled, “Soil water balance trial involving capacitance and neutron probe measurements” by Vera et al. (2009). Ag. Water Manag. 96:905–911.
Evett, S. R., R. C. Schwartz, J. A. Tolk, and T. A. Howell. 2009. Soil profile water content deter-mination: Spatiotemporal variability of electro-magnetic and neutron probe sensors in access tubes. Vadose Zone J. 8(4):926-941.
Evett, S.R. 2007. Soil water and monitoring tech-nology. p. 25-84. In R. J. Lascano and R. E. Sojka (ed.) Irrigation of agricultural crops. Agron. Monogr. 30, 2nd ed. ASA, CSSA, and SSSA, Madison, WI. Available at: http://www.cprl.ars.usda.gov/wmru/pdfs/C2_Irrigation%20Monograph%2030.pdf
Hanson, B., Orloff S., P. Douglas. 2000. California Agriculture, Volume 54, No. 3:38–42.
Mazahrih, N.Th., N. Katbeh-Bader, S.R. Evett, J. E. Ayars and T. J. Trout. 2008. Field calibration accuracy and utility of four down-hole water content sensors. Vadose Zone J. 7: 992–1000.
AcknowledgmentWe gratefully acknowledge support from the
USDA-ARS Ogallala Aquifer Program, a consortium between USDA-Agricultural Research Service, Kansas State University,
Texas AgriLife Research, Texas AgriLife Extension Service, Texas Tech University, and West Texas A&M University.


