Download - Investment Portfolio Quarterly - Winter 2014
Investment Portfolio Quarterly
Insightful PerspectivesWinter 2014
Contents Page Executive Summary
Q4/13 Quarterly Comments 1 Portfolio Strategy
Normalization Year 3
Economic Outlook
U.S. Economic Outlook: Enter the Bear Flattener 11
Equity Strategy
Top 10 Canadian and U.S. Stocks Picks for 2014 18
Investment Strategy
Emerging Markets: One Step Forward, Two Steps Back? 34
Guided Portfolios
Canadian Core 38
Canadian Income Plus 42
U.S. Core 45
North American Core 50
Core-Plus Fixed Income 54
Portfolio Advisory Group
Winter 2014 1
Executive Summary Q4/13 Quarterly Comments Shane Jones — Chief Investment Officer & Co-Head, Portfolio Advisory Group
The fourth quarter of 2013 was an excellent quarter in equity markets although markets are typically strong as we head into the year-end period, this one was very strong. Mr. Bernanke finally put the pin in and started the highly anticipated “tapering of QE3” with a reduction in bond purchases from $85 billion per month to $75 billion per month. At the present time it is expected that the Federal Reserve will reduce at $10 billion per meeting which are every 6 weeks and this will then bring the quantitative easing to an end in the latter part of 2014. However, economic conditions will drive these decisions so any further tapering will be data dependent. Economic statistics picked up pace in the fourth quarter with job creation better than expected and an increase in Gross Domestic Output, these stronger than expected numbers were critical in the Federal Reserve decisions although inflation does remain subdued. After many quarters of low volume trading we actually saw a decent increase in market volumes which were a catalyst for the better tone in the markets as Fund Managers positioned their portfolios to be overweight equities and underweight bonds as the equity markets continued to produce outstanding results. Bond Markets also put in a decent performance for the quarter considering the market environment as markets remained volatile around the potential for the aforementioned tapering of QE3. 10 Year US Treasury Bonds appear to be capped at around the 3% level at the present time and remain in a very tight trading range of 2.8% to 3.0%. As we enter the 1st quarter of the New Year we finally have a long awaited budget agreement however the parties still have to agree on the debt ceiling issue which comes up for debate in February and could cause further disruption in the markets.
Looking at North American Equity markets both Canada and the US performed very well with Total Returns of 7.28% and 10.33% respectively. As mentioned volumes improved dramatically throughout the quarter with equities being purchased at a healthy pace pushing US stock valuations to very high levels. When looking at the breakdown of sectors on the S&P500 that gained or lost in the quarter the gains were paced by an almost 40% return in the Oil and Gas refinery stocks followed by a 30% gain in Aluminum stocks. On the opposite end we saw big losses for Gold stocks of -18% as the precious metal continued to lose faith with investors. Looking at the same statistics for Canada and using the 10 sectors Industrials, Healthcare and Financials led the groups with gains of 15.8%, 13.8% and 9.1% respectively, in fact all sub-sectors produced positive performance with the exception of Materials which was dragged lower by the continuing poor performance of Gold stocks. In North American fixed income markets the focus remained on the Federal Reserve and their tapering of QE3 policy (when, why and how much), this kept markets uncertain and we saw yields trade in a tight range between 2.75% and 3%. Tapering did start in December and the announcement of further tapering is expected in late January. However, any further tapering of bond purchases will become very data dependent and the Federal Reserve will be looking for better economic statistics in the coming months such as lower unemployment and GDP growth to signal that the US economy is on track for a full recovery. We do not expect any changes to official interest rates in North America in 2014.
In Europe, equity markets performed very well as signs of a recovery are beginning to take shape across the EuroZone with the exception of France whose high tax rates are beginning to really hurt economic growth. We are starting to slow but sure gains in Spain and Italy while Germany and the Benelux countries continue to perform well from an economic standpoint. The UK is also seeing stronger than expected economic growth but most of the gains appear to be in the Southern regions of the country which has a very close proximity to the recovering European markets. The DAX in Germany gained 11.1%, the CAC in France added 3.7% while the FTSE in the UK added 4.4%. Ireland has emerged from its IMF/European austerity controls and the hope is that Portugal will emerge from under the same measures in the next few years as the economic recovery there takes shape. European markets are poised to perform well in 2014 and it’s an area of focus for many investors including ourselves.
Investment Portfolio Quarterly
2
As we look at Asia markets we see very different performance in the 2 major markets as Japan performed extremely well gaining 12.7% on a weak currency that really helping this exporting nation. In contrast we saw the Shanghai Market lose 2.7% as the economy struggles to gain traction and move back above the 8% growth level. Overnight money rates have also been a drag on economic growth and the markets as liquidity conditions remain very tight and the shadow banking market continues to be problematic. We still believe that with the US economy grinding higher and the European economy looking to have bottomed that this will bode well for the Chinese economy as we move further into 2014. If we are correct we expect that this will have a positive impact on Commodity markets and the Canadian equity markets.
In Commodities and Currencies we have once again had quite the mixed picture with Gold and Oil performing poorly while Natural Gas and the US Dollar performed better than expected especially Nat Gas as colder than expected weather conditions drove the price 24% higher in the US. Copper gained marginally while agricultural commodities were weak due to a stronger than expected crop yield especially Corn and Wheat. The US Dollar gained against most other major currencies (Japanese Yen was the exception) as the uncertainty around the Federal Reserve actions and the debt ceiling debates lifted the weight on the currency. The Canadian Dollar had a poor quarter as expectations of a move in official interest rates from the Bank of Canada has played into many speculators minds. We will await the economic update from Mr. Poloz in late January to see if there is a shift in policy from the central bank. This weakness in the Canadian Dollar has gathered momentum in early January and the currency is pushing towards $0.90 to the US Dollar. Oil has weakened from its recent highs on an agreement with Iran to reduce sanctions and some easing of tensions in Egypt and Libya. The Syria situation is still evolving with peace talks expected soon.
As we start the New Year of 2014 things appear to be a little calmer around the world. We have a budget agreement in Washington but still face a debt ceiling debate. In Europe, Germany has formed a grand coalition which should help keep that economy on track and help others in the region. In the Middle-East tensions appeared to have eased a little in the region with the exception of Syria and we have an agreement with Iran on Uranium enrichment. Asia economies are still slower than expected however we feel that there will be a pick-up in Chinese economic activity post the Chinese New Year in early February which should have a positive impact on the whole region. Having said all that and we move back to more fundamental investing rather than looking at geopolitical events we could see more volatility than expected as Fund Managers look to position themselves in the right markets and right stocks for 2014.
Here are some of the highlights of what our Winter 2014 Investment Portfolio Quarterly (IPQ) offers:
Scotiabank GBM Portfolio Strategy Team provides their Portfolio Strategy Outlook for 2014 report.
Scotiabank Economist Derek Holt discusses his outlook for the US economy and his view that this recovery has just begun and believes in a fairly bullish outlook.
Himalaya Jain and Warren Hastings provide their Top 10 Canadian Stock Picks for 2014 and provide an overview of the performance of the Top Picks from 2013.
Marco Martin and Caroline Escott provide their Top 10 US Stock Picks for 2014 and also an overview of the performance of the top picks from 2013.
Nick Chamie, IPAG, provides his outlook for emerging markets.
Caroline Escott, Warren Hastings, Tim Vlahopoulos and Andrew Mystic provide their quarterly review and commentary on the performance of the Guided Portfolios.
We hope you all enjoy the Winter 2014 version of the IPQ and recommend you contact your ScotiaMcLeod Advisor with regard to any ideas presented here which interest you, or to review your investment portfolio
Portfolio Advisory Group
Winter 2014 3
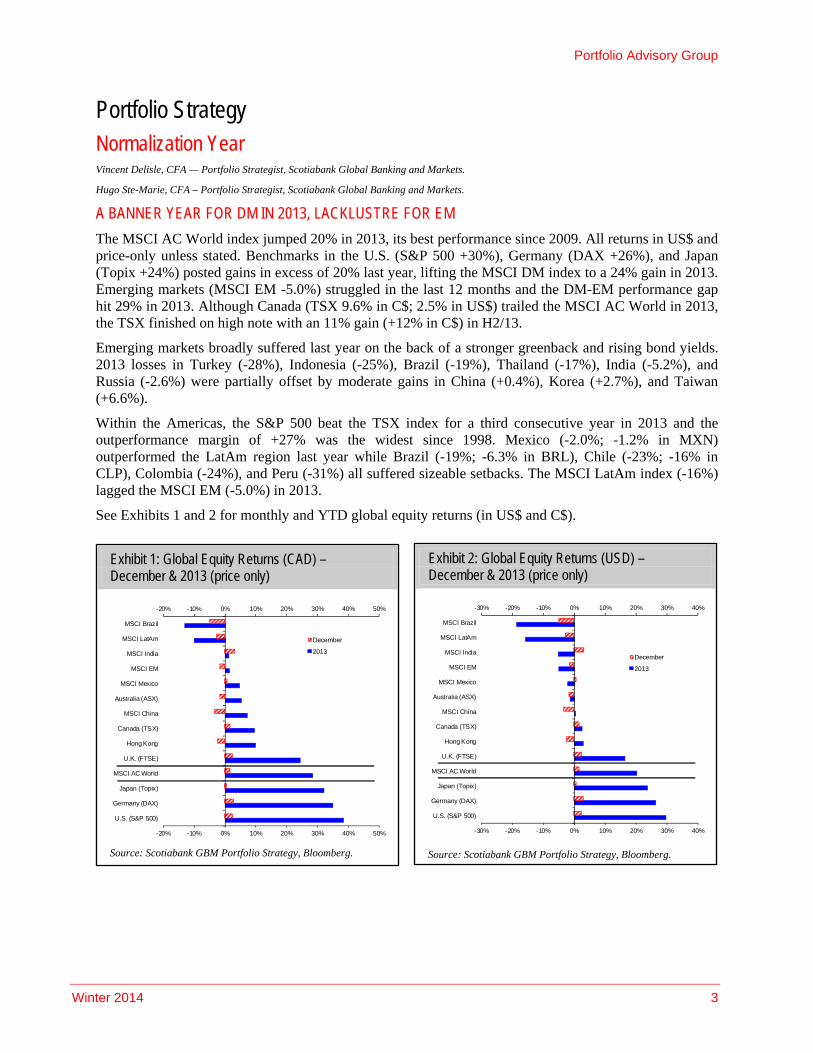
Exhibit 1: Global Equity Returns (CAD) – December & 2013 (price only)
-20% -10% 0% 10% 20% 30% 40% 50%
-20% -10% 0% 10% 20% 30% 40% 50%
U.S. (S&P 500)
Germany (DAX)
Japan (Topix)
MSCI AC World
U.K. (FTSE)
Hong Kong
Canada (TSX)
MSCI China
Australia (ASX)
MSCI Mexico
MSCI EM
MSCI India
MSCI LatAm
MSCI Brazil
December
2013
Source: Scotiabank GBM Portfolio Strategy, Bloomberg.
Exhibit 2: Global Equity Returns (USD) – December & 2013 (price only)
-30% -20% -10% 0% 10% 20% 30% 40%
-30% -20% -10% 0% 10% 20% 30% 40%
U.S. (S&P 500)
Germany (DAX)
Japan (Topix)
MSCI AC World
U.K. (FTSE)
Hong Kong
Canada (TSX)
MSCI China
Australia (ASX)
MSCI Mexico
MSCI EM
MSCI India
MSCI LatAm
MSCI Brazil
December
2013
Source: Scotiabank GBM Portfolio Strategy, Bloomberg.
Portfolio Strategy Normalization Year Vincent Delisle, CFA — Portfolio Strategist, Scotiabank Global Banking and Markets.
Hugo Ste-Marie, CFA – Portfolio Strategist, Scotiabank Global Banking and Markets.
A BANNER YEAR FOR DM IN 2013, LACKLUSTRE FOR EM
The MSCI AC World index jumped 20% in 2013, its best performance since 2009. All returns in US$ and price-only unless stated. Benchmarks in the U.S. (S&P 500 +30%), Germany (DAX +26%), and Japan (Topix +24%) posted gains in excess of 20% last year, lifting the MSCI DM index to a 24% gain in 2013. Emerging markets (MSCI EM -5.0%) struggled in the last 12 months and the DM-EM performance gap hit 29% in 2013. Although Canada (TSX 9.6% in C$; 2.5% in US$) trailed the MSCI AC World in 2013, the TSX finished on high note with an 11% gain (+12% in C$) in H2/13.
Emerging markets broadly suffered last year on the back of a stronger greenback and rising bond yields. 2013 losses in Turkey (-28%), Indonesia (-25%), Brazil (-19%), Thailand (-17%), India (-5.2%), and Russia (-2.6%) were partially offset by moderate gains in China (+0.4%), Korea (+2.7%), and Taiwan (+6.6%).
Within the Americas, the S&P 500 beat the TSX index for a third consecutive year in 2013 and the outperformance margin of +27% was the widest since 1998. Mexico (-2.0%; -1.2% in MXN) outperformed the LatAm region last year while Brazil (-19%; -6.3% in BRL), Chile (-23%; -16% in CLP), Colombia (-24%), and Peru (-31%) all suffered sizeable setbacks. The MSCI LatAm index (-16%) lagged the MSCI EM (-5.0%) in 2013.
See Exhibits 1 and 2 for monthly and YTD global equity returns (in US$ and C$).
Investment Portfolio Quarterly
4
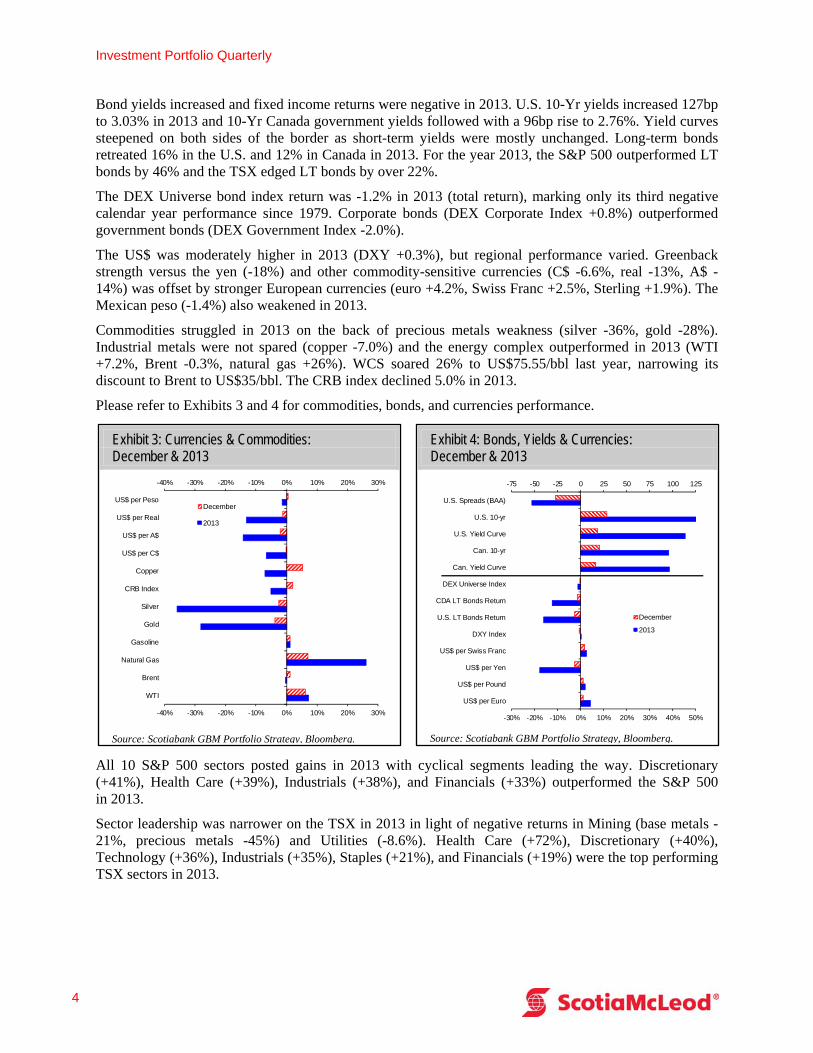
Exhibit 3: Currencies & Commodities: December & 2013
-40% -30% -20% -10% 0% 10% 20% 30%
-40% -30% -20% -10% 0% 10% 20% 30%
WTI
Brent
Natural Gas
Gasoline
Gold
Silver
CRB Index
Copper
US$ per C$
US$ per A$
US$ per Real
US$ per PesoDecember
2013
Source: Scotiabank GBM Portfolio Strategy, Bloomberg.
Exhibit 4: Bonds, Yields & Currencies: December & 2013
-75 -50 -25 0 25 50 75 100 125
-30% -20% -10% 0% 10% 20% 30% 40% 50%
US$ per Euro
US$ per Pound
US$ per Yen
US$ per Swiss Franc
DXY Index
U.S. LT Bonds Return
CDA LT Bonds Return
DEX Universe Index
Can. Yield Curve
Can. 10-yr
U.S. Yield Curve
U.S. 10-yr
U.S. Spreads (BAA)
December
2013
Source: Scotiabank GBM Portfolio Strategy, Bloomberg.
Bond yields increased and fixed income returns were negative in 2013. U.S. 10-Yr yields increased 127bp to 3.03% in 2013 and 10-Yr Canada government yields followed with a 96bp rise to 2.76%. Yield curves steepened on both sides of the border as short-term yields were mostly unchanged. Long-term bonds retreated 16% in the U.S. and 12% in Canada in 2013. For the year 2013, the S&P 500 outperformed LT bonds by 46% and the TSX edged LT bonds by over 22%.
The DEX Universe bond index return was -1.2% in 2013 (total return), marking only its third negative calendar year performance since 1979. Corporate bonds (DEX Corporate Index +0.8%) outperformed government bonds (DEX Government Index -2.0%).
The US$ was moderately higher in 2013 (DXY +0.3%), but regional performance varied. Greenback strength versus the yen (-18%) and other commodity-sensitive currencies (C$ -6.6%, real -13%, A$ -14%) was offset by stronger European currencies (euro +4.2%, Swiss Franc +2.5%, Sterling +1.9%). The Mexican peso (-1.4%) also weakened in 2013.
Commodities struggled in 2013 on the back of precious metals weakness (silver -36%, gold -28%). Industrial metals were not spared (copper -7.0%) and the energy complex outperformed in 2013 (WTI +7.2%, Brent -0.3%, natural gas +26%). WCS soared 26% to US$75.55/bbl last year, narrowing its discount to Brent to US$35/bbl. The CRB index declined 5.0% in 2013.
Please refer to Exhibits 3 and 4 for commodities, bonds, and currencies performance.
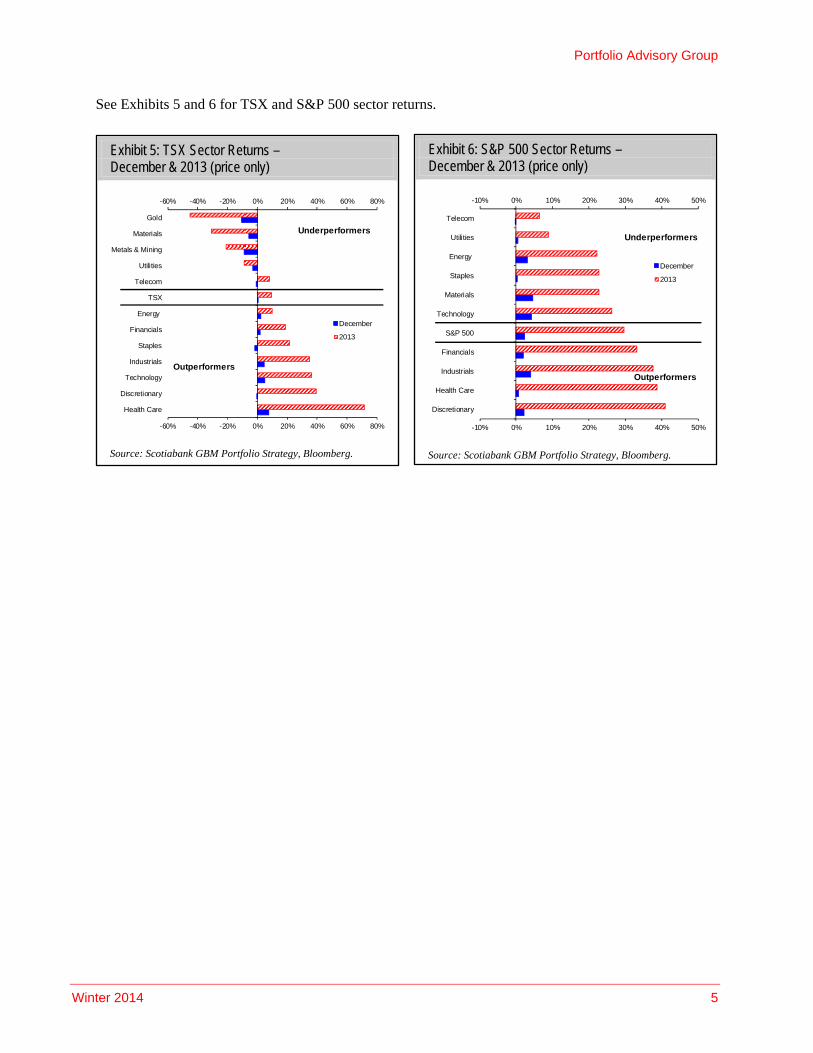
All 10 S&P 500 sectors posted gains in 2013 with cyclical segments leading the way. Discretionary (+41%), Health Care (+39%), Industrials (+38%), and Financials (+33%) outperformed the S&P 500 in 2013.
Sector leadership was narrower on the TSX in 2013 in light of negative returns in Mining (base metals -21%, precious metals -45%) and Utilities (-8.6%). Health Care (+72%), Discretionary (+40%), Technology (+36%), Industrials (+35%), Staples (+21%), and Financials (+19%) were the top performing TSX sectors in 2013.
Portfolio Advisory Group
Winter 2014 5
Exhibit 5: TSX Sector Returns – December & 2013 (price only)
-60% -40% -20% 0% 20% 40% 60% 80%
-60% -40% -20% 0% 20% 40% 60% 80%
Health Care
Discretionary
Technology
Industrials
Staples
Financials
Energy
TSX
Telecom
Utilities
Metals & Mining
Materials
Gold
December
2013
Underperformers
Outperformers
Source: Scotiabank GBM Portfolio Strategy, Bloomberg.
Exhibit 6: S&P 500 Sector Returns – December & 2013 (price only)
-10% 0% 10% 20% 30% 40% 50%
-10% 0% 10% 20% 30% 40% 50%
Discretionary
Health Care
Industrials
Financials
S&P 500
Technology
Materials
Staples
Energy
Utilities
Telecom
December
2013
Underperformers
Outperformers
Source: Scotiabank GBM Portfolio Strategy, Bloomberg.
See Exhibits 5 and 6 for TSX and S&P 500 sector returns.
Investment Portfolio Quarterly
6
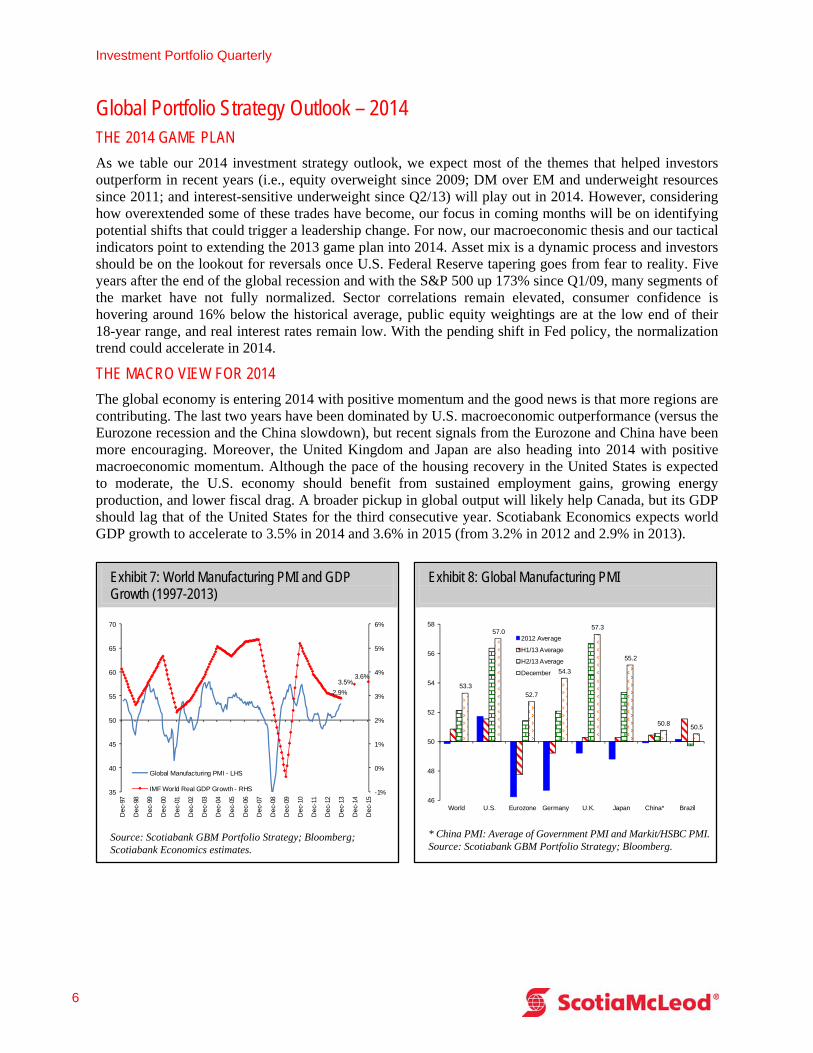
Exhibit 7: World Manufacturing PMI and GDP Growth (1997-2013)
2.9%
3.5%3.6%
-1%
0%
1%
2%
3%
4%
5%
6%
35
40
45
50
55
60
65
70
Dec
-97
Dec
-98
Dec
-99
Dec
-00
Dec
-01
Dec
-02
Dec
-03
Dec
-04
Dec
-05
Dec
-06
Dec
-07
Dec
-08
Dec
-09
Dec
-10
Dec
-11
Dec
-12
Dec
-13
Dec
-14
Dec
-15
Global Manufacturing PMI - LHS
IMF World Real GDP Growth - RHS
Source: Scotiabank GBM Portfolio Strategy; Bloomberg; Scotiabank Economics estimates.
Exhibit 8: Global Manufacturing PMI
53.3
57.0
52.7
54.3
57.3
55.2
50.8 50.5
46
48
50
52
54
56
58
World U.S. Eurozone Germany U.K. Japan China* Brazil
2012 Average
H1/13 Average
H2/13 Average
December
* China PMI: Average of Government PMI and Markit/HSBC PMI. Source: Scotiabank GBM Portfolio Strategy; Bloomberg.
Global Portfolio Strategy Outlook – 2014 THE 2014 GAME PLAN
As we table our 2014 investment strategy outlook, we expect most of the themes that helped investors outperform in recent years (i.e., equity overweight since 2009; DM over EM and underweight resources since 2011; and interest-sensitive underweight since Q2/13) will play out in 2014. However, considering how overextended some of these trades have become, our focus in coming months will be on identifying potential shifts that could trigger a leadership change. For now, our macroeconomic thesis and our tactical indicators point to extending the 2013 game plan into 2014. Asset mix is a dynamic process and investors should be on the lookout for reversals once U.S. Federal Reserve tapering goes from fear to reality. Five years after the end of the global recession and with the S&P 500 up 173% since Q1/09, many segments of the market have not fully normalized. Sector correlations remain elevated, consumer confidence is hovering around 16% below the historical average, public equity weightings are at the low end of their 18-year range, and real interest rates remain low. With the pending shift in Fed policy, the normalization trend could accelerate in 2014.
THE MACRO VIEW FOR 2014
The global economy is entering 2014 with positive momentum and the good news is that more regions are contributing. The last two years have been dominated by U.S. macroeconomic outperformance (versus the Eurozone recession and the China slowdown), but recent signals from the Eurozone and China have been more encouraging. Moreover, the United Kingdom and Japan are also heading into 2014 with positive macroeconomic momentum. Although the pace of the housing recovery in the United States is expected to moderate, the U.S. economy should benefit from sustained employment gains, growing energy production, and lower fiscal drag. A broader pickup in global output will likely help Canada, but its GDP should lag that of the United States for the third consecutive year. Scotiabank Economics expects world GDP growth to accelerate to 3.5% in 2014 and 3.6% in 2015 (from 3.2% in 2012 and 2.9% in 2013).
Portfolio Advisory Group
Winter 2014 7
Exhibit 9: U.S. 10-Year Yield, Jobless Claims, and Consumer Confidence (1998-2013)
0
20
40
60
80
100
120
140
1.0
2.0
3.0
4.0
5.0
6.0
7.0
Jan-
98
Jan-
99
Jan-
00
Jan-
01
Jan-
02
Jan-
03
Jan-
04
Jan-
05
Jan-
06
Jan-
07
Jan-
08
Jan-
09
Jan-
10
Jan-
11
Jan-
12
Jan-
13
Jan-
14
Jan-
15
U.S. 10-Yr Yield - LHS
Initial Jobless Claims (Inverted,Normalized) - RHS
Consumer Confidence(Normalized) - RHS
%
Source: Scotiabank GBM Portfolio Strategy; Bloomberg.
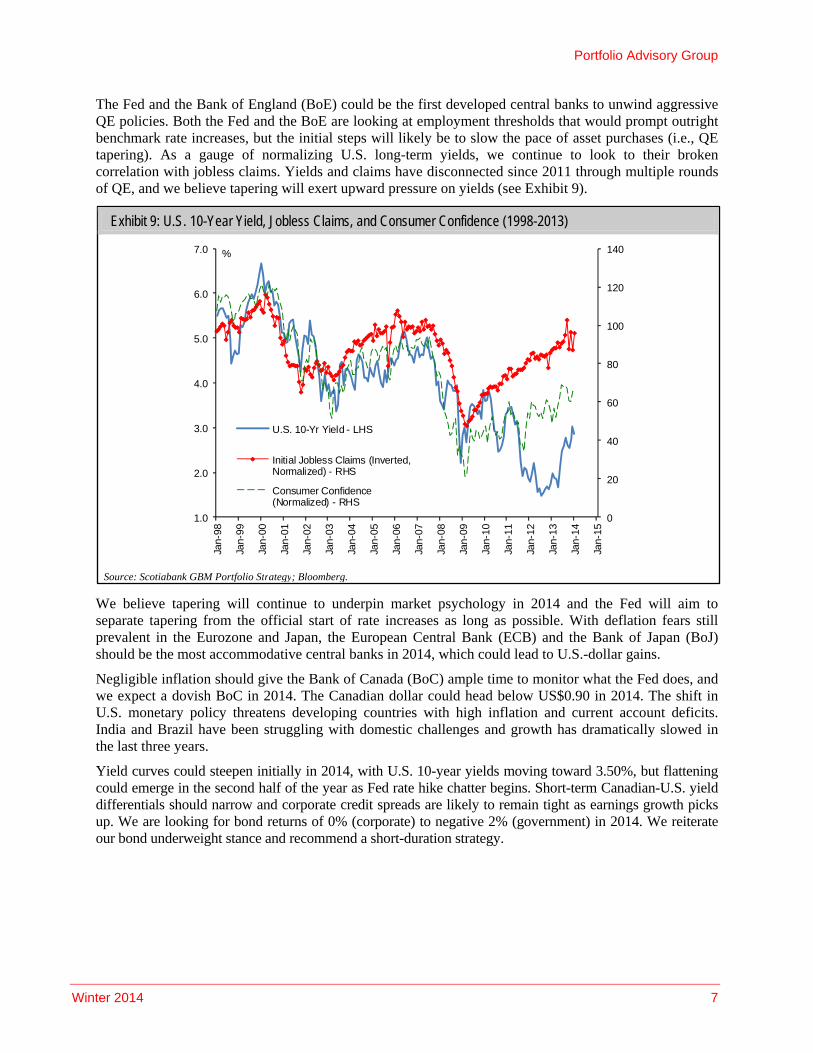
The Fed and the Bank of England (BoE) could be the first developed central banks to unwind aggressive QE policies. Both the Fed and the BoE are looking at employment thresholds that would prompt outright benchmark rate increases, but the initial steps will likely be to slow the pace of asset purchases (i.e., QE tapering). As a gauge of normalizing U.S. long-term yields, we continue to look to their broken correlation with jobless claims. Yields and claims have disconnected since 2011 through multiple rounds of QE, and we believe tapering will exert upward pressure on yields (see Exhibit 9).
We believe tapering will continue to underpin market psychology in 2014 and the Fed will aim to separate tapering from the official start of rate increases as long as possible. With deflation fears still prevalent in the Eurozone and Japan, the European Central Bank (ECB) and the Bank of Japan (BoJ) should be the most accommodative central banks in 2014, which could lead to U.S.-dollar gains.
Negligible inflation should give the Bank of Canada (BoC) ample time to monitor what the Fed does, and we expect a dovish BoC in 2014. The Canadian dollar could head below US$0.90 in 2014. The shift in U.S. monetary policy threatens developing countries with high inflation and current account deficits. India and Brazil have been struggling with domestic challenges and growth has dramatically slowed in the last three years.
Yield curves could steepen initially in 2014, with U.S. 10-year yields moving toward 3.50%, but flattening could emerge in the second half of the year as Fed rate hike chatter begins. Short-term Canadian-U.S. yield differentials should narrow and corporate credit spreads are likely to remain tight as earnings growth picks up. We are looking for bond returns of 0% (corporate) to negative 2% (government) in 2014. We reiterate our bond underweight stance and recommend a short-duration strategy.
Investment Portfolio Quarterly
8
Exhibit 10: S&P 500 Earnings Growth and Yield Curve (1954-2013)
-50%
-25%
0%
25%
50%
75%
100%
125%
-200
-100
0
100
200
300
400
500
Q1 1
954
Q1 1
957
Q1 1
960
Q1 1
963
Q1 1
966
Q1 1
969
Q1 1
972
Q1 1
975
Q1 1
978
Q1 1
981
Q1 1
984
Q1 1
987
Q1 1
990
Q1 1
993
Q1 1
996
Q1 1
999
Q1 2
002
Q1 2
005
Q1 2
008
Q1 2
011
Q1 2
014
NBER Recessions
Yield Curve (U.S. Gov. 10-Yrless 3-M) - LHSS&P 500 YoY EPS Growth(T+18M) - RHS
Source: Scotiabank GBM Portfolio Strategy; Bloomberg; S&P.
Exhibit 11: U.S.-Canada Bond Yield Spreads
-90
-60
-30
0
30
60
90
120
-90
-60
-30
0
30
60
90
120
Jan
-07
Jul-0
7
Jan
-08
Jul-0
8
Jan
-09
Jul-0
9
Jan
-10
Jul-1
0
Jan
-11
Jul-1
1
Jan
-12
Jul-1
2
Jan
-13
Jul-1
3
Jan
-14
Jul-1
4
10-Yr Bond Spread U.S. less Canada (bp)
2-Yr Bond Spread U.S. less Canada (bp)
Source: Scotiabank GBM Portfolio Strategy; Bloomberg.
Exhibit 12: Scotiabank GBM Financial Forecasts
Forecasts 2011 2012 2013E 2014E 2015E
S&P/TSX 11,955 12,434 13,622 14,200
EPS 833 818 833 900 950
S&P 500 1,258 1,426 1,848 1,950
EPS 96 99 108 117 125Mexico Bolsa 37,078 43,706 42,727 45,000
Brazil Bovespa 56,754 60,952 51,507 56,000
Chile IPSA 4,178 4,301 3,699 4,100
Equity
Source: Scotiabank GBM Portfolio Strategy estimates.
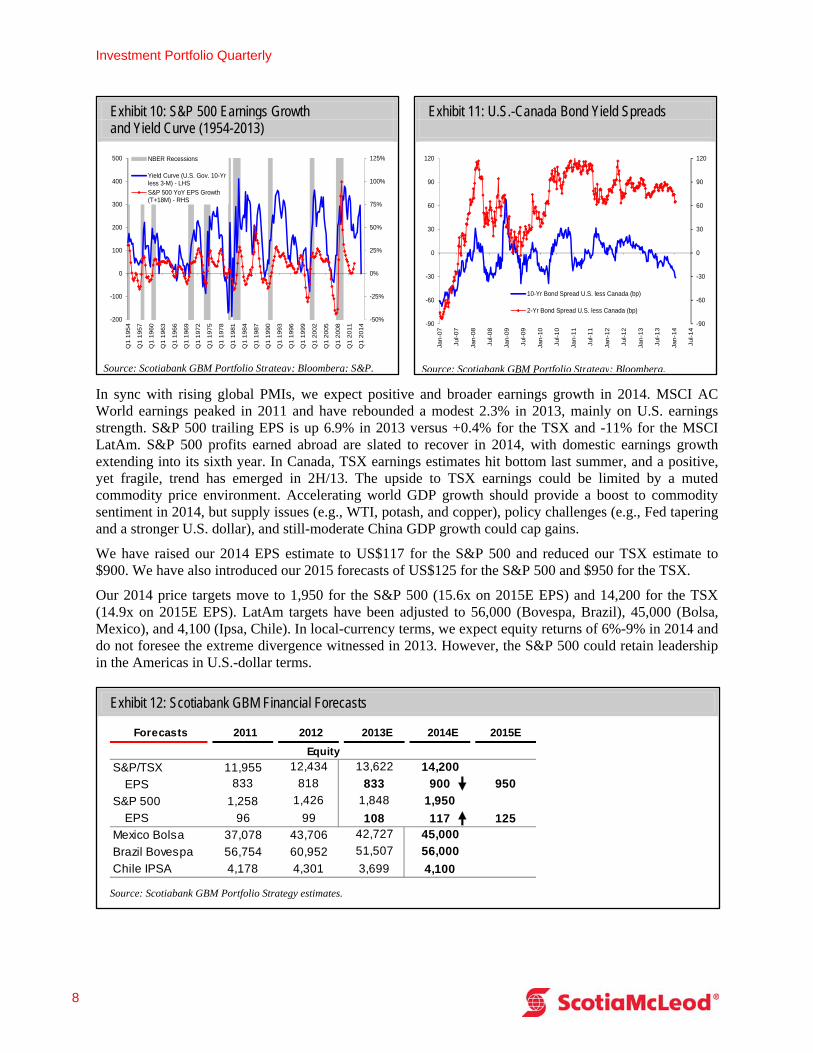
In sync with rising global PMIs, we expect positive and broader earnings growth in 2014. MSCI AC World earnings peaked in 2011 and have rebounded a modest 2.3% in 2013, mainly on U.S. earnings strength. S&P 500 trailing EPS is up 6.9% in 2013 versus +0.4% for the TSX and -11% for the MSCI LatAm. S&P 500 profits earned abroad are slated to recover in 2014, with domestic earnings growth extending into its sixth year. In Canada, TSX earnings estimates hit bottom last summer, and a positive, yet fragile, trend has emerged in 2H/13. The upside to TSX earnings could be limited by a muted commodity price environment. Accelerating world GDP growth should provide a boost to commodity sentiment in 2014, but supply issues (e.g., WTI, potash, and copper), policy challenges (e.g., Fed tapering and a stronger U.S. dollar), and still-moderate China GDP growth could cap gains.
We have raised our 2014 EPS estimate to US$117 for the S&P 500 and reduced our TSX estimate to $900. We have also introduced our 2015 forecasts of US$125 for the S&P 500 and $950 for the TSX.
Our 2014 price targets move to 1,950 for the S&P 500 (15.6x on 2015E EPS) and 14,200 for the TSX (14.9x on 2015E EPS). LatAm targets have been adjusted to 56,000 (Bovespa, Brazil), 45,000 (Bolsa, Mexico), and 4,100 (Ipsa, Chile). In local-currency terms, we expect equity returns of 6%-9% in 2014 and do not foresee the extreme divergence witnessed in 2013. However, the S&P 500 could retain leadership in the Americas in U.S.-dollar terms.
Portfolio Advisory Group
Winter 2014 9
Exhibit 13: Scotiabank GBM Asset Mix – January 2014 Update
Change FromBenchmark Recommended Last
Equities 60% 65% +2% Canada (TSX) 5% 5% U.S. (S&P 500) 22% 26% +2% MSCI EAFE 18% 22% (1. Europe, 2. Japan, 3. Australia)
Far East ex-Japan 10% 9% LatAm 5% 3%
Bonds 40% 30% -2% Government 30% 16% -2% Corporate 10% 14%
Cash (91-D Tbills) 0% 5%
Asset Mix
Source: Scotiabank GBM Portfolio Strategy estimates.
Exhibit 14: Tactical Asset Mix Signals – January 2014
Last 3M Trend Q4-13 Q3-13 Q2-13 Q1-13 Q4-12
Equity vs. Bonds (U.S.) +11% - +14% +9% +15% +14% +8%
Equity vs. Bonds (Canada) +13% + +12% +1% +0% +9% +6%
Sector Strategy (S&P 500)
Cyclical vs. Defensive Sectors +8% + +7% +5% +0% +7% +3%
Global Equity
Canada OW + MW OW UW MW MW
U.S. OW + OW OW OW MW UW
Europe (Western Europe) UW - OW MW OW OW OW
Far East (ex-Japan) UW + UW UW UW OW MW
LatAm UW - UW UW UW UW MW
Source: Scotiabank GBM Portfolio Strategy estimates.
Asset Mix: Stick with Equities in 2014, but Curb Your Enthusiasm
Overweight (OW); Market Weight (MW); Underweight (UW)
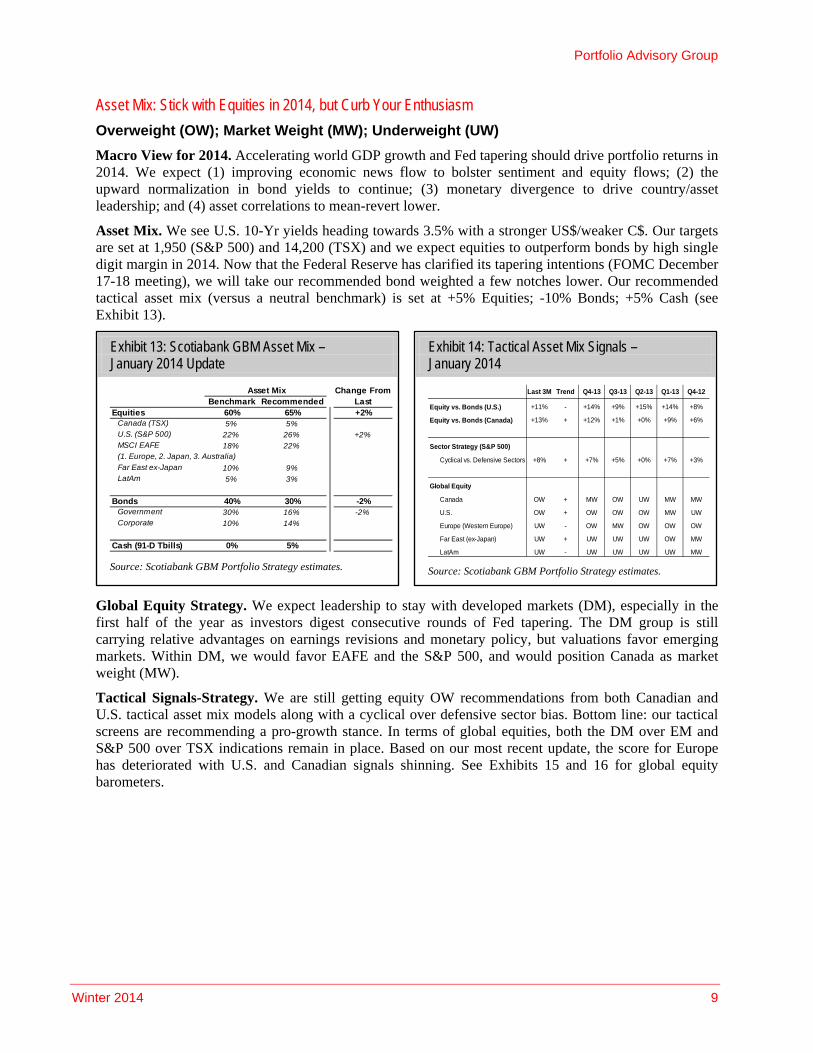
Macro View for 2014. Accelerating world GDP growth and Fed tapering should drive portfolio returns in 2014. We expect (1) improving economic news flow to bolster sentiment and equity flows; (2) the upward normalization in bond yields to continue; (3) monetary divergence to drive country/asset leadership; and (4) asset correlations to mean-revert lower.
Asset Mix. We see U.S. 10-Yr yields heading towards 3.5% with a stronger US$/weaker C$. Our targets are set at 1,950 (S&P 500) and 14,200 (TSX) and we expect equities to outperform bonds by high single digit margin in 2014. Now that the Federal Reserve has clarified its tapering intentions (FOMC December 17-18 meeting), we will take our recommended bond weighted a few notches lower. Our recommended tactical asset mix (versus a neutral benchmark) is set at +5% Equities; -10% Bonds; +5% Cash (see Exhibit 13).
Global Equity Strategy. We expect leadership to stay with developed markets (DM), especially in the first half of the year as investors digest consecutive rounds of Fed tapering. The DM group is still carrying relative advantages on earnings revisions and monetary policy, but valuations favor emerging markets. Within DM, we would favor EAFE and the S&P 500, and would position Canada as market weight (MW).
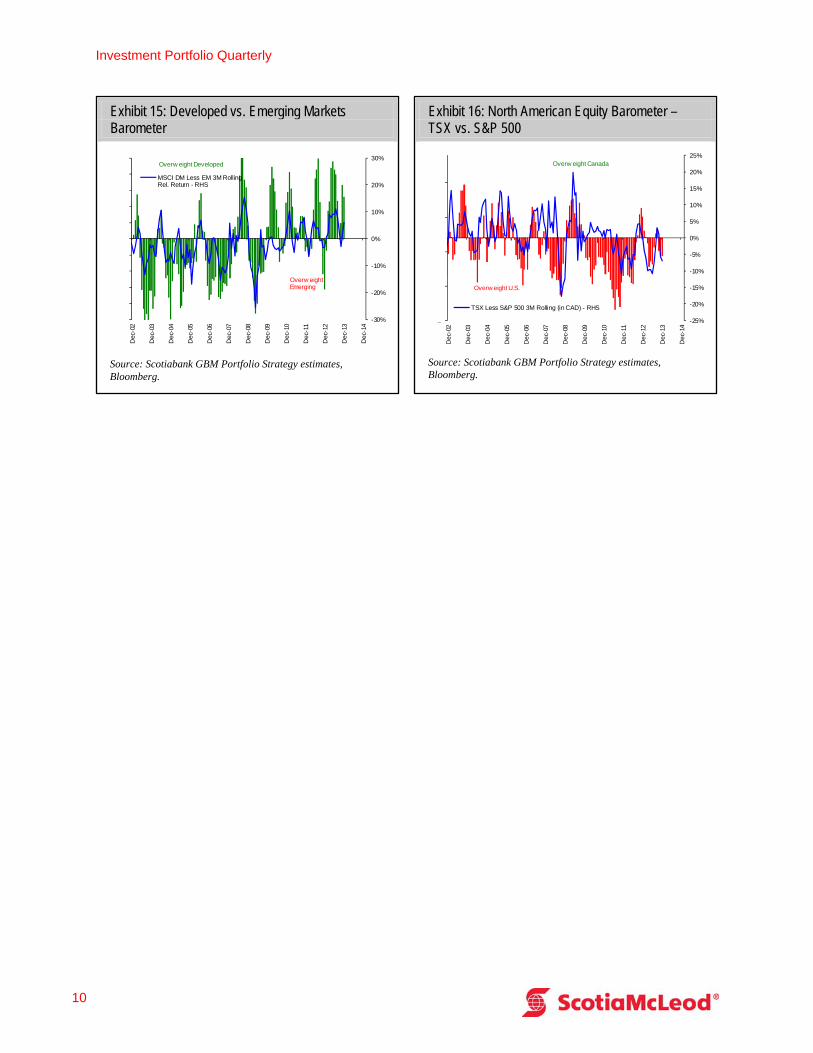
Tactical Signals-Strategy. We are still getting equity OW recommendations from both Canadian and U.S. tactical asset mix models along with a cyclical over defensive sector bias. Bottom line: our tactical screens are recommending a pro-growth stance. In terms of global equities, both the DM over EM and S&P 500 over TSX indications remain in place. Based on our most recent update, the score for Europe has deteriorated with U.S. and Canadian signals shinning. See Exhibits 15 and 16 for global equity barometers.
Investment Portfolio Quarterly
10
Exhibit 15: Developed vs. Emerging Markets Barometer
-30%
-20%
-10%
0%
10%
20%
30%
-1
-0.8
-0.6
-0.4
-0.2
0
0.2
0.4
0.6
0.8
1
Dec
-02
Dec
-03
Dec
-04
Dec
-05
Dec
-06
Dec
-07
Dec
-08
Dec
-09
Dec
-10
Dec
-11
Dec
-12
Dec
-13
Dec
-14
MSCI DM Less EM 3M RollingRel. Return - RHS
Overw eight Emerging
Overw eight Developed
Source: Scotiabank GBM Portfolio Strategy estimates, Bloomberg.
Exhibit 16: North American Equity Barometer – TSX vs. S&P 500
-25%
-20%
-15%
-10%
-5%
0%
5%
10%
15%
20%
25%
-1
-1
0
0
1
Dec
-02
Dec
-03
Dec
-04
Dec
-05
Dec
-06
Dec
-07
Dec
-08
Dec
-09
Dec
-10
Dec
-11
Dec
-12
Dec
-13
Dec
-14
TSX Less S&P 500 3M Rolling (in CAD) - RHS
Overw eight U.S.
Overw eight Canada
Source: Scotiabank GBM Portfolio Strategy estimates, Bloomberg.
Portfolio Advisory Group
Winter 2014 11
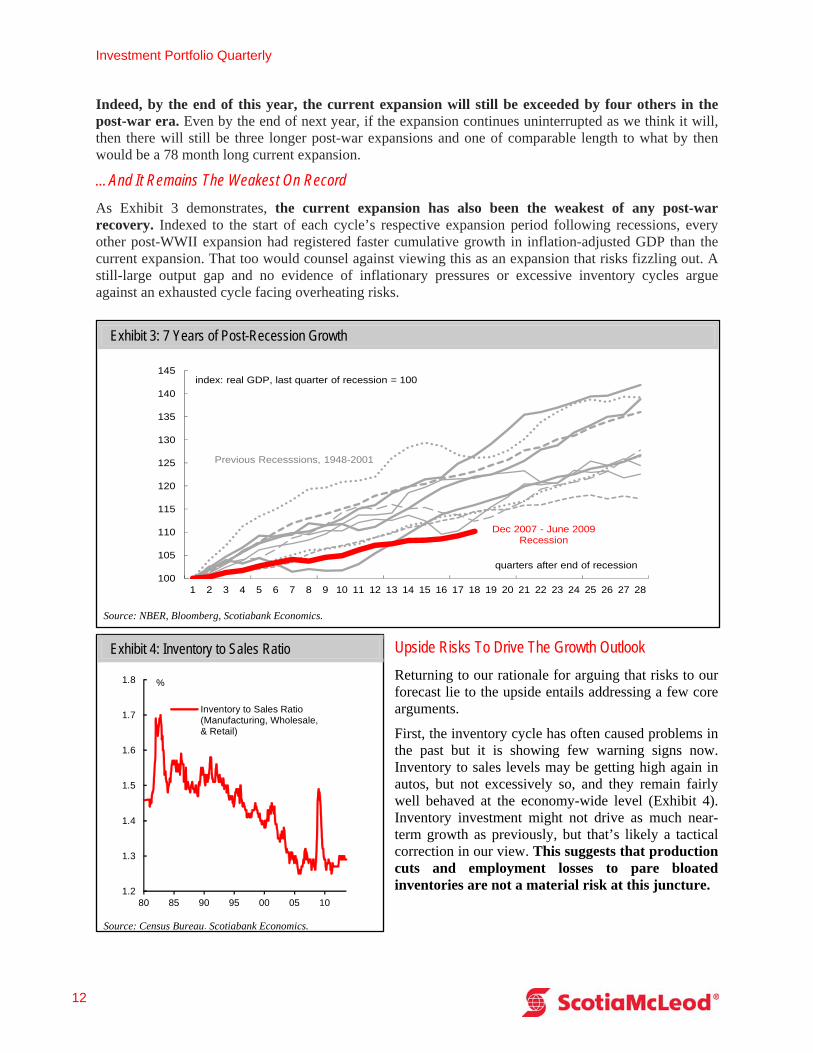
Exhibit 2: Still A Young Expansion
Source: NBER, Scotiabank Economics.
Economic and Market Outlook
U.S. Economic Outlook: Enter the Bear Flattener Derek Holt, MA, MBA, CFA – Vice-President, Scotiabank Economics
Dov Zigler, MA – Scotiabank Economics
We view this recovery as having only just begun in earnest and believe in a fairly bullish outlook with upside risks to our growth and interest rate forecasts. In contrast to the tail risk offered up within the range of consensus opinions that the expansion is already growing old and threatens to turn south, we think the bigger tail risk to consensus forecast opinions over 2014-15 lies in the direction of a stronger-
than-expected U.S. recovery with Bloomberg’s consensus at 2.6% in 2014 and 3% growth in 2015.
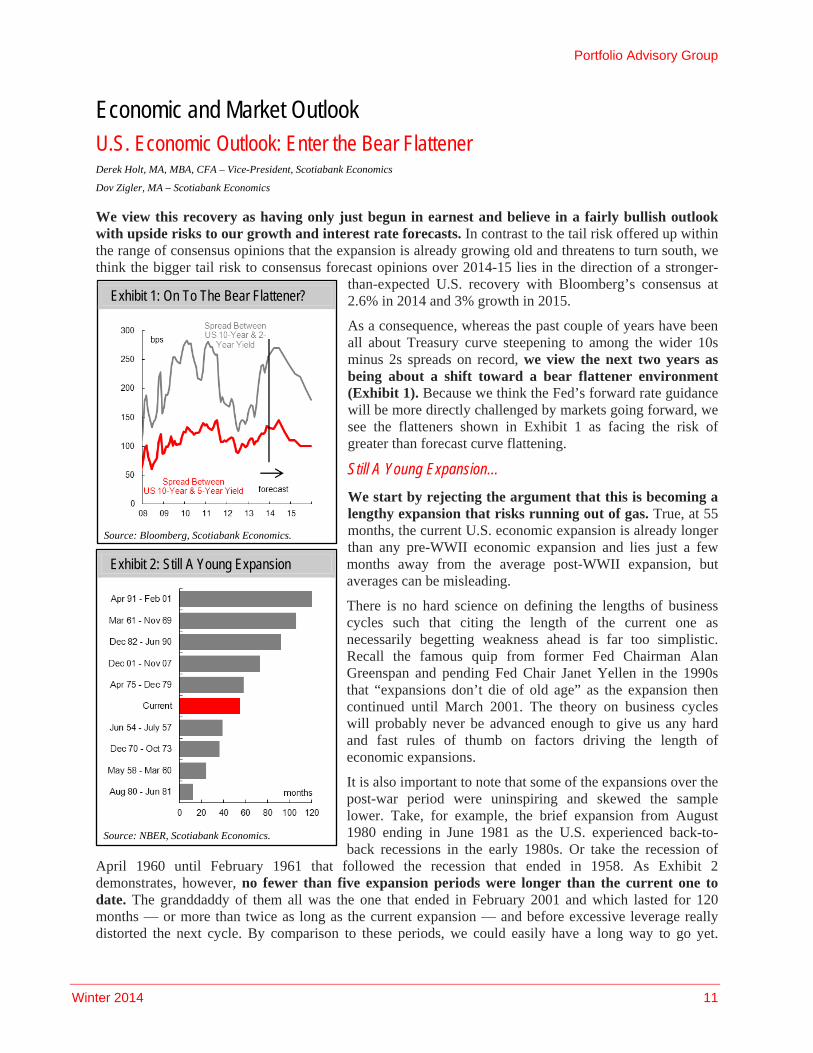
As a consequence, whereas the past couple of years have been all about Treasury curve steepening to among the wider 10s minus 2s spreads on record, we view the next two years as being about a shift toward a bear flattener environment (Exhibit 1). Because we think the Fed’s forward rate guidance will be more directly challenged by markets going forward, we see the flatteners shown in Exhibit 1 as facing the risk of greater than forecast curve flattening.
Still A Young Expansion...
We start by rejecting the argument that this is becoming a lengthy expansion that risks running out of gas. True, at 55 months, the current U.S. economic expansion is already longer than any pre-WWII economic expansion and lies just a few months away from the average post-WWII expansion, but averages can be misleading.
There is no hard science on defining the lengths of business cycles such that citing the length of the current one as necessarily begetting weakness ahead is far too simplistic. Recall the famous quip from former Fed Chairman Alan Greenspan and pending Fed Chair Janet Yellen in the 1990s that “expansions don’t die of old age” as the expansion then continued until March 2001. The theory on business cycles will probably never be advanced enough to give us any hard and fast rules of thumb on factors driving the length of economic expansions.
It is also important to note that some of the expansions over the post-war period were uninspiring and skewed the sample lower. Take, for example, the brief expansion from August 1980 ending in June 1981 as the U.S. experienced back-to-back recessions in the early 1980s. Or take the recession of
April 1960 until February 1961 that followed the recession that ended in 1958. As Exhibit 2 demonstrates, however, no fewer than five expansion periods were longer than the current one to date. The granddaddy of them all was the one that ended in February 2001 and which lasted for 120 months — or more than twice as long as the current expansion — and before excessive leverage really distorted the next cycle. By comparison to these periods, we could easily have a long way to go yet.
Exhibit 1: On To The Bear Flattener?
Source: Bloomberg, Scotiabank Economics.
Investment Portfolio Quarterly
12
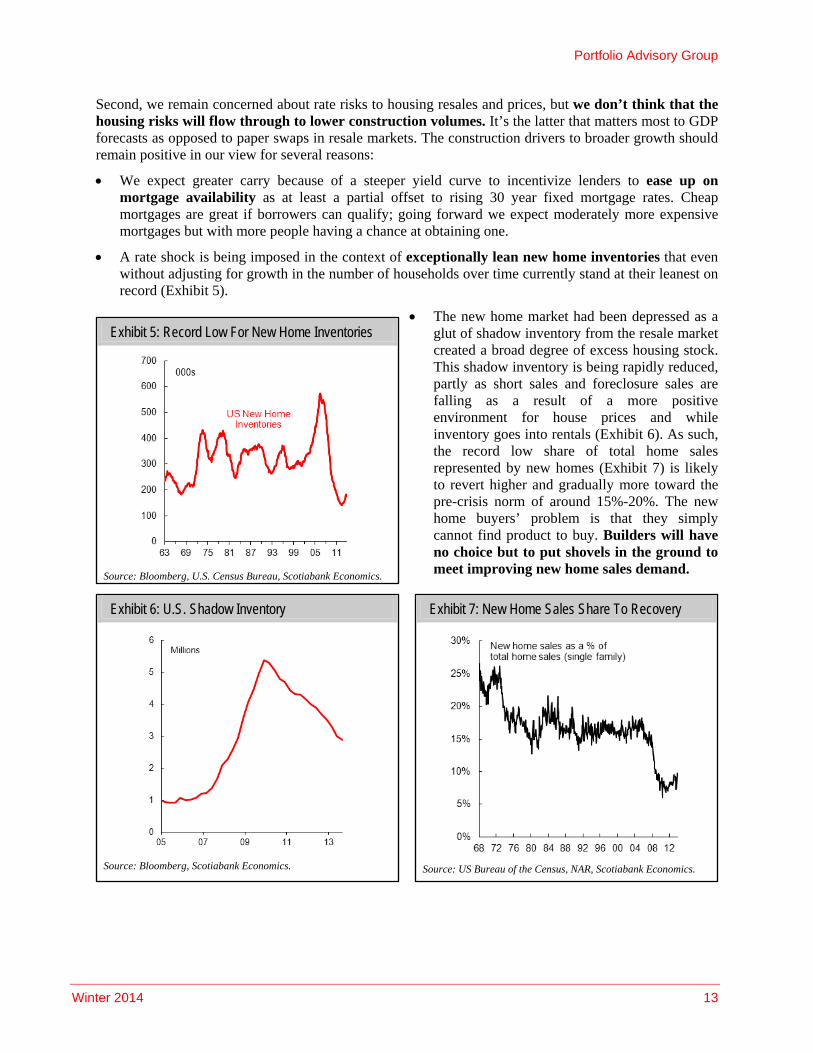
Exhibit 3: 7 Years of Post-Recession Growth
100
105
110
115
120
125
130
135
140
145
1 2 3 4 5 6 7 8 9 10 11 12 13 14 15 16 17 18 19 20 21 22 23 24 25 26 27 28
index: real GDP, last quarter of recession = 100
Dec 2007 - June 2009 Recession
quarters after end of recession
Previous Recesssions, 1948-2001
Source: NBER, Bloomberg, Scotiabank Economics.
Exhibit 4: Inventory to Sales Ratio
1.2
1.3
1.4
1.5
1.6
1.7
1.8
80 85 90 95 00 05 10
Inventory to Sales Ratio(Manufacturing, Wholesale,& Retail)
%
Source: Census Bureau, Scotiabank Economics.
Indeed, by the end of this year, the current expansion will still be exceeded by four others in the post-war era. Even by the end of next year, if the expansion continues uninterrupted as we think it will, then there will still be three longer post-war expansions and one of comparable length to what by then would be a 78 month long current expansion.
…And It Remains The Weakest On Record
As Exhibit 3 demonstrates, the current expansion has also been the weakest of any post-war recovery. Indexed to the start of each cycle’s respective expansion period following recessions, every other post-WWII expansion had registered faster cumulative growth in inflation-adjusted GDP than the current expansion. That too would counsel against viewing this as an expansion that risks fizzling out. A still-large output gap and no evidence of inflationary pressures or excessive inventory cycles argue against an exhausted cycle facing overheating risks.
Upside Risks To Drive The Growth Outlook
Returning to our rationale for arguing that risks to our forecast lie to the upside entails addressing a few core arguments.
First, the inventory cycle has often caused problems in the past but it is showing few warning signs now. Inventory to sales levels may be getting high again in autos, but not excessively so, and they remain fairly well behaved at the economy-wide level (Exhibit 4). Inventory investment might not drive as much near-term growth as previously, but that’s likely a tactical correction in our view. This suggests that production cuts and employment losses to pare bloated inventories are not a material risk at this juncture.
Portfolio Advisory Group
Winter 2014 13
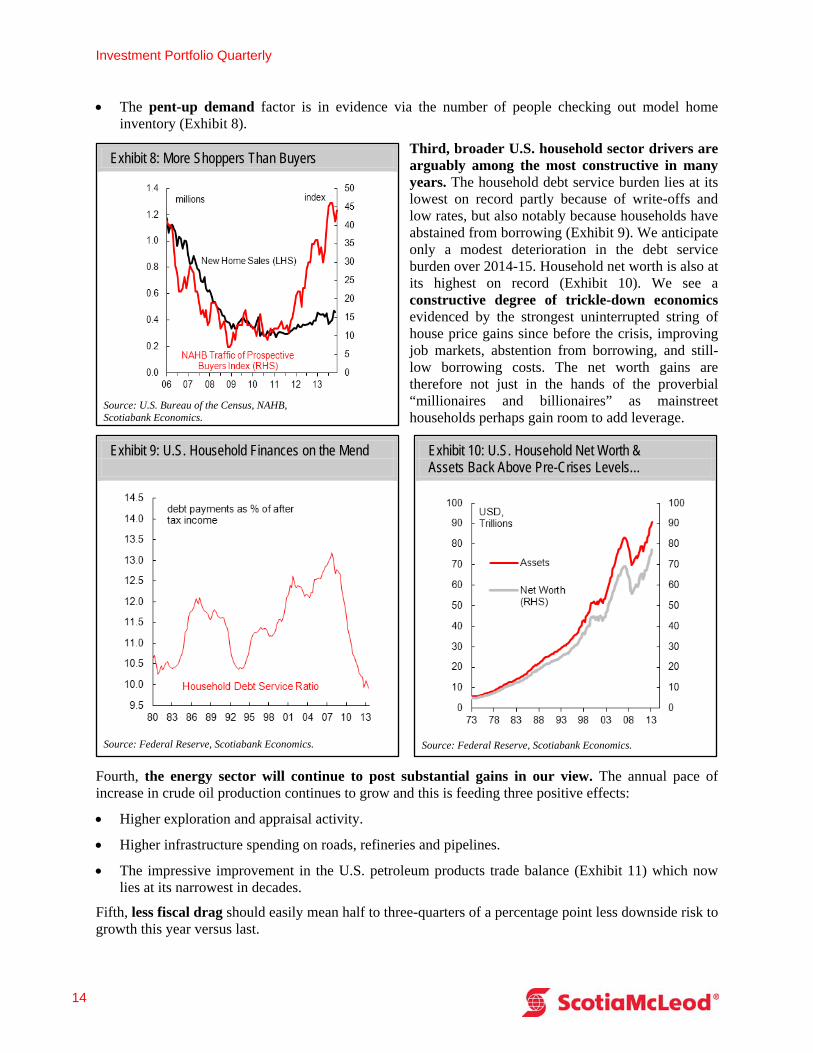
Exhibit 5: Record Low For New Home Inventories
Source: Bloomberg, U.S. Census Bureau, Scotiabank Economics.
Exhibit 6: U.S. Shadow Inventory
Source: Bloomberg, Scotiabank Economics.
Exhibit 7: New Home Sales Share To Recovery
Source: US Bureau of the Census, NAR, Scotiabank Economics.
Second, we remain concerned about rate risks to housing resales and prices, but we don’t think that the housing risks will flow through to lower construction volumes. It’s the latter that matters most to GDP forecasts as opposed to paper swaps in resale markets. The construction drivers to broader growth should remain positive in our view for several reasons:
We expect greater carry because of a steeper yield curve to incentivize lenders to ease up on mortgage availability as at least a partial offset to rising 30 year fixed mortgage rates. Cheap mortgages are great if borrowers can qualify; going forward we expect moderately more expensive mortgages but with more people having a chance at obtaining one.
A rate shock is being imposed in the context of exceptionally lean new home inventories that even without adjusting for growth in the number of households over time currently stand at their leanest on record (Exhibit 5).
The new home market had been depressed as a glut of shadow inventory from the resale market created a broad degree of excess housing stock. This shadow inventory is being rapidly reduced, partly as short sales and foreclosure sales are falling as a result of a more positive environment for house prices and while inventory goes into rentals (Exhibit 6). As such, the record low share of total home sales represented by new homes (Exhibit 7) is likely to revert higher and gradually more toward the pre-crisis norm of around 15%-20%. The new home buyers’ problem is that they simply cannot find product to buy. Builders will have no choice but to put shovels in the ground to meet improving new home sales demand.
Investment Portfolio Quarterly
14
Exhibit 8: More Shoppers Than Buyers
Source: U.S. Bureau of the Census, NAHB, Scotiabank Economics.
Exhibit 10: U.S. Household Net Worth & Assets Back Above Pre-Crises Levels…
Source: Federal Reserve, Scotiabank Economics.
Exhibit 9: U.S. Household Finances on the Mend
Source: Federal Reserve, Scotiabank Economics.
The pent-up demand factor is in evidence via the number of people checking out model home inventory (Exhibit 8).
Third, broader U.S. household sector drivers are arguably among the most constructive in many years. The household debt service burden lies at its lowest on record partly because of write-offs and low rates, but also notably because households have abstained from borrowing (Exhibit 9). We anticipate only a modest deterioration in the debt service burden over 2014-15. Household net worth is also at its highest on record (Exhibit 10). We see a constructive degree of trickle-down economics evidenced by the strongest uninterrupted string of house price gains since before the crisis, improving job markets, abstention from borrowing, and still-low borrowing costs. The net worth gains are therefore not just in the hands of the proverbial “millionaires and billionaires” as mainstreet households perhaps gain room to add leverage.
Fourth, the energy sector will continue to post substantial gains in our view. The annual pace of increase in crude oil production continues to grow and this is feeding three positive effects:
Higher exploration and appraisal activity.
Higher infrastructure spending on roads, refineries and pipelines.
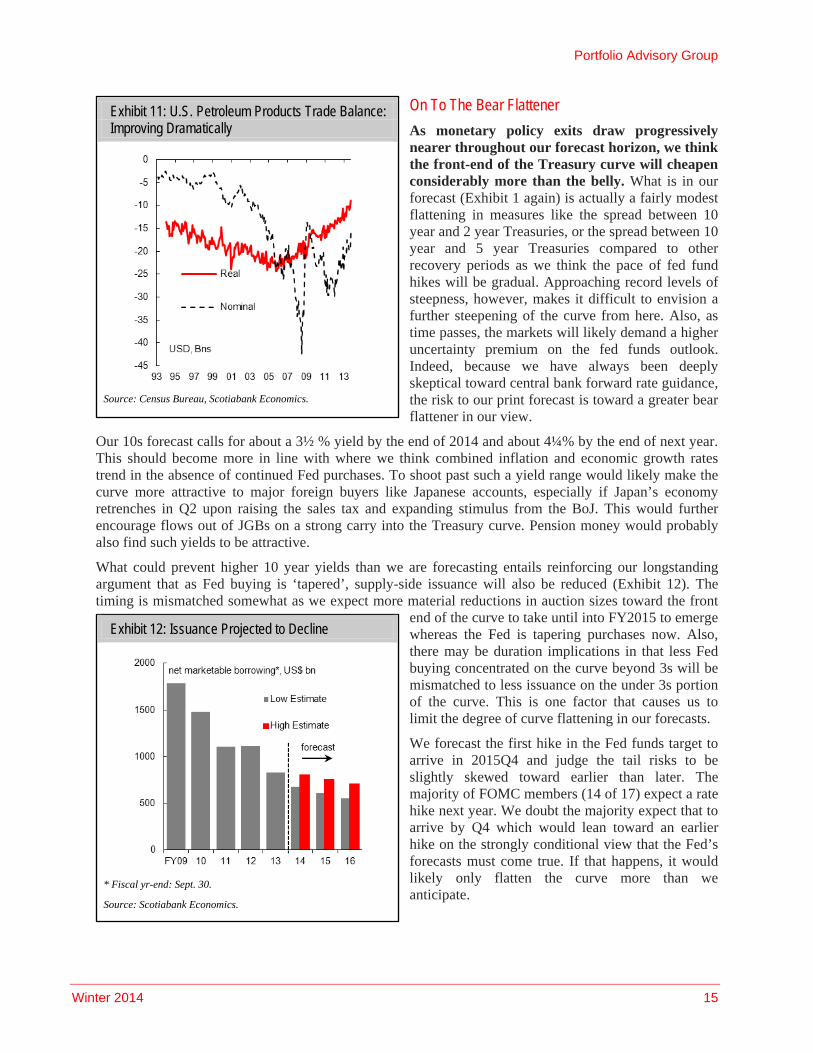
The impressive improvement in the U.S. petroleum products trade balance (Exhibit 11) which now lies at its narrowest in decades.
Fifth, less fiscal drag should easily mean half to three-quarters of a percentage point less downside risk to growth this year versus last.
Portfolio Advisory Group
Winter 2014 15
Exhibit 11: U.S. Petroleum Products Trade Balance: Improving Dramatically
Source: Census Bureau, Scotiabank Economics.
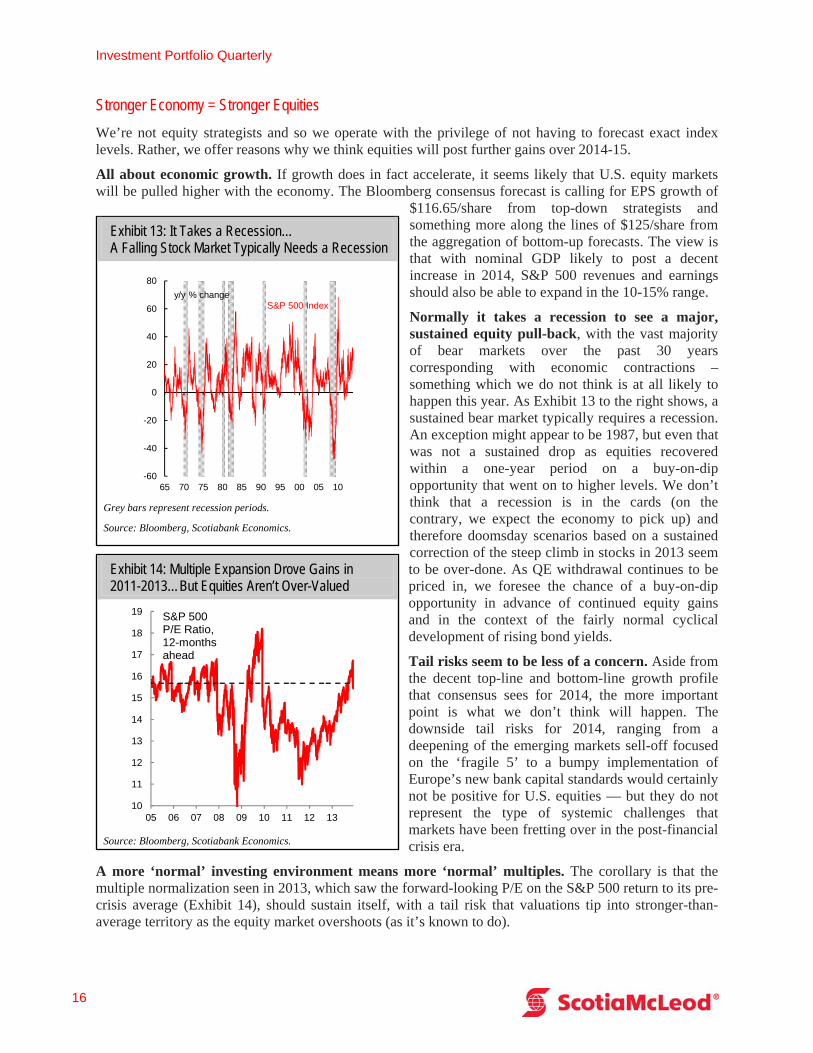
Exhibit 12: Issuance Projected to Decline
* Fiscal yr-end: Sept. 30.
Source: Scotiabank Economics.
On To The Bear Flattener
As monetary policy exits draw progressively nearer throughout our forecast horizon, we think the front-end of the Treasury curve will cheapen considerably more than the belly. What is in our forecast (Exhibit 1 again) is actually a fairly modest flattening in measures like the spread between 10 year and 2 year Treasuries, or the spread between 10 year and 5 year Treasuries compared to other recovery periods as we think the pace of fed fund hikes will be gradual. Approaching record levels of steepness, however, makes it difficult to envision a further steepening of the curve from here. Also, as time passes, the markets will likely demand a higher uncertainty premium on the fed funds outlook. Indeed, because we have always been deeply skeptical toward central bank forward rate guidance, the risk to our print forecast is toward a greater bear flattener in our view.
Our 10s forecast calls for about a 3½ % yield by the end of 2014 and about 4¼% by the end of next year. This should become more in line with where we think combined inflation and economic growth rates trend in the absence of continued Fed purchases. To shoot past such a yield range would likely make the curve more attractive to major foreign buyers like Japanese accounts, especially if Japan’s economy retrenches in Q2 upon raising the sales tax and expanding stimulus from the BoJ. This would further encourage flows out of JGBs on a strong carry into the Treasury curve. Pension money would probably also find such yields to be attractive.
What could prevent higher 10 year yields than we are forecasting entails reinforcing our longstanding argument that as Fed buying is ‘tapered’, supply-side issuance will also be reduced (Exhibit 12). The timing is mismatched somewhat as we expect more material reductions in auction sizes toward the front
end of the curve to take until into FY2015 to emerge whereas the Fed is tapering purchases now. Also, there may be duration implications in that less Fed buying concentrated on the curve beyond 3s will be mismatched to less issuance on the under 3s portion of the curve. This is one factor that causes us to limit the degree of curve flattening in our forecasts.
We forecast the first hike in the Fed funds target to arrive in 2015Q4 and judge the tail risks to be slightly skewed toward earlier than later. The majority of FOMC members (14 of 17) expect a rate hike next year. We doubt the majority expect that to arrive by Q4 which would lean toward an earlier hike on the strongly conditional view that the Fed’s forecasts must come true. If that happens, it would likely only flatten the curve more than we anticipate.
Investment Portfolio Quarterly
16
Exhibit 13: It Takes a Recession… A Falling Stock Market Typically Needs a Recession
-60
-40
-20
0
20
40
60
80
65 70 75 80 85 90 95 00 05 10
y/y % changeS&P 500 Index
Grey bars represent recession periods.
Source: Bloomberg, Scotiabank Economics.
Exhibit 14: Multiple Expansion Drove Gains in 2011-2013…But Equities Aren’t Over-Valued
10
11
12
13
14
15
16
17
18
19
05 06 07 08 09 10 11 12 13
S&P 500P/E Ratio,12-monthsahead
Source: Bloomberg, Scotiabank Economics.
Stronger Economy = Stronger Equities
We’re not equity strategists and so we operate with the privilege of not having to forecast exact index levels. Rather, we offer reasons why we think equities will post further gains over 2014-15.
All about economic growth. If growth does in fact accelerate, it seems likely that U.S. equity markets will be pulled higher with the economy. The Bloomberg consensus forecast is calling for EPS growth of
$116.65/share from top-down strategists and something more along the lines of $125/share from the aggregation of bottom-up forecasts. The view is that with nominal GDP likely to post a decent increase in 2014, S&P 500 revenues and earnings should also be able to expand in the 10-15% range.
Normally it takes a recession to see a major, sustained equity pull-back, with the vast majority of bear markets over the past 30 years corresponding with economic contractions – something which we do not think is at all likely to happen this year. As Exhibit 13 to the right shows, a sustained bear market typically requires a recession. An exception might appear to be 1987, but even that was not a sustained drop as equities recovered within a one-year period on a buy-on-dip opportunity that went on to higher levels. We don’t think that a recession is in the cards (on the contrary, we expect the economy to pick up) and therefore doomsday scenarios based on a sustained correction of the steep climb in stocks in 2013 seem to be over-done. As QE withdrawal continues to be priced in, we foresee the chance of a buy-on-dip opportunity in advance of continued equity gains and in the context of the fairly normal cyclical development of rising bond yields.
Tail risks seem to be less of a concern. Aside from the decent top-line and bottom-line growth profile that consensus sees for 2014, the more important point is what we don’t think will happen. The downside tail risks for 2014, ranging from a deepening of the emerging markets sell-off focused on the ‘fragile 5’ to a bumpy implementation of Europe’s new bank capital standards would certainly not be positive for U.S. equities — but they do not represent the type of systemic challenges that markets have been fretting over in the post-financial crisis era.
A more ‘normal’ investing environment means more ‘normal’ multiples. The corollary is that the multiple normalization seen in 2013, which saw the forward-looking P/E on the S&P 500 return to its pre-crisis average (Exhibit 14), should sustain itself, with a tail risk that valuations tip into stronger-than-average territory as the equity market overshoots (as it’s known to do).

Portfolio Advisory Group
Winter 2014 17
A market without major macro-shocks was quite benign for stock multiples in 2013. To remind readers, the major hiccups in 2013 were: a) a ‘fiscal cliff’ scenario that was much less bad than advertised, b) a bank panic in Cyprus that failed to spill over to the rest of the world, and c) fears of Fed tapering which turned out to be somewhat of a non-event for equities by the time the taper actually happened. U.S. equity markets were able to weather moderate shocks, including tail risks that had profound implications for particular assets (Greek and Cypriot banks, defense stocks, 10-year bonds, etc.) but not for the market as a whole. We expect more of the same this year.
Investment Portfolio Quarterly
18
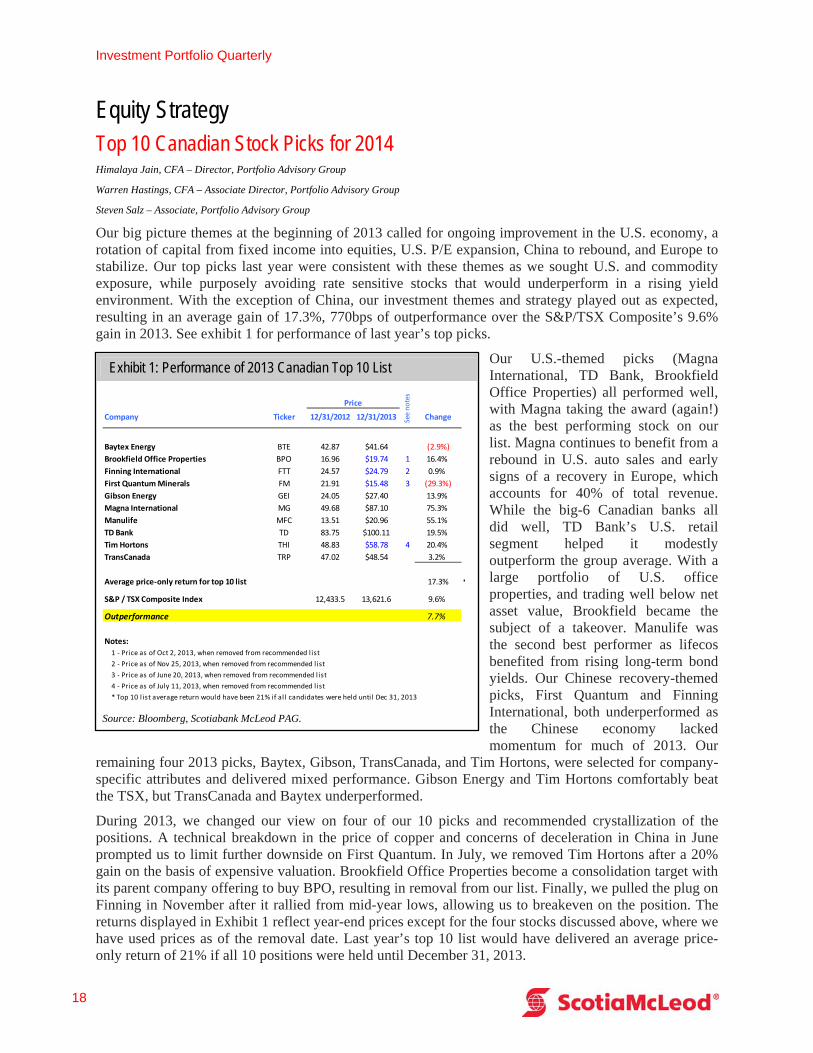
Exhibit 1: Performance of 2013 Canadian Top 10 List
Company Ticker 12/31/2012 12/31/2013 Change
Baytex Energy BTE 42.87 $41.64 (2.9%)
Brookfield Office Properties BPO 16.96 $19.74 1 16.4%
Finning International FTT 24.57 $24.79 2 0.9%
First Quantum Minerals FM 21.91 $15.48 3 (29.3%)
Gibson Energy GEI 24.05 $27.40 13.9%
Magna International MG 49.68 $87.10 75.3%
Manulife MFC 13.51 $20.96 55.1%
TD Bank TD 83.75 $100.11 19.5%
Tim Hortons THI 48.83 $58.78 4 20.4%
TransCanada TRP 47.02 $48.54 3.2%
Average price‐only return for top 10 list 17.3% *
S&P / TSX Composite Index 12,433.5 13,621.6 9.6%
Outperformance 7.7%
Notes:
1 ‐ Price as of Oct 2, 2013, when removed from recommended l ist
2 ‐ Price as of Nov 25, 2013, when removed from recommended l ist
3 ‐ Price as of June 20, 2013, when removed from recommended l ist
4 ‐ Price as of July 11, 2013, when removed from recommended l ist
* Top 10 l ist average return would have been 21% if all candidates were held until Dec 31, 2013
PriceSee notes
Source: Bloomberg, Scotiabank McLeod PAG.
Equity Strategy Top 10 Canadian Stock Picks for 2014 Himalaya Jain, CFA – Director, Portfolio Advisory Group
Warren Hastings, CFA – Associate Director, Portfolio Advisory Group
Steven Salz – Associate, Portfolio Advisory Group
Our big picture themes at the beginning of 2013 called for ongoing improvement in the U.S. economy, a rotation of capital from fixed income into equities, U.S. P/E expansion, China to rebound, and Europe to stabilize. Our top picks last year were consistent with these themes as we sought U.S. and commodity exposure, while purposely avoiding rate sensitive stocks that would underperform in a rising yield environment. With the exception of China, our investment themes and strategy played out as expected, resulting in an average gain of 17.3%, 770bps of outperformance over the S&P/TSX Composite’s 9.6% gain in 2013. See exhibit 1 for performance of last year’s top picks.
Our U.S.-themed picks (Magna International, TD Bank, Brookfield Office Properties) all performed well, with Magna taking the award (again!) as the best performing stock on our list. Magna continues to benefit from a rebound in U.S. auto sales and early signs of a recovery in Europe, which accounts for 40% of total revenue. While the big-6 Canadian banks all did well, TD Bank’s U.S. retail segment helped it modestly outperform the group average. With a large portfolio of U.S. office properties, and trading well below net asset value, Brookfield became the subject of a takeover. Manulife was the second best performer as lifecos benefited from rising long-term bond yields. Our Chinese recovery-themed picks, First Quantum and Finning International, both underperformed as the Chinese economy lacked momentum for much of 2013. Our
remaining four 2013 picks, Baytex, Gibson, TransCanada, and Tim Hortons, were selected for company-specific attributes and delivered mixed performance. Gibson Energy and Tim Hortons comfortably beat the TSX, but TransCanada and Baytex underperformed.
During 2013, we changed our view on four of our 10 picks and recommended crystallization of the positions. A technical breakdown in the price of copper and concerns of deceleration in China in June prompted us to limit further downside on First Quantum. In July, we removed Tim Hortons after a 20% gain on the basis of expensive valuation. Brookfield Office Properties become a consolidation target with its parent company offering to buy BPO, resulting in removal from our list. Finally, we pulled the plug on Finning in November after it rallied from mid-year lows, allowing us to breakeven on the position. The returns displayed in Exhibit 1 reflect year-end prices except for the four stocks discussed above, where we have used prices as of the removal date. Last year’s top 10 list would have delivered an average price-only return of 21% if all 10 positions were held until December 31, 2013.
Portfolio Advisory Group
Winter 2014 19
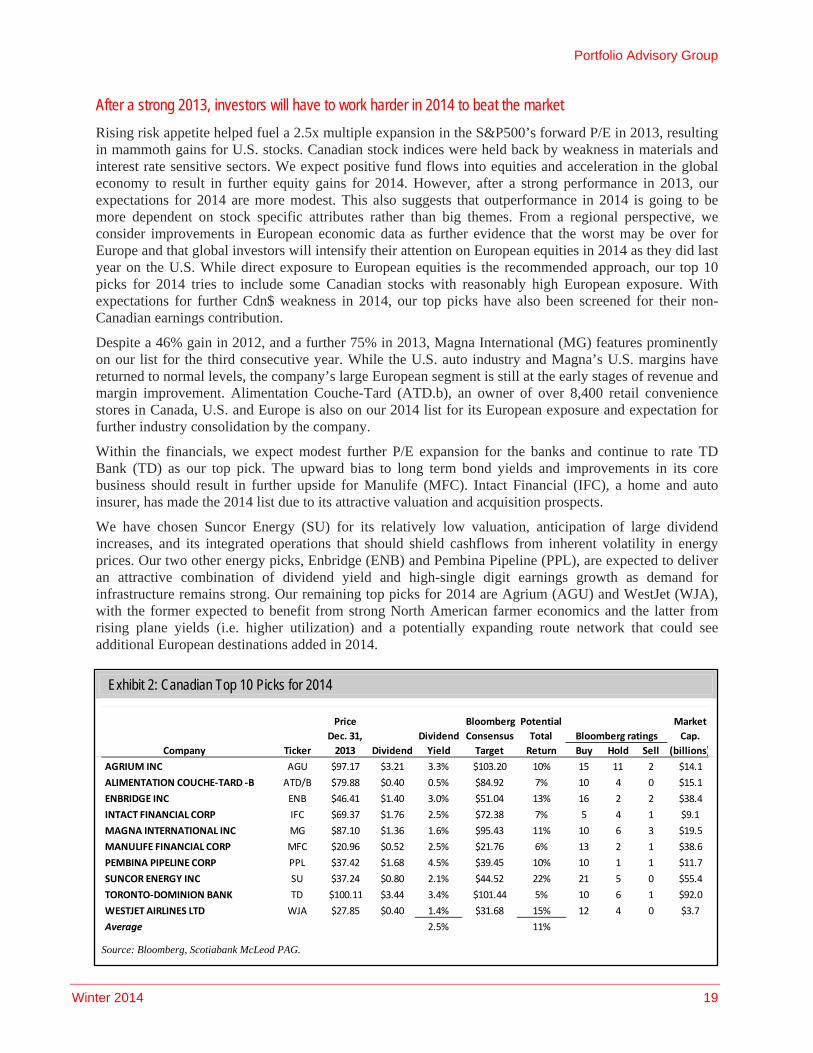
Exhibit 2: Canadian Top 10 Picks for 2014
Price
Dec. 31, Dividend
Bloomberg
Consensus
Potential
Total
Market
Cap.
Company Ticker 2013 Dividend Yield Target Return Buy Hold Sell (billions)
AGRIUM INC AGU $97.17 $3.21 3.3% $103.20 10% 15 11 2 $14.1
ALIMENTATION COUCHE‐TARD ‐B ATD/B $79.88 $0.40 0.5% $84.92 7% 10 4 0 $15.1
ENBRIDGE INC ENB $46.41 $1.40 3.0% $51.04 13% 16 2 2 $38.4
INTACT FINANCIAL CORP IFC $69.37 $1.76 2.5% $72.38 7% 5 4 1 $9.1
MAGNA INTERNATIONAL INC MG $87.10 $1.36 1.6% $95.43 11% 10 6 3 $19.5
MANULIFE FINANCIAL CORP MFC $20.96 $0.52 2.5% $21.76 6% 13 2 1 $38.6
PEMBINA PIPELINE CORP PPL $37.42 $1.68 4.5% $39.45 10% 10 1 1 $11.7
SUNCOR ENERGY INC SU $37.24 $0.80 2.1% $44.52 22% 21 5 0 $55.4
TORONTO‐DOMINION BANK TD $100.11 $3.44 3.4% $101.44 5% 10 6 1 $92.0
WESTJET AIRLINES LTD WJA $27.85 $0.40 1.4% $31.68 15% 12 4 0 $3.7
Average 2.5% 11%
Bloomberg ratings
Source: Bloomberg, Scotiabank McLeod PAG.
After a strong 2013, investors will have to work harder in 2014 to beat the market
Rising risk appetite helped fuel a 2.5x multiple expansion in the S&P500’s forward P/E in 2013, resulting in mammoth gains for U.S. stocks. Canadian stock indices were held back by weakness in materials and interest rate sensitive sectors. We expect positive fund flows into equities and acceleration in the global economy to result in further equity gains for 2014. However, after a strong performance in 2013, our expectations for 2014 are more modest. This also suggests that outperformance in 2014 is going to be more dependent on stock specific attributes rather than big themes. From a regional perspective, we consider improvements in European economic data as further evidence that the worst may be over for Europe and that global investors will intensify their attention on European equities in 2014 as they did last year on the U.S. While direct exposure to European equities is the recommended approach, our top 10 picks for 2014 tries to include some Canadian stocks with reasonably high European exposure. With expectations for further Cdn$ weakness in 2014, our top picks have also been screened for their non-Canadian earnings contribution.
Despite a 46% gain in 2012, and a further 75% in 2013, Magna International (MG) features prominently on our list for the third consecutive year. While the U.S. auto industry and Magna’s U.S. margins have returned to normal levels, the company’s large European segment is still at the early stages of revenue and margin improvement. Alimentation Couche-Tard (ATD.b), an owner of over 8,400 retail convenience stores in Canada, U.S. and Europe is also on our 2014 list for its European exposure and expectation for further industry consolidation by the company.
Within the financials, we expect modest further P/E expansion for the banks and continue to rate TD Bank (TD) as our top pick. The upward bias to long term bond yields and improvements in its core business should result in further upside for Manulife (MFC). Intact Financial (IFC), a home and auto insurer, has made the 2014 list due to its attractive valuation and acquisition prospects.
We have chosen Suncor Energy (SU) for its relatively low valuation, anticipation of large dividend increases, and its integrated operations that should shield cashflows from inherent volatility in energy prices. Our two other energy picks, Enbridge (ENB) and Pembina Pipeline (PPL), are expected to deliver an attractive combination of dividend yield and high-single digit earnings growth as demand for infrastructure remains strong. Our remaining top picks for 2014 are Agrium (AGU) and WestJet (WJA), with the former expected to benefit from strong North American farmer economics and the latter from rising plane yields (i.e. higher utilization) and a potentially expanding route network that could see additional European destinations added in 2014.
Investment Portfolio Quarterly
20
Two bonus picks:
Two additional picks that are not formally part of our top 10 list, but nevertheless reflect our current views, include ETFs that provide exposure to European equities and offer some protection against rising bond yields. While there are many options, Vanguard FTSE Europe ETF (VGK-NYSE) and WisdomTree Europe Hedged Equity Fund (HEDJ-NYSE) provide exposure to European large caps, with the latter hedged to the U.S. dollar. From a shorter-term perspective, ProShares UltraShort 20+ Year Treasury ETF (TBT-NYSE) is positively correlated to long-term Treasury yields and should provide downside protection against a disorderly sell-off in the bond market. As with all investments, these ETFs should be considered in the context of individual investor objectives and risk tolerance.
Agrium Inc. (AGU – TSX, $97.17)
Description:
Agrium is a major retail supplier of agricultural products and services in North and South America and a leading global producer and marketer of agricultural nutrients and industrial products. AGU produces and markets three primary groups of nutrients: nitrogen, phosphate and potash, plus controlled-release fertilizers and micronutrients.
Investment Thesis:
We like AGU’s 2014 prospects given strong farmer economics, expected strong retail results, and attractive nitrogen fundamentals. With respect to the first point, use of crop inputs, including those AGU produces, is supported by record high U.S. net farm income and record low farm debt/equity ratios based on U.S. Department of Agriculture estimates for 2013.
AGU should also benefit from continued growth of its strategically important retail segment, supported by integration of Viterra (acquired Oct. 1, 2013), further tuck-in acquisitions, and ongoing operational improvements.
Based on 2012 results, nitrogen represented 63% of AGU gross profit. Fundamentals for nitrogen appear stronger than those for phosphate and potash, driven by higher nitrogen/urea feedstock prices in China and lower Chinese urea exports.
On NTM consensus estimates, AGU shares trade at 7.4x forward EV/EBITDA, a premium to the long-term average of 6.7x but supported by estimated EBITDA and EPS growth of 5% and 7%, respectively, in F14. Agrium shares currently yield 3.3% and we believe the dividend is sustainable given AGU’s 37% F14E payout ratio.
The Bloomberg consensus comprises 15 Buys, 11 Holds, and 2 Sells, with a $103.20 average 12-month target price.
Alimentation Couche-Tard Inc. (ATD/B – TSX, $79.88)
Description:
Alimentation Couche-Tard Inc. (“Couche-Tard”) is a convenience store and fuel station operator in North America, Europe and ten other countries worldwide under the Circle K banner. The company has approximately 6,200 convenience stores in its North American network, nearly 2,300 in Europe, and 4,200 under the Circle K banner.
Portfolio Advisory Group
Winter 2014 21
Investment Thesis:
Couche-Tard made our list given its exposure to the recovering European economy and an improving balance sheet potentially supportive of another large acquisition.
In Europe, Couche-Tard owns Statoil Fuel & Retail (SFR), which operates nearly 2,300 stores in Scandinavia, Poland, the Baltics, and Russia. For the four quarters ended October 13, 2013, Europe represented approximately 35% of Couche-Tard’s revenue and gross profit.
Couche-Tard has an acquisition growth strategy, and with its adjusted leverage ratio having declined from 3.6x following the SFR acquisition in June, 2012 to 2.6x at the end of Q2F14, the company may be in a position to pursue another large acquisition and further consolidate its industry. According to recent analyst commentary, one possible consolidation target may be the retail network of U.S. oil and gas exploration and development company Hess Corp.
ATD/B shares currently trade at 15.7x F15E EPS, a premium to the 10-year average of approximately 13.5x likely reflecting strong expected EPS growth of 27% and 11% in F14 and F15, respectively. Couche-Tard’s dividend yield is currently just 0.5% and the company pays out less than 10% of EPS, suggesting plenty of room for dividend growth. Indeed the company hiked its dividend in each of the past two quarters.
The Bloomberg consensus currently comprises 10 Buys, 4 Holds, and no Sells, with an average 12-month share price target of $84.92.
Enbridge Inc. (ENB – TSX, $46.41)
Description:
Enbridge operates the world's longest crude oil and liquids transportation system. The company also has a significant presence in natural gas gathering, transmission and distribution, and an increasing involvement in power transmission and renewable/alternative energy production.
Investment Thesis:
We expect ENB to deliver an attractive combination of dividend yield and high-single digit earnings growth as demand for energy infrastructure remains strong. In December, ENB raised its dividend 11% and the shares currently yield 3.0%, and consensus estimates point to EPS growth of 9.5% in F14.
Earnings and dividend growth is supported by the company’s $36B growth plan, of which $29B+ is commercially secured and expected to enter service in the 2013-2017 time frame. These highly visible growth prospects underpin the company’s annual EPS and dividend growth guidance of 10%-12% (CAGR) from 2012-2017.
ENB shares trade at 13.9x NTM EV/EBITDA on consensus estimates versus a one-year average of 14.3x. The Bloomberg consensus currently comprises 16 Buys, 2 Holds, and 2 Sells, with an average 12-month share price target of $51.04.
Intact Financial Corporation (IFC – TSX, $69.37)
Description:
Intact provides property and casualty (P&C) insurance in Canada and is the country’s largest provider of home, auto, and business insurance.
Investment Portfolio Quarterly
22
Investment Thesis:
Based on 2014 consensus EPS, IFC is trading at a reasonable 11.0x P/E, particularly in view of strong expected F14 YOY growth of 63%.
We see further share price upside as investors grow more confident that expected Ontario auto insurance rate reductions should be gradual (averaging 15% over 2 years) and margin-neutral, with management expecting the Ontario government to announce offsetting cost reduction measures in the coming months. Additionally, IFC indicated it is targeting home insurance premium rate increases of 15%-23% on renewal, up from prior rate hikes of 6%-7%.
IFC could also benefit from potential industry M&A. Management believes 20 percentage points of Canadian P&C Insurance industry market share could change hands over the next five years. IFC has a track record of successfully integrating acquisitions, and management foresees growing its market share from 17% currently to 30% (before facing issues with competition regulators). The Scotiabank GBM analyst believes this growth likely will be achieved via acquisitions and estimates it could add as much as $25-$30 to IFC’s share price.
The Bloomberg consensus comprises 5 Buys, 4 Holds, and 1 Sell, with a $72.38 average 12-month target price.
Magna International Inc. (MG – TSX, $87.10)
Description:
Magna International Inc. is the most diversified automotive supplier in the world. It designs, develops and manufactures automotive systems, assemblies, modules and components, as well as engineers and assembles complete vehicles, primarily for sale to original equipment manufacturers (OEMs) of cars and light trucks in its three geographic segments – North America, Europe, and Rest of World (primarily Asia, South America and Africa). The company has 312 manufacturing operations and 87 product development, engineering and sales centres in 29 countries on five continents as of Q3 2013.
Investment Thesis:
Magna continues to grow its North American operations (52% of sales) modestly above industry growth rates while maintaining operating margins at ~9.0%. We believe this growth will be supported by a recovering U.S. auto industry (North American Vehicle sales gaining +12% on an annualized basis since 2009 lows) and improving consumer confidence.
Magna’s large European segment (41% of sales) has sustained bottom line growth despite a depressed economic backdrop. The company is on track to improve European operating margins to its target of 50% of North American levels. As Eurozone consumer confidence, unemployment, and PMI continues to improve, we believe Magna is well positioned to capitalize in this geographic segment, complemented by the possible exit from underperforming, non-core operations.
Magana has ~$0.7B in excess cash to be deployed, with a focus on new programs, targeted acquisitions, another possible share buyback, and potential dividend increases, which are all supportive of further share price appreciation.
Despite remarkable share price performance over the past two years, Magna trades at NTM EV/EBITDA of 5.5x vs. the peer average of 6.1x. Given Magna’s macroeconomic resilience, fiscal flexibility, firm 2014E earnings outlook, and prudent management, we believe the stock deserves to trade in-line or even a small premium to its peers. We also like the foreign currency exposure (to the USD and EUR) provided by Magna’s global operations.
Bloomberg consensus: 10 buys, 6 holds, 3 sells; average 12-month target price = $95.43
Portfolio Advisory Group
Winter 2014 23
Manulife Financial Corporation (MFC – TSX, $20.96)
Description:
Manulife Financial is a financial services group with principal operations in Asia, Canada and the United States. Manulife’s products and services include individual life insurance, group life and health insurance, long-term care services, pension products, annuities, mutual funds and banking products. Manulife also provides asset management services to institutional customers worldwide and offers reinsurance solutions.
Investment Thesis:
The upward bias to long term bond yields and improvements in its core business, driven by price increases and ongoing cost savings, should result in further upside for Manulife. In Q3F13, the company indicated earnings sensitivity of +$300M for a 100 bps increase in interest rates, and noted its efficiency initiatives could deliver $100M in after-tax savings in 2014 and higher amounts in 2015 and 2016.
The company’s exposure to fast-growing Asian emerging markets, which is higher than many of its North American peers, should also support continued earnings growth in 2014. Indeed, based on Scotiabank GBM F14 estimates, MFC’s Asia segment is expected to be the company’s most profitable, generating $1.1B in net income (before corporate eliminations) versus $635M-$971M at each of the three North American segments.
Based on consensus estimates, MFC trades at 13.0x F14 EPS, versus Canadian peers GWO, SLF, and IAG at 12.8x, 13.4x, and 13.1x, respectively. However, MFC is expected to deliver EPS growth of approximately 19% in F14, ahead of its peers at 13%, 2%, and 6%, respectively. It should also be noted MFC’s Q3F13 capital ratio at 229% was highest amongst its Canadian peers (216%-227%).
The Bloomberg consensus comprises 13 Buys, 2 Holds, and 1 Sell, with a $21.76 average 12-month target price.
Pembina Pipeline Corporation (PPL – TSX, $37.42)
Description:
Pembina is an energy transportation and midstream service provider that owns and operates pipelines in western Canada and related infrastructure in eastern and western Canada and the U.S.
Investment Thesis:
Underscoring ongoing strong demand for energy infrastructure, the company recently announced a $2 billion expansion of its pipeline system after reaching binding commercial agreements that are expected to provide a long-term annual EBITDA stream of $270M-$300M.
While valuation has increased to 16.8x NTM EV/EBITDA versus a five-year average of 13.4x, this arguably is justified by EBITDA estimates that have steadily moved higher over the course of 2013 and now imply 11%-12% YOY growth in both F14 and F15.
This should support YOY dividend growth of 4%-5% in both F14 and F15, complementing PPL shares’ current attractive dividend yield of 4.5%.
PPL’s balance sheet has improved significantly over six quarters, with leverage declining to 2.9x net debt / EBITDA from 5.6x following the Q2F12 acquisition of Provident Energy Ltd.
The current Bloomberg consensus comprises 10 Buys, 1 Hold, and 1 Sell, with an average 12 month target price of $39.45.
Investment Portfolio Quarterly
24
Suncor Energy Inc. (SU – TSX, $37.24)
Description:
Suncor Energy Inc.'s asset base is dominated by its oil sands operations in Fort McMurray in northeast Alberta, which produces about 400,000 bbl/d of refinery feedstock. In 2009, the company amalgamated with its former rival, Petro Canada, to form the largest Canadian-based integrated oil company. Suncor also has operations on the east coast of Canada and in Libya, Syria, and the United Kingdom. Suncor's downstream operations include refineries in Canada and the United States and a large network of retail service stations in Canada under the Sunoco and Petro Canada brands.
Investment Thesis:
The company’s oil sands operations have transitioned to a positive free cash flow (FCF) status, with the company prioritizing dividend increases, upstream and downstream growth projects, share repurchases, debt reduction, and opportunistic acquisitions.
Against a substantial FCF generation backdrop, and given a current dividend yield of 2.1%, below its two major integrated peers Cenovus and Husky at 3.2% and 3.6% respectively, we expect Suncor to continue raising its dividend at an above-average rate. The company also signaled at its most recent investor day that it would be comfortable repurchasing stock at present levels.
Clean balance sheet to support growth initiatives and FCF deployment. Suncor has a 2014E net debt to cash flow ratio of 0.6x and 2015E of 0.5x vs. the integrated peer-average of 1.1x. Additionally, the company has a net debt to capital ratio of 11.1% as of Q3/13 vs. 18.5% for its peers.
Suncor’s integrated business model and importantly its broad market access (E&P in Norway, UK, Libya, Canada) provides the company with increasingly competitive world oil price exposure over its peers. Access to North American markets is expected to improve over the next several years from its commitments to TransCanada’s Keystone XL pipeline and Enbridge’s Line 9 reversal.
Triggered by Berkshire Hathaway’s ownership filing in August, Suncor has begun to narrow its valuation gap relative to peers. The stock is trading at 6.2x 2014E EV/DACF vs. the sub-sector average of 7.4x. We believe that Suncor’s notable FCF generation, de-risked balance sheet, potential dividend increase, and integrated business model should contribute to higher relative valuation multiple.
Bloomberg consensus: 21 buys, 5 holds, 0 sells; average 12-month target price = $44.52
The Toronto-Dominion Bank (TD – TSX, $100.11)
Description:
Toronto-Dominion Bank (TD) is the largest Canadian chartered bank based on assets and the second-largest by market capitalization. It is one of the ten largest banks in the U.S. based on deposits after completing the purchase of TD Banknorth in 2007, Commerce Bank on March 31, 2008, and the South Financial Group on September 30, 2010. The bank also holds a 42% interest in TD Ameritrade.
Investment Thesis:
We continue to rate TD as our top bank pick owing to expected modest further P/E expansion for Canadian banks, exposure to the recovering U.S. economy, and above-average earnings growth.
On F14 consensus EPS estimates the P/E ratio for the Canadian bank group has expanded by 2.0 multiple points since June to 11.7x, driven by increasing comfort in a soft landing scenario for housing. This compares with a trading range of 12x-13x under normal conditions, suggesting another point of possible multiple expansion for the group.
Portfolio Advisory Group
Winter 2014 25
With U.S. personal and commercial (P&C) banking representing 23% of TD’s consolidated 2013 adjusted earnings, TD stands to benefit from a strengthening U.S. economy.
TD’s F14E EPS growth of +12.7% YOY ranks it ahead of all other Canadian banks. TD is one of only two Canadian banks expected to generate double-digit EPS growth in F14 (the other being CWB).
TD shares trade at 11.9x NTM consensus EPS estimates versus a ten-year average of 11.6x. The Bloomberg consensus currently comprises 10 Buys, 6 Holds, and 1 Sell, with an average 12-month share price target of $101.44.
WestJet Airlines (WJA – TSX, $27.85)
Description:
Founded in 1996 by a team of Calgary entrepreneurs, WestJet has grown from being a regional carrier with three aircraft and five destinations, to become Canada’s leading value-oriented airline offering scheduled service to 76 destinations in Canada, United States, Mexico and Caribbean, with its fleet of 98 Boeing Next-Generation 737 aircraft. Based on the Southwest Airlines’ model (which has resulted in 40 consecutive years of profitability for Southwest) of single aircraft type, high employee and aircraft productivity, low unit cost, and reduced frills, WestJet has become one of the most profitable airlines in North America.
Investment Thesis:
In recent years, the Canadian airline industry has benefited from limited capacity additions and increased demand, resulting in higher plane utilization and improved margins.
The introduction of Plus and Encore this year should complement earnings growth for 2014 and 2015 (11% forecast EBITDAR growth for each year). Plus is a business class equivalent, while Encore will provide regional connections serviced by Q400 turboprop planes.
WestJet also recently announced its first European destination (Dublin) and will decide on additional European destinations later in 2014. Given limited current customer options and WestJet’s value proposition, expanded European service could prove profitable for the Company.
WJA is trading at a reasonable 12x 2014E EPS (historical average of 12.3x), with a 2014E PEG ratio of 0.81. The company maintains a conservative balance sheet (net debt/EBITDA of -0.76x, i.e. net cash position).
Bloomberg consensus: 12 buys, 4 holds, 0 sells; average 12-month target price = $31.68
Investment Portfolio Quarterly
26
Exhibit 3: Performance of 2013 U.S. Top 10 List
Company Ticker 12/31/2012 12/31/2013 Change
APPLE INC AAPL 532.17 $561.02 5.4%
CATERPILLAR INC CAT 89.61 $90.81 1.3%
DIRECTV DTV 50.16 $69.06 37.7%
EMC CORP/MA EMC 25.30 $25.15 (0.6%)
FLUOR CORP FLR 58.74 $80.29 36.7%
JPMORGAN CHASE & CO JPM 43.97 $58.48 33.0%
MCKESSON CORP MCK 96.96 $161.40 66.5%
KROGER CO KR 26.02 $41.91 1 61.1%
MICROSOFT CORP MSFT 26.71 $37.41 40.1%
VALERO ENERGY CORP VLO 28.46 $50.40 2 77.1%
Average price‐only return for top 10 list 35.8% *
S&P 500 Index 1,426.2 1,848.4 29.6%
Outperformance 6.2%
Notes:
1 ‐ Price as of Oct 2, 2013, when removed from recommended l ist
2 ‐ VLO cost adjusted for spin‐off by factor .913472
* Top 10 l ist average return would have been 34.9% if all candidates held until Dec 31, 2013
See notes
Price
Source: Bloomberg, Scotiabank McLeod PAG.
Top 10 U.S. Picks for 2014 Marco Martin – International Equity Consultant
Global equity benchmarks ended the year on a positive note, with gains varying widely from country to country and region to region. The U.S. market was one of the better performers in 2013 as the S&P 500 delivered a strong 38% gain in Canadian dollar terms, which compares to a modest 9.6% for the TSX Composite Index, a gain of 31.6% in the Euro Stoxx and a modest gain of 7.0% for the Hang Seng. Within the S&P 500, all ten sectors provided a positive total return. A mix of cyclical and defensive sectors like Consumer Discretionary, Healthcare and Industrials, outperformed. However, with the exception of Healthcare, we expect that cyclical sectors will lead the market in 2014.
The S&P 500’s strong performance was supported by positive U.S. economic data which indicated the economy is gaining momentum across the board, particularly in key sectors like housing. With the U.S. deficit declining rapidly, budget agreements preventing sequestration, and employment data gaining momentum, we believe that we will see positive earnings revisions in the year.
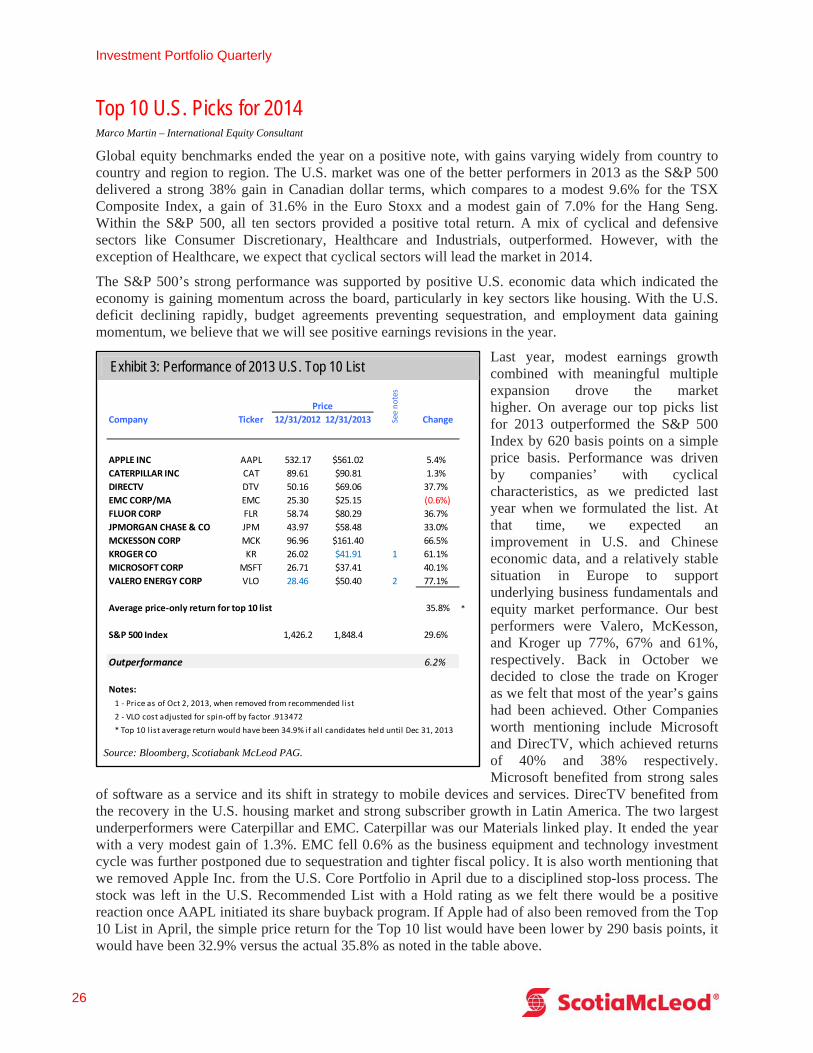
Last year, modest earnings growth combined with meaningful multiple expansion drove the market higher. On average our top picks list for 2013 outperformed the S&P 500 Index by 620 basis points on a simple price basis. Performance was driven by companies’ with cyclical characteristics, as we predicted last year when we formulated the list. At that time, we expected an improvement in U.S. and Chinese economic data, and a relatively stable situation in Europe to support underlying business fundamentals and equity market performance. Our best performers were Valero, McKesson, and Kroger up 77%, 67% and 61%, respectively. Back in October we decided to close the trade on Kroger as we felt that most of the year’s gains had been achieved. Other Companies worth mentioning include Microsoft and DirecTV, which achieved returns of 40% and 38% respectively. Microsoft benefited from strong sales
of software as a service and its shift in strategy to mobile devices and services. DirecTV benefited from the recovery in the U.S. housing market and strong subscriber growth in Latin America. The two largest underperformers were Caterpillar and EMC. Caterpillar was our Materials linked play. It ended the year with a very modest gain of 1.3%. EMC fell 0.6% as the business equipment and technology investment cycle was further postponed due to sequestration and tighter fiscal policy. It is also worth mentioning that we removed Apple Inc. from the U.S. Core Portfolio in April due to a disciplined stop-loss process. The stock was left in the U.S. Recommended List with a Hold rating as we felt there would be a positive reaction once AAPL initiated its share buyback program. If Apple had of also been removed from the Top 10 List in April, the simple price return for the Top 10 list would have been lower by 290 basis points, it would have been 32.9% versus the actual 35.8% as noted in the table above.
Portfolio Advisory Group
Winter 2014 27
Exhibit 4: U.S. Top 10 Picks for 2014 – Consensus Data *
Dec. 31,
Bloomberg
Consensus
Potential
Total
Market
Cap.
Company Ticker 2013 Dividend Yield Target Returm Buy Hold Sell (millions)
CITIGROUP INC C $52.11 $0.04 0.1% $58.09 12% 28 4 4 $158,050
CVS CAREMARK CORP CVS $71.57 $1.10 1.5% $75.52 7% 23 5 0 $85,186
EMC CORP/MA EMC $25.15 $0.40 1.6% $29.37 18% 38 7 0 $51,755
GILEAD SCIENCES INC GILD $75.10 $0.00 0.0% $88.40 18% 26 4 0 $115,155
HALLIBURTON CO HAL $50.75 $0.60 1.2% $65.78 31% 27 6 2 $43,047
JPMORGAN CHASE & CO JPM $58.48 $1.52 2.6% $62.73 10% 30 9 2 $219,837
QUALCOMM INC QCOM $74.25 $1.40 1.9% $77.53 6% 38 7 2 $125,441
ROYAL CARIBBEAN CRUISES LTD RCL $47.42 $1.00 2.1% $49.13 6% 27 9 1 $10,429
RYDER SYSTEM INC R $73.78 $1.36 1.8% $77.17 6% 14 3 0 $3,880
UNITED TECHNOLOGIES CORP UTX $113.80 $2.36 2.1% $120.50 8% 21 5 0 $104,421
Average 1.5% 12%
Bloomberg ratings
* U.S. dollars.
Source: Bloomberg.
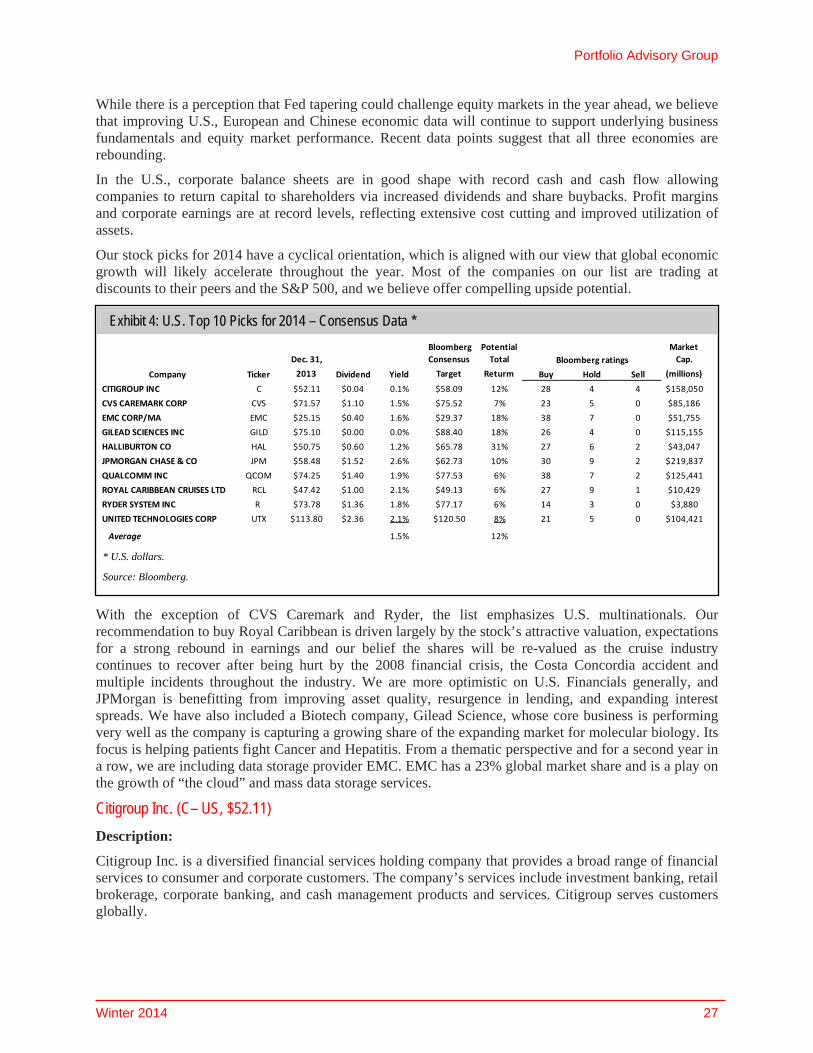
While there is a perception that Fed tapering could challenge equity markets in the year ahead, we believe that improving U.S., European and Chinese economic data will continue to support underlying business fundamentals and equity market performance. Recent data points suggest that all three economies are rebounding.
In the U.S., corporate balance sheets are in good shape with record cash and cash flow allowing companies to return capital to shareholders via increased dividends and share buybacks. Profit margins and corporate earnings are at record levels, reflecting extensive cost cutting and improved utilization of assets.
Our stock picks for 2014 have a cyclical orientation, which is aligned with our view that global economic growth will likely accelerate throughout the year. Most of the companies on our list are trading at discounts to their peers and the S&P 500, and we believe offer compelling upside potential.
With the exception of CVS Caremark and Ryder, the list emphasizes U.S. multinationals. Our recommendation to buy Royal Caribbean is driven largely by the stock’s attractive valuation, expectations for a strong rebound in earnings and our belief the shares will be re-valued as the cruise industry continues to recover after being hurt by the 2008 financial crisis, the Costa Concordia accident and multiple incidents throughout the industry. We are more optimistic on U.S. Financials generally, and JPMorgan is benefitting from improving asset quality, resurgence in lending, and expanding interest spreads. We have also included a Biotech company, Gilead Science, whose core business is performing very well as the company is capturing a growing share of the expanding market for molecular biology. Its focus is helping patients fight Cancer and Hepatitis. From a thematic perspective and for a second year in a row, we are including data storage provider EMC. EMC has a 23% global market share and is a play on the growth of “the cloud” and mass data storage services.
Citigroup Inc. (C– US, $52.11)
Description:
Citigroup Inc. is a diversified financial services holding company that provides a broad range of financial services to consumer and corporate customers. The company’s services include investment banking, retail brokerage, corporate banking, and cash management products and services. Citigroup serves customers globally.
Investment Portfolio Quarterly
28
Investment Thesis:
We are encouraged by Citigroup’s capital build, cost management and wind down of Citi Holdings (legacy assets).
We believe the continued strength in the capital levels will provide support for further increases dividends and share buyback programs, which will complement the attractive outlook for the underlying operations given the banks global footprint.
Citigroup was approved by the Federal Reserve for a $1.2 billion buyback (0.8% of shares outstanding) and there are expectations for meaningful dividend increase in 2014.
We also believe that recent settlements regarding mortgage litigation and Libor fixing accusations is positive for C as it puts the matter to rest and clears up one more overhang on the stock.
C is trading at a deep discount to its book value, 0.8x; pre 2008 crisis it traded at 2.7x.
We also believe that US banks will perform well given the growing capital levels, credit improvement trends, and attractive valuation levels.
The Bloomberg consensus ratings are 28 Buys, 4 Holds, and 4 Sell ratings with an average one year target price of $58.09.
CVS Caremark (CVS– US, $71.57)
Description:
CVS Caremark Corp. is an integrated pharmacy healthcare provider. The company offers pharmacy benefit management programs, mail order, retail and specialty pharmacy, disease management programs and retail clinics. The company operates drugstores throughout the U.S. and Puerto Rico.
Investment Thesis:
We believe CVS’s strong market position and integrated business model will drive positive returns for shareholders. It operates one of the largest drug store chains and pharmacy benefit managers (PBM) in the U.S. In addition, CVS is also the largest operator of retail health care clinics in the U.S.
The company is well positioned to benefit from the expected growth in demand for healthcare services in 2014 with the introduction of Obamacare resulting in 30 million new people gaining health insurance coverage.
With the U.S. population aging, we also see CVS benefiting from an increase in prescription drugs.
CVS is expanding it’s in store clinics and should also continue to benefit from its ability to utilize target marketing with its ExtraCare loyalty card.
CVS is committed to returning capital to shareholders. Recently the company announced a 22% boost to its dividend and a new share buyback program for $6 billion, which the company plans to spend $4 billion in 2014.
The Bloomberg consensus ratings are 23 Buys, 5 Holds, and 0 Sell ratings with an average one year target price of $75.52.
Portfolio Advisory Group
Winter 2014 29
EMC Corp. (EMC– US, $25.15)
Description:
EMC Corp. is the world’s leading mass data storage device maker with about 23% market share. Financial institutions, government agencies, manufacturers, internet service providers, and retailers all use massive amounts of information in their daily operations. EMC’s RAID (redundant array of independent disks) devices allow for the storage and quick retrieval of massive quantities of data. EMC’s new enterprise Platform-as-a-Service (Pivotal) and VMware tap consumer trends and capture businesses interested in big public clouds and analytics.
Investment Thesis:
The upside potential for EMC Corp. is being driven by increasing demand for data storage globally, analytic needs and the continued migration toward cloud computing.
EMC enjoys significant levels of recurring revenue from the software and services part of its business, and is expected to continue its recent growth trend through further market share gains.
EMC’s Pivotal is building "OS for the Cloud", and the company sees scale, analytics, and applications, including mobile, as the way forward for enterprises. Pivotal currently has 1,000 enterprise customers and it is expected to grow drastically.
EMC Corp. has a very solid balance sheet, ending the September quarter with U$10.6 billion in cash and investments and $5.4 billion in free cash flow. The company is committed to returning cash to shareholders by instituting a dividend and an aggressive share buyback plan ($6 billion dollars).
Bloomberg consensus: 38 buys, 7 holds, 0 sells; average 12-month target price of $29.37
Gilead Sciences Inc. (GILD – US, $75.10)
Description:
Gilead Sciences, Inc. is a research-based biopharmaceutical company that discovers, develops, and commercializes therapeutics to advance the care of patients suffering from life-threatening diseases. The Company’s primary areas of focus include HIV/AIDS, liver disease, and serious cardiovascular and respiratory conditions.
Investment Thesis:
Gilead has a market leading position with its HIV franchise, and expects that its Hepatitis C program will achieve market leadership with its December 10th, 2013 launch of its new drug Sovaldi.
According to analysts, physicians think that Sovaldi is the fastest and most effective regime for the disease. Competitor drug treatments require a 5 daily pill regime vs. 1 pill for Sovaldi. The drug is expected to increase GILD’s Hepatitis C franchise revenue from $4 billion to $15 billion over the next 7 years.
In HIV, GILD is in a Phase III study on tenofovir, which has a more potent profile than current therapy, securing its HIV leadership for a prolonged period of time.
GILD is trading at a reasonable 22x 2014E EPS (historical average of 16.7x) considering its expected 61% 2014 EPS growth and a 2014E PEG ratio of 0.94. The company maintains a conservative balance sheet (net debt/EBITDA of 1.0x).
Bloomberg consensus: 26 buys, 4 holds, 0 sells; average 12-month target price of $88.40.
Investment Portfolio Quarterly
30
Halliburton Co. (HAL– US, $50.75)
Description:
Halliburton provides energy and engineering & construction services, as well as manufactures products for the energy industry. The company offers services and products and integrated solutions to customers in the exploration, development and production of oil and natural gas.
Investment Thesis:
We believe the North American rig count has bottomed and Halliburton is set to benefit from increased oil and gas production in the region over the coming years.
We like HAL’s efforts to expand internationally and its exposure to deep water rigs, both important growth markets where specialized services are required.
In North America, earnings results are supported by improving operating margins, which are expanding with the introduction of innovative products used in horizontal drilling and fracking.
We maintain a positive outlook for HAL and believe the company’s increasingly global footprint and signs of robust oilfield activity in key overseas markets will help drive strong EPS growth over the next 12 months.
We acknowledge civil litigation associated with Macondo / Deep Water Horizon remains a risk, but we note the Department of Justice concluded its criminal investigation in July, 2013.
The Bloomberg consensus ratings are 27 Buys, 6 Holds, and 2 Sell ratings with an average one year target price of $65.78.
JPMorgan Chase (JPM– US, $58.48)
Description:
JPMorgan Chase & Co. provides global financial services and retail banking. The company provides services such as investment banking, treasury and securities services, asset management, private banking, card member services, commercial banking, and home finance. JPMorgan Chase serves business enterprises, institutions, and individuals.
Investment Thesis:
JPMorgan is among our preferred U.S. banks plays, given its scale, fee income and mortgage growth opportunities, domestic and international investment banking exposure, lower cost funding, and attractive valuation.
With most of JPMorgan’s claims related to mortgages and Libor rate fixing settled, we believe the bank can move forward and focus on growing its core business.
We expect JPM's capital markets business to benefit from a European recovery, and to take global market share from European banks which operate in a more highly regulated climate. We expect that European fixed income trading will remain strong in 2014.
We also believe that US banks will perform well given an improving capital position, credit improvement trends, and attractive valuation levels.
Bloomberg consensus: 30 buys, 9 holds, 2 sells; average 12-month target price of $62.73
Portfolio Advisory Group
Winter 2014 31
Qualcomm Inc. (QCOM– US, $74.25)
Description:
Qualcomm Inc. designs, develops, manufactures, and markets digital telecommunications products and services. It operates in four segments: 1) Develops integrated circuits and system software, 2) Grants licenses to use its intellectual property portfolio, 3) Provides fleet management, satellite- and terrestrial-based two-way wireless information and position reporting, 4) Invests in early-stage companies that support the design and introduction of new products and services.
Investment Thesis:
We believe the company is very well positioned to capitalize on key IT growth trends in mobile and wireless.
QCOM should benefit from the ramp-up of new products such as the Snapdragon 600 for the high-end mobile devices segment and higher MSM8225Q volumes for low-cost smartphones, sold mostly in emerging markets.
We expect QCOM to maintain modem leadership in the high-end device segment with expected ramp-up of new LTE advanced basebands and further penetration of 3G networks in developing markets.
We see China as an important opportunity for QCOM given growth prospects associated with LTE over the next year.
Bloomberg consensus: 38 buys, 7 holds, 2 sells; average 12-month target price of $77.53.
Royal Caribbean (RCL– US, $47.42)
Description:
Royal Caribbean Cruises Ltd. is a Norwegian / American global cruise company. It is the world's second-largest cruise line operator with 39 ships, after Carnival Corporation, its largest competitor with 50% of the market. Royal Caribbean Cruises Ltd. fully owns five cruise lines: Royal Caribbean International, Celebrity Cruises, Pullmantur Cruises, Azamara Club Cruises and CDF Croisières de France, plus has a 50% stake in TUI Cruises.
Investment Thesis:
The cruise industry remains in recovery mode after being hurt by the 2008 financial crisis, the Costa Concordia accident, and multiple incidents throughout the industry such as ship fires and food poisoning scares. During these difficult times, RCL has managed to adjust its cost structure and identify alternative and unique itineraries to adapt.
It is expected that RCL’s earnings will be driven by a continued improvement of the global consumer and improved industry perception.
RCL is increasing its fleet capacity by 13%, aiming to capitalize on the global economic recovery and ticket premiums across the industry as it targets the upper end of the market. RCL is perceived as a higher quality and dependable operator with the largest fully featured vessels in the industry, the “Oasis class”, and a superior safety record.
The stock is currently trading at 14 times forward EPS, in line with its 15 year average of 14.5 times and a deep discount to the cruise industry at 22 times.
The earnings per share growth rate for Royal Caribbean is forecast to be 30.3% in 2014, which compares favourably to Carnival Corporation’s (CCL) estimated 1.3% and half the growth of Norwegian Cruise Line Holdings (NCLH) 62.4% which trades at twice RCL’s multiple.
Investment Portfolio Quarterly
32
Royal Caribbean’s balance sheet is highly levered, which is typical in the industry given its capital intensity. RCL has a Debt to Asset ratio of 42% which compares favourably to NCLH’s 50%, but higher than CCL’s 22%.
The company also compares favourably on a price to cash flow ratio basis, trading at 6.5 times 2014E which compares to 9.3 times and 14.7 times for CCL and NCLH, respectively.
The Bloomberg consensus ratings are; 26 Buys, 9 Holds, and 1 Sell recommendation with a consensus target price of $48.71.
Ryder Systems Inc. (R– US, $73.78)
Description:
Ryder Systems Inc. provides a continuum of logistics, supply chain, and transportation management solutions worldwide. The company’s offerings range from full-service leasing, commercial rental and maintenance of vehicles to integrated services. Ryder also offers comprehensive supply chain solutions, logistics management services, and e-commerce solutions.
Investment Thesis:
We believe that Ryder is a well-managed company that should benefit from secular growth in fleet and logistics outsourcing. The underlying industry fundamentals point to a healthy trucking environment, supporting related logistics services and higher margins.
We expect further fleet growth as the U.S. economy continues to improve. Additionally, Ryder’s full-service truck leasing operations should continue to benefit from delayed spending on equipment and technology.
Ryder’s age of leased fleet vehicles has been dropping. The fourth quarter report shows average fleet life down 4 months Y-O-Y, which translates into lower maintenance expense and is well received by customers who sign longer contracts as they seek fuel efficiency and reliability.
Ryder has U$4 billion in net debt, up from U$2.7 billion in 2010. This reflects higher capital spending on increased customer vehicle commitments as the U.S. economy recovers.
The Bloomberg consensus ratings are 14 Buys, 3 Holds, and 0 Sell ratings with an average one year target price of $77.17.
United Technologies (UTX – US, $113.80)
Description:
This aerospace-industrial conglomerate’s portfolio includes Pratt &Whitney jet engines, Sikorsky helicopters, Otis elevators, and Carrier air conditioners, among other products. It also owns Goodrich, which it purchased in July 2012. The Otis division is the largest in terms of profitability, accounting for 21% of revenue and 31% of operating profit. The UTC Climate, Controls & Security division is 29% of sales and 30% of operating profit, Pratt & Whitney is 24% and 19%, UTC Aerospace Systems is 14% and 11%, and Sikorsky is 12% and 9%, respectively.
Investment Thesis:
The company provides investors with exposure to a mix of revenue from the industrial businesses and aerospace businesses. In 2012, approximately 56% of revenue was generated in the U.S., 21% in Europe and 15% from Asia Pacific.
UTX is expected to deliver organic revenue growth in 2014 in the range of 4%, driven by the Goodrich acquisition, improving economic activity in emerging markets and the U.S., as well as improved global air traffic growth and a strengthening U.S. residential construction market.
Portfolio Advisory Group
Winter 2014 33
UTX is expected to see attractive operating leverage given the significant restructuring effort the company has invested in over the past several years. It should also see the benefit from reduced restructuring expense as well as moderating pension headwinds as interest rates rise.
The integration of Goodrich appears to be progressing well, with management noting synergies are on track to hit $250 million by year-end 2013 and $500 million by 2016. Orders in the division remain strong and the growth trend is expected to continue.
The company has a strong record of cash generation; free cash flow is expected to be $5.6 billion this year. It also has a strong history of dividend growth, with a CAGR of 10.3% over the past five years. We believe the company will continue to focus on debt repayment (net debt/EBITDA is ~1.8x), increased dividends and its share buyback program.
The consensus estimates are calling for EPS growth of 11%, with a forecast of $6.15 in 2013 and $6.83 in 2014. This follows the $5.32 that UTX delivered in 2012. The stock is currently trading at a multiple of 16x 2014E consensus forecast.
Bloomberg consensus: 21 buys, 5 holds, 0 sells; average 12-month target price of $120.50.
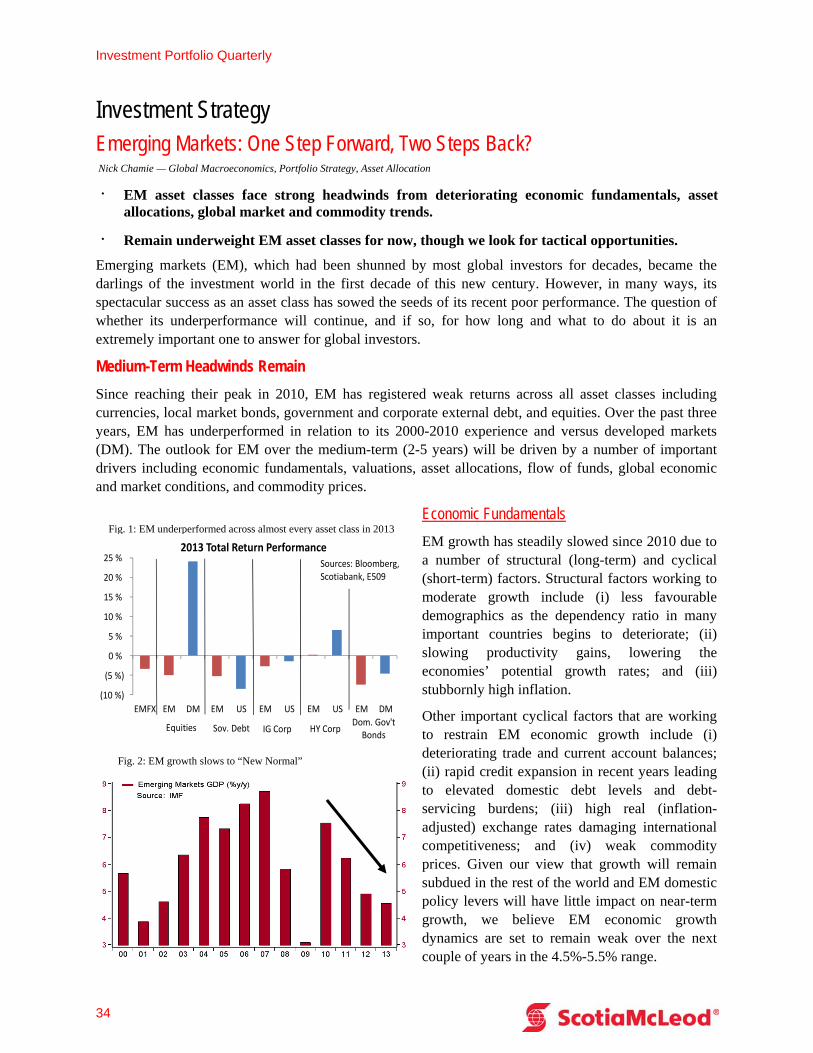
Investment Portfolio Quarterly
34
Investment Strategy Emerging Markets: One Step Forward, Two Steps Back? Nick Chamie — Global Macroeconomics, Portfolio Strategy, Asset Allocation
· EM asset classes face strong headwinds from deteriorating economic fundamentals, asset allocations, global market and commodity trends.
· Remain underweight EM asset classes for now, though we look for tactical opportunities.
Emerging markets (EM), which had been shunned by most global investors for decades, became the darlings of the investment world in the first decade of this new century. However, in many ways, its spectacular success as an asset class has sowed the seeds of its recent poor performance. The question of whether its underperformance will continue, and if so, for how long and what to do about it is an extremely important one to answer for global investors.
Medium-Term Headwinds Remain
Since reaching their peak in 2010, EM has registered weak returns across all asset classes including currencies, local market bonds, government and corporate external debt, and equities. Over the past three years, EM has underperformed in relation to its 2000-2010 experience and versus developed markets (DM). The outlook for EM over the medium-term (2-5 years) will be driven by a number of important drivers including economic fundamentals, valuations, asset allocations, flow of funds, global economic and market conditions, and commodity prices.
Economic Fundamentals
EM growth has steadily slowed since 2010 due to a number of structural (long-term) and cyclical (short-term) factors. Structural factors working to moderate growth include (i) less favourable demographics as the dependency ratio in many important countries begins to deteriorate; (ii) slowing productivity gains, lowering the economies’ potential growth rates; and (iii) stubbornly high inflation.
Other important cyclical factors that are working to restrain EM economic growth include (i) deteriorating trade and current account balances; (ii) rapid credit expansion in recent years leading to elevated domestic debt levels and debt-servicing burdens; (iii) high real (inflation-adjusted) exchange rates damaging international competitiveness; and (iv) weak commodity prices. Given our view that growth will remain subdued in the rest of the world and EM domestic policy levers will have little impact on near-term growth, we believe EM economic growth dynamics are set to remain weak over the next couple of years in the 4.5%-5.5% range.
(10 %)
(5 %)
0 %
5 %
10 %
15 %
20 %
25 %
EMFX EM DM EM US EM US EM US EM DM
2013 Total Return Performance
Equities Sov. Debt IG Corp HY CorpDom. Gov't
Bonds
Sources: Bloomberg, Scotiabank, E509
Fig. 1: EM underperformed across almost every asset class in 2013
Fig. 2: EM growth slows to “New Normal”
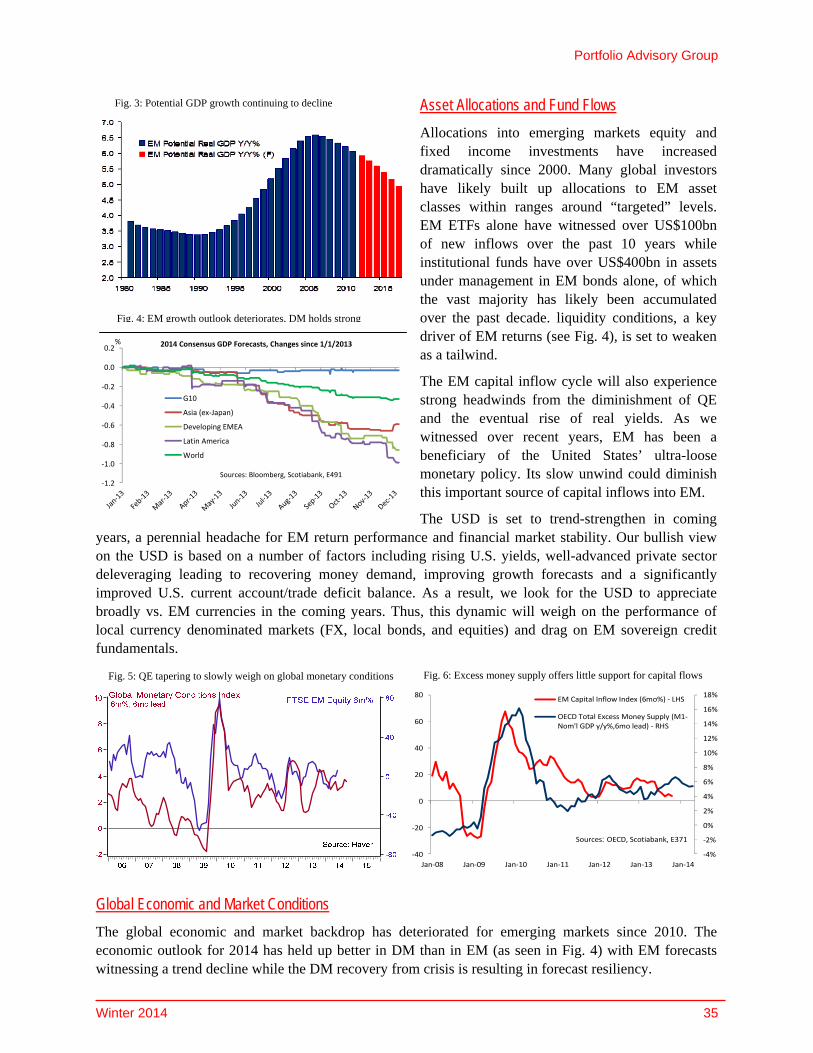
Portfolio Advisory Group
Winter 2014 35
Asset Allocations and Fund Flows
Allocations into emerging markets equity and fixed income investments have increased dramatically since 2000. Many global investors have likely built up allocations to EM asset classes within ranges around “targeted” levels. EM ETFs alone have witnessed over US$100bn of new inflows over the past 10 years while institutional funds have over US$400bn in assets under management in EM bonds alone, of which the vast majority has likely been accumulated over the past decade. liquidity conditions, a key driver of EM returns (see Fig. 4), is set to weaken as a tailwind.
The EM capital inflow cycle will also experience strong headwinds from the diminishment of QE and the eventual rise of real yields. As we witnessed over recent years, EM has been a beneficiary of the United States’ ultra-loose monetary policy. Its slow unwind could diminish this important source of capital inflows into EM.
The USD is set to trend-strengthen in coming years, a perennial headache for EM return performance and financial market stability. Our bullish view on the USD is based on a number of factors including rising U.S. yields, well-advanced private sector deleveraging leading to recovering money demand, improving growth forecasts and a significantly improved U.S. current account/trade deficit balance. As a result, we look for the USD to appreciate broadly vs. EM currencies in the coming years. Thus, this dynamic will weigh on the performance of local currency denominated markets (FX, local bonds, and equities) and drag on EM sovereign credit fundamentals.
Global Economic and Market Conditions
The global economic and market backdrop has deteriorated for emerging markets since 2010. The economic outlook for 2014 has held up better in DM than in EM (as seen in Fig. 4) with EM forecasts witnessing a trend decline while the DM recovery from crisis is resulting in forecast resiliency.
Fig. 3: Potential GDP growth continuing to decline
‐1.2
‐1.0
‐0.8
‐0.6
‐0.4
‐0.2
0.0
0.2%
G10
Asia (ex‐Japan)
Developing EMEA
Latin America
World
2014 Consensus GDP Forecasts, Changes since 1/1/2013
Sources: Bloomberg, Scotiabank, E491
Fig. 4: EM growth outlook deteriorates, DM holds strong
‐4%
‐2%
0%
2%
4%
6%
8%
10%
12%
14%
16%
18%
‐40
‐20
0
20
40
60
80
Jan‐08 Jan‐09 Jan‐10 Jan‐11 Jan‐12 Jan‐13 Jan‐14
EM Capital Inflow Index (6mo%) ‐ LHS
OECD Total Excess Money Supply (M1‐Nom'l GDP y/y%,6mo lead) ‐ RHS
Sources: OECD, Scotiabank, E371
Fig. 5: QE tapering to slowly weigh on global monetary conditions Fig. 6: Excess money supply offers little support for capital flows
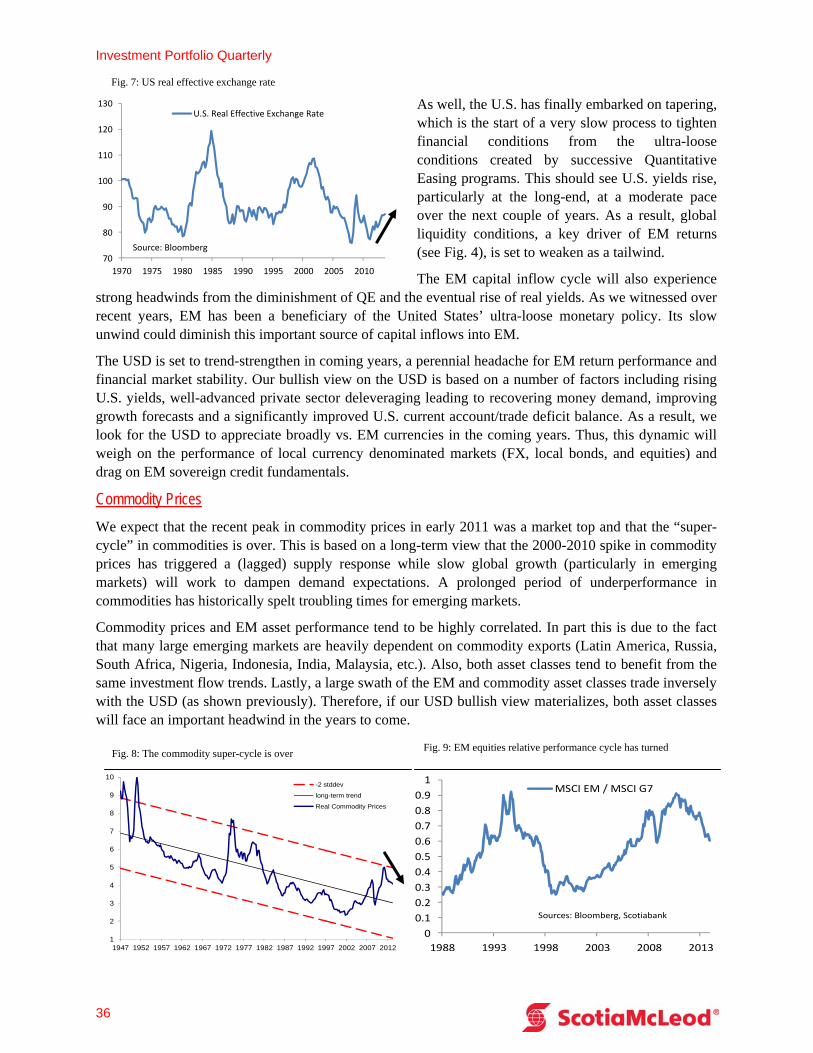
Investment Portfolio Quarterly
36
As well, the U.S. has finally embarked on tapering, which is the start of a very slow process to tighten financial conditions from the ultra-loose conditions created by successive Quantitative Easing programs. This should see U.S. yields rise, particularly at the long-end, at a moderate pace over the next couple of years. As a result, global liquidity conditions, a key driver of EM returns (see Fig. 4), is set to weaken as a tailwind.
The EM capital inflow cycle will also experience strong headwinds from the diminishment of QE and the eventual rise of real yields. As we witnessed over recent years, EM has been a beneficiary of the United States’ ultra-loose monetary policy. Its slow unwind could diminish this important source of capital inflows into EM.
The USD is set to trend-strengthen in coming years, a perennial headache for EM return performance and financial market stability. Our bullish view on the USD is based on a number of factors including rising U.S. yields, well-advanced private sector deleveraging leading to recovering money demand, improving growth forecasts and a significantly improved U.S. current account/trade deficit balance. As a result, we look for the USD to appreciate broadly vs. EM currencies in the coming years. Thus, this dynamic will weigh on the performance of local currency denominated markets (FX, local bonds, and equities) and drag on EM sovereign credit fundamentals.
Commodity Prices
We expect that the recent peak in commodity prices in early 2011 was a market top and that the “super-cycle” in commodities is over. This is based on a long-term view that the 2000-2010 spike in commodity prices has triggered a (lagged) supply response while slow global growth (particularly in emerging markets) will work to dampen demand expectations. A prolonged period of underperformance in commodities has historically spelt troubling times for emerging markets.
Commodity prices and EM asset performance tend to be highly correlated. In part this is due to the fact that many large emerging markets are heavily dependent on commodity exports (Latin America, Russia, South Africa, Nigeria, Indonesia, India, Malaysia, etc.). Also, both asset classes tend to benefit from the same investment flow trends. Lastly, a large swath of the EM and commodity asset classes trade inversely with the USD (as shown previously). Therefore, if our USD bullish view materializes, both asset classes will face an important headwind in the years to come.
70
80
90
100
110
120
130
1970 1975 1980 1985 1990 1995 2000 2005 2010
U.S. Real Effective Exchange Rate
Source: Bloomberg
Fig. 7: US real effective exchange rate
‐
1
2
3
4
5
6
7
8
9
10
1947 1952 1957 1962 1967 1972 1977 1982 1987 1992 1997 2002 2007 2012
-2 stddev
long-term trend
Real Commodity Prices
0
0.1
0.2
0.3
0.4
0.5
0.6
0.7
0.8
0.9
1
1988 1993 1998 2003 2008 2013
MSCI EM / MSCI G7
Sources: Bloomberg, Scotiabank
Fig. 8: The commodity super-cycle is over Fig. 9: EM equities relative performance cycle has turned
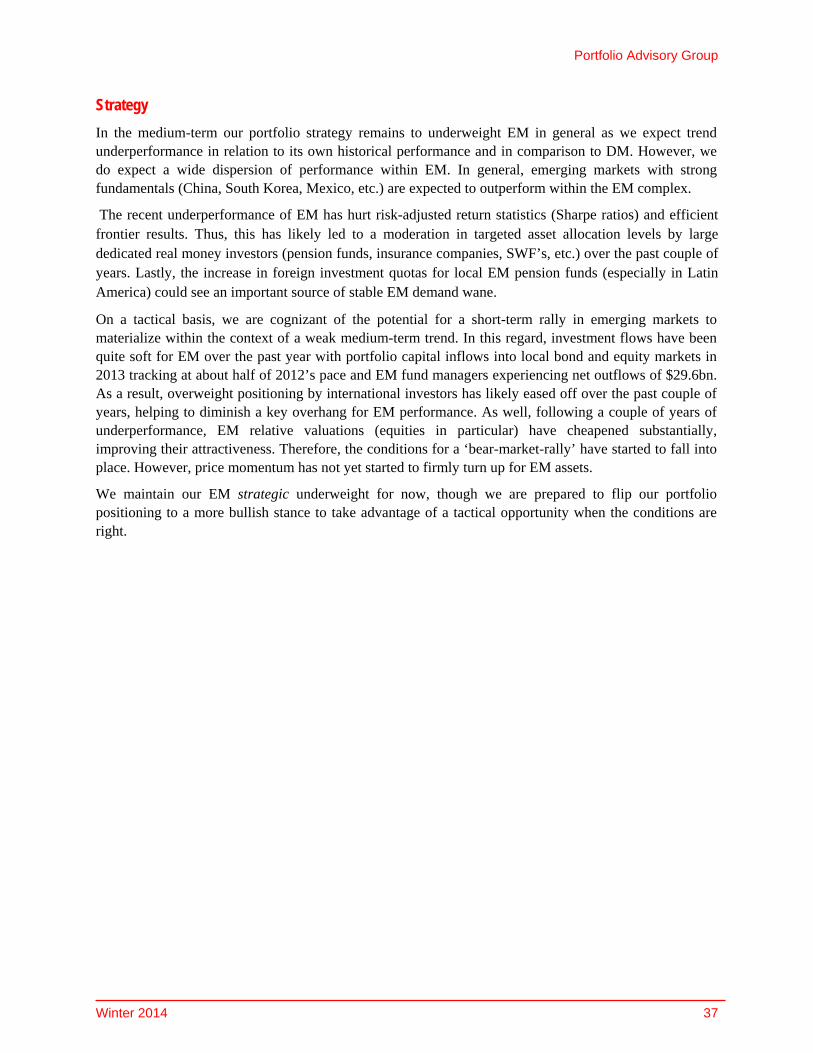
Portfolio Advisory Group
Winter 2014 37
Strategy
In the medium-term our portfolio strategy remains to underweight EM in general as we expect trend underperformance in relation to its own historical performance and in comparison to DM. However, we do expect a wide dispersion of performance within EM. In general, emerging markets with strong fundamentals (China, South Korea, Mexico, etc.) are expected to outperform within the EM complex.
The recent underperformance of EM has hurt risk-adjusted return statistics (Sharpe ratios) and efficient frontier results. Thus, this has likely led to a moderation in targeted asset allocation levels by large dedicated real money investors (pension funds, insurance companies, SWF’s, etc.) over the past couple of years. Lastly, the increase in foreign investment quotas for local EM pension funds (especially in Latin America) could see an important source of stable EM demand wane.
On a tactical basis, we are cognizant of the potential for a short-term rally in emerging markets to materialize within the context of a weak medium-term trend. In this regard, investment flows have been quite soft for EM over the past year with portfolio capital inflows into local bond and equity markets in 2013 tracking at about half of 2012’s pace and EM fund managers experiencing net outflows of $29.6bn. As a result, overweight positioning by international investors has likely eased off over the past couple of years, helping to diminish a key overhang for EM performance. As well, following a couple of years of underperformance, EM relative valuations (equities in particular) have cheapened substantially, improving their attractiveness. Therefore, the conditions for a ‘bear-market-rally’ have started to fall into place. However, price momentum has not yet started to firmly turn up for EM assets.
We maintain our EM strategic underweight for now, though we are prepared to flip our portfolio positioning to a more bullish stance to take advantage of a tactical opportunity when the conditions are right.
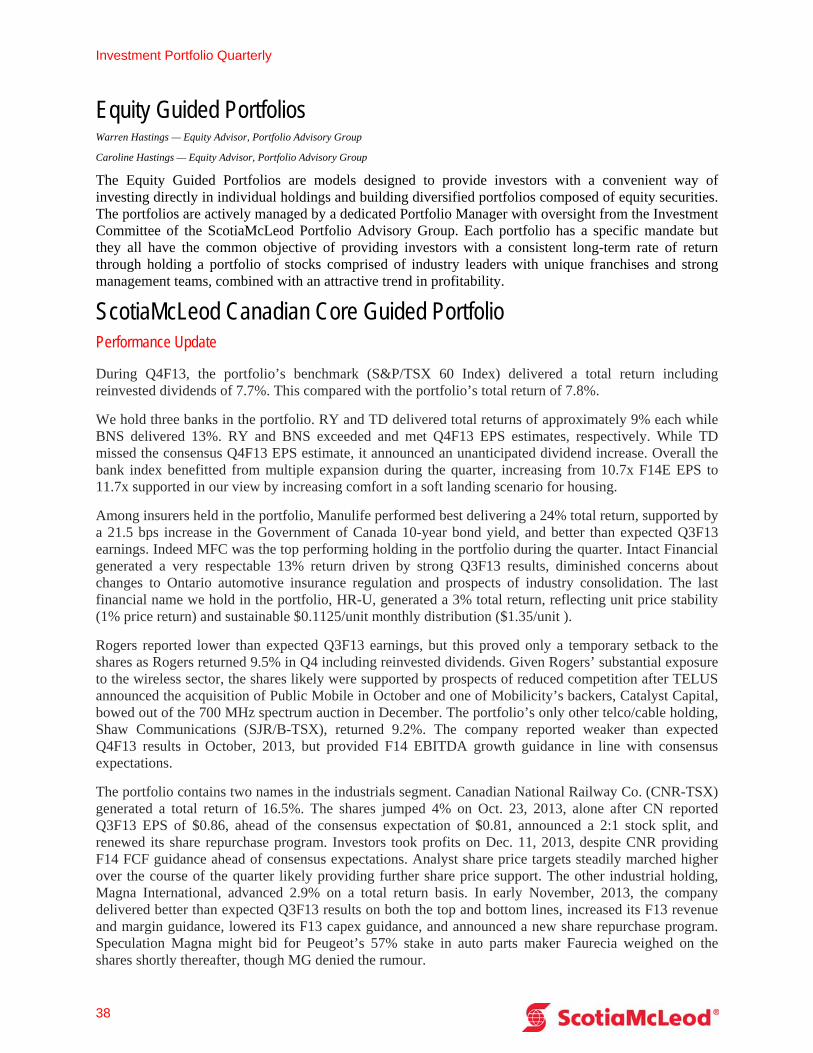
Investment Portfolio Quarterly
38
Equity Guided Portfolios Warren Hastings — Equity Advisor, Portfolio Advisory Group
Caroline Hastings — Equity Advisor, Portfolio Advisory Group
The Equity Guided Portfolios are models designed to provide investors with a convenient way of investing directly in individual holdings and building diversified portfolios composed of equity securities. The portfolios are actively managed by a dedicated Portfolio Manager with oversight from the Investment Committee of the ScotiaMcLeod Portfolio Advisory Group. Each portfolio has a specific mandate but they all have the common objective of providing investors with a consistent long-term rate of return through holding a portfolio of stocks comprised of industry leaders with unique franchises and strong management teams, combined with an attractive trend in profitability.
ScotiaMcLeod Canadian Core Guided Portfolio Performance Update
During Q4F13, the portfolio’s benchmark (S&P/TSX 60 Index) delivered a total return including reinvested dividends of 7.7%. This compared with the portfolio’s total return of 7.8%.
We hold three banks in the portfolio. RY and TD delivered total returns of approximately 9% each while BNS delivered 13%. RY and BNS exceeded and met Q4F13 EPS estimates, respectively. While TD missed the consensus Q4F13 EPS estimate, it announced an unanticipated dividend increase. Overall the bank index benefitted from multiple expansion during the quarter, increasing from 10.7x F14E EPS to 11.7x supported in our view by increasing comfort in a soft landing scenario for housing.
Among insurers held in the portfolio, Manulife performed best delivering a 24% total return, supported by a 21.5 bps increase in the Government of Canada 10-year bond yield, and better than expected Q3F13 earnings. Indeed MFC was the top performing holding in the portfolio during the quarter. Intact Financial generated a very respectable 13% return driven by strong Q3F13 results, diminished concerns about changes to Ontario automotive insurance regulation and prospects of industry consolidation. The last financial name we hold in the portfolio, HR-U, generated a 3% total return, reflecting unit price stability (1% price return) and sustainable $0.1125/unit monthly distribution ($1.35/unit ).
Rogers reported lower than expected Q3F13 earnings, but this proved only a temporary setback to the shares as Rogers returned 9.5% in Q4 including reinvested dividends. Given Rogers’ substantial exposure to the wireless sector, the shares likely were supported by prospects of reduced competition after TELUS announced the acquisition of Public Mobile in October and one of Mobilicity’s backers, Catalyst Capital, bowed out of the 700 MHz spectrum auction in December. The portfolio’s only other telco/cable holding, Shaw Communications (SJR/B-TSX), returned 9.2%. The company reported weaker than expected Q4F13 results in October, 2013, but provided F14 EBITDA growth guidance in line with consensus expectations.
The portfolio contains two names in the industrials segment. Canadian National Railway Co. (CNR-TSX) generated a total return of 16.5%. The shares jumped 4% on Oct. 23, 2013, alone after CN reported Q3F13 EPS of $0.86, ahead of the consensus expectation of $0.81, announced a 2:1 stock split, and renewed its share repurchase program. Investors took profits on Dec. 11, 2013, despite CNR providing F14 FCF guidance ahead of consensus expectations. Analyst share price targets steadily marched higher over the course of the quarter likely providing further share price support. The other industrial holding, Magna International, advanced 2.9% on a total return basis. In early November, 2013, the company delivered better than expected Q3F13 results on both the top and bottom lines, increased its F13 revenue and margin guidance, lowered its F13 capex guidance, and announced a new share repurchase program. Speculation Magna might bid for Peugeot’s 57% stake in auto parts maker Faurecia weighed on the shares shortly thereafter, though MG denied the rumour.
Portfolio Advisory Group
Winter 2014 39
Materials returns were also mixed, with Agrium (AGU-TSX) and Teck Resources (TCK/B-TSX) shares generating total returns of 13.2% and 1.7%, respectively. Agrium shares, while hampered by weaker than expected Q3F13 earnings, likely were supported by positive developments in the potash market during the quarter including the sale of a stake in Uralkali to an investor close to the Russian leadership – suggesting the old BPC potash marketing cartel might be close to reforming and supporting the price of the commodity. AGU has substantially less exposure to potash than peer Potash Corp., but the news likely improved sentiment across the fertilizer complex. Teck Resources’ shares were buffeted by a number of news items and trends during the quarter, with closing prices ranging from $24.41/sh to $30.54/sh. On one hand, Q3F13 earnings were better than expected. However, a report from Reuters in late November that Teck was part of a consortium bidding for the Las Bambas copper mine in Peru weighed on the shares, along with several analyst rating downgrades during the quarter, and sanctioning of the Fort Hills oil sands project.
TransCanada Pipelines (TRP-TSX) is the sole pipeline equity held in the portfolio. It generated an 8% total return, announcing an earnings beat in early November. Other energy-related equities delivered total returns ranging from -0.5% to +11.7%. In C$ terms, Canada’s benchmark crude oil price (Western Canada Select) advanced 10.7%, while West Texas Intermediate (Cushing) declined a slight 0.7%. BTE, despite reporting better than expected Q3F13 production and cash flow figures and F14 guidance that was largely in line with consensus expectations, delivered a -0.5% total return in Q4F13. SU returned 1.7% following strong gains in Q2F13 (when it announced a 53% dividend increase) and Q3F13 (when Warren Buffett announced a substantial stake in the company). SU’s F14 capex and production guidance, announced Nov. 20, were both slightly lower than Street expectations. CPG delivered a 7.6% total return after demonstrating solid organic production growth, despite guiding to slightly higher than expected F14 capex. CNQ, which posted the best total return (+11.7%) among all energy-related names in the portfolio, benefitted from a 60% dividend increase announced Nov. 7, 2013, plus Q3F13 CFPS that beat consensus expectations. The company’s F14 production guidance exceeded estimates though was partially offset by a larger than expected capital budget.
Changes:
On October 2, 2013, we removed Brookfield Office Properties (BPO-TSX). It returned 16.5% YTD and 26% since being added to the portfolio in late 2011. Our thesis on BPO was that it was trading materially below fair market value, largely due to leasing uncertainties at its World Financial Center complex in Manhattan. Our expectation was that BPO would trade up to C$19.00 – C$20.00/share if this space were to be fully leased. BPY’s US$19.34/share offer price (made September 30, 2013) was reasonably close to our estimated FMV range. With most of the upside realized, it made sense to us to sell BPO and move on, particularly with the BPY transaction expected to take 4-6 months.
On November 25, 2013, we removed Finning International (FTT-TSX) from the portfolio. It was added to the portfolio on November 7, 2012 with a total holding period return of 7.9%. During this period, Finning traded in line with many of its closest peers including Wajax, Toromont, Caterpillar, Joy Global, Deere, and Komatsu. We added Finning to conservatively gain exposure to an expected recovery in commodity prices, led by a rebound in the Chinese economy. We were attracted by Finning’s dividend yield and by its business mix that had large exposures to the stable Canadian market and after-sales support services. Although the global economy showed signs of recovery, commodity prices (particularly gold & copper) stagnated over our hold period. While we expect positive catalysts for copper later in 2014, we expect further weakness in gold and gold mining activity. Therefore we took advantage of strength in Finning’s share price to exit the position, particularly in view of the shares’ elevated valuation (7.5x forward EV/EBITDA versus a 6.9x historical average and 6.2x when we added it to the portfolio), lack of catalysts, and declining consensus EBITDA estimates.
Investment Portfolio Quarterly
40
On December 20, 2013, we removed Goldcorp (GG-NYSE) and replaced it with Emera (EMA-TSX). We had held Goldcorp in the portfolio believing we needed to have at least some representation in the gold sub-sector due to slower than expected global growth and high debt levels around the globe. The gold call served as a small hedge against our economic outlook. In retrospect we held on for far too long. The start of FOMC tapering combined with stronger than expected economic numbers out of Europe affirmed our belief global economies were well on the path to recovery. As such we saw no reason to hold Goldcorp any longer especially in view of our expectation gold would trade lower over the coming months. Our Emera (EMA-TSX) stake was initiated as a short-term position after the company announced (on December 10, 2013) its widely anticipated equity issue to finance its growth initiatives including the purchase of merchant gas-fired power plants from Capital Power and the Maritime Link project. This removed an overhang on the shares, given the company’s expectation the proceeds, in combination with internal cash generation and additional debt and preferred share financing activities, should be sufficient to fund EMA’s capex schedule through 2015. We also viewed EMA’s 4.8% dividend yield attractive and sustainable when we switched into the name.
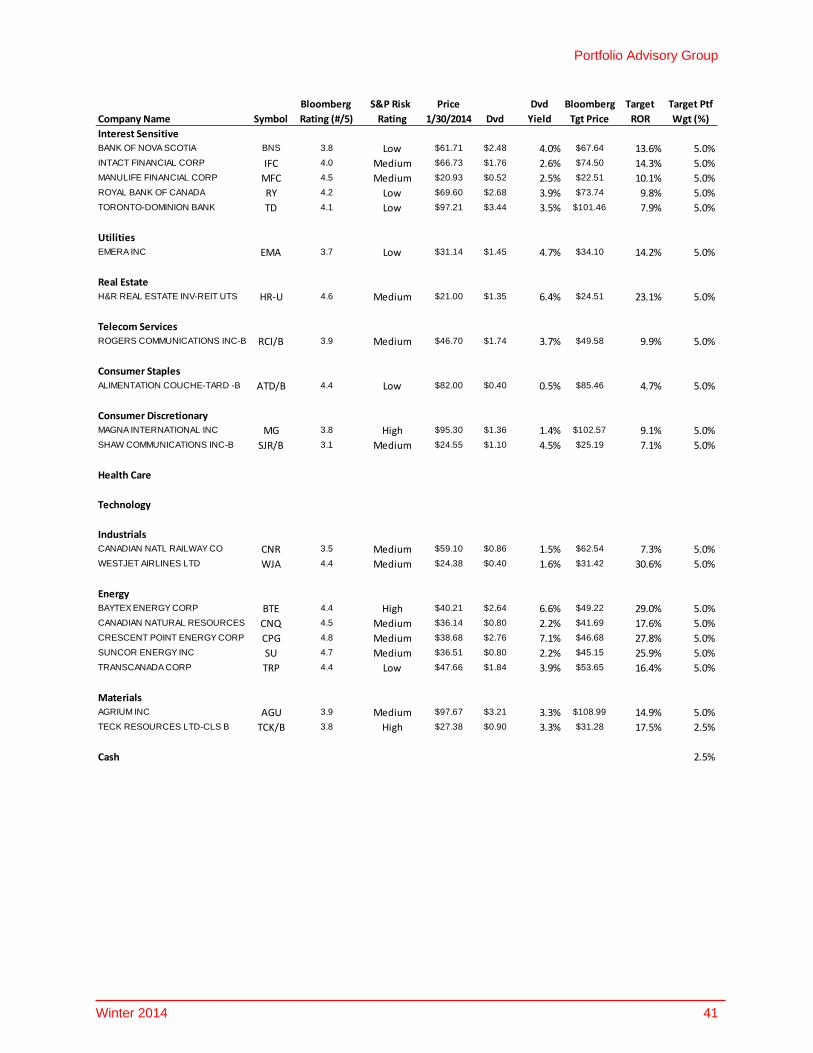
Portfolio Advisory Group
Winter 2014 41
Bloomberg S&P Risk Price Dvd Bloomberg Target Target Ptf
Company Name Symbol Rating (#/5) Rating 1/30/2014 Dvd Yield Tgt Price ROR Wgt (%)
Interest SensitiveBANK OF NOVA SCOTIA BNS 3.8 Low $61.71 $2.48 4.0% $67.64 13.6% 5.0%INTACT FINANCIAL CORP IFC 4.0 Medium $66.73 $1.76 2.6% $74.50 14.3% 5.0%MANULIFE FINANCIAL CORP MFC 4.5 Medium $20.93 $0.52 2.5% $22.51 10.1% 5.0%ROYAL BANK OF CANADA RY 4.2 Low $69.60 $2.68 3.9% $73.74 9.8% 5.0%TORONTO-DOMINION BANK TD 4.1 Low $97.21 $3.44 3.5% $101.46 7.9% 5.0%
UtilitiesEMERA INC EMA 3.7 Low $31.14 $1.45 4.7% $34.10 14.2% 5.0%
Real EstateH&R REAL ESTATE INV-REIT UTS HR‐U 4.6 Medium $21.00 $1.35 6.4% $24.51 23.1% 5.0%
Telecom ServicesROGERS COMMUNICATIONS INC-B RCI/B 3.9 Medium $46.70 $1.74 3.7% $49.58 9.9% 5.0%
Consumer StaplesALIMENTATION COUCHE-TARD -B ATD/B 4.4 Low $82.00 $0.40 0.5% $85.46 4.7% 5.0%
Consumer DiscretionaryMAGNA INTERNATIONAL INC MG 3.8 High $95.30 $1.36 1.4% $102.57 9.1% 5.0%SHAW COMMUNICATIONS INC-B SJR/B 3.1 Medium $24.55 $1.10 4.5% $25.19 7.1% 5.0%
Health Care
Technology
IndustrialsCANADIAN NATL RAILWAY CO CNR 3.5 Medium $59.10 $0.86 1.5% $62.54 7.3% 5.0%WESTJET AIRLINES LTD WJA 4.4 Medium $24.38 $0.40 1.6% $31.42 30.6% 5.0%
EnergyBAYTEX ENERGY CORP BTE 4.4 High $40.21 $2.64 6.6% $49.22 29.0% 5.0%CANADIAN NATURAL RESOURCES CNQ 4.5 Medium $36.14 $0.80 2.2% $41.69 17.6% 5.0%CRESCENT POINT ENERGY CORP CPG 4.8 Medium $38.68 $2.76 7.1% $46.68 27.8% 5.0%SUNCOR ENERGY INC SU 4.7 Medium $36.51 $0.80 2.2% $45.15 25.9% 5.0%TRANSCANADA CORP TRP 4.4 Low $47.66 $1.84 3.9% $53.65 16.4% 5.0%
MaterialsAGRIUM INC AGU 3.9 Medium $97.67 $3.21 3.3% $108.99 14.9% 5.0%TECK RESOURCES LTD-CLS B TCK/B 3.8 High $27.38 $0.90 3.3% $31.28 17.5% 2.5%
Cash 2.5%
Investment Portfolio Quarterly
42
ScotiaMcLeod Canadian Income Plus Guided Portfolio
Warren Hastings — Associate, Portfolio Advisory Group
Performance Update
During Q4F13, the portfolio’s benchmark (the Dow Jones Canada Dividend Select index) returned 6.6%. This compared with the portfolio’s total return of 7.8%.
We hold three banks in the portfolio. RY and TD delivered total returns of approximately 9% each while BNS delivered 13%. RY and BNS exceeded and met Q4F13 EPS estimates, respectively. While TD missed the consensus Q4F13 EPS estimate, it announced an unanticipated dividend increase. Overall the bank index benefitted from multiple expansion during the quarter, increasing from 10.7x F14E EPS to 11.7x supported in our view by increasing comfort in a soft landing scenario for housing. The final financial name held in the portfolio for the entirety of the quarter was H&R REIT (HR.u-TSX), which generated a 3% total return, reflecting unit price stability (1% price return) and a sustainable $0.1125/unit monthly distribution ($1.35/unit).
Among telco equities held in the portfolio, Rogers reported lower than expected Q3F13 earnings, but this proved only a temporary setback to the shares as Rogers returned 9.5% in Q4 including reinvested dividends. Given Rogers’ substantial exposure to the wireless sector, the shares likely were supported by prospects of reduced competition after TELUS announced the acquisition of Public Mobile in October and one of Mobilicity’s backers, Catalyst Capital, bowed out of the 700 MHz spectrum auction in December. TELUS shares benefitted for similar reasons as well as from another quarterly earnings beat on Nov. 8, 2013, generating an 8.1% total return during the quarter. Shaw Communications (SJR/B-TSX) returned 9.2%. The company reported weaker than expected Q4F13 results in October, 2013, but provided F14 EBITDA growth guidance in line with consensus expectations.
In the pipelines and midstream sector, TransCanada Pipelines (TRP-TSX) generated an 8.3% total return, announcing an earnings beat in early November. With an 8.6% return, ENB slightly nudged out its peer, supported by a positive regulatory decision related to the Northern Gateway project in December. This was in spite of disappointing Q3F13 earnings and concern over the company’s earnings growth guidance and trajectory. Inter Pipeline Ltd. (IPL-TSX) returned 4.0% following very strong performance in Q2F13 (+17.5% including dividends). Lower than expected Q3F13 EBITDA along with two analyst rating downgrades during the quarter (likely related to valuation) may also have weighed on the share price. Gibson Energy Inc. tied with BNS as the best performing equity in the portfolio during the quarter delivering a 12.6% total return as Q3F13 EBITDA beat the consensus estimate and the company provided higher than expected F14 capex guidance, underscoring Gibson’s growth prospects.
The portfolio holds two energy E&P-related equities, BTE and CPG. In C$ terms, Canada’s benchmark crude price (Western Canada Select) advanced 10.7%, while West Texas Intermediate was down a slight 0.7%. BTE declined 0.5% despite reporting better than expected Q3F13 production and cash flow figures and F14 guidance that was largely in line with consensus expectations. CPG, on the other hand, delivered a +7.6% total return after demonstrating solid organic production growth, though it guided to slightly higher than expected F14 capex.
Brookfield Renewable Energy Partners (BEP.u-TSX) is the only utility held in the portfolio and delivered a +4.1% return. The units remained fairly range bound during the quarter with the market having priced in a higher interest rate environment during Q2F13 and Q3F13. BEP-U delivered Q3F13 EBITDA that slightly missed consensus estimates, but this was offset by cash flow guidance toward the high end management’s 3%-5% target range.
Portfolio Advisory Group
Winter 2014 43
Changes
On October 9, 2013, we removed Power Corp. of Canada (POW-TSX) and added Agrium Inc. (AGU-TSX). Power Corporation’s indirect controlling interest in Great-West Lifeco accounts for the majority of its earnings, and we believed integration costs associated with GWO’s acquisition of Irish Life might weigh on financials and hence GWO, PWF, and POW share prices. Additionally, we thought new mutual fund fee regulations could result in greater disclosure of fees paid to advisors and hence redemptions at IGM Financial Inc. (IGM-TSX), in which POW also has an indirect controlling interest. POW, which was added to the portfolio on April 19, 2011, returned 14% over our holding period including reinvested dividends and yielded 4.1% when it was removed from the portfolio. We replaced POW with Agrium, shares of which we viewed as attractively valued after they sold off following disappointing Q3F13 guidance. AGU’s strong dividend growth track record, conservative payout ratio, relatively small exposure to the weak potash market (and higher exposure to the firmer nitrogen fertilizer market) also supported our switch decision. At the time of purchase, AGU shares traded at 6.6x EV/EBITDA on NTM consensus estimates as compared with the long-term average of 6.7x and yielded 3.5%.
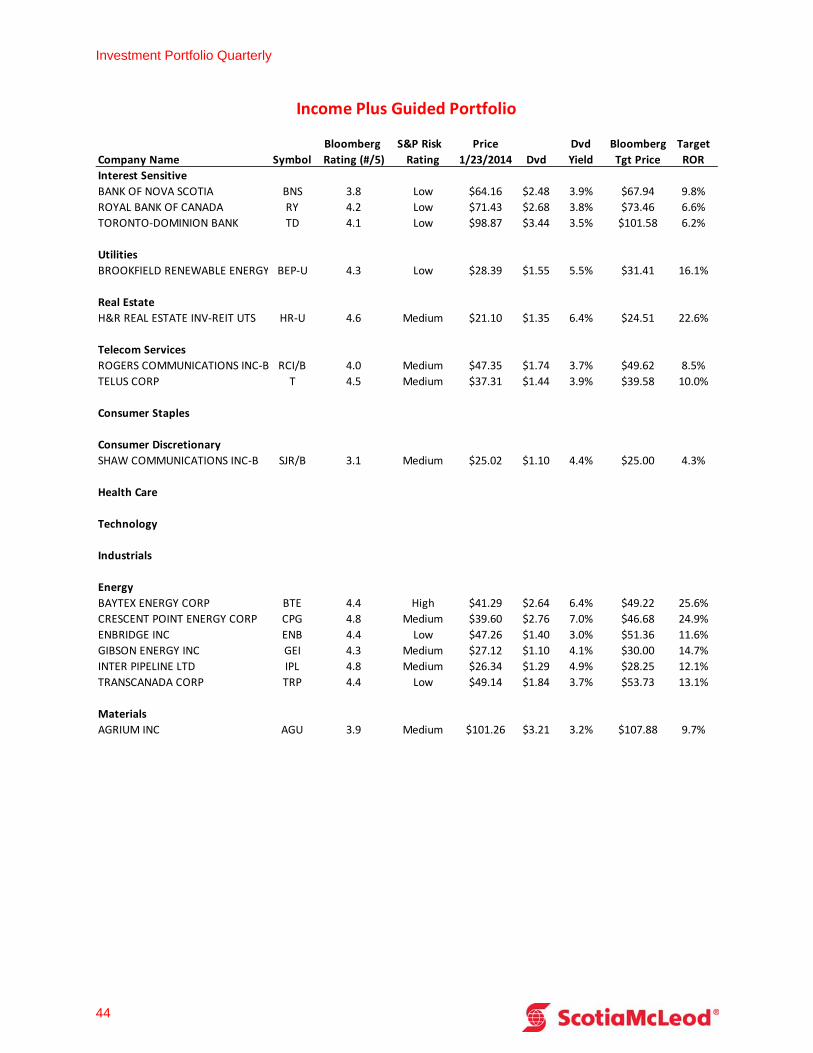
Investment Portfolio Quarterly
44
Bloomberg S&P Risk Price Dvd Bloomberg Target
Company Name Symbol Rating (#/5) Rating 1/23/2014 Dvd Yield Tgt Price ROR
Interest Sensitive
BANK OF NOVA SCOTIA BNS 3.8 Low $64.16 $2.48 3.9% $67.94 9.8%
ROYAL BANK OF CANADA RY 4.2 Low $71.43 $2.68 3.8% $73.46 6.6%
TORONTO‐DOMINION BANK TD 4.1 Low $98.87 $3.44 3.5% $101.58 6.2%
Utilities
BROOKFIELD RENEWABLE ENERGY BEP‐U 4.3 Low $28.39 $1.55 5.5% $31.41 16.1%
Real Estate
H&R REAL ESTATE INV‐REIT UTS HR‐U 4.6 Medium $21.10 $1.35 6.4% $24.51 22.6%
Telecom Services
ROGERS COMMUNICATIONS INC‐B RCI/B 4.0 Medium $47.35 $1.74 3.7% $49.62 8.5%
TELUS CORP T 4.5 Medium $37.31 $1.44 3.9% $39.58 10.0%
Consumer Staples
Consumer Discretionary
SHAW COMMUNICATIONS INC‐B SJR/B 3.1 Medium $25.02 $1.10 4.4% $25.00 4.3%
Health Care
Technology
Industrials
Energy
BAYTEX ENERGY CORP BTE 4.4 High $41.29 $2.64 6.4% $49.22 25.6%
CRESCENT POINT ENERGY CORP CPG 4.8 Medium $39.60 $2.76 7.0% $46.68 24.9%
ENBRIDGE INC ENB 4.4 Low $47.26 $1.40 3.0% $51.36 11.6%
GIBSON ENERGY INC GEI 4.3 Medium $27.12 $1.10 4.1% $30.00 14.7%
INTER PIPELINE LTD IPL 4.8 Medium $26.34 $1.29 4.9% $28.25 12.1%
TRANSCANADA CORP TRP 4.4 Low $49.14 $1.84 3.7% $53.73 13.1%
Materials
AGRIUM INC AGU 3.9 Medium $101.26 $3.21 3.2% $107.88 9.7%
Income Plus Guided Portfolio
Portfolio Advisory Group
Winter 2014 45
ScotiaMcLeod U.S. Core Guided Portfolio Caroline Escott – Portfolio Manager, Portfolio Advisory Group
Performance Update
The S&P 500 delivered a very strong return in the fourth quarter, up 9.9% on a simple price basis and 10.5% on a total return basis. The U.S. Core Guided Portfolio also performed very well in the quarter, delivering a total return of 10.8%. This follows a relatively strong showing in Q3 as well, when the S&P 500 delivered a total return of 5.2%. Over the year the S&P 500 benefited from rising risk appetite as the P/E multiple expanded 2.5x in 2013, helping drive the index up 29.6% over the year.
The primary focus last quarter was Fed tapering, which was initiated in December with the Fed’s announcement of a reduction in bond purchases from $85B to $75B per month. After creating meaningful volatility mid-year as speculation regarding the timing and pace of tapering grew, investors embraced the news of tapering on December 18 with the market rallying into year-end.
We expect the Fed will continue to taper at a rate of $10 billion per FOMC meeting (every six weeks) until its quantitative easing program is completely unwound by the end of 2014. However, economic conditions will drive these decisions so any further tapering will be data dependent. At the same time, the Fed has remained committed to a short-term interest rate of close to zero for the year, which should allow the Fed to balance the return to normal long-term bond yields while allowing economic momentum to build.
We expect improving U.S., European and Chinese economic data will continue to support underlying business fundamentals and equity market performance this year. The combined wealth effect of higher home prices, the strength in equity markets, and relatively consistent job growth has contributed to improved consumer sentiment.
In the U.S., corporate balance sheets are in good shape with record cash and cash flow allowing companies to return capital to shareholders via increased dividends and share buybacks. Profit margins and corporate earnings are at record levels, reflecting extensive cost cutting and improved utilization of assets. We believe that Financials, Technology, Industrials and Healthcare will outperform in this environment.
It was the cyclical sectors that outperformed last quarter, with Industrials leading the market with a 12.9% price return, followed by Information Technology at 12.8%, Consumer Discretionary at 10.4% and Materials delivering 10.1% on a simple price return basis. The sectors that lagged were Utilities, which delivererd 1.8%, Telecom Services with a return of 4.2%, Energy at 7.7%, Consumer Staples at 7.9%, Health Care at 9.6% and Financials, which performed in-line with the market with a return of 9.8%.
Within the portfolio there was a wide range of performance on both a sector basis as well as at the individual stock level. The top performing positions came equally from cyclical sectors as well as defensive sectors, Consumer Staples, HealthCare, Industrials, Technology and Consumer Discretionary while the laggards were more heavily skewed towards the cyclical sectors, Technology, Consumer Discretionary and Energy. The best performing sectors within the portfolio were Consumer Staples and Health Care with an average return of 26.1% and 16.2%.
There were a few very strong performers in the portfolio in the fourth quarter. CVS Caremark (CVS) and McKesson (MCK) both delivered exceptional returns for investors, CVS delivered a total return of 26.5% and McKesson delivered a total return of 26.0%. While CVS and MCK were very strong leaders in the quarter, there were a number of stocks that performed quite well, with many delivering double-digit returns over the quarter.
Investment Portfolio Quarterly
46
As noted, the strength in Consumer Staples was driven by the performance of CVS Caremark, as the stock climbed higher throughout the quarter. The newsflow on the company was positive through the quarter as there were a couple of analyst upgrades and positive investment comments regarding the company’s attractive integrated business model and strong market position. CVS is expected to benefit from increased drug utilization from an aging population, and increased sales of generic drugs. Demand is also expected to increase as consumers gained healthcare coverage with the introduction of the Patient Protection and Affordable Care Act (Obamacare) at the start of the new year.
The HealthCare sector also performed very well, led by the strength in McKesson. MCK has been a consistently strong performer throughout the year. Over the past three months, the share price performance was driven by a combination of strong Q2 results in mid-October as well as the news that MCK had offered to acquire German pharmaceutical company Celesio. The transaction was viewed very positively as the growth opportunities associated with the business were quite strong. Unfortunately, the share price has declined over the past few days after news that MCK’s offer did not receive the necessary 75% shareholder approval. The failure was quite surprising as it was a friendly transaction with Celesio’s largest shareholders in agreement. MCK is expected to look at alternatives, such as a Joint Venture arrangement. Nevertheless, while the failure of the deal is disappointing, we believe MCK will continue to deliver strong results through 2014.
There were also a few notable laggards in the portfolio, including EMC (EMC) which fell 1.6%, and McDonald’s (MCD) and Apache (APA), which were essentially flat with a positive return of 0.9% in the quarter.
We recently removed MCD (more details below in Changes) as the stock continues to experience weak same-store data in North America and APMEA. The share price has been range-bound over the past six months, and we believe it may continue until there is an improvement in same store sales data.
Within Technology, EMC was a laggard position throughout the year as it was negatively impacted by the delay in business spending. While the stock has lagged, we continue to believe there is very attractive upside potential driven by increasing demand for data storage globally, analytic needs, and continued migration toward cloud computing. We believe that business spending will begin to accelerate in 2014.
The weakness in Apache (APA) is in-line with general malaise in the Energy Sector as oil prices fell over the quarter, with WTI declining from approximately $102/bbl to the current level of $94/bbl. While natural gas prices were strong in the quarter, up 18%, APA’s commodity mix is 78% oil. Our remaining two positions, Occidental Petroleum (OXY) and Halliburton (HAL) also underperformed on a combination of a weak oil market and concerns about soft Q4 results. We continue to believe all three companies are strong players within their industry and will perform well once the near-term macro issues subside.
The exceptional strength in CVS and MCK drove very strong performance in their respective sectors, with Consumer Staples and HealthCare delivering strong returns from a sector perspective, up 26.6% and 19.0%, respectively. While there were a few sectors that underperformed their benchmark counterparts, they all performed quite well on an absolute basis, Telecom and Energy were the only two sectors that did not deliver double digit returns, with Telecom generating 2.6% and Energy generating a return of 3.0%.
Changes:
There were a number of changes made to the portfolio in the fourth quarter, more so than average as we repositioned the portfolio to take advantage of the investment environment that we expect to see in 2014. With the changes we have increased our exposure to Industrials and HealthCare, as we believe these are two of the sectors that are positioned to outperform this year. As noted above, we also believe Technology and Financials will deliver better than average results, and we have maintained our exposure to these sectors.
Portfolio Advisory Group
Winter 2014 47
We began the quarter by replacing Microsoft (MSFT) with Oracle (ORCL) on October 15. After a late entrance into the smartphone and tablet markets, MSFT is retooling its strategy into “Devices and Services”, and will leave its “Business Division” and “Server and Tools” businesses intact. While we believe MSFT’s new strategy is a step in the right direction, we believe the stock may be range-bound in the near-term as the market awaits the naming of a new CEO and evidence of positive results from the “Devices and Services” business.
We believe Oracle is an attractive alternative to MSFT. ORCL has done a great job of increasing its sales force as the company is launching new products. We believe ORCL has the right strategies in place to transition its products and services to “The Cloud” in coming years. The company generates strong cash flow with an estimated $13 billion in free cash flow, even in a slow business spending environment.
On October 21 we replaced AT&T with Verizon Communications as we felt Verizon offered a more attractive risk/reward profile. While the outlook for T remains reasonable, we believe there is better potential with VZ given its stronger financial outlook and better average revenue growth per account which could translate into faster dividend growth at VZ versus T.
We also made a couple of changes to the holdings in mid-November, with the removal of Caterpillar and the reduction of International Paper to a half position. Both of the trades were entered into primarily based on our view that equity markets were poised for a modest correction and as such we decided to raise cash in the portfolio. We felt IP and CAT were attractive candidates to raise cash given a lack of near-term catalysts and continued uncertainty in parts of each business due to macro issues. The market did subsequently pull back, albeit it was a very modest 1.7% pullback over the following couple of weeks.
For International Paper we decided to reduce the position to a half position as we felt that our Materials exposure needed to be diversified into other resources or another sector, particularly considering the diversity of the benchmark sector in the S&P 500. We continue to have a positive view on IP given its well positioned asset base, increasing cash flow and attractive valuation.
In late October CAT reported weaker than expected results and reduced revenue and earnings guidance for 2013 on lower mining sales. While management said that it believes Coal, Copper, and Iron Ore prices are strong enough for mining companies to add capex, indications from a number of large mining companies point to continued cost cutting and capital expenditure reductions. Given the continued uncertainty related to the Resources division, we view CAT as a turnaround story with a very attractive market presence and valuation. However, we expect the share price will remain range-bound until we see an improvement in mining sales. We will revisit this investment once the sentiment turns more positive or we can identify positive catalysts in construction or power equipment.
As noted earlier, there were a number of changes made in December as we repositioned the portfolio for our updated outlook for 2014. In keeping with our preference for Financials and Industrials, we increased our exposure to the sectors with the addition of Roche Holdings (RHHBY), Gilead Sciences (GILD), Ryder (R) and United Technologies (UTX). In order to accommodate these positions in the portfolio, we removed McDonald’s and our SPY position, we utilized some cash, we reduced our positions in General Electric (GE) and Verizon (VZ) and we trimmed some of our overweight positions in McKesson (MCK) and Comcast (CMCSA).
The trimming of CMCSA and MCK were done specifically to rebalance the portfolio and bring them back down to the 5% weight. In addition, the cash was necessary in order to add the new positions within Industrials and Healthcare.
In addition, McDonald’s was removed, after being reduced to a half position in September. We chose to sell the remaining half position in mid-December as the company continues to suffer from weak same-store sales in the U.S. and Asia. Overall, the data remains below trend as the price conscious customer continues to consumer MCD’s low margin dollar menu. While the downside risk from this point may be limited, we felt there were better opportunities elsewhere, in stocks such as Royal Caribbean, which offers a more attractive outlook and potential.
Investment Portfolio Quarterly
48
We reduced our position in Verizon (VZ) to a half position with a weight of 2.5% in order to bring our telecom exposure closer to a market weight exposure, 2.5% versus the sector weight of 2.3%. While we continue to have a positive outlook for Verizon, as noted above in our comments on the switch from AT&T to Verizon, we believe the sector overall will perform in-line with the market and as we noted in earlier comments, we currently prefer Industrials, Financials, Healthcare and Technology.
We also reduced our General Electric (GE) position to a half weight position in order to make room for the addition of Ryder (R) and United Technologies (UTX). GE performed very well last year, delivering a total return of 37.3% and we wanted to crystallize some of that gain on GE. We continue to have a positive outlook for GE given its diversified business model and reasonable valuation.
We added United Technologies (UTX) and Ryder (R) to the portfolio, increasing our exposure to Industrials. UTX provides investors with exposure to a mix of revenue from the industrial businesses and aerospace businesses. In 2013, approximately 56% of revenue was generated in the U.S., 21% in Europe and 15% from Asia Pacific. UTX is expected to deliver organic revenue growth in the range of 4%, driven by a few variables, including improving economic activity in emerging markets and the U.S., as well as positive global air traffic growth and a strengthening U.S. residential construction market. The company has a strong record of cash generation, free cash flow is expected to be $5.6 billion this year. It also has a strong history of dividend growth, with a CAGR of 10.3% over the past five years. We believe the company will continue to focus on debt repayment, increased dividends and its share buyback program.
Elsewhere in Industrials, we also added Ryder (R), which is a trucking company that provides a continuum of logistics, supply chain, and transportation management solutions worldwide. We believe that Ryder is a well-managed company that should benefit from secular growth in fleet and logistics outsourcing. The underlying industry fundamentals point to a healthy truck environment, pushing related logistics services and higher margins. We increased our exposure to HealthCare, as it is another sector that we believe is well positioned to deliver solid returns to shareholders.
We added Roche Holdings (RHHBY) and Gilead Sciences (GILD) for added HealthCare exposure. Roche Holdings is a Swiss company that develops and manufactures pharmaceutical and diagnostic products. Roche has significant exposure to the biotech (biologics) market. Biotech drugs offer patent protection given the difficulty for generics to prove bioequivalence. It is also a market leader in the rapidly growing molecular diagnostic market (sequencing devices). Sequencing technologies are critical to studying the genome and how variations correlate to diseases, helping the discovery of new drugs and treatments. We believe Roche offers an attractive investment opportunity given its appealing exposure to traditional pharma, biotech and diagnostics. We expect the company to continue to see strong revenue growth from its robust drug pipeline, diagnostic unit and balance sheet flexibility.
Gilead Sciences is a research-based biopharmaceutical company that discovers, develops, and commercializes therapeutics to advance the care of patients suffering from life-threatening diseases. The company’s primary focus includes HIV/AIDS, liver disease and serious cardiovascular and respiratory conditions. GILD has a market leading position with its HIV franchise, and it is expected that its Hepatitis C program will achieve market leadership with its recent launch of its new drug Sovaldi. The drug is expected to grow GILD’s Hepatitis C franchise revenue from $4 billion to $15 billion over the next 7 years.
The final addition we made to the portfolio was Royal Caribbean Cruises (RCL) with a half position weight of 2.5%. The cruise industry continues to be in recovery mode after being hurt by the 2008 financial crisis, the Costa Concordia accident and multiple incidents throughout the industry such as ship fires and food poisoning scares. During these difficult times, RCL has managed to right size their cost structure and identify attentive and unique itineraries to adapt. RCL is increasing its fleet capacity by 13%, aiming to capitalize on the global economic recovery and ticket premiums over the industry as it targets the upper end of the market. While the balance sheet is quite levered, this is typical in industry given its capital intensive nature. RCL is trading at an attractive valuation of 15.8x the forward consensus EPS estimate, and is expected to grow EPS by 33% in 2014 and another 25% in 2015.
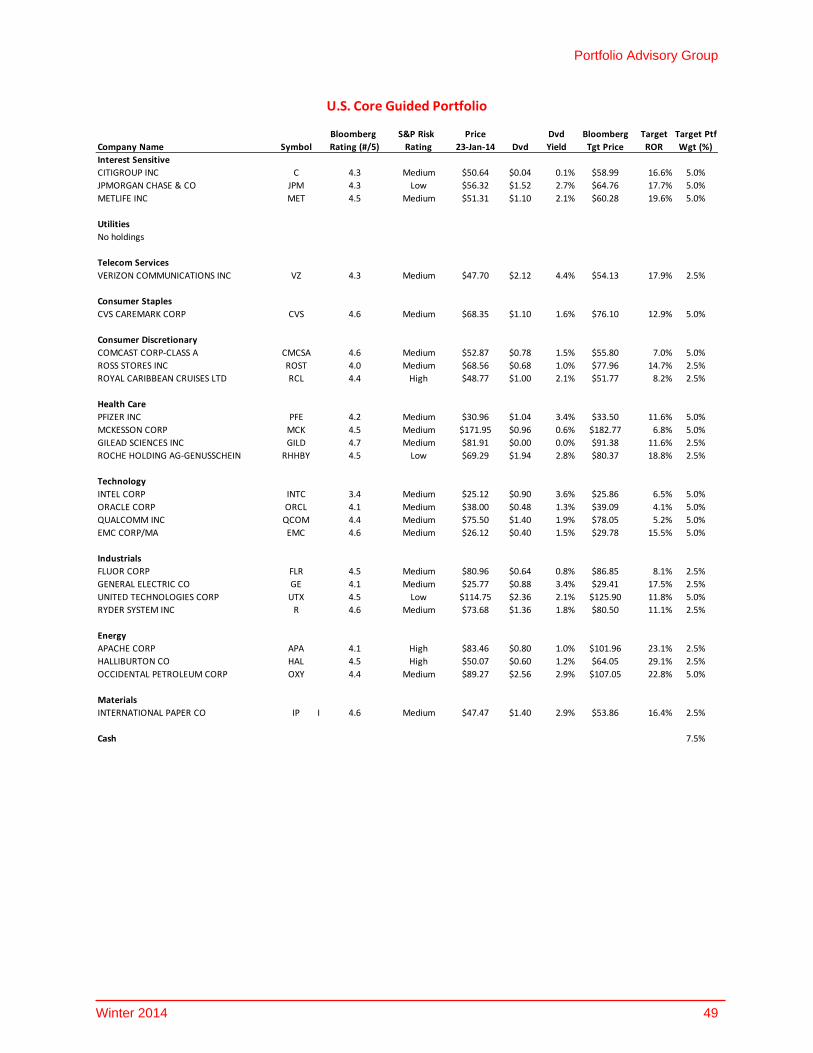
Portfolio Advisory Group
Winter 2014 49
Bloomberg S&P Risk Price Dvd Bloomberg Target Target Ptf
Company Name Symbol S Rating (#/5) Rating 23‐Jan‐14 Dvd Yield Tgt Price ROR Wgt (%)
Interest Sensitive
CITIGROUP INC C C 4.3 Medium $50.64 $0.04 0.1% $58.99 16.6% 5.0%
JPMORGAN CHASE & CO JPM J 4.3 Low $56.32 $1.52 2.7% $64.76 17.7% 5.0%
METLIFE INC MET M 4.5 Medium $51.31 $1.10 2.1% $60.28 19.6% 5.0%
Utilities
No holdings
Telecom Services
VERIZON COMMUNICATIONS INC VZ V 4.3 Medium $47.70 $2.12 4.4% $54.13 17.9% 2.5%
Consumer Staples
CVS CAREMARK CORP CVS C 4.6 Medium $68.35 $1.10 1.6% $76.10 12.9% 5.0%
Consumer Discretionary
COMCAST CORP‐CLASS A CMCSA C 4.6 Medium $52.87 $0.78 1.5% $55.80 7.0% 5.0%
ROSS STORES INC ROST R 4.0 Medium $68.56 $0.68 1.0% $77.96 14.7% 2.5%
ROYAL CARIBBEAN CRUISES LTD RCL R 4.4 High $48.77 $1.00 2.1% $51.77 8.2% 2.5%
Health Care
PFIZER INC PFE P 4.2 Medium $30.96 $1.04 3.4% $33.50 11.6% 5.0%
MCKESSON CORP MCK M 4.5 Medium $171.95 $0.96 0.6% $182.77 6.8% 5.0%
GILEAD SCIENCES INC GILD G 4.7 Medium $81.91 $0.00 0.0% $91.38 11.6% 2.5%
ROCHE HOLDING AG‐GENUSSCHEIN RHHBY R 4.5 Low $69.29 $1.94 2.8% $80.37 18.8% 2.5%
Technology
INTEL CORP INTC I 3.4 Medium $25.12 $0.90 3.6% $25.86 6.5% 5.0%
ORACLE CORP ORCL O 4.1 Medium $38.00 $0.48 1.3% $39.09 4.1% 5.0%
QUALCOMM INC QCOM Q 4.4 Medium $75.50 $1.40 1.9% $78.05 5.2% 5.0%
EMC CORP/MA EMC E 4.6 Medium $26.12 $0.40 1.5% $29.78 15.5% 5.0%
Industrials
FLUOR CORP FLR F 4.5 Medium $80.96 $0.64 0.8% $86.85 8.1% 2.5%
GENERAL ELECTRIC CO GE G 4.1 Medium $25.77 $0.88 3.4% $29.41 17.5% 2.5%
UNITED TECHNOLOGIES CORP UTX U 4.5 Low $114.75 $2.36 2.1% $125.90 11.8% 5.0%
RYDER SYSTEM INC R R 4.6 Medium $73.68 $1.36 1.8% $80.50 11.1% 2.5%
Energy
APACHE CORP APA A 4.1 High $83.46 $0.80 1.0% $101.96 23.1% 2.5%
HALLIBURTON CO HAL H 4.5 High $50.07 $0.60 1.2% $64.05 29.1% 2.5%
OCCIDENTAL PETROLEUM CORP OXY O 4.4 Medium $89.27 $2.56 2.9% $107.05 22.8% 5.0%
Materials
INTERNATIONAL PAPER CO IP I 4.6 Medium $47.47 $1.40 2.9% $53.86 16.4% 2.5%
Cash 7.5%
U.S. Core Guided Portfolio
Investment Portfolio Quarterly
50
ScotiaMcLeod North American Core Guided Portfolio Caroline Escott – Portfolio Manager, Portfolio Advisory Group
Performance Update
The North American Dividend Guided Portfolio generated a strong total return of +10.8% during the quarter, which was equal to the performance of the hybrid benchmark North American index which also generated a total return of 10.8% over the quarter (based in Canadian dollars). Both the S&P/TSX 60 Index and the S&P 500 delivered very strong results in the quarter, the S&/TSX 60 advanced 7.7% on a total return basis while the S&P 500 delivered a solid total return of 10.3%. In Canadian dollar terms, the S&P500 advanced 14.0% as the Canadian dollar weakened relative to the US dollar during the quarter. Throughout 2013 the S&P 500 benefitted from rising risk appetite as the earnings multiple on the S&P 500 expanded by 2.5x in the year.
The primary focus last quarter was Fed tapering, which was initiated in December with the Fed’s announcement of a reduction in bond purchases from $85B to $75B per month. After creating meaningful volatility mid-year as speculation regarding the timing and pace of tapering grew, investors embraced the news of tapering on December 18 with the market rallying through year-end. We expect the Fed will continue to taper at a rate of $10 billion per FOMC meeting (every six weeks) until its quantitative easing program is completely unwound by the end of 2014. However, economic conditions will drive these decisions so any further tapering will be data dependent. At the same time, the Fed has remained committed to a short-term interest rate of close to zero for the year, which should allow the Fed to balance the return to normal long-term bond yields while allowing economic momentum to build.
Going forward, we believe accelerating world GDP growth will drive portfolio returns in 2014, albeit at a much more moderate pace than what we experienced last year. We still believe that with the US economy grinding higher and the European economy looking to have bottomed that this will bode well for the Chinese economy as we move further into 2014. If we are correct we expect that this will have a positive impact on Commodity markets and particularly the Canadian equity markets.
In the U.S., corporate balance sheets are in good shape with record cash and cash flow allowing companies to return capital to shareholders via increased dividends and share buybacks. Profit margins and corporate earnings are at record levels, reflecting extensive cost cutting and improved utilization of assets. We continue to believe that Financials, Technology, Industrials and Healthcare will outperform in this environment.
Given the strength in the US market in the quarter, it’s not surprising that the best performers in the quarter within the North American Portfolio were primarily U.S. companies, while the laggards were generally a mix of Canadian and U.S. companies, although generally more weighted towards Canadian holdings. From a sector perspective, in both the US and Canada the top performing sectors were skewed towards cyclical sectors while the laggards tended to favour the more defensive sectors. Investors continued to reach out the risk curve in the quarter, looking for extra returns.
The Industrials sector performed very well as the sector was the leader in both Canada and the U.S.. Within the portfolio, all of the Industrials positions performed very well, particularly after accounting for the move in the Canadian dollar. General Electric was the best performer in the portfolio with a total C$ return of 22.1% in quarter, followed by Freeport McMoRan in Materials with a C$ total return of 18.8% and Intel delivering 17.9% in C$ within the Technology sector. Elsewhere in Industrials, Fluor delivered a total C$ return of 17.0% and Union Pacific with a total C$ return of 12.2%.
Portfolio Advisory Group
Winter 2014 51
Changes
There were a number of changes in the North American Dividend Portfolio in the fourth quarter; Freeport McMoRan (FCX) replaced Goldcorp (G) and H&R REIT (HR.UN) replaced Brookfield Office Properties (BPO) in early October, Verizon (VZ) replaced AT&T (T) in mid-October, and in mid-December we replaced Canadian National Railway (CNR) with Union Pacific (UNP) and Comcast (CMCSA) with Johnon&Johnson (JNJ).
On October 1st we replaced Goldcorp with Freeport McMoRan as we felt gold prices would remain under pressure and Freeport was a more attractive alternative as it offers investors exposure to a more diversified materials company with approximately 60% of the EBITDA coming from copper, 15% from gold and 25% from oil and gas. The outlook for Goldcorp continues to remain positive relative to its peer group of gold companies. However we continue to maintain a more cautious view of gold given the continued strength in the U.S. dollar, combined with the improving economic growth and stabilization in central bank policies and geopolitical issues. In addition, the onset of Fed tapering and rate hikes will also pressure gold prices. In late 2012 FCX added over $18 billion of debt to its balance sheet with the acquisitions of PXP and MMR, which caused skepticism from investors with the stock underperforming in the first half of the year. We felt that created an attractive opportunity to add FCX to the portfolio as management has clearly stated the shift in focus to reductions and deferrals on capex. There is a greater emphasis on financial strength and flexibility, which should drive additional shareholder returns. In addition, FCX also offers an attractive dividend yield of 3.4%, making it an attractive position for a well-diversified income portfolio.
We also replaced Brookfield Office Properties (BPO) with H&R REIT (HR.UN) after BPO delivered strong results since being added to the portfolio in late 2011. We felt much of the upside in BPO had been realized and saw better value in other companies. H&R was one of the stocks that we felt offered an attractive risk/reward profile given its attractive valuation. The REIT’s core strategy involves long-term leases to creditworthy tenants, matched with long-term financing, which provides stability and clarity into future cash flow.
In mid-October we replaced AT&T with Verizon Communications as we also felt Verizon offered a more attractive risk/reward profile. While the outlook for T remains reasonable, we believe there is better potential with VZ given its stronger financial outlook and better average revenue growth per account which could translate into faster dividend growth at VZ versus T. VZ’s acquisition of Verizon Wireless is expected to be immediately accretive to EPS by approximately 10%. The consensus estimates imply an EPS CAGR of approximately 15% versus the forecast of 7% for T. Despite the strong earnings growth profile for VZ, the consensus estimates imply a dividend CAGR of just 3% and a declining payout ratio (from 87% of adjusted EPS in 2012 ti 58% in 2015), suggesting dividend growth may exceed Street expectations. As such, VZ is also a more attractive candidate for an income oriented portfolio.
We made two final changes in early December, we replaced Canadian National Railway (CNR) with Union Pacific (UNP) and Comcast (CMCSA) with Johnson & Johnson (JNJ).
The shift from Comcast to Johnson & Johnson is a reflection of our moving the portfolio towards the dividend mandate. We continue to have a positive view of CMCSA, however Johnson & Johnson is a better alternative for an income oriented portfolio with a current dividend yield of 2.8% versus 1.5% on Comcast.
Johnson & Johnson is a leader in the pharmaceutical, medical device and consumer products industries. It is a well-diversified healthcare company with approximately 41% of its revenue from Medical Devices and Diagnostics, 38% from Pharmaceutical and 21% from its Consumer division. We believe that JNJ’s diversified business model will enable it to benefit from the changes and evolving healthcare system in the U.S. In addition, management has emphasized that its top three priorities to shareholders are the dividend, judicious M&A, and share repurchases that mitigate equity dilution.

Investment Portfolio Quarterly
52
The switch from Canadian National Railway to Union Pacific is a function of taking advantage of the strength in CNR as the stock had performed very well last year. While the outlook for CNR remains attractive, we believe UNP offers a better risk/reward profile at this time given its more attractive growth outlook combined with a discount valuation. In addition, UNP offers a slightly higher dividend yield, 1.9% versus 1.5% for CNR.
We believe UNP is well positioned to deliver attractive long term growth as volumes are expected to grow and the company benefits from pricing growth with $340 million of legacy contracts renewing in 2015. UNP continues to actively repurchase stock, and recently increased its repurchase program to 60 million shares, expiring December 31, 2017. The share buyback is expected to boost EPS by 2%-3% annually.
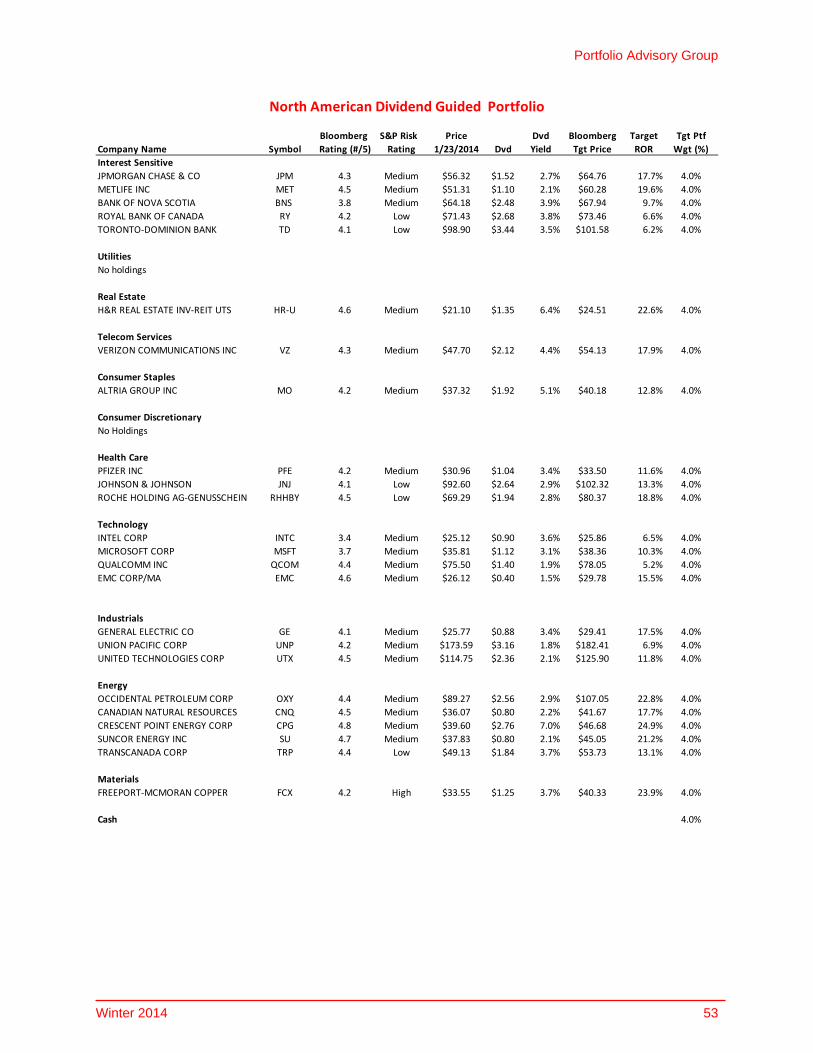
Portfolio Advisory Group
Winter 2014 53
Bloomberg S&P Risk Price Dvd Bloomberg Target Tgt Ptf
Company Name Symbol Rating (#/5) Rating 1/23/2014 Dvd Yield Tgt Price ROR Wgt (%)
Interest Sensitive
JPMORGAN CHASE & CO JPM PM 4.3 Medium $56.32 $1.52 2.7% $64.76 17.7% 4.0%
METLIFE INC MET MET 4.5 Medium $51.31 $1.10 2.1% $60.28 19.6% 4.0%
BANK OF NOVA SCOTIA BNS BNS 3.8 Medium $64.18 $2.48 3.9% $67.94 9.7% 4.0%
ROYAL BANK OF CANADA RY RY 4.2 Low $71.43 $2.68 3.8% $73.46 6.6% 4.0%
TORONTO‐DOMINION BANK TD TD 4.1 Low $98.90 $3.44 3.5% $101.58 6.2% 4.0%
Utilities
No holdings
Real Estate
H&R REAL ESTATE INV‐REIT UTS HR‐UHR‐U 4.6 Medium $21.10 $1.35 6.4% $24.51 22.6% 4.0%
Telecom Services
VERIZON COMMUNICATIONS INC VZ VZ 4.3 Medium $47.70 $2.12 4.4% $54.13 17.9% 4.0%
Consumer Staples
ALTRIA GROUP INC MO MO 4.2 Medium $37.32 $1.92 5.1% $40.18 12.8% 4.0%
Consumer Discretionary
No Holdings
Health Care
PFIZER INC PFE PFE 4.2 Medium $30.96 $1.04 3.4% $33.50 11.6% 4.0%
JOHNSON & JOHNSON JNJ JNJ 4.1 Low $92.60 $2.64 2.9% $102.32 13.3% 4.0%
ROCHE HOLDING AG‐GENUSSCHEIN RHHBYROG 4.5 Low $69.29 $1.94 2.8% $80.37 18.8% 4.0%
Technology
INTEL CORP INTC NTC 3.4 Medium $25.12 $0.90 3.6% $25.86 6.5% 4.0%
MICROSOFT CORP MSFTMSF 3.7 Medium $35.81 $1.12 3.1% $38.36 10.3% 4.0%
QUALCOMM INC QCOM CO 4.4 Medium $75.50 $1.40 1.9% $78.05 5.2% 4.0%
EMC CORP/MA EMC EMC 4.6 Medium $26.12 $0.40 1.5% $29.78 15.5% 4.0%
Industrials
GENERAL ELECTRIC CO GE GE 4.1 Medium $25.77 $0.88 3.4% $29.41 17.5% 4.0%
UNION PACIFIC CORP UNP UNP 4.2 Medium $173.59 $3.16 1.8% $182.41 6.9% 4.0%
UNITED TECHNOLOGIES CORP UTX UTX 4.5 Medium $114.75 $2.36 2.1% $125.90 11.8% 4.0%
Energy
OCCIDENTAL PETROLEUM CORP OXY OXY 4.4 Medium $89.27 $2.56 2.9% $107.05 22.8% 4.0%
CANADIAN NATURAL RESOURCES CNQ CNQ 4.5 Medium $36.07 $0.80 2.2% $41.67 17.7% 4.0%
CRESCENT POINT ENERGY CORP CPG CPG 4.8 Medium $39.60 $2.76 7.0% $46.68 24.9% 4.0%
SUNCOR ENERGY INC SU SU 4.7 Medium $37.83 $0.80 2.1% $45.05 21.2% 4.0%
TRANSCANADA CORP TRP TRP 4.4 Low $49.13 $1.84 3.7% $53.73 13.1% 4.0%
Materials
FREEPORT‐MCMORAN COPPER FCX FCX 4.2 High $33.55 $1.25 3.7% $40.33 23.9% 4.0%
Cash 4.0%
North American Dividend Guided Portfolio
Investment Portfolio Quarterly
54
ScotiaMcLeod Core-Plus Fixed Income Guided Portfolio Tim Vlahopoulos —Director, Portfolio Advisory Group
Andrew Mystic —Director, Portfolio Advisory Group
Investment Objective
The ScotiaMcLeod Core-Plus Fixed Income Guided Portfolio (“Portfolio”) is designed for investors with a moderate to higher investment risk profile and who want to take a more active approach to managing their fixed income assets within a diversified portfolio. The objectives of the portfolio are to provide both a high level of current income, and a reasonable level of return to protect against future inflation. The overall goal of the portfolio is to exceed the performance of the DEX Universe Bond Index (“Index”). Typically, superior returns are not achieved every year; however, the goal is to achieve these rates of return over the long-term. Approximately 75% of the portfolio is invested in a 10-year bond ladder and 5% is invested in inflation-protected securities. These comprise the core holdings of the portfolio. The remaining 20% is allocated between two active value-added trade strategies that attempt to outperform the benchmark.
Market Update
In Q4/13 the long anticipated Federal Reserve tapering decision finally materialized. Since the Federal Reserve’s June meeting, bond markets have reacted with fits of volatility that seemed to calm somewhat after Chairman Bernanke’s December announcement – when the Chairman announced that the Fed would begin to taper its asset purchase program by U$10bln/month(U$5bln in Treasuries/U$5bln in MBS securities). With the US recovery seemingly being undermined by the prospect of rapidly rising rates, the Fed sought to strike a balance between the need to taper and the need for more gradual rate normalization. Although the Fed did begin the tapering process, tapering was accompanied by stronger forward guidance, with the Fed noting that it would be appropriate to maintain the federal funds rate at its current level, “well past the time that the unemployment rate declines below 6-1/2 percent.” With the strengthening of forward guidance, the Fed was able to emphasize that rates would remain anchored for an extended period, which seemingly helped contain the selloff in rates – although the US 10-year did continue to leak out towards 3.03% towards the end of the quarter. The push towards 3.0% represented approximately a 42 basis point rise in the US 10-year yield during the quarter.
On the Canadian side of the border, the Bank of Canada’s October statement saw a notable change in its policy statement as the Bank abandoned its previous tightening bias, assuming a modestly more dovish tone. With downside inflation risks taking on increasing prominence the Bank effectively signaled that rates would remain on hold longer than had been previously anticipated. The Government of Canada 10-year bond yield outperformed the US, with the Canadian 10-year yield rising about 22 basis points in the quarter to touch off 2.76%.
The PC Bond DEX Universe Total Return Index returned -0.43% in the month of December and +0.38% in the quarter. This performance left the index in negative territory for the year, finishing with a return of -1.19% for 2013.
Performance Update
The ScotiaMcLeod Core-Plus Fixed Income Guided Portfolio outperformed the DEX Universe Index for both the fourth quarter and year-to-date. The portfolio continued to escape much of the volatility seen in the fourth quarter because of the decision to maintain a much higher cash reserve during the quarter as compared to the index.
Portfolio Advisory Group
Winter 2014 55
The Core-Plus Portfolio also managed to outperform the Index because of the structure of the portfolio as compared to the Index. The index had approximately 25% allocated in the long end of the yield curve which returned a -0.24% while the portfolio only held about 12% in this area of the curve. DEX short and mid sub-indices fared better in Q4/13 with positive returns of 0.76% and 0.41% respectively. With the Core-Plus having returned 0.68% in the quarter however, the modest outperformance seem in the short DEX (0.76% versus 0.68%) still left the index lagging behind the Core-Plus in the quarter.
In summary, the Core-Plus Portfolio outperformed the benchmark index because of the higher than normal amount of cash held in the portfolio and the overall short term nature of the holdings. These two keys helped limit volatility of the fourth quarter and achieve a 0.68% return in the quarter. The Core-Plus outperformed the index by 0.30% in Q4/12 and 1.74% for the full year 2013 (+0.55% versus -1.19%).
Current Active Strategies
There were two active positions in the Portfolio this quarter. The idle cash was invested into two cashable Guaranteed Investment Certificates before the end of the quarter. These investments represent one of the two active positions.
The other active position was the iShares US High Yield Bond Index Exchange Traded Fund hedged against the Canadian dollar (XHY on the TSX). The ETF returned 3.59% in the quarter modestly outperforming the 3.35% returned by the benchmark. The ETF attempts to replicate, as closely as possible, the performance of the Markit iBoxx USD Liquid High Yield Index but currency exposure is hedged back to the Canadian dollar.
Outlook
Although rates are expected to rise over the coming year, the move higher will likely be less tumultuous than was the case in 2013. Scotia’s January Global Forecast Update suggests that the US 10-year could reach 3.70% by the end of Q1/15 while consensus expectations are currently calling for a more modest 3.44% print over the same period. FOMC forward guidance, and a more dovish Bank of Canada, will likely continue to keep the front end of both respective curves well bid in the near term.
Rates are anticipated to rise in a more steady fashion in 2014 but markets will remain vulnerable to the impact of Fed tapering decisions, which could lead to sporadic bouts of volatility. The impact of Fed tapering should be contained by stronger forward guidance, and potentially even further policy action, should premature tightening further delay a return to normal economic conditions. The seeming continuity of a Janet Yellen led Fed, with the policies of Chairman Bernanke’s however, has seemingly garnered some market credibility in recent weeks. The risk to this view would be that a more hawkish tone seeps its way into the mix as new Fed members are rolled into voting seats in January.
Although it has been recently argued that markets should be pricing in the potential for a Canadian rate cut, the Bank of Canada has demonstrated that it remains concerned about the impact such a move would have on Canadian housing – where consumer borrowing levels are already relatively high. With the Canadian dollar having seen a significant depreciation in recent weeks, potentially helping to push up inflation, it seems that the greater probability will be that the Bank remains on hold for the foreseeable future. Although we think it unlikely that the Bank would cut rates, the market bias will likely continue to add some strength to the front end of the Canadian curve – at least until inflation begins to gain some modest traction. If inflation fails to pick up in the coming months, the front end of the Canadian curve will likely see further strengthening as market participants further anticipate policy action on the part of the Bank of Canada.
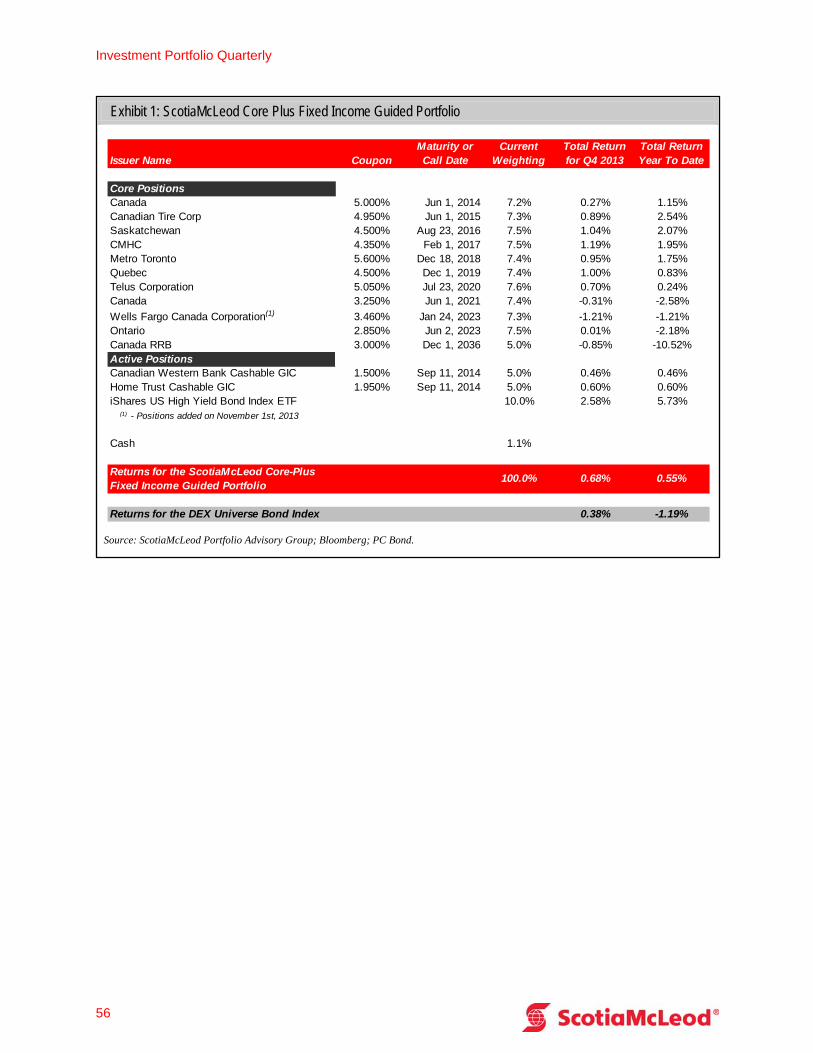
Investment Portfolio Quarterly
56
Exhibit 1: ScotiaMcLeod Core Plus Fixed Income Guided Portfolio
Issuer Name CouponMaturity or Call Date
Current Weighting
Total Return for Q4 2013
Total Return Year To Date
Core PositionsCanada 5.000% Jun 1, 2014 7.2% 0.27% 1.15%Canadian Tire Corp 4.950% Jun 1, 2015 7.3% 0.89% 2.54%Saskatchewan 4.500% Aug 23, 2016 7.5% 1.04% 2.07%CMHC 4.350% Feb 1, 2017 7.5% 1.19% 1.95%Metro Toronto 5.600% Dec 18, 2018 7.4% 0.95% 1.75%Quebec 4.500% Dec 1, 2019 7.4% 1.00% 0.83%Telus Corporation 5.050% Jul 23, 2020 7.6% 0.70% 0.24%Canada 3.250% Jun 1, 2021 7.4% -0.31% -2.58%
Wells Fargo Canada Corporation(1) 3.460% Jan 24, 2023 7.3% -1.21% -1.21%Ontario 2.850% Jun 2, 2023 7.5% 0.01% -2.18%Canada RRB 3.000% Dec 1, 2036 5.0% -0.85% -10.52%Active PositionsCanadian Western Bank Cashable GIC 1.500% Sep 11, 2014 5.0% 0.46% 0.46%Home Trust Cashable GIC 1.950% Sep 11, 2014 5.0% 0.60% 0.60%iShares US High Yield Bond Index ETF 10.0% 2.58% 5.73%
(1) - Positions added on November 1st, 2013
Cash 1.1%
Returns for the ScotiaMcLeod Core-Plus Fixed Income Guided Portfolio
100.0% 0.68% 0.55%
Returns for the DEX Universe Bond Index 0.38% -1.19%
Source: ScotiaMcLeod Portfolio Advisory Group; Bloomberg; PC Bond.

Portfolio Advisory Group
Winter 2014 57
Important Disclosures – As of 01/30/2014 This report has been prepared by members of the ScotiaMcLeod Portfolio Advisory Group. ScotiaMcLeod is the full service retail division of Scotia Capital Inc.
The author(s) of the report own(s) securities of the following companies. None. The supervisors of the Portfolio Advisory Group own securities of the following companies. Bank of Nova Scotia, Scotiabank, Global Banking and Markets is what is referred to as an “integrated” investment firm since we provide a broad range of corporate finance, investment banking, institutional trading and retail client services and products. As a result we recognize that we there are inherent conflicts of interest in our business since we often represent both sides to a transaction, namely the buyer and the seller. While we have policies and procedures in place to manage these conflicts, we also disclose certain conflicts to you so that you are aware of them. The following list provides conflict disclosure of certain relationships that we have, or have had within a specified period of time, with the companies that are discussed in this report. Thomas C. O’Neill is a director of BCE Inc and is a director of the Bank of Nova Scotia. BCE Inc. Ronald Brenneman is a director of BCE Inc and is a director of the Bank of Nova Scotia. BCE Inc. Tanya Jakusconek is a Director of Equity Research for Scotiabank, Global Banking and Markets and is a member of the board of directors for Tahoe Resources Inc. Goldcorp Inc. is a significant shareholder of Tahoe Resources Inc. Goldcorp Inc. Rick Waugh, Chief Executive Officer for The Bank of Nova Scotia, is a member of the the Board of Directors of TransCanada Corporation. TransCanada Corporation Scotia Capital (USA) Inc. or its affiliates has managed or co-managed a public offering in the past 12 months. Agrium Inc., Bank of Nova Scotia, Baytex Energy Corporation, BCE Inc., Brookfield Office Properties, Brookfield Renewable Energy Partners L.P., BROOKFIELD RENEWABLE ENRGY P, Canadian National Railway Company, Canadian Natural Resources Limited, Enbridge Inc., Finning International Inc., Gibson Energy Inc., Goldcorp Inc., H&R REAL EST INVT TR H&R FIN, H&R REIT, Manulife Financial Corporation, Rogers Communications Inc., Royal Bank of Canada, TELUS Corporation, Toronto-Dominion Bank, TransCanada Corporation Scotia Capital (USA) Inc. or its affiliates has received compensation for investment banking services in the past 12 months. Agrium Inc., Bank of Nova Scotia, Baytex Energy Corporation, BCE Inc., Brookfield Office Properties, Brookfield Renewable Energy Partners L.P., Canadian National Railway Company, Canadian Natural Resources Limited, Enbridge Inc., Finning International Inc., Gibson Energy Inc., Goldcorp Inc., H&R REIT, Intact Financial Corporation, Inter Pipeline Fund, Manulife Financial Corporation, Power Corporation of Canada, Rogers Communications Inc., Royal Bank of Canada, Shaw Communications Inc., SIMON PPTY GROUP INC NEW, Suncor Energy Inc., TELUS Corporation, Toronto-Dominion Bank, TransCanada Corporation Scotia Capital (USA) Inc. or its affiliates expects to receive or intends to seek compensation for investment banking services in the next 3 months. Manulife Financial Corporation, TELUS Corporation Scotia Capital (USA) Inc. had an investment banking services client relationship during the past 12 months. Agrium Inc., Bank of Nova Scotia, Canadian National Railway Company, Canadian Natural Resources Limited, Goldcorp Inc., Royal Bank of Canada The issuer paid a portion of the travel-related expenses incurred by the Fundamental Research Analyst/Associate to visit material operations of the following issuer(s): Agrium Inc., Canadian Natural Resources Limited, Gibson Energy Inc., Goldcorp Inc. Scotia Capital Inc. and its affiliates collectively beneficially own in excess of 1% of one or more classes of the issued and outstanding equity securities of the following issuer(s): BCE Inc., Brookfield Office Properties, Canadian National Railway Company, Enbridge Inc., Finning International Inc., Intact Financial Corporation, Inter Pipeline Fund, Manulife Financial Corporation, Power Corporation of Canada, Rogers Communications Inc., Royal Bank of Canada, Shaw Communications Inc., Toronto-Dominion Bank, TransCanada Corporation The Bank of Nova Scotia is the parent company and a related issuer of Scotia Capital Inc. and ultimate parent company and related issuer of Scotia Capital (USA) Inc. Bank of Nova Scotia The Fundamental Research Analyst/Associate has visited material operations of the following issuer(s): Agrium Inc., BCE Inc., Brookfield Office Properties, Canadian National Railway Company, Canadian Natural Resources Limited, Enbridge Inc., Gibson Energy Inc., Goldcorp Inc., H&R REIT, Inter Pipeline Fund, Manulife Financial Corporation, Rogers Communications Inc., Shaw Communications Inc., TELUS Corporation

Investment Portfolio Quarterly
58
Within the last 12 months, Scotia Capital Inc. and/or its affiliates have undertaken an underwriting liability with respect to equity or debt securities of, or have provided advice for a fee with respect to, the following issuer(s): Agrium Inc., Bank of Nova Scotia, Baytex Energy Corporation, BCE Inc., Brookfield Office Properties, Brookfield Renewable Energy Partners L.P., BROOKFIELD RENEWABLE ENRGY P, Canadian National Railway Company, Canadian Natural Resources Limited, Enbridge Inc., Finning International Inc., Gibson Energy Inc., Goldcorp Inc., H&R REAL EST INVT TR H&R FIN, H&R REIT, Manulife Financial Corporation, Rogers Communications Inc., Royal Bank of Canada, TELUS Corporation, Toronto-Dominion Bank, TransCanada Corporation Scotia Capital Inc was retained by Telus Corporation to provide a fairness opinion with respect to a proposed share conversion. TELUS Corporation This issuer owns 5% or more of the total issued share capital of The Bank of Nova Scotia. Royal Bank of Canada, Toronto-Dominion Bank Scotia Capital Inc. participated in a bought deal with Intact Financial Corporation. The proceeds from the bought deal were related to a proposed acquisition by Intact Financial Corporation of JEVCO Insurance Company, which is related to The Westaim Corporation. Intact Financial Corporation
Definition of Scotiabank GBM Equity Research Ratings & Risk Rankings
We have a three-tiered system, with ratings of 1-Sector Outperform, 2-Sector Perform, and 3-Sector Underperform. Each analyst assigns a rating that is relative to his or her coverage universe or an index identified by the analyst that includes, but is not limited to, stocks covered by the analyst.
Our risk ranking system provides transparency as to the underlying financial and operational risk of each stock covered. Historical financial results, share price volatility, liquidity of the shares, credit ratings, and analyst forecasts are evaluated in this process. The final ranking also incorporates judgmental, as well as statistical, criteria. Consistency and predictability of earnings, EPS growth, dividends, cash flow from operations, and strength of balance sheet are key factors considered. Scotiabank GBM has a committee responsible for assigning risk rankings for each stock covered.
The rating assigned to each security covered in this report is based on the Scotiabank GBM research analyst’s 12-month view on the security. Analysts may sometimes express to traders, salespeople and certain clients their shorter-term views on these securities that differ from their 12-month view due to several factors, including but not limited to the inherent volatility of the marketplace.
Portfolio Advisory Group
Winter 2014 59
Ratings
Focus Stock (FS) The stock represents an analyst’s best idea(s); stocks in this category are expected to significantly outperform the average 12-month total return of the analyst’s coverage universe or an index identified by the analyst that includes, but is not limited to, stocks covered by the analyst. Sector Outperform (SO) The stock is expected to outperform the average 12-month total return of the analyst’s coverage universe or an index identified by the analyst that includes, but is not limited to, stocks covered by the analyst.
Sector Perform (SP) The stock is expected to perform approximately in line with the average 12-month total return of the analyst’s coverage universe or an index identified by the analyst that includes, but is not limited to, stocks covered by the analyst.
Sector Underperform (SU) The stock is expected to underperform the average 12-month total return of the analyst’s coverage universe or an index identified by the analyst that includes, but is not limited to, stocks covered by the analyst.
Other Ratings Tender – Investors are guided to tender to the terms of the takeover offer. Under Review – The rating has been temporarily placed under review, until sufficient information has been received and assessed by the analyst.
Risk Rankings
Low Low financial and operational risk, high predictability of financial results, low stock volatility.
Medium Moderate financial and operational risk, moderate predictability of financial results, moderate stock volatility.
High High financial and/or operational risk, low predictability of financial results, high stock volatility.
Speculative Exceptionally high financial and/or operational risk, exceptionally low predictability of financial results, exceptionally high stock volatility. For risk-tolerant investors only.
General Disclosures
The ScotiaMcLeod Portfolio Advisory Group prepares this report by aggregating information obtained from various sources as a resource for ScotiaMcLeod Wealth Advisors and their clients. Information may be obtained from the Equity Research and Fixed Income Research departments of the Global Banking and Markets division of Scotiabank. Information may be also obtained from the Foreign Exchange Research and Scotia Economics departments within Scotiabank. In addition to information obtained from members of the Scotiabank group, information may be obtained from the following third party sources: Standard & Poor’s, Valueline, Morningstar CPMS, Bank Credit Analyst and Bloomberg. The information and opinions contained in this report have been compiled or arrived at from sources believed reliable but no representation or warranty, express or implied, is made as to their accuracy or completeness.
While the information provided is believed to be accurate and reliable, neither Scotia Capital Inc., which includes the ScotiaMcLeod Portfolio Advisory Group, nor any of its affiliates makes any representations or warranties, express or implied, as to the accuracy or completeness of such information. Neither Scotia Capital Inc. nor its affiliates accepts any liability whatsoever for any direct or consequential loss arising from any use of this report or its contents.
This report is provided to you for informational purposes only. This report is not intended to provide personal investment advice and it does not take into account the specific investment objectives, financial situation or particular needs of any specific person. Investors should seek advice regarding the appropriateness of investing in financial instruments and implementing investment strategies discussed or recommended in this report and should understand that statements regarding future prospects may not be realized.
Nothing contained in this report is or should be relied upon as a promise or representation as to the future. The pro forma and estimated financial information contained in this report, if any, is based on certain assumptions and management’s analysis of information available at the time that this information was prepared, which assumptions and analysis may or may not be correct. There is no representation, warranty or other assurance that any projections contained in this report will be realized.
Opinions, estimates and projections contained in this report are our own as of the date hereof and are subject to change without notice.
Copyright [2012] Scotia Capital Inc. All rights reserved.

Investment Portfolio Quarterly
60
Additional Disclosures
The content may have been based at least in part, on material provided by Standard & Poor's (S&P), our correspondent research service. S&P has given ScotiaMcLeod general permission to use its research reports as source materials, but has not reviewed or approved this report, nor has it been informed of its publication. S&P’s Stock Appreciation Ranking System is used by S&P analysts to rate stocks within their coverage universe assigning one to five STARS – five STARS – five STARS indicating a “buy” and one STAR a “sell”. S&P’s analysts also provide earnings estimates for these covered issues.
S&P’s Stock Appreciation Ranking System is a rank of the potential for future performance over a six to 12-month period. The STARS selection process relies on a disciplined investment approach that combines fundamental and technical analysis, sector weightings, reasonable turnover, performance-based bonus system, and a “top-down” overlay with influence from the S&P's Investment Policy Committee. The overarching investment methodology is “growth at a reasonable price”. Unlike equity valuations from other financial firms, STARS is a forecast of a company's future capital appreciation potential versus the expected performance of the S&P 500 before dividends. ScotiaMcLeod is committed to offering its valued clients a disciplined approach to investing. A hallmark of this approach is access to comprehensive research reports, including fundamental, technical, and quantitative analysis that investors can use to assist them in bringing informed judgment to their own financial situation and investment decisions. In addition to the reports prepared by ScotiaMcLeod through its Portfolio Advisory Group, we also offer our clients access on request to insights in the form of research from other leading firms such as Standard and Poor’s, which offers independent research of relevance to our investment process. Further to your request, please find attached a research report of Standard and Poor’s (or one of its research affiliates), a member of the National Association of Securities Dealers (or similar securities regulatory authority). As Standard & Poor’s is not subject to Canadian regulation, this research report does not conform to Canadian disclosure requirements. ScotiaMcLeod is a division of Scotia Capital Inc. Scotia Capital Inc. is a member of the Canadian Investor Protection Fund and the Investment Industry Regulatory Organization of Canada. Neither Scotia Capital Inc. nor its affiliates accepts any liability whatsoever for any loss arising from any use of this document or its contents, including for any errors or omissions in the data or information included in the document or the context from which it is drawn. ® Registered trademark used under authorization and control of The Bank of Nova Scotia. ScotiaMcLeod is a division of Scotia Capital Inc., Member CIPF.

Portfolio Advisory Group
Winter 2014 61
ABBOTSFORD (604) 864-3750
BARRIE (705) 725-0300
BELLEVILLE (613) 968-6459
BRAMPTON (905) 796-2424
BRANDON (204) 729-3362
BRIDGEWATER (902) 543-8293
CALGARY (403) 298-4000
CAMBRIDGE (519) 740-4300
CHARLOTTETOWN (902) 566-3225
COMOX (250) 890-3570
CORNER BROOK (709) 637-4747
EDMONTON (780) 497-3200
FREDERICTON (506) 450-6465
GRAND PRAIRIE (780) 513-3505
GUELPH (519) 763-0371
HALIFAX (902) 420-2220
HAMILTON (905) 570-7960
KANATA (613) 271-6600
KELOWNA (250) 868-5500
KENTVILLE (902) 678-0777
KINGSTON (613) 531-6300
KITCHENER (519) 571-3700
LAVAL (450) 680-3100
LETHBRIDGE (403) 317-4835
LONDON (519) 660-3214
MARKHAM (905) 947-0933
MEDICINE HAT (403) 529-6565
MISSISSAUGA (905) 848-1300
MONCTON (506) 867-0700
MONTRÉAL (514) 287-3600
MONTRÉAL Capital Branch (514) 287-2900
NEW GLASGOW (902) 755-8508
NEW GLASGOW (Aberdeen) (902) 755-7600
NEW LISKEARD (705) 647-2044
OAKVILLE – Church St. (905) 377-6301
OAKVILLE – North Service Rd. (905) 842-9000
OTTAWA (613) 563-0991
OWEN SOUND (519) 371-6496
PETERBOROUGH (705) 876-1373
POINTE CLAIRE (514) 428-8400
PRINCE GEORGE (250) 614-2080
QUEBEC – Montreal Immigrant Investor Program (514) 287-4504
QUEBEC (418) 686-8666
REGINA (306) 352-5005
RICHMOND (604) 713-7888
SAINT JOHN (506) 634-8021
SALMON ARM (250) 804-2125
SASKATOON (306) 665-5300
SCARBOROUGH (416) 296-0043
SIDNEY (250) 656-9393
SOUTH GRANVILLE (604) 731-7744
ST. CATHARINES (905) 641-7700 ST. JOHN’S (709) 576-1305
SUDBURY (705) 674-8558
THUNDER BAY (807) 626-5180
TORONTO – Scotia Plaza 49th Floor (416) 862-3110
TORONTO – Scotia Plaza Head Office Branch 15th Floor (416) 863-7272
TORONTO – Scotia Plaza 48th Floor (416) 945-4048
TORONTO – Eglinton (Uptown) (416) 945-4840
TORONTO Personal Inv. Management Group (416) 865-6400
TORONTO – North Toronto (416) 226-9505
TORONTO – Rosedale
(416) 335-6340
TRURO- (902) 896-7741
VANCOUVER (604) 661-7400
VANCOUVER – North (604) 981-7600
VANCOUVER – West (604) 913-7000
VANKLEEK HILL (613) 678-3475
VERNON (250) 549-3411
VICTORIA (250) 389-2110
WHITBY (905) 444-4500
WHITE ROCK (604) 531-3500
WINDSOR (519) 258-1050
WINNIPEG (204) 944-0025
YARMOUTH (902) 742-0040
ScotiaMcLeod ScotiaMcLeod

Building Relationships for Life
® Registered trademark of The Bank of Nova Scotia, used by ScotiaMcLeod. ScotiaMcLeod is a division of Scotia Capital Inc. (“SCI”). SCI is a member of the Investment Industry Regulatory Organization of Canada and the Canadian Investor Protection Fund.
37 10309 01/14


