
INVESTING FOR SUSTAINABLE GLOBAL FISHERIES
With support from:
Bloomberg Philanthropies’ Vibrant Oceans Initiative
The Rockefeller Foundation

Executive Summary
Introduction
Small-Scale Fisheries Investment Blueprints
The Mariscos Strategy
The Mangue Strategy
The Isda Strategy
Industrial-Scale Fisheries Investment Blueprints
The Merluza Strategy
The Sapo Strategy
National-Scale Fisheries Investment Blueprint
The Nexus Blue Strategy

ENCOURAGE CAPITAL PUBLICATION DISCLAIMER
This publication has been prepared solely for informational purposes, and has
been prepared in good faith on the basis of information available at the date of
publication without any independent verification. The information in this publication
is based on historical or current political or economic conditions, which may be
superseded by later events. Encourage Capital, LLC (Encourage Capital) does not
guarantee or warrant the accuracy, reliability, adequacy, completeness or currency
of the information in this publication nor its usefulness in achieving any purpose.
Charts and graphs provided herein are for illustrative purposes only. Nothing
contained herein constitutes investment, legal, tax, or other advice nor is it to
be relied on in making an investment or other decision. Readers are responsible
for assessing the relevance and accuracy of the content of this publication. This
publication should not be viewed as a current or past recommendation or a
solicitation of an offer to buy or sell securities or to adopt any investment strategy.
The information in this publication may contain projections or other forward-looking
statements regarding future events, targets, forecasts or expectations described
herein, and is only current as of the date indicated. There is no assurance that such
events, targets, forecasts or expectations will be achieved, and any such events,
targets, forecasts or expectations may be significantly different from that shown
herein. Past performance is not indicative of future results. Encourage Capital will
not be liable for any loss, damage, cost or expense incurred or arising by reason of
any person using or relying on information in this publication.

TABLE OF CONTENTS
The Mariscos Strategy 1
The Mariscos Strategy 2
Key Value Drivers 4
Profile of the Mariscos Strategy Fisheries 5
Chilean Small-Scale Fisheries 5
The Mariscos Strategy Portfolio 6
Current Regulatory Framework 8
Condition of Nearshore Species 9
Socio-Economic Context 10
The Current Supply Chain 10
The Mariscos Impact Strategy 12
Impact Investment Thesis 12
Step 1: Fisheries Management Improvements 13
The Fisheries Management Plan 14
Sustainable Fishing Rewards Program 15
Management and Implementation 17
Fisheries Management Improvements Budget 18
Targeted Social and Environmental Impacts 20
The Mariscos Commercial Investment Thesis 21
Step 2: The Expansion of Gustomar 21
Value Proposition 21
Company Description and Mission Alignment 22
Growth Strategy 23
Historical Performance 27
Market Trends 29
Competition 30
The Mariscos Strategy Financial Assumptions and Drivers 31
Revenue Model and Pricing 31
Cost Structure 32
The Mariscos Strategy Transaction Structure 34
Sources and Uses of Funds 34
Ownership Structure and Governance 34
Summary of Returns 35
Sensitivity Analysis 36
Key Mariscos Strategy Risks and Mitigants 38
Appendix 41

FIGURES
FIGURE 1: Target Species of The Mariscos Strategy 6
FIGURE 2: Location and Principal Species of the Caletas 7
FIGURE 3: Total Number of Fishers and Vessels from Prototype Caletas 8
FIGURE 4: Fisheries Governance Index 8
FIGURE 5: Nationwide Chilean Landings and Stock Status of Featured Species 9
FIGURE 6: Annual Fisher Income by Caleta Relative to Chilean Poverty Line and Extreme Poverty Line 10
FIGURE 7: Margin Increases at Each Turn in the Supply Chain 11
FIGURE 8: The Mariscos Strategy’s Investments 12
FIGURE 9: Profit Share Program Expansion (FCT and Premium) 16
FIGURE 10: Fisheries Management Improvements Annual Budget 18
FIGURE 11: Fishery Improvement Costs as a Share of Seafood Revenue 19
FIGURE 12: Final Presentation of Gustomar’s Products 22
FIGURE 13: Gustomar Sourcing Network Strategy Showing Locations of Seven
Portfolio Caletas, Key Species, and Target Markets for Finished Goods 23
FIGURE 14: Sourcing Plan with Relative Contribution of Each Species to Total Volume 24
FIGURE 15: Volume and Production Share from the Caletas over the 5-Year Plan 24
FIGURE 16: Sales by Customer Segment Year 5 25
FIGURE 17: Sales Growth by Country as a Result of International Expansion Plan 27
FIGURE 18: GustoMar Historical Market Share 27
FIGURE 19: Sales by Market Segment in Kilos and Dollars of Revenue 28
FIGURE 20: Growth (Both Historical and Projected) of Key Prepared-Foods
Product Families in the Chilean Market 30
FIGURE 21: GustoMar Revenue Projections Through International Expansion Plan 31
FIGURE 22: GustoMar Revenue Projections in Key Segments 31
FIGURE 23: Breakdown of COGS by Expense Category 32
FIGURE 24: Breakdown of SG&A by Expense Category 33
FIGURE 25: GustoMar Cost Structure (5-Year Average) 33
FIGURE 26: Capital Providers 35
FIGURE 27: Base Case Impact and Financial Returns 35
FIGURE 28: Growth in Projected Revenue and Net Income 36
Imp
act
Inve
stin
g f
or
Su
sta
ina
ble
Glo
ba
l F
ish
eri
es
A
VIB
RA
NT
OC
EA
NS
IN
ITIA
TIV
E
1
While Project Mariscos is based on analysis of actual fishing communities, fishing conditions, and commercial business operations to
incorporate realistic assumptions of costs, returns, and risks affecting the potential outcomes of the project, Encourage Capital has
synthesized its findings into a general case study that we hope can be used as a roadmap for fishery stakeholders interested in impact
investing opportunities more broadly in the sustainable fisheries space. As such, most of the company and programmatic references herein
use pseudonyms in place of the actual names of the organizations on which the analysis was based. Where used, such pseudonyms will be
used consistently throughout the remainder of this text.
THE MARISCOS STRATEGY: A SMALL-SCALE FISHERIES INVESTMENT IN CHILE
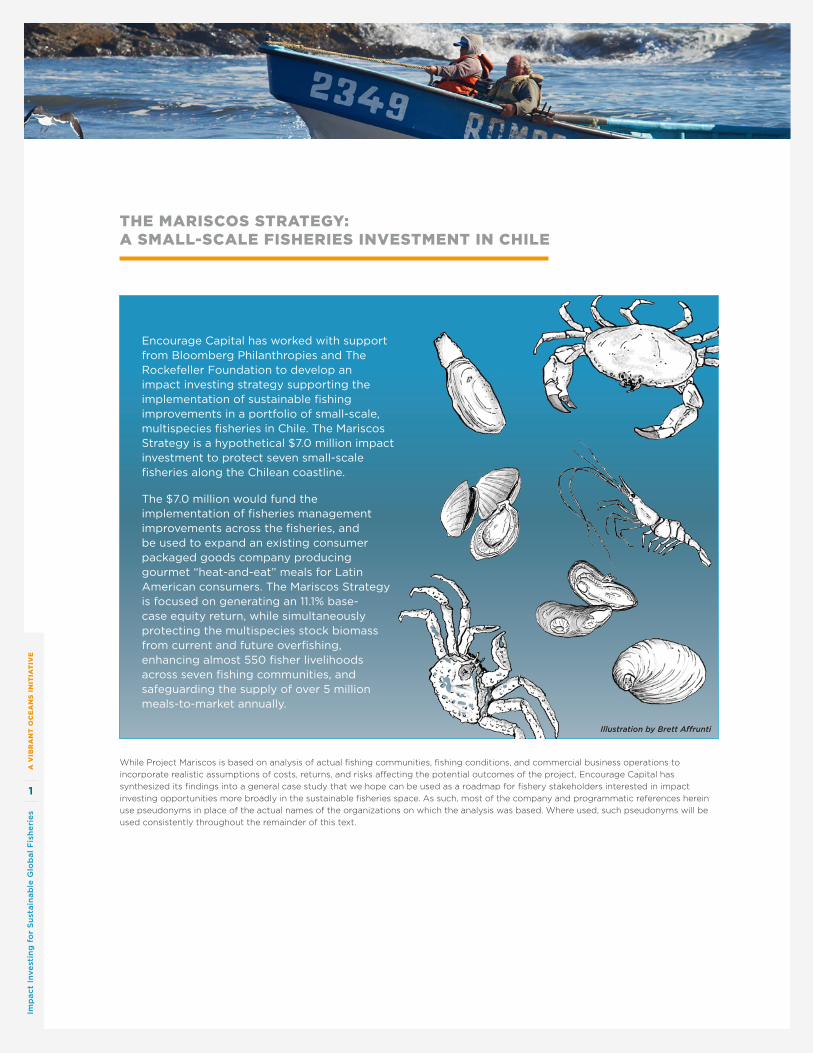
Encourage Capital has worked with support from Bloomberg Philanthropies and The Rockefeller Foundation to develop an impact investing strategy supporting the implementation of sustainable fishing improvements in a portfolio of small-scale, multispecies fisheries in Chile. The Mariscos Strategy is a hypothetical $7.0 million impact investment to protect seven small-scale fisheries along the Chilean coastline.
The $7.0 million would fund the implementation of fisheries management improvements across the fisheries, and be used to expand an existing consumer packaged goods company producing gourmet “heat-and-eat” meals for Latin American consumers. The Mariscos Strategy is focused on generating an 11.1% base-case equity return, while simultaneously protecting the multispecies stock biomass from current and future overfishing, enhancing almost 550 fisher livelihoods across seven fishing communities, and safeguarding the supply of over 5 million meals-to-market annually.
Illustration by Brett Affrunti

Imp
act
Inve
stin
g f
or
Su
sta
ina
ble
Glo
ba
l F
ish
eri
es
A
VIB
RA
NT
OC
EA
NS
IN
ITIA
TIV
E
2
Chile’s 6,435 km coastline constitutes one of the
most biodiverse and productive nearshore marine
environments in the world, accounting for 4% of
the world’s marine wild-capture fisheries landings.9
Despite Chile’s passing of one of the world’s most
progressive fisheries management laws in February
2013, many of the nation’s stocks remain inadequately
managed. The species group proposed for sourcing
in The Mariscos Strategy incorporate a mix of stocks,
including razor clams, mussels, scallops, king crab,
stone crab, nylon shrimp, and abalone, each the
predominant species in one of the seven caletas
(or coves) incorporated into Mariscos’s portfolio of
small-scale fishing communities. Altogether, nearly
550 fishers with some 200 vessels harvest the
aforementioned species, producing roughly 2,900
metric tons (mt) of seafood landings each year, with
an aggregated estimated value of $13.5 million in 2014.
The species vary in terms of their stock status
and management systems, with four of the seven
species lacking any stock assessment data, and
three of the seven communities lacking access
constraints to limit fishing effort. Only one of the
seven species has a designated Management
Committee, as required by law. As such, no
science-based catch limits are in place for any
of the species. Lacking critical elements of a
robust management framework, the fisheries
are vulnerable to overfishing. Indeed, all of The
Mariscos Strategy portfolio species that are
assessed, including the shrimp, king crab, and
abalone, are currently fully exploited, while
independent studies of the unassessed stocks,
including the razor clams, scallops, stone crab, and
mussels, suggest a general decline in catch per
unit of fishing effort (CPUE), which itself is a clear
sign of declining biomass volumes.10
The small-scale fishers who depend on the
resource lack the infrastructure, access to capital,
and commercial know-how required to effectively
commercialize and grow their businesses to a viable
scale. The fishers in all but a few of the over 400
caletas in Chile sell their products at the beachside,
with no value addition, into a fragmented chain of
intermediaries who take their product to market.
These intermediaries often also lack access to cold-
chain infrastructure, and have low standards regarding
product handling, hygiene, and legality. The result is an
often dramatic loss of product to spoilage, destroying
value for both fisher and buyer, requiring increased
production to compensate for the lost portion. Since
buyers are limited, fishers have few options, so they
must compete against one another on price. This, in
turn, locks them into a weak market position and a
low-margin, volume-driven production model.
The Mariscos Strategy therefore proposes to
implement robust fisheries management systems
before overfishing and habitat destruction cause
more severe stock depletion to occur. The strategy
proposes the investment of $7.0 million in equity
and grant funds into a combination of fisheries
management improvements implemented across
seven small-scale fisheries in Chile, as well as into
a mission-aligned seafood company to improve
the route-to-market for these products. In order
to profile such a company, for the purposes of this
Investment Blueprint, Mariscos therefore proposes
to invest into the expansion of “GustoMar”11 (or
the “The Company”), a hypothetical consumer
packaged goods company with a proven track
record that produces “heat-and-eat” packaged
meals for sale into Chilean grocery and institutional
food-service channels.12 Mariscos’s innovative
approach would incorporate the implementation
9 Food and Agriculture Organization of the United Nations, “The State of World Fisheries and Aquaculture,”, Rome 2014, ex/China.
10 Costello, et al.,. “Status and Solutions for the World’s Unassessed Fisheries,”, Science 338, 2013.
11 “GustoMar” is a generic pseudonym used to ensure confidentiality.
12 Consider all references to GustoMar throughout the remainder of this presentation as indicative of the type of business operations and historical performance that Mariscos would expect to find in a company of this size and focus.
The Mariscos Strategy proposes to implement robust fisheries management
systems before overfishing and habitat destruction cause more severe stock
depletion to occur.
THE MARISCOS STRATEGY

Imp
act
Inve
stin
g f
or
Su
sta
ina
ble
Glo
ba
l F
ish
eri
es
A
VIB
RA
NT
OC
EA
NS
IN
ITIA
TIV
E
3
of robust data collection technologies and systems,
plus the use of financial incentives that reward
sustainable fishing practices over time. The bundling
of the fisheries management improvements with
a company that mirrors the GustoMar investment
profile would allow Mariscos to capture higher value
for the products, generate financial returns, and
reward fishers for maintaining sustainable fishing
practices on an ongoing basis.
The Mariscos Strategy would aim to preserve
current stock levels, with the potential for modest
biomass increases in caletas facing localized
depletion. The value created through the strategy’s
spoilage reduction and efficiency gains would
be shared with fishers in the form of a 25%
price premium to market ex-vessel raw material
prices for participating supplier partners, with an
expected aggregate increase of fisher revenues
of approximately $1.8 million over the five-year
investment horizon.13 In addition, Mariscos offers
greater resiliency to each participant caleta through
a pre-capitalized Fishing Community Trust that could
be drawn down to provide insurance in the case of
business interruption due to bad weather or natural
disasters. This fund would be recapitalized using
the proceeds generated by the sale of a 20% equity
share in the GustoMar business. Mariscos will also
aim to reduce waste in the supply chain by 13.5%,
and as a result, increase the number of meals to
market by over 150,000 with no increase in landings.
Mariscos has the potential to generate attractive
financial returns, targeting an 11.1% levered IRR over
a five-year horizon. Overall, Mariscos could provide
a novel, replicable model for sustainable seafood
delivery from small-scale fishers, while showing that
sustainable management and responsible sourcing
can be not only profitable but also a source of
competitive advantage.
13 In constant 2015 dollars
14 A biomass increase is not built into the financial model.
15 In constant 2015 dollars
IMPACT AND FINANCIAL RETURNS
• Safeguards seven species stock levels with the potential to increase biomass by 10%, depending on fishery conditions14
• Increases aggregate fisher revenues by $1.8 million over five-year period15, and improves community resiliency through the allocation of a 20% equity share in GustoMar to participating communities
• Empowers fishers and fishing communities by strengthening fisher organizations and creating more direct market linkages
• Increases meals-to-market through 13.5% reduction in spoilage, delivering an additional 150,000 seafood meals to consumers annually
• Targets an 11.1% levered IRR over a five-year period
Imp
act
Inve
stin
g f
or
Su
sta
ina
ble
Glo
ba
l F
ish
eri
es
A
VIB
RA
NT
OC
EA
NS
IN
ITIA
TIV
E
4
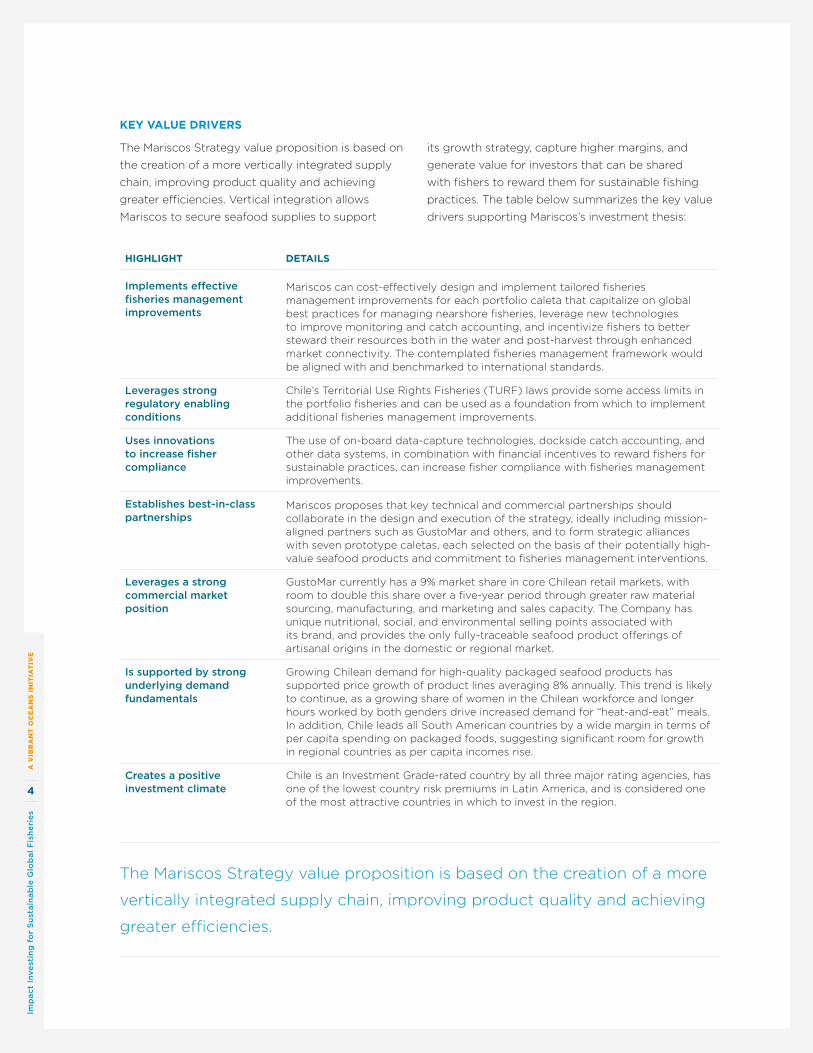
The Mariscos Strategy value proposition is based on
the creation of a more vertically integrated supply
chain, improving product quality and achieving
greater efficiencies. Vertical integration allows
Mariscos to secure seafood supplies to support
its growth strategy, capture higher margins, and
generate value for investors that can be shared
with fishers to reward them for sustainable fishing
practices. The table below summarizes the key value
drivers supporting Mariscos’s investment thesis:
HIGHLIGHT DETAILS
Implements effective fisheries management improvements
Mariscos can cost-effectively design and implement tailored fisheries management improvements for each portfolio caleta that capitalize on global best practices for managing nearshore fisheries, leverage new technologies to improve monitoring and catch accounting, and incentivize fishers to better steward their resources both in the water and post-harvest through enhanced market connectivity. The contemplated fisheries management framework would be aligned with and benchmarked to international standards.
Leverages strong regulatory enabling conditions
Chile’s Territorial Use Rights Fisheries (TURF) laws provide some access limits in the portfolio fisheries and can be used as a foundation from which to implement additional fisheries management improvements.
Uses innovations to increase fisher compliance
The use of on-board data-capture technologies, dockside catch accounting, and other data systems, in combination with financial incentives to reward fishers for sustainable practices, can increase fisher compliance with fisheries management improvements.
Establishes best-in-class partnerships
Mariscos proposes that key technical and commercial partnerships should collaborate in the design and execution of the strategy, ideally including mission-aligned partners such as GustoMar and others, and to form strategic alliances with seven prototype caletas, each selected on the basis of their potentially high-value seafood products and commitment to fisheries management interventions.
Leverages a strong commercial market position
GustoMar currently has a 9% market share in core Chilean retail markets, with room to double this share over a five-year period through greater raw material sourcing, manufacturing, and marketing and sales capacity. The Company has unique nutritional, social, and environmental selling points associated with its brand, and provides the only fully-traceable seafood product offerings of artisanal origins in the domestic or regional market.
Is supported by strong underlying demand fundamentals
Growing Chilean demand for high-quality packaged seafood products has supported price growth of product lines averaging 8% annually. This trend is likely to continue, as a growing share of women in the Chilean workforce and longer hours worked by both genders drive increased demand for “heat-and-eat” meals. In addition, Chile leads all South American countries by a wide margin in terms of per capita spending on packaged foods, suggesting significant room for growth in regional countries as per capita incomes rise.
Creates a positive investment climate
Chile is an Investment Grade-rated country by all three major rating agencies, has one of the lowest country risk premiums in Latin America, and is considered one of the most attractive countries in which to invest in the region.
The Mariscos Strategy value proposition is based on the creation of a more
vertically integrated supply chain, improving product quality and achieving
greater efficiencies.
KEY VALUE DRIVERS

Imp
act
Inve
stin
g f
or
Su
sta
ina
ble
Glo
ba
l F
ish
eri
es
A
VIB
RA
NT
OC
EA
NS
IN
ITIA
TIV
E
5
PROFILE OF THE MARISCOS STRATEGY FISHERIES
The Mariscos Strategy seeks to incorporate seven multispecies fisheries and fishing communities into a
regional, sustainable seafood sourcing operation for the manufacture and delivery of packaged seafood
products to domestic and international retailers and institutional food service operators. The species are
believed to be under moderate fishing pressure, which make the fisheries vulnerable to overfishing as
consumer demand continues to grow. Broadly speaking, Chile has a strong fisheries management regime,
but does not actively manage all its nearshore benthic fisheries. Although fishers and vessels are typically
registered, illegal fishing occurs with regularity, and only one species of seven in the Mariscos portfolio
undergoes a stock assessment, with no maximum catch levels established.
The Mariscos Strategy seeks to more effectively limit illegal fishing activity within its portfolio communities
by implementing fisheries management improvements that utilize the existing TURF agreements, a form of
locally managed access limitations, and data collection technologies that aid in assessing stock health and
fisher compliance with regulations.
CHILEAN SMALL-SCALE FISHERIES
Chile’s 6,435 km coastline constitutes one of the most biodiverse and productive nearshore marine
environments in the world, accounting for 4% of the world’s fisheries catch.16, 17 This productivity can be
attributed in large part to the physical heterogeneity of the coastline, with at least five unique ecoregions,
as well as unique oceanographic conditions including upwelling, nutrient inputs, freshwater influx,
temperature regime, and bathymetry complexity.18
Greater than 50% of Chile’s total landings, or nearly 5 million mt, are attributable to the small-scale, or
artisanal” sector, defined by authorities as fishers operating vessels less than 18 meters in length, fishing within
5 nautical miles of the coastline, and operating independently from larger corporate fishing operations.19
This vibrant sector is generally organized around “caletas,” the Spanish word for “cove,” which are typically
intergenerational landing sites used by one or more fishing communities. Caletas function much in the same
way as cooperatives in other countries, such as Mexico, in which an individual fisher pays an annual fee
and agrees to follow certain bylaws in order to enjoy the benefits of being part of the larger organization,
including an allocation of quota that gives fishers the right to access the fishery, access to social services,
and enhanced political leverage and market power.
16 Food and Agriculture Organization of the United Nations, “The State of World Fisheries and Aquaculture”, Rome, 2014.
17 This figure excludes China.
18 Advanced Conservation Strategies, “A Coastal Marine Assessment of Chile,” report prepared for the David and Lucile Packard Foundation, 2011.
19 Food and Agriculture Organization of the United Nations, “The State of World Fisheries and Aquaculture,”, Rome, 2014.
The Mariscos Strategy seeks to more effectively limit illegal fishing activity
within its portfolio communities

Imp
act
Inve
stin
g f
or
Su
sta
ina
ble
Glo
ba
l F
ish
eri
es
A
VIB
RA
NT
OC
EA
NS
IN
ITIA
TIV
E
6
The artisanal sector as a whole comprises roughly
72,000 fishers nationwide and more than 5,000
indirect jobs.20 The gear used in each caleta varies,
depending on the species being harvested, with finfish
generally landed by gillnet, longline, or handline gears,
and most bottom-dwelling (benthic) species (e.g.,
lobster, crab, and sea urchin) harvested using traps or
manual extraction techniques.21
Of these artisanal landings, roughly 3% are
composed of benthic species extracted from
nearshore environments.22 Although bivalves and
crustaceans make up a small percentage of total
landings, they are among the highest-value products
available in Chile’s waters. Given that these species
exist almost exclusively within the 5 nautical mile
band that is the domain of the artisans, their long-
term viability will be driven to a large extent by the
fishing practices and stewardship of artisanal fishers.
The species proposed for sourcing in The Mariscos
Strategy represent a mix of bottom-dwelling, near-
shore species. These species include razor clams,
mussels, scallops, king crab, stone crab, nylon
shrimp, and loco (or Chilean abalone), each of which
is depicted below ith its scientific and local names:
THE MARISCOS STRATEGY PORTFOLIO
20 Instituto Nacional de Estatisticas, “Primer Censo Nacional Pesquero Y Acuicultor Ano 2008–2009”, 2009.
21 Instituto Nacional de Estatisticas de Chile, “Primer Censo Pesquero Y Acuicultor,” Ano Censal 2008–2009, 2009.
22 J. Castilla, “Fisheries in Chile: Small Pelagics, Management, Rights, and Sea Zoning,” Bulletin of Marine Science 86(2), 2010.
FIGURE 1: Target Species of The Marisco Strategy
Razor Clams(Mesodesma donoacium)“Machas”
Chilean King Crab(Lithodes santolla)“Centolla”
Chilean abalone(Concholepas concholepas)“Loco”
Mussels(Mytilus chilensis)“Choros”
Stone Crab(Cancer edwardsi)“Jaiba marmola”
Scallops(Argopecten purpuratus)“Ostiónes”
Nylon Shrimp(Heterocarpus reedi)“Camarón nailon”
PRIMARY TARGET SPECIES

Imp
act
Inve
stin
g f
or
Su
sta
ina
ble
Glo
ba
l F
ish
eri
es
A
VIB
RA
NT
OC
EA
NS
IN
ITIA
TIV
E
7
FIGURE 2: Location and Principal Species of the Caletas
The Mariscos Strategy would incorporate seven
prototype caletas (the caletas) within the first five
years, spanning Regions IV, V, VII, VIII, X, and XIV.
The map in Figure 2 highlights the locations of the
portfolio caletas and their primary species. Over
time, Mariscos would seek to expand into other
caletas should the model prove viable.
The seven prototype sites include approximately
200 vessels dedicated specifically to harvesting
the target species, although many of the products
are collected by hand from shallow water and thus
have no associated vessels. Nearly all the fishers in
the caletas are currently enrolled in formal fishing
associations. These associations exist to advocate
for the fishers’ interests in shaping regional
and national fishing regulations, provide for the
allocation of government-issued fishing rights, and
oversee and enforce fishers’ compliance with a
range of fishing and commercialization bylaws.
SANTIAGO
Pichidangui
Tongoy
San Pedro
Huiro
Tome
Chaihuin
Mar Brava
Region 4
Region 5
Region 6
Region 7
Region 8
Region 9
Region 14
Region 10
Legend
Razor Clams
Shrimp
Stone Crab
King Crab
Mussels
Abalone
Scallops

Imp
act
Inve
stin
g f
or
Su
sta
ina
ble
Glo
ba
l F
ish
eri
es
A
VIB
RA
NT
OC
EA
NS
IN
ITIA
TIV
E
8
Figure 3 shows the composition of fishers by caleta and the relative vessel numbers by caleta.
FIGURE 3: Total Number of Fishers and Vessels from Prototype Caletas
FIGURE 4: Fisheries Governance Index
Beginning in the 1990s, Chile started to utilize formal
catch limits that established Total Allowable Catch
levels, or TACs. These TACs were combined with an
allocation of catch shares, or quota, to individual
fishing companies, fishers, and communities across
many of the larger fisheries. Most international
observers today consider Chile to maintain a strong
management regime (see Figure 4).
CURRENT REGULATORY FRAMEWORK
FISHER DISTRIBUTION
Total Fishers: 543 Total Vessels: 202
VESSEL DISTRIBUTION
Mar Brava8%
Mar Brava8%
San Pedro28%
Tongoy33%
Tongoy55%Pichidangui
10%
Pichidangui13%
Chaihuin5%
Tome5% Tome
7%
Huiro10%
Huiro17%
FISHERIES GOVERNANCE INDEX — PRELIMINARY RESULTS
Un
ited
Sta
tes
No
rway
Icela
nd
Ru
ssia
New
Zeala
nd
Can
ad
a
So
uth
Afr
ica
Fra
nce
Arg
en
tin
a
Sp
ain
Un
ited
Kin
gd
om
Ch
ile
Peru
Jap
an
So
uth
Ko
rea
Vie
tnam
Mexic
o
Mo
rocco
Mala
ysi
a
Ind
ia
Ph
ilip
pin
es
Nig
eri
a
Ind
on
esi
a
Ban
gla
desh
Bra
zil
Ch
ina
Th
aila
nd
Myan
mar
.0
.9
.8
.7.6.5.4.3.2.1
000000000 Research
Socioeconomics
Enforcement
Management
Colored circles represent index values for each dimension separately, averaged across respondents and species for each country.
1

Imp
act
Inve
stin
g f
or
Su
sta
ina
ble
Glo
ba
l F
ish
eri
es
A
VIB
RA
NT
OC
EA
NS
IN
ITIA
TIV
E
9
Notwithstanding Chile’s progressive management
framework, many specific management deficiencies
exist, and many of the nation’s stocks remain
improperly assessed and/or managed. As of 2014,
there were 38 official commercial stocks in Chile, 22
of which still lacked formal management plans. Of the
stocks for which there were formal stock assessments
and biological reference points established, eight were
considered “fully exploited, eight “overexploited,” and
six “collapsed or exhausted.” The remaining stocks
had no formal stock assessments and were defined as
open access.23
Management of benthic near-shore resources is, in
many cases, conducted through the implementation
of territorial user-rights management systems
(TURFs), referred to in Chile as Áreas de Manejo y
Explotación de Recursos Bentónicos, which create
a de facto exclusive-access right for certain groups
of fishers. TURFs were established initially for the
management of Chilean abalone, but have since been
extended to other species. Although TURFs have
been shown to meaningfully improve management
and biomass levels in specific cases, they are often
poorly implemented, and fishers tend to lack the
technical understanding and data necessary to
consistently manage their resources at sustainable
extraction levels. Moreover, with rising domestic and
international demand for many of these high-value
products, short-term financial incentives are often at
odds with long-term sustainable management.
The portfolio caletas vary in terms of the stock
status, management system in place, and market
destinations (see Figure 5). Unfortunately,
unlike many of the finfish for which there are
now annual stock assessments conducted with
established biological reference points to guide the
establishment of total allowable catch (TAC) limits,
the species in The Mariscos Strategy tend not to
have comprehensive data available and therefore
must rely almost exclusively on local stewardship. As
a result, significant deficiencies exist in management
across all the caletas. These deficiencies leave the
fisheries vulnerable to overfishing and illegal fishing
activity. While comprehensive stock-level data on
catch per unit effort does not exist for many of
these species, studies suggest a general decline in
CPUEs—a clear indicator of stock biomass declines.24
CONDITION OF NEARSHORE SPECIES
23 Sernapesca, “Anuario 2014,” Ministeria de Economia Fomento Y Turismo, Gobierno de Chile, 2014.
24 G. Vasquez-Prada, “Analyzing Fish Stocks Dynamics Using CPUE and PRCF: A New Approach for the Fishery Management,” Journal of Coastal Life Medicine 2(1), 2014.
25 Landings data reflect total landings for these species nationwide, not just landings in the portfolio caletas, which total 2,900 mt of the listed species.
26 Chile’s National Fisheries Service
SPECIES NAME (SPANISH)
LANDINGS 2014 (MT)25
STOCK STATUS26 MANAGEMENT SYSTEM
MANAGEMENT COMMITTEE ESTABLISHED (Y/N)
Razor Clams (Machas) 2,741 No reference points set TURF No
Scallops (Ostiónes) 11,021 No reference points set TURF No
Stone Crab (Jaiba) 3,500–4,000 No reference points set None No
Shrimp (Camarón) 5,480 Fully exploited None Yes
King Crab (Centolla) 5,500 Fully exploited None No
Mussels (Choros) 3,800 No reference points set TURF No
Abalone (Loco) 2,300 Fully exploited TURF No
Figure 5: Nationwide Chilean Landings and Stock Status of Featured Species

Imp
act
Inve
stin
g f
or
Su
sta
ina
ble
Glo
ba
l F
ish
eri
es
A
VIB
RA
NT
OC
EA
NS
IN
ITIA
TIV
E
10
The primary fisheries management improvements
required in these fisheries include the use of data
collection systems to support broader stock
assessment efforts that can ultimately enable the
setting of Total Allowable Catch limits for the species.
In addition, authorities need to strengthen the
enforcement of fishing access limitations, including
robust vessel registration, and the government
certification of legal catch volumes. Finally, depending
on the species, a variety of additional rules regarding
seasonal closures and the establishment of no-take
zones could be implemented to protect and restore
the fisheries’ biomass.
The caletas that Mariscos proposes to incorporate
into its portfolio are part of the most economically
vulnerable segment of the fishing sector—the
smallest-scale fishers dependent exclusively on
nearshore benthic species harvested out of either
TURF reserves or informal equivalents. Despite
contributing over 50% of national landings, these
artisanal fishers and their families tend to fall among
the poorest segments of society largely because they
lack capital, infrastructure, and commercial know-how,
diminishing their ability to capture a greater share of
the final value of their products. Income levels vary
largely by species, with finfish and crustacean fishers
earning the most, and mollusk and algae harvesters
making the least. Most artisanal fishers live well
below the poverty line, as shown in Figure 6, with the
seasonable variability of raw materials and lack of cold
storage capacity leading to high income-volatility.27
SOCIO-ECONOMIC CONTEXT
27 Note 1 million CLP = US $1,420 at current exchange rates
28 Instituto Nacional de Estatisticas de Chile, “Primer Censo Pesquero Y Acuicultor,” Ano Censal 2007–08, 2008.
29 Ministerio de Desarrollo Social, “Encuesta Casen 2013: Situacion de la Pobreza en Chile, 2014.
30 Tongoy’s socioeconomic status is stronger than that of many caletas, given its ability to produce high-value scallops that are in demand both in the capital of Santiago and internationally. In addition, the government has provided grant capital to Tongoy to construct preprocessing infrastructure and facilities, enabling it to transact direct sales to end customers and to capture higher value for its landed catch volumes.
Despite landing a large and ever increasing share of
Chile’s seafood, particularly of its high-value products,
the nation’s artisanal fishers remain economically
marginalized, with little or no downstream participation
in the value chain. This situation can be attributed in
large part to underinvestment in modernization of the
sector. This stands in stark contrast to Chile’s industrial
fishing and aquaculture sectors, which have become
THE CURRENT SUPPLY CHAIN
FIGURE 6: Annual Fisher Income by Caleta Relative to Chilean Poverty Line and Extreme Poverty Line28, 29, 30
$6,000,000
$5,000,000
$4,000,000
$3,000,000
$2,000,000
$1,000,000
Tongoy Tome San Pedro Pichidangui Chiluin Huira Mar Brava
2015 ChileExtremePoverty Line
2015 ChilePoverty Line
CL
P/Y
ear
ANNUAL FISHER INCOMES BY CALETA

Imp
act
Inve
stin
g f
or
Su
sta
ina
ble
Glo
ba
l F
ish
eri
es
A
VIB
RA
NT
OC
EA
NS
IN
ITIA
TIV
E
11
In addition to the supply chain issues facing artisanal
products, many are barred from the necessary
sustainability certifications demanded by many North
American and European retailers. Although many of
these fishers employ low-impact gear and tend to
do a better job than their industrial counterparts of
stewarding the resource—particularly for benthic stocks
that can be managed at a caleta level—a certification
for these fisheries cannot be achieved due either to
a lack of data regarding stock status or evidence to
distinguish that the product was harvested by legal
fishers and not mixed with illegal product.
As a consequence, artisanal fishermen are largely
relegated to the role of “poor harvesters,” while
demand for sustainably sourced seafood remains
largely unmet.
31 Based on Encourage Capital research on the portfolio caleta supply chains.
multi-billion dollar industries as a result of significant
private and public investment. Instead, artisans tend
to rely exclusively on small grants from regional
governments and international philanthropies.
As a result, small-scale fishers suffer a marked lack
of commercialization infrastructure, access to capital,
and commercial know-how. In fact, in all but a few of
the more than 400 caletas in Chile, fishers must sell
their products at the beachside, with no value added,
into a fragmented chain of intermediaries who
take their product to market. These intermediaries
themselves generally lack access to cold-chain
infrastructure, and have low standards regarding
product handling and hygiene. Moreover, the large
number of fishers relative to intermediaries creates a
monopsony market dynamic wherein fishers become
price-takers, competing against one another on price,
locking themselves into low-margin, volume-driven
production models. This dynamic, together with high
spoilage rates, in turn drives a positive feedback loop
in which fishers harvest more but make less, leading
to stock depletion, lower catch per unit effort, and
further margin compression.
To put this into context, a supply chain analysis of the
products sold by the seven portfolio caletas reveals
that the first intermediary in the supply chain sells
the products at a 50% to 100% markup to the price
they pay to fishers. These are the same unprocessed
raw materials purchased from the fishers, with the
markup intended to cover spoilage, transport costs,
and a profit margin to the intermediary. This trend
gets amplified at each turn in the supply chain (as
seen in Figure 7) as the product makes its way
to Santiago. By the time the product reaches the
supermarket, again with little added value, the
markup can be as high as 500%.31 Ultimately, only
a small percentage of these products ever reach
export markets due to the diminished quality,
opaque chain of custody, and lack of reliable volumes
required to justify export operations.
FIGURE 7: Margin Increases at Each Turn in the Supply Chain
500%
100%
200%
300%
400%
Mark
up
(%
)
Caleta Intermediary 1(Transport
Aggregator)
Intermediary 2(OutdoorMarket)
Intermediary 3(Wholesalers,Processors)
Retail
Shrimp
King Crab
Scallops
Mussels
Razor Clams
Abalones
(Supermarkets)
MARKUP AT EACH TURN IN THE SUPPLY CHAIN

Imp
act
Inve
stin
g f
or
Su
sta
ina
ble
Glo
ba
l F
ish
eri
es
A
VIB
RA
NT
OC
EA
NS
IN
ITIA
TIV
E
12
THE MARISCOS IMPACT STRATEGY
IMPACT INVESTMENT THESIS
The Mariscos Strategy’s goal is to protect the current biomass of the caleta fisheries, with an upside
opportunity to increase it by up to 10% over a five-year period, improving the livelihoods of approximately
550 fishers who depend on it.
The strategy’s investment thesis is premised on the opportunity to partner with seven fishing communities,
bundle investments into fisheries management improvements with investments into a downstream food
products company, capture higher value for the caletas products, and ultimately reward fishers for using
sustainable fishing practices.
To accomplish these objectives, The Mariscos Strategy proposes the following bundled set of investments
(see Figure 8):
Step 1: Invest $4.5 million over five years in the design and implementation of robust caleta-level fisheries
management improvements across the seven portfolio caletas.
Step 2: Invest $2.5 million into the expansion of GustoMar, a packaged food products company that sells
gourmet “heat-and-eat” meals both to retail outlets and through the institutional food channel. This would
include the funding of new business operations to support purchasing relationships with each of the seven
caletas, the construction of a preprocessing plant, the expansion of an existing manufacturing facility, the
construction of a new manufacturing facility, and the funding of other operational expenses necessary to
finance working capital and develop new international sales channels for the Company’s products.
By bundling the investments into fisheries management improvements with an investment in GustoMar,
Mariscos would enable GustoMar to develop direct purchasing relationships with the caletas. GustoMar would
expect to capture significantly higher margins through a reconfiguration of the supply chain, allowing the
Company to offer premium prices to fishers in compliance with sustainability requirements, thereby serving
to improve fisher compliance. Moreover, this connectivity to the fishers would afford greater control over both
product quality and supply availability, creating a virtuous cycle of value generation.
FIGURE 8: The Marisco Strategy’s investments
HARVEST HANDLINGCOLD CHAIN/ TRANSPORT PROCESSING DISTRIBUTION
STEP 1: Fund $4.5 million in Fisheries Management Improvements and Community Resilience.*
* Mariscos budgets an additional $860,000 in fisheries management improvements over the investment term funded by cash flow from operations. STEP 2: Invest $2.5 million to expand GustoMar
SMALL-SCALE FISHERIES SEAFOOD SUPPLY CHAIN

Imp
act
Inve
stin
g f
or
Su
sta
ina
ble
Glo
ba
l F
ish
eri
es
A
VIB
RA
NT
OC
EA
NS
IN
ITIA
TIV
E
13
The Mariscos Strategy proposes to implement
fisheries management improvements in each of the
seven portfolio caletas located across four regions
in Chile. The fisheries management improvements
outlined in this report are simplified to present the
general set of actions necessary to improve the
management of all species across the caletas, based
on the shortcomings identified in the preliminary
fishery analysis. Upon implementation, each caleta
would require its own detailed preassessment and
specific management plan tailored to its species,
geography, and other identified needs. While the
management improvements would be designed
in alignment with internationally recognized best-
in-class sustainability standards, they are not
specifically aimed to achieve certification, but
instead target specific social and environmental
outcomes described herein.
The principal management intervention in the
caletas would be the installation of a technology
package, designed for and already tested in small-
scale fishery settings. Tracking technology would
record harvest location, composition, and gear-
type, all of which would be captured passively and
sent via Wi-Fi to a central receiver in a landing
station at the port. Landings would then be
weighed at the landing station, and a unique bar
code would be generated for each harvest batch
that accompanies the product through the supply
chain for traceability purposes. The data systems
would be installed on all vessels targeting the
species of interest for sourcing, and would feed a
common database that provides information on (a)
fleet movements in space and time, (b) catch and
bycatch in weight by species, (c) landings by vessel
and species, and (d) full traceability of products
back to the vessel of origin. Most importantly, the
system would capture landed and removed biomass
for every fishing trip, thereby limiting illegal,
unreported, and unregulated fishing.
By gathering this data across many different
fishers and fisheries, the system would create a
rich database of metrics essential for fisheries
management efforts. Mariscos could then analyze
the data to generate user-specific reports that
empower fishers to better control their actions,
allow commercial partners such as GustoMar to
ensure that they are sourcing fresh and sustainably
harvested raw materials, and provide valuable data
to authorities to inform management efforts. These
data would ultimately be used to evaluate the status
of stocks, set total allowable catch limits, assess
the environmental impact of fisheries, and work out
mitigation strategies.
STEP 1: FISHERIES MANAGEMENT IMPROVEMENTS

Imp
act
Inve
stin
g f
or
Su
sta
ina
ble
Glo
ba
l F
ish
eri
es
A
VIB
RA
NT
OC
EA
NS
IN
ITIA
TIV
E
14
CORE FISHERIES MANAGEMENT COMPONENTS
ACTIVITIES PROPOSED MANAGEMENT IMPROVEMENTS
Stakeholder Engagement
Government Engagement
• Share all aggregated data by species with Sernapesca (fisheries authorities) to inform management efforts
• Co-create product label with Sernapesca verifying the Company’s product as legal and sustainable
• Conduct workshops with Sernapesca authorities to help integrate Catch Documentation System (CDS) data into annual stock assessments
• In year 5, begin workshops and training to transitioning CDS management to Sernapesca
Community Engagement
• Provide training activities to improve adoption and utilization of the technology
• Provide ongoing workshops for fishers to (a) improve handling and hygiene and (b) ensure full understanding of local fishery management plans
• Prepare and publicly disseminate annual report on progress against target benchmarks with external audits in the 2nd and 5th years
Community Support
• Invest in community vessel infrastructure and holding facilities to improve product quality and sanitary conditions for fishers
Policy Rules and Tools
Exclusive Access Rights
• Ensure that quota and TURF reserves—both de facto forms of exclusive access—are monitored and properly enforced through installation of Vessel Monitoring Systems (VMS) on all vessels
Fishery Management
• Design and oversee implementation of caleta-specific fishery management plans outlining proper harvesting, landing, and catch-documentation practices, as well as key environmental considerations regarding ecosystem impacts, closed seasons, bycatch, discards, and bait use
• Register all vessels in the participant caletas
• Implement minimum size limits for each species based on minimum size at sexual maturity
Biological Monitoring and Assessment
• Fund research projects on catch composition and discards
• Fund research to map out sensitive ecosystems and spawning grounds
Stock Recovery • Ensure that all data is fed to fisheries management authorities to inform stock assessments and establishment of biological reference points
• Derive annual reports on CPUE and total landings volume for dissemination to fishers, authorities, and commercial partners to monitor trends in stock biomass
No-take zones • Establish no-take zones of at least 10% of each TURF reserve to provide recovery areas for target species
THE FISHERIES MANAGEMENT PLAN
The table below outlines the core fisheries management activities associated with the portfolio caletas:

Imp
act
Inve
stin
g f
or
Su
sta
ina
ble
Glo
ba
l F
ish
eri
es
A
VIB
RA
NT
OC
EA
NS
IN
ITIA
TIV
E
15
CORE FISHERIES MANAGEMENT COMPONENTS
ACTIVITIES PROPOSED MANAGEMENT IMPROVEMENTS
Compliance Catch Accounting • Design, implement, and operate Catch Documentation System (CDS)
• Install weighing stations in caletas to ensure that landings comply with quota allocation and are properly accounted for in fishery management data
Product Traceability
• Design and implement full traceability system from buying stations to final point of sale
Local Enforcement Systems
• Sign contracts with the leadership of each of the seven caletas stipulating that in exchange for access to all technology and infrastructure (vessel equipment, ice machines, etc.), the caleta must comply with the guidelines of the fishery management plan
• Work with caleta leadership to codify fishery improvement activities into the bylaws of each caleta and/or “Regimen Artesanal de Extracción” (RAE) through which quotas are allocated
Fishers willing to commit to fisheries management
improvements and serve as suppliers to GustoMar’s
sourcing network would be eligible to participate
in The Mariscos Strategy’s Sustainable Fishing
Rewards Program (SFRP). Mariscos proposes to
utilize the SFRP as an incentive to catalyze and
sustain the implementation of sustainable artisanal
fishing practices that support maintenance of
nearshore stocks, bycatch reduction, habitat
protection, and biodiversity.
The SFRP would offer economic rewards to
fishers and fishing caletas in two ways: through
the payment of higher prices per unit of catch
and through a profit-sharing mechanism whereby
fishing caletas are allocated an economic interest in
GustoMar’s business, earning a share of GustoMar’s
profits over time. (see Figure 9).
GustoMar expects to be able to pay 25% above
prevailing beachside prices for products from the
caletas. In addition, Mariscos would invest $3.5
million to capitalize a new financial entity in each
caleta called a Fishing Community Trust, or FCT.32
The capitalization of the FCT is needed to create a
longer term incentive to reward sustainable fishing
practices over time. Each FCT would be capitalized
from the project outset with $500,000 in grant
funding from philanthropic sources and Chilean
regional governments or development agencies,
with a 20% annual vesting schedule for five years.
Moreover, Mariscos would allocate 20% of GustoMar’s
equity to caletas, with the proceeds upon sale of
the company being divided evenly between the
portfolio FCT’s, modeled to occur in the fifth year
of the investment. The FCT would be structured as
a community reserve fund or insurance pool, where
funds could be drawn down by participant caletas
to fund near-term revenue shortfalls and cover costs
borne by the community as it adopts the transition
to more sustainable fishing practices.* In this way,
the FCT both strengthens community resilience
with committed funds up front to support short
term needs in the community, as well as a share of
longer term profits generated with the success of the
caleta-Company collaboration.
The FCT would be structured as an adjunct financial
entity attached to each of the portfolio caletas.
The FCT would have the following governance and
membership requirements:
SUSTAINABLE FISHING REWARDS PROGRAM
32 The concept and structure of the FCT is borrowed, in part, from the structures used by Fair Trade in distributing premiums earned on Fair Trade products to producing caletas.
* The allocation and use of FCT funds will be subject to all rules and restrictions pertaining to the use and distribution of grant and government funding both within the local Chilean context as well as the domiciles from which the funds are sourced.

Imp
act
Inve
stin
g f
or
Su
sta
ina
ble
Glo
ba
l F
ish
eri
es
A
VIB
RA
NT
OC
EA
NS
IN
ITIA
TIV
E
16
a) The Fishing Community Trust (FCT) must be
established as a public benefit trust, wholly
owned and governed by each caleta association,
subject to minimum conditions established
through an FCT Charter document.
b) FCT leadership must be elected annually by caleta
members by simple majority in a democratic vote
where one person equals one vote.
c) FCT governance must include three members of
the fishing caletas, plus one voting member from
GustoMar, and two from The Mariscos Strategy
management team.
d) Any of FCT’s external board members would have the
right to veto any proposed modification to the FCT or
the fisheries management improvements plan.
e) Caletas’ access to FCT funds must include
agreement with and ongoing compliance with the
adopted fisheries management improvements,
which are to be updated and renewed annually.
f) The FCT will have a vesting period of five years,
whereby the caleta receives an incremental 20%
share of the total funds each successive year,
only after demonstrated compliance with the
fisheries management improvements, until the
fifth year when the initial endowment of funds
(see Transaction structure below) is fully vested
and available to the community.
g) FCT’s board can determine how best to use the
vested FCT funds subject to any constraints
stipulated by the grant provider.33 In addition to
assisting communities in making a transition to more
sustainable practices, the fund would also be well-
suited to provide business-interruption insurance
or other relief in the event of extended periods of
inclement weather or natural disaster, depending on
the needs of the individual community.
GustoMar would only source seafood from current
members of the caletas, and then on the basis
of individual and caletas’ compliance with the
current sustainability requirements as determined
by local caletas’ monitoring and annual third-party
verification. Prices for specific volumes of landings
would be paid for directly to fishers so long as the
fisher’s membership in the caletas remains intact.
Proceeds from the 20% fisher ownership share
in GustoMar generated at exit would be divided
between the seven FCTs to recapitalize them.34
The Mariscos Strategy estimates the current value of
the 2,905 mt landed annually by the seven portfolio
caletas to be approximately $13.5 million. Mariscos
believes that it can generate sufficient additional
33 The FCT would be capitalized initially with grant funds from philanthropic and regional government sources potentially constraining how the funds are used.
34 If exit proceeds were sufficiently large or investors were wiling to forgo a greater share of the equity, these funds could be used to endow a trust fund to pay for community or fishery improvements in perpetuity. This Fishery Management Fund mechanism is explored in the Industrial Fishery Blueprint.
35 $3.5 million up-front Contribution vests over 5 years @ 20% per year and is recapitalized upon exit through 20% equity share.
FIGURE 9: Profit Share Program Expansion (FCT and Premium)35
SUSTAINABLE FISHING REWARDS PROGRAM
$4,000,000
$3,500,000
$3,000,000
$2,500,000
$2,000,000
$1,500,000
$1,000,000
$500,000
Premiums Paid to Fishers
2015 2017 2018 2019 2020
Contributions from FCT

Imp
act
Inve
stin
g f
or
Su
sta
ina
ble
Glo
ba
l F
ish
eri
es
A
VIB
RA
NT
OC
EA
NS
IN
ITIA
TIV
E
17
economic value each year across its operating
footprint to pay out nearly $1.8 million in premium
to fishers over the first five years.35 The value of the
FCT in the 5th year could be as much as $5.0 million
in future value terms, and the 20% equity share
could enable the FCT to grow further in value if the
investment period were extended.
In addition, Mariscos proposes securing legal
contracts with the leadership of each of the caletas
stipulating that, in exchange for access to all loaned
infrastructure (vessel equipment, ice machines, etc.)
and access to the SFRP, the caletas must comply
with the fisheries management improvements.
Any caleta found in breach of the agreement
could lose access to these valuable assets as well
as to the SFRP. All valuable infrastructure in the
communities would be installed in such a way that
it was secure but could be removed by truck in the
case of sanction or other disruptions in the caletas.
This structure of loaned or leased equipment with
covenants is legally enforceable and would create
a self-policing structure in which the caleta’s
leadership could use any of a wide variety of
punitive measures to protect the broader interests
of the caleta against individual fishers, including
revocation of quota allocations, vessel licenses,
or membership in the federation. This structure
highlights the important interplay between market
incentives and fisher compliance in a context in
which sanctions on individual fishers by Mariscos by
itself would be legally or politically infeasible.
The fisheries management improvements have
been designed by experts in accordance with
international best practices and certification
frameworks, with a strong focus on traceability, data
collection, enhanced market connectivity, and the
special challenges of fisheries management in small-
scale, data-poor fisheries. Mariscos would seek
to engage similar experts to serve as the primary
fisheries management implementation partner
across the seven caletas, to ensure alignment with
international fisheries management best practices
and certification standards.
Finally, The Mariscos Strategy plans to utilize third-
party verification and auditing of the fisheries
management improvements at each fishing site it
sources from, so as to create additional discipline and
accountability in its sourcing policies and systems.
The auditors would be asked to review annual
reports provided by Mariscos, to conduct annual
audits of fishing practices and management systems,
and to perform surprise audits in each caleta.
MANAGEMENT AND IMPLEMENTATION
The Mariscos Strategy plans to utilize third-party verification and
auditing of the fisheries management improvements at each
fishing site it sources from, so as to create additional discipline and
accountability in its sourcing policies and systems.
35 In real dollar terms, 2015 base year.

Imp
act
Inve
stin
g f
or
Su
sta
ina
ble
Glo
ba
l F
ish
eri
es
A
VIB
RA
NT
OC
EA
NS
IN
ITIA
TIV
E
18
FIGURE 10: Fisheries Management Improvements Annual Budget
The fisheries management improvements require
a significant upfront investment, given that the
strategy would be rolled out simultaneously
across the seven caletas in year 1 (see Figure 10).
This rollout schedule is important to facilitate an
expansion of raw material sourcing beginning
in year 1 of the project. Over time, the ongoing
fisheries management costs would gradually
decrease as intensive stakeholder outreach
diminishes, leaving only general oversight and
maintenance of the vessel monitoring data, catch
documentation (which would be transitioned to
Sernapesca), reporting on FMI progress, external
audits, and other day-to-day oversight.
FISHERIES MANAGEMENT IMPROVEMENTS BUDGET
2016 2017 2018 2019 2020
Do
llars
(U
SD
)
$1,200,000
$1,000,000
$800,000
$600,000
$400,000
$200,000
Total CAPEX
Total OPEX
FISHERY MANAGEMENT IMPROVEMENTS BUDGET

Imp
act
Inve
stin
g f
or
Su
sta
ina
ble
Glo
ba
l F
ish
eri
es
A
VIB
RA
NT
OC
EA
NS
IN
ITIA
TIV
E
19
FIGURE 11: Fishery Improvement Costs as a Share of Seafood Revenue
Major budget outlays associated with fishery
management operating costs include:
• Workshops with Sernapesca to help them
incorporate data into fishery management decisions
• Generation of annual reports tailored to fishers,
GustoMar, and Sernapesca on fishery health and
updates to the management plan
• Training sessions to transfer management
of catch documentation systems (CDS) to
Sernapesca by year 5
• Registration of all vessels
• External audits and stakeholder dissemination
of findings
Major capital expenses, all of which are incurred in
the first year of the program, would include purchase
and installation of the following:
• Vessel monitoring systems on all vessels and data
collection terminals within the caleta
• Electronic scales and IT systems for catch
documentation
• Design, implementation, and constant monitoring
of the catch documentation system (CDS)
• Traceability system from buying station to point
of sale and integration with GustoMar logistics
• Ice machines and storage bins in each caleta
to improve sanitary conditions for fishers and
generate greater value per unit volume
Over time, the share of fishery management
improvements would fall dramatically as a share of
total seafood revenue, as shown in Figure 11:
$30,000,000
$35,000,000
$25,000,000
$20,000,000
$15,000,000
$10,000,000
$5,000,000
Seafo
od
Reve
nu
e (
US
D)
50%
40%
30%
20%
10%
FM
I E
xp
en
ses
/ R
eve
nu
e
Seafood Revenue
FMI budget as a % of Seafood Revenue
YE
AR
4
YE
AR
3
YE
AR
2
YE
AR
1
YE
AR
5
YE
AR
6
YE
AR
7
YE
AR
8
YE
AR
9
YE
AR
10
FISHERY MANAGEMENT IMPROVEMENT COSTS AS A % OF SEAFOOD REVENUE

Imp
act
Inve
stin
g f
or
Su
sta
ina
ble
Glo
ba
l F
ish
eri
es
A
VIB
RA
NT
OC
EA
NS
IN
ITIA
TIV
E
20
The table below sets forth the long-term social impact targets for the seven caletas The Mariscos Strategy
would incorporate into its sourcing network:
Because environmental conditions and conservation
potential differ by species and region, The Mariscos
Strategy’s targeted impact returns would vary by
species and caleta. The table below sets forth the
primary environmental impact goals of the strategy:
TARGETED SOCIAL AND ENVIRONMENTAL IMPACTS
SOCIAL IMPACTS
Increased Income Levels and Community Resilience
• 25% higher prices relative to current alternative market channels for nearly 550 fishers. The premiums paid out to fishers would approach $1.8 million during the first five years of the project, paid out immediately as fishers supplied the GustoMar operations.37
• Increased community resilience by offering an initial FCT endowment of $3.5 million with further capitalization in the form of a 20% equity interest in GustoMar that would be monetized upon exit in year 5. The cumulative FCT contribution from these sources totals $5.0 million over the first five years of the project.38 FCT funds could increase further in the event that the investment period was extended and additional profits were generated by the Company. The vested principal balance of the FCT could be drawn down by participant caletas as needed each year to fund community focused projects.
Food Security • Through storage and handling improvements, GustoMar would target a reduction in spoilage across the supply chain from the current 15% to under 2%, which equates to approximately 200 mt in avoided spoilage over the five-year project forecast.
• By reducing waste in the existing supply chain by the end of year 5, Mariscos would hope to deliver 150,000 additional meals-to-market each year to support local and global food security.
Time Horizon If Mariscos were to extend its investment horizon to 10 years, the social impacts would likely be even greater.
ENVIRONMENTAL IMPACTS
Biomass Protection • Maintain or gradually increase biomass in nearshore fisheries through improved management, no-take zones, and data-driven management plans
Habitat Protection • Define no-take zones in TURFs constituting at least 10% of the total area, protecting nearly 16,000 hectares of community fishing grounds under robust management plans
• Map fishing activity of artisanal fleets through vessel monitoring against occurrence of sensitive habitats, and seek to reduce incursions over time
Time Horizon If Mariscos were to extend its investment horizon to 10 years, the environmental impacts would likely be even greater.
37 In real dollar terms, 2015 base year.
38 In real dollar terms, 2015 base year.

Imp
act
Inve
stin
g f
or
Su
sta
ina
ble
Glo
ba
l F
ish
eri
es
A
VIB
RA
NT
OC
EA
NS
IN
ITIA
TIV
E
21
THE MARISCOS COMMERCIAL INVESTMENT THESIS
STEP 2: THE EXPANSION OF GUSTOMAR
The Mariscos Strategy proposes a $2.5 million investment39 into GustoMar to expand its sustainable
seafood sourcing and distribution capacity by building supply-chain infrastructure, enabling it to source
raw materials directly from seven fishing caletas, improve the quality of products sourced from its portfolio,
expand its manufacturing capacity, and extend the marketing and distribution of artisanally sourced
seafood products from Chile.
VALUE PROPOSITION
The Mariscos Strategy capitalizes on the opportunity to create additional value for the landed catch than
is currently generated in order to provide a source of cash flow to reward fishers for sustainable practices
and to generate financial returns. The commercial investment thesis for The Mariscos Strategy is centered
on (a) the reconfiguration of the existing, highly inefficient supply chain for artisanal seafood and (b)
the development and sale of innovative, value-added, packaged food products to high-value customer
segments both domestically and abroad.
Analysis of GustoMar’s supply chain suggests that seafood buyers currently purchase raw materials at
an approximately 200% markup to dockside prices earned by fishers in the caletas due to a reliance on
intermediaries, each of which charges a markup to cover inefficient transportation costs and spoilage. By
investing to create direct-sourcing channels to secure supplies, improve handling processes, upgrade supply
chain infrastructure and logistics, and expand final product processing and packaging capacity, Mariscos
can grow its business, improve quality and yield, and capture additional margin on its operations. This value
creation would be generated before taking into consideration any final unit pricing and does not assume any
increases in landings in the caletas, given that participant caletas are already assumed to be fully exploited.
By creating and capturing additional value for artisanally sourced seafood products, a company like GustoMar
can provide economic rewards to fishers and fishing caletas and generate attractive financial returns.
39 This includes all uses of investment proceeds excluding FMI implementation, capitalization of the FCT, and transaction fees.

Imp
act
Inve
stin
g f
or
Su
sta
ina
ble
Glo
ba
l F
ish
eri
es
A
VIB
RA
NT
OC
EA
NS
IN
ITIA
TIV
E
22
Mariscos proposes that the commercial investment
strategy identify a mission-aligned partner to ensure
a shared set of sustainable sourcing standards.
As such, Mariscos proposes an investment into
GustoMar, an indicative company with a track record
of success in the manufacture and sale of frozen
“heat-and-eat” packaged meals. GustoMar’s brand
emphasis is on higher-value, healthy, gourmet style
food that is quick to prepare. Prepared products
containing seafood, such as shrimp empanadas
(baked pastry stuffed with shrimp) and scallops
baked with grated parmesan cheese, have been
GustoMar’s major differentiator from its competitors,
most of whom do not offer seafood products. The
Company also produces prepared food without
seafood, including salads and sandwiches.
Mariscos would aim to invest into a company that
has identified sustainability as an important part
of its long-term business strategy, with interest in
development of a line of products focused on high-
value seafood entrees sourced from raw materials
sustainably extracted by local artisanal fishers in
Chile’s coastal caletas. The Company’s mission would
therefore incorporate the following tenets:
• Raw materials sourced from nature should be
managed sustainably to protect and steward those
natural resources for the long term
• Producers should be treated fairly in the value
chain and have the opportunity to improve
their livelihoods
• Sustainability and responsible-sourcing can be
a key differentiator and source of competitive
advantage in the marketplace
The Company markets a wide variety of products,
including many of the same recipes sold in different
formats, depending on the needs of the customer
(frozen versus refrigerated or varying portion sizes.).
Not all would need to contain seafood. Moreover, for
the scale of operations proposed, GustoMar would
need roughly 30 employees and an experienced
management team and CEO.
COMPANY DESCRIPTION AND MISSION ALIGNMENT
FIGURE 12: Final Presentation of GustoMar’s Products

Imp
act
Inve
stin
g f
or
Su
sta
ina
ble
Glo
ba
l F
ish
eri
es
A
VIB
RA
NT
OC
EA
NS
IN
ITIA
TIV
E
23
Facilitated by Mariscos investment, GustoMar’s
goal would be to grow its sustainable sourcing
network to encompass seven fishing caletas and
approximately 550 fishers by 2020. This expansion
would increase its sourcing to over 630 mt of raw
material by 2020, growing its revenue from $3.1
million to $14.1 million, while targeting gross margins
of 31% and EBITDA margins approaching 20%
by the end of year 5. To realize this growth, The
Mariscos Strategy proposes the investment of $2.4
million into the expansion of GustoMar’s business
operations to integrate critical upstream elements
of its current supply chain, as explained below.40
Sourcing and Handling
The investment would expand GustoMar’s
sourcing portfolio to 630 mt by 2020, representing
approximately 21.8% of the portfolio caletas’ total
extraction volumes by 2020 (and a significantly
higher percentage in many of the individual
caletas), while providing direct and secure access
to raw materials products. This large share of total
production is intended to provide greater market
leverage for both fishery management and quality
improvements. Raw materials would be derived from
the seven portfolio caletas producing seven high-
value species: razor clams, scallops, stone crab, king
crab, nylon shrimp, abalone, and mussels. In each of
these caletas, GustoMar would implement seafood-
handling training programs with fishers to improve
product quality and hygiene. The expanded portfolio
incorporating the seven caletas in four regions across
Chile, are illustrated in Figure 13.41
GROWTH STRATEGY
FIGURE 13: GustoMar Sourcing Network Strategy Showing Locations of Seven Portfolio Caletas, Key Species, and Target
Markets for Finished Goods
40 This includes all uses of investment proceeds listed in the Transaction Summary section excluding FMI implementation, capitalization of the FCT, and transaction fees.
41 For further details about The Marisco Strategy’s strategy of enlisting new sustainable fishers and caletas into its sourcing network, refer to the “Sustainable Fishing Rewards Program” section above.
Legend
Razor Clams
Buying station
Processingplant
Buying station to plant
SalesDistribution
Shrimp
Stone Crab
King Crab
Mussels
Abalone
Scallops
SANTIAGO
Pichidangui
Tongoy
San Pedro
Huiro
Tome
Chaihuin
Mar Brava
Region 4
Mexico
BrazilPeru &
Columbia
Region 5
Region 6
Region 7
Region 8
Region 9
Region 14
Region 10

Imp
act
Inve
stin
g f
or
Su
sta
ina
ble
Glo
ba
l F
ish
eri
es
A
VIB
RA
NT
OC
EA
NS
IN
ITIA
TIV
E
24
FIGURE 14: Sourcing Plan with Relative Contribution of Each Species to Total Volume
FIGURE 15: Volume and Production Share from the Caletas Over the 5-Year Plan42
Cold Chain and Logistics
Mariscos proposes to reconfigure the existing supply
chain to enable direct sourcing from the portfolio
caletas to the Company, bypassing the wholesale
seafood terminal in Santiago, and providing
uninterrupted cold chain access and chain of custody
from the beachside to the manufacturing plant.
Processing and Packaging
Mariscos would plan to upgrade GustoMar’s existing
manufacturing plant and construct a new, larger
facility in Santiago to increase annual seafood raw
material processing capacity to over 600 mt by
Year 5. The investment would also support the
construction of a new preprocessing plant that
would allow the Company to buy seafood products
directly from fishers without relying on processing
intermediaries as they currently do.
42 This constitutes a weighted average share of raw materials sourced, which underrepresents the extent of market leverage in the caletas due to the large production volume to sourcing in caleta Tongoy—1100 mt and only 4% by year five, respectively.
700
600
500
400
300
200
100
25%
20%
15%
10%
5%
Share ofCaletaProduction
VolumeSourcedby GustoMar
Year 1 Year 4 Year 5Year 2 Year 3
The sourcing contribution by species is outlined in Figure 14.
Figure 15 depicts the scale-up of sourcing and associated share of the production of the seven caletas.
SPECIES CONTRIBUTION TO SEAFOOD REVENUE
SOURCING VOLUMES & SHARE OF CALETA PRODUCTION
35%RazorClams
20%Scallops
11%Shrimp
12%StoneCrab
7% Mussels
12% Abalone
3% King Crab

Imp
act
Inve
stin
g f
or
Su
sta
ina
ble
Glo
ba
l F
ish
eri
es
A
VIB
RA
NT
OC
EA
NS
IN
ITIA
TIV
E
25
Distribution
GustoMar has developed a brand identity in the
Chilean retail markets based on health and quality. Its
marketing strategy going forward would be focused
on a combination of Chilean store-point expansion
and international distribution. GustoMar’s goals would
first include expanded market access and distribution
to achieve an increase in total volume of seafood
finished goods from 7 mt in 2014 to over 1,000 mt by
Year 5.43 Moreover, the investment would establish a
working capital line to support 90-day receivables
accounts (typical in grocery retailing customer
accounts) and support volume sales increases to new
store locations with existing customer bases.
Given the relatively small size of the Chilean market,
with a national population of only 17.6 million, the
international expansion strategy is key to GustoMar’s
growth. GustoMar would plan to initiate product
distribution and sales in four additional countries
over the next four years, using its relationship with a
major retail conglomerate as an entry point into the
retail grocery markets of Mexico, Brazil, Colombia
and Peru (see Figure 16).
FIGURE 16: Sales by Customer Segment Year 5
10% Supermarkets $1,590,906
(SODEXO etc.)$3,735,170
23%
4% Hospitality $691,698
6% Convenience Stores $822,208
InternationalRetail
$8,984,605
57%
43 Because finished goods have fillers added to volume, processing “yield” is greater than 1; therefore, the total volume of finished goods at ~1,000 mt is greater than the 634 mt in raw material inputs.
SALES BY CUSTOMER (YEAR 5) USD; %
FoodService

Imp
act
Inve
stin
g f
or
Su
sta
ina
ble
Glo
ba
l F
ish
eri
es
A
VIB
RA
NT
OC
EA
NS
IN
ITIA
TIV
E
26
Each of the above countries boasts a population
much larger than that of Chile. Moreover, in each
of these countries there is a trend of increasing
urbanization driving growth in supermarket
outlets.44 Capitalizing on this trend and its existing
retail experience in Chile, the Company will first
target the supermarket segment. In particular, the
company hopes to build on existing relationships
with Chilean retailers such as Cencosud, which also
own supermarkets in Brazil, Colombia and Peru.
A list of potential anchor clients, all of whom offer
either sustainable or premium seafood offerings, is
identified in the table to the right.
COUNTRY TARGET RETAIL CHAINS
Mexico Wal-Mart, Commercial Mexicana, Costco, Bodega Aurrera
Brazil Wal-Mart, Cencosud, Pão de Açúcar, Carrefour, Angeloni
Colombia Cencosud, Makro, Almacenes Éxito
Peru Cencosud, Vivanda, Tottus, Plaza Vea
COUNTRY INHABITANTS MOST AFFLUENT QUINTILE
INCOME PER CAPITA FOR TOP QUINTILE
Chile 17.8 million 3.6 million $41,325
Brazil 206.1 million 41.2 million $32,555
Mexico 125.4 million 25.1 million $27,676
Peru 31.0 million 6.2 million $16,396
Colombia 47.8 million 9.6 million $22,875
44 Food and Agriculture Organization of the United Nations, “State of the World’s Fisheries 2014”, Annual Report, Rome, 2014.
While Chile will continue to be GustoMar’s home
base, the Company has ambition to expand to
other larger Latin American countries where
significant growth opportunities exist. It would seek
to expand to four other Latin American countries
beginning with Brazil and Mexico in 2016, followed
by Colombia and Peru by 2017. The financial model
assumes an investment of $1.5 million to expand into
these four countries over the next 5 years.
The table below compares the income level and
number of people who fall within the wealthiest 20%
in each of these countries, which illustrates that there
is significant market potential for GustoMar’s high-
value products in the regional market.
Source: World Bank, 2014.

Imp
act
Inve
stin
g f
or
Su
sta
ina
ble
Glo
ba
l F
ish
eri
es
A
VIB
RA
NT
OC
EA
NS
IN
ITIA
TIV
E
27
The Company’s historical performance is
compelling, having grown sales in each year since
its founding, attaining a 9% market share within
the refrigerated, frozen and salad prepared food
segments of the Chilean retail market, as shown
in Figure 18. Nevertheless, overall profitability has
remained low as the Company has struggled to fund
its working capital needs while having its margins
squeezed by high debt-service costs.
HISTORICAL PERFORMANCE
FIGURE 18: GustoMar Historical Market Share
2008 2009 2010 2011 2012 2013 2014
1.1%
2.6%
6.8%7.9%
9.6%8.7%
9.3%10%
5%
15%Market Share
FIGURE 17: Sales Growth by Country as a Result of International Expansion Plan
Mill
ion
s (U
SD
)
$8
$1
$2
$3
$5
$7
$6
$4
Mexico
Columbia
Peru
Brazil
REVENUE BUILD-UP BY COUNTRY
GUSTOMAR MARKET SHARE FROZEN FOOD HEAT-AND-EAT SEGMENT
2016 2017 2018 2019 2020

Imp
act
Inve
stin
g f
or
Su
sta
ina
ble
Glo
ba
l F
ish
eri
es
A
VIB
RA
NT
OC
EA
NS
IN
ITIA
TIV
E
28
GustoMar’s products are currently sold through
several key distribution channels in Chile, including
supermarkets (leading chains such as Jumbo, Santa
Isabel, Tottus), convenience stores (OK Market, Shell,
etc.), hospitality businesses (hotels, restaurants, and
cafes), and institutional food services companies
(Sodexo). Companies that provide institutional
food services are mainly facilities management
companies that serve segments such as the mining,
education, prison, and other industries.
Although supermarkets only comprise 23% of
GustoMar’s sales volume in 2014, this sector also
pays the highest price on a per kilo basis, resulting
in a 29% contribution to the Company’s total
revenue, as the analyses in Figure 19 demonstrate.
GustoMar distributes its products to nearly all the
leading supermarket chains in Chile.
Currently, products with seafood as an ingredient
comprise under 10% of GustoMar’s unit sales but
deliver 14% of total revenue, given the higher price
point on many of its prepared seafood dishes.
One of the main reasons that seafood sales do not
currently represent a larger portion of GustoMar’s
business is the unreliable supply of key ingredients,
such as razor clams, conger eel, and scallops.
Between October 2014 and February 2015, for
example, razor clams were out of stock because
of supply shortages. Moreover, the company lacks
processing capacity for seafood raw materials,
leaving it reliant on intermediaries who often fail to
deliver quality, traceable product.
FIGURE 19: Sales by Market Segment in Kilos and Dollars of Revenue
23%Supermarket
29%Supermarket
54%Food
Service
43%Food
Service
17%Convenience
Store
10%On-Premise
11%On-
Premise
13% Convenience
Store
2014 SALE BY CUSTOMER (KILO %) 2014 SALE BY CUSTOMER (USD; %)

Imp
act
Inve
stin
g f
or
Su
sta
ina
ble
Glo
ba
l F
ish
eri
es
A
VIB
RA
NT
OC
EA
NS
IN
ITIA
TIV
E
29
Mariscos expects GustoMar’s sales to continue to
benefit from the general socioeconomic trends in
Chile in addition to the Chilean consumers’ shift
in food preferences toward healthier, responsibly
sourced products. Due to the positive economic
development and outlook in Chile, Chileans
are enjoying higher standards of living that are
continuing to improve. With the growth in the
economy, a growing percentage of women are
entering the Chilean workforce, and both men
and women are working longer hours. Moreover,
Chileans are delaying parenthood and remaining
single longer, with the number of single households
rising to 14% in 2013.45 These factors all contribute
to rising disposable income and less time available
to prepare meals from scratch, leading to a
greater ability and willingness to pay more for
higher-quality, more convenient food options. At
the same time, there is increasing consciousness
among Chilean consumers, particularly the younger
generations, to support values-aligned companies.
In terms of dietary preferences, Chileans consume
only 12.9 kg of seafood on an annual per capita
basis, versus global average consumption of over
17 kg per capita.46 This is only one-sixth of Chilean
meat consumption. However, fish and seafood per
capita sales in Chile rose by 3.9% in 2013 at a higher
rate than the 3.7% observed in overall food sales
in the country.47 Many attribute the low seafood
consumption in Chile to the historically poor
quality of seafood products as a result of improper
handling in harvest and distribution.
Of all the fish and seafood landed in Chile for
human consumption, 57% is currently converted
into frozen products, 33% are sold fresh and chilled,
and 10% are processed into cured and preserved
products. Sales in frozen fish and seafood increased
dramatically by 22% annually, rising from U.S. $5.2
million in 2008 to $19.8 million in 2013. Sales in fresh
seafood amounted to $650 million in 2013.48
Chile currently enjoys $513 of consumption per
capita of packaged food, surpassing the rest of the
countries in South America. Within the ready-to-
serve meals market, frozen food is growing more
rapidly than refrigerated food and salads (10.1% vs.
5.5% and 5.5% in 2014). Processed refrigerated food
and processed frozen products amount to 5.9 and
3.6 kg per capita, respectively.49
The retail supermarket segment would be the most
important growth segment for GustoMar. Chile has
one of the most sophisticated retail industries in
the world, on par with the United States. In Chile,
the three biggest supermarket chains—Walmart
Chile, Cencosud (which owns supermarket
brands Jumbo and Santa Isabel), and SMU (which
owns supermarket chains Unimarc, Bigger, and
convenience store OK Market—constitute a
combined 80% of total market share of supermarket
food sales.50 Figure 20 shows the historical and
projected growth of the prepared food segment in
the Chilean market.
MARKET TRENDS
45 Euromonitor International, “Downsizing Globally: The Impact of Changing Household Structure on Global Consumer Markets,” April Strategy Briefing, 2013.
46 Food and Agriculture Organization of the United Nations, “The State of World Fisheries and Aquaculture,” Rome, 2014.
47 Euromonitor International, “Downsizing Globally: The Impact of Changing Household Structure on Global Consumer Markets,” April Strategy Briefing, 2013.
48 Euromonitor International, “Frozen Processed Food in Chile,” March Country Report, 2015.
49 USDA Foreign Agricultural Service, “Chile’s Food Processing Sector,” Global Agricultural Information Network Report, 2013.
50 Feller Rate Clasificadora de Riesgo, “Chile salio de compras,” Salio De Compras”, Estudio Final, 2013.
Chile has one of the most sophisticated retail industries in the world,
on par with the United States.

Imp
act
Inve
stin
g f
or
Su
sta
ina
ble
Glo
ba
l F
ish
eri
es
A
VIB
RA
NT
OC
EA
NS
IN
ITIA
TIV
E
30
Within the sustainable prepared seafood category,
GustoMar is currently the only player in the market.
One packaged food company has seafood products
similar to GustoMar’s in the retail and food service
segments but without the emphasis on quality,
sustainability, or wellness. Three other competitors
currently offer packaged food products that could
compete with GustoMar’s, including sustainably
harvested frozen vegetables and fruits, and frozen
seafood products such as salmon and breaded fish
sticks. All three are well-funded companies backed
by larger parent entities.
COMPETITION
FIGURE 20: Growth (both Historical and Projected) of Key Prepared-Foods Product Families in the Chilean Market in Which
GustoMar Participates in the Two Categories Shaded Green
Within the sustainable prepared seafood category, GustoMar is
currently the only player in the market.
2008 2009 2010 2011 2012 2013 2014 2015 2016 2017 2018
Mill
ion
s
30
25
20
15
10
5
Frozen Pizza
Frozen/RefrigeratedSalad
RefrigeratedPizza
DehydratedFood
Canned Food
PREPARED FOOD: CHILEAN MARKET 2008-2018 (USD)
*GustoMar participates in the Dehydrated Food as well as the Frozen/Refrigerated Salad sectors.

Imp
act
Inve
stin
g f
or
Su
sta
ina
ble
Glo
ba
l F
ish
eri
es
A
VIB
RA
NT
OC
EA
NS
IN
ITIA
TIV
E
31
THE MARISCOS STRATEGY FINANCIAL ASSUMPTIONS & DRIVERS
REVENUE MODEL AND PRICING
With the injection of fresh capital, GustoMar would expect to grow domestic sales at a CAGR of 16.8%
during the first five years, reaching $6.6 million by 2020, and to grow international sales from zero to $7.5
million by 2020 (Figure 21).
Consistent with the Company’s strategic shift toward local, responsibly sourced seafood products, existing
nonseafood product revenue is expected to level off, with seafood products driving future top-line growth
(Figure 22).
FIGURE 21: GustoMar Revenue Projections Through International Expansion Plan
FIGURE 22: GustoMar Revenue Projections in Key Segments
Mill
ion
s (U
SD
)
Domestic
International$15
$13
$11
$9
$7
$5
$3
$1
Mill
ion
s (U
SD
)
Non-Seafood
Seafood$15
$13
$11
$9
$7
$5
$3
$1
REVENUE CONTRIBUTION: DOMESTIC VS INTERNATIONAL
REVENUE CONTRIBUTION: SEAFOOD VS NON-SEAFOOD
2012
2012
2013
2013
2014
2014
2015
2015
2016
2016
2017
2017
2018
2018
2019
2019
2020
2020

Imp
act
Inve
stin
g f
or
Su
sta
ina
ble
Glo
ba
l F
ish
eri
es
A
VIB
RA
NT
OC
EA
NS
IN
ITIA
TIV
E
32
GustoMar’s cost of goods sold (COGS) would
be driven primarily by its nonseafood raw
material costs in the early years, but increasingly
by seafood raw materials as the sourcing plan
develops. Transportation, processing personnel,
other production costs (including utilities), remain
a relatively constant but small contributor to the
overall cost structure (Figure 23).
COST STRUCTURE
FIGURE 23: Breakdown of COGS by Expense Category
100%
90%
80%
70%
60%
50%
40%
30%
20%
10%
Seafood Raw Materials
Non-SeafoodRaw Materials
Transportation &Distribution
Production Personnel
Other COGS
COST OF GOODS SOLD (COGS) BREAKDOWN
2016 2017 2018 2019 2020

Imp
act
Inve
stin
g f
or
Su
sta
ina
ble
Glo
ba
l F
ish
eri
es
A
VIB
RA
NT
OC
EA
NS
IN
ITIA
TIV
E
33
GustoMar’s Selling, General, and Administrative
Expenses (SG&A) costs early on would be
dominated by operational expenses associated
with its overseas expansion, business development,
and fisheries improvement activities. Over time,
these “start-up” related costs will fall, and general
administrative overhead including personnel payroll
and benefits should becomeassume the dominant
share of SG&A (Figure 24).
Figure 25 reflects the overall cost structure of
GustoMar’s operations. Raw material costs would
comprise a large share of the business, in line with costs
at other food processing and distribution businesses.
FIGURE 24: Breakdown of SG&A by Expense Category
FIGURE 25: GustoMar Cost Structure (5-Year Average)
100%
90%
80%
70%
60%
50%
40%
30%
20%
10%
BusinessDevelopment
Administration
FisheryImprovementProgram
OverseasExpansionStartupCosts
Maintenance
30%Non-Seafood
RawMaterials
24%Seafood
RawMaterials
13% Production -Personnel
6% Transportationand Distribution
4% Other COGS
12% Administration
5% Business Development
3% Overseas Expansion Startup Costs 3% Fishery Improvement Program
SALES, GENERAL, AND ADMINISTRATION (SG&A) BREAKDOWN
OVERALL COST STRUCTURE (5-YR CUMULATIVE)
2016 2017 2018 2019 2020

Imp
act
Inve
stin
g f
or
Su
sta
ina
ble
Glo
ba
l F
ish
eri
es
A
VIB
RA
NT
OC
EA
NS
IN
ITIA
TIV
E
34
THE MARISCOS STRATEGY TRANSACTION STRUCTURE
SOURCES AND USES OF FUNDS
The Mariscos Strategy proposes a $7.0 million investment consisting of a $3.5 million equity investment
paired with a total of $3.5 million of grant proceeds.
OWNERSHIP STRUCTURE AND GOVERNANCE
The CEO and Founder currently owns 100% of the
Company. After the proposed transaction, the new
investors would own 71% with management owning
the remaining 29%. Mariscos investors would then
allocate a 20% equity share for fishers.
The most efficient system for foreign investors and foundations to invest into The Merluza Strategy would
be through an entity incorporated in the United States. This company would become the parent company
and majority shareholder of GustoMar. Mariscos proposes that the GustoMar board have six total seats, with
the primary investor group controlling three, management controlling two, and one caleta leader, rotating
annually across the seven fishing caletas. Decisions would be made by simple majority.
The following table summarizes the uses of funds for Project Mariscos:
TOTAL SOURCES CAPITALIZATION
Sponsor Equity $3,467,273 50%
Total Debt $ – 0%
Foundation PRI $ – 0%
Foundation Grant $1,750,000 25%
Government Grant $1,750,000 25%
Total Sources $6,967,273 100%
TOTAL USES
Cash $100,000
Pre-Processing Plant $467,630
Upgrade Existing Processing Assets $37,037
New Processing Facility $592,593
FMI Initial Implementation $962,626
Overseas Expansion $600,000
Debt Payoff $607,387
Fishing Community Trust $3,500,000
Transaction Fees $100,000
Total Uses $6,967,273
51 This equity interest is controlled by Mariscos Investors; however, proceeds at sales will be distributed to the FCT.
OWNERSHIP STRUCTURE
Investors 51%
FCT Allocation51 20%
Management 29%
Total 100%

Imp
act
Inve
stin
g f
or
Su
sta
ina
ble
Glo
ba
l F
ish
eri
es
A
VIB
RA
NT
OC
EA
NS
IN
ITIA
TIV
E
35
Figure 27 shows a summary of the base case Mariscos impact and financial returns.52
SUMMARY OF RETURNS
SUMMARY OF BASE CASE FINANCIAL RETURNS
Total Equity Investment $3,467,273
Time Horizon (years) 5.0
Total Leverage Level 0%
Equity IRR 11.1%
5-Year EBITDA CAGR 39.3%
SUMMARY OF BASE CASE IMPACT RETURNS
Total Marketable Landings Increase N/A
Total Avoided Bycatch N/A
Total Habitat Protected (acres) 38,758
Total Income Increase (%) 25.0%
Total Income Increase to Fishers – 5 yrs
$1,759,382
Contributions to Fisher Community Trust
$3,500,000
Total Fishers Incorporated 543
Total “Caletas” Engaged 7
Spoilage Reduction 13.5%
Additional Meals-to-Market (meals/yr) 149,818
Impact Investors Foundations Local Gov’t or DFI
GustoMar
Buying Stations
FMI Service Providers
Technical assistance and capacity building
Outsource & manage implementation
VMS CDS
Transportation, Processing & Packaging
Sales & Distribution
Raw Materials
Transport
Marketing
Cold Storage Processing
Procurement & Handling
Sustainable Fishing Rewards Program
Fishing Community Trusts (FCT)
CAPITAL PROVIDERS
EQUITY GRANT
EXIT PROCEEDS
FEE
SERVICES
FIP Design
Implementation
Monitoring & Compliance
FIGURE 26: Capital Providers
52 “Contributions to Fishing Community Trust”—includes the $3.5m FCT capitalization, vested over 5 years, and 20% company equity allocated to FCT, all in real dollar terms (2015 USD); “Caleta Livelihood Diversification”—real value (2015 USD) of FCT capitalization vested over 5 years, and 20% company equity allocated to FCT paid out in year 5, and the % that this represents of the total ex-vessel value of all landings within GustoMar’s operating footprint over the 5-year period, represented in real terms (2015 USD); “Additional Meals to Market”—incremental meals produced due to spoilage reductions, assuming 200 g per serving.
FIGURE 27: Base Case Impact and Financial Returns
$2,250,000
$1,250,000
$250,000
$(750,000)
5-YEAR EBITDA
YEAR 1
YEAR 2
YEAR 3
YEAR 4
YEAR 5

Imp
act
Inve
stin
g f
or
Su
sta
ina
ble
Glo
ba
l F
ish
eri
es
A
VIB
RA
NT
OC
EA
NS
IN
ITIA
TIV
E
36
FIGURE 28: Growth in Free Cash Flow and Income*
Several key inputs will have a particularly pronounced
effect on the financial return of the project. As
such, the model has been forecast under multiple
scenarios, flexing the following key variables:
Annual Changes in Sales Prices: As with any
processing and distribution business, the cash flows
of the Company are sensitive to changes in the sales
price of the finished goods. The sales prices used in
the model are based on thorough diligence of the
market segments into which GustoMar intends to
sell. The base-case scenario assumes that current
market prices grow 2% faster than core inflation of
4%, or 6% per year. The downside scenario assumes
that prices only increase at domestic inflation rates
of 4%, while the upside scenario assumes 7% annual
increases. The IRR falls to 7.9% in the downside case,
while increasing to 16.8% in the upside case.
Working Capital: Managing working capital is a
particular challenge when sourcing from artisanal
fishers, given the need to pay cash at the time of
raw material purchase with significant delay before
payment by the customers. Moreover, the volatility
in seafood supply relative to the need to fulfill
constant supply agreements with buyers requires
holding significant inventory. Both scenarios create
significant working capital demands. In GustoMar’s
case, inventory has less of an impact on the IRR of
the project. In the base case, the model assumes
60 receivable days; 90 days is assumed in the
downside scenario, and 30 days in the upside
scenario. In the downside scenario the project IRR
falls to 8.0% while in the upside scenario the IRR
increases to 13.4%.
Transportation Costs as Percentage of Sales: Given
the wide geographic distribution of the caletas,
transportation costs—even when outsourced to an
efficient provider—can be a significant component
of the Company’s cost structure. The base case
assumes transport costs of 6% of sales, in line with
what other seafood businesses in Chile pay for
transport of raw materials but significantly higher
than GustoMar’s current spend on transportation.
Transport costs of 8% of sales are assumed in the
downside and 4% in the upside. In the downside
scenario the project IRR falls to 6.6% while in the
upside scenario the IRR increases to 14.8%.
SENSITIVITY ANALYSIS
Free Cash Flow
EBITDA
Net Income
FREE CASH FLOW AND INCOME METRICS
$5.5
$7.5
$3.5
$1.5
$(0.5)
$($2.5)
2012A 2013A 2014A 2015A 2016P 2017P 2018P 2019P 2020P
Mill
ion
s U
SD
* Free cash flow in 2020 includes the anticipated proceeds from the disposition of equity; anticipated free cash flow from ongoing operations
in 2020 is $1,589,150, while the estimated share from the exit of the investment is $5,861,388.

Imp
act
Inve
stin
g f
or
Su
sta
ina
ble
Glo
ba
l F
ish
eri
es
A
VIB
RA
NT
OC
EA
NS
IN
ITIA
TIV
E
37
EBITDA Exit Multiple: In year 5, the company
is assumed sold at a multiple times EBITDA.
This multiple is a function of the upside that the
company might offer to a potential buyer. The
model assumes a 5.0x multiple in the base case, a
7.0x multiple in the upside case, and a 3.0x multiple
in the downside. In the downside scenario the
project IRR falls to 0.0% while in the upside scenario
the IRR increases to 19.0%. Precedent exit multiples
in the Chilean seafood industry have tended to vary
between 6.0x–9.0x, so even the upside scenario
presented here may be conservative.
Foreign Exchange: Foreign exchange rates also
have the potential to impact returns, given that the
model assumes dollar-denominated investment.
A stronger dollar in the short run means greater
purchasing power in Chile, while a gradual
strengthening of the currency could improve the
return significantly as pesos are converted back
into dollars to repay investors upon exit of the
company. So as not to overemphasize the impact
of foreign exchange in the model, the base case
assumes a CLP/USD (Chilean peso vs. U.S. dollar)
exchange rate of 675, a downside of 725, and an
upside of 625. In the downside scenario the project
IRR falls to 5.5% while in the upside scenario the IRR
increases to 16.2%.
SCENARIOS IRR IMPACT
Base Case Downside Upside Downside Upside
Sales Price Increase (%/yr) 6.0% 4.0% 7.0% 7.9% 16.8%
Working Capital (Receivable Days)
60 90 30 8.0% 13.4%
Transportation (%/Sales) 6.0% 8.0% 4.0% 6.6% 14.8%
EBITDA Multiple 5.0x 3.0x 7.0x 0.0% 19.0%
F/X Rate (CLP/USD) 675 725 625 5.5% 16.2%
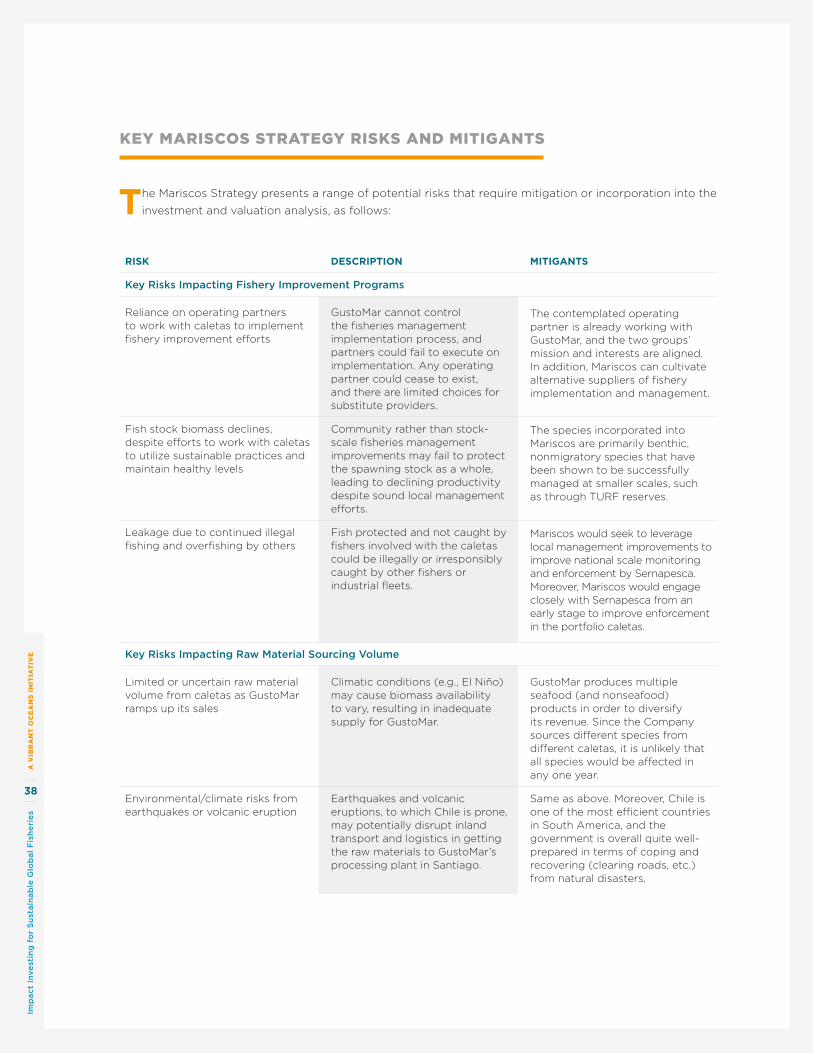
Imp
act
Inve
stin
g f
or
Su
sta
ina
ble
Glo
ba
l F
ish
eri
es
A
VIB
RA
NT
OC
EA
NS
IN
ITIA
TIV
E
38
KEY MARISCOS STRATEGY RISKS AND MITIGANTS
The Mariscos Strategy presents a range of potential risks that require mitigation or incorporation into the
investment and valuation analysis, as follows:
RISK DESCRIPTION MITIGANTS
Key Risks Impacting Fishery Improvement Programs
Reliance on operating partners to work with caletas to implement fishery improvement efforts
GustoMar cannot control the fisheries management implementation process, and partners could fail to execute on implementation. Any operating partner could cease to exist, and there are limited choices for substitute providers.
The contemplated operating partner is already working with GustoMar, and the two groups’ mission and interests are aligned. In addition, Mariscos can cultivate alternative suppliers of fishery implementation and management.
Fish stock biomass declines, despite efforts to work with caletas to utilize sustainable practices and maintain healthy levels
Community rather than stock-scale fisheries management improvements may fail to protect the spawning stock as a whole, leading to declining productivity despite sound local management efforts.
The species incorporated into Mariscos are primarily benthic, nonmigratory species that have been shown to be successfully managed at smaller scales, such as through TURF reserves.
Leakage due to continued illegal fishing and overfishing by others
Fish protected and not caught by fishers involved with the caletas could be illegally or irresponsibly caught by other fishers or industrial fleets.
Mariscos would seek to leverage local management improvements to improve national scale monitoring and enforcement by Sernapesca. Moreover, Mariscos would engage closely with Sernapesca from an early stage to improve enforcement in the portfolio caletas.
Key Risks Impacting Raw Material Sourcing Volume
Limited or uncertain raw material volume from caletas as GustoMar ramps up its sales
Climatic conditions (e.g., El Niño) may cause biomass availability to vary, resulting in inadequate supply for GustoMar.
GustoMar produces multiple seafood (and nonseafood) products in order to diversify its revenue. Since the Company sources different species from different caletas, it is unlikely that all species would be affected in any one year.
Environmental/climate risks from earthquakes or volcanic eruption
Earthquakes and volcanic eruptions, to which Chile is prone, may potentially disrupt inland transport and logistics in getting the raw materials to GustoMar’s processing plant in Santiago.
Same as above. Moreover, Chile is one of the most efficient countries in South America, and the government is overall quite well-prepared in terms of coping and recovering (clearing roads, etc.) from natural disasters.

Imp
act
Inve
stin
g f
or
Su
sta
ina
ble
Glo
ba
l F
ish
eri
es
A
VIB
RA
NT
OC
EA
NS
IN
ITIA
TIV
E
39
RISK DESCRIPTION MITIGANTS
Key Risks Impacting Raw Material Costs
Existing intermediaries offering caletas higher prices
Competitors wanting to compete with GustoMar may offer higher prices to the caletas.
By working closely with the caletas through its partners and procurement staff, GustoMar would pay a better price to the caletas. In addition, the caletas would have an ongoing financial interest in GustoMar’s business through the FCT, which align and incentivize them to support GustoMar’s operations.
Key Risks Impacting Revenue
Customer concentration GustoMar currently has 7 clients. In 2013, the Company lost an important contract with one of its clients, resulting in a loss of 35% of revenue.
The Company recognizes this weakness. With funds from this new round of financing, the Company would work to strengthen its sales and marketing efforts to diversify its client base. As it expands to other Latin American markets, its customer base would also expand.
International Expansions GustoMar’s business plan is reliant on international expansion, which may prove more costly or slower to ramp up than projected.
GustoMar has already completed extensive due diligence of the international markets, and has access to large-scale customers through its existing customer network and relationships.
Existing competitors undercutting by price or new entrants crowding the market
GustoMar’s products are more expensive than most of its competitors’. There is also interest from other companies in entering the prepared seafood segment.
GustoMar positions itself as offering gourmet food products, which it believes is supported by growing customer demand. This is demonstrated by GustoMar’s continuous growth in market share in the retail sector. GustoMar would continue to develop new innovative food products not offered by other competitors. Finally, as the company grows it would be expected to achieve significant economies of scale that should reduce its cost structure.
Still small but growing market for sustainable products in Latin America
As GustoMar tries to focus on growing sales of its sustainable seafood, customer demand or willingness to pay a premium for sustainable seafood may not be sufficient to support the growth strategy.
One of GustoMar’s strengths is that it produces great-tasting, unique, gourmet products that others currently do not offer. Even without the sustainability message, consumers are expected to continue to favor and purchase its products. Moreover, responsible sourcing from artisanal producers provides a unique selling point that seems to resonate with consumers.

Imp
act
Inve
stin
g f
or
Su
sta
ina
ble
Glo
ba
l F
ish
eri
es
A
VIB
RA
NT
OC
EA
NS
IN
ITIA
TIV
E
40
RISK DESCRIPTION MITIGANTS
Key Risks Impacting Business Execution
Trying to grow too quickly, resulting in an unsuccessful overseas expansion
In addition to losing invested capital associated with these overseas ventures, it could also divert GustoMar’s management time from the core business in Chile.
GustoMar should only initiate entrance to other geographic markets once its Chilean business is on track. Moreover, this expansion should be phased in over the next five years.
Management’s ability to focus on growing the business while managing other noncommercial issues
Not uncommon to small growing companies, GustoMar management has had to dedicate energy to resolving issues such as hiring/firing personnel and buying out former investors who did not take to the sustainability/responsible-sourcing story. One of its suppliers also committed fraud, resulting in GustoMar’s losing money.
The addition of the COO role in 2014 has been an important addition for the management team, allowing the CEO to focus more on the commercial side of the business. A capital infusion would also allow GustoMar to hire a finance and administrative manager and several other key positions, all of which should provide capacity to address a range of management issues.
Key Risks Impacting General Macroeconomic Environment
Inflation and currency risks The Chilean peso has weakened against the U.S. dollar considerably in the last 18 months. At 689 pesos to USD $1, it is currently approximately 31% below the 5-year average of 523 pesos per USD $1.
Inflation and currency fluctuations in Chile are closely linked to the price of copper, Chile’s most important export.
The base-case model scenario assumes the current weak foreign exchange rate will continue through 2020. This is a conservative view that assumes copper prices will not rebound in the next 5 years.
The base case also assumes a reasonable core inflation rate of 4% (Chile’s trailing 5-year average).

Imp
act
Inve
stin
g f
or
Su
sta
ina
ble
Glo
ba
l F
ish
eri
es
A
VIB
RA
NT
OC
EA
NS
IN
ITIA
TIV
E
41
APPENDIX
OPERATIONAL AND FINANCIAL PROJECTIONS
YEAR 1 YEAR 2 YEAR 3 YEAR 4 YEAR 5
# of Fishing Communities 7 7 7 7 7
# of Fishers 543 543 543 543 543
# of Vessels 202 202 202 202 202
SALES VOLUME (mt)
Live Weight Equivalent 56 118 262 453 634
Finished Product 88 183 404 706 1,016
REVENUE
Export Sales $37,543 $582,790 $1,948,938 $4,217,712 $7,522,672
Domestic Sales $3,024,294 $3,849,485 $5,104,833 $6,087,311 $6,584,178
Total $3,061,837 $4,432,275 $7,053,771 $10,305,023 $14,106,850
YoY Growth in Sales 44.8% 59.1% 46.1% 36.9%
OPERATING EXPENSES
Cost of Good Sold
Non-Seafood Raw Materials $1,214,930 $1,518,663 $1,898,328 $2,183,078 $2,401,385
Seafood Raw Materials $351,484 $769,512 $1,756,545 $3,092,209 $4,310,226
Production - Personnel $367,420 $531,873 $846,453 $1,236,603 $1,692,822
Transportation and Distribution $183,710 $257,072 $395,011 $556,471 $733,556
Other COGS $122,473 $177,291 $282,151 $412,201 $564,274
Total COGS $1,933,834 $2,820,047 $4,501,325 $6,511,889 $8,404,433
SG&A
Administration $306,184 $425,498 $648,947 $906,842 $1,184,975
Business Development $168,401 $234,911 $359,742 $504,946 $663,022
Overseas Expansion Startup Costs $600,000 $750,000 $150,000 $ - $ -
Fishery Improvement Program $302,626 $355,150 $218,561 $176,453 $107,650
Maintenance $16,969 $16,117 $15,307 $14,538 $13,808
Total COGS $1,071,027 $1,340,060 $728,303 $681,399 $770,671
EBITDA $(572,361) $(603,811) $482,726 $1,221,681 $2,435,131
EBITDA Margin -19% -14% 7% 12% 17%
CASH EXPENDITURES
Pre-processing Facility $467,630 $ - $ - $ - $ -
Processing Facility $592,593 $ - $ - $ - $ -
Upgrades to Existing Processing Facility $37,037 $ - $ - $ - $ -
Buying Stations $660,000 $ - $ - $ - $ -
Fishery Improvement Materials and Equipment $485,000 $ - $ - $ - $ -
Fishery Improvement Infrastructure $175,000 $ - $ - $ - $ -
Total CAPEX $2,417,259 $ - $ - $ - $ -

With support from:
Bloomberg Philanthropies’ Vibrant Oceans Initiative
The Rockefeller Foundation


