Interpreting TurfgrassIrrigation Water Test ResultsM. ALI HARIVANDI, Environmental Horticulture Advisor, Alameda, Contra Costa, andSanta Clara Counties
The notion that water quality problems caused by soluble salts arise only—oreven primarily—in regions with arid climates is far from the truth. For example,
the excessive pumping of fresh water from wells in coastal areas can lead to saltwa-ter intrusion problems. Even in high-rainfall areas the groundwater may contain sig-nificant levels of soluble salts derived from underground rock formations of marineorigin. Moreover, increasing numbers of golf courses, parks, cemeteries, schoolcampuses, industrial, and commercial turfed sites use potentially saline recycledmunicipal water for irrigation. The result of this breadth of use is that the effects ofexcess soluble salts are visible on turfgrass plantings in a wide range of climates.Water analysis and periodic monitoring have thus become key components of soundirrigation management.
Water analysis by a commercial laboratory provides data on many parameters,some of which are of little significance for turfgrass irrigation. The most importantparameters for turfgrass management are total concentration of soluble salts (salin-ity); sodium (Na) content; relative proportion of sodium to calcium (Ca) and mag-nesium (Mg) (Sodium Adsorption Ratio or SAR); chloride (Cl), boron (B), bicar-bonate (HCO3), and carbonate (CO3) content; and pH. Other parameters that youare likely to find on a water test report and that you should review are nutrient con-tent (nitrogen, phosphorus, and potassium), chlorine content, suspended solids,and turbidity, though none of these by itself plays a major role in determining thesuitability of water for irrigation.
I M P O R TA N T T E S T PA R A M E T E R SSalinity. All irrigation waters contain some dissolved mineral salts and chemicals.Some soluble salts are identified as nutrients and are beneficial to turfgrass growth;others may be phytotoxic or may become so when present in high concentrations.The rate at which salts accumulate to undesirable levels in a soil depends on theirconcentration in the irrigation water, the amount of water applied annually, annualprecipitation (rain plus snow), and the soil’s physical and chemical characteristics.
Different laboratories report water salinity in different ways: as Total DissolvedSolids (TDS) measured in parts per million (ppm) or milligrams per liter (mg/L), oras electrical conductivity (ECw) measured in millimhos per centimeter(mmhos/cm), micromhos per centimeter (µmhos/cm), decisiemens per meter(dS/m), or siemens per meter (S/m). Some labs may also report the individual com-ponents of salinity (e.g., sodium) in milliequivalents per liter (meq/L). You can usethe following equations to convert results from one set of units to another, and socompare data from differently formatted reports:
(1) 1 ppm = 1 mg/L
(2) 1 mg/L = meq/L 3 Equivalent Weight (see Table 1)
(3) 1 mmho/cm = 1 dS/m = 1,000 µmhos/cm = 0.1 S/m
P U B L I C A T I O N 8 0 0 9
UNIVERSITY OF CALIFORNIADivision of Agriculture and Natural Resourceshttp://anrcatalog.ucdavis.edu
Historically, laboratories determine TDS in water by evaporating a known vol-ume and then weighing any precipitate. Results of this method were reported as ppmor mg/L. This process is time-consuming, and today the preferred method for assess-ment of soluble salt content is the measurement of electrical conductivity (ECw),which is directly related to the salt content of the water. Regardless of how salinityis reported, the relationship between ECw and TDS is approximately
(4) ECw (mmhos/cm or dS/m) 3 640 = TDS (ppm or mg/L)
Note that the 640 value is a general average factor and may require adjustmentin special circumstances. For example, waters containing substantial amounts of sul-fate require a higher conversion factor. Many low-salinity groundwater suppliesalong coastal valleys of California have water that would fall within this category.Sometimes the appropriate conversion factor can be as high as 700. If you are unsureabout which conversion factor to use, consult the testing laboratory.
Most water that is acceptable for turfgrass irrigation contains from 200 to 800ppm soluble salts. Soluble salt levels greater than 2,000 ppm may injure turfgrass;salt levels up to 2,000 ppm may be tolerated by some turfgrass species (Table 2), butonly on soils with exceptional permeability and subsoil drainage. Good permeabili-ty and drainage allow a turfgrass manager to leach excessive salts from the root zoneby periodically applying heavy irrigations. Sand-based sport fields and golf greenshave the proper soil structure for this form of salinity management. (It should benoted that irrigation water with a very low salt content [i.e., below 0.2 dS/m] canactually reduce the permeability of a soil. Such water can disperse clay particles,which then clog large soil pores that are important for good permeability.)
INTERPRETING TURFGRASS IRRIGATION WATER TEST RESULTS 2
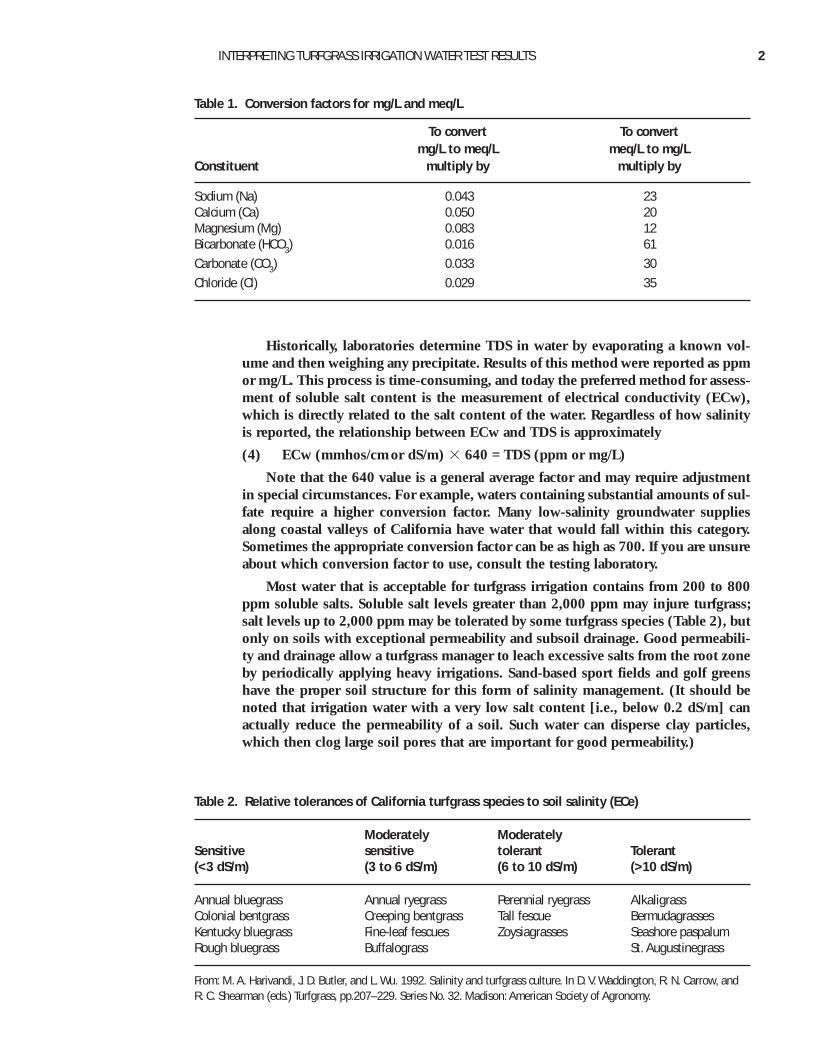
Table 1. Conversion factors for mg/L and meq/L
To convert To convertmg/L to meq/L meq/L to mg/L
Constituent multiply by multiply by
Sodium (Na) 0.043 23Calcium (Ca) 0.050 20Magnesium (Mg) 0.083 12Bicarbonate (HCO3) 0.016 61Carbonate (CO3) 0.033 30Chloride (Cl) 0.029 35
Table 2. Relative tolerances of California turfgrass species to soil salinity (ECe)
Moderately ModeratelySensitive sensitive tolerant Tolerant(<3 dS/m) (3 to 6 dS/m) (6 to 10 dS/m) (>10 dS/m)
Annual bluegrass Annual ryegrass Perennial ryegrass AlkaligrassColonial bentgrass Creeping bentgrass Tall fescue BermudagrassesKentucky bluegrass Fine-leaf fescues Zoysiagrasses Seashore paspalumRough bluegrass Buffalograss St. Augustinegrass
From: M. A. Harivandi, J. D. Butler, and L. Wu. 1992. Salinity and turfgrass culture. In D. V. Waddington, R. N. Carrow, andR. C. Shearman (eds.) Turfgrass, pp.207–229. Series No. 32. Madison: American Society of Agronomy.
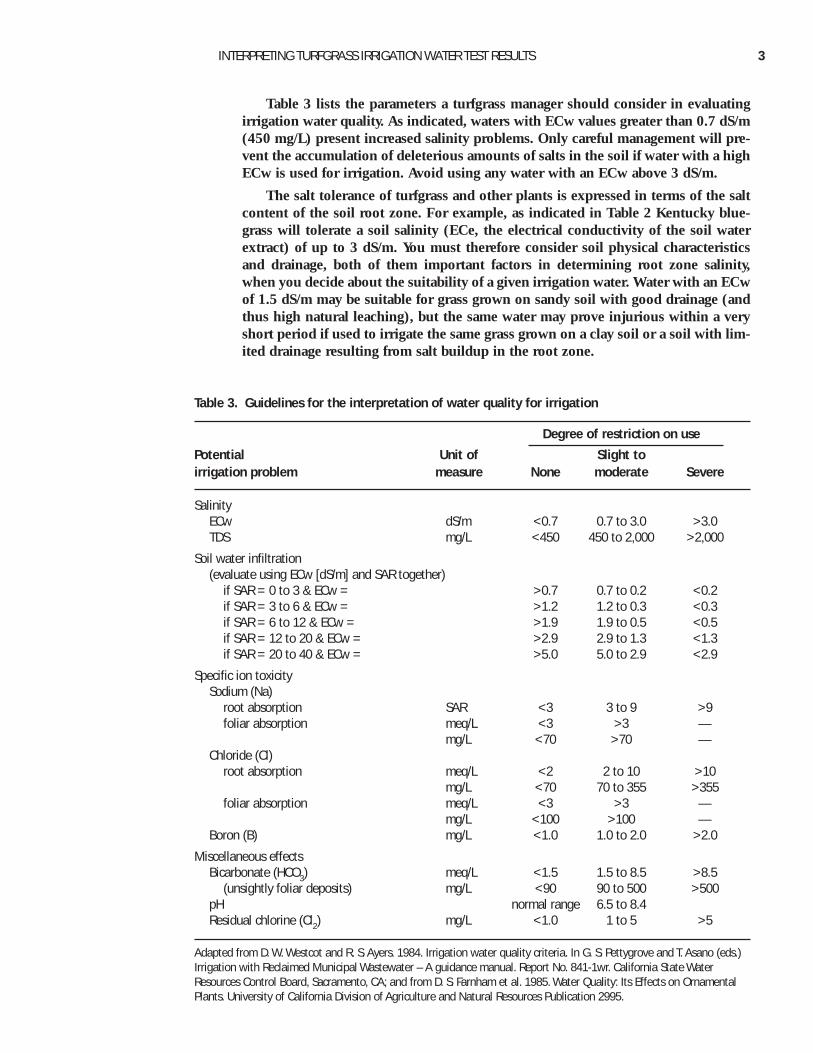
Table 3 lists the parameters a turfgrass manager should consider in evaluatingirrigation water quality. As indicated, waters with ECw values greater than 0.7 dS/m(450 mg/L) present increased salinity problems. Only careful management will pre-vent the accumulation of deleterious amounts of salts in the soil if water with a highECw is used for irrigation. Avoid using any water with an ECw above 3 dS/m.
The salt tolerance of turfgrass and other plants is expressed in terms of the saltcontent of the soil root zone. For example, as indicated in Table 2 Kentucky blue-grass will tolerate a soil salinity (ECe, the electrical conductivity of the soil waterextract) of up to 3 dS/m. You must therefore consider soil physical characteristicsand drainage, both of them important factors in determining root zone salinity,when you decide about the suitability of a given irrigation water. Water with an ECwof 1.5 dS/m may be suitable for grass grown on sandy soil with good drainage (andthus high natural leaching), but the same water may prove injurious within a veryshort period if used to irrigate the same grass grown on a clay soil or a soil with lim-ited drainage resulting from salt buildup in the root zone.
INTERPRETING TURFGRASS IRRIGATION WATER TEST RESULTS 3
Table 3. Guidelines for the interpretation of water quality for irrigation
Degree of restriction on use
Potential Unit of Slight toirrigation problem measure None moderate Severe
SalinityECw dS/m <0.7 0.7 to 3.0 >3.0TDS mg/L <450 450 to 2,000 >2,000
Soil water infiltration(evaluate using ECw [dS/m] and SAR together)
if SAR = 0 to 3 & ECw = >0.7 0.7 to 0.2 <0.2if SAR = 3 to 6 & ECw = >1.2 1.2 to 0.3 <0.3if SAR = 6 to 12 & ECw = >1.9 1.9 to 0.5 <0.5if SAR = 12 to 20 & ECw = >2.9 2.9 to 1.3 <1.3if SAR = 20 to 40 & ECw = >5.0 5.0 to 2.9 <2.9
Specific ion toxicitySodium (Na)
root absorption SAR <3 3 to 9 >9foliar absorption meq/L <3 >3 —
mg/L <70 >70 —Chloride (Cl)
root absorption meq/L <2 2 to 10 >10mg/L <70 70 to 355 >355
foliar absorption meq/L <3 >3 —mg/L <100 >100 —
Boron (B) mg/L <1.0 1.0 to 2.0 >2.0
Miscellaneous effectsBicarbonate (HCO3) meq/L <1.5 1.5 to 8.5 >8.5
(unsightly foliar deposits) mg/L <90 90 to 500 >500pH normal range 6.5 to 8.4Residual chlorine (Cl2) mg/L <1.0 1 to 5 >5
Adapted from D. W. Westcot and R. S. Ayers. 1984. Irrigation water quality criteria. In G. S. Pettygrove and T. Asano (eds.)Irrigation with Reclaimed Municipal Wastewater – A guidance manual. Report No. 841-1wr. California State WaterResources Control Board, Sacramento, CA; and from D. S. Farnham et al. 1985. Water Quality: Its Effects on OrnamentalPlants. University of California Division of Agriculture and Natural Resources Publication 2995.
The figures in Table 2 give a general guide to the salt tolerance of individual turf-grasses. As indicated, soils with ECe values below 3 dS/m are considered satisfacto-ry for most turfgrasses. ECe values between 3 and 10 dS/m indicate soils in whichonly a few salt-tolerant turfgrass species can survive.
Sodium. Sodium content is another important factor in irrigation water qualityevaluation. Plant roots absorb sodium and transport it to leaves where it can accu-mulate and cause injury. The leaf symptoms of sodium toxicity resemble those of saltburn. Because salts can be absorbed directly by leaves, irrigation water with a highlevel of sodium salts can be particularly toxic if applied to plant leaves via overheadsprinklers. Sodium toxicity is often of more concern on plants other than turfgrass-es, primarily because accumulated sodium is removed every time grass is mowed.Among grasses grown on golf courses, annual bluegrass and bentgrass are the mostsusceptible to sodium phytotoxicity. In these cases, mowing may not provide pro-tection since these grasses are generally cut very short (a stress in itself), and anysodium accumulation will then make up a large proportion of the small remainingquantity of leaf tissue.
The data in Table 3 provide general guidelines for assessing the effect of sodiumin irrigation water. As indicated in the table, the level of sodium tolerated by non-turf plants varies with irrigation application method. Most landscape plants will tol-erate as much as 70 ppm (mg/L) sodium when irrigated by overhead sprinkler.
SAR (Sodium Adsorption Ratio). Although sodium in the irrigation water can betoxic to plants, a more common deleterious effect of sodium results from its effecton soil structure. This effect generally is of more concern to golf course superinten-dents and other professional managers of intensely used turfgrassess.
When irrigation is applied to the soil, the best indicator of sodium effect is awater’s Sodium Adsorption Ratio (SAR), a value which should be provided in all lab-oratory water analyses. As a general rule, water with an SAR value below 3 is con-sidered safe for turf and other ornamental plants (Table 3). Because SAR is such animportant factor in water evaluation, however, it merits a thorough understanding.
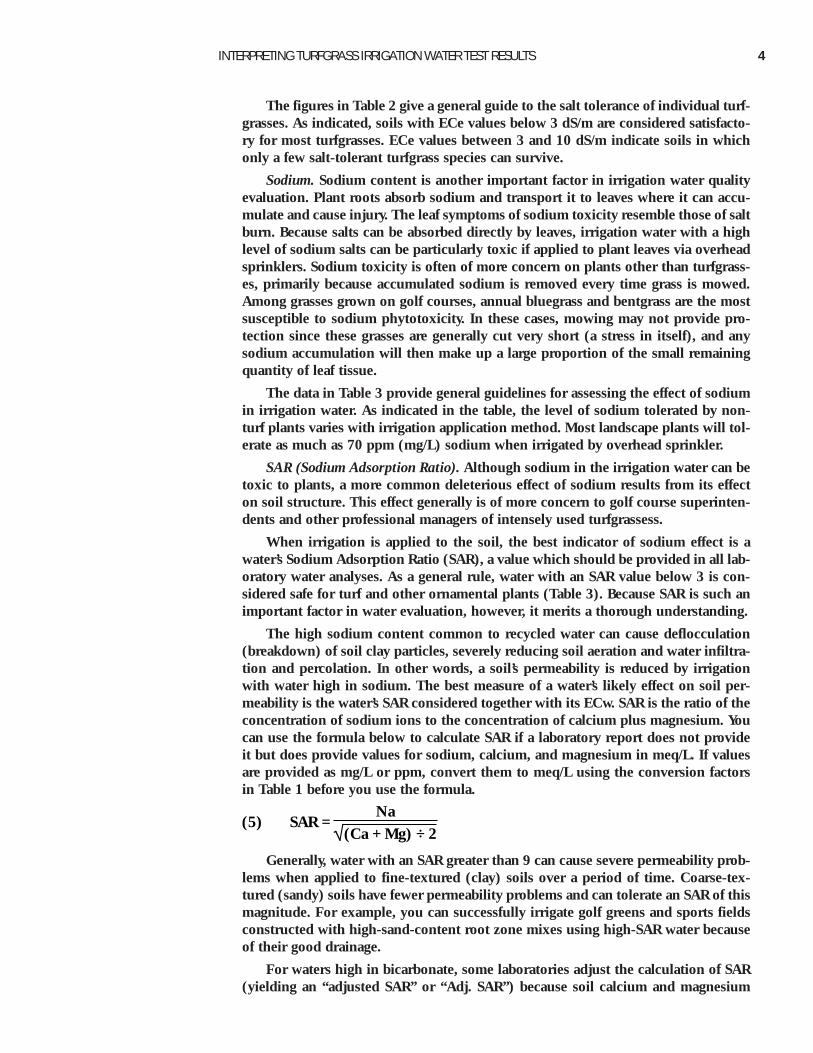
The high sodium content common to recycled water can cause deflocculation(breakdown) of soil clay particles, severely reducing soil aeration and water infiltra-tion and percolation. In other words, a soil’s permeability is reduced by irrigationwith water high in sodium. The best measure of a water’s likely effect on soil per-meability is the water’s SAR considered together with its ECw. SAR is the ratio of theconcentration of sodium ions to the concentration of calcium plus magnesium. Youcan use the formula below to calculate SAR if a laboratory report does not provideit but does provide values for sodium, calcium, and magnesium in meq/L. If valuesare provided as mg/L or ppm, convert them to meq/L using the conversion factorsin Table 1 before you use the formula.
INTERPRETING TURFGRASS IRRIGATION WATER TEST RESULTS 4
Generally, water with an SAR greater than 9 can cause severe permeability prob-lems when applied to fine-textured (clay) soils over a period of time. Coarse-tex-tured (sandy) soils have fewer permeability problems and can tolerate an SAR of thismagnitude. For example, you can successfully irrigate golf greens and sports fieldsconstructed with high-sand-content root zone mixes using high-SAR water becauseof their good drainage.
For waters high in bicarbonate, some laboratories adjust the calculation of SAR(yielding an “adjusted SAR” or “Adj. SAR”) because soil calcium and magnesium
(5) SAR = Na
( )Ca + Mg ÷ 2
concentrations are affected by the water’s bicarbonate. In simplest terms, Adj. SARreflects the water’s calcium, magnesium, sodium, and bicarbonate content as well asits total salinity. Other labs use a newer method to adjust the SAR value and reportthe adjusted value as Adj. RNa. Not all labs have adopted this new method, whichadjusts the SAR to account for either the precipitation or dissolution of calcium car-bonate, but the unadjusted SAR value is sufficient for our purposes.
Interaction of salinity and SAR. Salts and sodium do not act independently in theplant environment. The effects of sodium on soil particle dispersion (and thereforepermeability) are counteracted by a high electrolyte (soluble salts) concentration;therefore, one cannot assess a water’s sodium hazard independent of its salinity. Thecombined effect of water ECw and SAR on soil permeability is given in Table 3. Notethat the table provides general guidelines only. Soil properties, irrigation manage-ment, climate, a given plant’s salt tolerance, and cultural practices all interact sig-nificantly with water quality in the actual behavior of soils and plant growth.
Bicarbonate and carbonate. The bicarbonate content and, to a lesser degree, thecarbonate content of irrigation water also deserve careful evaluation. Recycledwaters and well waters are especially likely to contain excessive bicarbonate levels.Substantial bicarbonate levels in irrigation water can increase soil pH, and in com-bination with carbonate they may affect soil permeability. In addition, bicarbonatecontent may make itself obvious during hot, dry periods, when evaporation maycause white lime (CaCO3) deposits to appear on leaves of plants irrigated by over-head sprinklers.
Although high levels of bicarbonate in water can raise soil pH to undesirable lev-els, bicarbonate’s negative impact on soil permeability is often of greater concern. Asmentioned above, the bicarbonate ion may combine with calcium or magnesium andprecipitate as calcium carbonate or magnesium carbonate. This precipitationincreases the SAR in the soil solution because it lowers the dissolved calcium con-centration.
Table 3 indicates tolerable levels of bicarbonate in irrigation waters. The bicar-bonate hazard of water may be express as Residual Sodium Carbonate (RSC), calcu-lated thus
(6) RSC = (HCO3 + CO3) – (Ca + Mg)
where concentrations of ions are expressed in meq/L (see Equation 2 and Table 1 forconversions). Generally, water with an RSC value of 1.25 meq/L or lower is safe forirrigation, water with an RSC between 1.25 and 2.5 meq/L is marginal, and waterwith an RSC of 2.5 meq/L or more is probably not suitable for irrigation.
pH (hydrogen ion activity). The pH is a measure of water’s acidity or alkalinitymeasured in pH units. The scale ranges from 0 to 14, with pH 7 representing neu-tral—water with a pH of 7 is neither acidic nor alkaline. As it progresses from pH 7to pH 0, water becomes increasingly acidic; from pH 7 to pH 14, water becomesincreasingly basic (alkaline). The pH units are on a logarithmic scale: there is a ten-fold change between each whole pH number. Thus a water with pH 8 is 10 timesmore basic than a water with pH 7, and 100 times more basic than a water with pH6. Water pH is easy to determine and provides useful information about the water’schemical properties. Although seldom a problem in itself, a very high or very lowwater pH can be a warning that you need to evaluate the water for other con-stituents. The desirable soil pH for most turfgrasses ranges from 5.5 to 7.0; most irri-gation waters’ pH values, however, range from 6.5 to 8.4. Depending on the proper-
INTERPRETING TURFGRASS IRRIGATION WATER TEST RESULTS 5
ties of the soil where the grass is grown, an irrigation water pH range of 6.5 to 7would be most desirable. Water with a pH outside the desirable range must be care-fully evaluated for other chemical constituents.
Chloride. Besides contributing to the total soluble salt concentration of irriga-tion water, chloride (Cl) may be directly toxic to plants grown on a golf course, park,or other landscape site. Although chloride is not particularly toxic to turfgrasses,many trees, shrubs, and ground covers are quite sensitive to it.
Chloride is absorbed by plant roots and translocated to leaves where it accumu-lates. In sensitive plants this accumulation leads to necrosis: leaf margin scorch inminor cases, total leaf kill and abscission in severe cases. Similar symptoms mayoccur on sensitive plants if high-chloride water is applied via overhead sprinklers,since chloride can be absorbed by leaves as well as roots. Turfgrasses tolerate all butextremely high levels of chloride as long as they are regularly mowed.
Chloride salts are quite soluble, so they can be leached from well-drained soilswith good subsurface drainage. As indicated in Table 3, irrigation water with a chlo-ride content greater than 355 mg/L is toxic when absorbed by roots, while a chlo-ride content greater than 100 mg/L can damage sensitive ornamental plants ifapplied to foliage.
Boron. Boron (B) is an essential micronutrient for plant growth, though it isrequired in very small amounts. Even at concentrations as low as 1 to 2 mg/L in irri-gation water, it is phytotoxic to most ornamental plants and capable of causing leafburn (Table 3). The most obvious symptoms appear as a dark necrosis on the marginsof older leaves. Turfgrasses generally tolerate boron better than any other plants grownin a landscape, but they are more sensitive to boron toxicity than to either sodium orchloride. Most turfgrasses will grow in soils with boron levels as high as 10 ppm.
O T H E R PA R A M E T E R SChlorine. Irrigation water originating from municipal recycled water may containexcessive residual chlorine (Cl2), a potential plant toxin. Chlorine toxicity is almostalways associated only with recycled water sources, which are routinely disinfectedwith chlorine-containing compounds. Chlorine toxicity occurs only if high levels ofchlorine are sprayed directly onto foliage, a situation likely to occur only if the recy-cled water goes straight from the treatment plant to an overhead irrigation system.Free chlorine is very unstable in water, and it will dissipate quickly if the water isstored for even a short period of time between treatment and application to plants.As indicated in Table 3, residual chlorine is of concern at levels above 5 mg/L.
Nutrients. With the exception of municipal recycled water, the nutrient value ofmost irrigation waters is negligible. Recycled waters, however, always contain arange of micro (trace) elements sufficient to satisfy the needs of most turfgrasses.They may also contain enough macro (major) nutrients (nitrogen, phosphorus, andpotassium) to figure significantly in the fertilization program of a large turfed area.
Most laboratories test recycled water for nutrient content, and many reportnutrients in terms of “lb/acre-ft of water applied.” The economic value of thesenutrients can be substantial. Even where the quantities of nutrients are low, thenutrients can be used very efficiently by plants because they are applied on a regu-lar basis. If the laboratory report does not include the lb/acre-ft of nutrients, you canuse the following conversion formula to determine this value for any nutrient con-tained in the irrigation water:
(7) lb/acre-ft of nutrient = nutrient content (mg/L or ppm) × 2.72
INTERPRETING TURFGRASS IRRIGATION WATER TEST RESULTS 6
Suspended solids. The suspended solids (SS) in irrigation water are the inorgan-ic particles such as clay, silt, and other soil constituents, as well as organic mattersuch as plant material, algae, and bacteria. These materials do not dissolve in waterand can thus be removed only by filtration, an essential step for most irrigation sys-tems in which plugged sprinkler head openings or plugged valves can reduce a sys-tem’s efficiency and life span.
The suspended solids in domestic municipal water sources are negligible andnot a cause for concern. However, you should monitor suspended solids in well,lake, pond, canal, or recycled waters used for irrigation. Besides the mechanicalproblems they present for irrigation systems, suspended solids can seal a soil sur-face, especially on sand-based golf greens, sports fields, and other sandy media.Solids can fill in air spaces between sand particles, reducing infiltration and drainageand increasing compaction. Since these effects vary considerably with the type ofsuspended solid, the irrigation system, and the turfgrass soil, it is difficult to for-mulate general acceptable values for suspended solids in irrigation water. Generalconsensus says that an SS level below 50 mg/L is safe for a drip irrigation systemwhile values above 100 mg/L will cause plugging, but the complexity and variabili-ty of irrigation waters and systems make effective filtration the most sensibleapproach to controlling hazards posed by suspended solids.
Turbidity. Another factor, turbidity, measures the transmission of light throughwater with respect to matter suspended in the water. This measurement frequentlyappears in laboratory results, especially in analyses of recycled water, and it is animportant tool in determining the quality of domestic and recycled water. It is not auseful tool for evaluating irrigation water, primarily because there are no uniformguidelines for acceptable turbidity values for irrigation water.
S A M P L I N G I R R I G AT I O N W AT E R The results of a laboratory water test are only as good—and therefore only as use-ful—as the water sample tested. Thus, a tested sample must be truly representativeof the irrigation water applied. Poor or contaminated samples result in misleadingevaluations. Since the few ounces of water finally tested represent a tiny fraction ofthe millions of gallons of water eventually used to irrigate a golf course, cemetery, orpark, getting a good sample can be trickier than it may at first appear.
There are no strict rules for sampling water. Equal attention is due, however, tothe sampling equipment, timing, location, and handling of the sample. Some labo-ratories provide instructions on what type of containers to use for sampling and theamount of water needed for a sample. If no instructions are available from the lab,use clean plastic bottles rather than glass since some glass bottles may be a sourceof boron. Also, plastic bottles reduce the chance of breakage during transfer. Alwaysuse a clean bottle; if unsure of its cleanliness, wash the bottle thoroughly first, usingthe water to be sampled.
Label the bottles immediately after sampling. Use permanent ink and good qual-ity labels. Record the time, date, and location of sampling. Make sure each samplebottle is tightly closed.
A water sample should represent the water actually applied to plants. Thus, forexample, you should collect water from sprinklers while they are operating.Similarly, the quality of water stored in ponds or lakes may change over time, par-ticularly if the water has been recycled or if it is held for an extended period duringhot weather, so sampling must take this into account. Water quality may also vary
INTERPRETING TURFGRASS IRRIGATION WATER TEST RESULTS 7

from season to season, so it may be appropriate to take samples for analysis at dif-ferent times of year.
I N T E R P R E T I N G W AT E R Q U A L I T Y H A Z A R D SClearly, water quality involves a complex set of factors and each irrigation watermust be analyzed on an individual basis. Very few water sources are absolutelyunsuitable for turfgrass irrigation. While you can use the discussion in this publica-tion as a general guide to help you determine whether you have a turfgrass waterquality problem, any determination of the precise nature and magnitude of thatproblem may require more than just water analysis. Climate, soil chemistry andphysics, use patterns, and turf quality expectations all contribute both to any prob-lem and to any potential remedies in turfgrass water quality.
F O R M O R E I N F O R M AT I O NYou’ll find detailed information on many aspects of turfgrass and landscape care inthese UC ANR publications:
Effluent Water for Turfgrass Irrigation, publication 21500Evaluating Turfgrass Sprinkler Irrigation Systems, publication 21503Managing Turfgrasses during Drought, publication 21499Turfgrass Evapotranspiration Map: The Central Coast of California, publica-tion 21491Turfgrass Water Conservation, publication 21405UC IPM Pest Management Guidelines for Turfgrass, publication 3365-T
Also of interest:Grower’s Weed Identification Handbook, publication 4030Weeds of the West, publication 3350
To order these publications, visit our online catalog at http://anrcatalog.ucdavis.edu.You can also place orders by mail, phone, or fax, or request a printed catalog of pub-lications, slide sets, and videos from
University of CaliforniaDivision of Agriculture and Natural ResourcesCommunication Services6701 San Pablo Avenue, 2nd FloorOakland, California 94608-1239
Telephone: 1-800-994-8849 or (510) 642-2431, FAX: (510) 643-5470e-mail inquiries: [email protected] us on the World Wide Web: http://anrcatalog.ucdavis.edu
INTERPRETING TURFGRASS IRRIGATION WATER TEST RESULTS 8
An electronic version of this publication is available on the ANR Communication Services website at http://anrcatalog.ucdavis.edu.
Publication 8009
©1999 by the Regents of the University of California, Division of Agriculture and Natural Resources.All rights reserved.
The University of California prohibits discrimination against or harassment of any person employed byor seeking employment with the University on the basis of race, color, national origin, religion, sex,physical or mental disability, medical condition (cancer-related or genetic characteristics), ancestry,marital status, age, sexual orientation, citizenship, or status as a covered veteran (special disabled vet-eran, Vietnam-era veteran or any other veteran who served on active duty during a war or in a cam-paign or expedition for which a campaign badge has been authorized).
University Policy is intended to be consistent with the provisions of applicable State and Federal laws.
Inquiries regarding the University’s nondiscrimination policies may be directed to the AffirmativeAction/Staff Personnel Services Director, University of California, Agriculture and Natural Resources,1111 Franklin Street, 6th Floor, Oakland, CA 94607-5200 (510) 987-0096.
pr-12/99-WJC
INTERPRETING TURFGRASS IRRIGATION WATER TEST RESULTS 9


