Integrated Nutrient Management on
Productivity and Soil Fertility in Rice-based
Cropping System
Presented ByBiplab choudhariM.Sc. (Agril.) final year.AAU Jorhat-13
DEPARTMENT OF SOIL SCIENCE AAU JORHAT -13
Introduction Maintenance of soil health is an essential prerequisite for sustaining
crop productivity.
Intensive agriculture with high nutrient turn over in soil –plantsystem coupled with low and imbalanced fertilizer use results indeterioration of soil fertility and crop production.
In order to overcome this problem, alternative strategies areneeded so that soil degradation as well as soil fertility level can bemanaged for sustainable productivity.
It is widely recognized that neither use of organic manures alonenor chemical fertilizers can achieve the sustainability of crop yieldat desired level under the modern intensive farming
The integrated plant nutrient-supply system is emerging as the most
logical concept for managing long-term soil fertility and
productivity.
Integrated use of organic manures and chemical fertilizers has been
found promising in arresting the decline in productivity through the
correction of marginal deficiencies of some secondary and
micronutrient elements and their beneficial inf1uence on the
physical and biological properties of the soil.
Integrated nutrient-management system can bring about an
equilibrium between degenerative and restorative activities in the
soil environment
Hence adoption of integrated plant nutrient management strategies
for enhancing soil quality, input use efficiency and crop productivity is
extremely important for food and nutritional security in Indian
agriculture.
Integrated Nutrient Management is a practice where all sources
of nutrients namely organic ,inorganic (chemical fertilizer),
biofertilizer can be combined and applied to soils so that crop
growth is enhanced and we can get good yield with quality
product .
In INM it integrates/combines the objectives of production with
ecology and environment, that is, optimum crop nutrition,
optimum functioning of the soil health, and minimum nutrient
losses or other adverse effect on the environment.
Integrated Nutrient Management (INM) has to be considered
an integral part of any sustainable agricultural system.
WHAT IS INM
The basic concept of INM system is the maintenance of plantnutrients supply to achieve a given level of crop production byoptimizing the benefits from all possible sources of plant nutrients inan integrated manner, appropriate to each cropping system andfarming situation (Mahajan and Sharma, 2005; Subba Rao, A. andSammi Reddy, A. 2005).
One major task of INM system will be to at least stop theongoing loss of surface or top soil nutrients (Mahajan and Sharma,2005)
Concept of INM

Concept and principles of INM
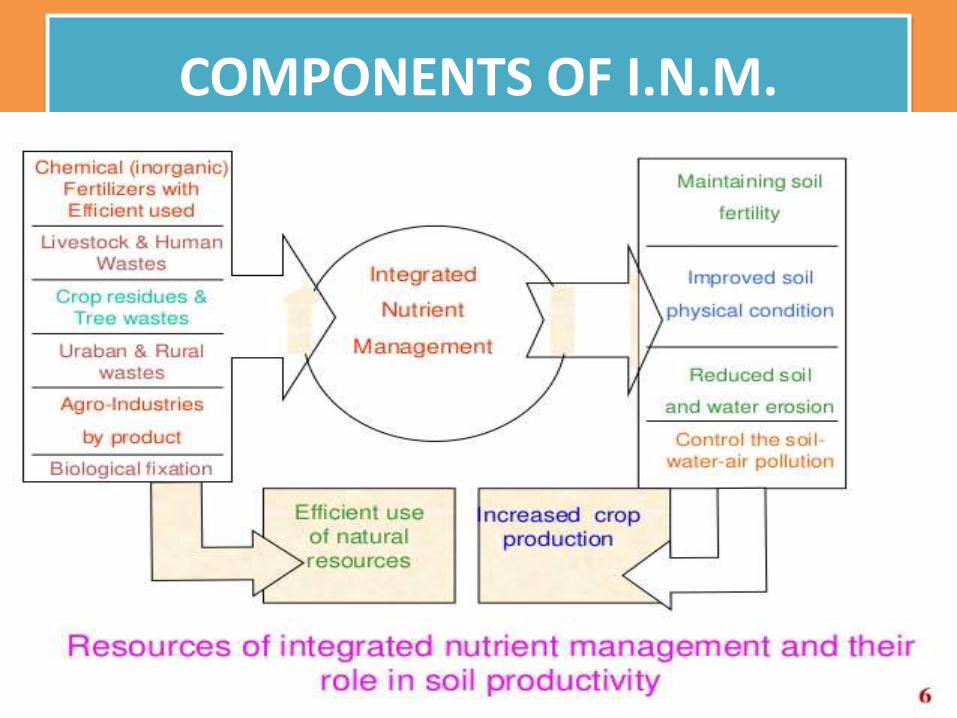
COMPONENTS OF I.N.M.
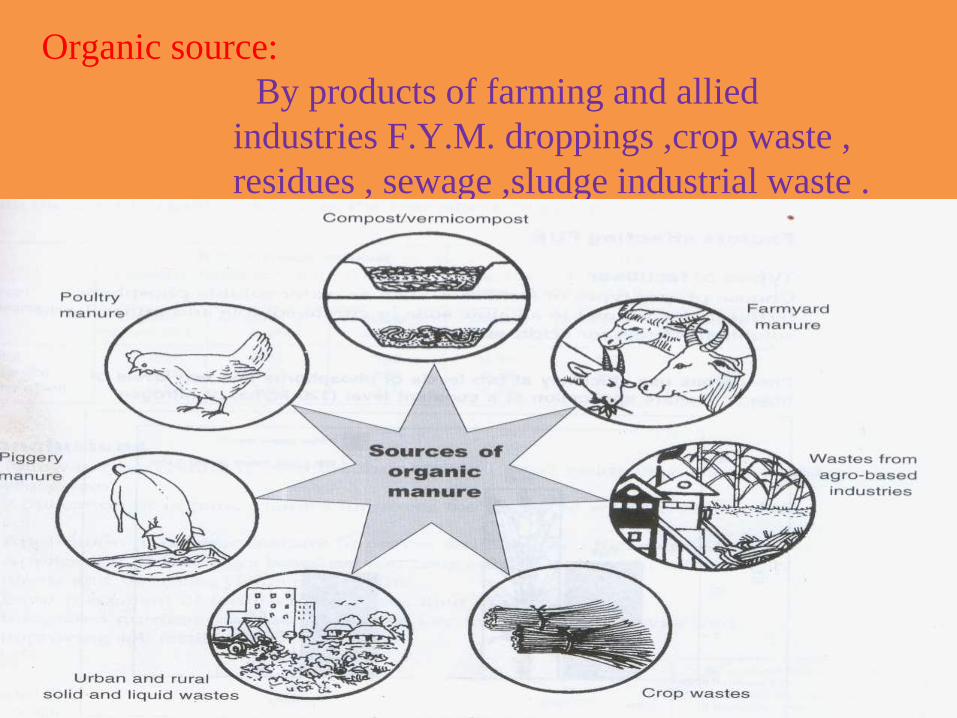
Organic source:
By products of farming and allied
industries F.Y.M. droppings ,crop waste ,
residues , sewage ,sludge industrial waste .
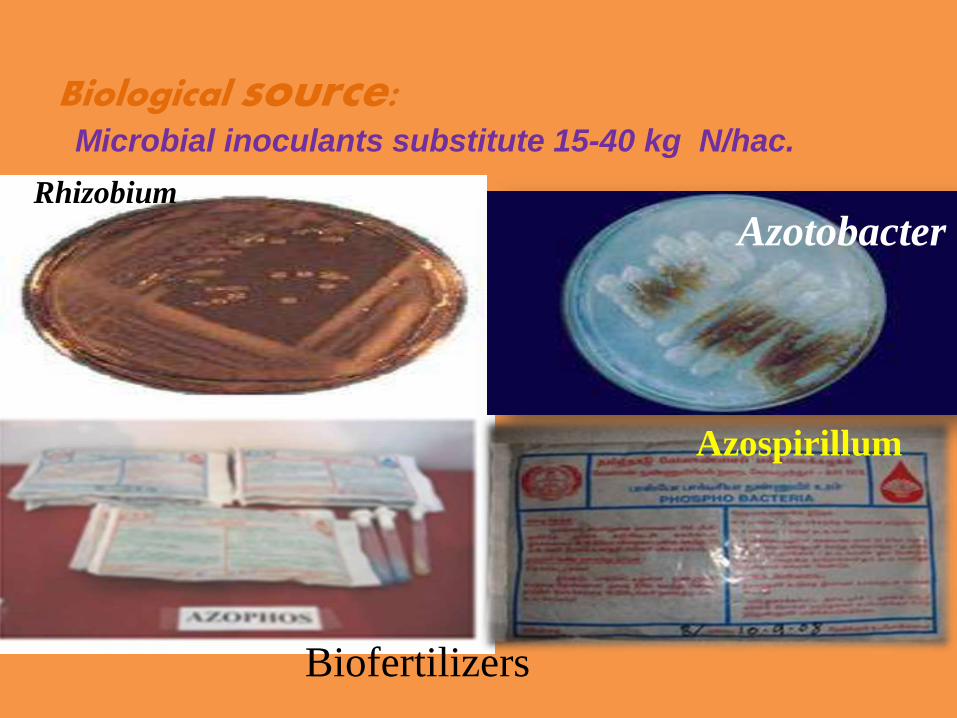
Biological source:Microbial inoculants substitute 15-40 kg N/hac.
Biofertilizers
Rhizobium
Azotobacter
Azospirillum
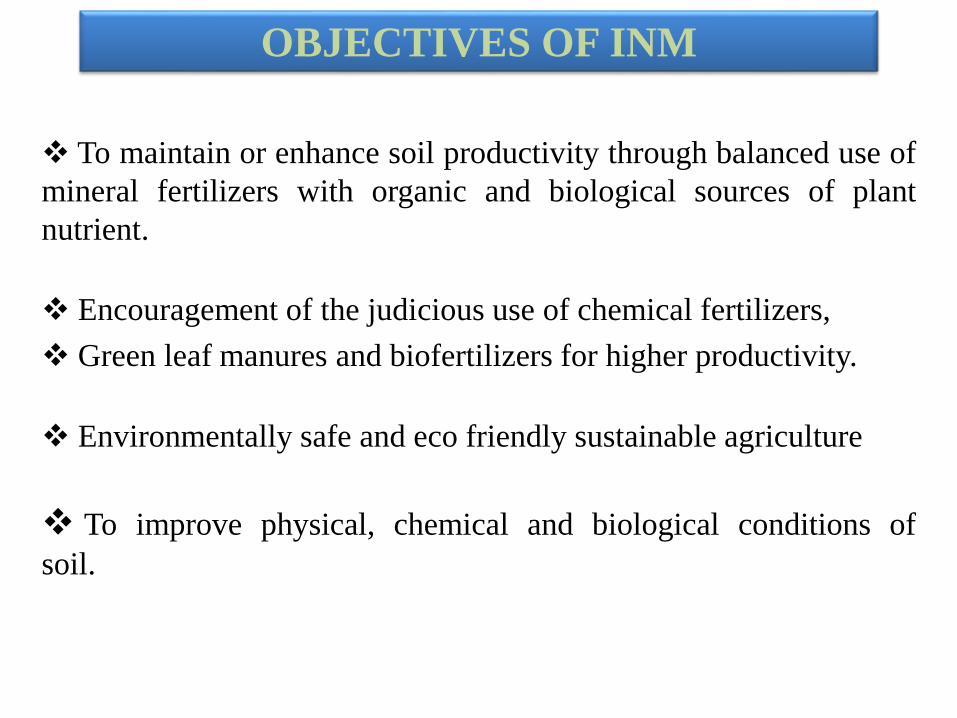
OBJECTIVES OF INM
To maintain or enhance soil productivity through balanced use of
mineral fertilizers with organic and biological sources of plant
nutrient.
Encouragement of the judicious use of chemical fertilizers,
Green leaf manures and biofertilizers for higher productivity.
Environmentally safe and eco friendly sustainable agriculture
To improve physical, chemical and biological conditions of
soil.
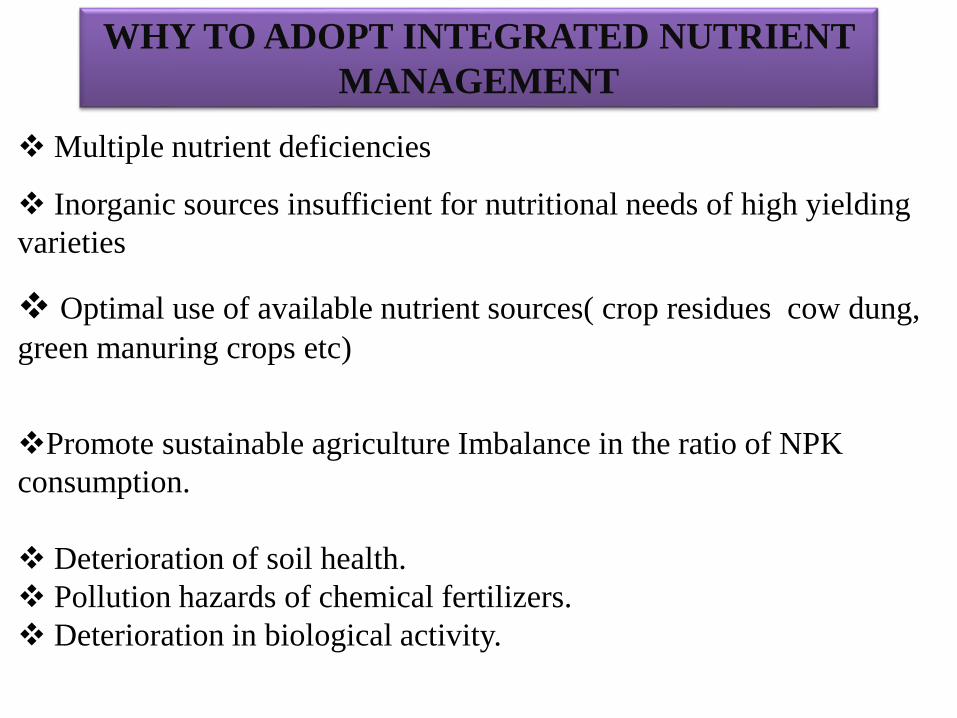
WHY TO ADOPT INTEGRATED NUTRIENT
MANAGEMENT
Multiple nutrient deficiencies
Inorganic sources insufficient for nutritional needs of high yielding
varieties
Optimal use of available nutrient sources( crop residues cow dung,
green manuring crops etc)
Promote sustainable agriculture Imbalance in the ratio of NPK
consumption.
Deterioration of soil health.
Pollution hazards of chemical fertilizers.
Deterioration in biological activity.
Promising treatments
Grain yield (t/ha)
1984-87 1990-93 1996-99 2000-03
Rice
Control 2.00 1.54 1.20 1.25
R100W100 3.94 4.37 3.96 3.43
R50+50FYMW100 2.99 4.47 4.27 3.53
R50+50WCS W100 3.41 4.19 3.47 3.04
R50+50GM W100 3.23 4.34 3.89 3.25
Wheat
Control 1.30 0.74 0.64 0.71
R100 W100 3.42 3.25 3.53 3.64
R50+50FYM W100 3.41 3.45 3.88 3.71
R50+50WCS W100 3.04 2.99 3.26 3.21
R50+50GM W100 3.16 3.03 3.47 3.50
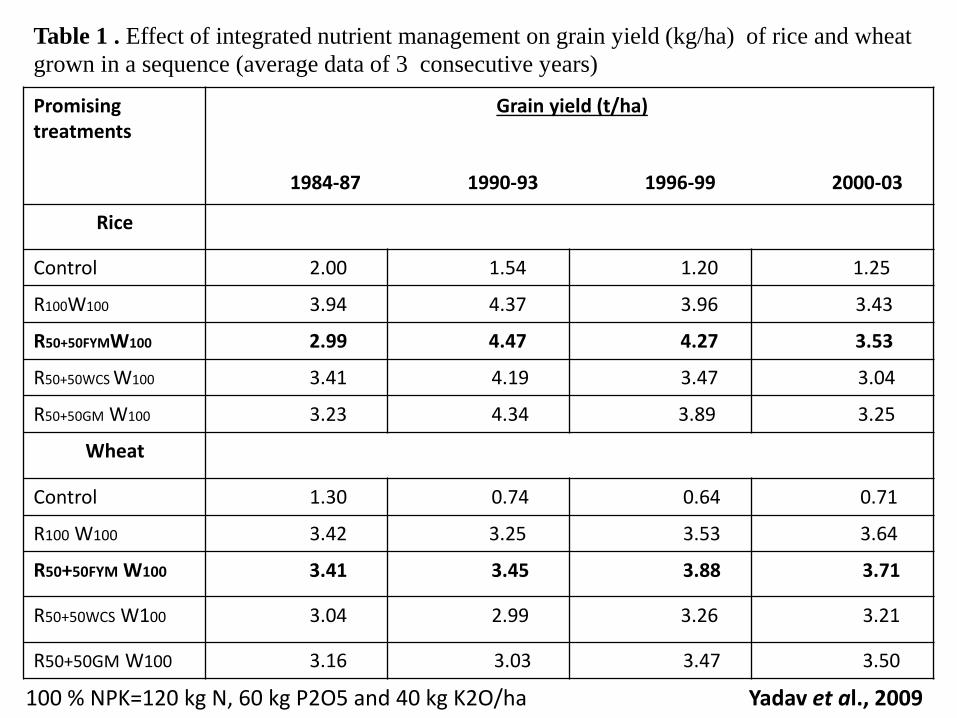
Table 1 . Effect of integrated nutrient management on grain yield (kg/ha) of rice and wheat
grown in a sequence (average data of 3 consecutive years)
100 % NPK=120 kg N, 60 kg P2O5 and 40 kg K2O/ha Yadav et al., 2009
Treatments pH (1:2.5) EC (1:2.5)(dS/m)
ESP BD (Mg/m3)
Org. C
(Mg/kg)
CEC
(c.mol
(p+)/kg
Control 8.4 0.36 17 1.51 2.9 15.9
R75 W75 8.2 0.33 21 1.46 4.2 16.5
R100 W100 8.0 0.32 18 1.43 4.6 17.4
R50+50FYMW100 7.7 0.25 12 1.35 5.7 18.9
R50+50WCS W100 7.8 0.28 16 1.36 5.4 18.3
R50+50GM W100 7.6 0.22 9 1.33 5.8 19.5
Initial status in 1984 8.8 0.50 27 1.38 3.7 17.1
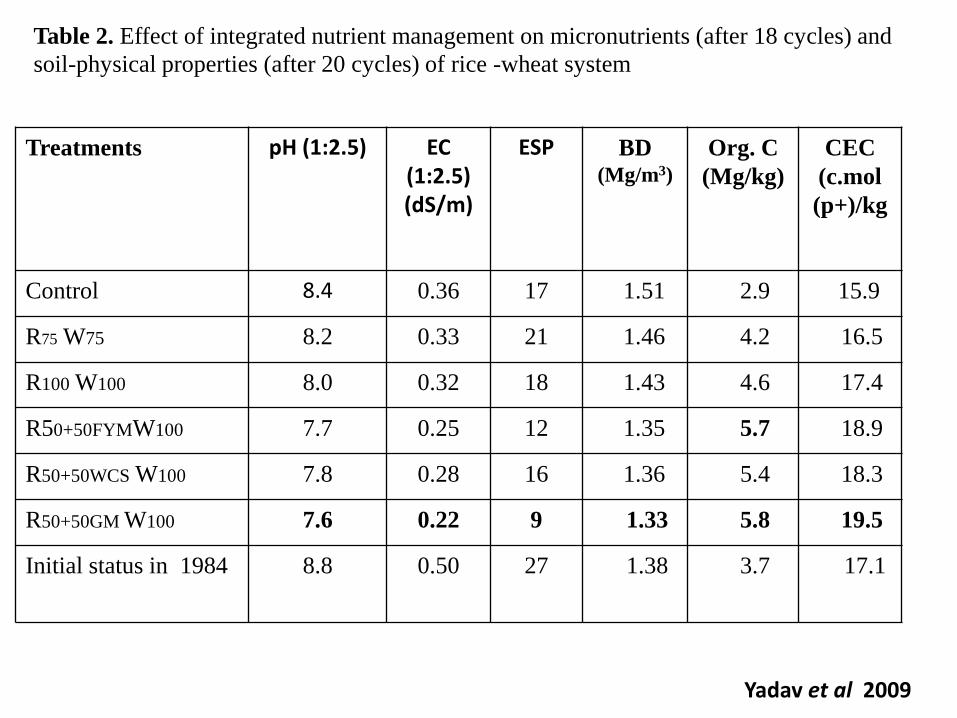
Table 2. Effect of integrated nutrient management on micronutrients (after 18 cycles) and
soil-physical properties (after 20 cycles) of rice -wheat system
Yadav et al 2009
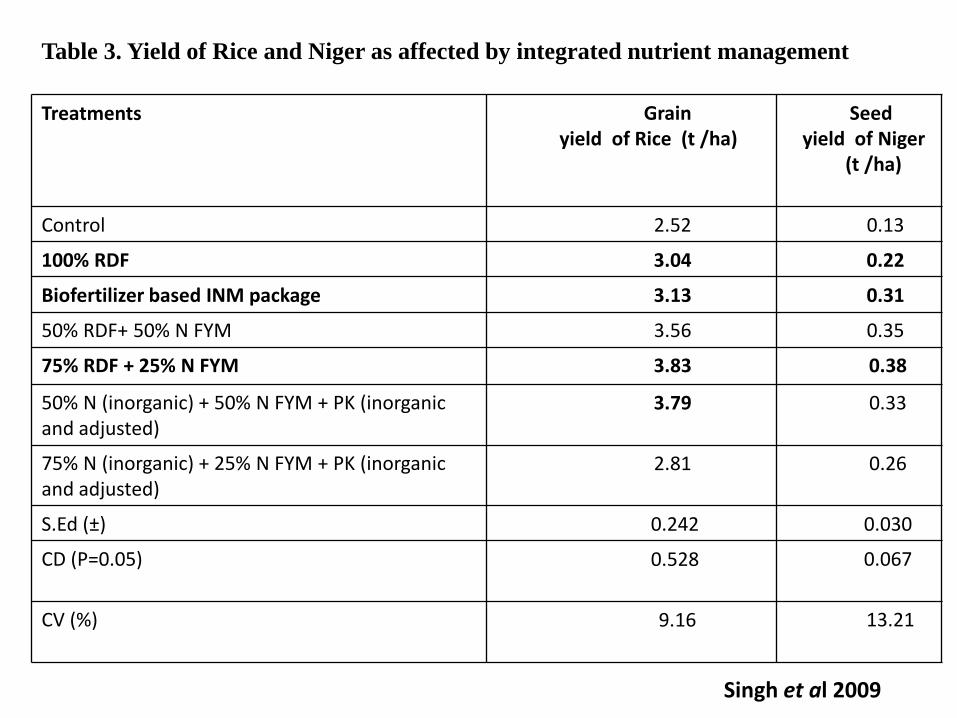
Treatments Grain yield of Rice (t /ha)
Seed yield of Niger
(t /ha)
Control 2.52 0.13
100% RDF 3.04 0.22
Biofertilizer based INM package 3.13 0.31
50% RDF+ 50% N FYM 3.56 0.35
75% RDF + 25% N FYM 3.83 0.38
50% N (inorganic) + 50% N FYM + PK (inorganic and adjusted)
3.79 0.33
75% N (inorganic) + 25% N FYM + PK (inorganic and adjusted)
2.81 0.26
S.Ed (±) 0.242 0.030
CD (P=0.05) 0.528 0.067
CV (%) 9.16 13.21
Table 3. Yield of Rice and Niger as affected by integrated nutrient management
Singh et al 2009
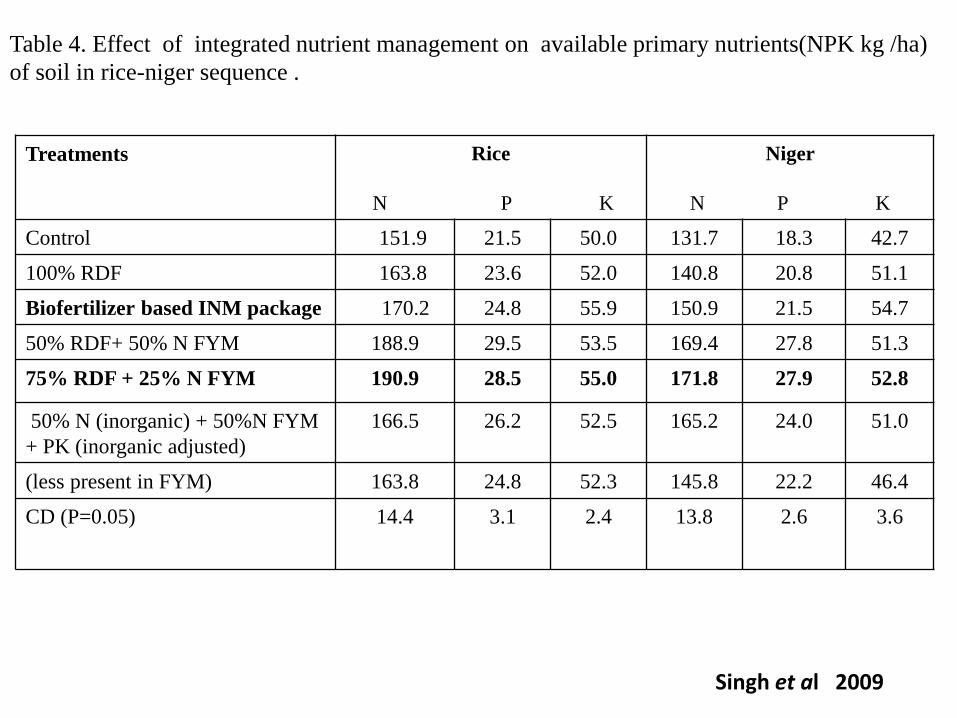
Treatments Rice
N P K
Niger
N P K
Control 151.9 21.5 50.0 131.7 18.3 42.7
100% RDF 163.8 23.6 52.0 140.8 20.8 51.1
Biofertilizer based INM package 170.2 24.8 55.9 150.9 21.5 54.7
50% RDF+ 50% N FYM 188.9 29.5 53.5 169.4 27.8 51.3
75% RDF + 25% N FYM 190.9 28.5 55.0 171.8 27.9 52.8
50% N (inorganic) + 50%N FYM
+ PK (inorganic adjusted)
166.5 26.2 52.5 165.2 24.0 51.0
(less present in FYM) 163.8 24.8 52.3 145.8 22.2 46.4
CD (P=0.05) 14.4 3.1 2.4 13.8 2.6 3.6
Table 4. Effect of integrated nutrient management on available primary nutrients(NPK kg /ha)
of soil in rice-niger sequence .
Singh et al 2009
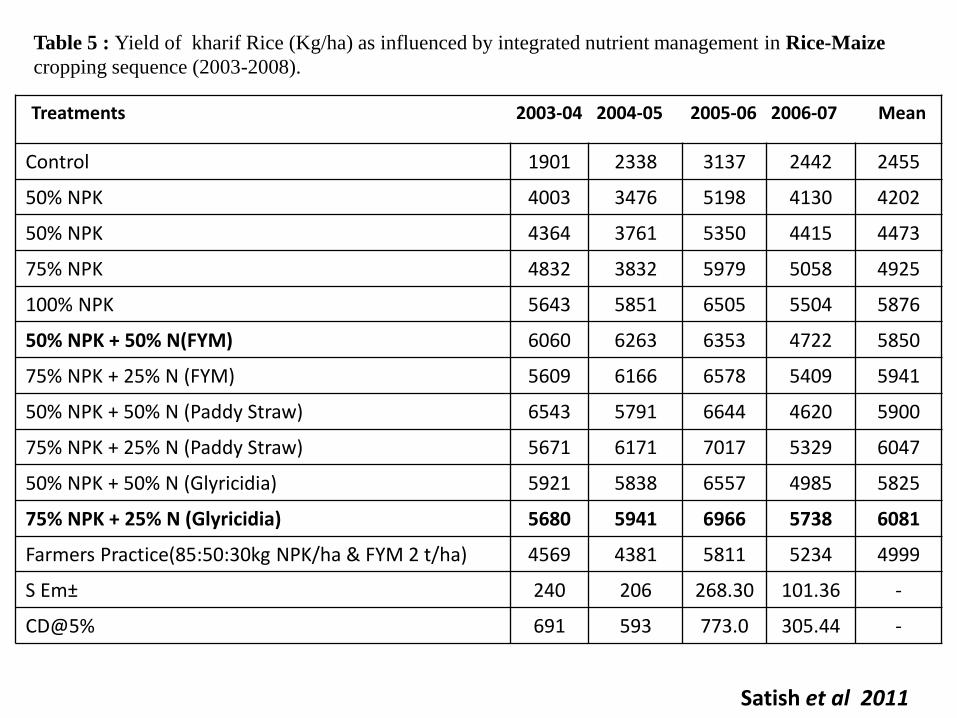
Treatments 2003-04 2004-05 2005-06 2006-07 Mean
Control 1901 2338 3137 2442 2455
50% NPK 4003 3476 5198 4130 4202
50% NPK 4364 3761 5350 4415 4473
75% NPK 4832 3832 5979 5058 4925
100% NPK 5643 5851 6505 5504 5876
50% NPK + 50% N(FYM) 6060 6263 6353 4722 5850
75% NPK + 25% N (FYM) 5609 6166 6578 5409 5941
50% NPK + 50% N (Paddy Straw) 6543 5791 6644 4620 5900
75% NPK + 25% N (Paddy Straw) 5671 6171 7017 5329 6047
50% NPK + 50% N (Glyricidia) 5921 5838 6557 4985 5825
75% NPK + 25% N (Glyricidia) 5680 5941 6966 5738 6081
Farmers Practice(85:50:30kg NPK/ha & FYM 2 t/ha) 4569 4381 5811 5234 4999
S Em± 240 206 268.30 101.36 -
CD@5% 691 593 773.0 305.44 -
Table 5 : Yield of kharif Rice (Kg/ha) as influenced by integrated nutrient management in Rice-Maize
cropping sequence (2003-2008).
Satish et al 2011
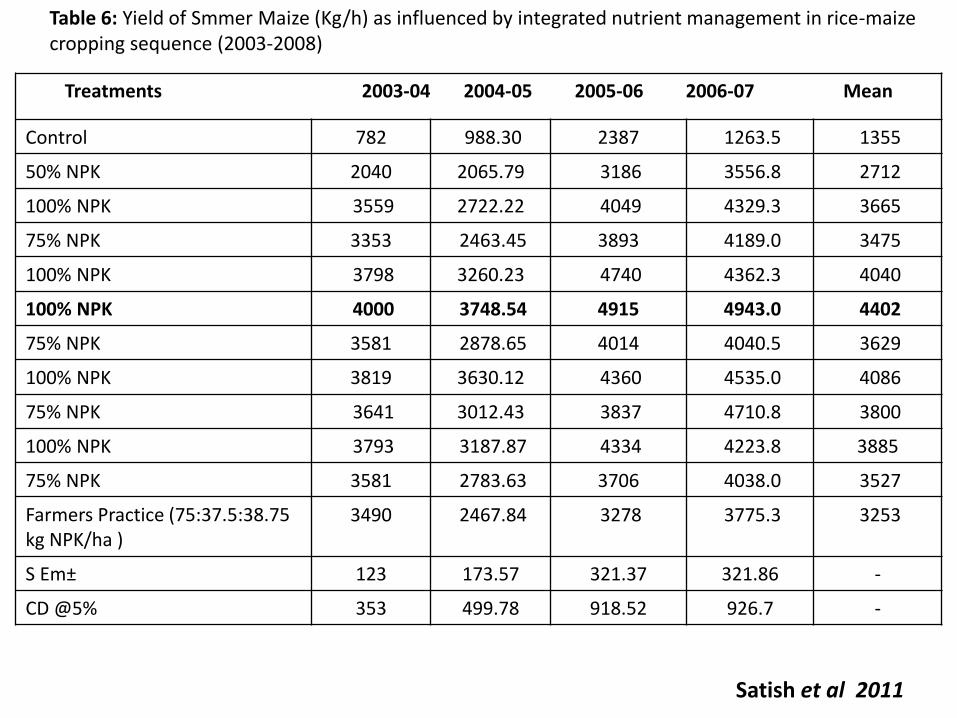
Treatments 2003-04 2004-05 2005-06 2006-07 Mean
Control 782 988.30 2387 1263.5 1355
50% NPK 2040 2065.79 3186 3556.8 2712
100% NPK 3559 2722.22 4049 4329.3 3665
75% NPK 3353 2463.45 3893 4189.0 3475
100% NPK 3798 3260.23 4740 4362.3 4040
100% NPK 4000 3748.54 4915 4943.0 4402
75% NPK 3581 2878.65 4014 4040.5 3629
100% NPK 3819 3630.12 4360 4535.0 4086
75% NPK 3641 3012.43 3837 4710.8 3800
100% NPK 3793 3187.87 4334 4223.8 3885
75% NPK 3581 2783.63 3706 4038.0 3527
Farmers Practice (75:37.5:38.75 kg NPK/ha )
3490 2467.84 3278 3775.3 3253
S Em± 123 173.57 321.37 321.86 -
CD @5% 353 499.78 918.52 926.7 -
Table 6: Yield of Smmer Maize (Kg/h) as influenced by integrated nutrient management in rice-maize cropping sequence (2003-2008)
Satish et al 2011
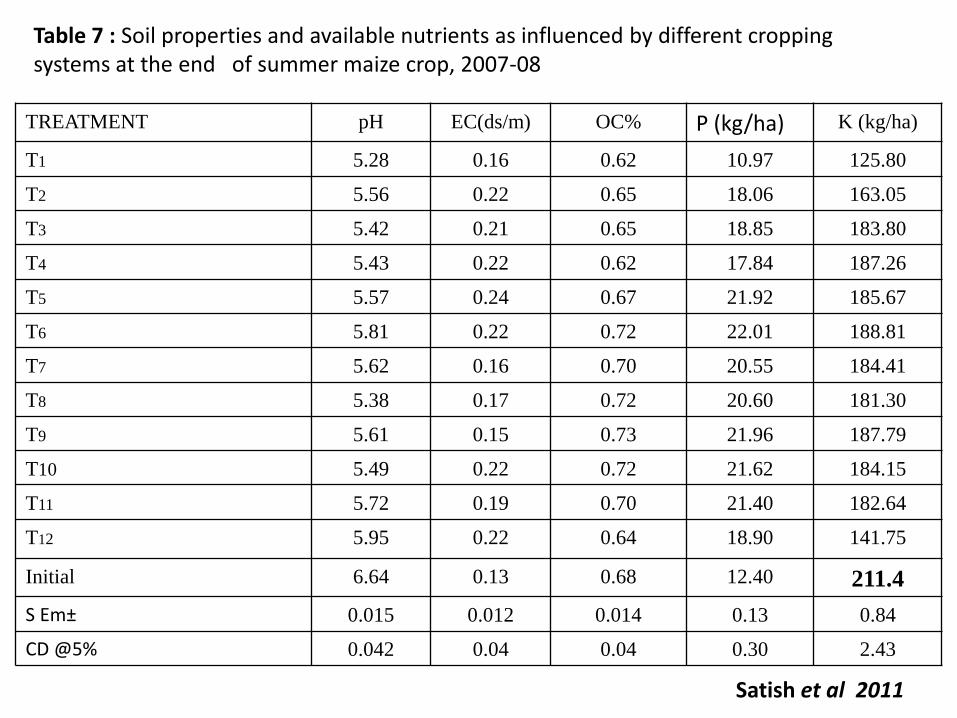
TREATMENT pH EC(ds/m) OC% P (kg/ha) K (kg/ha)
T1 5.28 0.16 0.62 10.97 125.80
T2 5.56 0.22 0.65 18.06 163.05
T3 5.42 0.21 0.65 18.85 183.80
T4 5.43 0.22 0.62 17.84 187.26
T5 5.57 0.24 0.67 21.92 185.67
T6 5.81 0.22 0.72 22.01 188.81
T7 5.62 0.16 0.70 20.55 184.41
T8 5.38 0.17 0.72 20.60 181.30
T9 5.61 0.15 0.73 21.96 187.79
T10 5.49 0.22 0.72 21.62 184.15
T11 5.72 0.19 0.70 21.40 182.64
T12 5.95 0.22 0.64 18.90 141.75
Initial 6.64 0.13 0.68 12.40 211.4
S Em± 0.015 0.012 0.014 0.13 0.84
CD @5% 0.042 0.04 0.04 0.30 2.43
Satish et al 2011
Table 7 : Soil properties and available nutrients as influenced by different cropping systems at the end of summer maize crop, 2007-08
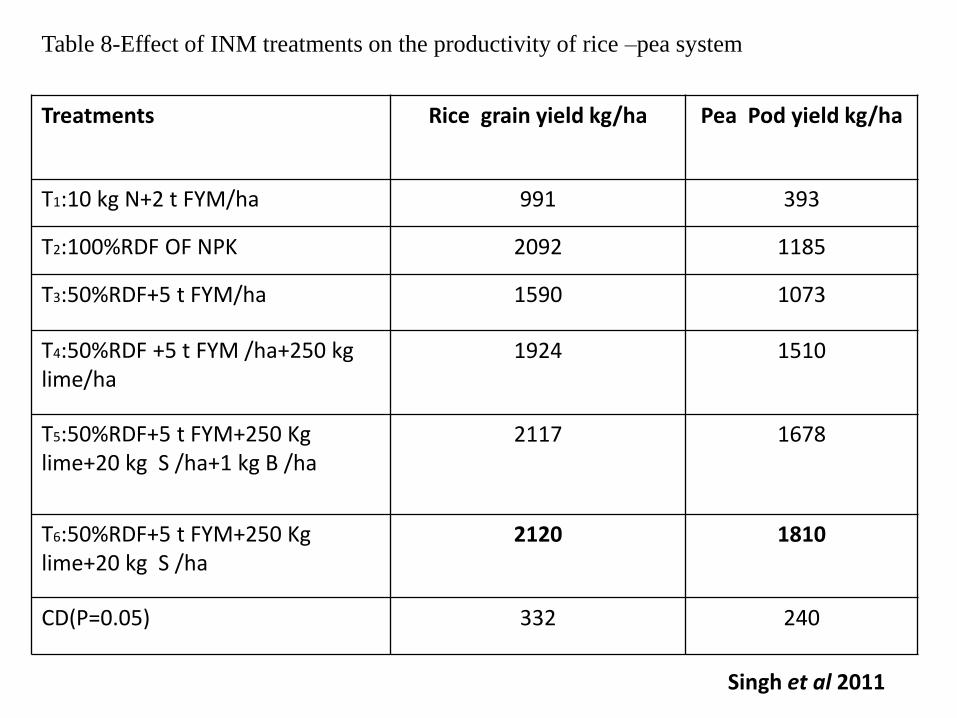
Treatments Rice grain yield kg/ha Pea Pod yield kg/ha
T1:10 kg N+2 t FYM/ha 991 393
T2:100%RDF OF NPK 2092 1185
T3:50%RDF+5 t FYM/ha 1590 1073
T4:50%RDF +5 t FYM /ha+250 kg lime/ha
1924 1510
T5:50%RDF+5 t FYM+250 Kg lime+20 kg S /ha+1 kg B /ha
2117 1678
T6:50%RDF+5 t FYM+250 Kg lime+20 kg S /ha
2120 1810
CD(P=0.05) 332 240
Table 8-Effect of INM treatments on the productivity of rice –pea system
Singh et al 2011
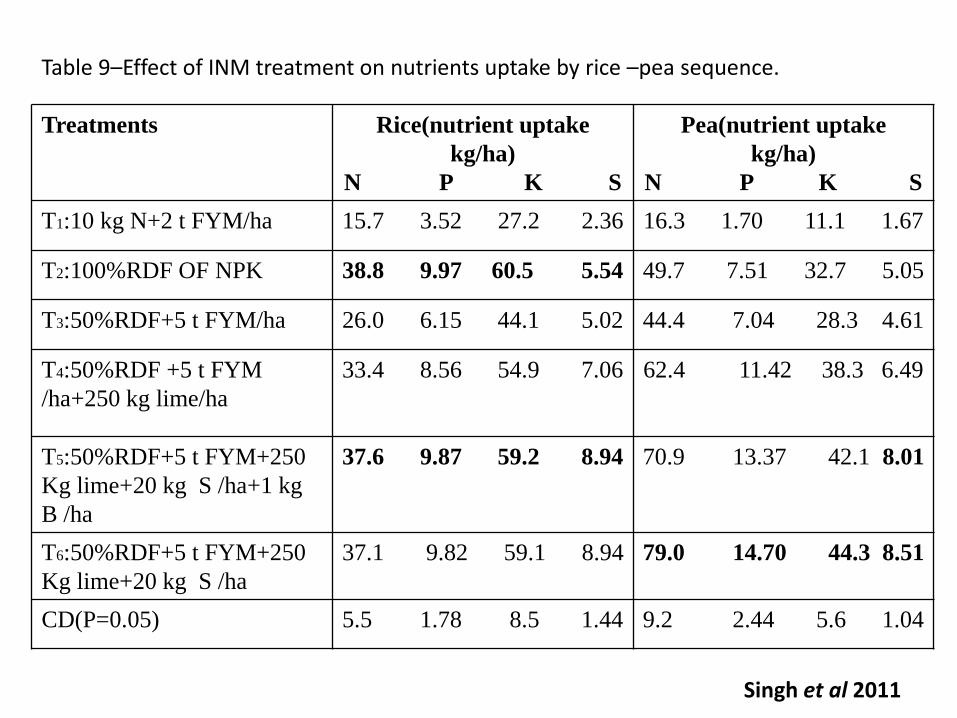
Treatments Rice(nutrient uptake
kg/ha)
N P K S
Pea(nutrient uptake
kg/ha)
N P K S
T1:10 kg N+2 t FYM/ha 15.7 3.52 27.2 2.36 16.3 1.70 11.1 1.67
T2:100%RDF OF NPK 38.8 9.97 60.5 5.54 49.7 7.51 32.7 5.05
T3:50%RDF+5 t FYM/ha 26.0 6.15 44.1 5.02 44.4 7.04 28.3 4.61
T4:50%RDF +5 t FYM
/ha+250 kg lime/ha
33.4 8.56 54.9 7.06 62.4 11.42 38.3 6.49
T5:50%RDF+5 t FYM+250
Kg lime+20 kg S /ha+1 kg
B /ha
37.6 9.87 59.2 8.94 70.9 13.37 42.1 8.01
T6:50%RDF+5 t FYM+250
Kg lime+20 kg S /ha
37.1 9.82 59.1 8.94 79.0 14.70 44.3 8.51
CD(P=0.05) 5.5 1.78 8.5 1.44 9.2 2.44 5.6 1.04
Table 9–Effect of INM treatment on nutrients uptake by rice –pea sequence.
Singh et al 2011
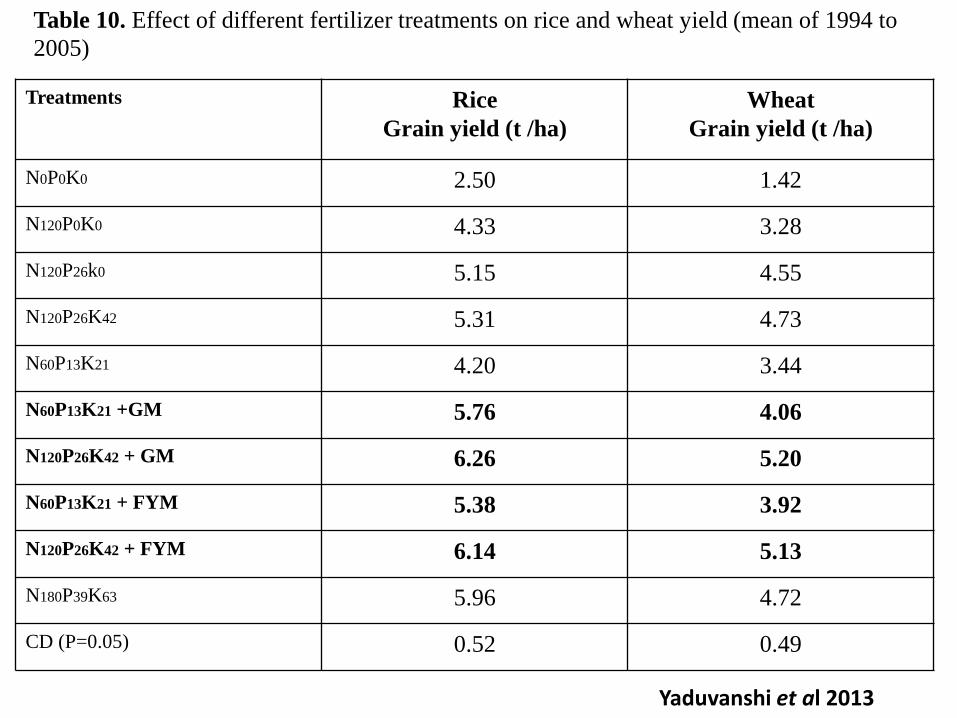
Treatments Rice
Grain yield (t /ha)
Wheat
Grain yield (t /ha)
N0P0K0 2.50 1.42
N120P0K0 4.33 3.28
N120P26k0 5.15 4.55
N120P26K42 5.31 4.73
N60P13K21 4.20 3.44
N60P13K21 +GM 5.76 4.06
N120P26K42 + GM 6.26 5.20
N60P13K21 + FYM 5.38 3.92
N120P26K42 + FYM 6.14 5.13
N180P39K63 5.96 4.72
CD (P=0.05) 0.52 0.49
Table 10. Effect of different fertilizer treatments on rice and wheat yield (mean of 1994 to
2005)
Yaduvanshi et al 2013
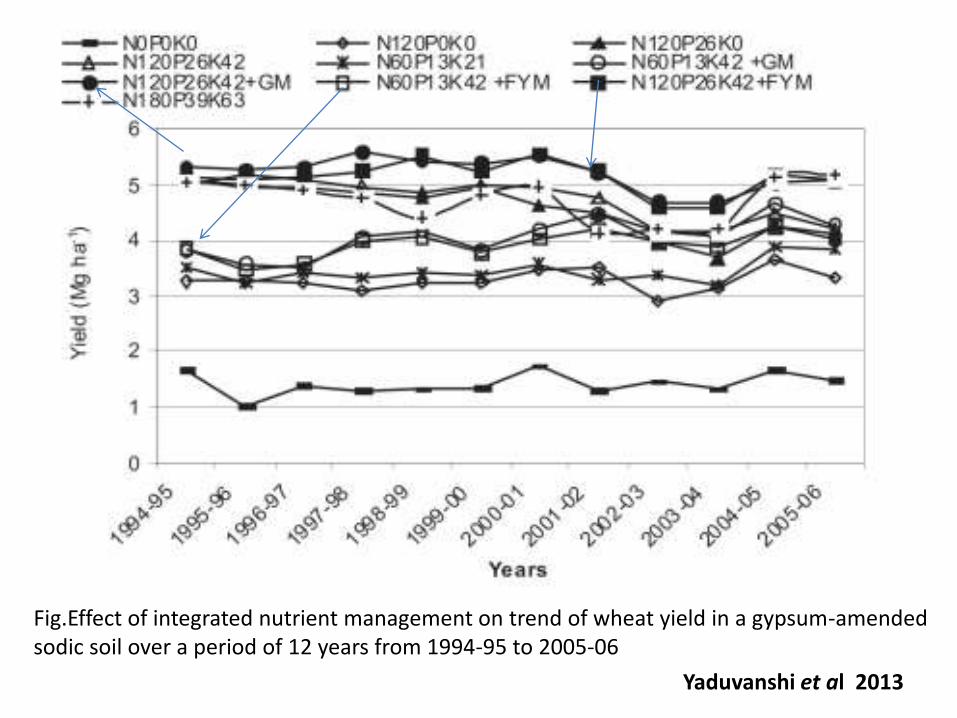
Fig.Effect of integrated nutrient management on trend of wheat yield in a gypsum-amended sodic soil over a period of 12 years from 1994-95 to 2005-06
Yaduvanshi et al 2013
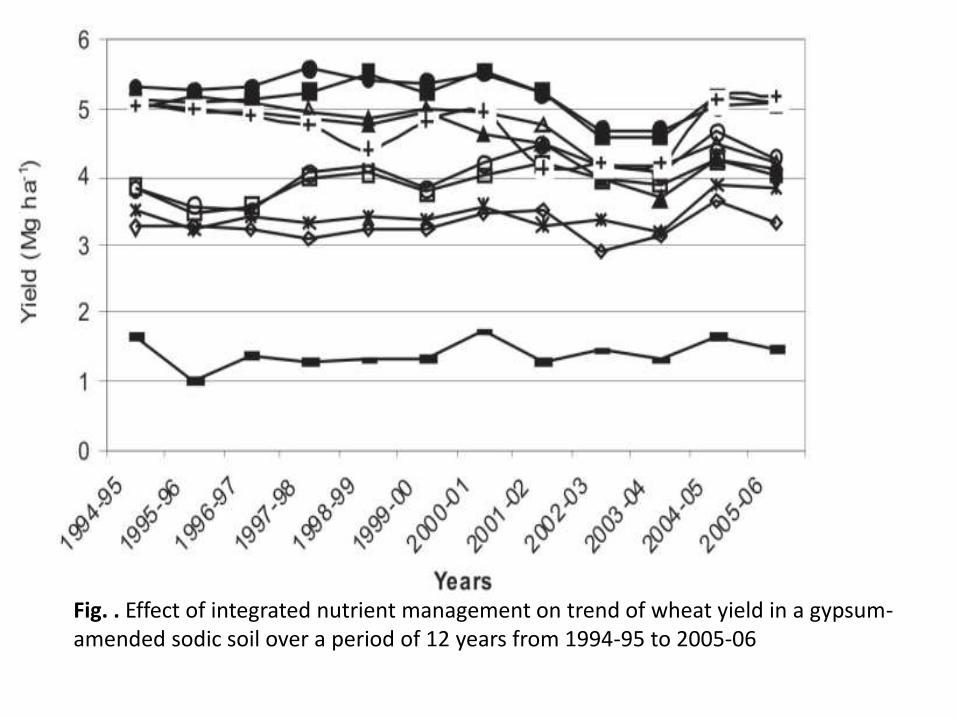
Fig. . Effect of integrated nutrient management on trend of wheat yield in a gypsum-amended sodic soil over a period of 12 years from 1994-95 to 2005-06
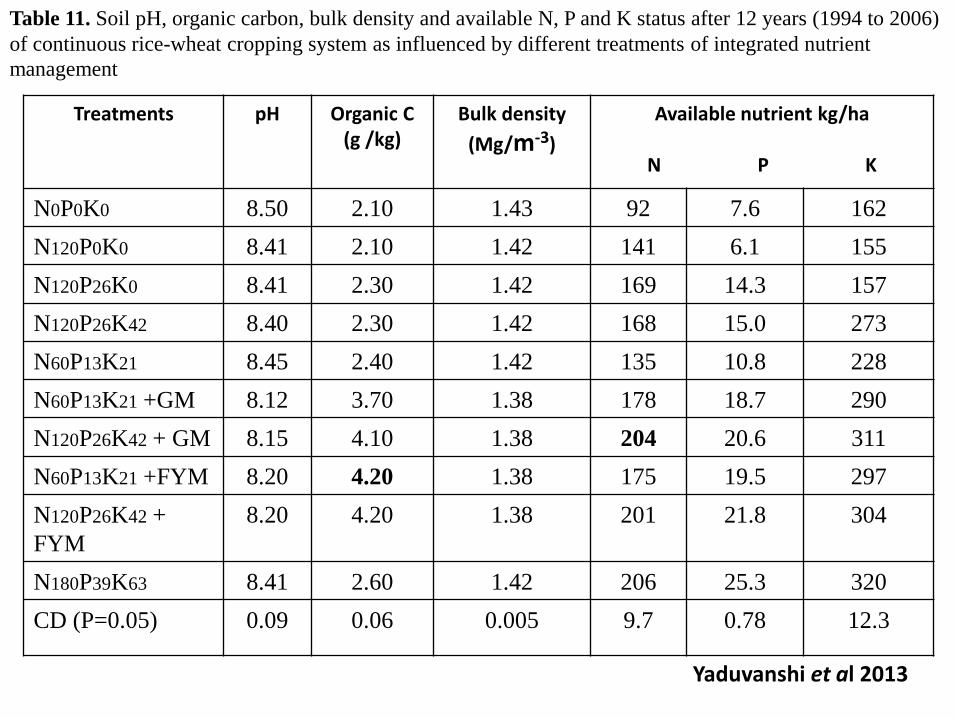
Treatments pH Organic C (g /kg)
Bulk density
(Mg/m-3)
Available nutrient kg/ha
N P K
N0P0K0 8.50 2.10 1.43 92 7.6 162
N120P0K0 8.41 2.10 1.42 141 6.1 155
N120P26K0 8.41 2.30 1.42 169 14.3 157
N120P26K42 8.40 2.30 1.42 168 15.0 273
N60P13K21 8.45 2.40 1.42 135 10.8 228
N60P13K21 +GM 8.12 3.70 1.38 178 18.7 290
N120P26K42 + GM 8.15 4.10 1.38 204 20.6 311
N60P13K21 +FYM 8.20 4.20 1.38 175 19.5 297
N120P26K42 +
FYM
8.20 4.20 1.38 201 21.8 304
N180P39K63 8.41 2.60 1.42 206 25.3 320
CD (P=0.05) 0.09 0.06 0.005 9.7 0.78 12.3
Table 11. Soil pH, organic carbon, bulk density and available N, P and K status after 12 years (1994 to 2006)
of continuous rice-wheat cropping system as influenced by different treatments of integrated nutrient
management
Yaduvanshi et al 2013
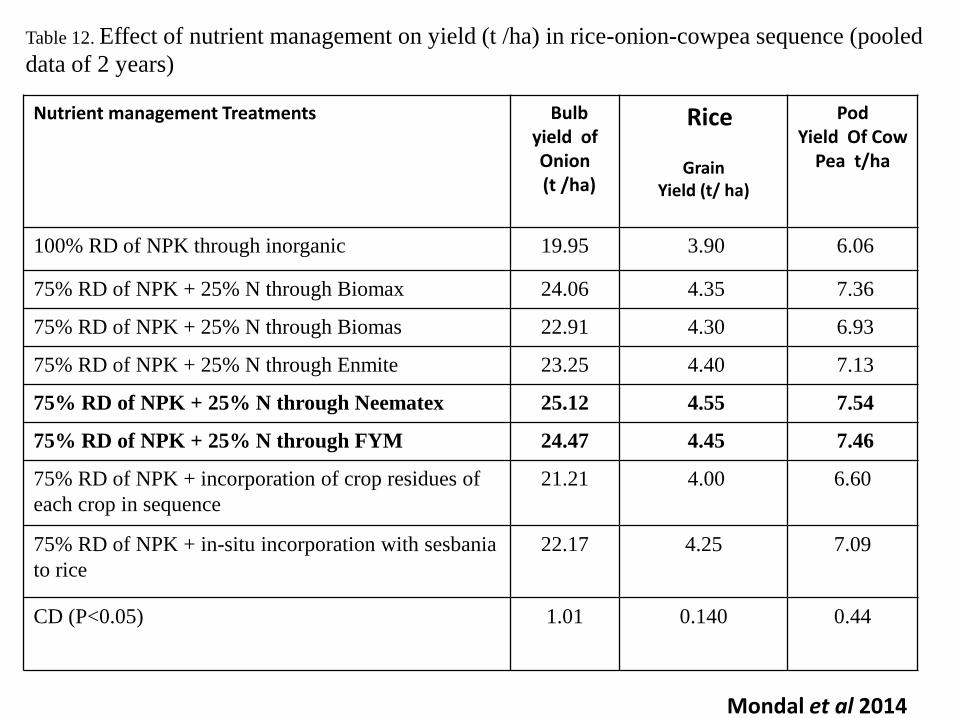
Nutrient management Treatments Bulb yield of Onion (t /ha)
Rice
GrainYield (t/ ha)
Pod Yield Of Cow
Pea t/ha
100% RD of NPK through inorganic 19.95 3.90 6.06
75% RD of NPK + 25% N through Biomax 24.06 4.35 7.36
75% RD of NPK + 25% N through Biomas 22.91 4.30 6.93
75% RD of NPK + 25% N through Enmite 23.25 4.40 7.13
75% RD of NPK + 25% N through Neematex 25.12 4.55 7.54
75% RD of NPK + 25% N through FYM 24.47 4.45 7.46
75% RD of NPK + incorporation of crop residues of
each crop in sequence
21.21 4.00 6.60
75% RD of NPK + in-situ incorporation with sesbania
to rice
22.17 4.25 7.09
CD (P<0.05) 1.01 0.140 0.44
Table 12. Effect of nutrient management on yield (t /ha) in rice-onion-cowpea sequence (pooled
data of 2 years)
Mondal et al 2014
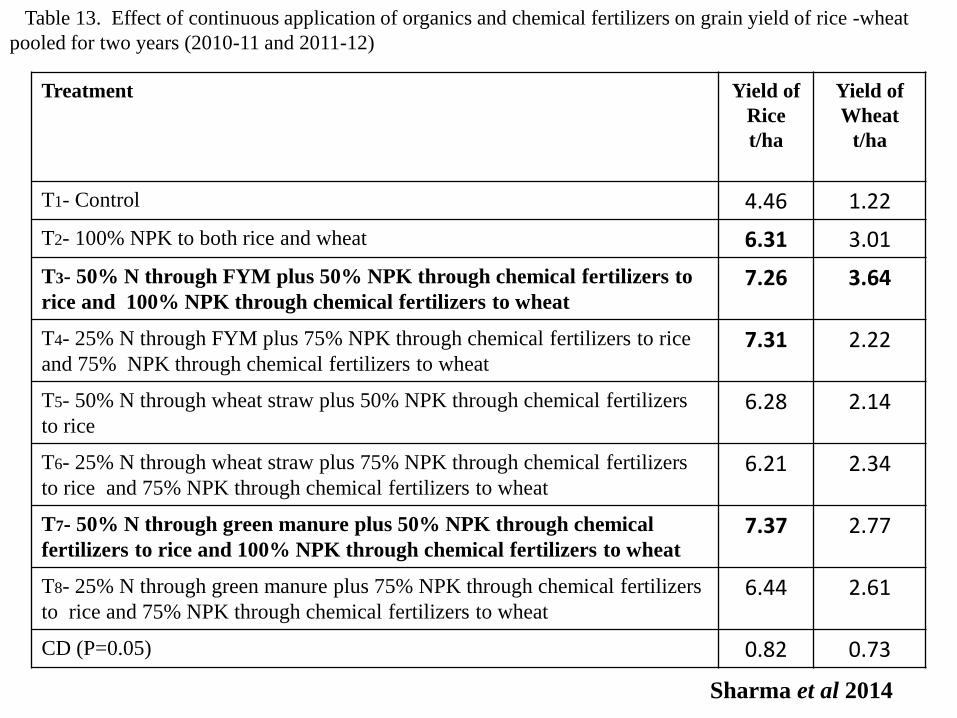
Treatment Yield of
Rice
t/ha
Yield of
Wheat
t/ha
T1- Control 4.46 1.22
T2- 100% NPK to both rice and wheat 6.31 3.01
T3- 50% N through FYM plus 50% NPK through chemical fertilizers to
rice and 100% NPK through chemical fertilizers to wheat7.26 3.64
T4- 25% N through FYM plus 75% NPK through chemical fertilizers to rice
and 75% NPK through chemical fertilizers to wheat7.31 2.22
T5- 50% N through wheat straw plus 50% NPK through chemical fertilizers
to rice6.28 2.14
T6- 25% N through wheat straw plus 75% NPK through chemical fertilizers
to rice and 75% NPK through chemical fertilizers to wheat6.21 2.34
T7- 50% N through green manure plus 50% NPK through chemical
fertilizers to rice and 100% NPK through chemical fertilizers to wheat7.37 2.77
T8- 25% N through green manure plus 75% NPK through chemical fertilizers
to rice and 75% NPK through chemical fertilizers to wheat6.44 2.61
CD (P=0.05) 0.82 0.73
Table 13. Effect of continuous application of organics and chemical fertilizers on grain yield of rice -wheat
pooled for two years (2010-11 and 2011-12)
Sharma et al 2014
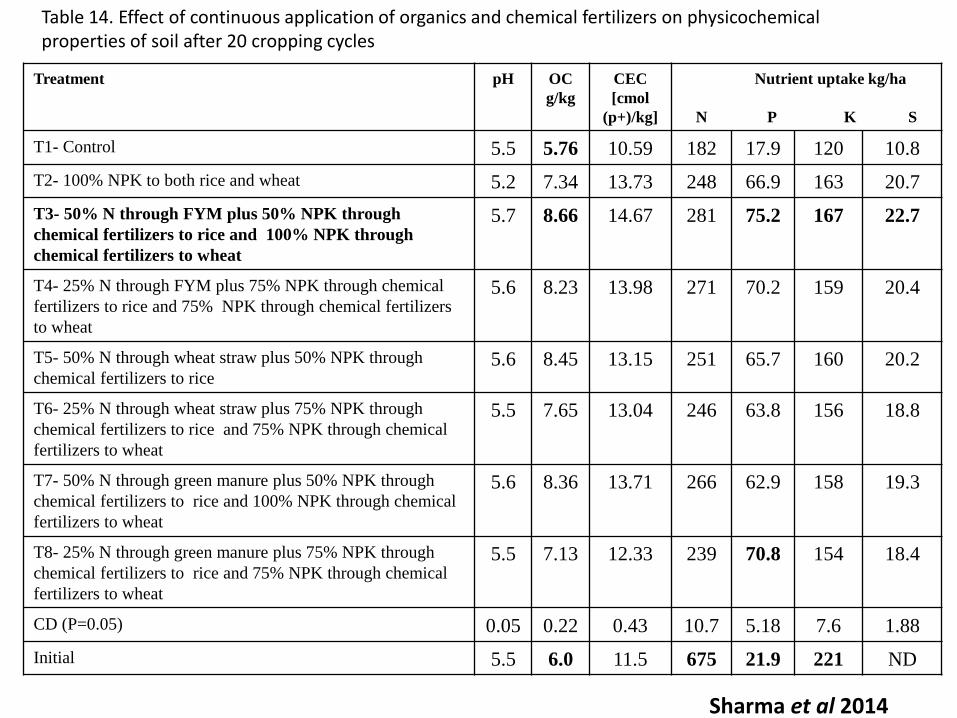
Treatment pH OC
g/kg
CEC
[cmol
(p+)/kg]
Nutrient uptake kg/ha
N P K S
T1- Control 5.5 5.76 10.59 182 17.9 120 10.8
T2- 100% NPK to both rice and wheat 5.2 7.34 13.73 248 66.9 163 20.7
T3- 50% N through FYM plus 50% NPK through
chemical fertilizers to rice and 100% NPK through
chemical fertilizers to wheat
5.7 8.66 14.67 281 75.2 167 22.7
T4- 25% N through FYM plus 75% NPK through chemical
fertilizers to rice and 75% NPK through chemical fertilizers
to wheat
5.6 8.23 13.98 271 70.2 159 20.4
T5- 50% N through wheat straw plus 50% NPK through
chemical fertilizers to rice5.6 8.45 13.15 251 65.7 160 20.2
T6- 25% N through wheat straw plus 75% NPK through
chemical fertilizers to rice and 75% NPK through chemical
fertilizers to wheat
5.5 7.65 13.04 246 63.8 156 18.8
T7- 50% N through green manure plus 50% NPK through
chemical fertilizers to rice and 100% NPK through chemical
fertilizers to wheat
5.6 8.36 13.71 266 62.9 158 19.3
T8- 25% N through green manure plus 75% NPK through
chemical fertilizers to rice and 75% NPK through chemical
fertilizers to wheat
5.5 7.13 12.33 239 70.8 154 18.4
CD (P=0.05) 0.05 0.22 0.43 10.7 5.18 7.6 1.88
Initial 5.5 6.0 11.5 675 21.9 221 ND
Table 14. Effect of continuous application of organics and chemical fertilizers on physicochemical properties of soil after 20 cropping cycles
Sharma et al 2014
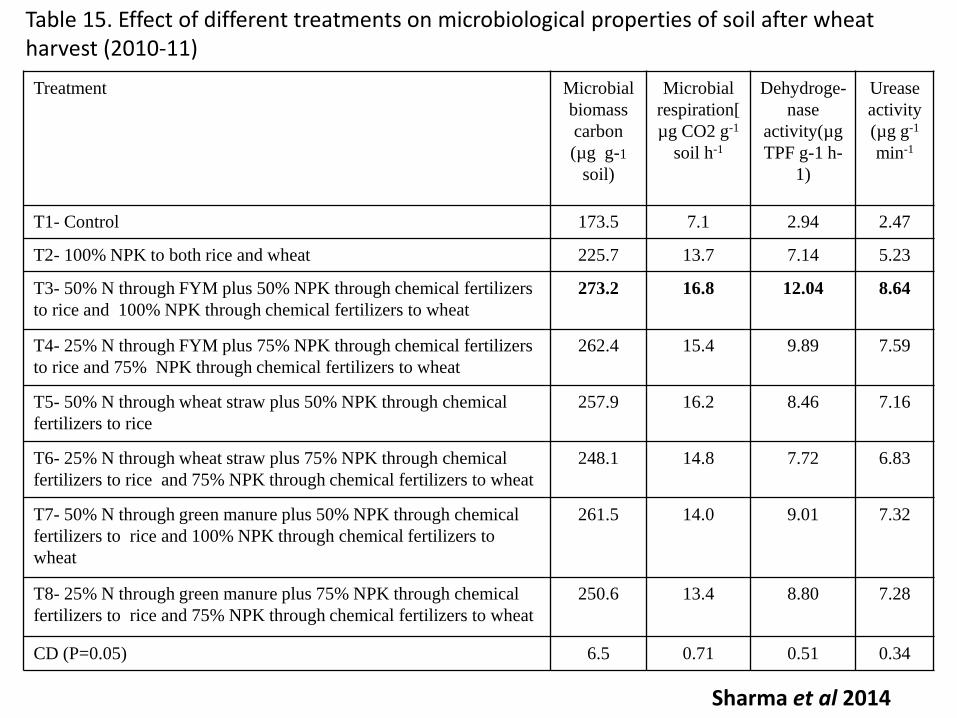
Treatment Microbial
biomass
carbon
(µg g-1
soil)
Microbial
respiration[
µg CO2 g-1
soil h-1
Dehydroge-
nase
activity(µg
TPF g-1 h-
1)
Urease
activity
(µg g-1
min-1
T1- Control 173.5 7.1 2.94 2.47
T2- 100% NPK to both rice and wheat 225.7 13.7 7.14 5.23
T3- 50% N through FYM plus 50% NPK through chemical fertilizers
to rice and 100% NPK through chemical fertilizers to wheat
273.2 16.8 12.04 8.64
T4- 25% N through FYM plus 75% NPK through chemical fertilizers
to rice and 75% NPK through chemical fertilizers to wheat
262.4 15.4 9.89 7.59
T5- 50% N through wheat straw plus 50% NPK through chemical
fertilizers to rice
257.9 16.2 8.46 7.16
T6- 25% N through wheat straw plus 75% NPK through chemical
fertilizers to rice and 75% NPK through chemical fertilizers to wheat
248.1 14.8 7.72 6.83
T7- 50% N through green manure plus 50% NPK through chemical
fertilizers to rice and 100% NPK through chemical fertilizers to
wheat
261.5 14.0 9.01 7.32
T8- 25% N through green manure plus 75% NPK through chemical
fertilizers to rice and 75% NPK through chemical fertilizers to wheat
250.6 13.4 8.80 7.28
CD (P=0.05) 6.5 0.71 0.51 0.34
Table 15. Effect of different treatments on microbiological properties of soil after wheat harvest (2010-11)
Sharma et al 2014
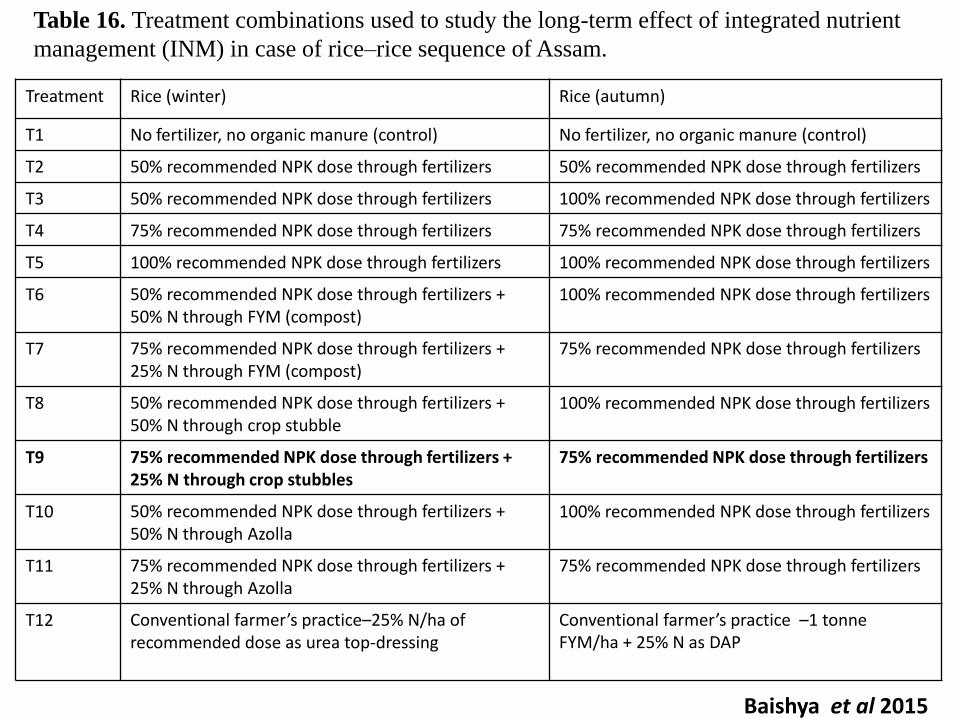
Treatment Rice (winter) Rice (autumn)
T1 No fertilizer, no organic manure (control) No fertilizer, no organic manure (control)
T2 50% recommended NPK dose through fertilizers 50% recommended NPK dose through fertilizers
T3 50% recommended NPK dose through fertilizers 100% recommended NPK dose through fertilizers
T4 75% recommended NPK dose through fertilizers 75% recommended NPK dose through fertilizers
T5 100% recommended NPK dose through fertilizers 100% recommended NPK dose through fertilizers
T6 50% recommended NPK dose through fertilizers + 50% N through FYM (compost)
100% recommended NPK dose through fertilizers
T7 75% recommended NPK dose through fertilizers + 25% N through FYM (compost)
75% recommended NPK dose through fertilizers
T8 50% recommended NPK dose through fertilizers + 50% N through crop stubble
100% recommended NPK dose through fertilizers
T9 75% recommended NPK dose through fertilizers + 25% N through crop stubbles
75% recommended NPK dose through fertilizers
T10 50% recommended NPK dose through fertilizers + 50% N through Azolla
100% recommended NPK dose through fertilizers
T11 75% recommended NPK dose through fertilizers + 25% N through Azolla
75% recommended NPK dose through fertilizers
T12 Conventional farmer’s practice–25% N/ha of recommended dose as urea top-dressing
Conventional farmer’s practice –1 tonne FYM/ha + 25% N as DAP
Table 16. Treatment combinations used to study the long-term effect of integrated nutrient
management (INM) in case of rice–rice sequence of Assam.
Baishya et al 2015
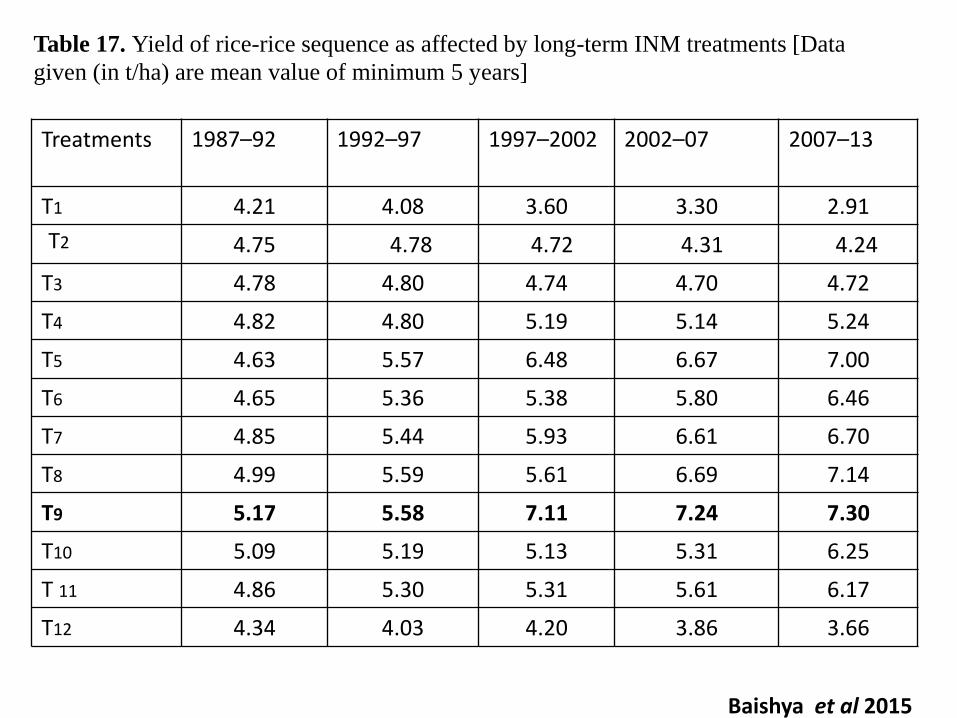
Treatments 1987–92 1992–97 1997–2002 2002–07 2007–13
T1 4.21 4.08 3.60 3.30 2.91
T2 4.75 4.78 4.72 4.31 4.24
T3 4.78 4.80 4.74 4.70 4.72
T4 4.82 4.80 5.19 5.14 5.24
T5 4.63 5.57 6.48 6.67 7.00
T6 4.65 5.36 5.38 5.80 6.46
T7 4.85 5.44 5.93 6.61 6.70
T8 4.99 5.59 5.61 6.69 7.14
T9 5.17 5.58 7.11 7.24 7.30
T10 5.09 5.19 5.13 5.31 6.25
T 11 4.86 5.30 5.31 5.61 6.17
T12 4.34 4.03 4.20 3.86 3.66
Table 17. Yield of rice-rice sequence as affected by long-term INM treatments [Data
given (in t/ha) are mean value of minimum 5 years]
Baishya et al 2015
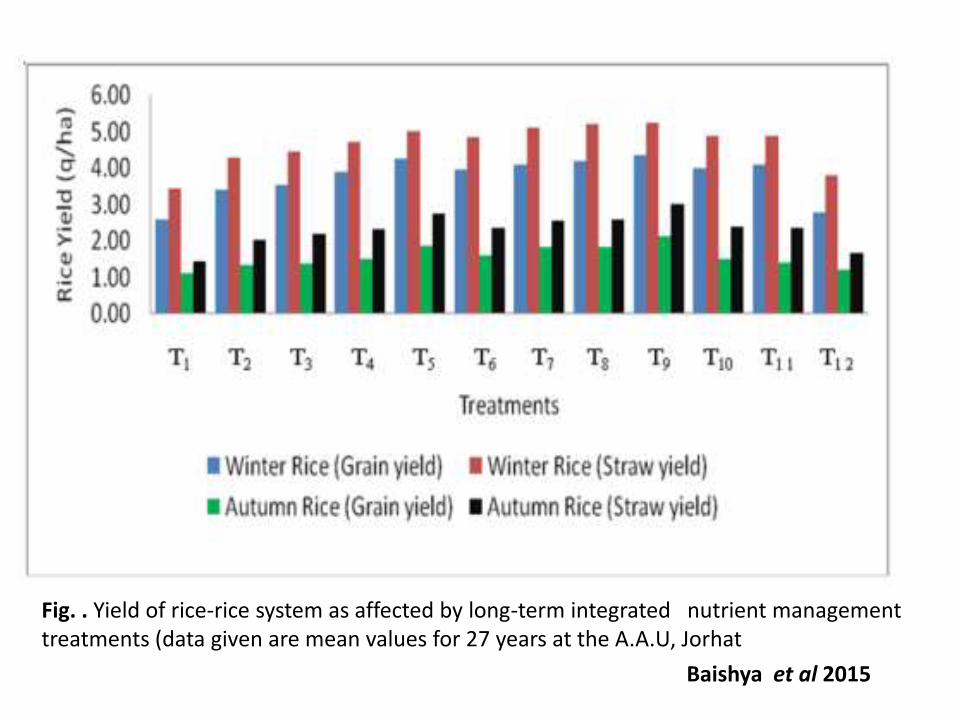
Fig. . Yield of rice-rice system as affected by long-term integrated nutrient management treatments (data given are mean values for 27 years at the A.A.U, Jorhat
Baishya et al 2015
Treatments pH OC
(g/kg
After Rice (available
nutrients kg/ha)
N P K
pH OC
(g /kg
After Niger
(available nutrients
kg/ha)
N P K
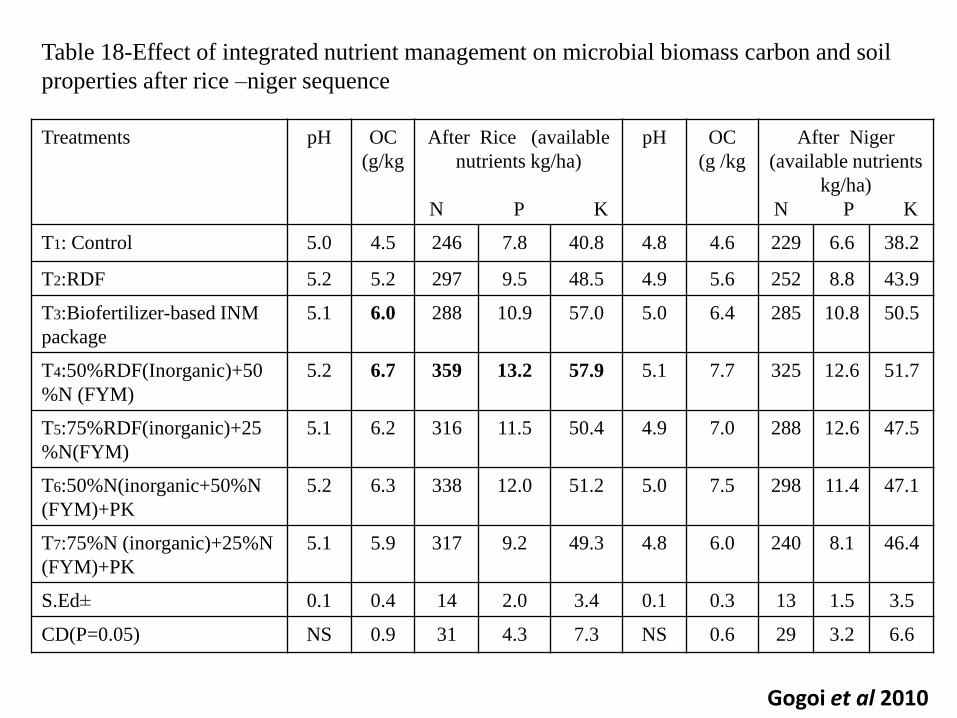
T1: Control 5.0 4.5 246 7.8 40.8 4.8 4.6 229 6.6 38.2
T2:RDF 5.2 5.2 297 9.5 48.5 4.9 5.6 252 8.8 43.9
T3:Biofertilizer-based INM
package
5.1 6.0 288 10.9 57.0 5.0 6.4 285 10.8 50.5
T4:50%RDF(Inorganic)+50
%N (FYM)
5.2 6.7 359 13.2 57.9 5.1 7.7 325 12.6 51.7
T5:75%RDF(inorganic)+25
%N(FYM)
5.1 6.2 316 11.5 50.4 4.9 7.0 288 12.6 47.5
T6:50%N(inorganic+50%N
(FYM)+PK
5.2 6.3 338 12.0 51.2 5.0 7.5 298 11.4 47.1
T7:75%N (inorganic)+25%N
(FYM)+PK
5.1 5.9 317 9.2 49.3 4.8 6.0 240 8.1 46.4
S.Ed± 0.1 0.4 14 2.0 3.4 0.1 0.3 13 1.5 3.5
CD(P=0.05) NS 0.9 31 4.3 7.3 NS 0.6 29 3.2 6.6
Table 18-Effect of integrated nutrient management on microbial biomass carbon and soil
properties after rice –niger sequence
Gogoi et al 2010
Treatments RICE
SMBC SMBC %Of(mg /kg) soil organic C
NIGER
SMBC SMBC % (mg /kg) Soil organic
C
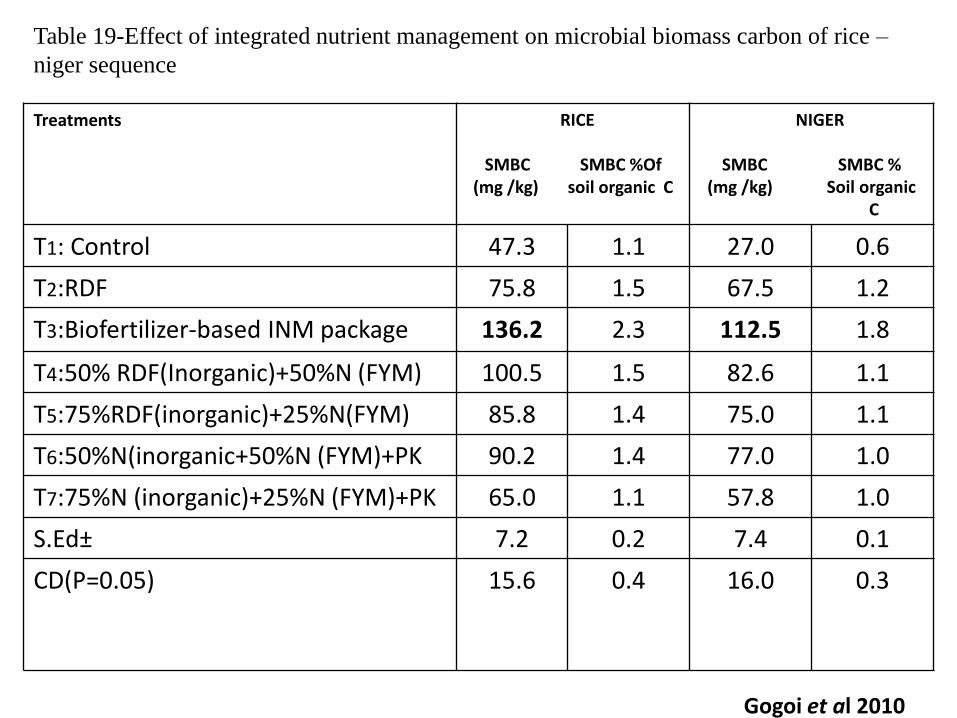
T1: Control 47.3 1.1 27.0 0.6
T2:RDF 75.8 1.5 67.5 1.2
T3:Biofertilizer-based INM package 136.2 2.3 112.5 1.8
T4:50% RDF(Inorganic)+50%N (FYM) 100.5 1.5 82.6 1.1
T5:75%RDF(inorganic)+25%N(FYM) 85.8 1.4 75.0 1.1
T6:50%N(inorganic+50%N (FYM)+PK 90.2 1.4 77.0 1.0
T7:75%N (inorganic)+25%N (FYM)+PK 65.0 1.1 57.8 1.0
S.Ed± 7.2 0.2 7.4 0.1
CD(P=0.05) 15.6 0.4 16.0 0.3
Table 19-Effect of integrated nutrient management on microbial biomass carbon of rice –
niger sequence
Gogoi et al 2010
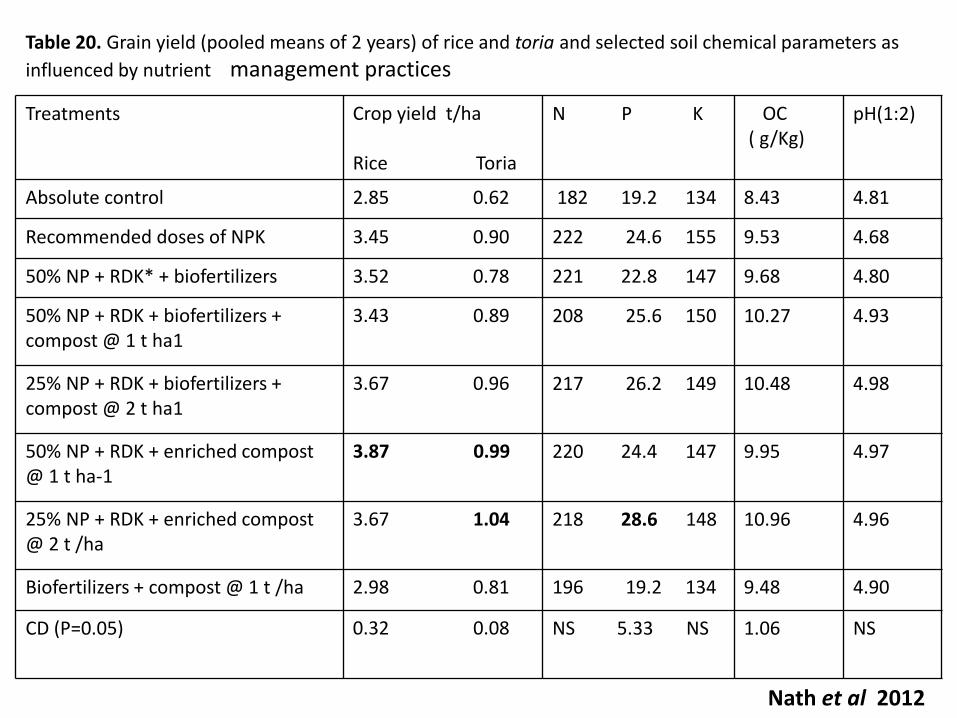
Treatments Crop yield t/ha
Rice Toria
N P K OC( g/Kg)
pH(1:2)
Absolute control 2.85 0.62 182 19.2 134 8.43 4.81
Recommended doses of NPK 3.45 0.90 222 24.6 155 9.53 4.68
50% NP + RDK* + biofertilizers 3.52 0.78 221 22.8 147 9.68 4.80
50% NP + RDK + biofertilizers + compost @ 1 t ha1
3.43 0.89 208 25.6 150 10.27 4.93
25% NP + RDK + biofertilizers + compost @ 2 t ha1
3.67 0.96 217 26.2 149 10.48 4.98
50% NP + RDK + enriched compost @ 1 t ha-1
3.87 0.99 220 24.4 147 9.95 4.97
25% NP + RDK + enriched compost @ 2 t /ha
3.67 1.04 218 28.6 148 10.96 4.96
Biofertilizers + compost @ 1 t /ha 2.98 0.81 196 19.2 134 9.48 4.90
CD (P=0.05) 0.32 0.08 NS 5.33 NS 1.06 NS
Table 20. Grain yield (pooled means of 2 years) of rice and toria and selected soil chemical parameters as
influenced by nutrient management practices
Nath et al 2012
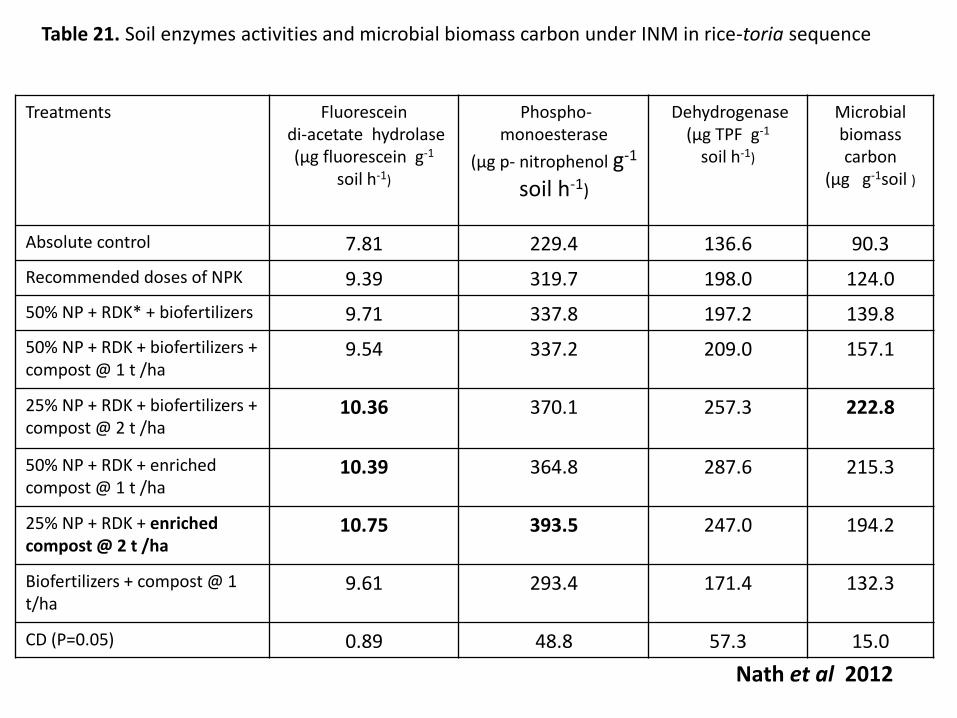
Treatments Fluoresceindi-acetate hydrolase (µg fluorescein g-1
soil h-1)
Phospho-monoesterase
(µg p- nitrophenol g-1
soil h-1)
Dehydrogenase (µg TPF g-1
soil h-1)
Microbial biomass carbon
(µg g-1soil )
Absolute control 7.81 229.4 136.6 90.3
Recommended doses of NPK 9.39 319.7 198.0 124.0
50% NP + RDK* + biofertilizers 9.71 337.8 197.2 139.8
50% NP + RDK + biofertilizers + compost @ 1 t /ha
9.54 337.2 209.0 157.1
25% NP + RDK + biofertilizers + compost @ 2 t /ha
10.36 370.1 257.3 222.8
50% NP + RDK + enriched compost @ 1 t /ha
10.39 364.8 287.6 215.3
25% NP + RDK + enriched compost @ 2 t /ha
10.75 393.5 247.0 194.2
Biofertilizers + compost @ 1 t/ha
9.61 293.4 171.4 132.3
CD (P=0.05) 0.89 48.8 57.3 15.0
Table 21. Soil enzymes activities and microbial biomass carbon under INM in rice-toria sequence
Nath et al 2012
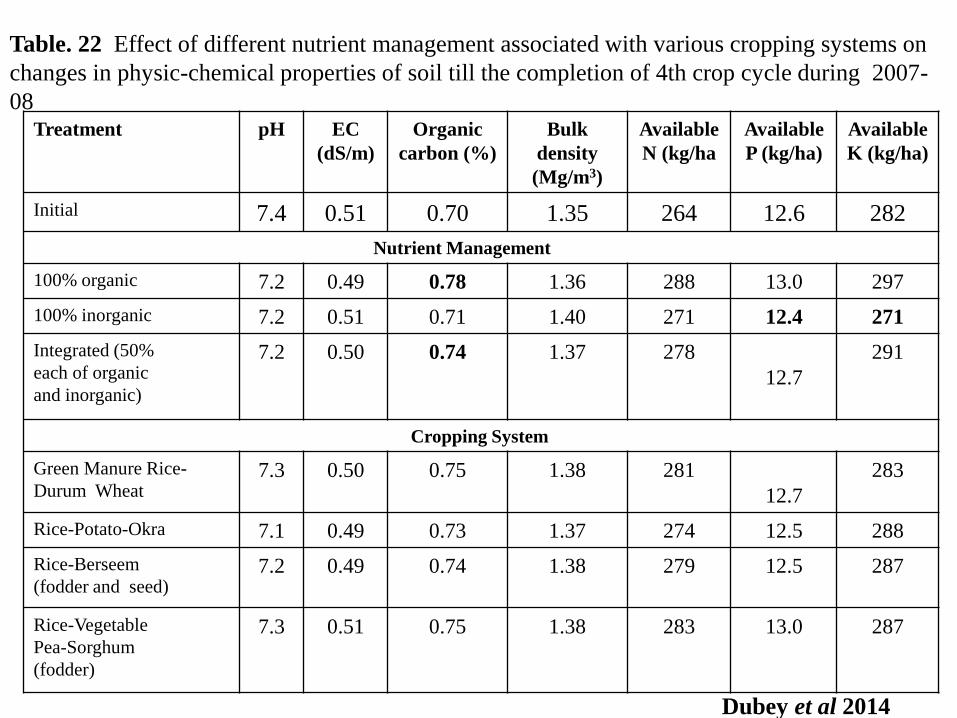
Treatment pH EC
(dS/m)
Organic
carbon (%)
Bulk
density
(Mg/m3)
Available
N (kg/ha
Available
P (kg/ha)
Available
K (kg/ha)
Initial 7.4 0.51 0.70 1.35 264 12.6 282
Nutrient Management
100% organic 7.2 0.49 0.78 1.36 288 13.0 297
100% inorganic 7.2 0.51 0.71 1.40 271 12.4 271
Integrated (50%
each of organic
and inorganic)
7.2 0.50 0.74 1.37 278
12.7
291
Cropping System
Green Manure Rice-
Durum Wheat 7.3 0.50 0.75 1.38 281
12.7
283
Rice-Potato-Okra 7.1 0.49 0.73 1.37 274 12.5 288
Rice-Berseem
(fodder and seed) 7.2 0.49 0.74 1.38 279 12.5 287
Rice-Vegetable
Pea-Sorghum
(fodder)
7.3 0.51 0.75 1.38 283 13.0 287
Table. 22 Effect of different nutrient management associated with various cropping systems on
changes in physic-chemical properties of soil till the completion of 4th crop cycle during 2007-
08
Dubey et al 2014
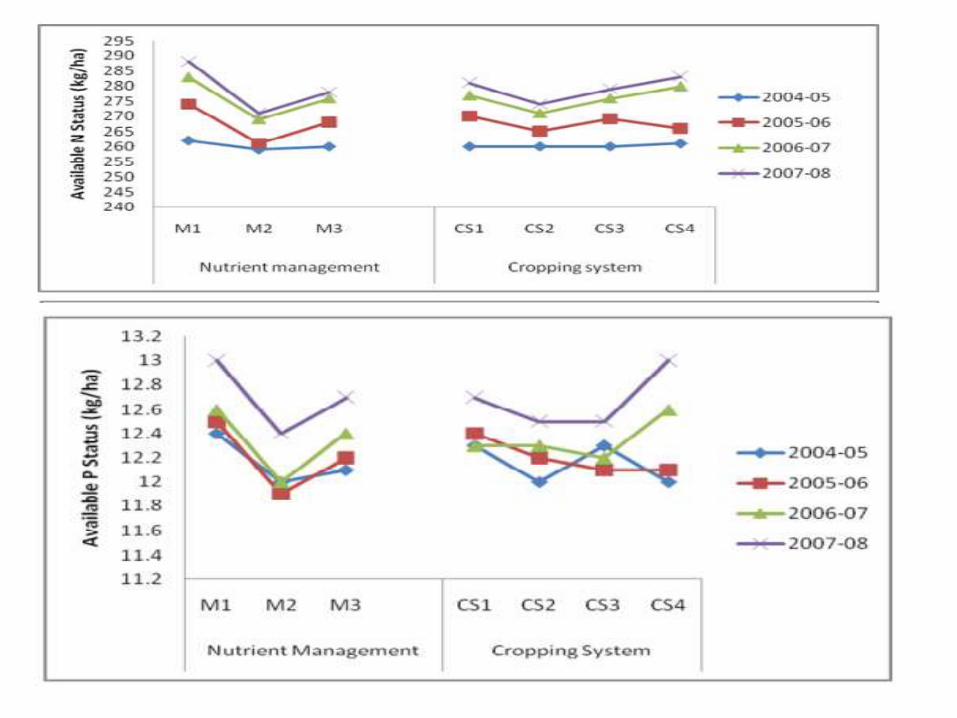
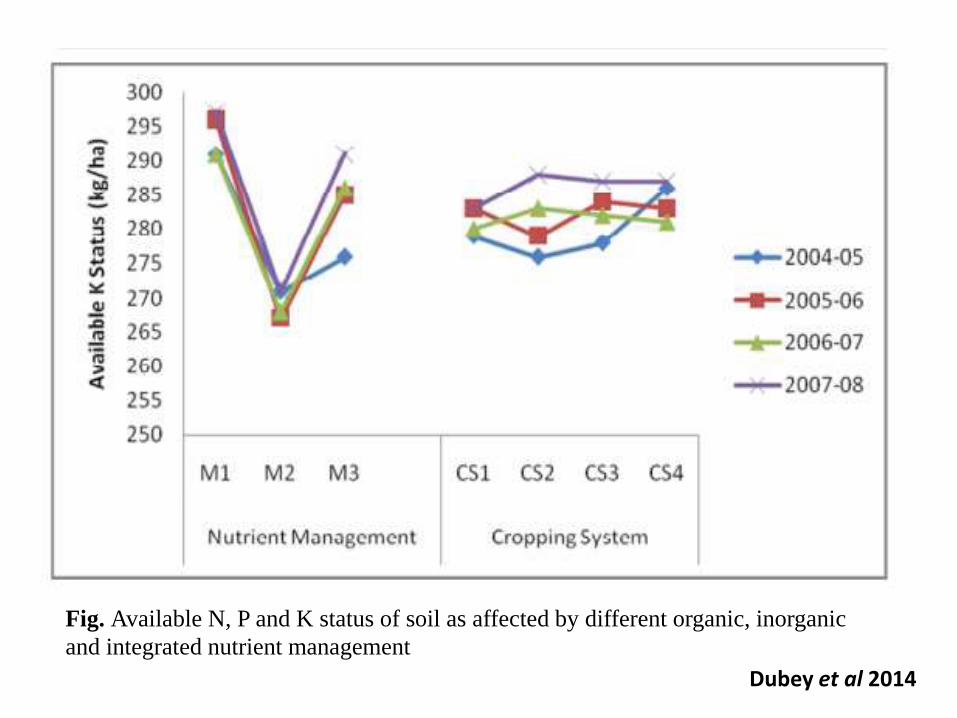
Fig. Available N, P and K status of soil as affected by different organic, inorganic
and integrated nutrient management
Dubey et al 2014
Treatment Fungi
(104/g)Bacteria
(106/g)
Azotobacter
(106/g)PSB
(106/gActinomycities
(106/g)
Initial 33.7 35.7 17.5 9.7 5.9
Nutrient Management
100% organic-M1 49.3 60.0 31.7 20.5 14.5
100% inorganicM2 38.8 36.1 20.7 12.4 7.9
Integrated (50% each oforganic and inorganic)-M3
41.7 44.2 25.4 15.5 11.6
Cropping System
Green Manure- Wheat-CS1 43.6 46.8 27.6 16.3 12.0
Rice-Potato-Okra -CS2 42.5 46.0 25.6 15.9 10.8
Rice- Berseem (fodderand seed)-CS3
43.7 47.6 27.8 16.4 11.4
Rice-Vegetable Pea Sorghum (fodder)-CS4
43.4 46.7 26.0 16.0 11.1
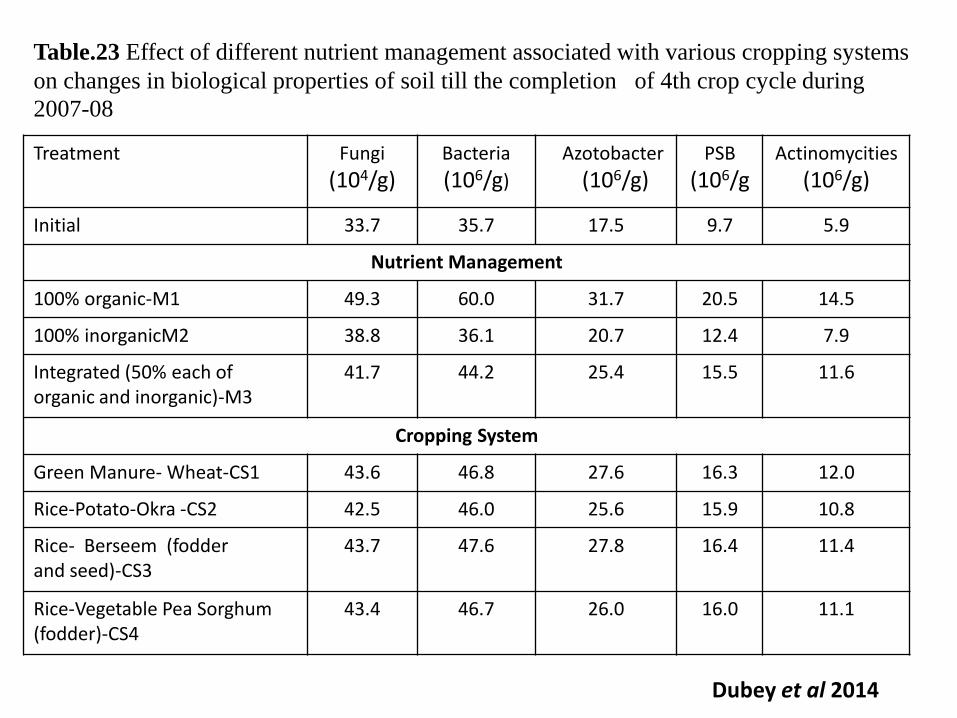
Table.23 Effect of different nutrient management associated with various cropping systems
on changes in biological properties of soil till the completion of 4th crop cycle during
2007-08
Dubey et al 2014
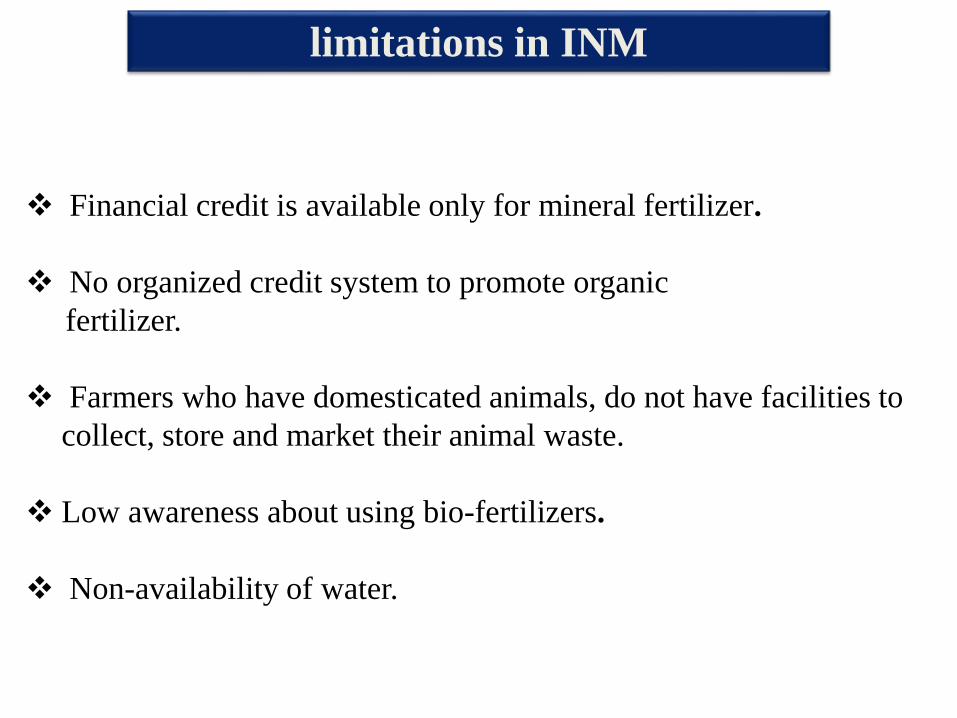
limitations in INM
Financial credit is available only for mineral fertilizer.
No organized credit system to promote organic
fertilizer.
Farmers who have domesticated animals, do not have facilities to
collect, store and market their animal waste.
Low awareness about using bio-fertilizers.
Non-availability of water.
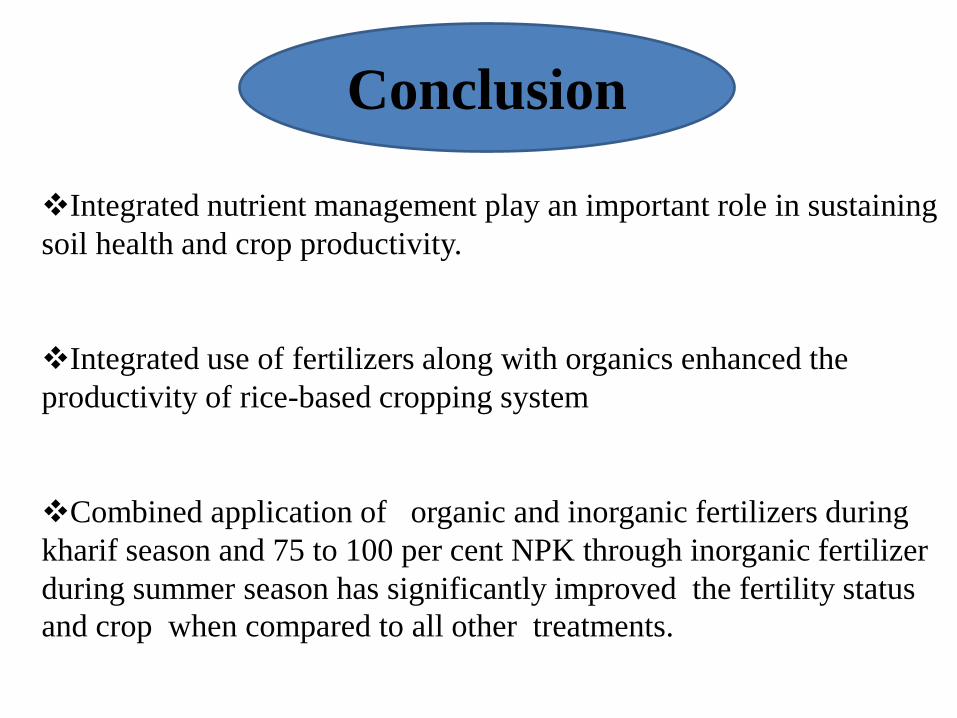
Integrated nutrient management play an important role in sustaining
soil health and crop productivity.
Integrated use of fertilizers along with organics enhanced the
productivity of rice-based cropping system
Combined application of organic and inorganic fertilizers during
kharif season and 75 to 100 per cent NPK through inorganic fertilizer
during summer season has significantly improved the fertility status
and crop when compared to all other treatments.
Conclusion
The decline in soil fertility and crop productivity in treatments
with only inorganic fertilizers due to imbalance and inadequate
nutrient supply.
INM favorably affects the physical,chemical and biological
environment of the soil
It can be summarized that the good quality organic inputs with
lower doses of chemical fertilizers have a potential to augment soil
enzymes activities and improve the microbial biomass carbon and
organic carbon.
From the foregoing discussion it can be concluded that integrated
nutrient management seem to be viable option rather than chemical
fertilizer alone for maintenance of soil productivity and fertility,