Inkai Operation
South Kazakhstan Oblast,
Republic of Kazakhstan
National Instrument 43-101
Technical Report
Effective Date: December 31, 2016
Date of Technical Report: March 23, 2017
PREPARED FOR CAMECO CORPORATION BY:
DARRYL CLARK, PhD, P. GEO.
ALAIN G. MAINVILLE, P. GEO.
STUART B. SOLIZ, P. GEO.
ROBERT J. SUMNER, PhD, P. ENG.
i 2017 INKAI OPERATION TECHNICAL REPORT
T A B L E O F C O N T E N T S
1 SUMMARY ................................................................................................................... 8
1.1 Operation overview .......................................................................................... 8
1.2 2016 Implementation agreement ..................................................................... 8
1.3 Property tenure ................................................................................................ 9
1.4 Location and existing infrastructure ............................................................... 10
1.5 Geology and mineralization ........................................................................... 10
1.6 Exploration and delineation ........................................................................... 11
1.7 Block 3 appraisal program ............................................................................. 11
1.8 Blocks 1 and 2 development ......................................................................... 12
1.9 Mineral resources and mineral reserves ....................................................... 12
1.10 Mining ............................................................................................................ 14
1.11 Processing ..................................................................................................... 15
1.12 Environmental assessment and licensing ..................................................... 15
1.13 Production plan and mine life ........................................................................ 16
1.14 Capital and operating cost estimates ............................................................ 17
1.15 Regulatory risks ............................................................................................. 17
1.16 Conclusions and recommendations .............................................................. 17
2 INTRODUCTION ........................................................................................................ 19
2.1 Introduction and purpose ............................................................................... 19
2.2 Report basis .................................................................................................. 19
3 RELIANCE ON OTHER EXPERTS ........................................................................... 21
4 PROPERTY DESCRIPTION AND LOCATION ......................................................... 22
4.1 Location ......................................................................................................... 22
4.2 Exploration and mining licences .................................................................... 23
4.3 Surface tenure ............................................................................................... 23
4.4 Resource Use Contract ................................................................................. 24
4.5 Subsoil Law ................................................................................................... 24 4.5.1 Stabilization clause ........................................................................... 25 4.5.2 Transfer of subsoil use rights and pre-emptive rights ...................... 25 4.5.3 Dispute resolution ............................................................................. 26 4.5.4 Contract termination ......................................................................... 26 4.5.5 Work programs and project documentation ..................................... 27 4.5.6 Procurement requirements ............................................................... 27 4.5.7 Local content requirements .............................................................. 27 4.5.8 Strategic deposits ............................................................................. 28
4.6 Draft Subsoil Code ........................................................................................ 28
ii 2017 INKAI OPERATION TECHNICAL REPORT
4.6.1 Re-introduction of the licencing regime ............................................ 29 4.6.2 Stabilization clause ........................................................................... 29 4.6.3 Dispute resolution ............................................................................. 29 4.6.4 Transfer of subsoil use rights and pre-emptive rights ...................... 29
4.7 Strategic object .............................................................................................. 30
4.8 Taxes and royalties ....................................................................................... 30
4.9 Known environmental liabilities ..................................................................... 31
4.10 Permitting....................................................................................................... 31
4.11 Factors affecting access to the property ....................................................... 31
5 ACCESSIBILITY, CLIMATE, LOCAL RESOURCES, INFRASTRUCTURE AND
PHYSIOGRAPHY ....................................................................................................... 32
5.1 Access ........................................................................................................... 32
5.2 Climate ........................................................................................................... 32
5.3 Physiography ................................................................................................. 32
5.4 Local resources ............................................................................................. 32
5.5 Infrastructure ................................................................................................. 33
6 HISTORY .................................................................................................................... 35
6.1 Ownership...................................................................................................... 35
6.2 Exploration and development history ............................................................ 35
6.3 Historical mineral resource and mineral reserve ........................................... 36
6.4 Historical production ...................................................................................... 36
7 GEOLOGICAL SETTING AND MINERALIZATION .................................................. 37
7.1 Regional geology ........................................................................................... 37 7.1.1 Hydrostratigraphy of the Chu-Sarysu Basin ..................................... 38
7.2 Local and property geology ........................................................................... 38 7.2.1 Local hydrogeology .......................................................................... 41 7.2.2 Hydraulic connectivity ....................................................................... 43 7.2.3 Piezometric measurements .............................................................. 44 7.2.4 Groundwater chemistry .................................................................... 44
7.3 Mineralization ................................................................................................ 45 7.3.1 Host rocks ......................................................................................... 45 7.3.2 Oxidation and mineralization ............................................................ 47 7.3.3 Geometry .......................................................................................... 48 7.3.4 Mineralogy ........................................................................................ 49
8 DEPOSIT TYPES ....................................................................................................... 52
8.1 Roll-front deposits .......................................................................................... 52 8.1.1 Oxidation state .................................................................................. 52
9 EXPLORATION .......................................................................................................... 54
10 DRILLING ................................................................................................................... 55
iii 2017 INKAI OPERATION TECHNICAL REPORT
10.1 Uranium exploration and delineation drilling ................................................. 55
10.2 Methodology and guidelines .......................................................................... 55 10.2.1 Timeline for exploration-delineation drilling programs ...................... 55
10.3 Factors that could materially affect the accuracy of the results .................... 56
11 SAMPLE PREPARATION, ANALYSES AND SECURITY ....................................... 58
11.1 Sample density .............................................................................................. 58
11.2 Core recovery ................................................................................................ 58
11.3 Procedure for sampling and sample preparation .......................................... 58
11.4 Assaying ........................................................................................................ 59
11.5 Geophysical logging ...................................................................................... 59 11.5.1 Radiometric probing ......................................................................... 59 11.5.2 Caliper logging .................................................................................. 60 11.5.3 Hole deviations ................................................................................. 60 11.5.4 Resistivity and self-polarization ........................................................ 60
11.6 Density determinations .................................................................................. 60
11.7 Quality assurance / quality control ................................................................ 60
11.8 Adequacy of sample preparation, assaying, QA/QC and security ................ 61
12 DATA VERIFICATION ............................................................................................... 62
12.1 Blocks 1 and 2 ............................................................................................... 62 12.1.1 Radioactivity, radium and uranium grades ....................................... 63
12.2 Block 3 ........................................................................................................... 63
12.3 Opinion on adequacy of data......................................................................... 63
13 MINERAL PROCESSING AND METALLURGICAL TESTING ................................ 64
13.1 Main Processing Plant and Satellite 1 ........................................................... 64
13.2 Block 3 and Test Leach Facility ..................................................................... 64
14 MINERAL RESOURCE ESTIMATES ........................................................................ 66
14.1 Key assumptions, parameters and methods ................................................. 66 14.1.1 Key assumptions .............................................................................. 68 14.1.2 Key parameters ................................................................................ 68 14.1.3 Key methods ..................................................................................... 68 14.1.4 Resource classification ..................................................................... 69 14.1.5 Mineral resource estimate ................................................................ 72 14.1.6 Changes to mineral resources ......................................................... 73
14.2 Factors that could materially affect the mineral resource estimate ............... 73
15 MINERAL RESERVE ESTIMATES ........................................................................... 74
15.1 Definitions ...................................................................................................... 74
15.2 Key assumptions, parameters and method ................................................... 74 15.2.1 Modifying factors .............................................................................. 74 15.2.2 Key assumptions .............................................................................. 75
iv 2017 INKAI OPERATION TECHNICAL REPORT
15.2.3 Key parameters ................................................................................ 75 15.2.4 Key methods ..................................................................................... 75 15.2.5 Reserve classification ....................................................................... 75 15.2.6 Cut-off ............................................................................................... 76 15.2.7 Mineral reserve estimate .................................................................. 76 15.2.8 Changes to mineral reserves ........................................................... 77
15.3 Factors that could materially affect the mineral reserve estimate ................. 78
16 MINING METHODS .................................................................................................... 79
16.1 Mining ............................................................................................................ 79 16.1.1 Mining method .................................................................................. 80 16.1.2 Production objectives ....................................................................... 80 16.1.3 Wellfield design and development .................................................... 81 16.1.4 Wellfield production .......................................................................... 83
17 RECOVERY METHODS ............................................................................................ 85
17.1 Processing facilities ....................................................................................... 85
17.2 Ion exchange resin adsorption (loading) ....................................................... 85
17.3 Resin elution (stripping) ................................................................................. 85
17.4 Denitrification ................................................................................................. 86
17.5 Precipitation ................................................................................................... 86
17.6 Yellowcake product thickening and dewatering ............................................ 86
17.7 Filter press operation ..................................................................................... 86
17.8 Drying ............................................................................................................ 86
17.9 Packaging ...................................................................................................... 86
17.10 Overall uranium recovery .............................................................................. 86
18 PROJECT INFRASTRUCTURE ................................................................................ 88
19 MARKET STUDIES AND CONTRACTS ................................................................... 90
19.1 Markets .......................................................................................................... 90
19.2 Uranium sales contracts ................................................................................ 91
19.3 Material contracts .......................................................................................... 91
20 ENVIRONMENTAL STUDIES, PERMITTING AND SOCIAL OR COMMUNITY
IMPACT ...................................................................................................................... 92
20.1 Environmental considerations ....................................................................... 92 20.1.1 Legislation ........................................................................................ 92 20.1.2 Permitting ......................................................................................... 92 20.1.3 Environmental impact assessment ................................................... 93 20.1.4 Decommissioning and restoration .................................................... 94 20.1.5 Known environmental liabilities ........................................................ 94
20.2 Social and community factors........................................................................ 95
21 CAPITAL AND OPERATING COSTS ....................................................................... 97
v 2017 INKAI OPERATION TECHNICAL REPORT
21.1 Capital cost estimates ................................................................................... 97
21.2 Operating cost estimates ............................................................................... 97
22 ECONOMIC ANALYSIS ............................................................................................. 99
23 ADJACENT PROPERTIES ........................................................................................ 99
24 OTHER RELEVANT DATA AND INFORMATION .................................................. 100
24.1 Block 3 appraisal program ........................................................................... 100
24.2 Cameco funding of Block 3 appraisal program ........................................... 100
24.3 2016 Implementation Agreement ................................................................ 101
24.4 Currency control regulations ....................................................................... 102
24.5 Regulatory risks ........................................................................................... 102 24.5.1 Kazakhstan laws and regulations ................................................... 102 24.5.2 Compliance with legal requirements .............................................. 103 24.5.3 2016 Implementation Agreement regulatory approvals ................. 104 24.5.4 Extension of Block 3 exploration period ......................................... 104
24.6 Caution about forward-looking information .................................................. 104
25 INTERPRETATION AND CONCLUSIONS ............................................................. 107
26 RECOMMENDATIONS ............................................................................................ 108
27 REFERENCES ......................................................................................................... 109
28 DATE AND SIGNATURE PAGE.............................................................................. 111
vi 2017 INKAI OPERATION TECHNICAL REPORT
T A B L E S
Table 1-1: Summary Of Mineral Resources – December 31, 2016 ........................................ 13 Table 1-2: Summary Of Mineral Reserves – December 31, 2016 .......................................... 14 Table 3-1: Reliance On Other Experts .................................................................................... 21 Table 6-1: Historical Drilling ..................................................................................................... 35 Table 6-2: Inkai Block 1 And Block 2 Uranium Production ...................................................... 36 Table 7-1: Hydraulic Conductivity ............................................................................................ 43 Table 7-2: Horizons And Subhorozons Division ...................................................................... 45 Table 10-1: Delineation Drilling At Inkai .................................................................................. 55 Table 13-1: Key Species In The Block 3 Composite Samples ................................................ 65 Table 14-1: Cut-Offs And Additional Estimation Parameters .................................................. 69 Table 14-2: Summary Of Mineral Resources – December 31, 2016 ...................................... 72 Table 14-3: Changes In Mineral Resources ............................................................................ 73 Table 15-1: Summary Of Mineral Reserves – December 31, 2016 ........................................ 77 Table 15-2: Changes In Mineral Reserves .............................................................................. 78 Table 16-1: Production Schedule ............................................................................................ 84 Table 19-1: 2016 World Uranium Production .......................................................................... 90 Table 21-1: Capital Cost Forecast By Year – 100% Basis ...................................................... 98 Table 21-2: Operating Cost Forecast By Year – 100% Basis ................................................. 98
F I G U R E S
Figure 1-1: Annual Production Plan - 100% Basis .................................................................. 17 Figure 4-1: Location Map ......................................................................................................... 22 Figure 5-1: General Location Map ........................................................................................... 34 Figure 7-1: Schematic Cross-Section Of The Chu-Sarysu Basin – Looking West ................. 37 Figure 7-2: Schematic Stratigraphic Column For The Chu-Sarysu Basin ............................... 40 Figure 7-3: Inkai Uranium Roll Front ....................................................................................... 46 Figure 7-4: Roll-Front Morphology Of Mineralization .............................................................. 50 Figure 7-5: Typical Characteristics Of A Roll-Front Deposit ................................................... 51 Figure 10-1: Drill Hole Collar Location Map ............................................................................ 57 Figure 14-1: Blocks 1 And 2 - Total Mineral Resources By Cim Classification ....................... 71 Figure 16-1: In-Situ Recovery Schematic ................................................................................ 79 Figure 16-2: Recovery Curves For Block 1 Wellfields ............................................................. 82 Figure 16-3: Recovery Curves For Block 2 Wellfields ............................................................. 82 Figure 16-4: Annual Production Plan – 100% Basis ............................................................... 84 Figure 17-1: Flowsheet Based On Annual Production Of 5.2 Mlbs U308 ................................ 87 Figure 18-1: Infrastructure General Arrangement ................................................................... 89
7 2017 INKAI OPERATION TECHNICAL REPORT
U N I T S O F M E A S U R E A N D A B B R E V I A T I O N S
°C ................................................................................. Degrees Celsius
$ ................................................................................... Canadian dollars
> ................................................................................... Greater than
< ................................................................................... Less than
% .................................................................................. Percent
a ................................................................................... Annum (year)
d ................................................................................... Day
g ................................................................................... Grams
GT ................................................................................ Grade multiplied by Thickness
h ................................................................................... Hour(s)
K .................................................................................. Thousand
km2 ............................................................................... Square kilometres
L ................................................................................... Litre
Lbs ............................................................................... Pounds
M .................................................................................. Million
m .................................................................................. Metres
m%U3O8 ....................................................................... Metres times percent uranium oxide
m/d .............................................................................. Metres per Day
mm ............................................................................... Millimetres
t .................................................................................... Tonnes (metric)
U .................................................................................. Uranium (1 tonne U = 2,599.8 Lbs U3O8)
%U ............................................................................... Percent uranium (%U x 1.179 = % U3O8)
U3O8 ............................................................................. Uranium oxide (yellowcake)
%U3O8 .......................................................................... Percent uranium oxide (%U3O8 x 0.848 = %U)
UF6 ............................................................................... Uranium hexafluoride
8 2017 INKAI OPERATION TECHNICAL REPORT
1 Summary
Inkai is a material property for Cameco Corporation (Cameco) under Canadian securities laws.
This technical report has been prepared for Cameco by internal Qualified Persons (QP) in support of the
disclosure of scientific and technical information relating to Inkai contained in Cameco’s annual Management’s
Discussion and Analysis for the year ended December 31, 2016 filed with Canadian securities regulators on
February 9, 2017 and Cameco’s Annual Information Form and Form 40-F for the year ended December 31,
2016.
All monetary references in this technical report are expressed in Canadian dollars, unless otherwise indicated.
1.1 Operation overview
Inkai is an in-situ recovery (ISR) producing mine in the Central Asian Republic of Kazakhstan, made up of
three contiguous licence blocks:
Block 1 –16.6 square kilometres
Block 2 –230 square kilometres
Block 3 –240 square kilometres
Inkai is owned and operated by Joint Venture Inkai Limited Liability Partnership (JV Inkai), an entity which is
owned by Cameco (60%) and Joint Stock Company “National Atomic Company Kazatomprom”
(Kazatomprom) (40%). The Republic of Kazakhstan owns Joint Stock Company Sovereign Wealth Fund
“Samruk-Kazyna”, who is the sole shareholder of Kazatomprom.
Inkai’s mineral reserves and resources reported by Cameco are located at Blocks 1 and 2. An ISR test is
currently in progress at Block 3 in order to demonstrate Block 3’s technical and economic viability. Total
packaged production from Blocks 1 and 2 from 2009 to the end of 2016 is 36.7 million pounds of U3O8
(Cameco’s share 21.5 million pounds).
1.2 2016 Implementation agreement
Cameco, Kazatomprom and JV Inkai signed an agreement (Implementation Agreement) dated May 27, 2016,
to restructure and enhance Inkai. Subject to closing, the Implementation Agreement provides as follows:
JV Inkai will have the right to produce 4,000 tonnes of uranium (tU) (10.4 million pounds of U3O8) per
year (Cameco’s share 4.2 million pounds), an increase from the current 5.2 million pounds (Cameco’s
share 3.0 million pounds)
JV Inkai will have the right to produce from Blocks 1, 2 and 3 until 2045 (currently, the licence terms
are to 2024 for Block 1 and to 2030 for Blocks 2 and 3)
subject to further adjustments tied to the construction of a refinery as described below, Cameco’s
ownership interest in JV Inkai will be adjusted to 40%, and Kazatomprom’s ownership interest in JV
Inkai will be adjusted to 60%. However the Implementation Agreement ensures that during production
ramp up, Cameco’s share of annual production remains at 57.5% on the first 5.2 million pounds of
U3O8. As annual production increases above 5.2 million pounds, Cameco will be entitled to 22.5% of
any incremental production, to the maximum annual share of 4.2 million pounds of U3O8. Once the
ramp up to 10.4 million pounds of U3O8 annually is complete, Cameco’s interest in production will be
adjusted to match its ownership interest at 40%.
a governance framework that provides protection for Cameco as a minority owner of JV Inkai
9 2017 INKAI OPERATION TECHNICAL REPORT
the current boundaries of Blocks 1, 2 and 3 will be adjusted to match the agreed production profile
for Inkai to 2045
the loan made by a Cameco subsidiary to JV Inkai to fund exploration and evaluation of Block 3 will
be paid on a priority basis
The Implementation Agreement is subject to obtaining all required government approvals, including certain
amendments to JV Inkai’s Resource Use Contract. In February 2017, Cameco estimated it would take 10 to
18 months to obtain the required approvals. The agreement provides for annual production at Inkai to be
ramped up to 10.4 million pounds of U3O8 over three years following receipt of the required approvals.
The Implementation Agreement also provides that Cameco and Kazatomprom will complete a feasibility study
for the purpose of evaluating the design, construction and operation of a uranium refinery in Kazakhstan. If
Cameco and Kazatomprom decide to build the refinery, the agreement also provides that Cameco’s
ownership interest in JV Inkai will be increased to 42.5% upon commissioning of the refinery and, depending
on the level of commercial support Cameco provides, may be increased further to 44%. The agreement also
grants Kazatomprom a five-year option to license Cameco’s proprietary uranium conversion technology for
purposes of constructing and operating a UF6 conversion facility in Kazakhstan, if Cameco and Kazatomprom
decide to build the refinery.
For more information, see Section 24.3 2016 Implementation Agreement.
The technical and scientific information in this technical report does not reflect the material changes that
would result upon closing of the Implementation Agreement since it is still subject to obtaining all required
government approvals. If the Implementation Agreement closes, the estimated mineral resources and mineral
reserves of Inkai and Cameco’s share will change materially.
1.3 Property tenure
In April 1999, the government of Kazakhstan granted JV Inkai a mining licence for Block 1 and an exploration
with subsequent mining licence for Blocks 2 and 3. The associated subsoil use contract (Resource Use
Contract), covering both licences, was signed by the Republic of Kazakhstan and JV Inkai in July, 2000. The
Block 1 licence expires in 2024 and the Blocks 2 and 3 licence expires in 2030 (Licences).
JV Inkai also has obligations under the Licences and the Resource Use Contract which it must comply with in
order to maintain its rights to Blocks 1, 2 and 3. There have been five amendments to the Resource Use
Contract. The most recent amendment was in November 2016 to extend the exploration period at Block 3 until
July 13, 2018.
In addition to complying with its obligations under the Licences and the Resource Use Contract, JV Inkai, like
all subsoil users, is required to abide by the work program appended to its Resource Use Contract, which
relates to its mining operations.
Under Kazakhstan law, subsoil and mineral resources belong to the state. Currently, the state provides
access to subsoil and mineral resources under a resource use contract. Minerals extracted from subsoil by a
subsoil user under a resource use contract are the property of the subsoil user unless the Law on the Subsoil
and Subsoil Use, dated June 24, 2010, as amended (Subsoil Law) or a resource use contract provides
otherwise.
Under the Resource Use Contract and the Licences, JV Inkai has the rights to explore for and to extract
uranium from the subsoil. JV Inkai owns uranium extracted from the subsoil, and has the right to use the
surface of the lands.
A subsoil use contract gives the contractor a right to use the surface of the property while exploring, mining
and reclaiming the land. However, this right must be set forth in a surface lease agreement with the applicable
local administrative authorities.
On a regular basis, JV Inkai obtains from local authorities the necessary surface lease agreements for new
10 2017 INKAI OPERATION TECHNICAL REPORT
buildings and infrastructure. JV Inkai does not hold surface leases for the entire area that is subject to the
Licences. JV Inkai obtains surface leases gradually only for surface area required for exploration, mining or
construction of new infrastructure.
For more information, see Sections 4.1 to 4.5.
1.4 Location and existing infrastructure
Inkai is located in the Suzak District of South-Kazakhstan Oblast, Kazakhstan, near the town of Taikonur. It is
approximately 350 kilometres northwest of the city of Shymkent and approximately 155 kilometres east of the
city of Kyzl-Orda. Inkai is accessible by road from Shymkent (470 kilometres) and from Kyzl-Orda (290 kilo-
metres). JV Inkai’s corporate office is located in Shymkent.
There are three surface processing facilities at Inkai:
main processing plant (MPP) located on Block 1
satellite 1 (Sat1) located on Block 2
test leach facility (TLF) located on Block 3
The MPP has an ion exchange (IX) capacity of 2.7 million pounds of U3O8 per year and a product recovery
drying and packaging capacity of 8.1 million pounds of U3O8 per year. Sat1 has an IX capacity of 6.3 million
pounds of U3O8 per year. The TLF is currently operated as part of a test campaign to assess the commercial
viability of Block 3.
The following are located at Block 1: an administrative office, shops, garage, holding ponds, laboratory and
emergency response building, enclosures for low-level radioactive waste and domestic waste, reagent
storage tanks, food services facilities, engineering and construction offices, wellfield pipelines, header houses,
roads, and powerlines. At Block 2, there is an office, shops, holding ponds, reagents storage tanks, a food
services facility, wellfield pipelines, header houses, roads, and powerlines. At Block 3, there is an office,
shops, holding ponds, reagent storage tanks, a food services facility, wellfield pipelines, header houses,
roads, and powerlines. At Taikonur, JV Inkai has a camp for 429 employees with catering and leisure facilities.
1.5 Geology and mineralization
South-central Kazakhstan geology is comprised of a large relatively flat basin of Cretaceous to Quaternary
age continental clastic sedimentary rocks. The Chu-Sarysu Basin extends for more than 1,000 kilometres
from the foothills of the Tien Shan Mountains located on south and southeast sides of the basin, and merges
into the flats of the Aral Sea depression to the northwest. The basin is up to 250 kilometres wide, bordered by
the Karatau Mountains on the southwest and the Kazakh Uplands on the northeast. The basin is composed of
gently dipping to nearly flat lying fluvial-derived unconsolidated sediments composed of inter-bedded sand, silt
and local clay horizons.
The Cretaceous and Paleogene sediments contain several stacked and relatively continuous, sinuous “roll-
fronts” or oxidation-reduction (redox) fronts hosted in the more porous and permeable sand and silt units.
Several uranium deposits and active ISR uranium mines are located at these regional oxidation roll-fronts,
developed along a regional system of superimposed mineralization fronts. The overall stratigraphic horizon of
interest in the basin is approximately 200 to 250 metres in vertical section.
The Inkai deposit is one of these roll-front deposits. It is hosted within the Inkuduk and Mynkuduk Formations
which comprise fine, medium and coarse-grain sands, gravels and clays. The redox boundary can be readily
recognised in core by a distinct colour change from grey and greenish-grey on the reduced side to light-grey
with yellowish stains on the oxidized side, stemming from the oxidation of pyrite to limonite.
The sands have high horizontal hydraulic conductivities. Hydrogeological parameters of the deposit play a key
role in ISR mining. Studies and mining results indicate Inkai has favourable hydrogeological conditions for ISR
mining.
11 2017 INKAI OPERATION TECHNICAL REPORT
Ten mineralized zones have been identified in Blocks 1, 2 and 3. These include four zones in the Mynkuduk
horizon and six zones in the Inkuduk horizon. The bulk of the uranium mineralization in Block 1 is contained in
the Mynkuduk horizon which extends over more than 10 kilometres. This horizon is at an average depth of
about 490 metres. Mineralization in Block 2 is contained primarily in the Lower and Middle Inkuduk horizons at
average depths of 390 and 340 metres below surface. It extends over more than 35 kilometres. The bulk of
the mineralization in Block 3 is contained in the Lower and Middle Inkuduk horizons extending over more than
25 kilometres at average depths of 360 and 330 metres below surface.
Mineralization comprises sooty pitchblende (85%) and coffinite (15%). The pitchblende occurs as micron-
sized globules and spherical aggregates, while the coffinite forms tiny crystals. Both uranium minerals occur in
pores on interstitial materials such as clay minerals, as films around and in cracks within sand grains, and as
replacements of rare organic matter, and are commonly associated with pyrite.
1.6 Exploration and delineation
Exploration at Inkai began in the 1970s and progressed until 1996. Since 2006 exploration and delineation
drilling has been conducted by JV Inkai.
Blocks 1 and 2 exploration and delineation programs
No exploration activity was conducted by JV Inkai at Blocks 1 and 2 before 2013. From 2013 to 2016,
delineation drilling was conducted at Block 1 (67 drillholes) and Block 2 (280 drillholes) to better establish the
mineralization distribution and to support further development and wellfield design.
Block 3 exploration and delineation programs
Exploration and delineation work was completed at the northern flank (Block 3) of the Inkai deposit by JV Inkai
from 2006 to 2016.
During the period from 2006 to 2013, an extensive exploration-delineation drilling program was carried out at
Block 3, consisting of 3,640 drillholes. This was in addition to the historic 489 holes drilled prior to JV Inkai
obtaining it licenses for Inkai.
The first phase of the drilling program, from 2006 through 2009, was focused on drilling on an 800 x 50-metre
grid pattern in the southwestern part of Block 3. The mineralization trends were also followed along the
northwestern border using sparser (800 to 1,600 x 100 to 200-metre) drilling patterns. It resulted in the
identification of extensive uranium mineralization hosted by several units, and traced along approximately 25
kilometres from Block 2 in the southwest through to the northeastern border of Block 3.
The second phase of the drilling program, from 2010 to May 2011, was aimed at developing an 800 x 50-
metre infill drilling grid pattern throughout the mineralized trend identified along the northwestern border, as
well as the trend developed along the southern border. In addition, the 200 x 50-metre drilling grids patterns
started to be developed in the southwestern part of Block 3 with the goal of identifying sites and designing test
wellfields in the Lower Inkuduk and Lower Mynkuduk horizons.
The third phase of drilling started in June 2011 and continued until the end of 2013. Progressively tightening
drilling grids (from 800 x 50-metre to 400 x 50-metre to 200 x 50-metre) were used to delineate mineralization
in the southwestern, western and northern parts of Block 3.
In the fourth phase of drilling, during the second half of 2016, 69 infill delineation holes were drilled on a 100 x
50-metre grid on a selected site focusing on the Mynkuduk mineralization to confirm the continuity of the
mineralization and its categorization. Thirty-nine drillholes were drilled at the test leach wellfields to study the
recovery process.
1.7 Block 3 appraisal program
Exploration work on Block 3 has identified extensive mineralization hosted by several horizons and traced
along 25 kilometres. This discovery requires further assessment of its commercial viability. A Cameco
subsidiary funded JV Inkai’s Block 3 exploration work. JV Inkai is operating a test mine at Block 3.
12 2017 INKAI OPERATION TECHNICAL REPORT
Approvals
Since 2009, JV Inkai has received a number of approvals extending the exploration period at Block 3. The
latest one in November 2016, extended the exploration period until July 13, 2018.
In 2011, JV Inkai obtained government approval to carry out delineation drilling, uranium resource estimation,
construction and operation of a TLF and completion of a pre-feasibility study.
In February 2017, JV Inkai submitted an updated estimate of in-situ uranium mineralization and a study,
similar to a pre-feasibility study, to the Kazakh State Reserve Commission (SRC) for their approval.
Appraisal Work
Extensive exploration and delineation drilling was completed at Block 3 by JV Inkai from 2006 to 2016.
In 2011, JV Inkai began infrastructure development and completed engineering for a TLF for the Block 3
assessment program. In addition, a preliminary estimate of the mineralization on the southwestern corner of
Block 3 was prepared, which was reviewed and approved by the SRC.
In 2012, JV Inkai started drilling the test wellfields and started construction of the TLF.
In 2014, an interim report on exploration results and estimate of the mineralization at Block 3 was reviewed
and conditionally approved by the SRC.
In 2015, JV Inkai completed construction of the TLF and began pilot production from test wellfields. At
December 31, 2016, total production from test mining at Block 3 was 865,000 pounds of U3O8.
In 2017, JV Inkai plans to continue with pilot production from the TLF.
1.8 Blocks 1 and 2 development
A pilot test, using the ISR mining method, was performed in the northeast area of Block 1 starting in
December 1988. The pilot leach test in the north area of Block 2 was initiated in 2002.
In September 2005, JV Inkai decided to proceed with the main processing plant to be located at Block 1, and
construction began soon after. In 2009, construction of the main processing plant was completed and the
processing of solutions from Block 1 commenced. In February 2010, regulatory approval was received,
allowing full processing of uranium concentrate on site.
Also in 2009, JV Inkai constructed and began commissioning a satellite plant to process solution recovered
from Block 2. In 2011, JV Inkai received regulatory approval for processing at this satellite plant.
1.9 Mineral resources and mineral reserves
The estimated mineral resources and reserves at Inkai are located in Block 1 and Block 2. The preparation of
the resource models followed the SRC guidelines. They were created by Volkovgeology Joint Stock Company
(Volkovgeology), using the Grade-Thickness (GT) estimation method on 2-dimensional blocks in plan.
Volkovgeology is a subsidiary of Kazatomprom and is responsible for prospecting, exploration and
development of uranium deposits in Kazakhstan.
In 2003, Cameco performed a validation of the Kazakh reserve estimate for Block 1 and confirmed the
estimated pounds of uranium to within 2.5% of the Kazakh reserve estimate. The same Kazakh reserve
estimate was validated by an independent consulting firm in 2005. In 2007, Cameco and an independent
consulting firm verified the Kazakh reserves estimate for Block 2 and obtained results in agreement with the
Kazakh reserve estimate. In 2016, Cameco reviewed the criteria to align the Kazakh mineral resources and
mineral reserves classification system with the Canadian Institute of Mining, Metallurgy and Petroleum (CIM)
“Definition Standards - For Mineral Resources and Mineral Reserves” (Definition Standards). Where
previously the Kazakh categories C2 and C1 were directly reconciled to Inferred and Indicated respectively,
now C2 can be in the Inferred and Indicated categories and C1 in the Indicated and Measured categories.
The Block 1 mineral resources and reserves estimates are based on 991 surface drillholes. The Block 2
13 2017 INKAI OPERATION TECHNICAL REPORT
mineral resources and reserves estimates are based upon 1,441 drillholes. No mineral resources or reserves
are reported for Block 3 until approved by the SRC and the Implementation Agreement closes.
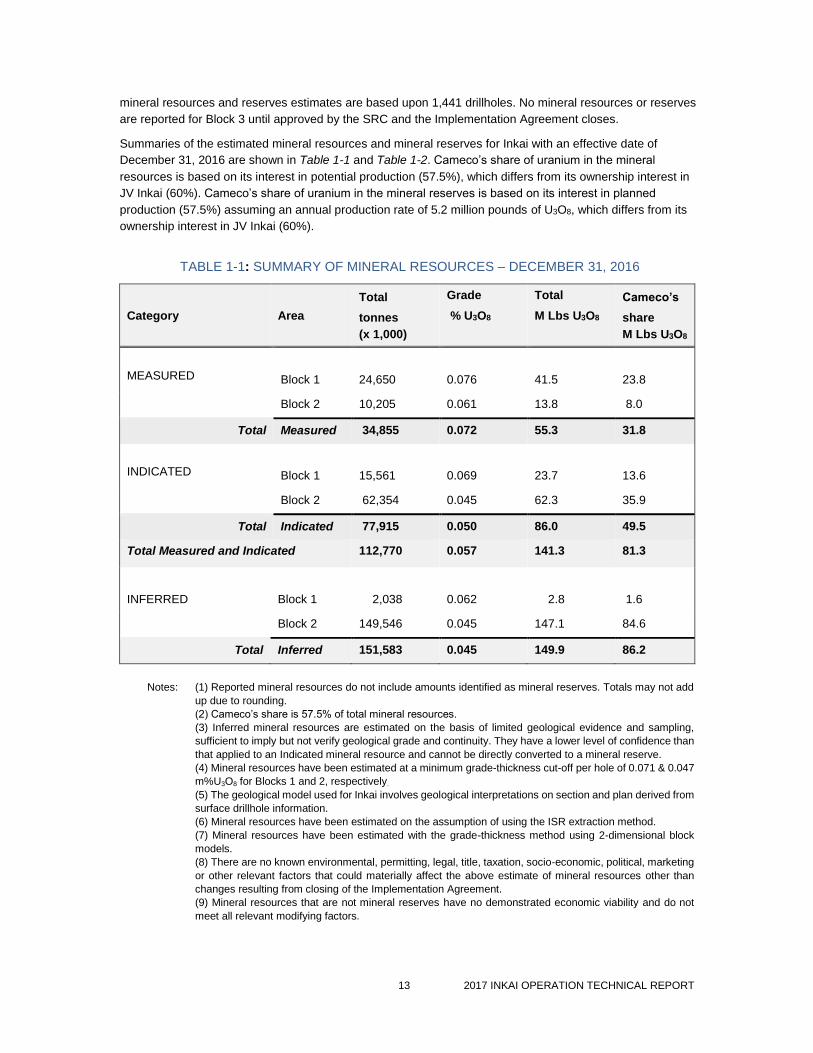
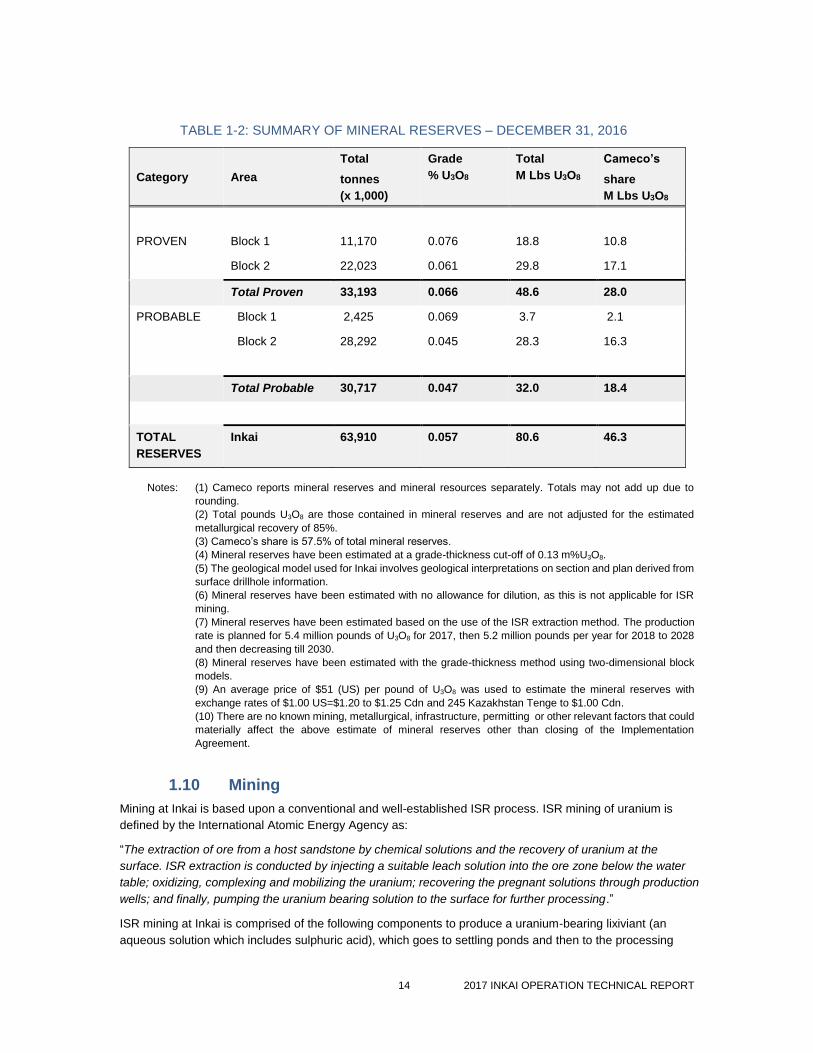
Summaries of the estimated mineral resources and mineral reserves for Inkai with an effective date of
December 31, 2016 are shown in Table 1-1 and Table 1-2. Cameco’s share of uranium in the mineral
resources is based on its interest in potential production (57.5%), which differs from its ownership interest in
JV Inkai (60%). Cameco’s share of uranium in the mineral reserves is based on its interest in planned
production (57.5%) assuming an annual production rate of 5.2 million pounds of U3O8, which differs from its
ownership interest in JV Inkai (60%).
TABLE 1-1: SUMMARY OF MINERAL RESOURCES – DECEMBER 31, 2016
Category Area
Total
tonnes
(x 1,000)
Grade
% U3O8
Total
M Lbs U3O8
Cameco’s
share
M Lbs U3O8
MEASURED
Block 1
24,650
0.076
41.5
23.8
Block 2 10,205 0.061 13.8 8.0
Total Measured 34,855 0.072 55.3 31.8
INDICATED
Block 1
15,561
0.069
23.7
13.6
Block 2 62,354 0.045 62.3 35.9
Total Indicated 77,915 0.050 86.0 49.5
Total Measured and Indicated 112,770 0.057 141.3 81.3
INFERRED
Block 1
2,038
0.062
2.8
1.6
Block 2 149,546 0.045 147.1 84.6
Total Inferred 151,583 0.045 149.9 86.2
Notes: (1) Reported mineral resources do not include amounts identified as mineral reserves. Totals may not add
up due to rounding.
(2) Cameco’s share is 57.5% of total mineral resources.
(3) Inferred mineral resources are estimated on the basis of limited geological evidence and sampling,
sufficient to imply but not verify geological grade and continuity. They have a lower level of confidence than
that applied to an Indicated mineral resource and cannot be directly converted to a mineral reserve.
(4) Mineral resources have been estimated at a minimum grade-thickness cut-off per hole of 0.071 & 0.047
m%U3O8 for Blocks 1 and 2, respectively.
(5) The geological model used for Inkai involves geological interpretations on section and plan derived from
surface drillhole information.
(6) Mineral resources have been estimated on the assumption of using the ISR extraction method.
(7) Mineral resources have been estimated with the grade-thickness method using 2-dimensional block
models.
(8) There are no known environmental, permitting, legal, title, taxation, socio-economic, political, marketing
or other relevant factors that could materially affect the above estimate of mineral resources other than
changes resulting from closing of the Implementation Agreement.
(9) Mineral resources that are not mineral reserves have no demonstrated economic viability and do not
meet all relevant modifying factors.
14 2017 INKAI OPERATION TECHNICAL REPORT
TABLE 1-2: SUMMARY OF MINERAL RESERVES – DECEMBER 31, 2016
Category Area
Total
tonnes
(x 1,000)
Grade
% U3O8
Total
M Lbs U3O8
Cameco’s
share
M Lbs U3O8
PROVEN Block 1 11,170 0.076 18.8 10.8
Block 2 22,023 0.061 29.8 17.1
Total Proven 33,193 0.066 48.6 28.0
PROBABLE Block 1 2,425 0.069 3.7 2.1
Block 2 28,292 0.045 28.3 16.3
Total Probable 30,717 0.047 32.0 18.4
TOTAL
RESERVES
Inkai 63,910 0.057 80.6 46.3
Notes: (1) Cameco reports mineral reserves and mineral resources separately. Totals may not add up due to
rounding.
(2) Total pounds U3O8 are those contained in mineral reserves and are not adjusted for the estimated
metallurgical recovery of 85%.
(3) Cameco’s share is 57.5% of total mineral reserves.
(4) Mineral reserves have been estimated at a grade-thickness cut-off of 0.13 m%U3O8.
(5) The geological model used for Inkai involves geological interpretations on section and plan derived from
surface drillhole information.
(6) Mineral reserves have been estimated with no allowance for dilution, as this is not applicable for ISR
mining.
(7) Mineral reserves have been estimated based on the use of the ISR extraction method. The production
rate is planned for 5.4 million pounds of U3O8 for 2017, then 5.2 million pounds per year for 2018 to 2028
and then decreasing till 2030.
(8) Mineral reserves have been estimated with the grade-thickness method using two-dimensional block
models.
(9) An average price of $51 (US) per pound of U3O8 was used to estimate the mineral reserves with
exchange rates of $1.00 US=$1.20 to $1.25 Cdn and 245 Kazakhstan Tenge to $1.00 Cdn.
(10) There are no known mining, metallurgical, infrastructure, permitting or other relevant factors that could
materially affect the above estimate of mineral reserves other than closing of the Implementation
Agreement.
1.10 Mining
Mining at Inkai is based upon a conventional and well-established ISR process. ISR mining of uranium is
defined by the International Atomic Energy Agency as:
“The extraction of ore from a host sandstone by chemical solutions and the recovery of uranium at the
surface. ISR extraction is conducted by injecting a suitable leach solution into the ore zone below the water
table; oxidizing, complexing and mobilizing the uranium; recovering the pregnant solutions through production
wells; and finally, pumping the uranium bearing solution to the surface for further processing.”
ISR mining at Inkai is comprised of the following components to produce a uranium-bearing lixiviant (an
aqueous solution which includes sulphuric acid), which goes to settling ponds and then to the processing
15 2017 INKAI OPERATION TECHNICAL REPORT
plants for production of uranium as yellowcake.
Determination of the GT cut-off for the initial design and the operating period. The design cut-off sets
a lower limit to the pounds per pattern required to warrant installation of a pattern before funds are
committed, and the operating cut-off applies to individual producer wells and dictates the lower limit
of operation once a well has entered production.
Preparation of a production sequence which will deliver the uranium-bearing lixiviant to meet
production requirements, considering the rate of wellfield uranium recovery, lixiviant uranium head
grades, and wellfield flow rates.
Wellfield development practices using an optimal pattern design to distribute barren lixiviant to the
wellfield injectors, and to then collect lixiviant, which carries the dissolved uranium, back to the main
processing plant or satellite plant, as the case may be.
The above factors are used to estimate the number of operating wellfields, wellfield patterns and header
houses over the production life. They also determine the unit cost of each of the mining components required
to achieve the production schedule, including drilling, wellfield installation and wellfield operation.
There is ongoing wellfield development in both Blocks 1 and 2 to support the current production plan.
1.11 Processing
As a result of extensive test work and operational experience, a very efficient process of uranium recovery
has been established. The process consists of the following major steps:
uranium in-situ leaching with a lixiviant
uranium adsorption from solution with IX resin
elution of uranium from resin with ammonium nitrate
precipitation of uranium as yellowcake with hydrogen peroxide and ammonia
yellowcake thickening, dewatering, and drying
packaging of dry yellowcake product in containers
All plants load and elute uranium from resin while the resulting eluate is converted to yellowcake at the main
processing plant. Inkai is designed to produce a dry uranium product that meets the quality specifications of
uranium refining and conversion facilities.
1.12 Environmental assessment and licensing
In the Resource Use Contract, JV Inkai committed to conducting its operations according to good international
mining practices. It complies with the environmental requirements of Kazakhstan legislation and regulations,
and, as an industrial company, it must also reduce, control or eliminate various kinds of pollution and protect
natural resources. JV Inkai is required to submit annual reports on pollution levels to the Republic of
Kazakhstan environmental, tax and statistics authorities. Regulatory authorities have the power to issue an
order reducing or halting production at a facility that violated environmental standards.
Environmental protection legislation in Kazakhstan has evolved rapidly, especially in recent years. As the
subsoil use sector has evolved, there has been a trend towards greater regulation, heightened enforcement
and greater liability for non-compliance. The most significant development was the adoption of the Ecological
Code in 2007. This code replaced the three main laws related to environmental protection. Amendments were
made to the code in 2011 that include more stringent environmental protection regulations, particularly relating
to the control of greenhouse gas emissions, obtaining environmental permits, state monitoring requirements
and other similar matters.
JV Inkai is required to comply with environmental requirements during all stages of operation, and develop an
16 2017 INKAI OPERATION TECHNICAL REPORT
environmental impact assessment for examination by a state environmental expert before making any legal,
organizational or economic decisions that could have an effect on the environment and public health.
Under the Ecological Code, JV Inkai needs an environmental permit to operate. The permit certifies the
holder's right to discharge emissions into the environment, provided that it complies with the requirements of
the permit and the Ecological Code. JV Inkai has a permit for environmental emissions and discharges for the
operation that is valid until December 31, 2022. JV Inkai also holds the required permits under the Water
Code which have various expiry dates.
As Inkai is a nuclear facility, JV Inkai is required to and currently holds the following additional material
licences relating to its mining activities:
“Licence for radioactive substances handling” valid till January 23, 2020
“Licence for operation of mining production and mineral raw material processing” with indefinite term
“Licence for transportation of radioactive substances within the territory of the Republic of
Kazakhstan” valid till January 23, 2020
“Licence for radioactive waste handling” valid till January 23, 2020.
In accordance with applicable legislation regulating permits and licences, JV Inkai is required to submit annual
reports to relevant state authorities. As is typical with any mineral extraction site, construction, operation, and
reclamation are subject to an ongoing process during which permits, licences, and approvals are requested,
monitored and reported on, expire, and are amended or renewed.
JV Inkai received a mining licence for Block 1 and an exploration with subsequent mining licence for Blocks 2
and 3 from the government of Kazakhstan in April 1999. (See Section 4.2, Exploration and mining licences,
for more information.)
The ISR mining method at Inkai uses acid in the mining solution to extract uranium from underground
non-potable aquifers. The injection and recovery system is engineered to prevent the mining solution from
migrating to the aquifer above the orebody, which has water with higher purity.
Kazakhstan does not require active restoration of post-mining groundwater. After a number of
decommissioning steps are taken, natural attenuation of the residual acid in the mined out horizon, as a
passive form of groundwater restoration, has been accepted. Attenuation is a combination of neutralization of
the groundwater residual acid content by interaction with the host rock minerals and other chemical reactions
which immobilize residual groundwater contaminants in the mined-out subsoil horizon. This approach is
considered acceptable because it results in water quality similar to the pre-mining baseline status.
JV Inkai’s decommissioning obligations are largely defined by the Resource Use Contract. It has deposited
the required contributions into a separate bank account as security to ensure it will meet its obligations.
Contributions are capped at $500,000 (US). JV Inkai has funded the full amount.
Under the Resource Use Contract, JV Inkai must submit a plan for decommissioning the property to the
government six months before mining activities are complete. It developed a preliminary decommissioning
plan to estimate total decommissioning costs, and updates the plan every five years, or when there is a
significant change at the operation that could affect decommissioning estimates. The plan was most recently
revised in 2016. The preliminary decommissioning estimate is $10 million (US).
JV Inkai has environmental insurance, as required by the Ecological Code and the Resource Use Contract as
well as the required civil liability insurance.
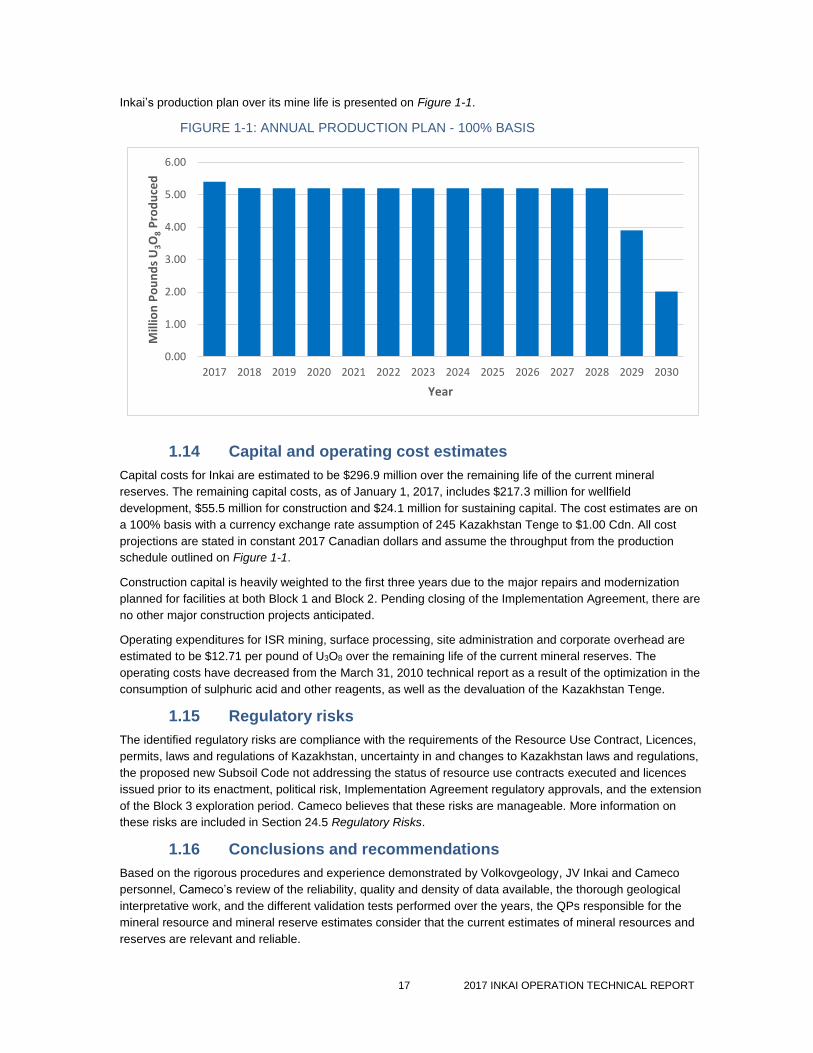
1.13 Production plan and mine life
The production plan presented in this technical report is based on Inkai mineral reserves from which the
production of 68.5 million pounds of U3O8 is forecast. The projected remaining mine life is 13.3 years.
17 2017 INKAI OPERATION TECHNICAL REPORT
Inkai’s production plan over its mine life is presented on Figure 1-1.
FIGURE 1-1: ANNUAL PRODUCTION PLAN - 100% BASIS
1.14 Capital and operating cost estimates
Capital costs for Inkai are estimated to be $296.9 million over the remaining life of the current mineral
reserves. The remaining capital costs, as of January 1, 2017, includes $217.3 million for wellfield
development, $55.5 million for construction and $24.1 million for sustaining capital. The cost estimates are on
a 100% basis with a currency exchange rate assumption of 245 Kazakhstan Tenge to $1.00 Cdn. All cost
projections are stated in constant 2017 Canadian dollars and assume the throughput from the production
schedule outlined on Figure 1-1.
Construction capital is heavily weighted to the first three years due to the major repairs and modernization
planned for facilities at both Block 1 and Block 2. Pending closing of the Implementation Agreement, there are
no other major construction projects anticipated.
Operating expenditures for ISR mining, surface processing, site administration and corporate overhead are
estimated to be $12.71 per pound of U3O8 over the remaining life of the current mineral reserves. The
operating costs have decreased from the March 31, 2010 technical report as a result of the optimization in the
consumption of sulphuric acid and other reagents, as well as the devaluation of the Kazakhstan Tenge.
1.15 Regulatory risks
The identified regulatory risks are compliance with the requirements of the Resource Use Contract, Licences,
permits, laws and regulations of Kazakhstan, uncertainty in and changes to Kazakhstan laws and regulations,
the proposed new Subsoil Code not addressing the status of resource use contracts executed and licences
issued prior to its enactment, political risk, Implementation Agreement regulatory approvals, and the extension
of the Block 3 exploration period. Cameco believes that these risks are manageable. More information on
these risks are included in Section 24.5 Regulatory Risks.
1.16 Conclusions and recommendations
Based on the rigorous procedures and experience demonstrated by Volkovgeology, JV Inkai and Cameco
personnel, Cameco’s review of the reliability, quality and density of data available, the thorough geological
interpretative work, and the different validation tests performed over the years, the QPs responsible for the
mineral resource and mineral reserve estimates consider that the current estimates of mineral resources and
reserves are relevant and reliable.
0.00
1.00
2.00
3.00
4.00
5.00
6.00
2017 2018 2019 2020 2021 2022 2023 2024 2025 2026 2027 2028 2029 2030
Mill
ion
Po
un
ds
U3O
8P
rod
uce
d
Year
18 2017 INKAI OPERATION TECHNICAL REPORT
From 2009 till end of 2016, JV Inkai produced 36.7 million pounds of U3O8 (Cameco’s share 21.5 million) from
Blocks 1 and 2. Cameco believes that Blocks 1 and 2 have the potential to sustain production levels, as
outlined in this technical report. The current mine plan represents an operating mine life of 13.3 years, during
which Inkai is forecast to produce an estimated 68.5 million pounds of U3O8.
Based on exploration and development to date, Cameco and the authors of this report are of the opinion that
Block 3 has the potential to support a commercial operation.
Given that Inkai is in production, that it has sufficient mineral reserves to produce at the current licensed
production rate, and that leach tests on Block 3 are in progress, the authors of this technical report consider
that it is not necessary to recommend further exploration activities. In areas of probable mineral reserves
where the confidence on some characteristics of the mineralization, such as grade continuity and hydrological
conditions, can be increased, additional delineation drilling is recommended.
Over the life of the operation and at higher production rates, the accumulation of specific ionic species in the
holding ponds could reduce surface equipment performance. It is recommended that the concentration of
ionic species be monitored.
The Implementation Agreement provides for annual production at Inkai to be ramped up to 10.4 million
pounds of U3O8 over three years following receipt of the required approvals. It is recommended that technical
studies related to the production ramp-up be completed and submitted in a timely manner.
If the Implementation Agreement closes, the estimated mineral resources and mineral reserves of Inkai, and
Cameco’s share of them, will change materially.
19 2017 INKAI OPERATION TECHNICAL REPORT
2 Introduction
2.1 Introduction and purpose
Inkai is a material property for Cameco under Canadian securities laws.
This technical report has been prepared for Cameco by internal QPs in support of the disclosure of scientific
and technical information relating to Inkai contained in Cameco’s annual Management’s Discussion and
Analysis for the year ended December 31, 2016 filed with Canadian securities regulators on February 9, 2017
and Cameco’s Annual Information Form and Form 40-F for the year ended December 31, 2016.
The report has an effective date of December 31, 2016, and has been prepared in accordance with NI 43-101
by the following individuals:
Darryl Clark, PhD, P. Geo., Managing Director, Cameco Kazakhstan LLP
Alain G. Mainville, P. Geo., Director, Mineral Resources Management, Cameco Corporation
Stuart B. Soliz, P. Geo., Principal Geologist, Power Resources, Inc. (operating as Cameco
Resources)
Robert J. Sumner, PhD, P. Eng., Principal Metallurgist, Technical Services, Cameco Corporation.
These individuals are the qualified persons responsible for the content of this technical report. All four have
visited Inkai.
Alain G. Mainville has visited the Inkai site and JV Inkai’s head office on four occasions in the last three years,
the latest being on November 20-22, 2016. The scope of his personal visits included meetings with JV Inkai,
Kazatomprom and Volkovgeology personnel and field inspections of drilling, sampling, core logging, sample
preparation and assaying, radiometric downhole surveys, geological modelling, mineral resources and mineral
reserves estimation, production reconciliation and mine plans. Mr. Mainville has been involved with Inkai since
2002.
Darryl Clark is based in Astana, Kazakhstan. He routinely visits the Inkai site and JV Inkai’s office in
Shymkent to meet with JV Inkai management and personnel to review aspects of the operation, including
exploration, operations and mine development. Mr. Clark has been involved with Inkai since 2014, as General
Director till the end of 2016.
Stuart B. Soliz has visited the Inkai site on eight occasions, the latest occurring March 1-8 2017. The scope of
his last personal visit to the Inkai site included meetings with JV Inkai personnel to review the development
status of technical documents related to the Implementation Agreement, including the Life of Mine plan. Mr.
Soliz has been involved with Inkai since 2014.
Robert Sumner has visited the Inkai site on one occasion on February 3-6, 2016. The scope of the visit
included meetings with JV Inkai personnel to review the surface processing facilities. Mr. Sumner has been
involved with Inkai since 2015.
2.2 Report basis
This technical report has been prepared with available internal Cameco and JV Inkai data and information, as
well as data and information prepared for Inkai. The principal technical documents and files relating to Inkai
that were used in preparation of this technical report are listed in Section 27 References.
All monetary references in this technical report are expressed in Canadian dollars, unless otherwise indicated.
Illustrations (Figures) in this technical report are from Cameco, Kazatomprom and JV Inkai, and are dated
December 31, 2016, unless otherwise specified.
The technical and scientific information in this technical report does not reflect the material changes that
would result upon closing of the Implementation Agreement since it is still subject to obtaining all required

20 2017 INKAI OPERATION TECHNICAL REPORT
government approvals. If the Implementation Agreement closes, the estimated mineral resources and mineral
reserves of Inkai and Cameco’s share will change materially.
21 2017 INKAI OPERATION TECHNICAL REPORT
3 Reliance on other experts
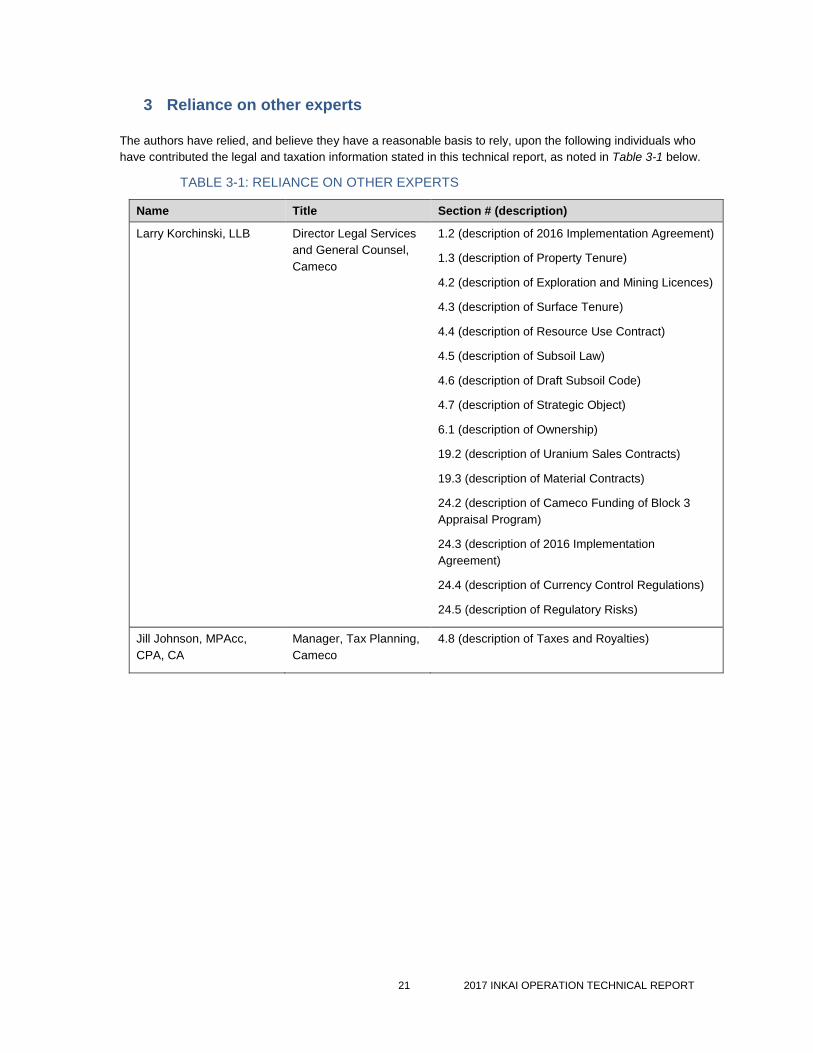
The authors have relied, and believe they have a reasonable basis to rely, upon the following individuals who
have contributed the legal and taxation information stated in this technical report, as noted in Table 3-1 below.
TABLE 3-1: RELIANCE ON OTHER EXPERTS
Name Title Section # (description)
Larry Korchinski, LLB Director Legal Services
and General Counsel,
Cameco
1.2 (description of 2016 Implementation Agreement)
1.3 (description of Property Tenure)
4.2 (description of Exploration and Mining Licences)
4.3 (description of Surface Tenure)
4.4 (description of Resource Use Contract)
4.5 (description of Subsoil Law)
4.6 (description of Draft Subsoil Code)
4.7 (description of Strategic Object)
6.1 (description of Ownership)
19.2 (description of Uranium Sales Contracts)
19.3 (description of Material Contracts)
24.2 (description of Cameco Funding of Block 3
Appraisal Program)
24.3 (description of 2016 Implementation
Agreement)
24.4 (description of Currency Control Regulations)
24.5 (description of Regulatory Risks)
Jill Johnson, MPAcc,
CPA, CA
Manager, Tax Planning,
Cameco
4.8 (description of Taxes and Royalties)
22 2017 INKAI OPERATION TECHNICAL REPORT
4 Property description and location
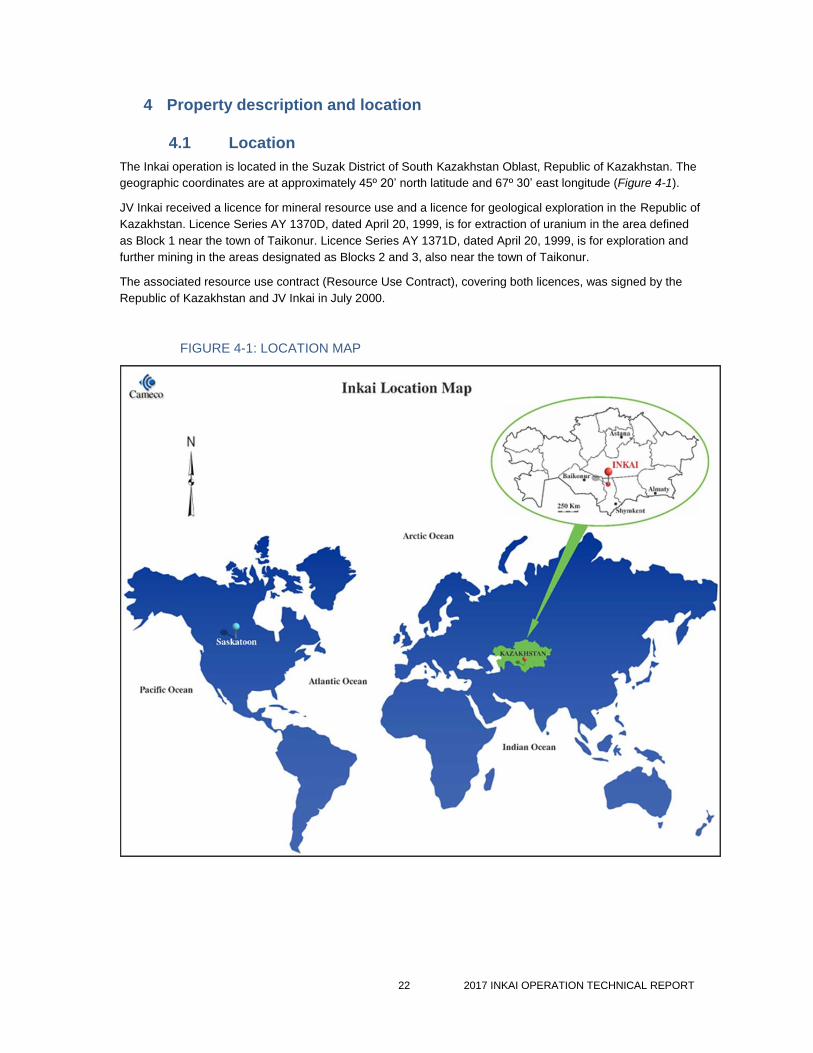
4.1 Location
The Inkai operation is located in the Suzak District of South Kazakhstan Oblast, Republic of Kazakhstan. The
geographic coordinates are at approximately 45º 20’ north latitude and 67º 30’ east longitude (Figure 4-1).
JV Inkai received a licence for mineral resource use and a licence for geological exploration in the Republic of
Kazakhstan. Licence Series AY 1370D, dated April 20, 1999, is for extraction of uranium in the area defined
as Block 1 near the town of Taikonur. Licence Series AY 1371D, dated April 20, 1999, is for exploration and
further mining in the areas designated as Blocks 2 and 3, also near the town of Taikonur.
The associated resource use contract (Resource Use Contract), covering both licences, was signed by the
Republic of Kazakhstan and JV Inkai in July 2000.
FIGURE 4-1: LOCATION MAP
23 2017 INKAI OPERATION TECHNICAL REPORT
4.2 Exploration and mining licences
JV Inkai holds two licences issued on April 20, 1999: Licence AY 1370D and Licence AY 1371D (Licences).
Licence Series AY 1370D allows for the mining of uranium in a 16.58 square-kilometre area, designated as
Block 1 in the Suzak District of the Republic of Kazakhstan. Mining is to be conducted in the Inkuduk and
Mynkuduk horizons, which are at depths ranging from 300 to 520 metres from the surface. Licence AY 1370D
includes Appendix 1 (mining allotment) and Appendix 2, which provides a list of geographical co-ordinates of
14 points defining the licence area. The term of the licence is 25 years from the licence issue date.
Licence Series AY 1371D allows for the exploration and further mining of uranium in a 470 square-kilometre
area, designated as Block 2 (about 230 square kilometres) and Block 3 (about 240 square kilometres) in the
Suzak District of the Republic of Kazakhstan. Licence Series AY 1371D includes Appendix 1 (exploration
allotment) and Appendix 2, which provides a list of geographic coordinates- of 21 points. The term of the
licence is 31 years from the licence issue date.
In 2008, JV Inkai received initial approval for mining for Block 2. In December 2008, JV Inkai was issued a
new mining allotment. It consists of both the original mining allotment for Block 1 and the newly added area of
the mining allotment for Block 2. This mining allotment contains two tables with geographic co-ordinates of the
corner points. The Block 1 mining area is 16.58 square kilometres, and the depth of mining from 300 to 540
metres. The table for Block 1 contains the same 14 points as was in the original mining allotment. The table
for Block 2 contains 20 points. The Block 2 mining area is 164.0 square kilometres, and the depth of mining is
down to 520 metres.
The mining licence for Block 2 expires in April 2030. The mining licence for Block 1 expires in April 2024.
The Licences themselves do not grant subsoil use rights in Kazakhstan, rather, the right arises on the basis of
both the Licences and the Resource Use Contract. Please refer to Section 4.4 Resource Use Contract for the
discussion of the Resource Use Contract.
The exploration period for Block 3 has been extended to July 13, 2018 by amendments to the Resource Use
Contract. See Section 4.4 Resource Use Contract for more information.
4.3 Surface tenure
Under Kazakhstan law, subsoil and mineral resources belong to the Republic of Kazakhstan. Currently, the
Republic of Kazakhstan provides access to subsoil and mineral resources under a resource use contract.
Minerals extracted from subsoil by a subsoil user under a resource use contract are the property of the subsoil
user unless the Subsoil Law or a resource use contract provides otherwise.
Under the Resource Use Contract and the Licences, JV Inkai has the rights to explore for and to extract
uranium from the subsoil and JV Inkai owns uranium extracted from the subsoil.
A subsoil use contract gives the contractor a right to use the surface of the property while exploring, mining
and reclaiming the land. However, this right must be set forth in a surface lease agreement with the applicable
local administrative authorities.
On a regular basis, JV Inkai obtains from local authorities the necessary surface lease agreements for new
buildings and infrastructure. JV Inkai does not hold surface leases for the entire area that is subject to the
Licences. It obtains them gradually only for surface area required for exploration, mining or construction of
new infrastructure.
For more information on subsoil use rights, terms, and termination of the Licences and the Resource Use
Contract, please refer to Sections 4.2, 4.4, and 4.5.
24 2017 INKAI OPERATION TECHNICAL REPORT
4.4 Resource Use Contract
The Resource Use Contract was signed by the Republic of Kazakhstan and JV Inkai in July 2000. Under the
Subsoil Law, JV Inkai holds its rights to Blocks 1, 2 and 3, on the basis of the Licences it received for those
blocks and the Resource Use Contract. JV Inkai also has obligations under the Licences and the Resource
Use Contract with which it must comply in order to maintain its rights to Blocks 1, 2 and 3.
In 2007, Amendment No. 1 to the Resource Use Contract was signed to extend the exploration period at
Blocks 2 and 3.
In 2009, Amendment No. 2 to the Resource Use Contract was signed to:
extend the exploration period for Block 3 until July 13, 2010
provide final approval for mining at Block 2
combine Blocks 1 and 2 for mining and reporting purposes
adopt the new Tax Code of the Republic of Kazakhstan (Tax Code) that took effect January 1, 2009
reflect current Kazakhstan legal and policy requirements for subsoil users, like JV Inkai, to procure
goods, works and services under certain prescribed procedures and foster greater local content. As
a result, at least 40% of the cost of equipment and materials purchased must be for equipment and
materials of Kazakhstan origin and 90% of the contract work must be of Kazakhstan origin
require a certain level of Kazakhstan employment by JV Inkai: 100% of workers; at least 70% of
technical and engineering staff; and at least 60% of the management staff. All of these percentages
are measured over the life of the Resource Use Contract.
In 2011, Amendment No. 3 to the Resource Use Contract was signed to:
increase annual production from Blocks 1 and 2 to 3.9 million pounds of U3O8
carry out a five-year assessment program (to July 2015) at Block 3 that includes delineation drilling,
uranium resource estimation, construction and operation of a TLF and completion of a feasibility
study.
In 2013, Amendment No. 4 to the Resource Use Contract was signed to increase annual production from
Blocks 1 and 2 to 5.2 million pounds of U3O8.
In November 2016, Amendment No.5 to the Resource Use Contract was signed, extending the exploration
period at Block 3 to July 13, 2018.
The Implementation Agreement contemplates certain amendments to the Resource Use Contract. For more
information, see Section 24.3 2016 Implementation Agreement
In addition to complying with its obligations under the Licences and the Resource Use Contract, JV Inkai, like
all subsoil users, is required to abide by the work program appended to its Resource Use Contract, which
relates to its mining operations. See Section 4.5.5 Work programs and project documentation for more
information.
4.5 Subsoil Law
The principal legislation governing subsoil exploration and mining activity in Kazakhstan is the Law on the
Subsoil and Subsoil Use, dated June 24, 2010, as amended (Subsoil Law) which superseded the previous
law on subsoil and subsoil use dated January 27, 1996, as amended (Old Subsoil Law). In general, the
Licences held by JV Inkai are governed by the version of the Old Subsoil Law in effect at the time of their
issuance in April, 1999 and the current Subsoil Law applies only if it does not worsen JV Inkai’s position.
25 2017 INKAI OPERATION TECHNICAL REPORT
The Subsoil Law defines the framework and the procedures connected with the granting of subsoil rights and
the regulation of the activities of subsoil users. The subsoil, including mineral resources in their underground
state, are Kazakhstan state property, while resources brought to the surface belong to the subsoil user, unless
otherwise provided by contract or laws of the Republic of Kazakhstan.
In order to develop mineral resources, the appropriate state agency (Competent Authority), grants exploration
and production rights to third parties. Subsoil rights are granted for a specific period, but may be extended
prior to the expiration of the applicable contract or licence. Currently, the Ministry of Energy of the Republic of
Kazakhstan is the Competent Authority
Subsoil rights become effective upon execution of a contract with the Competent Authority. Pursuant to the
Subsoil Law, a subsoil user is accorded, inter alia, the exclusive right to conduct mining operations, to erect
production facilities, to freely dispose of its share of production and to conduct negotiations for extension of
the contract, subject to restrictions and requirements set out in the Subsoil Law.
Until amendments to the Old Subsoil Law in August 1999, both a licence and a contract were required for
exploration and production. Combined licences (both exploration and production) were granted for a period
that included exploration and production licence periods (up to six and 25 years respectively), including any
permitted extensions. Both exploration and production licences were required to contain, among other things,
information concerning the licensee, the boundaries of the contract area, the term of the licence and the date
of commencement of work, the type of contract (exploration or production), the minimum work program,
environmental and safety obligations and conditions for extending the licence term.
In August 1999, the Kazakhstan government abolished the licence regime for subsoil use rights granted after
September 1999. Thus, from September 1999 onward, subsoil use rights have been granted on the basis of a
resource use contract alone. However, all licences previously issued remain valid. An entity which obtained its
subsoil use right prior to August 1999 holds such rights on the basis of a subsoil use licence and a resource
use contract. An entity which obtained a subsoil use right after August 1999 holds its rights on the basis of a
resource use contract alone.
The subsoil use rights held by JV Inkai came into effect upon the issuance of its Licences (April 1999), the
execution of its Resource Use Contract (July 2000), and approval of the Resource Use Contract by applicable
state entities.
In accordance with the August 1999 amendments to the Old Subsoil Law and the current Subsoil Law,
Cameco believes the Licences held by JV Inkai are governed by the version of the Old Subsoil Law in effect
at the time of their issuance in April, 1999.
To date, the Subsoil Law has not had a significant impact upon JV Inkai; however, Cameco continues to
assess the impact. Some of the general impact is described below in the remaining parts of this Section 4.5
Subsoil Law
4.5.1 Stabilization clause
The general stabilization provision has been changed in the Subsoil Law. Under the Old Subsoil Law,
changes in legislation that worsened the position of the subsoil user did not apply to resource use contracts
signed or licences granted before the changes were adopted.
While the Subsoil Law still contains the above guarantees, it expands the list of exceptions such as national
defence or security, ecological safety, public health, taxation, and customs. The Republic of Kazakhstan has
gradually weakened the stabilization guarantee, particularly in relation to the new projects, and the national
security exception is applied broadly to encompass security over strategic national resources.
Amendment No. 2 to the Resource Use Contract eliminated the tax stabilization provision that applied to JV
Inkai.
4.5.2 Transfer of subsoil use rights and pre-emptive rights
Amendments to the Old Subsoil Law of December 2004 and October 2005, provide the Republic of
26 2017 INKAI OPERATION TECHNICAL REPORT
Kazakhstan with a pre-emptive right to acquire subsurface use rights and equity interests in entities holding
subsoil use rights and in any entity which may directly or indirectly determine or exert influence on decisions
made by a subsoil user, if the main activity of such entity is related to subsoil use in Kazakhstan, when such
entity wishes to transfer such rights or interests. This pre-emptive right is also provided by the Subsoil Law
and it permits the Republic of Kazakhstan to purchase any subsoil use rights or equity interests being offered
for transfer on terms no less favourable than those offered by other purchasers. The pre-emptive right has
been recently limited to the deposits of strategic importance; however, Inkai is a deposit of strategic
importance and therefore still subject to the pre-emptive right of the state.
The Competent Authority has the right to terminate a subsoil contract if a transaction takes place in breach of
this law. According to the Subsoil Law requirements, these provisions apply both to Kazakhstan and overseas
entities, including publicly traded companies.
The Subsoil Law provides that assignments and transfers of subsoil use rights may be made only with the
prior consent of the Competent Authority. During its tenure as the Competent Authority, the Ministry of
Energy of the Republic of Kazakhstan customarily interpreted this requirement widely to include any
alienation of rights, including, for example, in bankruptcy or by merger or amalgamation. Transactions
entered into and implemented without such consent as well as those implemented six months after the
consent is granted are invalid.
The Subsoil Law also provides that once the approved transaction is completed, the Competent Authority
must be informed within five business days. Failure to notify the Competent Authority in time is grounds for
invalidation of the transaction.
See Section 4.7 Strategic object for information on additional requirements to dispose of an interest in JV
Inkai.
4.5.3 Dispute resolution
The dispute resolution procedure in the Subsoil Law does not specifically disallow international arbitration.
Instead it states that if a dispute related to a resource use contract cannot be resolved by negotiation, the
parties can resolve the dispute according to the laws of Kazakhstan and international treaties ratified by the
Republic of Kazakhstan.
The Resource Use Contract allows for international arbitration. Cameco believes the Subsoil Law does not
affect this right.
4.5.4 Contract termination
Under the Subsoil Law, the Competent Authority can unilaterally terminate a contract before it expires if:
a subsoil user does not fix more than two breaches of its obligations provided by the resource use
contract specified in a notice by the Competent Authority within a specific period (non-compliance
with project documents are excluded from the grounds for termination)
subsoil rights or an object connected with the subsoil use rights (direct and indirect ownership
interests in a subsoil user) are transferred without consent of the Competent Authority if such consent
was required
less than 30% of the financial obligations under a contract are fulfilled during two consecutive years
activities of a subsoil user exploring or developing a strategic deposit entails such changes in the
economic interests of the state that it poses a threat to national security and the subsoil user does
not satisfy the Competent Authority’s request to amend the resource use contract in this regard.
Under the Resource Use Contract, if JV Inkai breaches its obligations, the Competent Authority has to notify
JV Inkai of the breach and provide a reasonable period for JV Inkai to fix the breach before it can terminate
the contract. Cameco believes that the terms of the Resource Use Contract should continue to apply unless
27 2017 INKAI OPERATION TECHNICAL REPORT
the state seeks to apply the national security or environmental protection exception to the guarantee of legal
stability.
4.5.5 Work programs and project documentation
In addition to following its obligations under its Licences and the Resource Use Contract, JV Inkai, like all
subsoil users, is required to abide by the work program, which is a mandatory part of the Resource Use
Contract, and which relates to its operations over the life of the mine.
Work programs must be developed in accordance with project documents. The Subsoil Law establishes three
types of project documents, depending on the type and stage of the work:
exploration project: none for JV Inkai
appraisal project: Block 3
mining project documents: Block 1 and Block 2.
The project documents are developed and undergo a review and approval process. All work must be in
compliance with the project documents, and conducting any work without an approved project document, or in
non-compliance with it, is not permitted. Since January 2015, subsoil users are allowed to produce within 20%
(above or below) their licensed capacity in a year without triggering a requirement to redo the project
document for the work program. Any other changes in the work program require application to the Competent
Authority.
Subsoil users who received subsoil rights before the Subsoil Law was introduced were required to:
develop new project documentation to be approved by July 7, 2011
develop a new work program in accordance with the project documentation to be approved by
January 7, 2012.
JV Inkai submitted the required documentation and received approval of the new work program as part of
the April 2011 approval of Amendment No. 3 to the Resource Use Contract. An updated work program, to
increase the annual production rate to 5.2 million pounds of U3O8 (100% basis), was submitted to the
Competent Authority in 2012 and was approved in December 2013 in connection with Amendment No. 4 to
the Resource Use Contract. An updated work program for the Block 3 appraisal project was submitted and
approved in connection with the November 2016 Amendment No. 5 to the Resource Use Contract.
The Subsoil Law repealed the previous requirement for annual work plans. Instead, expected exploration
and production for each year are now set out in one work program.
4.5.6 Procurement requirements
Under Subsoil law, all subsoil users, including JV Inkai, must procure goods, works and services for subsoil
use operations under prescribed statutory procedures.
Kazakhstan law unifies the procurement process and now requires procurements from open tender, single
source, price request and digital procurement to be conducted with mandatory use of the register of goods,
works and services (the register of potential suppliers) or other digital procurement systems which is
synchronized with this register. Subsoil users are also required to develop annual, mid-term and long-term
procurement programs based on the work program and respective budget.
JV Inkai currently procures goods, works and services according to Kazakhstan law and the Resource Use
Contract, following the annual approval of its procurement plan.
4.5.7 Local content requirements
Since 2002, Kazakhstan has implemented a policy aimed at replacing imports, and fostering greater
involvement, support and stimulation of local producers and local employees. Under this policy, subsoil users
are obliged to purchase local works and services and hire local personnel in such percentages as may be
specified in their resource use contracts.
28 2017 INKAI OPERATION TECHNICAL REPORT
In 2012 Kazakhstan amended the Subsoil Law to retroactively mandate all subsoil users to use unified
terminology and to report on local content pursuant to a newly introduced unified methodology. However,
since accession to the World Trade Organization, Kazakhstan amended its local content requirements,
abolishing the local content requirements for goods. If this requirement remains in resource use contracts
entered into prior to January 1, 2015, it must be removed if the term of the contract is amended; otherwise it
would have been automatically abolished on January 1, 2012. Nonetheless, the Subsoil Law still imposes
local content requirements for works, services and employees.
The Resource Use Contract imposes local content requirements on JV Inkai with respect to employees,
goods, works and services. As a result, at least 40% of the costs of goods and equipment must be for
equipment and materials purchased of local origin, 90% of the contract work (i.e. works and services) must be
of local origin, and 100%, 70% and 60% of employees depending on qualifications (workers, engineers and
management, respectively) must be of local origin. The Resource Use Contract has not been amended to
remove the local content requirements for goods yet and it will continue to apply to goods procured by JV
Inkai until either it is amended or January 1, 2021, whichever comes first.
4.5.8 Strategic deposits
On August 13, 2009, a governmental resolution “On Determination of the List of Subsoil (Deposit) Areas
having Strategic Importance” No. 1213 came into force whereby 231 blocks, including all three of JV Inkai’s
Blocks, were prescribed as strategic deposits. The Kazakhstan government re-approved this list in 2011 and
JV Inkai’s Blocks remain on it.
Under the Subsoil Law, if a subsoil user's actions in the performance of subsoil use operations with respect to
strategic deposits result in a change to the economic interests of the Republic of Kazakhstan which create a
threat to national security, the Competent Authority is entitled to require an amendment to the resource use
contract for the purpose of restoring the economic interests of the Republic of Kazakhstan. The Subsoil Law
prescribes strict deadlines for the parties to negotiate and execute any such required amendments.
The Subsoil Law also allows the Competent Authority, with the consent of the Republic of Kazakhstan, to
unilaterally refuse to perform its obligations under a contract if it determines that the subsoil use operations
conducted thereunder will result in a change in the economic interests of Kazakhstan, which create a threat to
national security. In such circumstances, the Competent Authority must provide not less than two months prior
notice of such refusal. Under this provision, the Competent Authority also has the right to unilaterally terminate
a contract without having to comply with the civil law provisions requiring a party to apply to a court or
arbitration panel for termination.
The basis for exercise by the Competent Authority of any of these powers is a “change in the economic
interests of the Republic of Kazakhstan which creates a threat to national security”, which might be interpreted
broadly.
4.6 Draft Subsoil Code
At present, the subsoil use sector in Kazakhstan is regulated by the Subsoil Law (as defined in Section 4.5
Subsoil Law above) and related regulations. Currently, the Republic of Kazakhstanis developing a draft
comprehensive code – the Subsoil and Subsoil Use Code (Subsoil Code or Code). It is to supersede the
current Subsoil Law and related regulations for the purpose of consolidation of the legislation in this area.
The Kazakhstan government initially planned to finalize and introduce a draft Subsoil Code to the Parliament
in November 2016. However, as at the date of this technical report the Subsoil Code is still at the stage of
development. It is expected to be enacted in the second half of 2017.
The overview below is therefore based upon the most recent available draft of the Subsoil Code dated
December 22, 2016. It is possible that at the time of its adoption the Subsoil Code could be significantly
different than the current draft version.
29 2017 INKAI OPERATION TECHNICAL REPORT
4.6.1 Re-introduction of the licencing regime
The draft Subsoil Code reintroduces the licencing regime, which was in effect until 1999. If adopted in its
current form, the Subsoil Code would provide that a subsoil use right with respect to solid minerals and
geological exploration of the subsoil would be granted on the basis of a licence only. The regime of the
resource use contracts would only apply to exploration and production rights of hydrocarbons. Thus, the rights
to explore for and produce uranium will continue to be provided on the basis of a licence.
A competent authority and a subsoil user would still be able to enter into a contract for extraction of solid
minerals provided that the subsoil user’s investment commitments is not less than a minimum amount
stipulated under the Code. However, such a contract would no longer serve as the basis for the creation and
termination of the subsoil use right which would only be granted under a licence. Instead, a contract would
function as an agreement setting out in more detail the parties’ terms of cooperation and the terms of
extraction of minerals. The execution of such a contract may not serve as basis for granting a licence.
The previous edition of the draft Subsoil Code dated May 2016 provided that any licences issued and
contracts executed before the enactment of the Subsoil Code would remain valid. However, the December
2016 draft of the Subsoil Code no longer contains these transitional provisions. Therefore, status of the
validity of the Resource Use Contract and JV Inkai’s Licences under the Subsoil Code is unclear. It remains to
be seen if the final version of the Code provides clarity.
4.6.2 Stabilization clause
The Subsoil Code provides new tests for the application of stabilization which are (i) establishment or
aggravation of liability, or (ii) imposition of new obligations, and (ii) new obligations which define another terms
of the subsoil use operation that are detrimental to the results of such operations. It seems that the new
stabilization clause aims to clarify the stability and at the same time to provide the subsoil user with the ability
to use the new right granted by the laws adopted after the date of the respective contracts/licences.
4.6.3 Dispute resolution
The Subsoil Code grants the subsoil user recourse to arbitration subject to the following conditions: (i) the
subsoil user incurred expenses equivalent to an amount stipulated under the Code over the course of its
subsoil operations; (ii) the dispute is compensation of the subsoil user’s losses caused by revocation of
licence or a violation by the subsoil user of the Subsoil Code that may lead to early revocation of licence. In
case of the subsoil user’s referral of the dispute to arbitration (subject to the conditions described above) the
consent of the state is deemed to have been granted.
The Subsoil Code is silent on the status of arbitration clauses contained in resource use contracts currently in
effect. The December 2016 draft of the Code no longer contains transitional provisions providing that the
contracts executed before its enactment would remain valid. It may be that the dispute settlement provisions
of the draft Subsoil Code will be further refined.
4.6.4 Transfer of subsoil use rights and pre-emptive rights
The Subsoil Code maintains the state’s control over transactions involving subsoil use rights and direct and
indirect ownership interests in a subsoil user. Like the current law, the Subsoil Code establishes that transfers
of subsoil use rights, transfers of shares/interests in subsoil users and grant of security over a subsoil use
right require consent of the competent authority. At the same time, unlike the current law, the Subsoil Code
provides a completely new approach, the proposed test for the application of the consent is a transfer of
subsoil user right (its share) or a change in direct and indirect controlling persons. Where the direct control
means (i) holding 25% of shares (interest, convertible securities (convertible into shares)), or (ii) having 25%
of votes in the highest management body, or (iii) having the right to determine decision under the law or
contract, or (iv) receiving 25% of distributed net profit); and indirect control means control of the company
having direct control over another company. Accordingly, transfers between shareholders having less than
25% of shares (vote or net profit) would not be subject to the consent.
Moreover, the Subsoil Code provides more exemptions from the requirement to obtain consent and excludes
30 2017 INKAI OPERATION TECHNICAL REPORT
inter alia transfer of subsoil user rights or shares in controlling persons within the same person (i.e. no change
in shareholders but only change in the shareholding), intragroup transfers, change of type of legal entity
(transformation) and reduction of shareholders of the controlling entity (buy out).
Similarly to the current law, the Subsoil Code establishes the state’s priority right to purchase any subsoil use
right and interest in the respective subsoil user and interest in persons controlling such subsoil user under the
contract on use where the site is of strategic importance. The above mentioned test on control and
exemptions from the consent requirements are also applicable to the state priority right.
Unlike the current law, the Subsoil Code provides which deposit may be recognized as having strategic
importance and refers only to hydrocarbons but does not list uranium. Therefore, it is unclear whether uranium
fields would or would not be recognized as fields of strategic importance.
4.7 Strategic object
Kazakhstan law (Civil Code and the Law on State Property) defines the term “strategic object” and provides
that imposition of encumbrances and their alienation is subject to the approval of the Kazakhstan government.
In addition, the Law on State Property provides that the Republic of Kazakhstan shall have the priority right to
purchase the strategic object being disposed of.
The Civil Code provides a general description of objects which might be recognized as strategic objects while
Decree No. 651 of the Republic of Kazakhstan dated June 30, 2008 approves a specific list of objects
qualified as strategic (the “List of Strategic Objects”). While a 40% interest in JV Inkai held by the
Kazatomprom was on the List of Strategic Objects since 2008, Cameco’s 60% interest in JV Inkai was
included on the List of Strategic Objects only in August 2012.
Accordingly, any encumbrances and disposal of an interest in JV Inkai requires a decree of the Republic of
Kazakhstan and waiver of priority right by the Republic of Kazakhstan.
4.8 Taxes and royalties
The Resource Use Contract lists the taxes, duties, fees, royalties and other governmental charges that are
payable by JV Inkai, including income tax, value added tax, excise tax, excess profits tax, social tax, land tax,
transportation tax, royalties on uranium extracted, commercial discovery bonus and custom duties, subject to
changes due to the elimination of the tax stabilization provision in October 2009 noted below.
However, on January 1, 2009, a new Tax Code took effect. Pursuant to the Tax Code, a number of changes
have been introduced to the taxation regime of subsoil users.
The most significant changes to the tax regime previously applicable to the Resource Use Contract introduced
by the Tax Code are as follows:
The abolition of the stabilization of tax regimes provided by resource use contracts. Prior to
Amendment No. 2 being signed, the Resource Use Contract contained a tax stabilization provision.
In October 2009, JV Inkai signed this amendment to the Resource Use Contract to adopt the Tax
Code, which included elimination of this tax stabilization provision.
The rate of corporate income tax on aggregate income has been 20% since January 1, 2009. In
2007, JV Inkai became subject to payment of the income tax. Under the Resource Use Contract,
corporate income tax rate was 30%.
The Tax Code has replaced the previous royalty regime with a new tax – the Tax on Production of
Useful Minerals, a mineral extraction tax previously defined as MET. MET must be paid on minerals
and certain other substances extracted. The rate in the Tax Code used to calculate MET on uranium
(production solution) is currently 18.5%. Under the prior law, JV Inkai would pay royalties, calculated
on a graduated scale, based on the sale price of production in each year.
31 2017 INKAI OPERATION TECHNICAL REPORT
Under the Resource Use Contract, a one-time commercial discovery bonus is payable when
confirmation is received of Kazakh-defined recoverable reserves located in a particular licensed area.
Under the Tax Code, the rate for future commercial discoveries is increased to 0.1% of the value of
Kazakh-defined recoverable reserves. Previously, the bonus was calculated as 0.05% of the value
of Kazakh-defined recoverable reserves.
The Tax Code changes the calculation of excess profits tax from that contained in the Resource Use
Contract. However, JV Inkai is currently of the view that it will not be liable to pay any excess profits
tax for the foreseeable future.
4.9 Known environmental liabilities
For a discussion of known environmental liabilities, see Section 20.1.5 Known environmental liabilities.
4.10 Permitting
For a discussion on permitting, see Section 20.1.2 Permitting.
4.11 Factors affecting access to the property
Known factors and risks that may affect access, title and right to work on the property are described below.
Under the Resource Use Contract and Licenses, JV Inkai has the rights to explore for and to extract uranium
from the subsoil and it owns the uranium extracted from the subsoil. Its ability to conduct these activities,
however, depends upon compliance with its obligations under the Resource Use Contract, the Licenses and
laws of Kazakhstan, as well as ongoing support, agreement and co-operation from the government of
Kazakhstan.
Under Kazakhstan law, the state has the right to nationalize private property by enacting a law on
nationalization. As of the date of this technical report, Kazakhstan has not exercised such right but the risk of
nationalization of JV Inkai’s property still exists.
The Subsoil Law lists the violations which entitle the Competent Authority to unilateral termination of a
resource use contract (for more details please refer to Section 4.5.4 Contract termination). If JV Inkai or its
participants commit any of these violations, there is a risk of JV Inkai losing its subsoil use rights due to
unilateral termination by the Competent Authority.
The Subsoil Law provides the state with the right to demand the amendments of the resource use contract if
activities of a subsoil user, exploring or developing a strategic deposit, entail such changes in the economic
interests of the Republic of Kazakhstan that pose a threat to national security. This in turn might entail a risk
of diminishment of JV Inkai’s rights. The right to demand amendments might be applied broadly by the
Republic of Kazakhstan leading to a risk of (i) curtailment of JV Inkai’s rights or (ii) termination of the
Resource Use Contract and the Licences. For more details please refer to Section 4.5.4 Contract termination.
JV Inkai is required to hold, and it does hold, a number of licences and permits (including but not limited to
ecological permits) and therefore, must comply with their requirements. Failure to obtain and to comply with
the requirements of licences and permits could result in the activities JV Inkai performs under a licence or
permit being limited. For example, without an ecological permit, JV Inkai will be unable to conduct subsoil
operations.
Generally, other breaches of law and/or contractual obligations (such as failure to pay taxes, breach of regular
contract, or causing damages to a third party) may also lead to limitation of the right to use JV Inkai’s property.
Please see Section 24.5.1 Kazakhstan laws and regulations for a discussion of other risks that may affect
access, title and right to work on the property.
32 2017 INKAI OPERATION TECHNICAL REPORT
5 Accessibility, climate, local resources, infrastructure and
physiography
5.1 Access
The Inkai operation is located near the town of Taikonur, approximately 350 kilometres northwest of the city of
Shymkent and approximately 155 kilometres east of the city of Kyzl-Orda in the south-central region of
Kazakhstan. Taikonur can be reached from Astana or Almaty by flying to one of the regional cities of
Shymkent or Kyzl-Orda, then driving on paved roads (Figure 5-1). The road to Taikonur is currently the
primary access road for transportation of people, supplies and uranium product for JV Inkai.
Major airline service is available to Astana and Almaty from Europe, Russia, China and other countries in the
region. From Astana or Almaty, commercial airline services are available to Shymkent and Kyzl-Orda. The
flight from Almaty to Kyzl-Orda is a two-hour trip. The four-hour drive from Kyzl-Orda is on paved roads for
130 kilometres to the town of Shieli and then for 160 kilometres to Taikonur. The total trip time through
Shymkent from Almaty is about eight hours for 470 kilometres on a paved road.
Rail transportation is available from Almaty to Shymkent then northwest to Shieli, Kyzl-Orda and beyond. A
rail line also runs from the town of Dzhambul to Kazatomprom’s Centralia facility to the south of Taikonur.
5.2 Climate
Inkai lies in the Betpak Dala Desert. The ground consists of extensive sand deposits, with vegetation limited to
grasses and occasional low bushes. Major hydrographic systems in the area include the Shu, Sarysu and
Boktykaryn rivers. These rivers typically exhibit surface water flow in May and June and revert to isolated
reaches with salty water during the rest of the year.
The climate in south central Kazakhstan is semi-arid, with temperatures ranging from -35°C in the winter to
+40°C in the summer. January is the coldest month, with an average temperature of -9°C. July is the warmest
month, when temperatures climb to an average of +28°C. The climate of the region is continental,
characterized by harsh winters and hot summers, low humidity and low precipitation. The daily fluctuation in
air temperature during the summer can be up to 14°C.
The average precipitation varies from 130 to 140 millimetres per year, with snow accounting for 22 to 40% of
this amount. The average air humidity is typically in the range of 56 to 59%.
The region is also characterized by strong winds. The prevailing direction of the wind is northeast, averaging
3.8 to 4.6 metres per second. Dust storms are common.
Site operations are carried out throughout the year, despite the cold winter and hot summer conditions.
5.3 Physiography
The surface elevation at Inkai ranges from 140 to 300 metres above mean sea level. The Inkai deposit is sub-
divided into two morphologically diverse regions:
the sandy-brackish intercontinental deltas of Shu and Sarysu rivers
the Betpak Dala Plateau
The sandy-brackish intercontinental deltas of the Shu and Sarysu rivers are located in the hollow between the
elevation of the Betpak Dala plateau and the Karatau Mountain range. This plain has numerous brackish and
lacustrine basins, dry river-beds, former river-beds, and aeolian relief of various configurations. The Betpak
Dala is a slightly sloping and slanted north to south plain with deflationary basins and rare arched ridges.
5.4 Local resources
Currently, Taikonur has a population of about 680 people who are mainly employed in uranium development
and exploration. Whenever possible, JV Inkai hires personnel from Taikonur and surrounding villages. The
33 2017 INKAI OPERATION TECHNICAL REPORT
town has a school, medical clinic and small store. Most of the food is purchased in Shymkent or Shieli.
5.5 Infrastructure
Inkai is a developed producing property with sufficient surface rights to meet future mining operation needs for
the current mineral reserves as well as site facilities and infrastructure. The electrical supply for Inkai is from
the national power grid. Inkai is connected to the grid via a 35-kilovolt power line, which is a branch of the
circuit that supplies the Stepnoye mine east of Inkai. In case of power outage, there are standby generators.
Telephone communications utilize a satellite internet system.
Inkai has access to sufficient water from groundwater wells for all planned industrial activities. Potable water
for use at the camp and at the site facilities is supplied from shallow wells on site. The water systems include
well houses, pump stations, storage for reserve demands and fire protection and distribution to points of use
and fire protection mains. Sewage disposal is in a standard septic tank and leach field system.
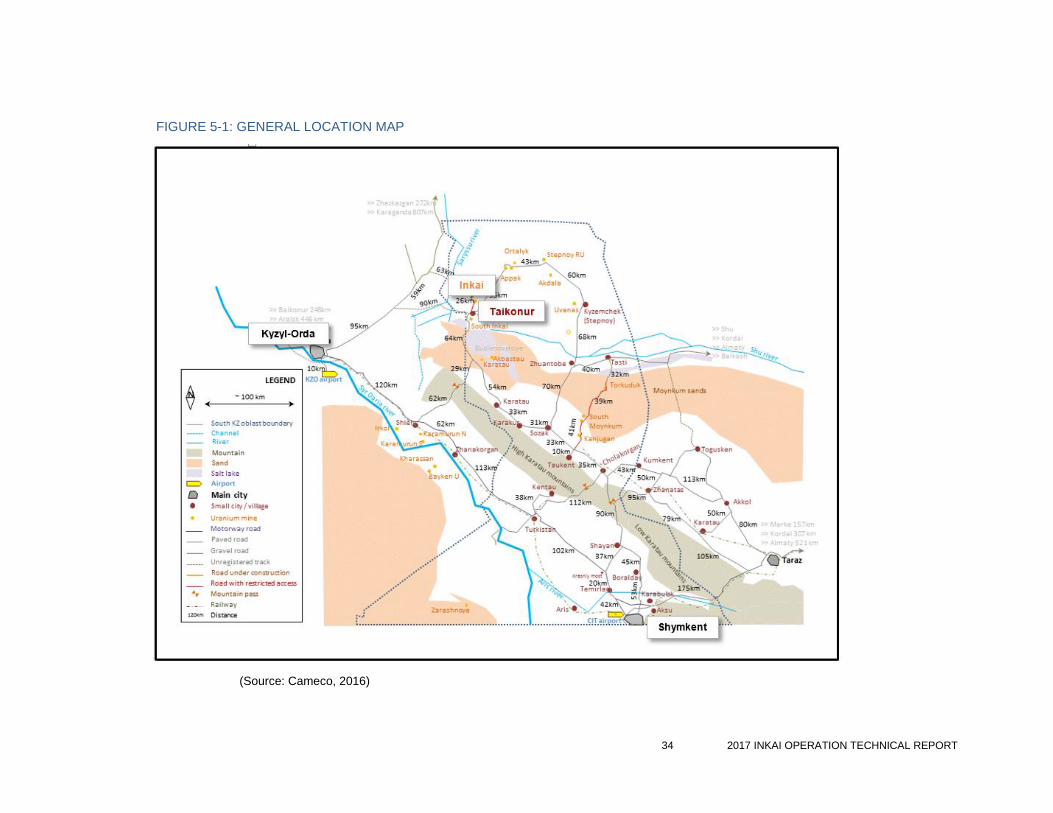
34 2017 INKAI OPERATION TECHNICAL REPORT
FIGURE 5-1: GENERAL LOCATION MAP
(Source: Cameco, 2016)
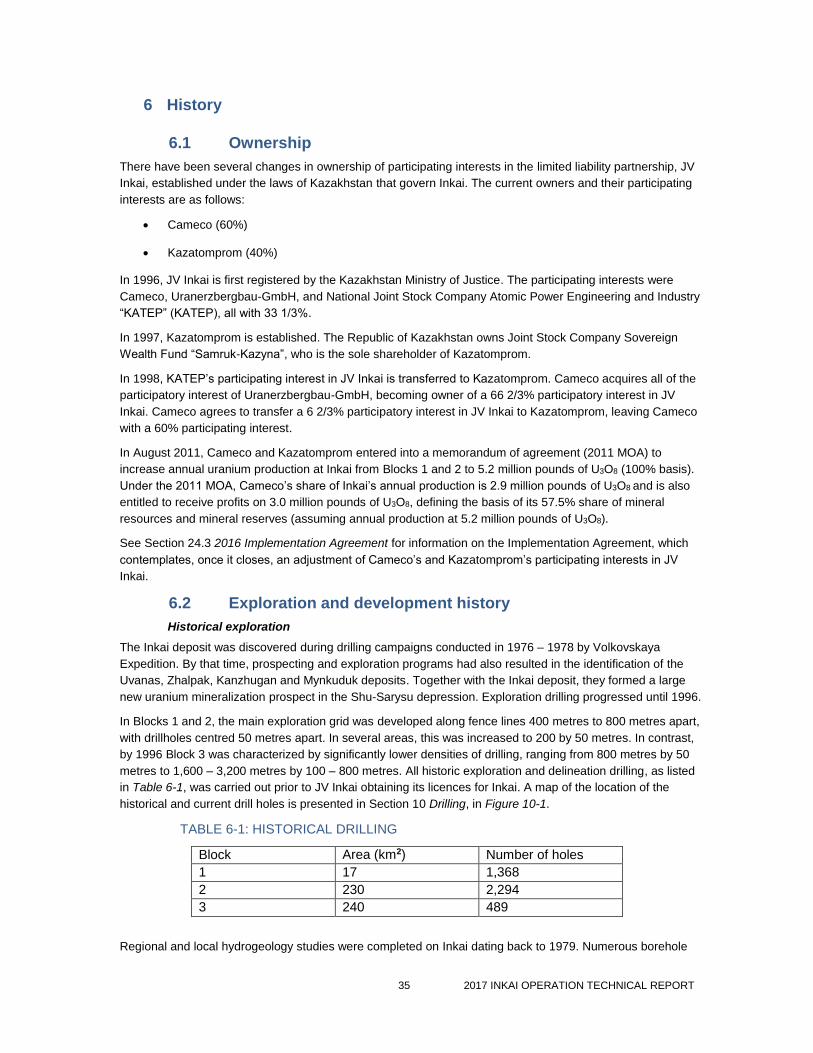
35 2017 INKAI OPERATION TECHNICAL REPORT
6 History
6.1 Ownership
There have been several changes in ownership of participating interests in the limited liability partnership, JV
Inkai, established under the laws of Kazakhstan that govern Inkai. The current owners and their participating
interests are as follows:
Cameco (60%)
Kazatomprom (40%)
In 1996, JV Inkai is first registered by the Kazakhstan Ministry of Justice. The participating interests were
Cameco, Uranerzbergbau-GmbH, and National Joint Stock Company Atomic Power Engineering and Industry
“KATEP” (KATEP), all with 33 1/3%.
In 1997, Kazatomprom is established. The Republic of Kazakhstan owns Joint Stock Company Sovereign
Wealth Fund “Samruk-Kazyna”, who is the sole shareholder of Kazatomprom.
In 1998, KATEP’s participating interest in JV Inkai is transferred to Kazatomprom. Cameco acquires all of the
participatory interest of Uranerzbergbau-GmbH, becoming owner of a 66 2/3% participatory interest in JV
Inkai. Cameco agrees to transfer a 6 2/3% participatory interest in JV Inkai to Kazatomprom, leaving Cameco
with a 60% participating interest.
In August 2011, Cameco and Kazatomprom entered into a memorandum of agreement (2011 MOA) to
increase annual uranium production at Inkai from Blocks 1 and 2 to 5.2 million pounds of U3O8 (100% basis).
Under the 2011 MOA, Cameco’s share of Inkai’s annual production is 2.9 million pounds of U3O8 and is also
entitled to receive profits on 3.0 million pounds of U3O8, defining the basis of its 57.5% share of mineral
resources and mineral reserves (assuming annual production at 5.2 million pounds of U3O8).
See Section 24.3 2016 Implementation Agreement for information on the Implementation Agreement, which
contemplates, once it closes, an adjustment of Cameco’s and Kazatomprom’s participating interests in JV
Inkai.
6.2 Exploration and development history
Historical exploration
The Inkai deposit was discovered during drilling campaigns conducted in 1976 – 1978 by Volkovskaya
Expedition. By that time, prospecting and exploration programs had also resulted in the identification of the
Uvanas, Zhalpak, Kanzhugan and Mynkuduk deposits. Together with the Inkai deposit, they formed a large
new uranium mineralization prospect in the Shu-Sarysu depression. Exploration drilling progressed until 1996.
In Blocks 1 and 2, the main exploration grid was developed along fence lines 400 metres to 800 metres apart,
with drillholes centred 50 metres apart. In several areas, this was increased to 200 by 50 metres. In contrast,
by 1996 Block 3 was characterized by significantly lower densities of drilling, ranging from 800 metres by 50
metres to 1,600 – 3,200 metres by 100 – 800 metres. All historic exploration and delineation drilling, as listed
in Table 6-1, was carried out prior to JV Inkai obtaining its licences for Inkai. A map of the location of the
historical and current drill holes is presented in Section 10 Drilling, in Figure 10-1.
TABLE 6-1: HISTORICAL DRILLING
Block Area (km2) Number of holes
1 17 1,368
2 230 2,294
3 240 489
Regional and local hydrogeology studies were completed on Inkai dating back to 1979. Numerous borehole

36 2017 INKAI OPERATION TECHNICAL REPORT
tests characterize the four aquifers within the Inkai deposit: the Uvanas, Zhalpak, Inkuduk and Mynkuduk.
Main processing and satellite plants
A pilot test, using the ISR mining method, was performed in the northeast area of Block 1 starting in
December 1988. The pilot leach test in the north area of Block 2 was initiated in 2002.
In September 2005, JV Inkai decided to proceed with the main processing plant to be located at Block 1, and
construction began soon after. Commissioning of the front half of the main processing plant was completed
during the fourth quarter of 2008, and the processing of solutions from Block 1 commenced.
In 2009, construction of the main processing plant was completed, and in February 2010, regulatory approval
to commission the main processing plant was received, allowing full processing of uranium concentrate on
site. Also in 2009, JV Inkai constructed and began commissioning a satellite plant to process solution
recovered from Block 2. In 2011, JV Inkai received regulatory approval for processing at the first satellite
plant. In 2010 planning began for the engineering and construction of a TLF at Block 3. In 2015 JV Inkai
completed construction of the Block 3 TLF and began pilot production from test wellfields.
6.3 Historical mineral resource and mineral reserve
There are no historical mineral resources and mineral reserve estimates within the meaning of NI 43-101 to
report.
6.4 Historical production
A pilot test, using the ISR mining method, was performed in the northeast area of Block 1 starting in
December 1988. The test lasted for 495 days and recovered approximately 92,900 pounds of U3O8. The pilot
leach test in the north area of Block 2 started in 2002 and was completed in 2006. Commercial production
started in 2009. Inkai production from Blocks 1 and 2 to year-end 2016 is shown in Table 6-2.
TABLE 6-2: INKAI BLOCK 1 AND BLOCK 2 URANIUM PRODUCTION
Period Blocks Production
(M Lbs U3O8)
Cameco’s share
(M Lbs U3O8)
1988 – 1990 1 0.1 -
2002 – 2006 2 2.0 1.2
2007 2 0.3 0.2
2008 2 0.5 0.3
2009 1 & 2 1.9 1.1
2010 1 & 2 4.3 2.6
2011 1 & 2 4.2 2.5
2012 1 & 2 4.4 2.6
2013 1 & 2 5.3 3.1
2014 1 & 2 5.0 2.9
2015 1 & 2 5.8 3.4
2016 1 & 2 5.9 3.4
2009-16 Total 36.7 21.5
JV Inkai is licensed to produce at an annual rate of 5.2 million pounds of U3O8. During 2015, the Subsoil Law
in Kazakhstan was amended to allow producers to produce within 20% (above or below) of their licensed
production rate in a year.
Block 3 ISR test was started in 2015 and is ongoing. At December 31, 2016, total production from test mining
at Block 3 was 865,000 pounds.
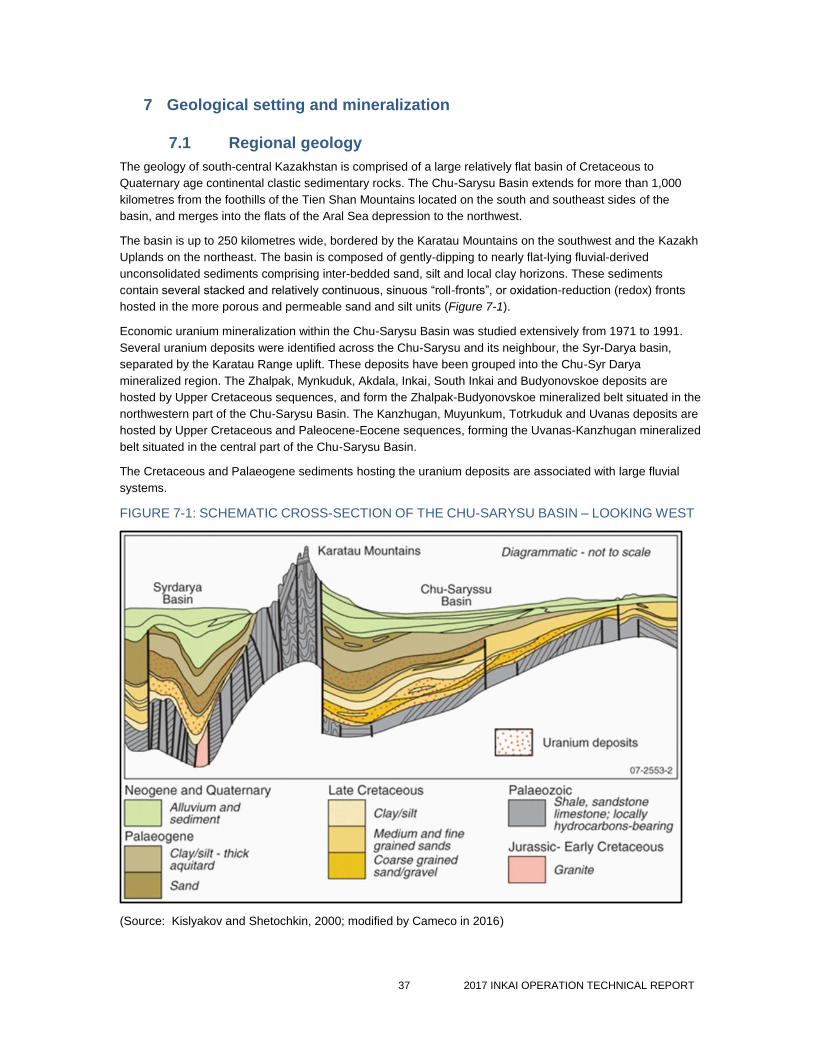
37 2017 INKAI OPERATION TECHNICAL REPORT
7 Geological setting and mineralization
7.1 Regional geology
The geology of south-central Kazakhstan is comprised of a large relatively flat basin of Cretaceous to
Quaternary age continental clastic sedimentary rocks. The Chu-Sarysu Basin extends for more than 1,000
kilometres from the foothills of the Tien Shan Mountains located on the south and southeast sides of the
basin, and merges into the flats of the Aral Sea depression to the northwest.
The basin is up to 250 kilometres wide, bordered by the Karatau Mountains on the southwest and the Kazakh
Uplands on the northeast. The basin is composed of gently-dipping to nearly flat-lying fluvial-derived
unconsolidated sediments comprising inter-bedded sand, silt and local clay horizons. These sediments
contain several stacked and relatively continuous, sinuous “roll-fronts”, or oxidation-reduction (redox) fronts
hosted in the more porous and permeable sand and silt units (Figure 7-1).
Economic uranium mineralization within the Chu-Sarysu Basin was studied extensively from 1971 to 1991.
Several uranium deposits were identified across the Chu-Sarysu and its neighbour, the Syr-Darya basin,
separated by the Karatau Range uplift. These deposits have been grouped into the Chu-Syr Darya
mineralized region. The Zhalpak, Mynkuduk, Akdala, Inkai, South Inkai and Budyonovskoe deposits are
hosted by Upper Cretaceous sequences, and form the Zhalpak-Budyonovskoe mineralized belt situated in the
northwestern part of the Chu-Sarysu Basin. The Kanzhugan, Muyunkum, Totrkuduk and Uvanas deposits are
hosted by Upper Cretaceous and Paleocene-Eocene sequences, forming the Uvanas-Kanzhugan mineralized
belt situated in the central part of the Chu-Sarysu Basin.
The Cretaceous and Palaeogene sediments hosting the uranium deposits are associated with large fluvial
systems.
FIGURE 7-1: SCHEMATIC CROSS-SECTION OF THE CHU-SARYSU BASIN – LOOKING WEST
(Source: Kislyakov and Shetochkin, 2000; modified by Cameco in 2016)

38 2017 INKAI OPERATION TECHNICAL REPORT
7.1.1 Hydrostratigraphy of the Chu-Sarysu Basin
Hydrostratigraphy plays key roles both in the formation of the uranium sandstone deposits and in mining them
using the ISR method.
The Inkai deposit is located in the north-western part of the Suzak artesian basin that comprises two
hydrogeological stages, an upper platform stage and a lower basement stage.
The upper platform stage is related to Quaternary-Neogene and Palaeogene-Cretaceous deposits. The
hydrogeological section of the platform stage reveals two hydrogeological sub-stages. The upper
hydrogeological sub-stage is the Betpak Dala aquifer (fine-grain sands) and other aquifers of sporadic
occurrence. In general, these aquifers contain brackish and saline water not suitable for drinking. These upper
aquifers are hydraulically isolated from the lower hydrogeological sub-stage aquifers by the regional Intymak
clay aquitard of the Lower and Upper Eocene which is about 100 to 150 metres thick.
The lower basement stage contains groundwater in fractured rocks of Palaeozoic age. It contains four
aquifers within Palaeocene and Upper Cretaceous strata, listed from top to bottom as follows:
Uvanas aquifer: contains fresh groundwater suitable for household and drinking purposes. The
Uvanas aquifer is widely used in the region for domestic and livestock water supply. In the nearest
vicinity of the deposit, in the town of Taikonur, there are six domestic water supply boreholes
operated on the Uvanas aquifer. Additionally, outside Inkai, but in its vicinity, there are a few free-
flowing artesian boreholes tapping groundwater from the Uvanas aquifer for livestock watering
Zhalpak aquifer: contains slightly brackish water which can be used for watering livestock. The
aquifer is accessed by wells in proximity to Inkai. Groundwater from the Zhalpak aquifer is used for
industrial and partial drinking water supply in the vicinity of the deposit site
Inkuduk aquifer: contains brackish and slightly brackish water not suitable for drinking
Mynkuduk aquifer: contains brackish and slightly brackish water not suitable for drinking.
Groundwater movement in the Chu-Sarysu Basin is towards the north-westerly discharge areas. The annual
natural flow rate averages one to four metres, depending on the various permeabilities of the different sand
horizons.
The lower aquifers have a common recharge area (the Karatau ridge and the Tien-Shan Mountains) and
discharge into topographic depressions of the region-saline lands of Ashikol, Askazansor, and Lake Arys.
Regional groundwater flows north-north-west. Permian claystones and siltstones underlay Mynkuduk aquifer
and appear to be a regional aquitard. Elsewhere in the region, the groundwater is tapped by numerous
boreholes for livestock watering. Groundwater of lower aquifers is not used at Inkai or in the surrounding area.
7.2 Local and property geology
The stratigraphic sequence at Inkai ranges from Cretaceous though to Quaternary sediments. A schematic
stratigraphic cross-section of Inkai is presented in Figure 7-2.
Neogene-Quaternary sediments of continental origin form the uppermost cover. They do not host significant
uranium occurrences. These are underlain by 100 to 150 metres of Palaeogene clay-dominated marine
sediments. Elsewhere in the basin, these display a lower facies transition zone of brackish sediments that
hosts the uranium deposits of Tortkuduk and of the Taukent area (Kanzhugan and Moynkum).
The underlying Upper Cretaceous strata are divided into three horizons, listed from youngest to oldest: the
Zhalpak horizon; the Inkuduk horizon; and the Mynkuduk horizon.
Zhalpak horizon
The Zhalpak horizon is Campanian-Maastrichtian in age, and is generally comprised of a medium grained
sand, with occasional clay layers.
Inkuduk horizon
The Inkuduk horizon is Coniacian-Santonian in age, and is typified by medium to coarse-grained sands, with

39 2017 INKAI OPERATION TECHNICAL REPORT
occasional gravels.
In the Inkuduk horizon, there are three sub-horizons representing indistinct transgressive alluvial cycles
composed of several incomplete elementary rhythms. Lower and middle sub-horizons are composed mainly
of coarse clastic sediments of channel facies while the upper sub-horizon is made of floodplain channel
formations. The thickness of the Inkuduk horizon is up to 120 metres, and the depth to the bottom varies from
300 to 420 metres at the Inkai deposit, being a function of both basin architecture and the topography.
The general plan of the river network at the time within the deposit did not change significantly. Relatively
dissected topography, closeness of uplifted alimentation zones facilitated deposition of mottled and coarse
clastic poor sorted sediments alternating in the section. Interbeds of siltstone-sand clays, medium and fine
grained sands are subordinate in the Inkuduk horizon.
Mynkuduk horizon
The Mynkuduk horizon is Turonian in age, uncomfortably overlying the Permian argillites and dominated by
fine to medium-grained sands. These sands are generally well sorted, reflecting a probable overbank
environment.
Sediments of the Mynkuduk horizon represent an alluvial cycle of the first order where several (up to ten)
elementary rhythms with a thickness up to several metres can be identified. Each of them begins with coarse,
poorly sorted gravel, inequigranular sands with gravel and pebble and ends with small, clastic rocks,
sometimes interbeds (up to 20 centimetres) of dense sands with carbonaceous cement. In some areas in the
basal part of the horizon, mottled sandy clays and siltstones of floodplain facies are developed.
The dominating colour of the rocks is greyish-green to light-grey for the channel sand-gravel sediments. The
total thickness of the sediments of the Mynkuduk horizon in the area is 60 to 80 metres.
Regular alternation of channel sediments with floodplain sediments is characteristic of lateral direction, where
initial mottled and green sand-clay formations in floodplains and watersheds are replaced by channel
midstream, grey bar-sand rocks.
The depth to the Paleozoic unconformity increases to the west and south. At the east end of the Mynkuduk
deposit, the unconformity is at a depth of about 250 metres. It deepens to 350 to 400 metres where the
Mynkuduk and the Inkai deposits meet, to 500 to 600 metres at the south end of Inkai, and to more than 700
metres at Budyonovskoe deposit.
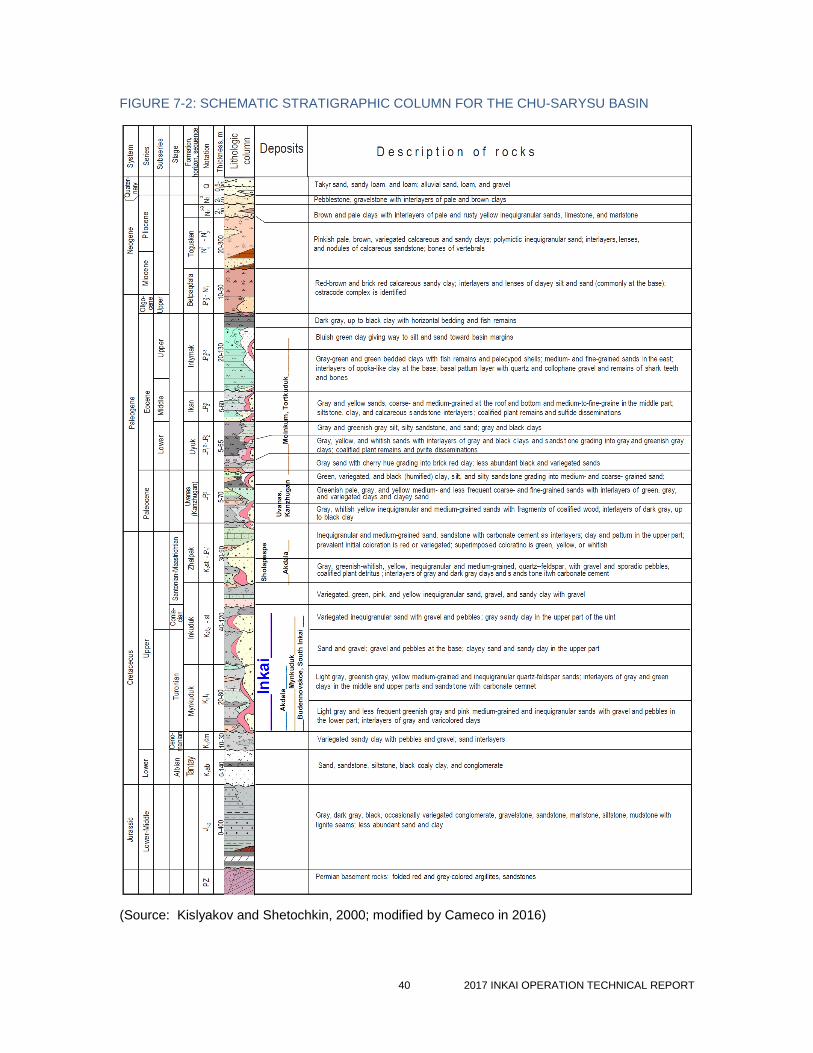
40 2017 INKAI OPERATION TECHNICAL REPORT
FIGURE 7-2: SCHEMATIC STRATIGRAPHIC COLUMN FOR THE CHU-SARYSU BASIN
(Source: Kislyakov and Shetochkin, 2000; modified by Cameco in 2016)
41 2017 INKAI OPERATION TECHNICAL REPORT
7.2.1 Local hydrogeology
The unconsolidated Upper Cretaceous sediments provide an excellent groundwater-storing reservoir, some
250 to 300 metres thick. This reservoir is regionally confined by the underlying Palaeozoic rocks and the
overlying thick Palaeogene marine clays (Intymak, Uyuk and Ikan aquitards). To varying degrees, there is
local confinement created by the sedimentation cycles, with each cycle including fine sands to silts and
occasional clay seams at the top.
The Upper Cretaceous groundwater regime exhibits a layered sequence of aquifers due to gravity separation
by different salinity levels, or total dissolved solids (TDS). At Inkai, from youngest to oldest, top to bottom
these are:
Uvanas & Betpak Dala fresh water (0.6 – 0.8 grams per litre TDS) aquifer
Zhalpak brackish water (1.1 – 1.5 grams per litre TDS) aquifer
Inkuduk salt water (2.3 – 3.6 grams per litre TDS) aquifer
Mynkuduk salt water (2.7 – 4.5 grams per litre TDS) aquifer.
The confined Upper Cretaceous aquifers produce artesian conditions where the topography is depressed
below the piezometric surface of about 135 – 140 metres above sea level. The general water table is at a
depth of eight to ten metres at Inkai.
The Inkai deposit includes the lower hydrogeological sub-stage (Paleocene and Upper Cretaceous). The
hydrogeological conditions for the Quaternary-Upper Eocene sediments are not described here because
aquifers of the upper sub-stage are not hydraulically connected to the Inkai deposit (Volkovgeology, 2007,
2015).
Available hydrogeology information is summarized below for the entire Inkai deposit with references for
different blocks as specified.
The typical feature of the Upper Cretaceous aquifers (Zhalpak, Inkuduk and Mynkuduk) is a quasi-uniform
lateral structure, i.e. high heterogeneity but in a very local scale. Thus, in a scale of pumping tests, hydraulic
properties vary laterally very little, even though borehole logs reveal sediments of very different grain sizes. All
these aquifers present a vertical anisotropy due to low-permeable lenses and thin layers between the aquifers
and sub-horizons.
Intymak aquitard (Middle to Upper Eocene)
The Intymak aquitard is composed of greenish-grey, bluish-grey intercalated, rarely massive marine clays,
varying in thickness from 70 to 120 metres. Intymak clays outcrop immediately to the north-west of Block 3 in
the Batykaryn river terrace. The Intymak clays comprise a regional aquitard in the Chu-Sarysu Basin.
Uyuk-Ikan aquitard (Lower Eocene)
The Uyuk-Ikan aquitard is represented by massive grey and greenish-grey marine clays. The thickness varies
from 22 metres in the northern part of Block 3 to 70 metres in the southern part of Block 2.
Uvanas and Byurtusken aquifers (Lower Paleocene)
The thickness of the Uvanas and Byurtusken aquifers varies from 15 metres in the northern part of Block 2 up
to 80 metres in the south and south east, beyond the deposit boundary. At Inkai, the aquifers occur at depths
of 170 to 280 metres and have a thickness from 20 to 30 metres. Water bearing sediments are fine to medium
grain sands.
Based on 15 single borehole pumping tests at Blocks 1 and 2 (Volkovgeology, 1991) and five cluster pump
tests at Block 3 (Volkovgeology, 2007, 2015), the calculated transmissivity of the Uvanas and Byurtusken
aquifer varies from 47 to 168 square metres per day, with horizontal hydraulic conductivities between 2.4 and
8.6 metres per day. Borehole yields were 1.6 to 11.0 litres per second.
42 2017 INKAI OPERATION TECHNICAL REPORT
Zhalpak aquifer (Campanian-Maastrichtian)
The depth to the bottom of the Zhalpak aquifer varies from 195 metres in the northern part of Block 3, to 270
metres in the northern part of Block 2, and to 355 metres in the southern part of Block 1. The aquifer thickness
is 40 to 60 metres. Water bearing sediments are fine and medium grained sands with gravels. In the top of the
Zhalpak Formation, there is a one to 10-metre layer of clays and fine sands that separates the Zhalpak aquifer
from the overlying Uvanas aquifer. This layer is assumed to be the Upper Zhalpak aquitard (Geolink, 2003,
Volkovgeology, 2007, 2015). There are clays and argillaceous sands underlying the Zhalpak aquifer that
serve as local aquitards. Those low-permeable sediments are somewhat discontinuous; therefore, some
hydraulic connection between the Zhalpak and underlying aquifers is possible.
The hydraulic properties of the Zhalpak aquifer were characterized by 10 pumping tests within Block 2, and
seven pumping tests within Block 3. From their interpretation (Volkovgeology, 1991, 2007, 2015), the
estimated transmissivity varies from 226 square metres per day to 575 square metres per day, with an
average value of 413 square metres per day. Elsewhere in the mine, transmissivities of the Zhalpak aquifer
were estimated within a similar range for Block 2. Horizontal hydraulic conductivities on Block 2 were
estimated at the range 5.5 to 11.4 metres per day, with an average value of 8.9 metres per day.
Inkuduk aquifer (Upper Turonian-Santonian)
The top of the Inkuduk aquifer is located at an approximate depth of 250 to 380 metres, with an average
thickness between 110 and 130 metres. The aquifer contains fine-to-coarse granular sands with gravels and
pebbles. Three sub-layers are identified and listed from top to bottom as: sands with clay lenses; fine and
medium-grained sands; and sands with gravels and pebbles.
These sub-layers are not always present, and there are no clear boundaries between them. Towards
northeast of Block 2 and the entire site, the clay content is slightly increasing in all sub layers. Clay lenses
typically separate the Inkuduk aquifer from the upper and lower horizons. This aquifer hosts a portion of the
mining zone. In Blocks 2 and 3, uranium mineralization develops within the middle and the lower parts of the
Inkuduk aquifer, down to the depths of 270 to 370 metres, depending on local conditions.
The Inkuduk aquifer is characterized by 27 borehole tests conducted by Volkovgeology prior to 1991, and 38
borehole tests comprising eight cluster aquifer pump tests, as well as 28 single well tests conducted at Block
3 from 2010 to 2013 by Volkovgeology, under the contract with JV Inkai. Horizontal hydraulic conductivities
obtained from different parts of test interpretation graphs were between 6.3 and 22.8 metres per day, with
80% of values in the range 10 to 18 metres per day.
Borehole yields for the Inkuduk aquifer in Block 2 vary between 3.2 and 18.30 litres per second, and specific
borehole yields vary between 0.8 and 2.4 litres per second. Generally, hydrogeological tests revealed that
horizontal hydraulic conductivities of the Inkuduk aquifer were consistent through the whole cross-section.
Hydraulic conductivity of the lower sub-horizon was estimated in the range of 9.2 to 16.1 metres per day; for
the middle sub-horizon, 11.8 to 15.8 metres per day; and for the upper sub-horizon, approximately 13 metres
per day. Transmissivities for different sub-horizons were estimated, on average, as 472 square metres per
day, 613 square metres per day, and 336 square metres per day for the lower, the middle, and the upper
horizons, respectively.
Mynkuduk aquifer (Lower Turonian)
The top of the Mynkuduk aquifer is encountered at depths of 360 to 370 metres, with a thickness of 30 to 40
metres in the northeast, increasing to 70 to 90 metres in the south-west. The average thickness of the aquifer
at Block 2 is 48 metres.
The aquifer lies on the Paleozoic argillaceous sediments that are recognized as a regional aquitard. The water
bearing sediments are sands of various grain sizes with clays, gravels and pebbles. Generally, coarse sand
and gravel fractions are associated with the upper part of the aquifer, while more clayish fractions are
associated with the lower part of the aquifer. Towards the north-east of Block 2 and the entire site, the clay
content is slightly increasing in all sub layers, particularly in the upper sub-horizon of the Mynkuduk aquifer.
43 2017 INKAI OPERATION TECHNICAL REPORT
The Mynkuduk aquifer hosts a portion of the deposit. In Block 2, the lower boundary of uranium mineralization
is found for different locations at depths of 380 to 430 metres; however, this aquifer contains minor
mineralization (compared to the Inkuduk aquifer on Block 2).
The Mynkuduk aquifer is characterized by 95 boreholes, 20 hydrogeological single borehole tests, 36 multi-
borehole tests and five injection tests (Volkovgeology, 1991). Borehole yields vary from 1.5 to 16.7 litres per
second, with borehole specific yields between 0.2 to 2.6 litres per second.
Horizontal hydraulic conductivities at the deposit area vary from 7.1 to 13 metres per day, with the average
value of 10.9 metres per day. Site transmissivities vary between 394 and 694 square metres per day, with the
average value of 564 square metres per day. Block 2 was characterized by 20 borehole tests prior to 1991.
Resulting horizontal hydraulic conductivities are generally higher for Block 2 than for Block 1, with values
varying between 7.4 and 17.3 metres per day, and an average value of 13 metres per day. Block 2
transmissivities obtained from pumping tests were in the range 460 to 755 square metres per day.
Vertical hydraulic conductivities were not well defined during exploration activities. They were calculated
through calibration of the regional groundwater flow model by Geolink (2003).
Prevailing values of both horizontal and vertical hydraulic conductivities used by Geolink for the regional
groundwater flow model are shown in Table 7-1.
TABLE 7-1: HYDRAULIC CONDUCTIVITY
Model Hydraulic conductivity (m/d)
Aquifer/Aquitard Horizontal Vertical Anisotropy ratio(rounded)
Uvanas 4.0 0.62 6 : 1
Upper Zhalpak aquitard 1 x 10⁻⁵ 2.5 x 10⁻⁵ 1 : 2.5
Zhalpak 14.6 0.023 635 : 1
Upper Inkuduk 3.0 0.5 6 : 1
Middle Inkuduk 10.5 0.5 20 : 1
Lower Inkuduk 14.4 0.5 30 : 1
Upper Mynkuduk 10.7 1.0 10 : 1
Lower Mynkuduk 10.3 1.0 10 : 1
Calibrated values of horizontal hydraulic conductivity are generally higher than vertical hydraulic conductivity
values by about one order of magnitude, with the exception of the Zhalpak aquifer. This aquifer has
discontinuous lenses of low-permeable clays and argillaceous sands with a calculated anisotropy ratio of
635:1.
7.2.2 Hydraulic connectivity
The Uvanas aquifer is confined by 100 to 150 metres of clays (regional aquitard), so it can be considered
hydraulically isolated in the region from the overlying Betpak Dala aquifer.
However, Geolink (2003) data analysis and the modelling study revealed an insignificant leakage of
groundwaters of the Uvanas aquifer into the overlying Betpak Dala aquifer for the northern flank of Block 1.
The reason for this leakage appears to be open exploration wells that allow some hydraulic connection.
The aquifers of the lower hydrogeological sub-stage are hydraulically connected. This connection is more
obvious between three lower aquifers (the Zhalpak, the Inkuduk and the Mynkuduk) that, according to
borehole logs and geophysics results, do not have continuous separating low-permeability layers. These
aquifers are separated from each other by clay lenses and by sediments with higher clay contents.
Furthermore, a multi-stage pumping test conducted by KAPE (2002) demonstrated a hydraulic connection
between the Zhalpak aquifer and the horizons of the Lower Cretaceous (e.g., Inkuduk and Mynkuduk). Re-
interpretation of the Volkovgeology (1991) pumping tests conducted by KAPE (2002) also supports this
hypothesis.
44 2017 INKAI OPERATION TECHNICAL REPORT
The hydraulic connection of the Uvanas aquifer with the underlying aquifers is complicated by the presence of
a thin (one to 10-metre) layer of low-permeable deposits in the upper part of the Zhalpak aquifer. Previous site
studies (Volkovgeology, 1991; KAPE, 2002) conclude that these two aquifers are considered hydraulically
isolated. However, this conclusion was based on the presence of low-conductive sediments between these
two aquifers and the results of one pumping test in the Uvanas aquifer when no drawdown was observed in
the underlying aquifers. Subsequent site studies (Geolink, 2003) indicate that this conclusion may be
incorrect.
Piezometric levels of the Uvanas aquifer are very close to that of the Zhalpak aquifer (the difference may run
to less than 10 to 20 centimetres) and piezometric level data for both aquifers show a synchronous decrease
over the last 20 years. This evidence suggests a hydraulic connection between the aquifers in the lower
hydrogeological sub-stage. However, the degree of interconnection between the Uvanas aquifer and Zhalpak
aquifer is significantly less than between the Zhalpak and Inkuduk, and Inkuduk and Mynkuduk aquifers.
7.2.3 Piezometric measurements
The majority of water level measurements which were taken in Block 1 concerned the Mynkuduk aquifer,
while measurements at Blocks 2 and 3 were carried out on Inkuduk and Zhalpak aquifers (Volkovgeology,
1991, 2007, 2015; KAPE, 2002). Overall, piezometric data indicate that the Uvanas, Zhalpak, Inkuduk and
Mynkuduk aquifers are confined, with piezometric levels varying from approximately 20 metres above ground
surface on the southeast to about 20 metres below ground surface on the north and north-west. The
horizontal hydraulic gradients at Inkai are relatively small (e.g., 2 to 3 x 10⁻⁴). Estimated lateral groundwater
movement is approximately 0.5 to 3.0 metres per year.
Concurrent piezometric measurements from four aquifers in cluster wells K1, K2 and K15 indicate similar
piezometric levels with differences of 0.7 metres (Volkovgeology, 1991; Geolink, 2003). This observation
suggests that the natural piezometric surfaces for these aquifers coincide.
Monitoring of piezometry variations by Volkovgeology (1991) revealed that, between 1981 and 1991, the site
piezometry was gradually declining in all four aquifers. This drop was observed throughout at the mine,
including boreholes in Block 2. The drop of piezometric levels between 0.3 and 1.2 metres per year was
observed in the majority of exploration boreholes, with a site average of 0.5 to 0.7 metres per year. This drop
in the piezometric surface was likely related to aquifer exploitation beyond the mine site, in the southern,
south-eastern and south-western parts of the West-Chu artesian basin. Other reasons could be the presence
of free-flowing artesian boreholes used for livestock watering.
Between 2001 and 2004, piezometric levels of the Upper Cretaceous complex continued to decline, but at a
slower rate of 0.1 to 0.3 metres per year (KAPE, 2006). Decline of piezometric levels is expected to continue
to slow down due to abandonment of free-flowing boreholes within and adjacent to the mine.
7.2.4 Groundwater chemistry
Typical vertical hydrochemical zoning is observed in the water-bearing complex of the lower hydrogeological
sub-stage. There is a regular top-down increase in total dissolved solids from 0.6 to 4.7 grams per litre. These
aquifers have also lateral hydrochemical zoning. As groundwater flows from its source towards north-west the
salinity of water increases and the hydrochemistry changes.
Apart from upper zones of the Zhalpak aquifer, the groundwaters are not suitable for drinking due to high
TDS, but up to certain depth (usually top of the Inkuduk aquifer) can be used for livestock watering.
Groundwater in the Zhalpak aquifer is fresh to slightly brackish (TDS=0.9 to 1.8 grams per litre). Uranium
concentrations are 1.0 x 10⁻⁷ to 2.1 x 10⁻⁶ grams per litre; radium concentrations 1 x 10-12 to 6 x 10-12 grams
per litre.
These concentrations are consistent with typical background concentrations of these elements in sedimentary
rocks. Brackish and salt water is found in the two lower aquifers.
TDS of the Inkuduk aquifer vary between 1.2 and 3.6 grams per litre, increasing with depth of burial. The
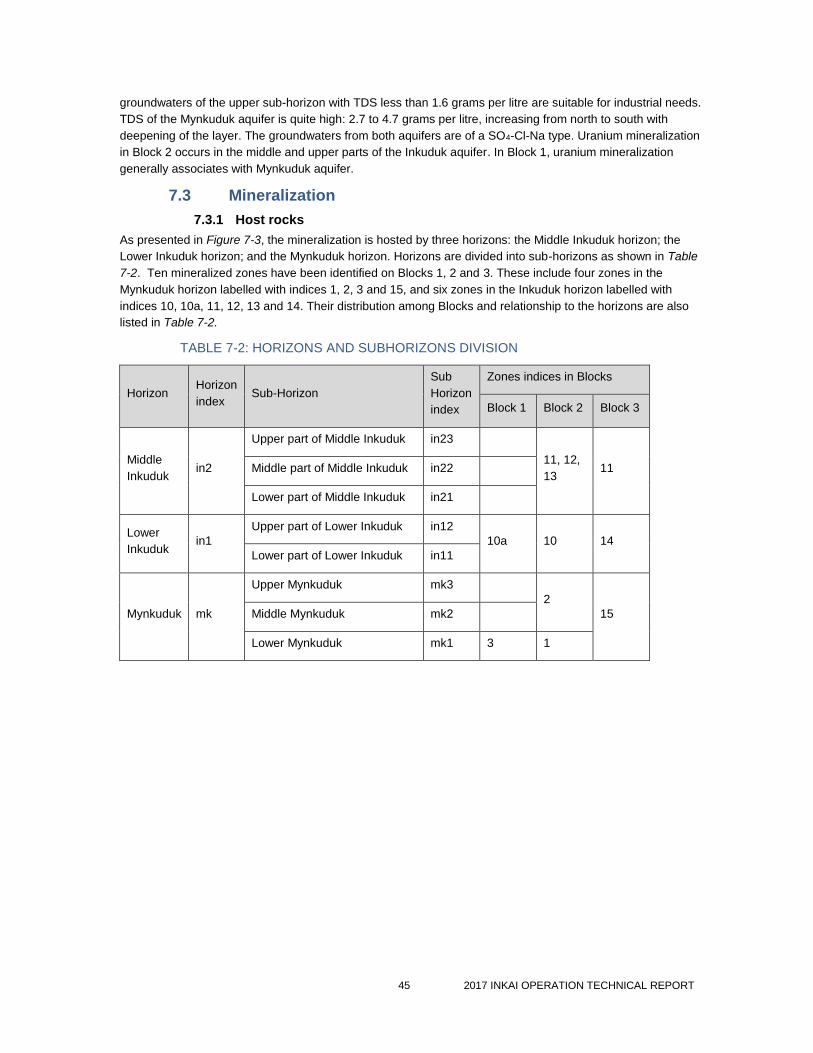
45 2017 INKAI OPERATION TECHNICAL REPORT
groundwaters of the upper sub-horizon with TDS less than 1.6 grams per litre are suitable for industrial needs.
TDS of the Mynkuduk aquifer is quite high: 2.7 to 4.7 grams per litre, increasing from north to south with
deepening of the layer. The groundwaters from both aquifers are of a SO4-Cl-Na type. Uranium mineralization
in Block 2 occurs in the middle and upper parts of the Inkuduk aquifer. In Block 1, uranium mineralization
generally associates with Mynkuduk aquifer.
7.3 Mineralization
7.3.1 Host rocks
As presented in Figure 7-3, the mineralization is hosted by three horizons: the Middle Inkuduk horizon; the
Lower Inkuduk horizon; and the Mynkuduk horizon. Horizons are divided into sub-horizons as shown in Table
7-2. Ten mineralized zones have been identified on Blocks 1, 2 and 3. These include four zones in the
Mynkuduk horizon labelled with indices 1, 2, 3 and 15, and six zones in the Inkuduk horizon labelled with
indices 10, 10a, 11, 12, 13 and 14. Their distribution among Blocks and relationship to the horizons are also
listed in Table 7-2.
TABLE 7-2: HORIZONS AND SUBHORIZONS DIVISION
Horizon Horizon
index Sub-Horizon
Sub
Horizon
index
Zones indices in Blocks
Block 1 Block 2 Block 3
Middle
Inkuduk in2
Upper part of Middle Inkuduk in23
11, 12,
13 11 Middle part of Middle Inkuduk in22
Lower part of Middle Inkuduk in21
Lower
Inkuduk in1
Upper part of Lower Inkuduk in12
10a 10 14
Lower part of Lower Inkuduk in11
Mynkuduk mk
Upper Mynkuduk mk3
2
15 Middle Mynkuduk mk2
Lower Mynkuduk mk1 3 1
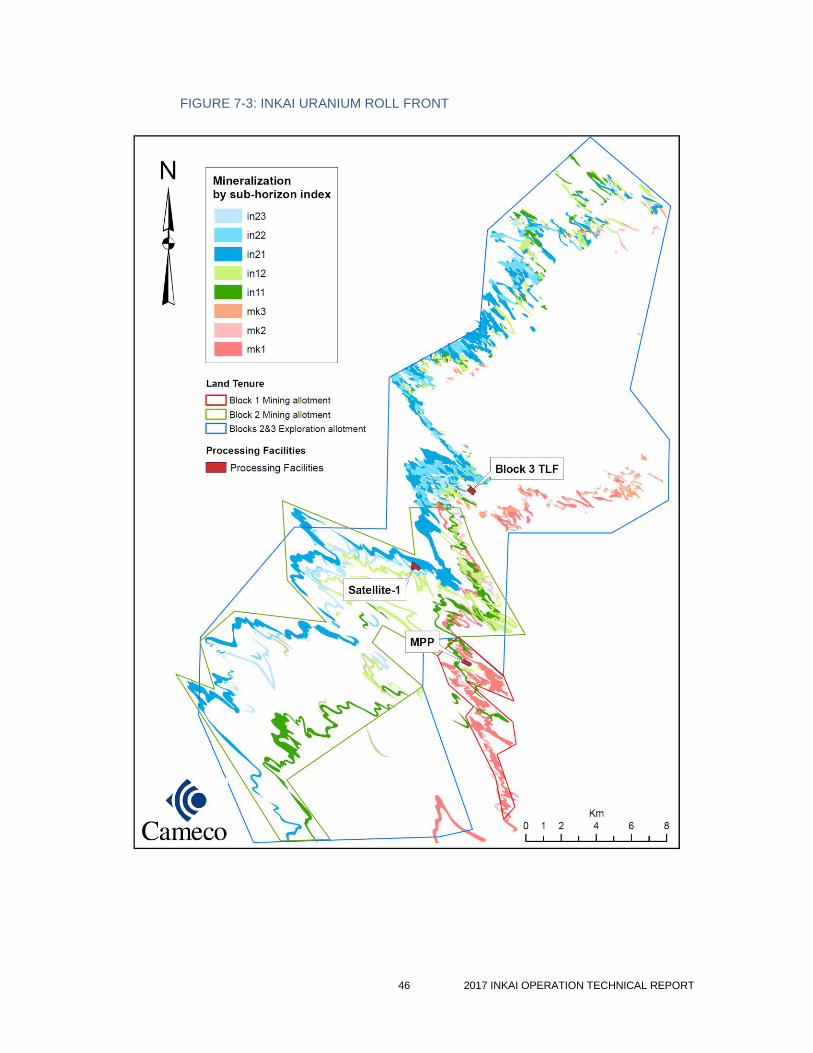
46 2017 INKAI OPERATION TECHNICAL REPORT
FIGURE 7-3: INKAI URANIUM ROLL FRONT
47 2017 INKAI OPERATION TECHNICAL REPORT
Block 1
Bulk of the uranium mineralization contained in the Mynkuduk horizon and extending over more than
10 kilometres
Small portion contained in the Lower Inkuduk horizon
Depth to the bottom of mineralization in the Mynkuduk horizon ranges from 450 to 528 metres.
Average depth is 490 metres
Mineralization width in plan view ranges from 40 to 600 metres and averages 250 metres
Mineralized levels are generally at the lower part of the horizon, close to the Permian-Upper
Cretaceous unconformity, but may also be found at a higher level, above the oxidized part of the
Mynkuduk.
Block 2
Bulk of the mineralization contained in the Lower and Middle Inkuduk horizons extending over more
than 35 kilometres
Small portion is contained in the Mynkuduk horizon
Depth to the bottom of mineralization in the Inkuduk horizons ranges from 300 to 426 metres.
Average depth for Lower Inkuduk is 390 metres and 340 metres for the Middle Inkuduk
Mineralization width for the Inkuduk horizon in plan view ranges from 40 to 1400 metres and averages
350 metres.
Block 3
Bulk of mineralization contained in the Lower and Middle Inkuduk horizons extending over more than
25 kilometres
Small portion contained in the Mynkuduk horizon
Depth to the bottom of mineralization for the Middle Inkuduk horizon ranges from 278 to 415 metres.
Average depth is 330 metres. Width in plan view ranges from 40 to 1600 metres and averages 350
metres
Depth to the bottom of the Lower Inkuduk horizon is 331 to 445 metres. Average depth is 360 metres.
Width in plan view ranges from 40 to 600 metres and averages 250 metres
Depth to the bottom of the Mynkuduk horizon is 360 to 16 metres. Average depth is 430 metres.
Width in plan view ranges from 40 to 350 metres and averages 200 metres.
Regional structures in the Chu-Sarysu Basin have had some control to the development of the sedimentary
facies and to the movement of uranium bearing groundwater to form the roll fronts. Structure contour maps,
on the surface of the basement Palaeozoic rocks, indicate that perhaps linear depressions in the surface have
coincidence with overlying roll fronts; the hydrostratigraphy of the Cretaceous formations being the primary
control to mineralization.
7.3.2 Oxidation and mineralization
Different lithologic and geochemical types have been studied for the content of their organic carbon, total iron,
and iron contents.
The zone of uranium mineralization is located along the geochemical barrier marked by the contact zone of
the incompletely oxidized rock and the primary grey-coloured rock. Iron oxides are nearly absent in this zone.
Organic carbon content is decreased. Some associated pyrite, and sometimes carbonates, are observed.
Four geochemical host rocks types can be identified at the deposit:

48 2017 INKAI OPERATION TECHNICAL REPORT
diagenetically reduced grey sands and clays containing coalified plant detritus
green-grey sands and clays, reduced both diagenetically and epigenetically by “gley” soil (anaerobic
organic) processes
non-reduced initially mottled sediments
yellow-coloured lithologies that underwent stratal epigenetic oxidation.
The initial colours are typical of channel of flood-plain facies. Diagenetically reduced grey sands and gravel of
channel facies are more favourable for uranium deposition compared to greenish-grey or grey-green sands.
Occurrence and development of facies of Upper Cretaceous continental mottled alluvial formation is controlled
by syn-sedimentary structures consistent with the tectonic pattern of the depression. Structural-facies control
of mineralization is clearly expressed in mineralization of the Mynkuduk horizon. In the upper horizons such
control is weakly expressed.
From observations of core, the redox boundary can be readily recognized by a distinct colour change from
grey and greenish-grey on the reduced side to light-grey with yellowish stains on the oxidized side, stemming
from the oxidation of pyrite to limonite and consumption of organic carbon.
The propagation of the oxidation fronts is affected by hydrostratigraphy (controlling fluid paths and velocities),
and rock composition (controlling redox reactions). The implied groundwater movement direction was from the
southeast to northwest, leading to the formation of oxidation tongues also oriented to the northwest. It gives
rise to characteristic geometries of the redox fronts and associated mineralization described in more detail in
the following section.
7.3.3 Geometry
The Inkai deposit has developed along a regional system of superimposed redox fronts in the porous and
permeable sand units of the Chu-Sarysu Basin. The overall strike length of the redox front at Inkai is
approximately 60 kilometres. The overall stratigraphic horizon of interest in the basin, located between 290
and 520 metres below surface, is approximately 200 to 250 metres thick.
Plan view
In a plan view the mineralized fronts have an irregular sinuous shape comprising southwestern and
northeastern limbs joining to form prominent northeast-oriented frontal crests and southeast-oriented posterior
troughs observed at a variety of scales. The wavelength of the larger-scale sinusoid varies from one to five
kilometres, with the corresponding peak-to-peak amplitude varying from two to ten kilometres. Often, the
irregular shape of a larger scale sinusoid is further complicated by smaller scale irregular sinusoids with more
variably oriented limbs, crests and troughs, with wavelengths ranging from 100 to 500 metres and amplitudes
from 200 to 1,000 metres. The width in a plan view of the limbs is typically narrower than that of the frontal
crests and rear troughs. The crests and the troughs usually contain most of the metal accumulations. There
are notable differences in the mineralization width in a plan view between different horizons and sub-horizons,
as well as between different locations for the same sub-horizon, as presented in Figure 7-3. Overall, the
mineralization in the Mynkuduk and Lower Inkuduk horizon is less than 40 to 100 metres wide in the limbs,
and reach 600 metres in the crests and troughs. The mineralization in the Middle Inkuduk horizon tends to be
comparatively wider, especially in the central part of the deposit. It is 50 to 400 metres in the limbs, and
reaches 1,400 metres in the crests and troughs in the central part of the deposit, but its width decreases and
almost completely pinches out in the northern part of Block 3.
In the Middle Inkuduk horizon, the mineralization is found in coarse sands of the main channel or streambed
facies. Here, the mineralized fronts are the farthest advanced to the northwest in the direction of groundwater
flow. In the Lower Inkuduk and Mynkuduk horizons, mineralization usually lags somewhat behind, along a
complex system of superimposed suturing oxidation tongues. Stacked mineralization is also observed where it
occurs in different horizons over the same area; for example, in the north-east of Block 2 and south-west of
Block 3, where up to five mineralization levels are stacked.
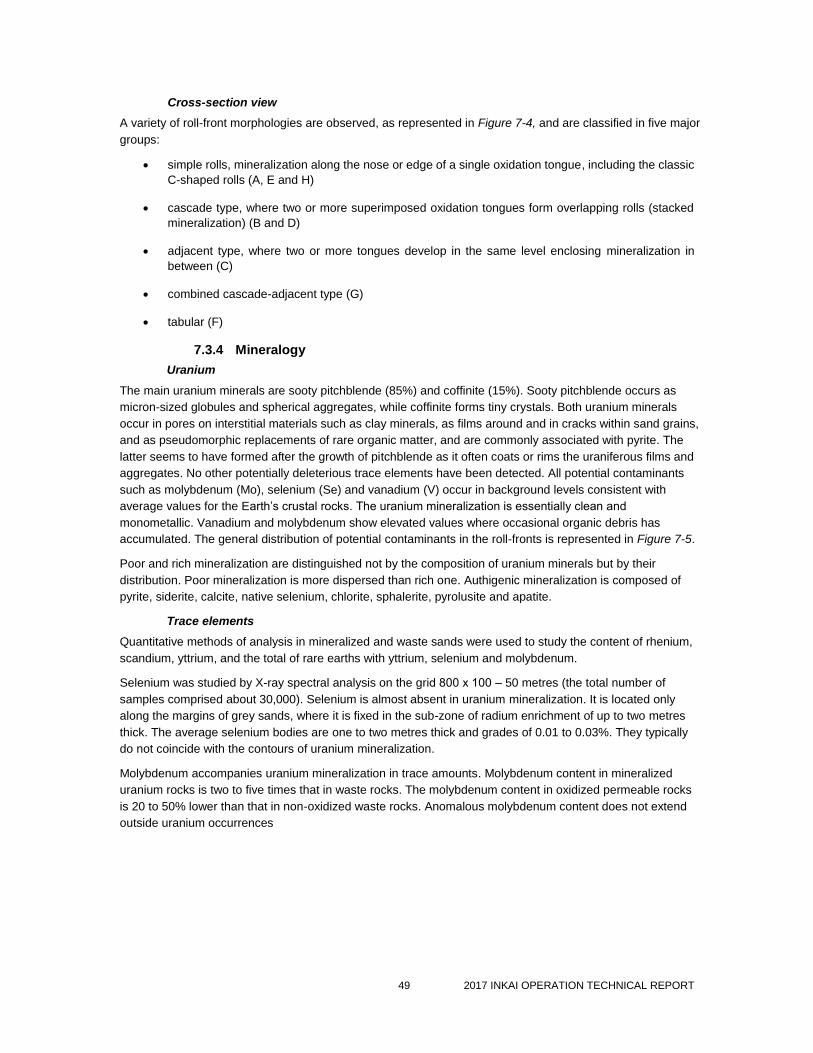
49 2017 INKAI OPERATION TECHNICAL REPORT
Cross-section view
A variety of roll-front morphologies are observed, as represented in Figure 7-4, and are classified in five major
groups:
simple rolls, mineralization along the nose or edge of a single oxidation tongue, including the classic
C-shaped rolls (A, E and H)
cascade type, where two or more superimposed oxidation tongues form overlapping rolls (stacked
mineralization) (B and D)
adjacent type, where two or more tongues develop in the same level enclosing mineralization in
between (C)
combined cascade-adjacent type (G)
tabular (F)
7.3.4 Mineralogy
Uranium
The main uranium minerals are sooty pitchblende (85%) and coffinite (15%). Sooty pitchblende occurs as
micron-sized globules and spherical aggregates, while coffinite forms tiny crystals. Both uranium minerals
occur in pores on interstitial materials such as clay minerals, as films around and in cracks within sand grains,
and as pseudomorphic replacements of rare organic matter, and are commonly associated with pyrite. The
latter seems to have formed after the growth of pitchblende as it often coats or rims the uraniferous films and
aggregates. No other potentially deleterious trace elements have been detected. All potential contaminants
such as molybdenum (Mo), selenium (Se) and vanadium (V) occur in background levels consistent with
average values for the Earth’s crustal rocks. The uranium mineralization is essentially clean and
monometallic. Vanadium and molybdenum show elevated values where occasional organic debris has
accumulated. The general distribution of potential contaminants in the roll-fronts is represented in Figure 7-5.
Poor and rich mineralization are distinguished not by the composition of uranium minerals but by their
distribution. Poor mineralization is more dispersed than rich one. Authigenic mineralization is composed of
pyrite, siderite, calcite, native selenium, chlorite, sphalerite, pyrolusite and apatite.
Trace elements
Quantitative methods of analysis in mineralized and waste sands were used to study the content of rhenium,
scandium, yttrium, and the total of rare earths with yttrium, selenium and molybdenum.
Selenium was studied by X-ray spectral analysis on the grid 800 х 100 – 50 metres (the total number of
samples comprised about 30,000). Selenium is almost absent in uranium mineralization. It is located only
along the margins of grey sands, where it is fixed in the sub-zone of radium enrichment of up to two metres
thick. The average selenium bodies are one to two metres thick and grades of 0.01 to 0.03%. They typically
do not coincide with the contours of uranium mineralization.
Molybdenum accompanies uranium mineralization in trace amounts. Molybdenum content in mineralized
uranium rocks is two to five times that in waste rocks. The molybdenum content in oxidized permeable rocks
is 20 to 50% lower than that in non-oxidized waste rocks. Anomalous molybdenum content does not extend
outside uranium occurrences
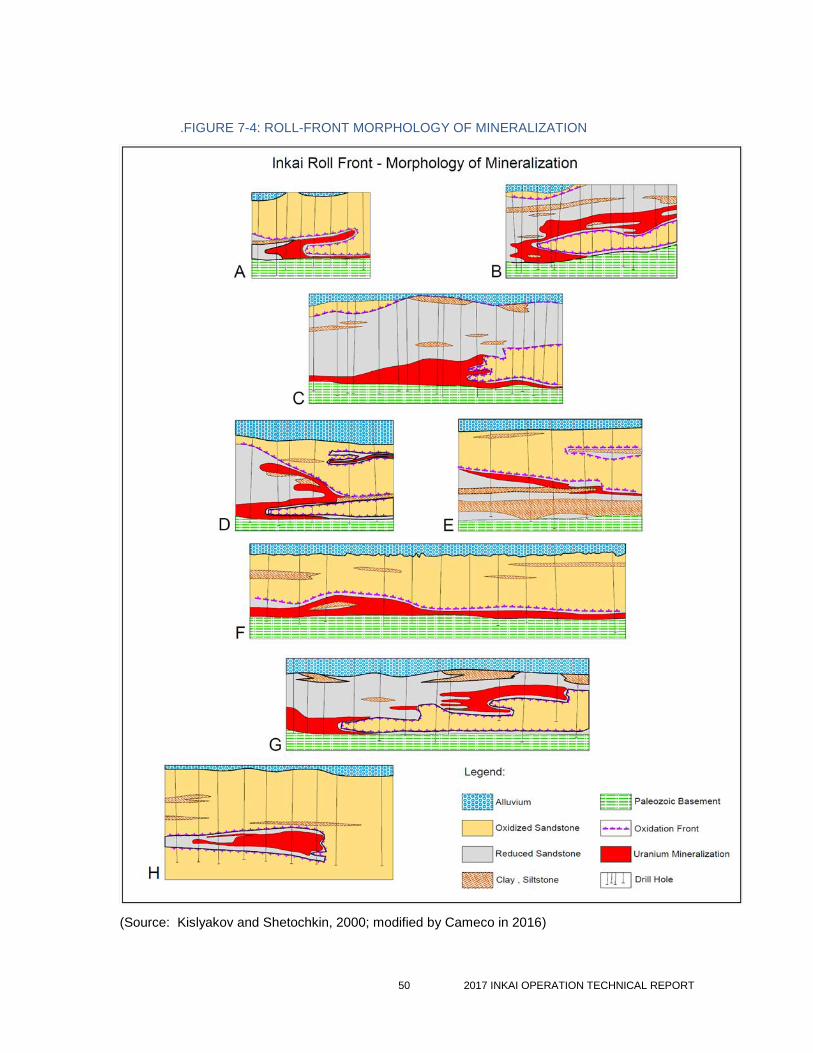
50 2017 INKAI OPERATION TECHNICAL REPORT
.FIGURE 7-4: ROLL-FRONT MORPHOLOGY OF MINERALIZATION
(Source: Kislyakov and Shetochkin, 2000; modified by Cameco in 2016)
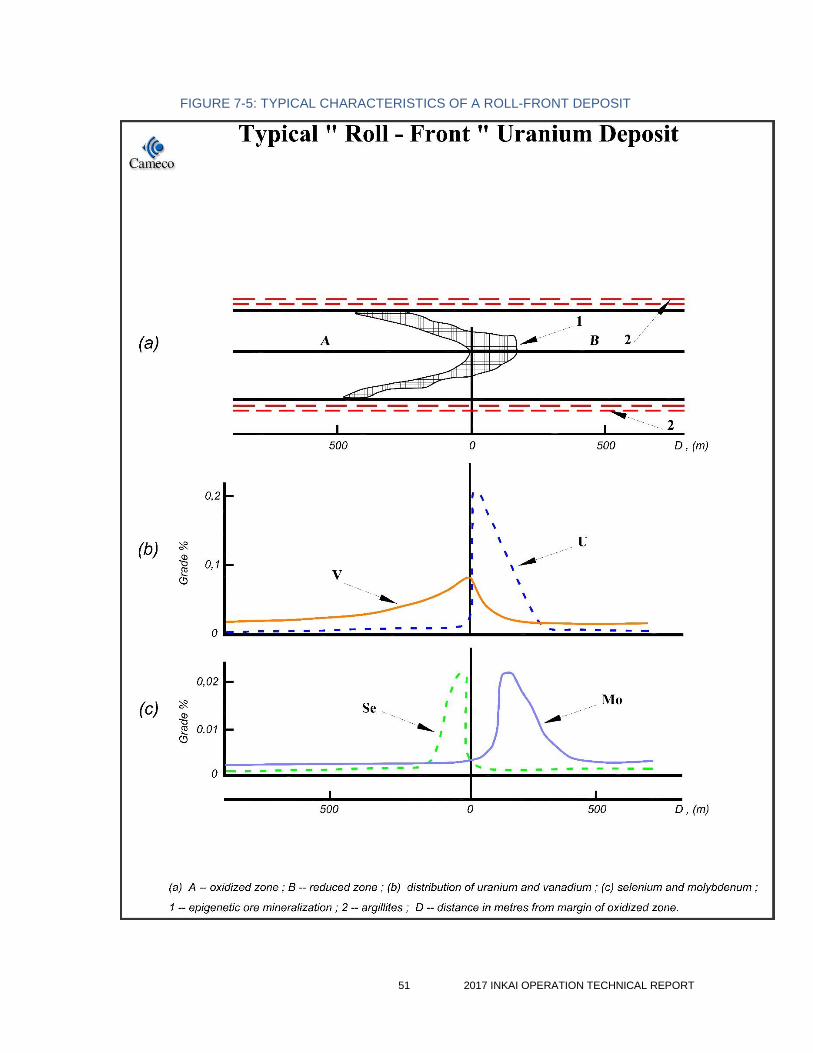
51 2017 INKAI OPERATION TECHNICAL REPORT
FIGURE 7-5: TYPICAL CHARACTERISTICS OF A ROLL-FRONT DEPOSIT
52 2017 INKAI OPERATION TECHNICAL REPORT
8 Deposit types
8.1 Roll-front deposits
The Inkai uranium deposit is a roll-front type deposit. Roll-front deposits are a common example of stratiform
deposits that form within permeable sandstones in localised reduced environments. Microcrystalline uraninite
and coffinite are deposited during diagenesis by oxygenated and uraniferous groundwater, in a crescent-
shaped lens that cuts across bedding and forms at the interface between oxidized and reduced lithologies.
Sandstone host rocks are medium to coarse grained and were highly permeable at the time of mineralization.
They form in continental-basin margins, fluvial channels, braided stream deposits and stable coastal plains.
Contemporaneous felsic volcanism or eroding felsic plutons are sources of uranium. In tabular mineralization,
source rocks for uranium-bearing fluids are commonly in overlying or underlying mud-flat facies sediments.
Fifteen economic uranium deposits have been discovered within Cretaceous and Palaeogene sediments of
the Chu-Sarysu and Syr-Darya Basins across Kazakhstan. These are grouped into the Chu-Syr Darya
mineralized region, and situated within the two basins that are separated by the Karatau Range uplift.
Soviet geologists established the spatial relation for uranium mineralization between the boundaries of the
yellow oxidized sand sediments of aquifers and unoxidized grey sand sediments in Uzbekistan in 1956. These
were named “bed oxidation zones” deposits by Soviet geologists, and characterised by:
hydrodynamic conditions of infiltration artesian basins
arid climate conditions of the mineralization deposition epoch
favourable lithologic-geochemical type of host rocks (grey-coloured, easily permeable sediments)
8.1.1 Oxidation state
The geological model for stratabound roll-front deposits, applied at the exploration stage, relates to the
identification of the following zoning:
Oxidation: Siderite, pyrite, biotite, chlorite and glauconite are absent in the completely oxidized zone.
The mineralization contains iron hydroxides. The granular fraction includes some kaolinized
feldspars. The predominant colour of the rock is yellow, ochre yellow and orange. The completely
oxidized sub-zone can extend for tens and hundreds of kilometres into the basin, measured from the
outcrop at the basin margin.
Incomplete oxidation: In the sub-zone of incomplete oxidation, iron hydroxides occur locally,
resulting in the rock having a mottled appearance. Minor quantities of plant detritus, siderite, and
glauconite may be present. The predominant colours are yellowish-green and whitish-yellow.
Between the zone of complete and partial oxidation, one sometimes observes a sub-zone of re-
deposited red hematite ochres. The sub-zone of incomplete oxidation can extend from a few
kilometres to some tens and hundreds of kilometres.
Primary reduced: The zone of barren grey rock has a characteristic mineral composition of rock
common for the stratigraphic horizon under consideration. The colour is grey or light grey. Unoxidized
pyrite and small quantities of bitumen or carbon trash are common and contribute to the grey colour.
The zone of uranium mineralization is located along the geochemical barrier marked by the contact zone of
the incompletely oxidized rock and the primary grey-coloured reduced rock. Iron oxides are nearly absent in
this zone.
Carbonaceous plant detritus remains non-oxidized. Some associated pyrites, and sometimes carbonates, are
observed. Uranium minerals, including sooty pitchblende, pitchblende and coffinite, may be associated with
pyrite and organic matter. The uranium-bearing zone generally extends for tens of metres or, rarely, for a few
hundred metres (in cross-section across the roll front), but may extend for many kilometres along the roll-front.

53 2017 INKAI OPERATION TECHNICAL REPORT
The geochemical properties of the host rocks are determined by their primary composition and particle size
distribution, as well as by their permeability and other hydrologic characteristics. The reduced chemical state
of the host rocks develops during diagenesis following deposition, or possibly as the result of some event or
events taking place later in the geologic history, such as introduction of hydrocarbons and/or hydrocarbon
gases.
The reduction processes are accompanied by the development of grey, dark-grey and greenish-grey coloured
host rocks. Epigenetic alteration taking place during reduction, include bituminization, carbonation,
sulphidation, argillisation and decomposition of iron minerals result in bleaching of the sediments.
54 2017 INKAI OPERATION TECHNICAL REPORT
9 Exploration
Blocks 1 and 2 are in production. All exploration work was carried out prior to JV Inkai being established and
is described in Section 6.2 Exploration and development history. No further exploration is planned besides
drilling with the objective to convert mineral resource categories to a higher level. Block 3 exploration work
was with drilling only and is covered in Section 10 Drilling.
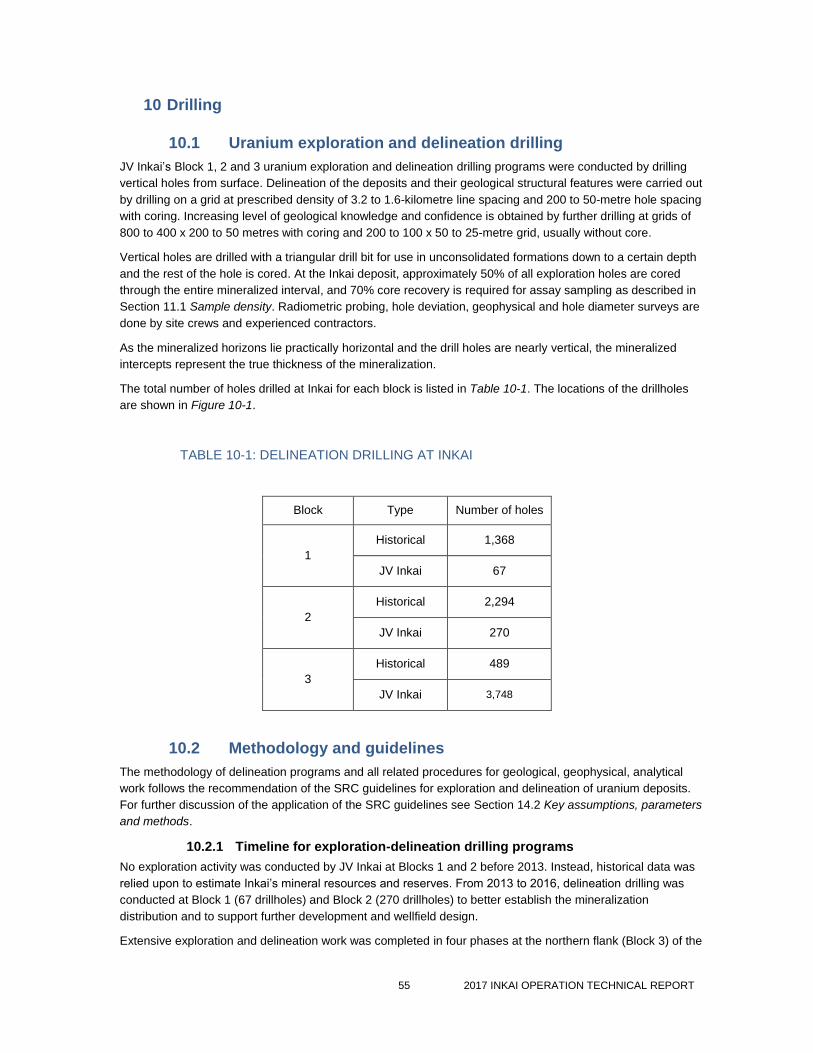
55 2017 INKAI OPERATION TECHNICAL REPORT
10 Drilling
10.1 Uranium exploration and delineation drilling
JV Inkai’s Block 1, 2 and 3 uranium exploration and delineation drilling programs were conducted by drilling
vertical holes from surface. Delineation of the deposits and their geological structural features were carried out
by drilling on a grid at prescribed density of 3.2 to 1.6-kilometre line spacing and 200 to 50-metre hole spacing
with coring. Increasing level of geological knowledge and confidence is obtained by further drilling at grids of
800 to 400 x 200 to 50 metres with coring and 200 to 100 x 50 to 25-metre grid, usually without core.
Vertical holes are drilled with a triangular drill bit for use in unconsolidated formations down to a certain depth
and the rest of the hole is cored. At the Inkai deposit, approximately 50% of all exploration holes are cored
through the entire mineralized interval, and 70% core recovery is required for assay sampling as described in
Section 11.1 Sample density. Radiometric probing, hole deviation, geophysical and hole diameter surveys are
done by site crews and experienced contractors.
As the mineralized horizons lie practically horizontal and the drill holes are nearly vertical, the mineralized
intercepts represent the true thickness of the mineralization.
The total number of holes drilled at Inkai for each block is listed in Table 10-1. The locations of the drillholes
are shown in Figure 10-1.
TABLE 10-1: DELINEATION DRILLING AT INKAI
Block Type Number of holes
1
Historical 1,368
JV Inkai 67
2
Historical 2,294
JV Inkai 270
3
Historical 489
JV Inkai 3,748
10.2 Methodology and guidelines
The methodology of delineation programs and all related procedures for geological, geophysical, analytical
work follows the recommendation of the SRC guidelines for exploration and delineation of uranium deposits.
For further discussion of the application of the SRC guidelines see Section 14.2 Key assumptions, parameters
and methods.
10.2.1 Timeline for exploration-delineation drilling programs
No exploration activity was conducted by JV Inkai at Blocks 1 and 2 before 2013. Instead, historical data was
relied upon to estimate Inkai’s mineral resources and reserves. From 2013 to 2016, delineation drilling was
conducted at Block 1 (67 drillholes) and Block 2 (270 drillholes) to better establish the mineralization
distribution and to support further development and wellfield design.
Extensive exploration and delineation work was completed in four phases at the northern flank (Block 3) of the
56 2017 INKAI OPERATION TECHNICAL REPORT
Inkai deposit, by JV Inkai from 2006 to 2016. Refer to Figure 10-1 for the distribution of drilling by periods.
JV Inkai’s Geology department oversaw the exploration drilling program, including the drilling program and
management of contractors. JV Inkai has retained a contractor, Volkovgeology, to direct and coordinate day-
to-day drilling activities, and to ensure the quality of drilling, core recovery, surveying, geological logging,
sampling, assaying and daily data processing. All downhole geophysical logging was performed by JV Inkai
logging crews, as described in Section 11.5 Geophysical logging. Drilling was performed by a number of
contractors, supervised by Volkovgeology.
All drilling conducted on grids of 400 by 50 metres and larger were cored with the core recovery of at least
70% in at least 70% of the drillholes, where the infill drillholes in 200 by 50 metre drilling patterns consist of
predominately coreless drillholes, in compliance with the requirements of the SRC of the Republic of
Kazakhstan.
Phase 1: 2006 – 2009
The first phase focused on drilling on an 800 x 50-metre grid pattern in the southwestern part of Block 3. Also,
the mineralization trends were followed along the northwestern border using sparser (800 to 1,600 x 100 to
200-metre) drilling patterns. Mineralization zones were delineated and a significant increase in their extent
(compared with previous results) was established in the more densely drilled south-western part of Block 3.
The purpose of this phase was to support a commercial discovery application, which was achieved, as
required under the Kazakhstan regulations. Further drilling was aimed at the commercial discovery
assessment in accordance with the requirements of the Kazakhstan regulations.
Phase 2: January 2010 – May 2011
The second phase was aimed at developing an 800 x 50-metre infill drilling grid pattern throughout the
mineralized trend identified within the Inkuduk horizon along the northwestern border, as well as the trend
developed in the Mynkuduk horizon along the southern border. This phase allowed for tracing the presence of
mineralization throughout Block 3 with a greater degree of certainty. In addition, the development of 200 x 50-
metre drilling grids patterns began in the southwestern part of Block 3, with the goal of identifying sites and
designing test wellfields in the Lower Inkuduk and Lower Mynkuduk horizons. The sites for test wellfields were
identified by May 2011.
Phase 3: June 2011 – December 2013
In the third phase of drilling, progressively tightening drilling grids (from 800 x 50-metre to 400 x 50-metre to
200 x 50-metre) were used to delineate mineralization in the southwestern, western and northern parts of
Block 3. In 2012, the design for the test wellfields was completed. Drilling the test wellfields started in August
and was finished in December 2012.
Phase 4: August – November 2016
In the fourth phase of drilling, 69 coreless infill delineation holes were drilled on a 100 x 50-metre grid on a
selected site focusing on the Mynkuduk mineralization to confirm the continuity of the mineralization and its
categorization, as per recommendation of the SRC. Thirty-nine core drillholes were drilled at the ISR test
wellfields to study the recovery process.
10.3 Factors that could materially affect the accuracy of the
results
There are no known drilling, sampling or core recovery factors that could materially affect the accuracy and
reliability of the results. For a further discussion of sampling and core recovery factors, see Section 11 Sample
preparation, analyses and security.
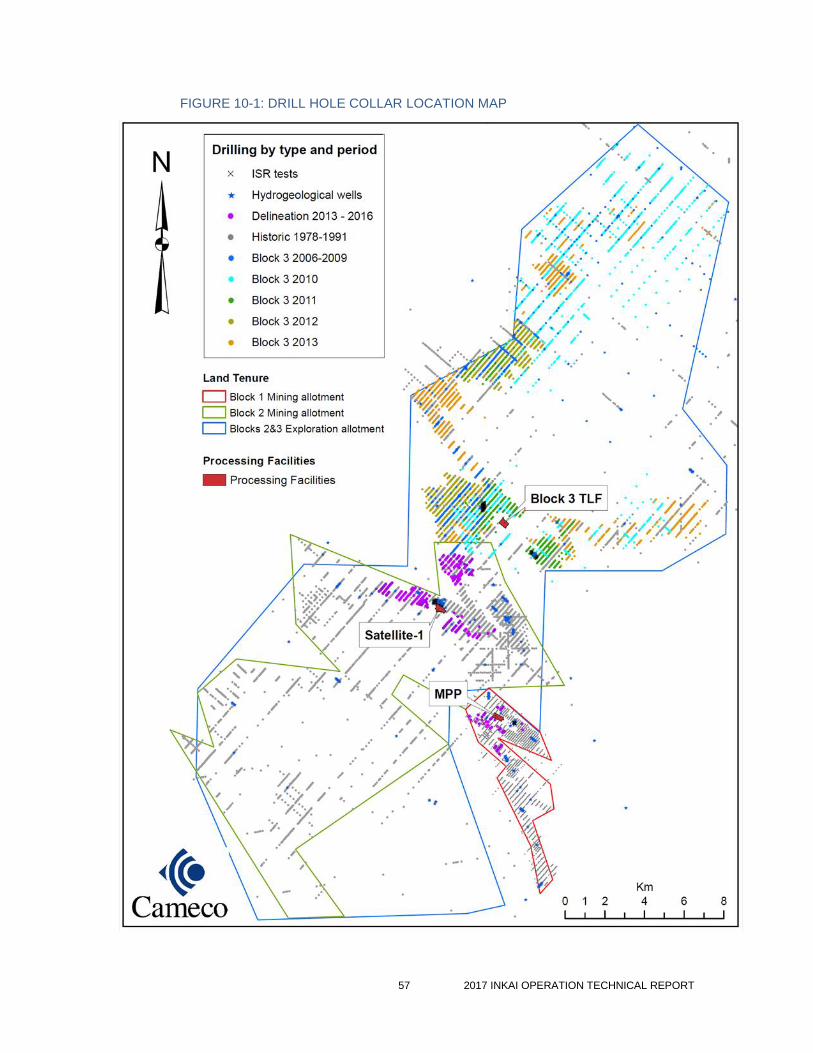
57 2017 INKAI OPERATION TECHNICAL REPORT
FIGURE 10-1: DRILL HOLE COLLAR LOCATION MAP
58 2017 INKAI OPERATION TECHNICAL REPORT
11 Sample preparation, analyses and security
The sampling, sample preparation, analyses, geophysical downhole logging during the exploration and
delineation programs follow the procedures and manuals which adhere to the requirements set out in the SRC
guidelines as described in Section 14.1.3: Key methods
11.1 Sample density
Sampling of the mineralization is based on drilling grids that progressively tighten with increasing levels of
geological knowledge and confidence. The line spacing with drillhole spacing decreases as follows:
3.2 – 1.6 kilometres x 200 – 50 metres, all drillholes are cored through productive horizon
800 – 400 metres x 200 – 50 metres, all drillholes are cored through productive horizon
200 – 100 metres x 50 – 25 metres, most drillholes are coreless
11.2 Core recovery
At Block 1, 66% of cored drillholes have recovery higher than 70%. At Block 2, 54% of cored drillholes have
recovery higher than 70%. At Block 3, 85% of cored drillholes have recovery higher than 70%. Core
recovery is generally considered to be acceptable, given the unconsolidated state of the mineralized material.
Resource estimates are based on gamma log results. Core sample assays are composited for correlation
purposes if core recovery was at least 70%.
11.3 Procedure for sampling and sample preparation
Drill core is logged in log journals following the developed manuals and representative core samples are
selected for the following analyses and tests:
determination of the content of uranium, radium and associated elements
determination of bulk density, rock moisture, porosity and acid-base balance of monolith rocks
determination of mineralization and host rock physical composition, rock grading and carbonate
content
column leach tests for uranium leachability.
Detailed sampling procedures guide the sampling interval within the mineralization. Where core recoveries are
better than 70% and radioactivity is greater than 40 micro-roentgens per hour, core samples are taken at
irregular intervals of 0.2 metre to 1.2 metre. Sample intervals also are differentiated by barren or low-
permeability material. The average core sample length is 0.4 metre. The sampling is conducted from the half
of core divided along its axis and cleared from the clay envelope. Core diameter was 60 mm, 70 mm and 100
mm. The required sample weight was determined based on the length of the samples and the diameters of
the core sampled.
The split core is also sampled for grain-size analysis and carbonate content following the same procedure.
Sample preparation and assaying are done by Volkovgeology following procedures set out in SRC guidelines.
When core samples are being analyzed for geochemistry, they are primarily analyzed for grain size and
assayed for uranium, radium, thorium, potassium and carbonate content. On selected fence lines, a more
extensive study of geochemistry is undertaken.
The core samples for uranium and radium determination are taken from representative intervals, based on
their quantity and quality. The sampling is conducted in sections from the half of core divided along its axis.
The maximum sample length is 1.0 to 1.2 metre, and the minimum is 0.2 metre, with an average of 0.4 metre.
To control the sampling quality, a sample is collected from the second half of core. The core samples are
ground down to 1.0-millimetre grain size and are further subdivided by one or three times quartering until the
59 2017 INKAI OPERATION TECHNICAL REPORT
final representative weight of samples and duplicates is reached (0.2 kilogram).
11.4 Assaying
The laboratory tests for uranium and radium were performed by the Central Analytical Laboratory (CAL) of
Volkovgeology, located in Almaty. The laboratory is certified and licensed by the National Centre for
Accreditation of the Republic of Kazakhstan to comply with the STRK ISO/IEC 17025-2007 standard,
Certificate number KZ.I.02.1029. Volkovgeology is part owned by Kazatomprom, which is part owner of JV
Inkai. The uranium content was determined by using the X-ray fluorescence spectrum analysis. The radium
content was determined by the multi-step method using gamma intensity and X-ray spectrum analysis. Since
uranium grade calculated from gamma probing of the drillholes is used for resource estimation, assays from
core sampling are only used for correlation and radioactive disequilibrium determination purposes.
11.5 Geophysical logging
Downhole geophysical logging is performed by JV Inkai. JV Inkai owns three geophysical downhole logging
trucks, fully equipped for conducting the following types of logging used in exploration/delineation and wellfield
drilling programs:
gamma logging
resistivity and spontaneous potential
caliper
hole deviation
thermometry
inductive resistivity.
Gamma and electric logging is conducted in all drillholes over their entire length and is performed with no
casing in the drillholes.
AtomGeo, the specialized software developed by a subsidiary of Kazatomprom, is universally used throughout
uranium mines and exploration projects in Kazakhstan. It centralizes entry, storage, processing and retrieval
of drillhole-related geological information. The raw geophysical data (logs) are entered into the AtomGeo
database by JV Inkai staff after conducting a first level QA/QC and checking for errors.
A copy of the database is given to the Volkovgeology data processing centre in Almaty for more rigorous data
processing. Correction coefficients are determined considering all factors, including correction for
disequilibrium. Thus, calculated and corrected grades are checked against the chemical assays. Then a
specifically formatted drillhole file (the passport) is prepared, which is later used in building cross-sections and
plans. The plans and section thus prepared will be later used in reserve estimation. Volkovgeology performs
this work under a separate contract with JV Inkai.
11.5.1 Radiometric probing
Every drillhole at Inkai is logged for total count gamma radiation, which is used as the primary uranium
measurement in resource estimation. Therefore, the quality of the grade calculations is thoroughly controlled.
The probes use sodium-iodine crystals which are 30 x 70 millimetres in size and are shielded by lead filters
0.9 to 1.1 millimetres in thickness. The preparation of devices and equipment for operation, methods and
techniques of logging are kept in strict compliance with the requirements from the instruction manuals on
operation and gamma-logging. The readings are measured in micro-roentgen per hour and are taken at 10-
centimetre intervals down the length of the drillhole.
The source materials for logging calibration are considered to be of good quality and are used to test the
probing equipment both prior to and after logging. The variation in gamma logging estimates, based on basic
control and check logging, does not exceed +/- 5% grade-thickness, and the variation in recording electrical
logging parameters does not exceed +/- 7%.
The data from the gamma logging is processed and interpreted using the AtomGeo software, which uses an
algorithm of differential interpretation (deconvolution), as recommended by the SRC logging instruction
60 2017 INKAI OPERATION TECHNICAL REPORT
manual. During the interpretation, adjustments are made for absorption of gamma radiation by mud and for
moisture within the mineralization. The first adjustment is made based on the value of the nominal diameter
for the drilled mineralized intervals because the adjustment by an actual well diameter, established by caliper
logging, differs from it by less than 2%. A 15% adjustment for humidity is applied on the basis of numerous
measurements. In addition, adjustments for radioactive equilibrium and radon release are made manually on
the diagrams of differential interpretation.
Further comparisons have been made between gamma logging data and neutron logging data to confirm the
absence of systematic errors. Prompt fission neutron logging was performed for a number of drillholes as a
direct method for logging uranium and to check comparisons with gamma log determinations of the uranium
grade.
11.5.2 Caliper logging
Caliper logging is performed over the entire length of a drillhole in approximately 10% of the drillholes.
Calipers are calibrated before and after each logging run by using reference rings. When comparing the
results of the calliper logging to the corresponding nominal diameters of the drillhole intervals, the difference
was insignificant and the standard deviations did not exceed the allowable values indicated by the instruction
manual. On this basis, it was concluded that for the calculation of the gamma-ray absorption coefficient, the
nominal diameter of drillholes could be used.
11.5.3 Hole deviations
Directional surveys are carried out on every drillhole at Inkai to determine the actual position of the well in
three-dimensional space. This is carried out by measuring the zenith and azimuth angles for the deviation of
the well from vertical. Measurements are made every 20 metres down the length of the drillhole. During the
deviation survey, every fifth point is re-measured as a check measurement. These check measurements are
conducted two to three metres above the original key point. Similar check measurements are conducted in
cases where serious changes to the zenith angle occur when compared to the previous point. The drift
indicator is calibrated at least once per month.
11.5.4 Resistivity and self-polarization
These methods are used on all holes to identify the lithologies and stratigraphic features, and to assess the
permeability of the rocks in place.
11.6 Density determinations
Density determinations are typically made on 100 to 150 samples per mineralized horizon, and are analyzed
by using bulk density methods. The density of the mineralized material is regarded as constant at 1.70 tonnes
per metre cubed.
11.7 Quality assurance / quality control
The sampling reproducibility for the uranium and radium assays was determined by two methods: (1) having
the remaining half of the core sampled by another sampler and by (2) by compositing samples consisting of
the original sample rejects and samples of the remaining half of the core. The standard deviation for (1) did
not exceed 6.4% and the standard deviation for (2) did not exceed 5.6%.
In order to ensure the assay accuracy and adequacy for the purposes of correlation with gamma probing and
disequilibrium determination for resource estimation, the following control analyses were carried out:
internal laboratory control of the uranium and the radium grade determination is performed by
comparing the results of the sample and its blind duplicate. The mean square error between sample
and duplicate was calculated by measuring the deviation to ensure it stayed within the prescribed
limits. The number of control samples was approximately 9% of all samples for uranium and
approximately 6% of all samples for radium.
61 2017 INKAI OPERATION TECHNICAL REPORT
internal inter-method control of assays for uranium and radium were performed in the form of checks
between the results of the X-ray fluorescence analysis for uranium against the results of wet chemical
analyses conducted by CAL. The results of radium determination were checked against the results
of radiochemical analyses also conducted by CAL. The number of control samples was
approximately 4% of all samples for uranium and approximately 2% of all samples for radium.
external (inter-laboratory) controls for the uranium and radium assays were carried out at the VIMS
laboratory in Moscow, Russia, Nevskoe PGO laboratory in Saint-Petersburg, Russia and
Kyzyltepageologiya Laboratory in Navoi, Uzbekistan. The number of control samples was
approximately 2% of all samples for uranium and approximately 1% of all samples for radium.
Based on numerous QA/QC controls applied by Volkovgeology, including internal checks and inter-laboratory
checks, the repeatability of the results for uranium and radium confirmed the accuracy specified and no
significant systematic deviations were found.
All drilling, logging, core drilling, and subsequent core splitting and assaying, were completed under the
direction of various geological expeditions of the USSR Ministry of Geology and later under the supervision of
Volkovgeology. Sampling and analysis procedures have been examined by Cameco and an independent
consultant and found to be detailed and thorough.
11.8 Adequacy of sample preparation, assaying, QA/QC and
security
With respect to historic Kazakh exploration on Blocks 1, 2 and 3, Cameco has been unable to locate the
documentation on sample security at this time. However, based upon the rigorous QA/QC used in other areas
of sampling, and on strict regulations imposed by the Kazakhstan government, Cameco believes that the
security measures taken to store and ship samples were of the highest quality.
The QP responsible for this section has witnessed core handling, logging and sampling at Inkai, considers
that the methodologies are satisfactory and the results representative and reliable. The QP is satisfied with all
aspects of probing, sample preparation, assaying, QA/QC and security for samples resulting from drilling by
JV Inkai and believes that the security measures taken to handle, store and ship samples are acceptable.
62 2017 INKAI OPERATION TECHNICAL REPORT
12 Data verification
12.1 Blocks 1 and 2
The data relevant to Block 1 of the Inkai deposit, as well as some of the data relevant to Block 2, have been
used to produce the “Report of the Expedition No. 7 on the First Stage of the Detailed Exploration-Delineation
of the Inkai Uranium Deposit for the Period 1979–1991”, issued by Volkovgeology in 1991.
That report consists of three volumes in Russian:
Volume I: Geology of the Orebody, comprising 11 books and two binders of plan views and
sections
Volume II: Estimate of the Reserves, comprising 11 books and 11 binders of plan views and
sections
Volume III: Results of a Leach Test on Property 1, comprising three books and one binder of
drawings.
In July and August of 2002, Cameco obtained access to the detailed drillhole data which consisted of:
list of radioactivities for all anomalous zones (with their conversion into radium concentration for
159 drillholes)
geophysical graphs (radioactivity, resistivity, self-potential)
assay results (radium and uranium) from individual drillhole log and from binders 186 and 187
list of filtration coefficients in the anomalous zones.
Drawings from the report were also sent to Cameco after JV Inkai obtained the necessary export
authorizations.
The following information was digitized from reports, sections and maps, and validated by Cameco with
available Volkovgeology reports:
lists of mineralized intervals used in the 1991 estimate by Volkovgeology
tables of calculations and lists of filtration coefficients that could be found in books two to 10 of
Volume II of the RDP-7
radioactive listings (and calculated radium concentrations) for 159 drillholes only
drillhole collar co-ordinates and deviations
lithology, oxidation level and filtration coefficients.
The available information as of March 2003 was more than sufficient to allow for a comprehensive data
verification, and for validating the historic Kazakh mineral resource and reserve estimate.
Part of the assay results has also been processed by Cameco to validate the uranium grade calculations by
Volkovgeology. All of the 1,294 drillholes shown on the Volkovgeology cross-sections were studied and
coded.
All of the drillhole core that could be recovered (and according to the drill logs, this recovery was good) was
sampled and assayed for uranium and radium content. The location of each sample and the assay results
were recorded in the drillhole log, referred to as a passport.
Subsequently, in 2007, Volkovgeology issued two reports for Block 2:
“Technical and Economic Substantiation of Permanent Conditions for Block 2 of the Inkai Uranium
Deposit”, consisting of five books and five binders of plan views and cross-sections
“Report on the Results of Exploration and Delineation at Block 2 of the Inkai Uranium Deposit over
the Period from 1991 to 2006”, consisting of the following two volumes:
o “Volume I: Geology of the Orebody”, comprising five books and five binders
63 2017 INKAI OPERATION TECHNICAL REPORT
o “Volume II: Estimate of the Reserves”, comprising one book and five binders.
Based on the observations from the amount of data verification, resource validation and mining experience in
Block 1, Cameco’s data validation for Block 2 was less extensive than the one it did on Block 1. The validation
done covered drillhole location and uranium grade calculations for mineralized intervals,
12.1.1 Radioactivity, radium and uranium grades
Each historic drillhole has been entirely gamma probed, and the graphs (originals and copy on passport) were
found in the individual drillhole files. In the anomalous zones and their vicinity, the graphs were digitized and
computerized. The result was a list of radioactivity measures in micro-roentgen per hour at 10-centimetre
spacing. All drillholes drilled by JV Inkai were probed by its geophysical crews. The gamma data was
recorded in digital form by the logging equipment, with radioactivity measurement in micro-roentgen per hour
every 10 centimetres, and stored in the AtomGeo database.
As a correlation has been established between radioactivity and radium content, it is possible to convert this
radioactivity into radium grade. The process used by Volkovgeology is performed by means of AtomGeo, a
proprietary program developed by Volkovgeology. This program takes into account the characteristics of the
drillhole (diameter, fluid density and casing), the characteristics of the surrounding ground (density) and the
characteristics of each individual probe.
The relationship between radioactive readings and calculated radium grades obtained from the use of the
method was studied in detail by Cameco. There is a very good relationship between radioactivity and radium
grade in most locations. Arithmetic and logarithmic plots between the two variables give a gradient of 1.086,
suggesting the possibility of overestimating radium content in the high radioactivity zones.
The conversion of radium grade into uranium grade is dependent on the radium-uranium equilibrium. A
disequilibrium factor related to the interpreted location of the mineralized intervals in the roll-front is applied.
Correlation on grade-thickness from radioactivity and from uranium grade was reviewed and found to be
excellent. The data validation work done by Cameco showed that the grade and grade-thickness used by
Volkovgeology are considered quite reliable.
12.2 Block 3
Block 3 datasets, including the drillhole database and geological interpretations, were provided to Cameco
and are currently being reviewed by Cameco. So far, Cameco has validated for consistency the drillhole
information in the dataset with maps, cross-sections and calculation tables received from JV Inkai. The few
inconsistencies noted were reported to JV Inkai. The Block 3 datasets were previously validated by
Volkovgeology, JV Inkai, and SRC. Cameco has not reviewed their validation results.
12.3 Opinion on adequacy of data
The QPs for this section are satisfied with the quality of data and consider it valid for use in the estimation of
mineral resources and mineral reserves for Blocks 1 and 2. Comparison of the actual mine production with the
expected production from the mine plan supports this opinion.
All of the drillhole information in use at Inkai is regularly provided to Cameco. The current database for Block 1
and Block 2 has been thoroughly validated a number of times by geologists with JV Inkai, Volkovgeology, the
SRC and Cameco (including the QPs responsible for this section) and is considered relevant and reliable.
This is supported again by the uranium production from Blocks 1 and 2.
64 2017 INKAI OPERATION TECHNICAL REPORT
13 Mineral processing and metallurgical testing
The ISR mining method applied at Inkai uses sulphuric acid as the lixiviant. The resulting uranium rich
pregnant solution is processed at surface plants which produces uranium peroxide yellowcake. At Inkai, the
pregnant solution from the Block 1 wellfield reports to the main processing plant (MPP), the pregnant solution
from the Block 2 wellfield reports to Satellite 1 processing plant (Sat1), and the pregnant solution from Block 3
reports to TLF processing plant.
Field test work at the Inkai site started in the late 1970s. By the end of the 1990s, all main process parameters
for the Inkai deposit had been determined. Block 1 has been in commercial production since 2009. Block 2
started commercial production in 2010. Since Block 1/MPP and Block 2/Sat1 are in commercial production, a
discussion of metallurgical test results has not been included. A testing campaign is currently being conducted
to assess Block 3.
Production details for Block 1 and 2 are found in Section 16 Mining methods. A description of the process
recovery methods in the MPP, Sat1, and TLF processing plants are provided in Section 17 Recovery
methods. Uranium recovery in the MPP and Sat1 surface operations and the metallurgical test results relating
to Block 3 are discussed in this section.
13.1 Main Processing Plant and Satellite 1
The overall surface process recovery for the MPP and Sat1 operations was 98% in 2016. It is expected to
remain at this level for the current life of mine plan. Although this recovery level is relatively high, future
recovery levels and equipment capacity could be affected by the accumulation of specific species such as
nitrate, chloride, ferrous and ferric ions accumulating in production ponds. To the extent known, these species
do not currently affect the overall uranium recovery and capacity of the surface equipment. In the future, the
accumulation of these species may occur as a result of longer duration of operation and higher production
levels. It is recommended that the concentration of species which have the potential to impact equipment
performance be monitored.
13.2 Block 3 and Test Leach Facility
The main objective of the Block 3/TLF test program is to determine whether the operational experience gained
in Block 1/MPP and/or Block2/Sat1 is directly applicable to Block 3/TLF or if there are differences which
require changes in the approach to its development. Based on the results of exploration at Block 3, the
Volkovgeology 2015 report indicates that geology of the middle Inkuduk region of the Block 3 deposit is
almost identical to the adjacent Block 2 geology including geological and hydrogeological characteristics,
orebody morphology, and mineralogical and material composition of uranium mineralization and enclosing
rocks. Most of the uranium identified in Block 3 exists in the middle Inkuduk region.
Standardized column tests were conducted with three composite samples from Block 3 as described in the
2011 Volkovgeology report, “Laboratory Studies of Technological Parameters of the Ore Deposit Inkai”. The
composite samples selected for preliminary test work are not necessarily representative of the entire deposit
at Block 3. Analysis of the composite samples was conducted according to Kazakhstan regulations.
Table 13-1 below provides the content of key species in the composite samples as determined in the study,
(Volkovgeology, 2011).
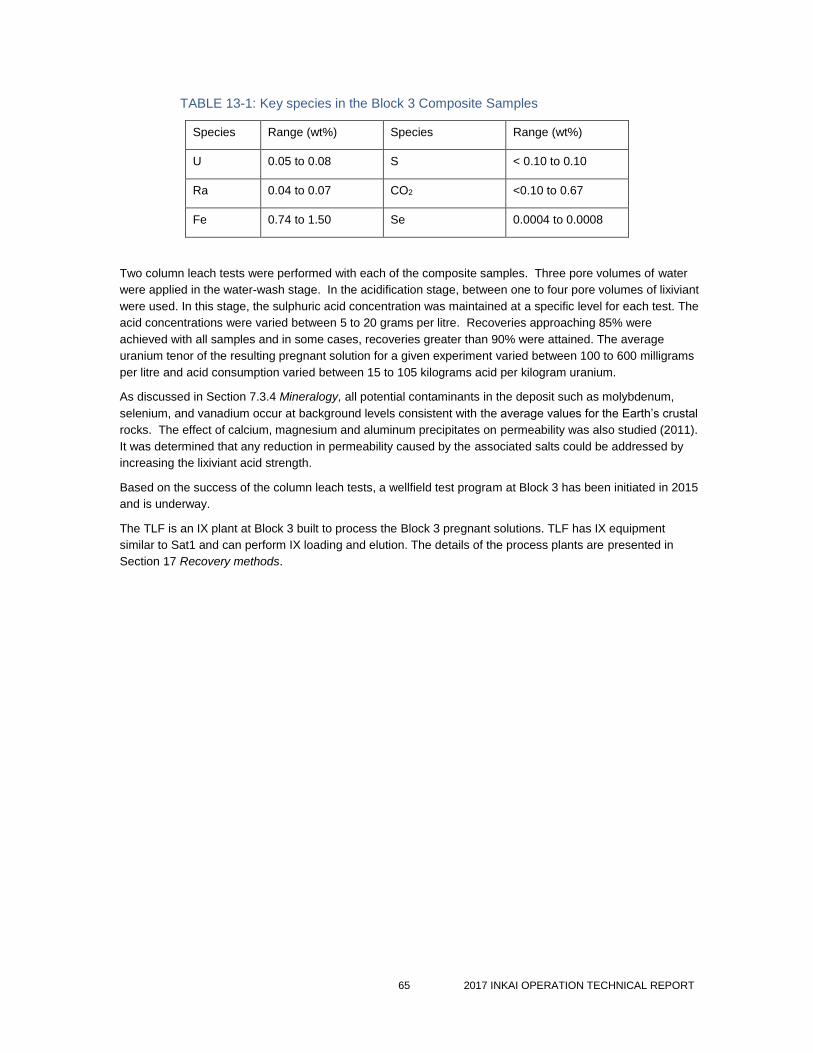
65 2017 INKAI OPERATION TECHNICAL REPORT
TABLE 13-1: Key species in the Block 3 Composite Samples
Species Range (wt%) Species Range (wt%)
U 0.05 to 0.08 S < 0.10 to 0.10
Ra 0.04 to 0.07 CO2 <0.10 to 0.67
Fe 0.74 to 1.50 Se 0.0004 to 0.0008
Two column leach tests were performed with each of the composite samples. Three pore volumes of water
were applied in the water-wash stage. In the acidification stage, between one to four pore volumes of lixiviant
were used. In this stage, the sulphuric acid concentration was maintained at a specific level for each test. The
acid concentrations were varied between 5 to 20 grams per litre. Recoveries approaching 85% were
achieved with all samples and in some cases, recoveries greater than 90% were attained. The average
uranium tenor of the resulting pregnant solution for a given experiment varied between 100 to 600 milligrams
per litre and acid consumption varied between 15 to 105 kilograms acid per kilogram uranium.
As discussed in Section 7.3.4 Mineralogy, all potential contaminants in the deposit such as molybdenum,
selenium, and vanadium occur at background levels consistent with the average values for the Earth’s crustal
rocks. The effect of calcium, magnesium and aluminum precipitates on permeability was also studied (2011).
It was determined that any reduction in permeability caused by the associated salts could be addressed by
increasing the lixiviant acid strength.
Based on the success of the column leach tests, a wellfield test program at Block 3 has been initiated in 2015
and is underway.
The TLF is an IX plant at Block 3 built to process the Block 3 pregnant solutions. TLF has IX equipment
similar to Sat1 and can perform IX loading and elution. The details of the process plants are presented in
Section 17 Recovery methods.
66 2017 INKAI OPERATION TECHNICAL REPORT
14 Mineral resource estimates
The estimated mineral resources at Inkai are located in Block 1 and Block 2. The preparation of the resource
models followed the SRC guidelines. They were prepared by Volkovgeology using the GT estimation method
on two-dimensional blocks in plan view. They were approved by SRC in 1993, for Block 1, and in 2007, for
Block 2. Inkai’s mineral resource estimates have been reviewed and accepted by Cameco. Cameco
performed a re-interpretation and re-estimation of Block 1 in 2003, and confirmed the estimated pounds of
uranium to within 2.5% of the Kazakh estimate. Independent verifications of the mineral resources estimates
were performed in 2005 on Block 1 and in 2007 on Block 2 and the results were consistent with the Kazakh
resource estimates.
A revision of the alignment of the historical Kazakh mineral resources classification system with the CIM
Definition Standards was done by Cameco in 2016.
The classification of mineral resources and their subcategories conforms to the definitions adopted by the CIM
Council on May 10, 2014, which are incorporated by reference in NI 43-101. Cameco reports mineral reserves
and mineral resources separately. The amount of reported mineral resources does not include those amounts
identified as mineral reserves. Mineral resources that are not mineral reserves have no demonstrated
economic viability and do not meet the requirements for all relevant modifying factors. Stated mineral
resources are derived from estimated quantities of mineralized material recoverable by ISR methods. Inkai’s
mineral resources do not include allowances for dilution and wellfield uranium recovery.
14.1 Key assumptions, parameters and methods
Guidelines
The methodology of delineation programs and all related procedures for geological, geophysical, analytical
work and resource classification follows the recommendation of the SRC guidelines for exploration and
delineation of uranium deposits (GKZ, 1986). The guideline first was developed by the State Reserve
Commission of the USSR. It was followed by the guideline issued in 2008 by the SRC of Kazakhstan,
specifically developed for the roll-front (sandstone) uranium deposits in Kazakhstan (SRC, 2008).
The SRC guidelines outline the main requirements and standards for exploration/delineation and related work,
including:
deposits classification into geological types and complexity categories
stages of exploration and delineation work
recommendations for drilling pattern geometry and densities, depending on the stage, complexity
and the category of reserves to be defined
a regular pattern is necessitated by the polygonal plan method of reserve estimation
requirements for geological logging of the core
requirements for geophysical downhole logging
requirements for the content and standards of analytical work
reserve estimation procedures and requirements for data used.
The requirements for geophysical logging, data processing, analytical work, and topographic work must follow
corresponding subordinate guidelines specifying the standards for equipment performance, QA/QC protocols
and other similar items.
The SRC guidelines represent a significantly more detailed and prescriptive set of requirements in comparison
to NI 43-101, the CIM Definition Standards and the CIM “Estimation of Mineral Resources and Mineral
67 2017 INKAI OPERATION TECHNICAL REPORT
reserves – Best Practice Guidelines”.
The Kazakhstan Association for Public Reporting of Exploration Results, Mineral Resource and Mineral
Reserves (KAZRC) developed the KAZRC Code in June 2016 following the CRIRSCO template. KAZRC
contains a checklist outlining the recommended additional criteria for estimation and reporting of uranium for
in-situ leaching. The checklist is consistent with the requirements of the SRC guidelines, although represents
a much higher level summary.
Technical studies
The regulations in Kazakhstan require that definitive mineral resource estimation reports submitted to the
SRC be based on approved set of parameters. The selection of the parameters must be substantiated in a
study known as TEO of Permanent Conditions (TEO), from the Russian abbreviations for Technical and
Economic Substantiation. A TEO must be submitted and approved by the SRC. The following two documents
provide a useful reference for the nature, the scope and the meaning of the TEO studies:
“The Guidelines On Alignment Of Russian Minerals Reporting Standards And The CRIRSCO
Template” (FGU GKZ and CRIRSCO, 2010)
“The Guidelines On Alignment Of Minerals Reporting Standards Of The Republic Of Kazakhstan And
The CRIRSCO Template” (KAZRC, 2016).
A TEO is defined as follows: “The TEO of Permanent Conditions is prepared according to the results of
completed exploration work. Its purpose is to establish the scale and commercial value of a deposit, to define
the economic value of its development, and to aid decision-making on financial investments in mining
development of the deposit. Thus all financial estimates on the accepted option for commercial development
of the deposit are carried out within the framework of realistically assumed values of all the modifying factors.
The overall reliability of the completed study must be characterised.”
The TEO studies are required to include a mining plan and be based on technical and economic parameters
relevant to the deposit studied as well as cost estimates for CAPEX and OPEX and commodity price forecast
relevant for the time of the studies and the mine planning horizon.
The guidelines state that TEO studies are thus broadly similar to Preliminary Feasibility Study or a Feasibility
Study defined in the International Reporting Template, published by the Committee for Mineral Reserves
International Reporting Standards (CRIRSCO). The TEO studies provide a set of parameters allowing
distinguishing parts of mineralization that can be profitably extracted (the so-called “Balance” part) from parts
which cannot be profitably extracted (the so-called “Off-Balance” part) at the time of estimation in accordance
with technical-economic calculations carried out in a TEO study. Cameco only uses the “Balance” part of
mineralization for defining Inkai’s mineral resources and the basis for mineral reserves.
Once approved, the TEO studies provide a set of parameters to be used in preparation of a resource
estimation report. A resource estimation report contains detailed data and results for the geological,
hydrogeological, geotechnical, including laboratory and field ISR test delineation, analytical, geophysical
studies, description of the methodology for delineation and resource estimation, as well as resource
estimation itself.
TEO studies were completed and approved by SRC for Block 1 in 1991 and for Block 2 in 2007. They were
based on the results of exploration-delineation drilling programs and accompanying studies of hydrogeological
and technological characteristics, including laboratory column leach and field ISR tests. The resource
estimation reports were reviewed by Cameco as described in Section 12 Data verification. TEO studies were
reviewed by Cameco and used in studies it did to validate the project economics and to contemplate
increasing production levels.
To define the mineral resources in 2007, average forecast price of $32.80 (US) per pound of U3O8 was used
along with production costs of $11.20 (US) per pound of U3O8. As mineral reserves are currently based on
$51 (US) per pound with production costs of $9.80 (US) (See Section 21.2 Operating cost estimates), the
expectation for eventual economic extraction of the mineral resources is reasonable. It is also supported by
68 2017 INKAI OPERATION TECHNICAL REPORT
studies of hydrogeological and technological characteristics of the mineralization. The amenability to ISR
mining is determined by laboratory leach tests, field ISR tests and further supported by the results of
commercial operation since 2009.
14.1.1 Key assumptions
mineral resources were estimated based on the use of the ISR extraction method and yellowcake
production
in 2007, average forecast price of $32.80 (US) per pound U3O8 was used to estimate the mineral
resources cut-off, along with production costs of $11.20 (US) per pound U3O8 and 85% metallurgical
recovery. These are still valid today to define the mineral resources, and reasonable given the
proximity of surface and mining infrastructure on the site
14.1.2 Key parameters
Block 1 mineral resources estimates are based on 991 surface drillholes
Block 2 mineral resources and reserves estimates are based upon 1,441 drillholes
grades (% U3O8) were obtained from gamma radiometric probing of drillholes, checked against assay
results and prompt-fission neutron logging results to account for disequilibrium
average density of 1.70 tonnes per cubic metre was used, based on historical and current sample
measurements
Additional key parameters, including cut-offs are listed in Table 14-1.
14.1.3 Key methods
geological interpretation of the orebody outlines was done on section and plan views derived from
surface drillhole information
a resource block must be confined to one aquifer taking into consideration the distribution of local
aquitards.
mineral resources were estimated with the GT method, where the estimated variable is the uranium
grade multiplied by the thickness of the interval, and using two-dimensional block models
geological modelling and mining applications used were AtomGeo, MapInfo and Maptek Vulcan.
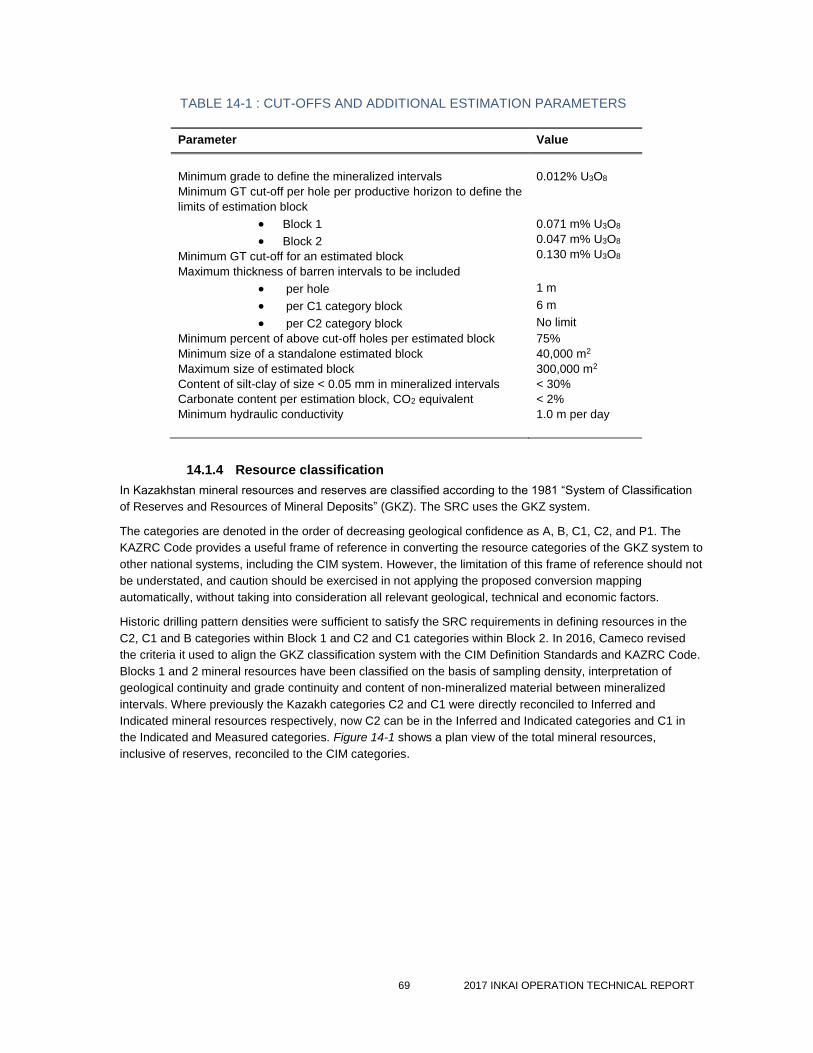
69 2017 INKAI OPERATION TECHNICAL REPORT
TABLE 14-1 : CUT-OFFS AND ADDITIONAL ESTIMATION PARAMETERS
14.1.4 Resource classification
In Kazakhstan mineral resources and reserves are classified according to the 1981 “System of Classification
of Reserves and Resources of Mineral Deposits” (GKZ). The SRC uses the GKZ system.
The categories are denoted in the order of decreasing geological confidence as A, B, C1, C2, and P1. The
KAZRC Code provides a useful frame of reference in converting the resource categories of the GKZ system to
other national systems, including the CIM system. However, the limitation of this frame of reference should not
be understated, and caution should be exercised in not applying the proposed conversion mapping
automatically, without taking into consideration all relevant geological, technical and economic factors.
Historic drilling pattern densities were sufficient to satisfy the SRC requirements in defining resources in the
C2, C1 and B categories within Block 1 and C2 and C1 categories within Block 2. In 2016, Cameco revised
the criteria it used to align the GKZ classification system with the CIM Definition Standards and KAZRC Code.
Blocks 1 and 2 mineral resources have been classified on the basis of sampling density, interpretation of
geological continuity and grade continuity and content of non-mineralized material between mineralized
intervals. Where previously the Kazakh categories C2 and C1 were directly reconciled to Inferred and
Indicated mineral resources respectively, now C2 can be in the Inferred and Indicated categories and C1 in
the Indicated and Measured categories. Figure 14-1 shows a plan view of the total mineral resources,
inclusive of reserves, reconciled to the CIM categories.
Parameter Value
Minimum grade to define the mineralized intervals 0.012% U3O8
Minimum GT cut-off per hole per productive horizon to define the
limits of estimation block
Block 1
Block 2
Minimum GT cut-off for an estimated block
0.071 m% U3O8
0.047 m% U3O8
0.130 m% U3O8
Maximum thickness of barren intervals to be included
per hole 1 m
per C1 category block 6 m
per C2 category block No limit
Minimum percent of above cut-off holes per estimated block 75%
Minimum size of a standalone estimated block 40,000 m2
Maximum size of estimated block 300,000 m2
Content of silt-clay of size < 0.05 mm in mineralized intervals < 30%
Carbonate content per estimation block, CO2 equivalent < 2%
Minimum hydraulic conductivity 1.0 m per day
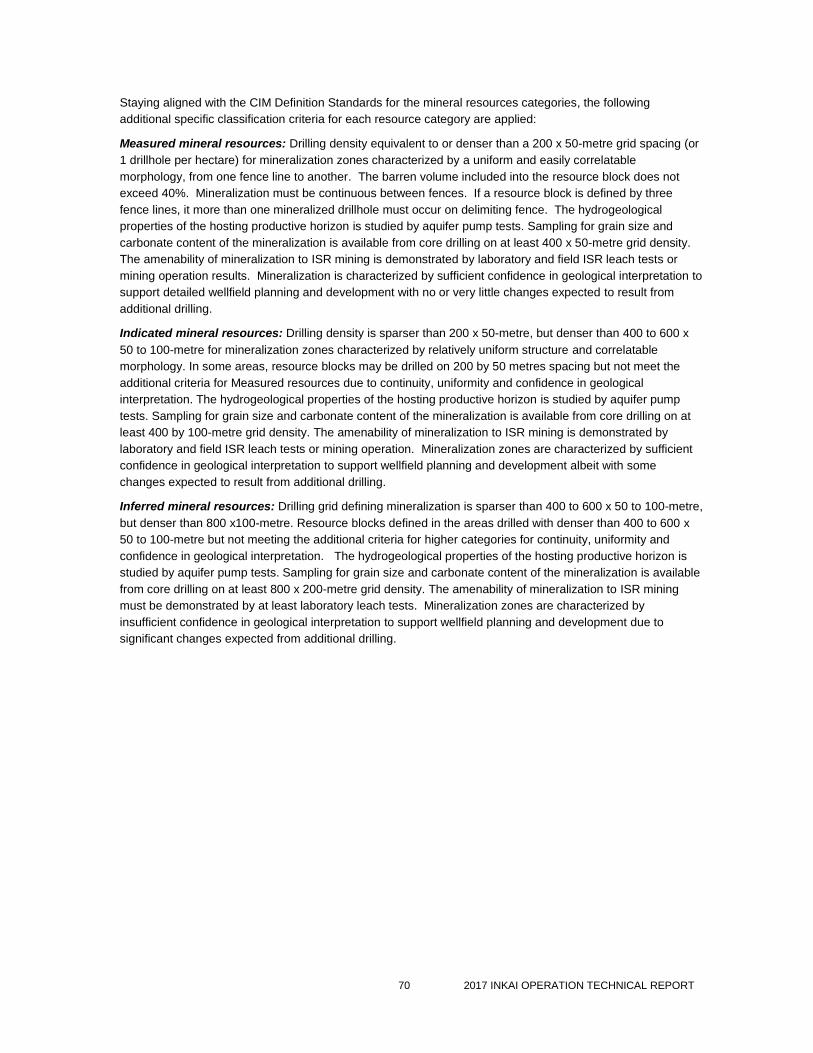
70 2017 INKAI OPERATION TECHNICAL REPORT
Staying aligned with the CIM Definition Standards for the mineral resources categories, the following
additional specific classification criteria for each resource category are applied:
Measured mineral resources: Drilling density equivalent to or denser than a 200 x 50-metre grid spacing (or
1 drillhole per hectare) for mineralization zones characterized by a uniform and easily correlatable
morphology, from one fence line to another. The barren volume included into the resource block does not
exceed 40%. Mineralization must be continuous between fences. If a resource block is defined by three
fence lines, it more than one mineralized drillhole must occur on delimiting fence. The hydrogeological
properties of the hosting productive horizon is studied by aquifer pump tests. Sampling for grain size and
carbonate content of the mineralization is available from core drilling on at least 400 x 50-metre grid density.
The amenability of mineralization to ISR mining is demonstrated by laboratory and field ISR leach tests or
mining operation results. Mineralization is characterized by sufficient confidence in geological interpretation to
support detailed wellfield planning and development with no or very little changes expected to result from
additional drilling.
Indicated mineral resources: Drilling density is sparser than 200 x 50-metre, but denser than 400 to 600 x
50 to 100-metre for mineralization zones characterized by relatively uniform structure and correlatable
morphology. In some areas, resource blocks may be drilled on 200 by 50 metres spacing but not meet the
additional criteria for Measured resources due to continuity, uniformity and confidence in geological
interpretation. The hydrogeological properties of the hosting productive horizon is studied by aquifer pump
tests. Sampling for grain size and carbonate content of the mineralization is available from core drilling on at
least 400 by 100-metre grid density. The amenability of mineralization to ISR mining is demonstrated by
laboratory and field ISR leach tests or mining operation. Mineralization zones are characterized by sufficient
confidence in geological interpretation to support wellfield planning and development albeit with some
changes expected to result from additional drilling.
Inferred mineral resources: Drilling grid defining mineralization is sparser than 400 to 600 x 50 to 100-metre,
but denser than 800 x100-metre. Resource blocks defined in the areas drilled with denser than 400 to 600 x
50 to 100-metre but not meeting the additional criteria for higher categories for continuity, uniformity and
confidence in geological interpretation. The hydrogeological properties of the hosting productive horizon is
studied by aquifer pump tests. Sampling for grain size and carbonate content of the mineralization is available
from core drilling on at least 800 x 200-metre grid density. The amenability of mineralization to ISR mining
must be demonstrated by at least laboratory leach tests. Mineralization zones are characterized by
insufficient confidence in geological interpretation to support wellfield planning and development due to
significant changes expected from additional drilling.
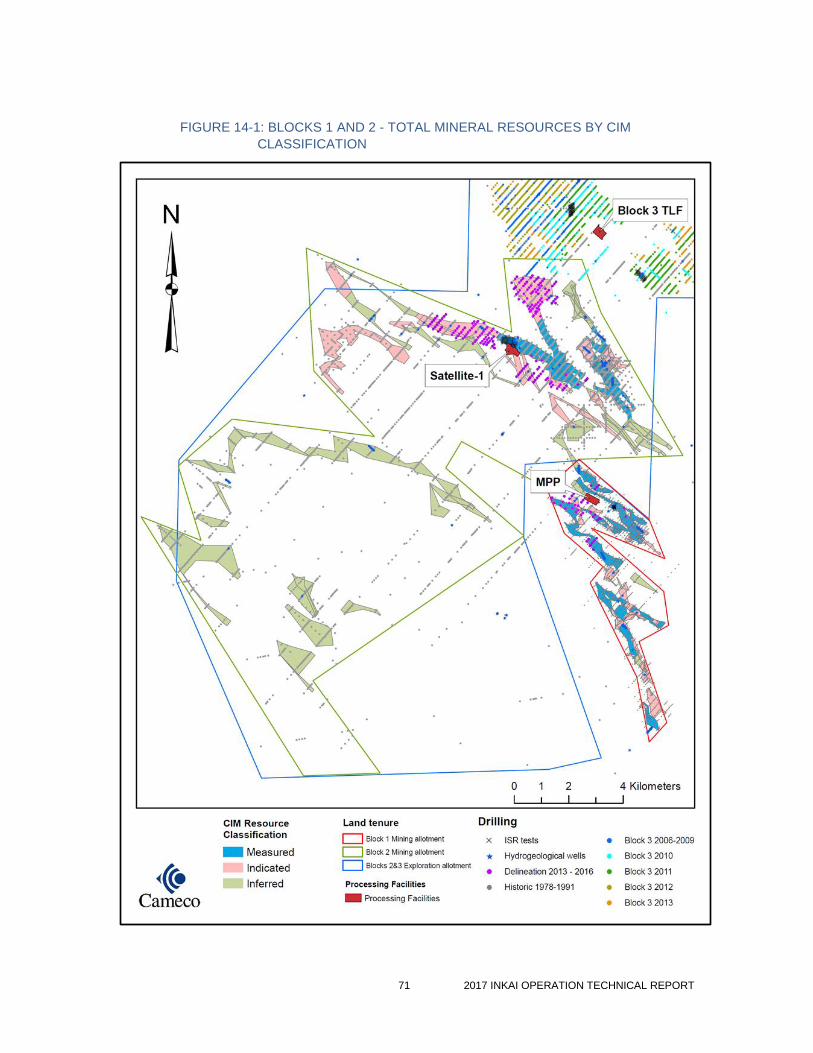
71 2017 INKAI OPERATION TECHNICAL REPORT
FIGURE 14-1: BLOCKS 1 AND 2 - TOTAL MINERAL RESOURCES BY CIM
CLASSIFICATION
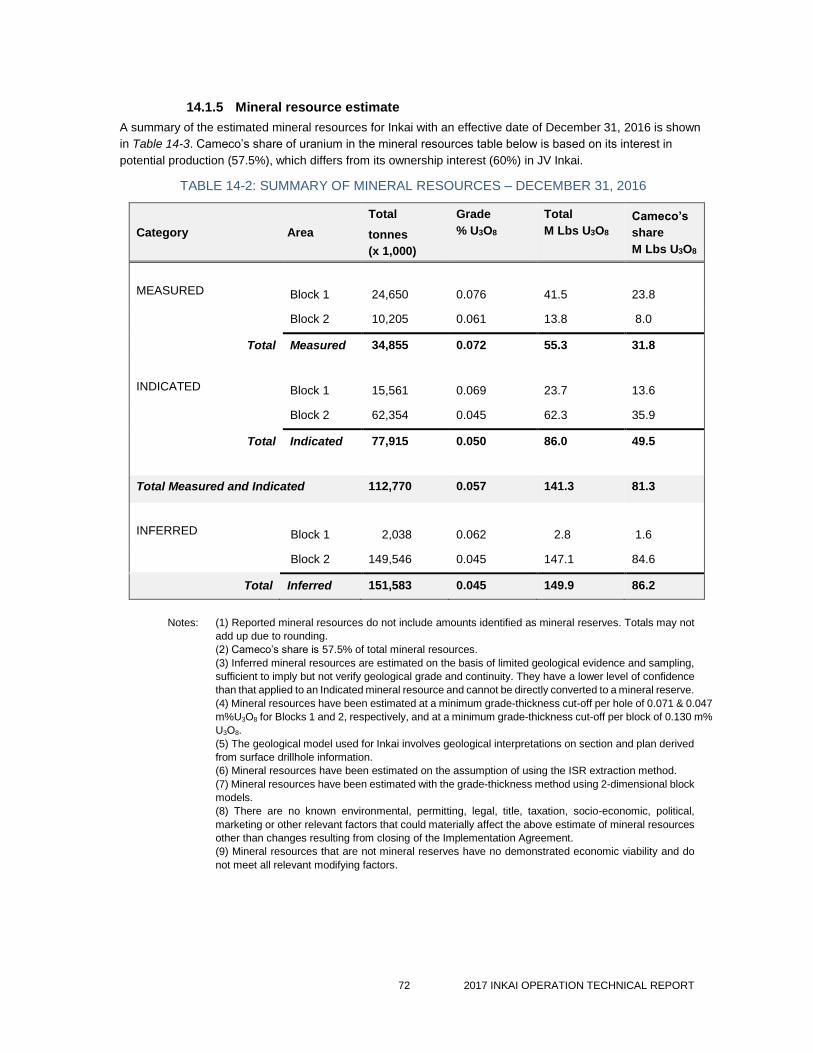
72 2017 INKAI OPERATION TECHNICAL REPORT
14.1.5 Mineral resource estimate
A summary of the estimated mineral resources for Inkai with an effective date of December 31, 2016 is shown
in Table 14-3. Cameco’s share of uranium in the mineral resources table below is based on its interest in
potential production (57.5%), which differs from its ownership interest (60%) in JV Inkai.
TABLE 14-2: SUMMARY OF MINERAL RESOURCES – DECEMBER 31, 2016
Category Area
Total
tonnes
(x 1,000)
Grade
% U3O8
Total
M Lbs U3O8
Cameco’s
share
M Lbs U3O8
MEASURED
Block 1
24,650
0.076
41.5
23.8
Block 2 10,205 0.061 13.8 8.0
Total Measured 34,855 0.072 55.3 31.8
INDICATED
Block 1
15,561
0.069
23.7
13.6
Block 2 62,354 0.045 62.3 35.9
Total Indicated 77,915 0.050 86.0 49.5
Total Measured and Indicated 112,770 0.057 141.3 81.3
INFERRED
Block 1
2,038
0.062
2.8
1.6
Block 2 149,546 0.045 147.1 84.6
Total Inferred 151,583 0.045 149.9 86.2
Notes: (1) Reported mineral resources do not include amounts identified as mineral reserves. Totals may not
add up due to rounding.
(2) Cameco’s share is 57.5% of total mineral resources.
(3) Inferred mineral resources are estimated on the basis of limited geological evidence and sampling,
sufficient to imply but not verify geological grade and continuity. They have a lower level of confidence
than that applied to an Indicated mineral resource and cannot be directly converted to a mineral reserve.
(4) Mineral resources have been estimated at a minimum grade-thickness cut-off per hole of 0.071 & 0.047
m%U3O8 for Blocks 1 and 2, respectively, and at a minimum grade-thickness cut-off per block of 0.130 m%
U3O8.
(5) The geological model used for Inkai involves geological interpretations on section and plan derived
from surface drillhole information.
(6) Mineral resources have been estimated on the assumption of using the ISR extraction method.
(7) Mineral resources have been estimated with the grade-thickness method using 2-dimensional block
models.
(8) There are no known environmental, permitting, legal, title, taxation, socio-economic, political,
marketing or other relevant factors that could materially affect the above estimate of mineral resources
other than changes resulting from closing of the Implementation Agreement.
(9) Mineral resources that are not mineral reserves have no demonstrated economic viability and do
not meet all relevant modifying factors.
73 2017 INKAI OPERATION TECHNICAL REPORT
14.1.6 Changes to mineral resources
The differences in Cameco’s share of the pounds between the 2016 and the 2015 year-end mineral
resource estimates show increases of 31.8 million pounds in Measured and 19.2 million pounds in Indicated
resources and a decrease of 58.1 million pounds in Inferred resources. The changes are mainly due to:
revised mineral resources classification with most of C1 and C2 categories, which are not included
in the mine plan, now equivalent to Measured and Indicated, respectively
the production plan now assumes production of 5.4 million pounds of U3O8 for 2017, then 5.2
million pounds per year for 2018 to 2028 and then decreasing till 2030, with more Indicated
resources available for conversion to mineral reserves than previously.
The mineral resource classification is based on the criteria laid out in Section 14.2.4 Resource classification. A summary of the changes in mineral resources is shown in Table 14-3.
TABLE 14-3: CHANGES IN MINERAL RESOURCES
Year-end 2015 Year-end 2016 Changes
Category
Total
tonnes
(x 1,000)
Grade
% U3O8
Total
M Lbs
U3O8
Total
tonnes
(x 1,000)
Grade
% U3O8
Total
M Lbs
U3O8
Total
M Lbs
U3O8
Cameco’s
share
M Lbs U3O8
Measured - - - 34,855 0.072 55.3 + 55.3 + 31.8
Indicated 31,366 0.076 52.6 77,915 0.050 86.0 + 33.4 + 19.2
Inferred 250,959 0.045 251.0 151,583 0.045 149.9 - 101.1 - 58.1
Notes: (1) Cameco reports mineral reserves and mineral resources separately. Reported mineral resources do not
include amounts identified as mineral reserves. Totals may not add up due to rounding.
(2) Cameco’s share is 57.5% of total mineral resources.
(3) Inferred mineral resources are estimated on the basis of limited geological evidence and sampling, sufficient
to imply but not verify geological and grade continuity. They have a lower level of confidence than that
applied to an Indicated mineral resource and cannot be directly converted to a mineral reserve.
14.2 Factors that could materially affect the mineral resource
estimate
The QP responsible for Inkai mineral resource estimate is satisfied with the high quality of data and considers
the data valid for use in the estimation of mineral resources. This is supported by the results of the leach tests
done on Blocks 1 and 2, and commercial production results from Blocks 1 and 2 since 2009.
As is the case for most mining projects, the extent to which the estimate of mineral resources may be affected
by environmental, permitting, legal, title, taxation, socio-economic, political, marketing or other relevant factors
could vary from material gains to material losses. The QP responsible for the mineral resource estimate is not
aware of any relevant factors that could materially affect Inkai’s mineral resource estimate other than changes
resulting from closing of the Implementation Agreement (see Section 24.3 2016 Implementation Agreement).
74 2017 INKAI OPERATION TECHNICAL REPORT
15 Mineral reserve estimates
15.1 Definitions
The classification of mineral reserves and their subcategories conforms to the CIM Definition Standards.
Cameco reports mineral reserves and mineral resources separately. The reference point at which Inkai’s
mineral reserves are defined is the point where the mineralization occurs under the existing or planned
wellfield pattern.
Stated mineral reserves are derived from estimated quantities of mineral resources economically recoverable
by ISR and satisfying all modifying factors. Inkai’s mineral reserves do not include allowances for dilution and
wellfield uranium recovery. The wellfield uranium recovery is part of the reported metallurgical recovery.
Mineral reserves have demonstrated economic viability. Only Block 1 and Block 2 Indicated and Measured
mineral resources are considered for conversion to mineral reserves. Inkai’s mineral reserves estimate has
been updated with the life-of-mine plan provided by JV Inkai and reviewed by Cameco.
Recovery
In the ISR process some quantity of mineralization cannot be extracted from the ground due to a number of
geological, mining as well as metallurgical factors. These include, for example, the formation of stagnant
zones, reduced permeability due to plugging up pore spaces, re-precipitation of some uranium in the leach
zones, screen location in relation to complex mineralization morphology and hydrogeological settings or
unfavorable host rock composition, return of residual uranium remaining in the lixiviant to wellfields after
extraction at the processing facilities. In practice it is difficult or impossible to accurately establish the share of
each of the above contributors to the total loss pertinent to the in-situ leaching process. The total loss can
nevertheless be established based on the results of laboratory leach tests, field ISR tests and commercial ISR
operation which all provide the basis for expected wellfield recovery. The recovery obtained from the in-situ
leaching process is therefore included in the metallurgical recovery.
Dilution
Dilution occurs in ISR, as the lixiviant cannot be precisely confined to the limits of mineralized volume of rock,
but is rather controlled by hydrostratigraphic architecture of the productive horizons, placement of screens and
the balance between injector and producer wells. Dilution results in additional volume of rock mass that has
to be acidified and leached relative to the mineralized rock volume. Dilution is accounted for by using
permeable thickness and corresponding screen lengths at the mine planning step to provide the effective
volume of rock that is subject to acidification and leaching. It is this effective volume that is used for the
wellfield uranium recovery curves and computation of production forecasts. Dilution affects a volume and not
a tonnage.
15.2 Key assumptions, parameters and method
15.2.1 Modifying factors
In order to convert mineral resource to mineral reserve the requirements of all modifying factors have to be
satisfied. The key assumptions, parameters and methods used for mineral reserve definition are based on
the application of relevant modifying factors.
Geological, hydrogeological, mining, metallurgical, technical and economic factors. As discussed in
Section 14 Mineral resource estimates, the assumptions, parameters and methods used for the definition of
mineral resource account for geological, hydrogeological, mining, metallurgical, technical and economic
factors pertinent to the project. It is supported by the results of commercial production since 2009. The same
parameters and assumptions were used in the mining project for the life of the mine required in Kazakhstan
as described in Section 4.5.5 Work programs and project documentation. The technical and economic
studies carried out and presented in the TEO reports were based on reasonable assumptions for the
production costs and uranium price forecast which remain relevant for this technical report. The QPs
responsible for mineral reserve estimates are of the opinion that these geological, hydrogeological, mining,
75 2017 INKAI OPERATION TECHNICAL REPORT
metallurgical, technical and economic factors are relevant and satisfy the requirements for the corresponding
modifying factors that are applied in converting mineral resource to mineral reserve.
Processing factor. The processing facilities capable of processing the flow of pregnant lixiviants from the
wellfields in the terms of its volume and head grade and chemistry. The capacities of the processing facilities,
as described in the Sections 13 Mineral processing and metallurgical testing and Section 17 Recovery
methods meet the requirements of processing the flow of pregnant lixiviants with volumes and head grades as
described in the Section 16.1.4 Wellfield production.
Infrastructure factor. The infrastructure necessary to support the wellfield development, transportation of
materials, electric power requirements, personnel accommodations for the operation of processing facilities,
wellfields. The infrastructure, as described in Section 18 Project infrastructure, is adequate to support the
planned production.
Legal and governmental factor. Inkai has sufficient security of tenure for the mineral rights provided by the
Resource Use Contract and access to the surface area as described in the following Sections:4.2, 4.3, 4.4
and 4.5. Approved mining project and a work program are required under the regulations in Kazakhstan, as
described in Section 4.5.5 Work programs and project documentation. The production plan assumed in this
technical report as presented in Table 16-1 Production schedule and Figure 16-4 is based on approved
mining project and work program.
15.2.2 Key assumptions
average metallurgical recovery of 85%, which is based on the production results so far, as presented
in the Section 16.1.4 Wellfield production
average uranium price of $51 (US) per pound U3O8, derived from the production schedule and annual
forecast realized prices, with exchange rates of $1.00 US=$1.20 to $1.25 Cdn and 245 Kazakhstan
Tenge to $1.00 Cdn.
15.2.3 Key parameters
the production rate is planned for 5.4 million pounds of U3O8 for 2017, then 5.2 million pounds per
year for 2018 to 2028 and then decreasing till 2030.
average estimated operating costs of $12.71 per pound
mineral reserves have been estimated at a minimum grade-thickness of 0.130 m% U3O8
Mineral reserves represent the in-situ ore that can be extracted within the term of the Block 1 and
Block 2 licenses.
15.2.4 Key methods
only Indicated and Measured mineral resources are considered for conversion to mineral reserves
preparation of a feasible mining plan with required infrastructure
considerations of the rate of wellfield uranium recovery, lixiviant uranium head grades, wellfield flow
rates and production requirements to define the production sequence
geological and mining applications used were AtomGeo, MapInfo and Maptek
Vulcan.
15.2.5 Reserve classification
Mineral reserves have been classified in accordance with the CIM Definition Standards, where in most
circumstances the economically mineable part of Indicated mineral resources can become Probable mineral
reserves and the economically mineable part of Measured mineral resources can become Proven mineral
reserves, as long as all modifying factors are satisfied and that, at the time of reporting, extraction could
reasonably be justified.
76 2017 INKAI OPERATION TECHNICAL REPORT
In areas of Probable reserves where the confidence on some characteristics of the mineralization, such as
grade continuity and hydrological conditions, can be increased, additional delineation drilling is recommended.
15.2.6 Cut-off
A cut-off for the mineral reserves of 0.13 m%U3O8 is applied on the estimated GT value for each block of the
mineral resources model. The cut-off is determined with consideration to: a) uranium price, b) wellfield
development and operating costs defined by depth, acid consumption, wellfield pattern layouts, metallurgical
recovery, c) pregnant lixiviant processing costs, and d) reclamation costs as well as other relevant factors.
15.2.7 Mineral reserve estimate
A summary of the estimated mineral reserves for Inkai with an effective date of December 31, 2016 is shown
in Table 15-1. Cameco’s share of uranium in the mineral reserves table below is based on its interest in
planned production (57.5%) assuming an annual production rate of 5.2 million pounds of U3O8, which differs
from its ownership interest (60%) in JV Inkai.
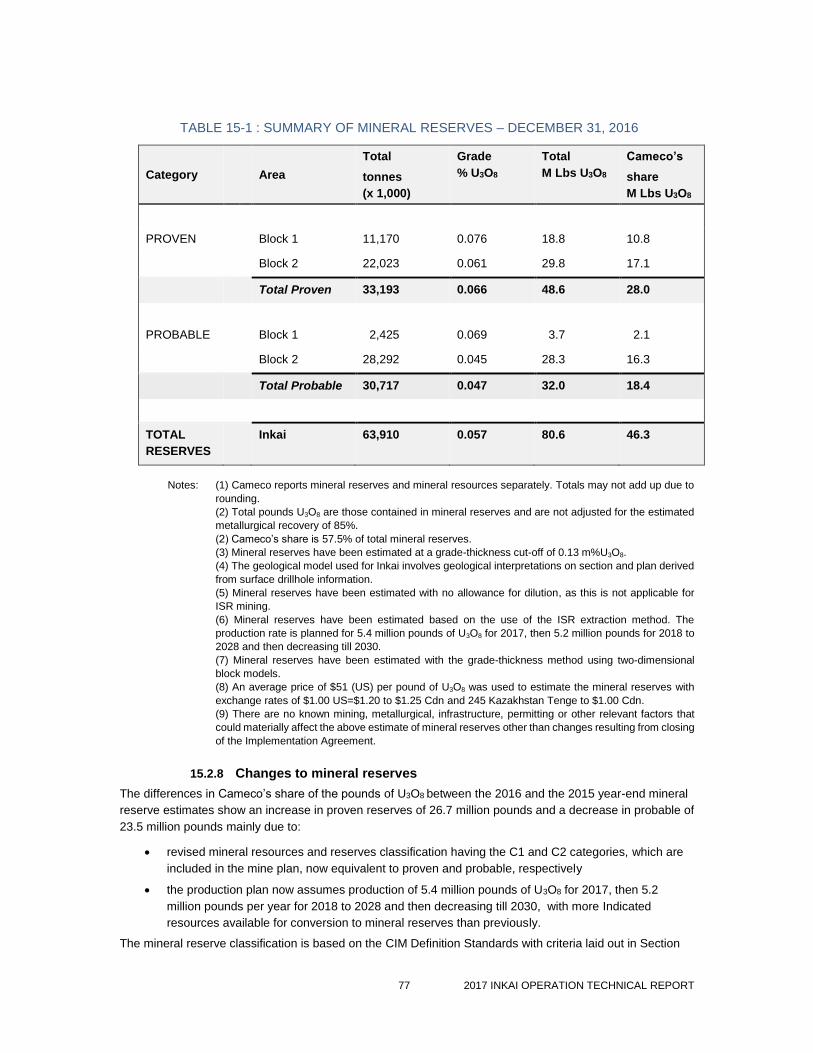
77 2017 INKAI OPERATION TECHNICAL REPORT
TABLE 15-1 : SUMMARY OF MINERAL RESERVES – DECEMBER 31, 2016
Category
Area
Total
tonnes
(x 1,000)
Grade
% U3O8
Total
M Lbs U3O8
Cameco’s
share
M Lbs U3O8
PROVEN Block 1 11,170 0.076 18.8 10.8
Block 2 22,023 0.061 29.8 17.1
Total Proven 33,193 0.066 48.6 28.0
PROBABLE
Block 1
2,425
0.069
3.7
2.1
Block 2 28,292 0.045 28.3 16.3
Total Probable 30,717 0.047 32.0 18.4
TOTAL
RESERVES
Inkai 63,910 0.057 80.6 46.3
Notes: (1) Cameco reports mineral reserves and mineral resources separately. Totals may not add up due to
rounding.
(2) Total pounds U3O8 are those contained in mineral reserves and are not adjusted for the estimated
metallurgical recovery of 85%.
(2) Cameco’s share is 57.5% of total mineral reserves.
(3) Mineral reserves have been estimated at a grade-thickness cut-off of 0.13 m%U3O8.
(4) The geological model used for Inkai involves geological interpretations on section and plan derived
from surface drillhole information.
(5) Mineral reserves have been estimated with no allowance for dilution, as this is not applicable for
ISR mining.
(6) Mineral reserves have been estimated based on the use of the ISR extraction method. The
production rate is planned for 5.4 million pounds of U3O8 for 2017, then 5.2 million pounds for 2018 to
2028 and then decreasing till 2030.
(7) Mineral reserves have been estimated with the grade-thickness method using two-dimensional
block models.
(8) An average price of $51 (US) per pound of U3O8 was used to estimate the mineral reserves with
exchange rates of $1.00 US=$1.20 to $1.25 Cdn and 245 Kazakhstan Tenge to $1.00 Cdn.
(9) There are no known mining, metallurgical, infrastructure, permitting or other relevant factors that
could materially affect the above estimate of mineral reserves other than changes resulting from closing
of the Implementation Agreement.
15.2.8 Changes to mineral reserves
The differences in Cameco’s share of the pounds of U3O8 between the 2016 and the 2015 year-end mineral
reserve estimates show an increase in proven reserves of 26.7 million pounds and a decrease in probable of
23.5 million pounds mainly due to:
revised mineral resources and reserves classification having the C1 and C2 categories, which are
included in the mine plan, now equivalent to proven and probable, respectively
the production plan now assumes production of 5.4 million pounds of U3O8 for 2017, then 5.2
million pounds per year for 2018 to 2028 and then decreasing till 2030, with more Indicated
resources available for conversion to mineral reserves than previously.
The mineral reserve classification is based on the CIM Definition Standards with criteria laid out in Section
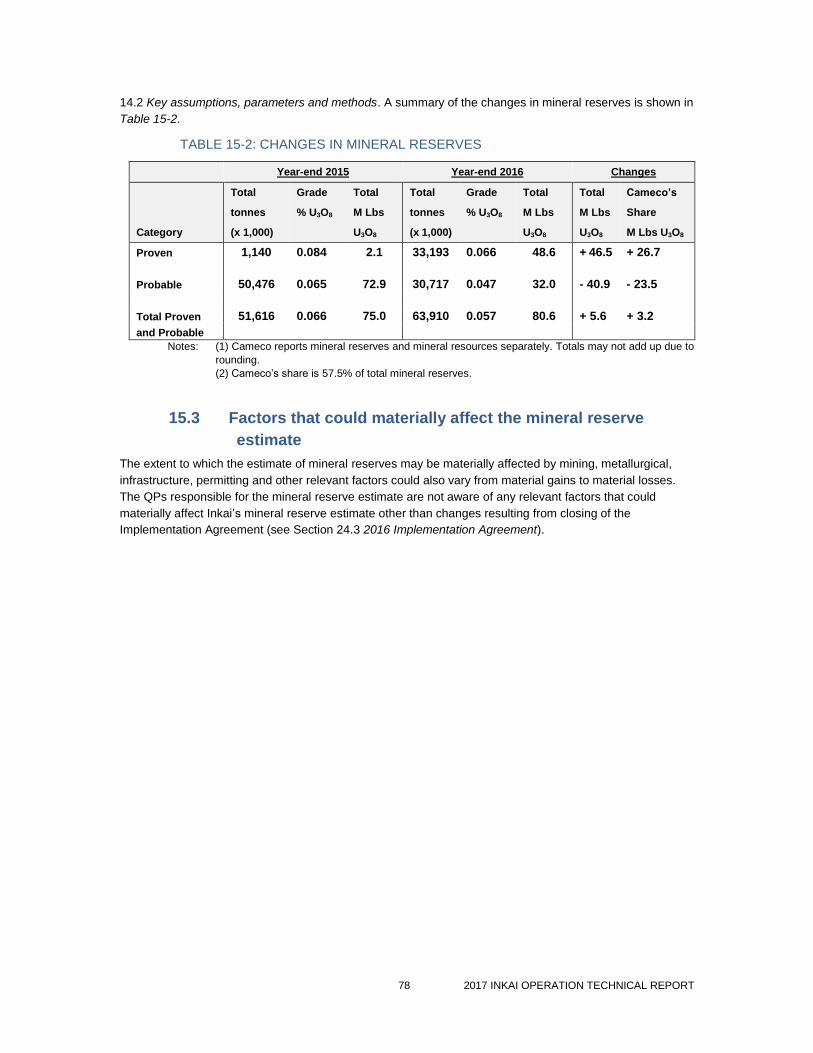
78 2017 INKAI OPERATION TECHNICAL REPORT
14.2 Key assumptions, parameters and methods. A summary of the changes in mineral reserves is shown in
Table 15-2.
TABLE 15-2: CHANGES IN MINERAL RESERVES
Year-end 2015 Year-end 2016 Changes
Category
Total
tonnes
(x 1,000)
Grade
% U3O8
Total
M Lbs
U3O8
Total
tonnes
(x 1,000)
Grade
% U3O8
Total
M Lbs
U3O8
Total
M Lbs
U3O8
Cameco’s
Share
M Lbs U3O8
Proven 1,140 0.084 2.1 33,193 0.066 48.6 + 46.5 + 26.7
Probable 50,476 0.065 72.9 30,717 0.047 32.0 - 40.9 - 23.5
Total Proven
and Probable
51,616 0.066 75.0 63,910 0.057 80.6 + 5.6 + 3.2
Notes: (1) Cameco reports mineral reserves and mineral resources separately. Totals may not add up due to
rounding.
(2) Cameco’s share is 57.5% of total mineral reserves.
15.3 Factors that could materially affect the mineral reserve
estimate
The extent to which the estimate of mineral reserves may be materially affected by mining, metallurgical,
infrastructure, permitting and other relevant factors could also vary from material gains to material losses.
The QPs responsible for the mineral reserve estimate are not aware of any relevant factors that could
materially affect Inkai’s mineral reserve estimate other than changes resulting from closing of the
Implementation Agreement (see Section 24.3 2016 Implementation Agreement).
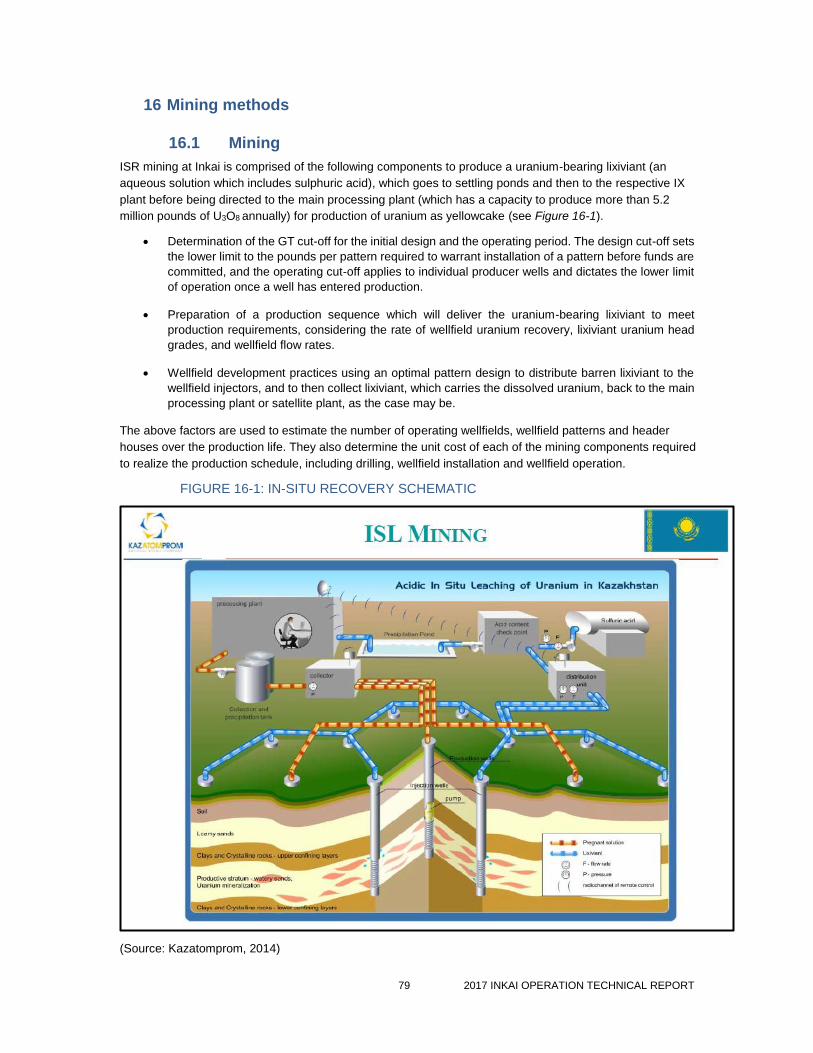
79 2017 INKAI OPERATION TECHNICAL REPORT
16 Mining methods
16.1 Mining
ISR mining at Inkai is comprised of the following components to produce a uranium-bearing lixiviant (an
aqueous solution which includes sulphuric acid), which goes to settling ponds and then to the respective IX
plant before being directed to the main processing plant (which has a capacity to produce more than 5.2
million pounds of U3O8 annually) for production of uranium as yellowcake (see Figure 16-1).
Determination of the GT cut-off for the initial design and the operating period. The design cut-off sets
the lower limit to the pounds per pattern required to warrant installation of a pattern before funds are
committed, and the operating cut-off applies to individual producer wells and dictates the lower limit
of operation once a well has entered production.
Preparation of a production sequence which will deliver the uranium-bearing lixiviant to meet
production requirements, considering the rate of wellfield uranium recovery, lixiviant uranium head
grades, and wellfield flow rates.
Wellfield development practices using an optimal pattern design to distribute barren lixiviant to the
wellfield injectors, and to then collect lixiviant, which carries the dissolved uranium, back to the main
processing plant or satellite plant, as the case may be.
The above factors are used to estimate the number of operating wellfields, wellfield patterns and header
houses over the production life. They also determine the unit cost of each of the mining components required
to realize the production schedule, including drilling, wellfield installation and wellfield operation.
FIGURE 16-1: IN-SITU RECOVERY SCHEMATIC
(Source: Kazatomprom, 2014)
80 2017 INKAI OPERATION TECHNICAL REPORT
16.1.1 Mining method
ISR mining of uranium is defined by the International Atomic Energy Agency as:
“The extraction of ore from a host sandstone by chemical solutions and the recovery of uranium at the
surface. ISR extraction is conducted by injecting a suitable leach solution into the ore zone below the water
table; oxidizing, complexing and mobilizing the uranium; recovering the pregnant solutions through production
wells; and finally, pumping the uranium bearing solution to the surface for further processing.”
Two basic types of leaching systems are used in the world today, acid leach and alkaline leach. In an acid
leach system, diluted sulphuric acid is normally used as the complexing agent and to generate an oxidant
from iron in the deposit. In an alkaline system, bicarbonate, either as a direct addition or as liberated from the
reaction of carbon dioxide and carbonates in the formation, is used as the complexing agent. Oxygen is
added in some cases when there is low carbonate in the formation.
According to IAEA technical document-1239, “Manual of Acid In Situ Leach Uranium Mining Technology,” dated
August 2001, acid leach has the following technical advantages over alkaline leach:
a high degree of uranium recovery from the ore (70 – 90%)
favourable leach kinetics
a comparatively short leaching period of two to five years
limited seepage beyond the wellfield due to the formation of low permeable chemical precipitates
that block flow
addition of oxidants is not necessary (if iron is present)
possibility of self-restoration (or self-attenuation) of the remaining leach solution due to self-cleaning
of the contaminated solutions through the adjacent barren rocks
The manual also lists the disadvantage compared to an alkaline leach:
acid consumption in carbonate-bearing ores can be high, increasing chemical costs and making the
process uneconomical
the risk of pore plugging (blocking the formation with gas or chemical precipitate)
increased concentrations of dissolved solids
use of corrosion resistant equipment, increasing the up-front capital cost
Leaching at Inkai is done at a pH between 1 and 2. The use of IX for recovery of uranium from leach solutions
is based on the existence of uranyl sulphate complexes (Section 17.2 Ion exchange resin adsorption
(loading)).
16.1.2 Production objectives
The annual production specification is 5.2 million pounds of U3O8, derived from a combined flow of 2,840
cubic metres per hour (12,500 gallons per minute). By calculation, this implies an average head grade of
100 parts per million of uranium delivered to the IX columns. Therefore, the rate of installation of new
patterns, coupled with appropriate wellfield management and consideration of depletion of mineral
reserves, must be balanced to provide the requisite IX feed.
While considerable variation exists within the flow capacity of any production well, combined statistics indicate
that patterns yield between eight and 10.5 cubic metres per hour. Assuming the average, approximately 278
patterns will need to be operating at any one time to provide flow to the IX circuits.
Actual production results from Blocks 1 and 2, are shown by the recovery curves for their respective wellfields
on Figures 16-2 and 16-3. The recovery curve graphs show the relationship between the liquid to solid ratio
81 2017 INKAI OPERATION TECHNICAL REPORT
(L/S) to the recovery expressed in percent. L/S is defined as the ratio between the volume of the leaching
solution to the rock mass in the leaching zone of the wellfields. The graphs indicate that, in agreement with
Kazakhstan mining regulations, on average uranium recovery of 85% is achievable.
16.1.3 Wellfield design and development
With any mining method, there is a fundamental unit of production that is the basis for all design and
scheduling. For an open pit operation, this unit would be a blast pattern, while for underground mining, it
would be a stope. For ISR mining, the basic unit is a ‘pattern’ with a production well (also called an extractor)
and its associated injector wells.
The pattern drives mine operation at a number of levels. At the design level, the pattern governs the
economics. A pattern that is economic must cover the cost of well installation, connection of the wells to a
piping system to carry the lixiviant to and from the IX plant, the operating cost of the chemicals needed to leach
the uranium, the operating cost of the pumps and maintenance on the pumps, the down-stream plant costs
(elution, precipitation, filtering and drying), post-processing costs, and administrative overhead. Any pattern
that cannot demonstrate an economic benefit should not be installed unless there is some compelling reason
to do so.
For long-range planning purposes, scheduling assumes that the average flow from past production will apply
the future. While not strictly true, (the flow is a function of screened length and local permeability, among
numerous other factors), the approximation is sufficient for predicting the behaviour of large numbers of
patterns.
There are a number of approaches to ISR mining and, as with any mining technique, there is a substantial
degree of customization applied, depending on the local conditions. Factors affecting the design of the pattern
are numerous, including:
permeability of the host sands
depth of the host sands
cost of drilling
thickness of mineralized unit
surface topography
target wellfield uranium recovery.
Where there are no historical operations to use as a baseline, extensive hydrological modeling may be
required. This is not the case with Inkai, as there has been significant experience since at least 1988 with
the original test mine on Block 1 and commercial production starting in 2009.
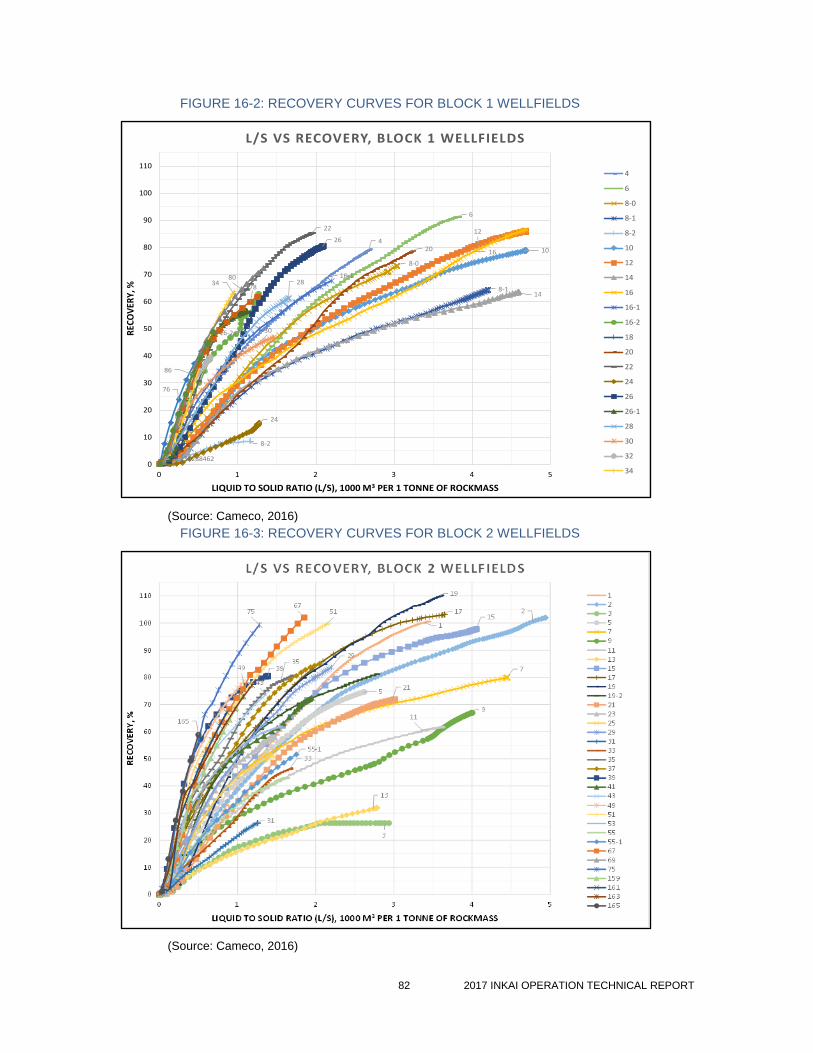
82 2017 INKAI OPERATION TECHNICAL REPORT
FIGURE 16-2: RECOVERY CURVES FOR BLOCK 1 WELLFIELDS
(Source: Cameco, 2016)
FIGURE 16-3: RECOVERY CURVES FOR BLOCK 2 WELLFIELDS
(Source: Cameco, 2016)
4
6
8-0
8-1
8-2
10
12
14
16
2.130288462
16-1
16-2
20
22
24
26
28
30
34
76
78
80
86
0
10
20
30
40
50
60
70
80
90
100
110
0 1 2 3 4 5
REC
OV
ERY,
%
LIQUID TO SOLID RATIO (L/S), 1000 M3 PER 1 TONNE OF ROCKMASS
L/S VS RECOVERY, BLOCK 1 WELLFIELDS
4
6
8-0
8-1
8-2
10
12
14
16
16-1
16-2
18
20
22
24
26
26-1
28
30
32
34
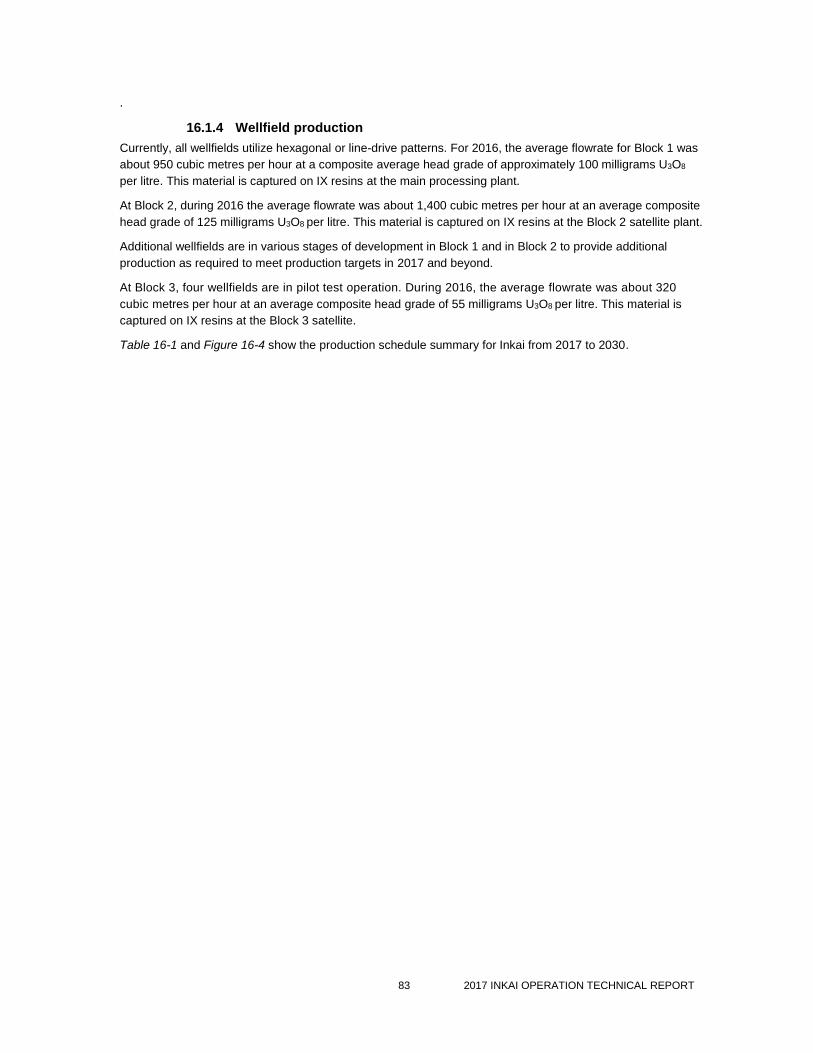
83 2017 INKAI OPERATION TECHNICAL REPORT
.
16.1.4 Wellfield production
Currently, all wellfields utilize hexagonal or line-drive patterns. For 2016, the average flowrate for Block 1 was
about 950 cubic metres per hour at a composite average head grade of approximately 100 milligrams U3O8
per litre. This material is captured on IX resins at the main processing plant.
At Block 2, during 2016 the average flowrate was about 1,400 cubic metres per hour at an average composite
head grade of 125 milligrams U3O8 per litre. This material is captured on IX resins at the Block 2 satellite plant.
Additional wellfields are in various stages of development in Block 1 and in Block 2 to provide additional
production as required to meet production targets in 2017 and beyond.
At Block 3, four wellfields are in pilot test operation. During 2016, the average flowrate was about 320
cubic metres per hour at an average composite head grade of 55 milligrams U3O8 per litre. This material is
captured on IX resins at the Block 3 satellite.
Table 16-1 and Figure 16-4 show the production schedule summary for Inkai from 2017 to 2030.
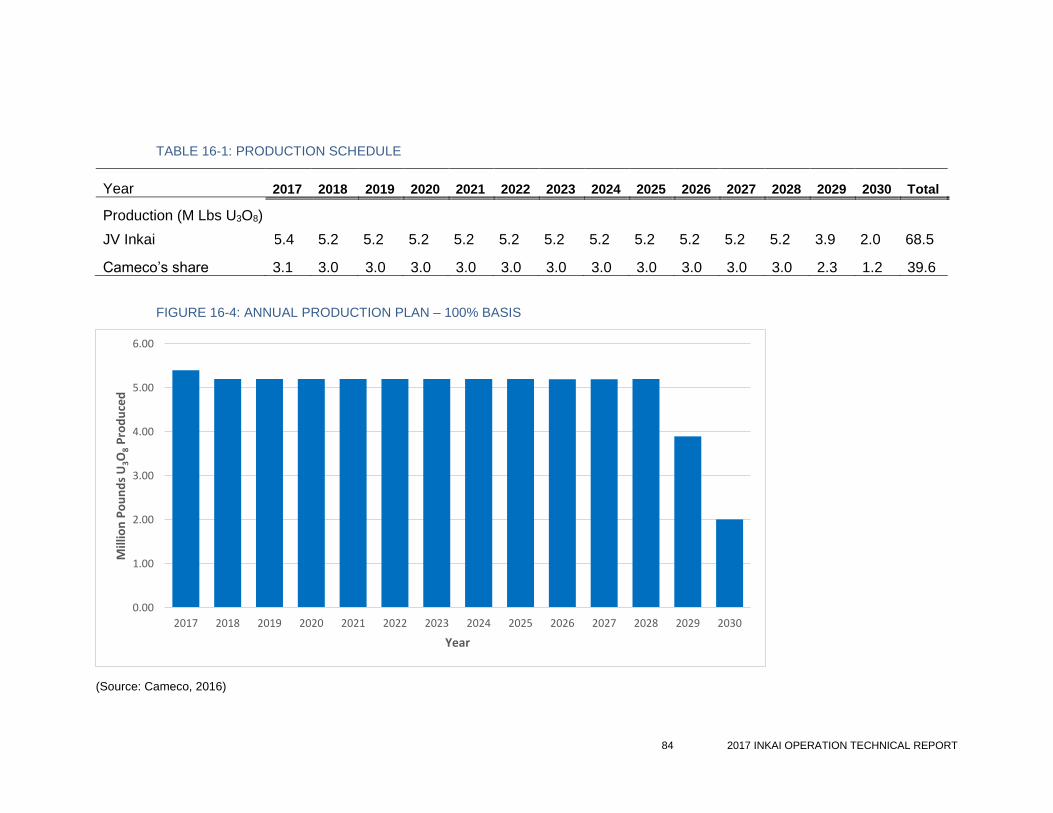
84 2017 INKAI OPERATION TECHNICAL REPORT
TABLE 16-1: PRODUCTION SCHEDULE
Year 2017 2018 2019 2020 2021 2022 2023 2024 2025 2026 2027 2028 2029 2030 Total
Production (M Lbs U3O8)
JV Inkai
5.4
5.2
5.2
5.2
5.2
5.2
5.2
5.2
5.2
5.2
5.2
5.2
3.9
2.0
68.5
Cameco’s share 3.1 3.0 3.0 3.0 3.0 3.0 3.0 3.0 3.0 3.0 3.0 3.0 2.3 1.2 39.6
FIGURE 16-4: ANNUAL PRODUCTION PLAN – 100% BASIS
(Source: Cameco, 2016)
0.00
1.00
2.00
3.00
4.00
5.00
6.00
2017 2018 2019 2020 2021 2022 2023 2024 2025 2026 2027 2028 2029 2030
Mill
ion
Po
un
ds
U3O
8P
rod
uce
d
Year
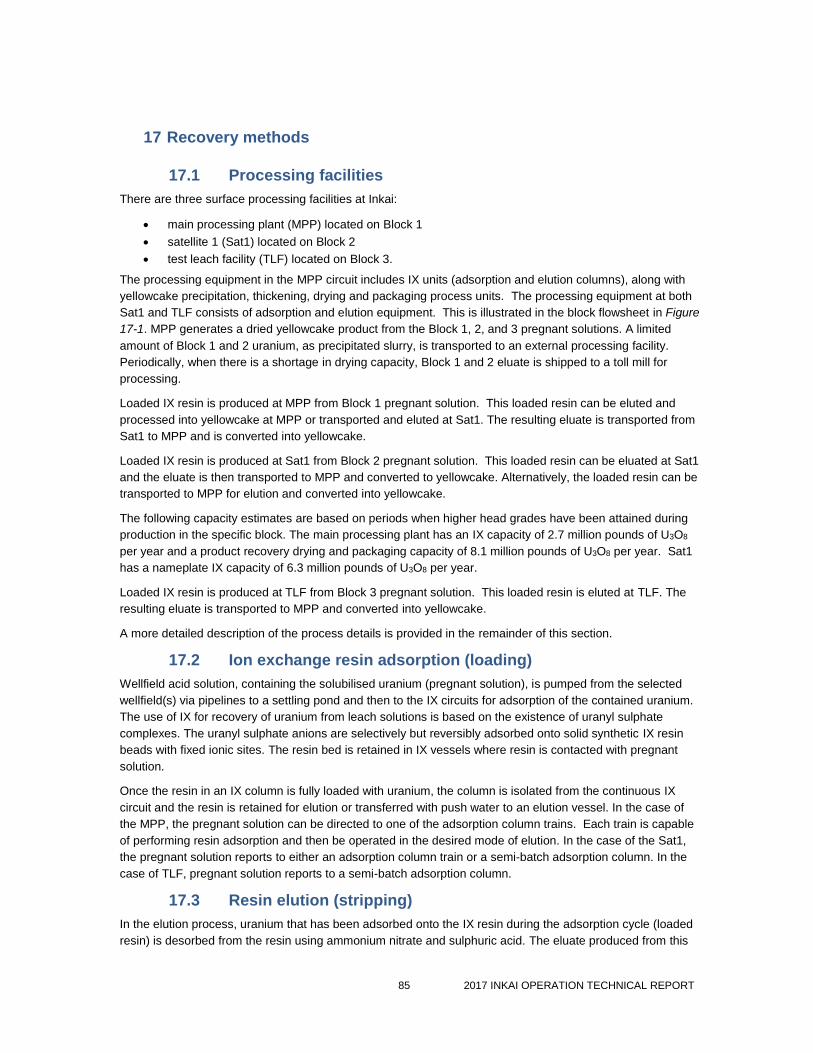
85 2017 INKAI OPERATION TECHNICAL REPORT
17 Recovery methods
17.1 Processing facilities
There are three surface processing facilities at Inkai:
main processing plant (MPP) located on Block 1
satellite 1 (Sat1) located on Block 2
test leach facility (TLF) located on Block 3.
The processing equipment in the MPP circuit includes IX units (adsorption and elution columns), along with
yellowcake precipitation, thickening, drying and packaging process units. The processing equipment at both
Sat1 and TLF consists of adsorption and elution equipment. This is illustrated in the block flowsheet in Figure
17-1. MPP generates a dried yellowcake product from the Block 1, 2, and 3 pregnant solutions. A limited
amount of Block 1 and 2 uranium, as precipitated slurry, is transported to an external processing facility.
Periodically, when there is a shortage in drying capacity, Block 1 and 2 eluate is shipped to a toll mill for
processing.
Loaded IX resin is produced at MPP from Block 1 pregnant solution. This loaded resin can be eluted and
processed into yellowcake at MPP or transported and eluted at Sat1. The resulting eluate is transported from
Sat1 to MPP and is converted into yellowcake.
Loaded IX resin is produced at Sat1 from Block 2 pregnant solution. This loaded resin can be eluated at Sat1
and the eluate is then transported to MPP and converted to yellowcake. Alternatively, the loaded resin can be
transported to MPP for elution and converted into yellowcake.
The following capacity estimates are based on periods when higher head grades have been attained during
production in the specific block. The main processing plant has an IX capacity of 2.7 million pounds of U3O8
per year and a product recovery drying and packaging capacity of 8.1 million pounds of U3O8 per year. Sat1
has a nameplate IX capacity of 6.3 million pounds of U3O8 per year.
Loaded IX resin is produced at TLF from Block 3 pregnant solution. This loaded resin is eluted at TLF. The
resulting eluate is transported to MPP and converted into yellowcake.
A more detailed description of the process details is provided in the remainder of this section.
17.2 Ion exchange resin adsorption (loading)
Wellfield acid solution, containing the solubilised uranium (pregnant solution), is pumped from the selected
wellfield(s) via pipelines to a settling pond and then to the IX circuits for adsorption of the contained uranium.
The use of IX for recovery of uranium from leach solutions is based on the existence of uranyl sulphate
complexes. The uranyl sulphate anions are selectively but reversibly adsorbed onto solid synthetic IX resin
beads with fixed ionic sites. The resin bed is retained in IX vessels where resin is contacted with pregnant
solution.
Once the resin in an IX column is fully loaded with uranium, the column is isolated from the continuous IX
circuit and the resin is retained for elution or transferred with push water to an elution vessel. In the case of
the MPP, the pregnant solution can be directed to one of the adsorption column trains. Each train is capable
of performing resin adsorption and then be operated in the desired mode of elution. In the case of the Sat1,
the pregnant solution reports to either an adsorption column train or a semi-batch adsorption column. In the
case of TLF, pregnant solution reports to a semi-batch adsorption column.
17.3 Resin elution (stripping)
In the elution process, uranium that has been adsorbed onto the IX resin during the adsorption cycle (loaded
resin) is desorbed from the resin using ammonium nitrate and sulphuric acid. The eluate produced from this
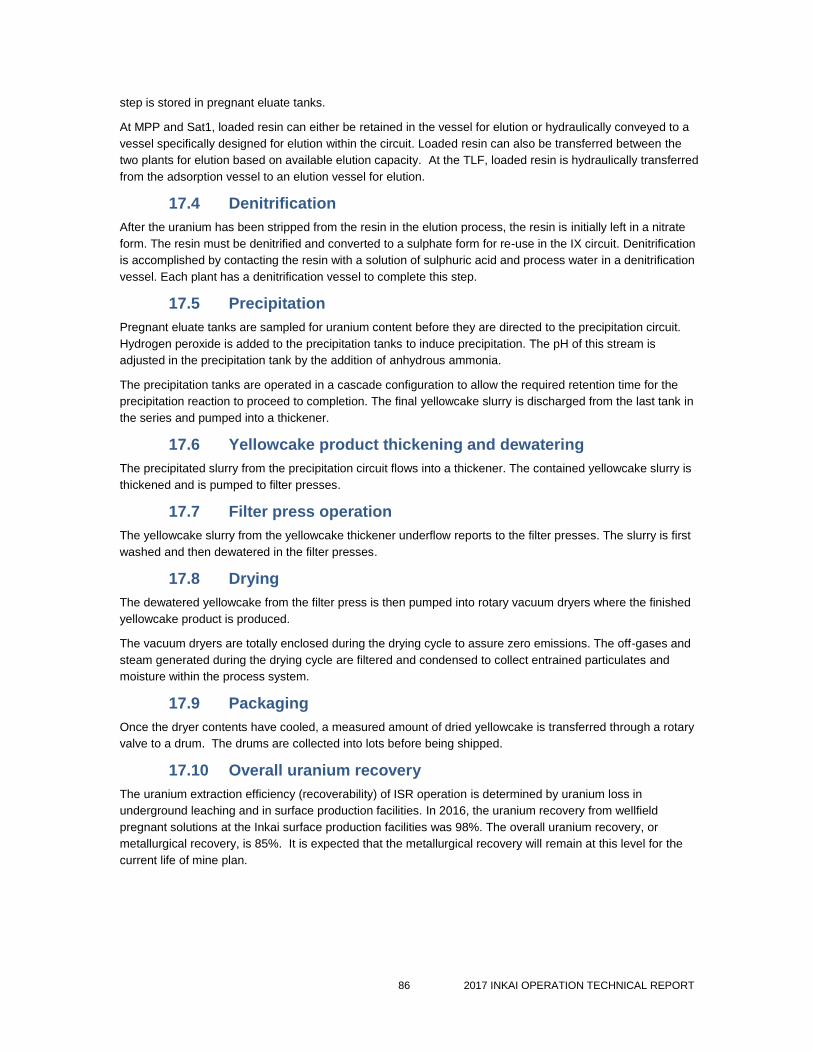
86 2017 INKAI OPERATION TECHNICAL REPORT
step is stored in pregnant eluate tanks.
At MPP and Sat1, loaded resin can either be retained in the vessel for elution or hydraulically conveyed to a
vessel specifically designed for elution within the circuit. Loaded resin can also be transferred between the
two plants for elution based on available elution capacity. At the TLF, loaded resin is hydraulically transferred
from the adsorption vessel to an elution vessel for elution.
17.4 Denitrification
After the uranium has been stripped from the resin in the elution process, the resin is initially left in a nitrate
form. The resin must be denitrified and converted to a sulphate form for re-use in the IX circuit. Denitrification
is accomplished by contacting the resin with a solution of sulphuric acid and process water in a denitrification
vessel. Each plant has a denitrification vessel to complete this step.
17.5 Precipitation
Pregnant eluate tanks are sampled for uranium content before they are directed to the precipitation circuit.
Hydrogen peroxide is added to the precipitation tanks to induce precipitation. The pH of this stream is
adjusted in the precipitation tank by the addition of anhydrous ammonia.
The precipitation tanks are operated in a cascade configuration to allow the required retention time for the
precipitation reaction to proceed to completion. The final yellowcake slurry is discharged from the last tank in
the series and pumped into a thickener.
17.6 Yellowcake product thickening and dewatering
The precipitated slurry from the precipitation circuit flows into a thickener. The contained yellowcake slurry is
thickened and is pumped to filter presses.
17.7 Filter press operation
The yellowcake slurry from the yellowcake thickener underflow reports to the filter presses. The slurry is first
washed and then dewatered in the filter presses.
17.8 Drying
The dewatered yellowcake from the filter press is then pumped into rotary vacuum dryers where the finished
yellowcake product is produced.
The vacuum dryers are totally enclosed during the drying cycle to assure zero emissions. The off-gases and
steam generated during the drying cycle are filtered and condensed to collect entrained particulates and
moisture within the process system.
17.9 Packaging
Once the dryer contents have cooled, a measured amount of dried yellowcake is transferred through a rotary
valve to a drum. The drums are collected into lots before being shipped.
17.10 Overall uranium recovery
The uranium extraction efficiency (recoverability) of ISR operation is determined by uranium loss in
underground leaching and in surface production facilities. In 2016, the uranium recovery from wellfield
pregnant solutions at the Inkai surface production facilities was 98%. The overall uranium recovery, or
metallurgical recovery, is 85%. It is expected that the metallurgical recovery will remain at this level for the
current life of mine plan.
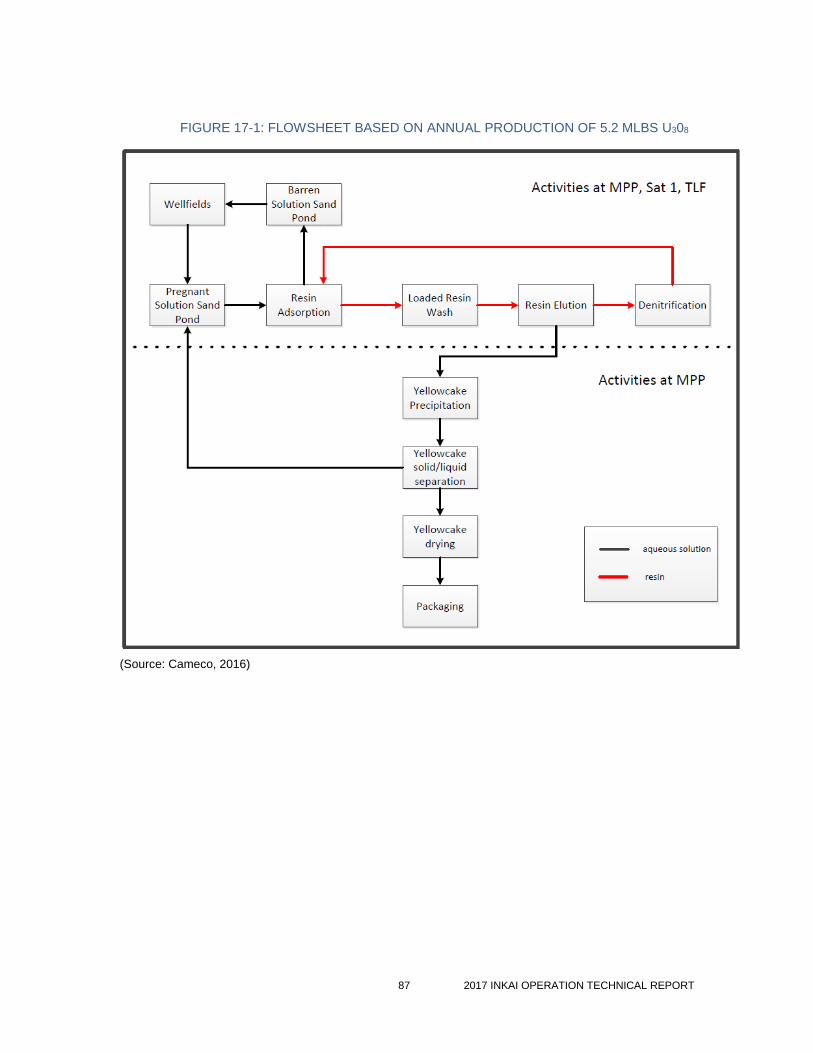
87 2017 INKAI OPERATION TECHNICAL REPORT
FIGURE 17-1: FLOWSHEET BASED ON ANNUAL PRODUCTION OF 5.2 MLBS U308
(Source: Cameco, 2016)
88 2017 INKAI OPERATION TECHNICAL REPORT
18 Project infrastructure
Inkai is a developed producing property with sufficient surface rights, site facilities and infrastructure to meet
its current and future mining operation needs for the current mineral reserves. A site plan of the existing
infrastructure general arrangement is shown in Figure 18-1.
JV INKAI FACILITIES IN TAIKONUR
camp for 429 employees, with catering and leisure facilities
perimeter fence for security
space for recreation activities
BLOCK 1
main processing plant - MPP
administrative office, engineering and construction offices, shops and garage
holding ponds and reagent storage tanks
waste disposal enclosures for low-level radioactive waste and domestic waste
laboratory and emergency response building (staffed at all times by fire services personnel)
food services facility
roads and power lines
wellfield pipelines and header houses
BLOCK 2
satellite processing plant – Sat1
office and shops
holding ponds and reagent storage tanks
food services facility
roads and power lines
wellfield pipelines and header houses
BLOCK 3
test leach facility - TLF
office and shops
holding ponds and reagent storage tanks
food services facility
roads and power lines
wellfield pipelines and header houses
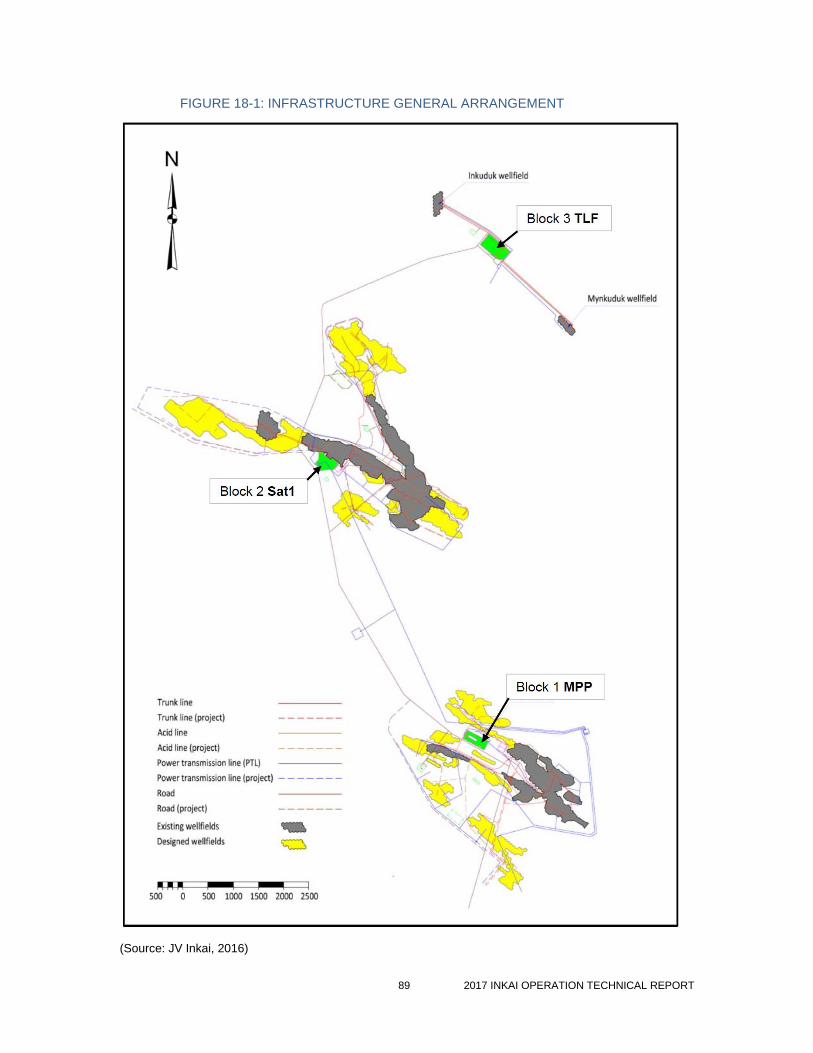
89 2017 INKAI OPERATION TECHNICAL REPORT
FIGURE 18-1: INFRASTRUCTURE GENERAL ARRANGEMENT
(Source: JV Inkai, 2016)
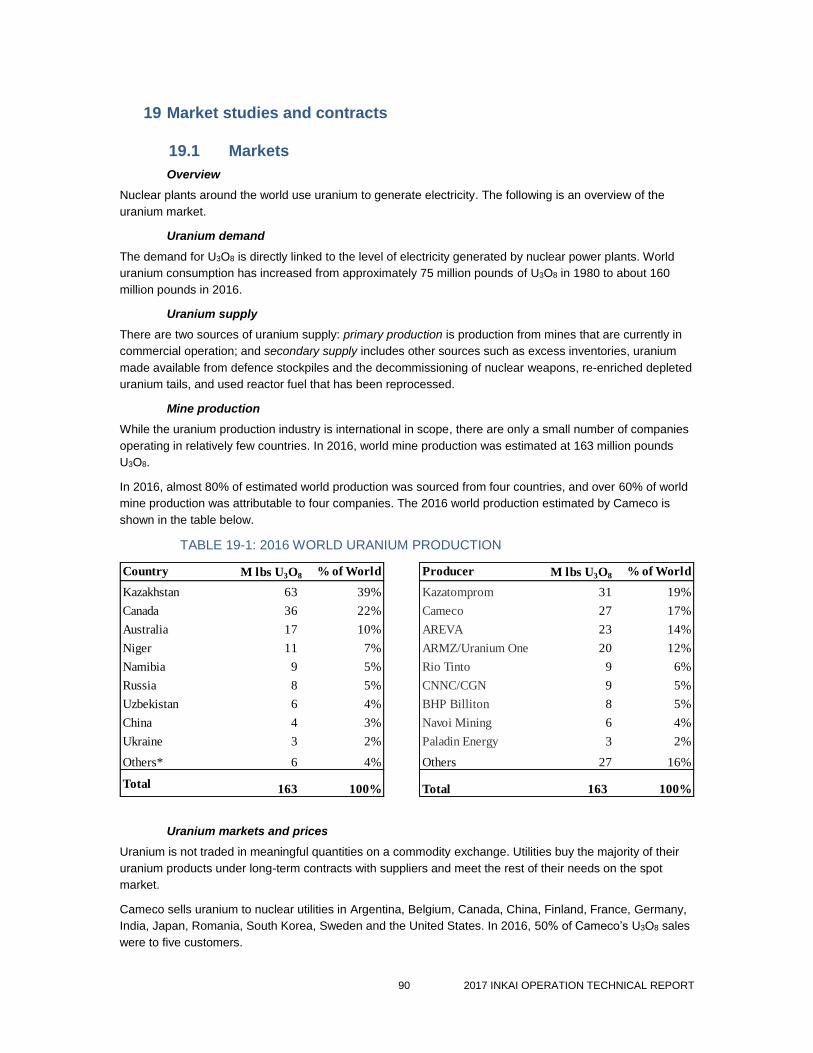
90 2017 INKAI OPERATION TECHNICAL REPORT
19 Market studies and contracts
19.1 Markets
Overview
Nuclear plants around the world use uranium to generate electricity. The following is an overview of the
uranium market.
Uranium demand
The demand for U3O8 is directly linked to the level of electricity generated by nuclear power plants. World
uranium consumption has increased from approximately 75 million pounds of U3O8 in 1980 to about 160
million pounds in 2016.
Uranium supply
There are two sources of uranium supply: primary production is production from mines that are currently in
commercial operation; and secondary supply includes other sources such as excess inventories, uranium
made available from defence stockpiles and the decommissioning of nuclear weapons, re-enriched depleted
uranium tails, and used reactor fuel that has been reprocessed.
Mine production
While the uranium production industry is international in scope, there are only a small number of companies
operating in relatively few countries. In 2016, world mine production was estimated at 163 million pounds
U3O8.
In 2016, almost 80% of estimated world production was sourced from four countries, and over 60% of world
mine production was attributable to four companies. The 2016 world production estimated by Cameco is
shown in the table below.
TABLE 19-1: 2016 WORLD URANIUM PRODUCTION
Uranium markets and prices
Uranium is not traded in meaningful quantities on a commodity exchange. Utilities buy the majority of their
uranium products under long-term contracts with suppliers and meet the rest of their needs on the spot
market.
Cameco sells uranium to nuclear utilities in Argentina, Belgium, Canada, China, Finland, France, Germany,
India, Japan, Romania, South Korea, Sweden and the United States. In 2016, 50% of Cameco’s U3O8 sales
were to five customers.
Country M lbs U3O8 % of World Producer M lbs U3O8 % of World
Kazakhstan 63 39% Kazatomprom 31 19%
Canada 36 22% Cameco 27 17%
Australia 17 10% AREVA 23 14%
Niger 11 7% ARMZ/Uranium One 20 12%
Namibia 9 5% Rio Tinto 9 6%
Russia 8 5% CNNC/CGN 9 5%
Uzbekistan 6 4% BHP Billiton 8 5%
China 4 3% Navoi Mining 6 4%
Ukraine 3 2% Paladin Energy 3 2%
Others* 6 4% Others 27 16%
Total 163 100% Total 163 100%
91 2017 INKAI OPERATION TECHNICAL REPORT
Cameco currently has commitments to supply approximately 150 million pounds of U3O8 under long-term
contracts with 40 customers worldwide. Cameco’s five largest customers account for 52% of future
commitments, and 36% of Cameco’s committed sales volume is attributed to purchasers in the Americas
(United States, Canada and Latin America), 44% in Asia and 20% in Europe.
Uranium spot market
The industry average spot price (TradeTech and UxC) on December 31, 2016 was $20.25 (US) per pound of
U3O8, down 41% from $34.23 (US) per pound of U3O8 at the end of 2015.
Long-term uranium market
The industry average long-term price (TradeTech and UxC) on December 31, 2016 was $30.00 (US) per
pound of U3O8, down 32% from $44.00 (US) per pound of U3O8 on December 31, 2015.
Cameco Market Studies and Analyses
Cameco prepares a uranium supply and demand forecast which reflects its view of supply from all known
sources as well as demand from all of the existing and planned reactors in the world. Cameco maintains
detailed models tracking supplies by source – production as well as secondary supplies – and demand by
reactor. In the preparation of this forecast, Cameco reviews detailed supply and demand models published by
industry, such as the World Nuclear Association, tracks public announcements about supplies and reactors,
then applies its own expertise and develops a forecast.
The qualified persons for Sections 14 Mineral resource estimates and 15 Mineral reserve estimates have
reviewed the studies and analyses underlying Cameco’s uranium supply and demand forecast and confirm
that the results of these studies and analyses support the assumptions used for the portions of the technical
report such qualified persons are responsible for.
19.2 Uranium sales contracts
There are annual uranium sales contracts entered into between JV Inkai and a Cameco subsidiary to
purchase Cameco’s share of Inkai production for each year, as well as similar contracts between JV Inkai and
Kazatomprom. JV Inkai currently has no other forward-sales commitments for its uranium production.
In accordance with the Kazakhstan government’s resolution on uranium concentrate pricing regulations
(effective February 3, 2011), product is currently purchased from JV Inkai at a price equal to the uranium spot
price, less a 5% discount (maximum allowable).
19.3 Material contracts
There are no contracts material to Cameco required for the development and operation of Inkai other than the
Resource Use Contract. Please see Section 4.4 Resource Use Contract for a description of this contract.
92 2017 INKAI OPERATION TECHNICAL REPORT
20 Environmental studies, permitting and social or community impact
20.1 Environmental considerations
20.1.1 Legislation
In Kazakhstan, government agencies are responsible for the administration of, among other things, uranium
production, transportation and storage. The primary regulatory authorities that issue
permits/licences/approvals are the Ministry of Investments and Development (Industrial Development and
Industrial Safety Committee) and the Ministry of Energy (Committee of Environmental Regulation and
Control).
At a regional level, both ministries provide enforcement through local representative authorities. In particular,
the Ministry of Energy’s local representative authorities administer approvals of environmental protection
programs, costs for environmental protection and enhancement, and approval for waste management
programs. Local executive authorities supervise and control development and implementation of
environmental protection and subsoil use programs, and are responsible for granting approval for the
construction of facilities.
The Ecological Code is the principal legislation dealing with the protection of the environment. Although it
does not specifically refer to uranium, there are general provisions regulating production waste which apply to
uranium. More specific provisions are provided in other applicable Kazakhstan regulations and state
standards.
The environmental management system at JV Inkai is designed to ensure compliance with regulatory
requirements, preventing pollution in accordance with ISR operation best practice, and continual improvement
of performance. The environmental management system and the occupational health and safety management
systems have been certified to ISO 14001 and OHSAS 18001 since 2006 (certificates renewed in 2015).
The principal legislation governing subsoil exploration and mining activity in Kazakhstan is the Subsoil Law. In
general, the Subsoil Law identifies the subsoil and mineral resources in the underground state as property of
the Republic of Kazakhstan, and resources brought to the surface as property of the subsoil user, unless
otherwise provided by contract or this law. See Section 4.5 Subsoil Law for more information on the Subsoil
Law and Section 4.6 Draft Subsoil Code for information on the Draft Subsoil Code.
20.1.2 Permitting
JV Inkai is required to hold certain permits and licences to operate the mine, as it is a nuclear facility. With
regard to environmental protection requirements, JV Inkai has applied for and received:
a permit for environmental emissions and discharges for the operation valid till December 2022
water use permits with various expiry dates
JV Inkai currently holds the following additional material licences relating to its mining activities:
“Licence for radioactive substances handling” valid till January 23, 2020
“Licence for operation of mining production and mineral raw material processing” with indefinite term
“Licence for transportation of radioactive substances within the territory of the Republic of
Kazakhstan” valid till January 23, 2020
“Licence for radioactive waste handling” valid till January 23, 2020
In accordance with applicable legislation regulating permits and licences, JV Inkai is required to submit annual
reports to relevant state authorities. In particular, renewal of environmental permits requires the submission of
an annual report on pollution levels to Kazakhstan’s environmental authorities, compliance with the permits’
provisions and the payment of any environmental payment obligations not in the nature of payments in
93 2017 INKAI OPERATION TECHNICAL REPORT
respect of violations.
JV Inkai received a mining licence for Block 1 and an exploration with subsequent mining licence for Blocks 2
and 3 from the Kazakhstan government in April 1999. The Resource Use Contract between JV Inkai and the
Republic of Kazakhstan was signed in 2000. For more information, see Sections 4.2 Exploration and mining
licences, 4.3 Surface tenure, 4.4 Resource Use Contract and 4.5.5 Work programs and project
documentation.
As is typical with any mineral extraction site, construction, operation, and reclamation are subject to an
ongoing process during which permits, licences, and approvals are requested, monitored and reported on,
expire, and are amended or renewed. Provision for these ongoing processes has been included in the cost
estimates in this technical report.
20.1.3 Environmental impact assessment
Under the Ecological Code, an environmental impact assessment (EIA) is a mandatory requirement for
various types of activities which may have direct or indirect impact on the environment and human health. The
Ecological Code does not allow development or implementation of particular business projects (affecting the
environment) without an EIA. The Ecological Code requires that an EIA must be conducted at various stages
of a project.
Specifically, an EIA must be carried out:
prior to implementing any type of industrial or construction project
in respect of feasibility studies for construction, upgrades and reconstruction of buildings, facilities
or other industrial infrastructure
in connection with designs and project documentation for construction of buildings, facilities and
infrastructure,
in connection with the certification of facilities, technologies and materials
in respect of documentation relating to emissions permits and the treatment of wastes.
Every EIA must be reviewed and approved by a state environmental expert evaluation, which is conducted by
the Ministry of Environmental Protection or its territorial departments. Obtaining approvals based on EIAs
constitutes prima facie proof that the scope and details of subsoil use operations have been approved by
environmental, governmental and other authorities.
Prior to commencing subsoil operations under the Resource Use Contract and obtaining emission and water
use permits, JV Inkai had to conduct approved EIAs. The issuance of emission and water use permits by the
relevant authorities confirms that JV Inkai conducted approved EIAs as required.
Kazakhstan environmental legislation requires that a state environmental expert examination precede the
making of any legal, organizational or economic decisions regarding an operation that may potentially impact
public health or the environment. One of the documents the subsoil user must provide in connection with the
state environmental expert examination is an environmental impact statement.
The baseline conditions and potential environmental impacts of the commercial mining facility based on
Republic of Kazakhstan and western U.S. standards were assessed. The baseline fieldwork was performed in
2001 – 2002. The anticipated environment is common to any uranium acid ISR operation and is described in
detail in the EIA and western environmental assessment reports published since 2002. The EIA reports
describe the biological, hydro-geological, hydrologic and other physical environmental baseline prior to the
introduction of exploration and production operations, and assess the potential impacts to environmental
media and the human environment from the proposed operations. The environmental studies completed to
date have not identified any potential impacts to human health or the environment that could not be mitigated
through permit conditions or reclamation bond commitments. Based on the environmental findings of the EIA
studies, the state chose to award two mining licences and the extension of the Block 3 exploration period.
Groundwater flow and plume migration modelling study (Geolink, 2003)
The study presents a critical analysis of hydrogeological data and simulation of contaminant transport. The
94 2017 INKAI OPERATION TECHNICAL REPORT
modelling study predicted groundwater flow and transport within the test area of Block 1. The model was
calibrated with recent and historic piezometric measurements. The model results showed no risk to local and
regional groundwater users from ISR mining of Block 1.
Natural attenuation study on Block 1 (Volkovgeology, 2005)
The objective of this Volkovgeology (2005) study was to assess natural attenuation of ISR solutions within
Block 1, based on the pilot-scale uranium in-situ leaching conducted between 1988 and 1990. To assess and
monitor the natural attenuation, four deep boreholes were drilled to depths up to 519 metres into Permian
rocks to intersect the mineralized zones within the Mynkuduk aquifer.
Core samples were studied in the field and in the laboratory. Water samples were collected and analyzed.
The observed contamination plume was localized within an area of 110 x 80 metres and with a thickness of 32
metres. Laboratory investigations showed attenuation of contaminants (e.g., approximately neutral pH) in the
upper part of ISR profile and partial attenuation in the lower part of the profile. In analogy with other uranium
ISR sites in the region, the study concluded that the majority of contamination caused by ISR test block 1 will
be attenuated in 39 years.
20.1.4 Decommissioning and restoration
Under the Resource Use Contract, JV Inkai must submit a documented plan for decommissioning the property
to the government six months before completion of mining activities. A preliminary decommissioning plan has
been established for the purposes of estimating total decommissioning costs. The decommissioning plan
considers the issues and costs under a “decommission now” scenario. The plan is updated every five years,
or as significant changes take place at the operation which would affect the decommissioning estimates. The
preliminary decommissioning plan was initially completed in January of 2006, and most recently revised in
(2016). On a 100% basis, the estimated decommissioning cost is $10 million (US).
Surface reclamation following the completion of mining will include the removal of all buildings, re-contouring
of all disturbed areas of the mine site, and removal of any contaminated material based on a detail post-
mining gamma radiation survey. Material exceeding baseline conditions will be removed and replaced with
clean material. Contaminated material will be removed to an approved waste facility for permanent disposal.
No active restoration of post-mining groundwater is done in Kazakhstan. Natural attenuation of ion
constituents as a passive form of groundwater restoration is determined to be sufficient.
20.1.5 Known environmental liabilities
JV Inkai’s mining activities must comply with the environmental requirements of Kazakhstan laws and
regulations. In addition, in the Resource Use Contract, JV Inkai has committed to conduct its operations in
accordance with good international mining practices.
The environmental protection legislation in Kazakhstan has evolved rapidly, especially in recent years. As the
subsoil use sector has evolved, there is presently a trend towards greater regulation, heightened enforcement
and increased liability for non-compliance with respect to environmental issues. The most significant
development was the adoption of the Ecological Code in 2007, which replaced the three principal prior laws
on environmental protection. Amendments were made to the code in 2011 that include more stringent
environmental protection regulations, particularly relating to the control of greenhouse gas emissions,
obtaining environmental permits, state monitoring requirements and other similar matters.
Both under the prior and the existing legislative regime, a subsoil user, such as JV Inkai, is obliged to comply
with environmental requirements during all stages of a subsoil use operation. Kazakhstan environmental
legislation requires that a state environmental expert examination precede the making of any legal,
organisational or economic decisions with respect to an operation that could impact the environment and
public health. One of the documents that the subsoil user must provide in connection with the state
environmental expert examination is an EIA.
The Ecological Code requires that the subsoil user obtain environmental permits to conduct its operations. A
permit certifies the holder’s right to discharge emissions into the environment, provided that it introduces the
95 2017 INKAI OPERATION TECHNICAL REPORT
“best available technologies” and complies with specific technical guidelines for emissions as set forth by the
environmental legislation. Government authorities and the courts enforce compliance with these permits and
violations may result in civil, administrative and/or criminal liability, the curtailment or cessation of operations,
orders to pay compensation, orders to remedy the effects of violations and orders to take preventative steps
against possible future violations. In certain situations, the issuing authority may modify, renew, suspend or
revoke the permits. JV Inkai has applied for and received a permit for environmental emissions and
discharges for the operation that is valid until December 31, 2022.
Pursuant to the Water Code, JV Inkai is qualified as a primary water user, and is entitled to extract water
directly from water sources for its own use. JV Inkai has obtained special water use permits, which have
various expiry dates. Water usage under the permits is limited to the purposes defined in the permits.
As an industrial company, JV Inkai is also required to undertake programs to reduce, control or eliminate
various types of pollution and to protect natural resources. The Resource Use Contract specifically requires
the implementation of environmental controls based on an industrial environmental control program developed
by JV Inkai and which is to be approved by the environmental protection authorities. JV Inkai must also
actively monitor specific air emission levels, ambient air quality, nearby surface water quality, groundwater
quality, levels of contaminants in soil and the creation of solid waste. It must also submit annual reports on
pollution levels to Kazakhstan’s environmental, tax and statistics authorities. The authorities conduct tests to
validate JV Inkai’s results.
If JV Inkai’s emissions were to exceed the specified levels, this would trigger additional payment obligations.
Moreover, in the course of, or as a result of, an environmental investigation, regulatory authorities in
Kazakhstan have the power to issue an order reducing or halting production at a facility that has violated
environmental standards.
The Ecological Code and the Resource Use Contract set out requirements with respect to environmental
insurance. Legal entities carrying out environmentally hazardous activities are required to obtain insurance to
cover these activities, in addition to the civil liability insurance which must be held by owners of facilities, the
activities of which may cause harm to third parties. JV Inkai currently maintains both the required
environmental insurance and the civil liability insurance.
JV Inkai is subject to decommissioning obligations which are largely defined by the Resource Use Contract.
JV Inkai has established a separate bank account and has made the required contributions to the account as
security for decommissioning Inkai. Contributions are set as a fraction of gross revenue and are capped at
$500,000 (US). The account has been fully funded by JV Inkai in this amount. On a 100% basis, the
estimated decommissioning cost is $10 million (US).
The Parliament of Kazakhstan ratified the country’s accession to the United Nations Framework Convention
on Climate Changes (Kyoto Protocol) in 2009. The Kyoto Protocol’s objective is to limit or capture emissions
of greenhouse gases such as carbon dioxide and methane. Within the framework of the Kyoto Protocol,
Kazakhstan has enacted a number of legislative instruments aiming to reduce emissions of the greenhouse
gases. In particular, the emission regulations and trading provisions were introduced into the Environmental
Code. However, application of the regulations and the issued quotes was postponed until January 1, 2018
and currently, natural resources users are only required to report emission volumes by April 1 of the year
following the reporting year without purchasing the quotas.
20.2 Social and community factors
JV Inkai operates in the Suzak district of the South Kazakhstan region. The territory of the district is about
41,000 square kilometres and its population is over 50,000. The town of Taikonur, with a population of about
680, is in this district and the Inkai deposit is located near the village. A major part of Kazakhstan’s uranium
reserves are in the district. The district also has deposits of gold, silver, coal and other mineral resources.
Meat and dairy products production is a leading agriculture industry in the district.
In accordance with JV Inkai’s corporate responsibility strategy and to comply with its obligations under the

96 2017 INKAI OPERATION TECHNICAL REPORT
Resource Use Contract, JV Inkai finances projects and provides goods and services to support the district’s
social infrastructure.
Under the Resource Use Contract, JV Inkai is required to finance the training and development of Kazakhstan
personnel. The Resource Use Contract imposes local content requirements on JV Inkai with respect to
employees, goods, works and services. See Section 4.5.7 Local content requirements for more information.
97 2017 INKAI OPERATION TECHNICAL REPORT
21 Capital and operating costs
The cost estimates in this section are on a 100% basis with a currency exchange rate assumption of 245
Kazakhstan Tenge to $1.00 Cdn. All cost projections are stated in constant 2017 Canadian dollars and
assume the throughput from the production schedule outlined in Table 16-1.
21.1 Capital cost estimates
Capital costs for Inkai are estimated to be $296.9 million over the remaining life of the current mineral
reserves. The remaining capital costs, as of January 1, 2017, includes $217.3 million for wellfield
development, $55.5 million for construction and maintenance and $24.1 million for sustaining capital.
It is assumed that wellfield development costs will gradually decline over the last three years, consistent with
the production schedule.
Construction capital is heavily weighted to the first three years due to the major repairs and modernization
planned for facilities at both Block 1 and Block 2. Pending closing of the Implementation Agreement, there are
no other major construction projects anticipated.
Table 21-1 shows the annual capital cost estimate for Inkai from 2017 to 2030.
21.2 Operating cost estimates
Estimated operating expenditures, excluding taxes and royalties, for ISR mining, surface processing, site
administration and corporate overhead for Inkai from 2017 to 2030 are presented in Table 21-2.
Mining costs consist of annual expenditures incurred at Inkai to extract the uranium from the ore zone and
pumping the pregnant solution to the surface for further processing.
Surface processing costs are expenditures incurred to turn the pregnant solution from the wellfields into the
dried yellowcake product. This includes IX (adsorption and elution), precipitation, thickening, drying, and
packaging circuits.
Site administration costs consist of general maintenance, health, safety and environment, camp and catering
costs, along with charges for additional functions performed at the Taikonur office, such as geology and
supply chain management.
Corporate overhead costs consist of the marketing and transportation of the finished product, along with
additional charges due to the administration functions at the Shymkent office, such as the finance and legal
departments.
Operating costs for Inkai are estimated to be $12.71 per pound of U3O8 over the remaining life of the current
mineral reserves. The operating cost projections have incorporated the production sequence and pattern
design of the wellfields along with past production experience to determine the estimated annual
expenditures. The operating costs have decreased from the March 31, 2010 technical report as a result of the
optimization in the consumption of sulphuric acid and other reagents, as well as the devaluation of the
Kazakhstan Tenge.
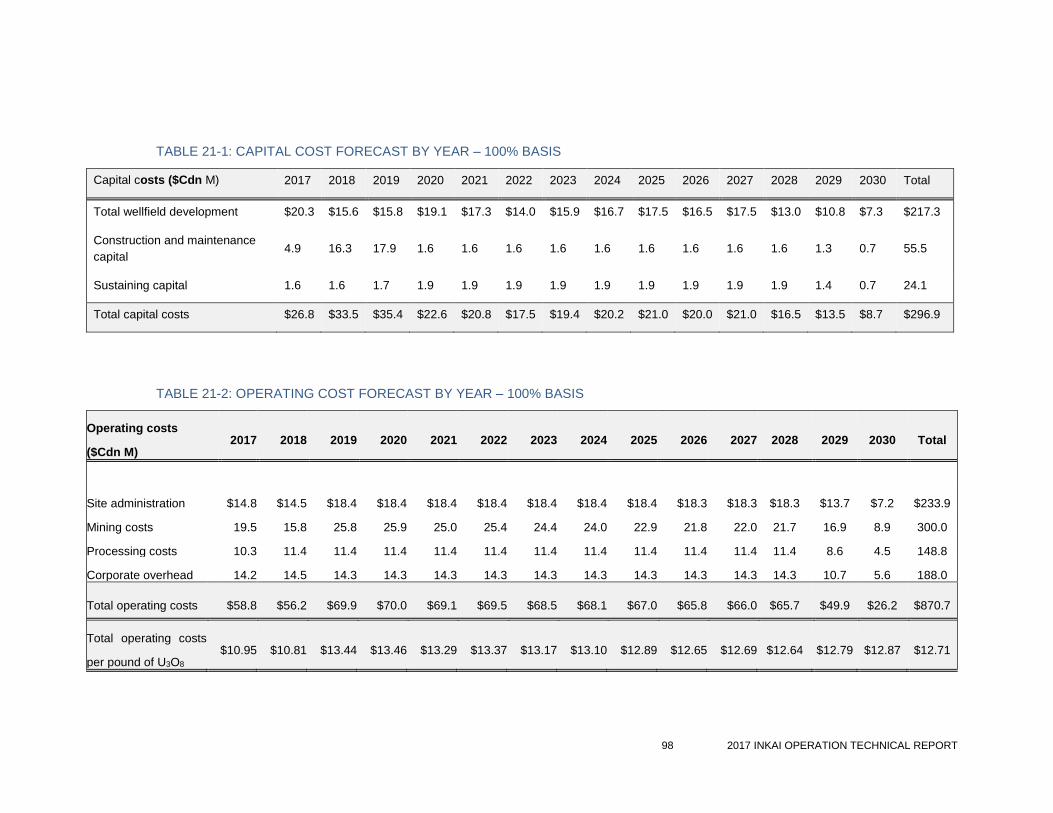
98 2017 INKAI OPERATION TECHNICAL REPORT
TABLE 21-1: CAPITAL COST FORECAST BY YEAR – 100% BASIS
Capital costs ($Cdn M) 2017 2018 2019 2020 2021 2022 2023 2024 2025 2026 2027 2028 2029 2030 Total
Total wellfield development $20.3 $15.6 $15.8 $19.1 $17.3 $14.0 $15.9 $16.7 $17.5 $16.5 $17.5 $13.0 $10.8 $7.3 $217.3
Construction and maintenance
capital 4.9 16.3 17.9 1.6 1.6 1.6 1.6 1.6 1.6 1.6 1.6 1.6 1.3 0.7 55.5
Sustaining capital 1.6 1.6 1.7 1.9 1.9 1.9 1.9 1.9 1.9 1.9 1.9 1.9 1.4 0.7 24.1
Total capital costs $26.8 $33.5 $35.4 $22.6 $20.8 $17.5 $19.4 $20.2 $21.0 $20.0 $21.0 $16.5 $13.5 $8.7 $296.9
TABLE 21-2: OPERATING COST FORECAST BY YEAR – 100% BASIS
Operating costs
($Cdn M) 2017 2018 2019 2020 2021 2022 2023 2024 2025 2026 2027 2028 2029 2030 Total
Site administration $14.8 $14.5 $18.4 $18.4 $18.4 $18.4 $18.4 $18.4 $18.4 $18.3 $18.3 $18.3 $13.7 $7.2 $233.9
Mining costs 19.5 15.8 25.8 25.9 25.0 25.4 24.4 24.0 22.9 21.8 22.0 21.7 16.9 8.9 300.0
Processing costs 10.3 11.4 11.4 11.4 11.4 11.4 11.4 11.4 11.4 11.4 11.4 11.4 8.6 4.5 148.8
Corporate overhead 14.2 14.5 14.3 14.3 14.3 14.3 14.3 14.3 14.3 14.3 14.3 14.3 10.7 5.6 188.0
Total operating costs $58.8 $56.2 $69.9 $70.0 $69.1 $69.5 $68.5 $68.1 $67.0 $65.8 $66.0 $65.7 $49.9 $26.2 $870.7
Total operating costs
per pound of U3O8 $10.95 $10.81 $13.44 $13.46 $13.29 $13.37 $13.17 $13.10 $12.89 $12.65 $12.69 $12.64 $12.79 $12.87 $12.71
99 2017 INKAI OPERATION TECHNICAL REPORT
22 Economic analysis
This technical report does not include the information required under Section 22 (Economic Analysis) of Form
43-101F1 of NI 43-101, as this technical report does not include a material expansion of Inkai’s current
production. Cameco’s economic analysis demonstrates a positive cash flow.
23 Adjacent properties
South Inkai is an ISR mine that began operating in 2009. South Inkai’s land position is contiguous with, and
south of, Inkai. It is owned 100% by the Southern Mining and Chemical Company joint venture and operated
by the Betpak Dala joint venture, both joint ventures in turn owned by Uranium One Inc. (70% interest) and
Kazatomprom (30% interest). The mineralization hosted in the Middle and Lower Inkuduk and in the
Mynkuduk extends from the Inkai property onto the South Inkai property. The source of this information, not
verified by the QP responsible for this section, is from Uranium One’s “Operating and Financial Review –
Quarter Ended March 31, 2016” and their technical report on South Inkai published in 2014.
100 2017 INKAI OPERATION TECHNICAL REPORT
24 Other relevant data and information
24.1 Block 3 appraisal program
Exploration work on Block 3 has identified extensive mineralization hosted by several horizons in the lower
and middle parts of the Upper Cretaceous stratigraphic level and traced along 25 kilometres from Block 2 in
the southwest through to the Mynkuduk deposit in the northeast. This discovery requires further assessment
of its commercial viability. In 2010, JV Inkai filed a notice of the discovery with regulators. JV Inkai is
operating a test mine at Block 3. The exploration period expires July 13, 2018 unless extended.
Approvals
In 2009, Amendment No.2 to the Resource Use Contract was signed, extending the exploration period at
Block 3 to July 13, 2010.
In 2011, Amendment No 3 to the Resource Use Contract was signed, giving JV Inkai government approval to
carry out a five-year assessment program that included delineation drilling, uranium resource estimation,
construction and operation of a TLF and completion of a feasibility study.
In 2012, JV Inkai received regulatory approval for the detailed Block 3 delineation drilling and test leach work
programs.
In 2014, JV Inkai applied for a three-year extension to complete the Block 3 evaluation.
In November 2016, Amendment No. 5 to the Resource Use Contract was signed, extending the exploration
period at Block 3 until July 13, 2018.
Appraisal Work
Extensive exploration and delineation work was completed at Block 3 by JV Inkai from 2006 to 2016. For
more information on drilling at Block 3, see Section 10.2.1 Timeline for exploration-delineation drilling
programs. In 2011, JV Inkai began infrastructure development and completed engineering for a TLF for the
block 3 assessment program. In addition, a preliminary estimate of the mineralization on the southwestern
corner of Block 3 was prepared, which was reviewed and approved by the SRC.
In 2012, JV Inkai started drilling at test wellfields and started construction of the TLF.
In 2013, JV Inkai continued construction of the TLF and test wellfields, and started work on an appraisal of
mineral potential according to Republic of Kazakhstan standards.
In 2014, JV Inkai continued construction of the TLF and test wellfields, and advanced work on a preliminary
appraisal of the mineral potential according to Republic of Kazakhstan standards. An interim report on
exploration results and estimate of the mineralization at Block 3 was conditionally approved by the SRC.
In 2015, JV Inkai completed construction of the TLF and began pilot production from test wellfields, as well as
advanced work on a preliminary appraisal of the mineral potential of Block 3. At December 31, 2016, total
production from test mining at Block 3 was 865,000 pounds of U3O8.
In February 2017, JV Inkai submitted an updated estimate of in-situ uranium mineralization and a TEO report,
similar to a preliminary feasibility study, to the SRC for their approval. During 2017, JV Inkai plans to continue
with pilot production from the TLF.
See Section 10 Drilling for more information on drilling at Block 3.
24.2 Cameco funding of Block 3 appraisal program
A Cameco subsidiary advanced funds for JV Inkai’s exploration and evaluation work on Block 3 and, as at
December 31, 2016, the principal and interest amounted to $168 million (US). Under the loan agreement, JV
Inkai is to repay the Cameco subsidiary from the sale of its production. On January 20, 2017, a payment of
101 2017 INKAI OPERATION TECHNICAL REPORT
$30 million (US) was received.
24.3 2016 Implementation Agreement
In 2012, Cameco entered into a memorandum of agreement (2012 MOA) with Kazatomprom setting out a
framework to:
increase Inkai’s annual production from Blocks 1 and 2 to 10.4 million pounds (Cameco’s share 5.2
million pounds) and sustain it at that level
extend the term of JV Inkai’s resource use contract through 2045.
Cameco, Kazatomprom and JV Inkai signed an agreement (Implementation Agreement) dated May 27, 2016,
to restructure and enhance Inkai. Subject to closing, the Implementation Agreement replaces the 2012 MOA
and provides as follows:
JV Inkai will have the right to produce 4,000 tonnes of uranium (tU) (10.4 million pounds of U3O8) per
year (Cameco’s share 4.2 million pounds), an increase from the current 5.2 million pounds of U3O8
(Cameco’s share 3.0 million pounds).
JV Inkai will have the right to produce from blocks 1, 2 and 3 until 2045 (currently, the licence terms
are to 2024 for Block 1 and to 2030 for Blocks 2 and 3)
subject to further adjustments tied to the construction of a refinery as described below, Cameco’s
ownership interest in JV Inkai will be adjusted to 40%, and Kazatomprom’s ownership interest in JV
Inkai will be adjusted to 60%. However, the Implementation Agreement ensures that during
production ramp up, Cameco’s share of annual production remains at 57.5% on the first 5.2 million
pounds. As annual production increases above 5.2 million pounds, Cameco will be entitled to 22.5%
of any incremental production, to the maximum annual share of 4.2 million pounds of U3O8. Once the
ramp up to 10.4 million pounds of U3O8 annually is complete, Cameco’s interest in production will be
adjusted to match its ownership interest at 40%.
a governance framework that provides protection for Cameco as a minority owner of JV Inkai
the current boundaries of Blocks 1, 2 and 3 will be adjusted to match the agreed production profile
for JV Inkai to 2045
the loan made by a Cameco subsidiary to JV Inkai to fund exploration and evaluation of Block 3 will
be paid on a priority basis.
The Implementation Agreement is subject to obtaining all required government approvals, including certain
amendments to JV Inkai’s existing Resource Use Contract. In February 2017, Cameco estimated it would take
10 to 18 months to obtain them. The government approvals are conditional upon submission of certain
technical reports and other documents. The agreement provides for annual production at the Inkai operation
to be ramped up to 10.4 million pounds of U3O8 over three years following receipt of the required approvals.
The Implementation Agreement also provides that Cameco and Kazatomprom will complete a feasibility study
for the purpose of evaluating the design, construction and operation of a uranium refinery in Kazakhstan with
the capacity to produce 6,000 tU annually as uranium trioxide (UO3). The Implementation Agreement
includes provisions that would make Cameco’s proprietary uranium refining technology available to
Kazatomprom on a royalty-free basis, and grants Kazatomprom a five-year option to license Cameco’s
proprietary uranium conversion technology for purposes of constructing and operating a UF6 conversion
facility in Kazakhstan.
If Cameco and Kazatomprom decide to build the refinery, the Implementation Agreement also provides that
Cameco’s ownership interest in JV Inkai will be increased to 42.5% upon commissioning of the refinery and,
depending on the level of commercial support Cameco provides, may be increased further to 44%.
The Implementation Agreement also grants Kazatomprom a five year option to licence Cameco’s proprietary
uranium conversion technology for purposes of constructing and operating a UF6 conversion facility in
102 2017 INKAI OPERATION TECHNICAL REPORT
Kazakhstan, if Cameco and Kazatomprom decide to build the refinery.
24.4 Currency control regulations
In 2009, specific amendments to existing currency regulations were adopted. These amendments are
aimed at preventing possible threats to the economic security and stability of Kazakhstan’s financial system.
The President of Kazakhstan was granted the power to establish a special currency regime that can:
require foreign currency holders to deposit a certain portion of their foreign currency interest free with
a resident Kazakhstan bank or the National Bank of Kazakhstan
require the permission of the National Bank of Kazakhstan for currency transactions
require the sale of foreign currency received by residents
restrict overseas transfers of foreign currency.
While the special currency regime has not been imposed, it has the potential to prevent Kazakhstan
companies, like JV Inkai, from being able to pay dividends to their shareholders abroad or repatriating any or
all of its profits in foreign currency. It can also impose additional administrative procedures, and Kazakhstan
companies could be required to hold a portion of their foreign currency in local banks.
Following 2009 Kazakhstan currency control legislation has been liberalized. Changes, although insignificant,
have been made with respect to simplification of administration of currency operation and liberalization of the
regulatory regime applicable to currency payments by individuals.
In 2015 the National Bank of the Republic of Kazakhstan amended the rules on currency operations in the
Republic of Kazakhstan (Rules). The Rules inter alia regulate foreign exchange operations, the regime of
foreign investments into Kazakhstan, and cross border and domestic currency payments. Kazakhstan legal
entities (with some exceptions) may purchase foreign currency on Kazakhstan’s market in the amount
exceeding $100,000 (US) or its equivalent only when such currency is required for fulfillment of a currency
contract (e.g. a cross-border sale and purchase agreement) or other documents which confirm the purpose of
the purchase. A Kazakhstan bank may sell currency to Kazakhstan legal entities only when an underlying
contract is presented to the bank. The previous version of the Rules did not restrict the purchase of foreign
currency by Kazakhstan legal entities. Non-resident legal entities, when purchasing or selling the foreign
currency through Kazakhstan banks for Tenge, must provide the purpose of such purchase or sale.
A new law, Law on Currency Regulation and Currency Control, has been proposed and could be adopted by
the end of 2017. The proposed law envisages substantial changes to Kazakhstan currency control. In
particular, the contemplated changes relate to:
amendments to the definition of Kazakhstan residents
the sale and purchase of currency by residents in the Kazakhstan market
requirements applicable to export/import operations with customer clearance in the territory of
Kazakhstan.
The Resource Use Contract grants JV Inkai a measure of protection from currency control regulations,
granting it the right to freely transfer funds, in state and other currencies, inside and outside Kazakhstan.
24.5 Regulatory risks
24.5.1 Kazakhstan laws and regulations
Most civil relations in the Republic of Kazakhstan are governed principally by the Civil Code of the Republic of
Kazakhstan. The Civil Code broadly recognises, inter alia, the rights of foreign companies and citizens to
enter into transactions and to own property in Kazakhstan. These rights are established in the Constitution of
the Republic of Kazakhstan and may be limited only by those restrictions set forth in the legislation of
Kazakhstan.
103 2017 INKAI OPERATION TECHNICAL REPORT
In addition to the Civil Code, there are a number of statutes which are material to JV Inkai’s operations. They
include, principally, Subsoil Law, the Law on Limited Liability Partnerships, the Tax Code, the Ecological
Code, the Entrepreneurial Code, Law on State Property, the Law on Transfer Pricing, and the Law on
Currency Regulation.
The government is developing a new law, the Subsoil Code, to replace the Subsoil Law. The December 2016
draft of the new law does not address licences issued and resource use contracts executed before its
enactment. Therefore, the status of JV Inkai’s Resource Use Contract and Licences under the proposed law is
unclear. This development reflects increased political risk in Kazakhstan.
Although the Republic of Kazakhstan has well-developed legislation, many provisions are sufficiently vague
as to give government officials discretion in their application, interpretation and enforcement. Consequently,
laws are subject to changing and different interpretations. This means that even JV Inkai’s best efforts to
comply with applicable law may not always result in recognized compliance and that non-compliance may
have consequences disproportionate to the violation. The uncertainties in Kazakhstan laws, as well as in their
interpretation and application, represent a significant risk for JV Inkai’s current operations and plans to
increase production.
In addition, the regulation of business in Kazakhstan continues to be influenced by historical notions of strong
governmental control and regulation. This legacy, coupled with state institutions and a judicial system in which
many foreign investors still lack confidence, present a challenging environment in which to do business. To
maintain and increase Inkai production, ongoing support, agreement and co-operation from Kazatomprom and
the Kazakhstan government is required.
The recent worldwide trend of resource nationalism has also been embraced by Kazakhstan in recent years,
as previous benefits accorded foreign investors have been whittled away in the subsoil use sector, changes
have been negotiated by the government into existing resource use contracts, and new laws granting
preferences to the state, state enterprises and domestic concerns have been adopted.
Under Kazakhstan law, the state has the right to nationalize private property by enacting a law on
nationalization. As of the date of this technical report, Kazakhstan has not exercised such right but the risk of
nationalization of JV Inkai’s property still exists.
JV Inkai’s operations may be affected in varying degrees by government regulations restricting production,
price controls, export controls, currency controls, taxes and royalties, expropriation of property,
environmental, mining and safety legislation, and annual fees to maintain mineral properties in good
standing. There is no assurance that the laws in Kazakhstan protecting foreign investments will not be
amended or abolished, or that these existing laws will be enforced or interpreted to provide adequate
protection against any or all of the risks described above. There is also no assurance that the Resource Use
Contract can be enforced or will provide adequate protection against any or all of the risks described above.
Cameco believes that the risk of operating a mine in Kazakhstan is manageable.
24.5.2 Compliance with legal requirements
Under the Resource Use Contract and Licences, JV Inkai has the rights to explore for and to extract uranium
from the subsoil and it owns the uranium extracted from the subsoil. Its ability to conduct these activities,
however, depends upon compliance with its obligations under the Resource Use Contract, the Licences and
laws of the Republic of Kazakhstan, as well as ongoing support, agreement and co-operation from the
government of Kazakhstan.
The Subsoil Law lists the violations which entitle the Competent Authority to unilateral termination of a
resource use contract. For more details please refer to Section 4.4 Resource Use Contract. If JV Inkai or its
participants commit any of these violations, there is a risk of JV Inkai losing its subsoil use rights due to
unilateral termination by the Competent Authority.
The Subsoil Law provides the state with the right to demand the amendments of the resource use contract if
activities of a subsoil user, exploring or developing a strategic deposit, entail such changes in the economic
104 2017 INKAI OPERATION TECHNICAL REPORT
interests of the state that pose a threat to national security. This in turn might entail a risk of diminishment of
JV Inkai’s rights. The right to demand amendments might be applied broadly by the state leading to a risk of
(i) curtailment of JV Inkai’s rights or (ii) termination of the Resource Use Contract and the Licences. For more
details please refer to Section 4.5.4 Contract termination
In its Resource Use Contract, JV Inkai committed to conducting its operations according to good international
mining practices. It complies with the environmental requirements of Kazakhstan legislation and regulations,
and, as an industrial company, it must also reduce, control or eliminate various kinds of pollution and protect
natural resources. Regulatory authorities have the power to issue an order reducing or halting production at a
facility that violated environmental standards.
JV Inkai is required to hold, and it does hold, a number of licences and permits (including but not limited to
ecological permits) and therefore, must comply with their requirements. Failure to obtain and to comply with
the requirements of licences and permits could result in the activities JV Inkai performs under a licence or
permit being limited. For example, without an ecological permit, JV Inkai will be unable to conduct subsoil
operations.
Generally, other breaches of law and/or contractual obligations may also lead to limitation of the right to use
JV Inkai’s property.
24.5.3 2016 Implementation Agreement regulatory approvals
In 2016, Cameco signed the Implementation Agreement with Kazatomprom and JV Inkai to restructure and
enhance Inkai. This agreement is subject to obtaining all required government approvals, including
amendments to the Resource Use Contract, which in February 2017, Cameco estimated it would take 10 to
18 months to obtain. There is a risk that all required government approvals to close, or give effect to, the
contemplated transactions, including approval of the amendments to the Resource Use Contract from
government authorities, will not be received or will not be received on a timely basis.
24.5.4 Extension of Block 3 exploration period
In November 2016, Amendment No. 5 to the Resource Use Contract was signed, extending the exploration
period at Block 3 until July 13, 2018. There is risk that JV Inkai may not complete the work on the final
appraisal of Block 3’s mineral potential prior to July 13, 2018 and a further extension may be required. There
is no assurance that a further extension will be granted or what the terms and conditions of such an extension
would be. This may result in the loss of Block 3 without compensation for the loss of JV Inkai’s investment.
Cameco believes that the risk will be mitigated if the Implementation Agreement closes prior to July 13, 2018.
24.6 Caution about forward-looking information
This technical report includes statements and information about expectations for the future that are not
historical facts. When JV Inkai’s plans and the future performance of Inkai, or other things that have not yet
taken place, are discussed, these statements are considered to be forward-looking information or forward-
looking statements under Canadian and US securities laws. They are referred to in this technical report as
forward-looking information.
Key things to understand about the forward-looking information in this technical report:
It typically includes words and phrases about the future, such as believe, estimate, anticipate,
expect, plan, forecast, project, scheduled, strategy and proposed or variations (including negative
variations) of such words and phrases or may be identified by statements to the effect that certain
actions, events or results, may, could, should, would, will be or shall be taken, occur or be achieved.
It is based on a number of material assumptions, including those listed below, which may prove to be
incorrect.
Actual results and events may be significantly different from what is currently expected because of
the risks associated with JV Inkai, its business, the Inkai deposit and mining in the Republic of
Kazakhstan. A number of these material risks are listed below. It is recommended that the reader
105 2017 INKAI OPERATION TECHNICAL REPORT
also reviews other parts of this document, including Section 24.5 Regulatory risks, which outlines a
number of regulatory risks, Cameco’s Annual Information Form for the year ended December 31,
2016 under the headings “Caution about forward-looking information” and “Risks that can affect our
business” and Cameco’s annual Management’s Discussion and Analysis for the year ended 2016
under the headings “Caution about forward-looking information” and “Uranium Operating Properties
– Inkai – Managing our risks,” which include a discussion of other material risks that could cause
actual results to differ from current expectations.
Forward-looking information is designed to help the reader understand current views of the qualified persons
and management of Cameco. It may not be appropriate for other purposes. Cameco and the qualified persons
will not necessarily update this forward-looking information unless required to by securities laws.
Examples of forward-looking information in this technical report
plans and expectations for Inkai
estimates of capital, operating and decommissioning costs
mineral resource and mineral reserve estimates
forecasts relating to mining, development and other activities including but not limited to mine life and
mine production
Cameco’s February 2017 estimate that it would take 10 to 18 months to obtain all required
approvals, including amendments to the Resource Use Contract, to close the Implementation
Agreement and the effect of the Implementation Agreement closing
Material assumptions
there is no material delay or disruption in JV Inkai’s plans due to natural phenomena, delay in
acquiring critical equipment, equipment failure or other causes
there are no labour disputes or shortages
all necessary contractors, equipment, operating parts and supplies are obtained when they are
needed
regulatory permits and approvals are obtained when they are needed, including to close the
Implementation Agreement
the main processing plant and satellite plant are available and function reliably as designed
the mineral resource and mineral reserve estimates and the assumptions they are based on are
reliable (see Sections 14 Mineral resource estimates and 15 Mineral reserve estimates)
JV Inkai’s development, mining and production plans for Inkai succeed
equipment required for mining operates reliably
Material risks
an unexpected geological, hydrological, or mining condition delays or disrupts production
the necessary regulatory permits or approvals cannot be obtained or maintained, including to close
the Implementation Agreement
natural phenomena, labour disputes, equipment failure, delay in obtaining the required contractors,
equipment, operating parts and supplies or other reasons cause a material delay or disruption in
production
main processing plant and the satellite plant are not available or do not function as designed
mineral resource and mineral reserve estimates are not reliable

106 2017 INKAI OPERATION TECHNICAL REPORT
JV Inkai’s development, mining or production plans for Inkai are delayed or do not succeed for any
reason
the risks described in Section 24.5 Regulatory Risks.
107 2017 INKAI OPERATION TECHNICAL REPORT
25 Interpretation and conclusions
Inkai is an ISR mine in the Central Asian Republic of Kazakhstan. It comprises three contiguous licence
blocks: Block 1, Block 2 and Block 3. Uranium production is obtained from Blocks 1 and 2. A test leach
program is ongoing at Block 3.
Based on the rigorous procedures and experience demonstrated by Volkovgeology, JV Inkai and Cameco
personnel, Cameco’s review of the reliability, quality and density of data available, the thorough geological
interpretative work, and the different validation tests performed over the years, the QPs responsible for the
mineral resource and mineral reserve estimates consider that the current estimates of mineral resources and
reserves are relevant and reliable.
From 2009 till end of 2016, JV Inkai produced 36.7 million pounds of U3O8 (Cameco’s share of 21.5 million)
from Blocks 1 and 2. Cameco believes that Blocks 1 and 2 have the potential to sustain production levels, as
outlined in this technical report.
The current technical report supports the sustained production, based on an operating mine life of 13.3 years,
producing an estimated 68.5 million pounds of U3O8.
Based on exploration and development to date, Cameco and the authors of this report are of the opinion that
Block 3 has the potential to support a commercial operation. In November 2016, Amendment No. 5 to the
Resource Use Contract was signed, extending the exploration period at Block 3 until July 13, 2018.
If the Implementation Agreement closes, the estimated mineral resources and mineral reserves of Inkai, and
Cameco’s share of them, will change materially.
108 2017 INKAI OPERATION TECHNICAL REPORT
26 Recommendations
Given that Inkai is in production, that it has sufficient mineral reserves to produce at the current licensed
production rate, and that leach tests on Block 3 are in progress, the authors of this technical report consider
that it is not necessary to recommend further exploration activities. In areas of probable reserves where the
confidence on some characteristics of the mineralization can be increased, such as grade continuity and
hydrological conditions, additional delineation drilling is recommended.
Over the life of the operation and at higher production rates, the accumulation of specific ionic species in the
holding ponds could reduce surface equipment performance. It is recommended that the concentration of
ionic species be monitored.
The Implementation Agreement provides for annual production at the Inkai operation to be ramped up to 10.4
million pounds of U3O8 over three years following receipt of required approvals. It is recommended that
technical studies related to the production ramp-up be completed and submitted in a timely manner.
109 2017 INKAI OPERATION TECHNICAL REPORT
27 References
Cameco, JV Inkai Property- Uranium Reserve and Resource Estimate, 2003
CIM, Definition Standards - For Mineral Resources and Mineral Reserves, 2014
CIM, Estimation of Mineral Resources and Mineral Reserves – Best Practice Guidelines, 2003
Council of Ministers of the USSR, Resolution N 1128 on the Approval of the Classification for the Mineral
Reserves and Prognosticated Resources of the Solid Minerals, 1981
FGU GKZ and CRISCO, Guidelines on Alignment of Russian minerals reporting standards and the CRIRSCO
Template, 2010.
Geolink Consulting, Groundwater Flow and Plume Migration Modeling Study at the Inkai Deposit, Block No. 1,
2003
GKZ (State Reserve Commission of the USSR), Guidelines on the Application of the Mineral Reserve
Classification for the Deposits of Radioactive Minerals, 1986
International Atomic Energy Agency, Manual of acid in situ leach uranium mining technology, 2001
KAPE, Environmental Baseline Study of the Inkai Deposit, 2002
KAPE, Environmental Baseline Study on Block 2 of the Inkai Deposit, 2006.
Kazatomprom, Development of Uranium Mining by ISL in Kazakhstan, IAEA Vienna, 2014
KAZRC, Kazakhstan Code for the Public Reporting of Exploration Results, Mineral Resources and Mineral
Reserves, 2016
KAZRC, The Guidelines On Alignment Of Minerals Reporting Standards Of The Republic Of Kazakhstan And
The CRIRSCO Template, 2016
Kislyakov, Y.M. and Shetochkin, V.N., Hydrogenic Ore Formation, 2000. English translation from Russian by
CERCAMS, 2009
NAEN. The NAEN Code for the Public Reporting of Exploration Results, Mineral Resources, Mineral
Reserves, 2011
Power Resources Inc., Inkai ISL Uranium Project Feasibility Study Volume 1, November 2003, revised
September 2004 and December 2004
SRC (State Reserve Commission of Kazakhstan), Guidelines on the Application of the Mineral Reserve
Classification for the Sandstone Uranium Deposits (Amendment to the Guidelines on the Application of the
Mineral Reserve Classification for the Deposits of Radioactive Minerals), 2008
SRK Consulting, Inkai In-Situ Leach Uranium Project, 2005
SRK Consulting, Resource Verification – Inkai in-situ Leach, 2007
Two Key, Interim Report on the Results of Exploration and Delineation at the Block 3 (Northern Flank) of the
Inkai Deposit with Uranium Resource Estimation in the C1 and C2 Categories, 2014
Volkovgeology, Assessment of Natural Attenuation on Test Block 1 after In-Situ Leaching at the Inkai Deposit,
2005
Volkovgeology, Report of the Expedition No 7 on the First Stage of the Detailed Exploration and Delineation of
the Inkai Uranium Deposit for the Period 1979-1991, with Mineral Resource Estimation as of 01.07.1991.
Volumes I, II and III, 1991
Volkovgeology, Report on the Results of Exploration and Delineation Block 2 of the Inkai Uranium Deposit
over a Period of 1991-2006, 2007
110 2017 INKAI OPERATION TECHNICAL REPORT
Volkovgeology, Technical and Economic Substantiation of Permanent Conditions for Block 2 of the Inkai
Uranium Deposit, 2007
Volkovgeology, Laboratory Studies on the Technical Parameters of the Ore - Deposit Inkai, 2011
Volkovgeology, Report of Exploration of Block 3 Inkai Uranium Deposit As of 01.01.2015, Volume 1, Book 4,
2015
111 2017 INKAI OPERATION TECHNICAL REPORT
28 Date and signature page
This NI 43-101 Technical Report titled “Inkai Operation, South Kazakhstan Oblast, Republic of
Kazakhstan”, dated March 23, 2017 with an effective date of December 31, 2016 has been prepared
under the supervision of the undersigned. The format and content of the report conform to Form 43-
101F1 of NI 43-101 of the Canadian Securities Administrators.
“signed and sealed”________________
Alain G. Mainville, P. Geo. March 23, 2017
Cameco Corporation 2121 – 11th Street West
Saskatoon, SK, S7M 1J3
Canada
“signed” _________________________
Darryl Clark, PhD, P. Geo. March 23, 2017
Cameco Kazakhstan LLP 6 Sary-Arka Street
Office 920, Arman Business Center
Astana,
Kazakhstan 010000
“signed and sealed” ________________
Stuart B. Soliz, P. Geo. March 23, 2017
Power Resources, Inc. (operating as 550 North Poplar, Suite 100
Cameco Resources) Casper, WY 82601
United States of America
“signed and sealed” ________________
Robert J. Sumner, PhD, P. Eng. March 23, 2017
Cameco Corporation 2121 – 11th Street West
Saskatoon, SK, S7M 1J3
Canada


