A project
implemented by
TRANSTEC &
EQUINOCCIO
INDONESIA’S TRADE ACCESS TO THE EUROPEAN UNION:
OPPORTUNITIES AND CHALLENGES
Team Leader: Montague LORD
Expert 2: Rina OKTAVIANI
Expert 3: Edzard RUEHE
November 2010
This report was commissioned and financed by the European Communities. The views expressed herein are those of the Consultants, and do not represent any official view of the Commission.


iINDONESIA TRADE ACCESS TO THE EUROPEAN UNION: OPPORTUNITIES AND CHALLENGES
Table of Contents
List of Acronyms vi
Executive Summary 1
1. The EU as an Important Market 1
2. Indonesia’s Trade Flows with the European Union and Other Important Markets 1
3. Selection of Focal Industries for the Study 2
4. Focal Industries have a Huge Potential in the EU Market 3
5. Market Potential of Focal Sectors Needs to be Counter-Balanced with Compliance of
Quality Requirements 3
6. Indonesia is Well Positioned to Tackle Enormous Trade Potential with European Union 4
7. Most Challenges for Indonesia are in Supply-Side Aspects, Especially the EQI System 4
8. Compliance with EU Quality Requirements also Helps Indonesian Exports to
Other Developed Markets 6
1 Introduction 7
1.1 Background 7
1.2 Challenges 7
1.3 Coverage of Export Quality Infrastructure 8
1.4 How EQI Relates to WTO’s TBT-SPS Agreements 9
1.5 Study Outline 10
PART I: TRADE PATTERNS
2 The EU Market 13
2.1 Overview of the European Union 13
2.2 Structure of the EU Economies 14
2.3 EU Internal Markets 14
2.4 EU Market Performances 16
2.5 Regulatory Environment 17
2.5.1 EU Institutions and Decision-Making Processes in Trade-Related Matters 17
2.5.2 Regulations and Restrictions on EU Imports 18
3 Indonesia’s Exports to The European Union 21
3.1 Export Structure and Performance 21
3.2 Indonesia’s Exports to EU Countries 22
3.3 Indonesian-EU Trade Compatibility 22
3.4 Indonesia’s Exports of the European Union’s Top Imports 24
3.5 Matching High-Growth Exports with Dynamic EU Imports 24
3.5.1 Measuring Penetration in Different Types of Markets 24
3.5.2 Indonesia’s Smaller-Size Exports 25
3.5.3 Indonesia’s Medium-Size Exports 25
3.5.4 Indonesia’s Large-Size Exports 25
3.5.5 Emerging Patterns 25
3.6 Indonesia’s EU Market Access Relative to Comparator Countries 27
4 Selection of Focal Sectors and Industries 29
4.1 Selection Criteria and Decision-Making Process 29
4.2 Factors Related to National Development Objectives (Steps 1 and 2) 31

ii
4.3 Foreign Market Determinants (Step3) 32
4.4 International Competitiveness and Internal Factors (Step 4) 32
4.5 Recommended Focal Sectors 33
4.6 Selected Focal Industries 34
PART II: EU MARKET POTENTIAL
5 Market Prospects for Focal Industries 39
5.1 Import Demand Responsiveness to Income and Price Changes 39
5.2 Import Demand Forecasts for Focal Industries 41
6 EU Market Performance and Growth Potential for Focal Industries 43
6.1 Fisheries Industry 43
6.2 Processed Agri-Food Industry 44
6.3 Electronics Industry 45
6.4 Furniture Industry 46
6.5 Cosmetic Industry 47
7 Market Access Issues for Indonesian Exporters 49
7.1 Trade Regulations with General Application 49
7.1.1 Preferential Trade Arrangements 49
7.1.2 Tariffs 49
7.1.3 Non-Tariff Measures 50
7.2 Market Access Issues of Focal Industries 52
7.2.1 Fisheries Industry 52
7.2.2 Agri-Food Processing 54
7.2.3 Electronics 55
7.2.4 Furniture Industry 56
7.2.5 Cosmetic Industry 56
PART III: INDONESIA’S POSITION TO TACKLE EU MARKET POTENTIAL
8 Outlook for Exports to EU Market 60
8.1 Export Drivers 60
8.2 Export Prospects 61
8.3 Regaining Market Shares 62
9 Indonesia’s Export Performance in EU Market 65
9.1 Importance of Focal Industries 65
9.1.1 Importance of Focal Industries to Indonesia 65
9.1.2 Major Export Markets 66
9.1.3 Major Global Competitors 66
9.2 Export Competitiveness in EU Market 67
9.2.1 Export Prices and Real Cross Rates 68
9.2.2 Demand Conditions 69
9.2.3 Industry Networking 69
9.2.4 Conditions for Conducting Business 70
9.3 International and Regional Trade Agreements 71
9.3.1 Indonesia Membership in WTO, ASEAN and APEC 71
9.3.2 Indonesia Market Access under the European Union’s GSP 71

iiiINDONESIA TRADE ACCESS TO THE EUROPEAN UNION: OPPORTUNITIES AND CHALLENGES
9.3.3 Indonesia’s Partnership and Cooperation Agreement (PCA)
with European Union 72
10 EQI Constraints in Focal Industries 73
10.1 Cross-Cutting Issues 73
10.2 Fisheries Industry 74
10.2.1 EQI Issues in Wild Catch 74
10.2.2 EQI Issues in Fish and Shrimp Farming 74
10.2.3 EQI Issues in Collection by Middlemen and Transport to Processor 75
10.2.4 EQI Issues in Fish Processing 75
10.2.5 EQI Issues in Laboratories 75
10.3 Agri-Foods Industry 75
10.3.1 EQI Issues in Farming 75
10.3.2 EQI Issues from Farm to Processor 76
10.3.3 EQI Issues in Processing 76
10.3.4 EQI Issues in Product Quality Testing 76
10.4 Consumer Electronics Industry 76
10.4.1 EQI Issues in Product Design 77
10.4.2 EQI Issues in Component Purchases 77
10.4.3 EQI Issues in Assembly 77
10.4.4 EQI Issues in Inspection and Packaging 77
10.5 Furniture Industry 77
10.5.1 EQI Issues in Buying and Cutting the Wood 77
10.5.2 EQI Issues in Drying the Wood 77
10.5.3 EQI Issues in Production and Assembly 78
10.5.4 EQI Issues in Finishing 78
10.5.5 EQI Issues in Testing 78
10.6 Cosmetics Industry 78
10.6.1 EQI Issues in New Product Designs 78
10.6.2 EQI Issues in Processing and Testing 79
11 Export Policies and Regulatory Environment 80
11.1 Institutional Framework 80
11.1.1 Trade Policy Formulation 80
11.1.2 Institutional Capacity 81
11.2 Cross-Cutting Policies and Regulations 81
11.3 Industry-Specific Policies and Regulations 82
12 Business Associations Support 85
12.1 SME Knowledge about EU Market Access Requirements 85
12.2 Business Support in Focal Industries 85
12.2.1 Fisheries Industry 85
12.2.2 Agri-Foods Industry 86
12.2.3 Consumer Electronics Industry 87
12.2.4 Furniture Industry 87
12.2.5 Cosmetics Industry 88

iv
ANNEXESA. Fisheries 91
A.0 Executive Summary 93
A.1. Introduction 95
A.1.1 Objective and Coverage 95
A.1.2 Importance of the Industry 95
A.1.3. SWOT Analysis 99
A.2. Indonesia’s Export Competitiveness in The EU Market 101
A.2.1. EU Market Development and Prospects 101
A.2.2. Indonesia’s Export Competitiveness 102
A.2.3. Opportunities to Regain Market Shares 105
A.3 Challengers for Realizing Indonesia’s Exports Potential 107
A.3.1. EU Market Access 107
A.3.2. Value Chain Analysis 110
A.3.3. Industry Support Services 122
A.3.4. Regulatory Framework 124
A.3.5. Case Study of Fish Farming and Processing 125
A.4. Summary and Conclusions 127
B. Agri-Foods 131
B.0. Executive Summary 133
B.1.1. Objective and Coverage 135
B.1.2. Importance of the Industry 135
B.1.3. SWOT Analysis 138
B.2. Indonesia’s Export Competitiveness in The EU Market 140
B.2.1. EU Market Development and Prospects 140
B.2.2. Indonesia’s Export Competitiveness 141
B.2.3. Opportunities to Regain Market Shares 144
B.3 Challenges for Realizing Indonesia’s Exports Potential 145
B.3.1. EU Market Access 145
B.3.2 Value Chain Analysis 154
B.3.3. Industry Support Services 164
B.3.4. Regulatory Framework 164
B.3.5. Case Study: Fruit Juice Company 165
B.4 Summary and Conclusions 168
C. Electronics 171
C.0. Executive Summary 173
C.1. Introduction 175
C.1.1. Objective and Coverage 175
C.1.2. Importance of the Industry 175
C.1.3 SWOT Analysis 178
C.2. Indonesia’s Export Competitiveness in The EU Market 179
C.2.1. EU Market Development and Prospects 179
C.2.2. Indonesia’s Export Competitiveness 180
vINDONESIA TRADE ACCESS TO THE EUROPEAN UNION: OPPORTUNITIES AND CHALLENGES
C.2.3 Opportunities to Regain Market Shares 183
C.3. Challenges for Realizing Indonesia’s Export Potential 185
C.3.1 EU Market Access 185
C.3.2 Value Chain Analysis 187
C.3.3 Industry Support Services 197
C.3.4 Case Study of Electronic Manufacturer 197
C.3.5 Regulatory Framework 199
C.4 Summary and Conclusions 200
D Furniture 203
D.0. Executive Summary 205
D.1. Introduction 207
D.1.1. Objective and Coverage 207
D.1.2. Importance of the Industry 207
D.1.3. SWOT Analysis 210
D.2. Indonesia’s Export Competitiveness in the EU market 212
D.2.1. EU Market Development and Prospects 212
D.2.2. Indonesia’s Export Competitiveness 213
D.2.3. Opportunities to Regain Market Shares 216
D.3. Challenges for Realizing Indonesia’s Export Potential 218
D.3.1. EU Market Access 218
D.3.2. Value Chain and EQI Analysis 220
D.3.3. Business Constraints 229
D.3.4. Labeling on Sustainable Forestry 231
D.3.5. Business Support and EQI Information Access 235
D.3.6. Regulatory Framework 238
D.3.7. Case Study of Furniture Manufacturer 239
D.4. Summary and Conclusions 241
E. Natural Cosmetics 243
E.0 Executive Summary 245
E.1. Introduction 247
E.1.1. Objective and Coverage 247
E.1.2. Importance of the Industry 247
E.1.3. SWOT Analysis 250
E.2. Indonesia’s Export Competitiveness in the EU market 252
E.2.1. EU Market Development and Prospects 252
E.2.2. Indonesia’s Export Competitiveness 253
E.2.3. Opportunities to Regain Market Shares 255
E.3 Challenges For Realizing Indonesia’s Export Potential 257
E.3.1. EU Market Access 257
E.3.2. Value Chain Analysis 260
E.3.3 Industry Support Services 267
E.3.4. Regulatory Framework 268
E.3.5. Case Study of a Leading Indonesian Cosmetics Company 269
E.4 Summary and Conclusions 272
vi
List of Acronyms
ACP African, Caribbean and Pacific (countries or states)
ABE Asosiasi Perusahaan Jasa dan Barang Teknik Elektronika
ACA Asian Cosmetic Association
ACD ASEAN cosmetic directive
ACP African, Caribbean and Pacific (States)
AP5I Association for Fish Processing and Marketing Companies in Indonesia
APKJ Small-Scale Furniture Producers Association
APUI Asosiasi Pembenih Udang Indonesia
ASEAN Association of Southeast Asian Nations
ASI Accreditation Services International
ASMINDO Furniture and Handicraft Association
ASTUIN Association for Tuna Fish Companies
ATP Autonomous trade preferences
B4T Balai Besar Bahan dan Barang Teknik
BBIA Balai Besar Industri Agro
BBKK Balai Besar Kimia dan Keramik
BIP Border Inspection Post
BPMBEI Laboratory for Quality Testing of Export and Import Goods
BPOM Indonesia the National Agency for Food and Drugs
BSN National Standardization Agency
CA Competent Authority
CAB Conformity assessment body
CAP Common Agricultural Policy
CB Certification bodies
CCP Common Commercial Policy
CEN European Committee for Standardization
CENELEC European Committee for Electrotechnical Standardization
CFP Common Fisheries Policy
CMO Common Market Organisation
COM Common Organization of the Markets
CPKB Good Cosmetic Production Method
CRM Certified Reference Materials
CSR Corporate Social Responsibility
DG SANCO European Commission´s Health and Consumer Protection Directorate General
DGFPPM Directorate General of Fishery Products Processing and Marketing
DGFPS Direccion General de Farmacia y Productos Sanitarios
EBA Everything But Arms
EC European Commission
ECHA European Chemicals Agency
ECVAM European Centre for Validation of Alternative Methods
EEE Electrical and electronic equipment
EEZ Exclusive Economic Zones
EFSA European Food Safety Authority
EMC Electro Magnetic Compatibility
EMS Equipment Manufacturing Services
EPZ Export Processing Zone
EQI Export Quality Infrastructure
ERP Effective rate of protection
ESO European Standards Organizations
ETPIK Registered Exporters of Products of Forestry Industry
ETS Emission Trading Scheme
ETSI Emission Trading Scheme
EU European Union
FAO Food and Agriculture Organization
FIFG Financial Instrument of Fisheries Guidance
FLEGT Forest Law Enforcement Governance and Trade
FOB Free on Board
FSC Forest Stewardship Council
FTA Free trade agreements
FVO Food and Veterinary Office
GABEL Gabungan Industri Elektronika dan Alat-Alat Listrik Rumah Tangga
GAP Good Aquaculture Practice
GAPMMI Gabungan Pengusaha Makanan dan Minuman Seluruh Indonesia
GDP Gross Domestic Product
GHdP Good Handling Practice
GHG Greenhouse gas
GM Genetically modified
GMOs Genetically modified organisms
GMP Good Manufacturing Practices
GP JAMU Gabungan Pengusaha Jamu dan Obat Tradisional Indonesia
GPSD General Product Safety Directive

viiINDONESIA TRADE ACCESS TO THE EUROPEAN UNION: OPPORTUNITIES AND CHALLENGES
GSP Generalized System of Preferences
HACCP Hazard Analysis Critical Control Points
HS Harmonized System
ICS Internal Control System
IDR Iskandar Development Region
IEC International Electrotechnical Commission
IIT Intra-industry trade
IIU Illegal, unreported and unregulated
IPPC Integrated Pollution Prevention and Control
IPPC-FAO International Plant Protection Convention of Food and Agriculture Organization
ISIC International Standard Industrial Classification
IT Information Technology
ITC Information and Communications Technologies
KAN Komite Akreditasi Nasional
LDCs Least Developed Countries
LIPI Lembaga Ilmu Pengetahuan Indonesia
MFN Most-favored-nation
MMAF Ministry of Fisheries and Marine Affairs
MOI Ministry of Industry
MRAs Mutual recognition agreements
MSDS Material Safety Data Sheets
MSE Micro and small enterprises
MUI Majelis Ulama Indonesia
NADFC National Agency of Drug and Food Control
NCQC National Center for Fish Quality Control
NPPOS National Plant Protection Organizations
NRCP National Residue Control Plan
NTBs Non-Tariff Barriers
ODM Original Design Services
OEM Original Equipment Manufacturers
PBB Polybrominated biphenyls
PBDE Polybrominated diphenyl ethers
PC Personal computer
PERKOSMI Persatuan Perusahaan Kosmetik Indonesia
PIF Product Information File
PPMB Pusat Pengujian Mutu Barang
PT Proficiency Tests
PTB Physikalische Technische Bundesanstalt
PTCI PT Cosmetics Indonesia
PTFI PT Furniture Indonesia
PTFJ PT Furniture Jerman
R&D Research & development
RAPEX Rapid Alert System for non-food consumer products
RASFF Rapid Alert System for Food and Feed
RCChem Research Centre for Chemistry
REACH Registration, evaluation, authorization and restriction of chemicals
RoHS Restriction of Hazardous Substances
SAD Single admissions document
SCI Shrimp Club Indonesia
SEI PT Supplier Electronic Indonesia
SGF Schutzgemeinschaft der Fruchtsaft- Industrie e.V.
SME Small and medium size enterprises
SOP Standard Operation Procedures
SPF Specific Pathogen Free
SPS Sanitary and Phytosanitary (measures)
SWOT Strengths, opportunities, weaknesses and threats
TBT Technical Barriers to Trade
TCI Trade compatibility index
TFT The Forest Trust
TLAS Timber Legality Assurance System
TSP Trade Support Programme
TÜV Technischer Überwachungsverein
U.A.R. United Arab Republic
VAT Value added tax
VLO Verification of Legal Origin
VPA Voluntary Partnerships Agreement
WEEE Waste electrical and electronic equipment
WTO World Trade Organization

1INDONESIA TRADE ACCESS TO THE EUROPEAN UNION: OPPORTUNITIES AND CHALLENGES
Executive Summary
1. The EU as an Important MarketThere are extensive market opportunities for countries like Indonesia in the European Union. As a single entity, the European Union is the world’s largest economic power, accounting for nearly 30 percent of total world output and outranking the total gross domestic product (GDP) of the United States, and of Japan and China combined. With the value of total trade equal to more than 40 percent of GDP, the European Union’s openness to trade is more than three times greater than that of either the United States or Japan. The total value of its imports last year was US$1.7 trillion, representing over 18 percent of total world trade. The ASEAN countries supply 5 percent of those EU imports and Indonesia contributes 18 percent of that share.
From Indonesia’s perspective, there are two important differences among the 27 member countries of the European Union. The first is the large variations in the size of member countries in terms of their domestic markets and importance of external trade to their economies; the second is the considerable variation that occurs in consumer purchasing power across the countries. Under these conditions, Indonesian exporters have a wide range of market opportunities when looking for markets of different sizes, openness to foreign trade, and with consumer preferences for either high-end products or products that are more directed towards mass markets.
The European Union is also home for almost half of the world’s largest transnational corporations. These companies depend on linkages with foreign-based producers in sectors that are of particular interest to Indonesia, for example, in chemicals, electrical equipment, food and beverage, motor vehicles, and pharmaceuticals. By integrating their supplies into global value chains of these transnationals, local Indonesian producers are increasingly becoming part of networks of cooperating firms that are involved in the full cycle of activities that add value to the products that they supply to consumers, both in Europe and elsewhere.
2. Indonesia’s Trade Flows with the European Union and Other Important MarketsNotwithstanding the size and importance of the European Union, the share of Indonesia’s exports destined for that market has declined substantially, from 18 percent to 14 percent over the last decade. This contraction parallels similar reductions in the share of Indonesia’s exports directed
2
at the United States and Japan. As a whole, the absorption of Indonesia’s exports by these three markets has fallen from 55 percent in 2000 to 40 percent in 2009.
Most of the decline in Indonesia’s exports to these developed markets has been redirected to the ASEAN regional market. This shift has increasingly allowed other ASEAN countries to use Indonesia’s natural resources in their unprocessed forms to move up their value chains and produce greater quantities of processed and high-tech products. As a result, the fast-growing East Asian economies have been able to concentrate a growing proportion of their exports in manufactures and high value-added products, while Indonesia has remained entrenched in the production of raw materials and products having relatively small value-adding activities.
Indonesia could reverse this pattern by focusing its production activities on processing activities and other activities that add value to products. It has a relatively high degree of trade compatibility with EU imports. There are also a large number of products in which Indonesia has already succeeded in increasing its market shares in rapidly expanding markets in the European Union. Examples include electronic components, processed and prepared foods, and chemicals. In other products, however, Indonesia has not yet taken advantage of the fast growing EU markets for products like soaps and cosmetics, television parts, furniture, crustaceans, footwear and jewellery. Recognising these opportunities could stimulate the Indonesian private sector, with Government support, to find ways to overcome existing obstacles and develop products with export potential to fast-growing EU markets.
3. Selection of Focal Industries for the Study In order to provide lessons and guidelines for developing high-value added exports with dynamic growth markets in the European Union, the present study focuses on five industries or sub-sectors of importance to Indonesia. The selection process has invoked a number of criteria that can be grouped into three categories: (i) factors related to national development objective; (ii) factors related to foreign market determinants; and (iii) factors related to international competitiveness and internal factors. The results of this procedure have led to the selection of the following focal industries:
Fisheries and Agri-Foods: There are large opportunities for exporters to move into high value-adding downstream activities. Small and medium size enterprises (SMEs) tend to predominate in food industry clusters, and networking activities along the value chain provide large opportunities for knowledge and technology transfers to local producers. There are also important gains to be made in poverty alleviation by generating employment.
Consumer Electronics: The industry has considerable potential for value adding activities in the economy. There are extensive opportunities for Export Quality Infrastructure (EQI) support directed at moving Indonesia from low to medium-tech products with favourable market prospects in the new EU member states of Eastern Europe to high-tech components in the high-income Western European economies. Trade compatibility between Indonesia’s existing exports of these products and EU imports in this industry is the highest of any of the industries considered.
Furniture: Development of this industry would offer large possibilities for SMEs and micro and small scale enterprises (MSEs), and could lead to substantial employment generation and poverty alleviation throughout Indonesia. The benefits from EQI activities could have a favourable environmental impact through improved quality management and control, standardisation, inspections and certification. Domestic business and trade associations are strong and could provide support to exporters intending to enter the EU market.
Natural Cosmetics: The industry has the highest import demand responsiveness to changes in economic activity in the European Union. It therefore has the best EU market prospects among all sectors. Downstream activities involving the location of facilities for further processing are rapidly emerging in new manufacturing areas, where large research and development (R&D) inputs are also needed. Requirements for EQI improvements are therefore large in the Indonesian industry’s chain of activities.

3INDONESIA TRADE ACCESS TO THE EUROPEAN UNION: OPPORTUNITIES AND CHALLENGES
4. Focal Industries have a Huge Potential in the EU MarketDemand for imports of the focal products is projected to grow by nearly 7 percent a year over the medium term. This forecast is based on our econometric models that generated market estimates based on key assumptions about GDP growth, relative price changes for each of the traded products, and the exchange rate between the Euro and the US dollar. EU market outlook highlights are as follows:
Fisheries: The European Union is, by far, the world’s largest importer of fishery products, and its strong demand for fishery imports largely reflects its high responsiveness to changes in consumer incomes. Based on our estimates, and expectations about the medium-term prospects for economic growth, European fishery imports are projected to grow by a robust annual average of 8 percent. Above-average rates are expected to continue in processed fishery imports, which have in the past grown at rates that were twice those of all other types of fishery imports. The fastest growing product-level imports are likely to be fish and shellfish in their frozen form, including coalfish, eels, albacore, scallops, trout, mackerel, sardines and crabmeat. Imports of fresh and chilled yellow-fin tuna are also expected to show strong growth. Indonesia is in a particularly favourable position in that it has the world’s largest catch of this species.
Agri-foods: The EU demand for agri-food imports has been strong, particularly in its response to changes in consumer incomes. Demand for agri-food imports is projected to grow by 3.5 percent a year in the medium-term. Among individual product categories, fruit and vegetable juices are expected to continue as one of the largest processed agri-food imported into the European Union. It alone accounts for nearly one-fifth of all agri-food imports and it is expected to continue its robust growth, especially in tropical and exotic fruits that are abundant throughout Indonesia. Other major imports showing strong demand prospects are prepared vegetables and fruits, and condiments and seasonings, where Indonesia has large varieties.
Consumer Electronics: The size of the consumer electronics markets far exceeds that of any other focal industry covered by this study. Demand is highly responsive to income changes, but year-to-year variations in EU imports are high. The medium-term forecast is for a 2 percent average annual growth of imports, but yearly variations from the trend are likely to be high. The top EU electronic product imports are fairly evenly distributed among the mass market applications in home appliances, data processing uses, audio and video.
Furniture: The European Union is the world’s largest market for furniture. The medium-term outlook is for a 2 percent annual growth in imports, as foreign supplies become an increasingly larger proportion of the total furniture market in Europe. The top importing countries in the European Union are the United Kingdom, Germany, France and the Netherlands, which together account for two-thirds of all EU furniture imports.
Natural Cosmetics: The cosmetic market of the European Union is nearly as large as the combined markets of the United States and Japan. Common growth patterns are occurring throughout the European Union in sun-care products. In addition, the aging population of Europe is generating growing demand for creams and skin care products. There is also a rapidly expanding demand for natural and organic products across all age groups. Because of strong and rising consumption of cosmetic products in the European Union, cosmetic imports is projected to grow by 5-6 percent annually in 2010-2012, and thereafter accelerate to 7 percent a year.
5. Market Potential of Focal Sectors Needs to be Counter-Balanced with Compliance of Quality Requirements While the EU market offers enormous growth opportunities for Indonesian exporters, its regulatory environment has strict controls that are largely aimed at protecting consumers and the environment. Requirements covering security, technical, sanitary, phytosanitary, environmental and other regulations are generally harmonized among EU member countries. General regulations cover food and feed safety, environmental protection, marketing standards, product safety, technical standardisation,

4
packaging and labeling. Industry and product-specific requirements are also detailed in this study. This information is readily available and transparent to Indonesian exporters interested in selling their products in the EU market.
6. Indonesia is Well Positioned to Tackle Enormous Trade Potential with European UnionIndonesia has numerous advantages in the EU market that could help to reverse the under-representation of the EU market in its export portfolio. It has low labor costs and ready access to an abundance of resources. Its export prices to the EU market are generally competitive in local currency units, notwithstanding the undervalued currencies of other major suppliers that have undermined Indonesia’s price competitiveness in some products. With the likely re-alignment of currencies in the coming year, Indonesia’s stable currency will undoubtedly attract investors.
In the EU market, Indonesia is a beneficiary of trade preferences under the Generalized System of Preferences (GSP), which grants product imports into the European Union either duty-free access or tariff reductions. At present, almost 40 percent of Indonesia’s 13 billion Euros exports to the EU market are eligible for preferential treatment. Yet only about 3 billion Euros of those products are actually covered under the scheme, and they are mainly concentrated in the areas of telecommunications instruments, television and audio equipment, garments and footwear. There is therefore considerable scope for increased and broader use of the GSP facility by Indonesian exporters.
Government and business associations are facilitating private sector export growth to the European Union and elsewhere. The Government’s trade policy goals and priorities are to (i) improve the country’s business climate and regional competitiveness; (ii) attract greater foreign and domestic investment, especially in infrastructure and export sectors; and (iii) generate high-quality job growth needed for sustained economic development. To this end, the Government has been promoting bilateral, regional, and multilateral trade, with the aim of expanding international markets in the European Union and other markets.
Business associations have also provided extensive support to the private sector. However, for many small and medium size enterprises (SMEs) there remains a lack of awareness of EU market access requirements, product design needed for European customers, and available government support programs. Information dissemination by both Government and business associations is therefore an important means of ensuring that SMEs are able to successfully participate in value chains supplying the EU market.
7. Most Challenges for Indonesia are in Supply-Side Aspects, Especially the EQI SystemIndonesia has suffered important losses in EU market shares in the last decade. Our estimates of the export relationships in the focal industries suggest that those losses were largely due to non-price factors, including supply impediments from limitations in Export Quality Infrastructure (EQI). Export quality infrastructure is relevant for all products where importers require certain quality standards. For Indonesia’s exports to the EU market, EQI issues centre on the system used to meet EU import standards and requirements, certification of products and management systems, competence of laboratories related to export, accreditation of laboratories, metrology and inspection. Testing and accreditation difficulties are common issues for Indonesian industries, as are the inability of laboratories to perform all testing and analysis required by the European Union. As a result, accreditation by the large number of certification bodies in Indonesia is not always recognised internationally. While these issues are common to most Indonesian industries, EQI impediments generally tend to be industry-specific.
Apart from EQI limitations, major cross-sectoral obstacles remain in area like poor infrastructure, particularly road, electricity and logistics, as well as lack of marketing expertise and networking in extra-regional markets. SMEs confront great challenges in meeting EU standards since they often lack information and face excessively high costs in gaining those standards.
5INDONESIA TRADE ACCESS TO THE EUROPEAN UNION: OPPORTUNITIES AND CHALLENGES
Notwithstanding challenges in overcoming these obstacles, the results of this study point to the enormous export revenue gains that Indonesia could achieve if industries were to overcome EQI and other supply-related constraints and place their products in the EU market. For the five focal industries covered by this study, our estimates indicate that in the last decade the average revenue gain from exports to the EU market would have been 28 percent higher if those supply-constraints had been overcome. Industry-specific findings are striking:
Fisheries
o Non-Price Factors: Negative non-price effects on Indonesia’s export competitiveness in the EU market more than offset improvements in the relative price of the products themselves, thereby producing an overall reduction in Indonesia’s share of EU imports from third countries.
o EQI Issues: Quality and food safety improvements are needed in fish vessels, fishing ports and at landing sites, while in fish farming the presence of antibiotics in fishery products remains a major issue for Indonesia’s exports to the European Union.
o Potential for Increasing Exports: To the extent that Indonesia could have overcome its supply impediments on exports and maintained the same share of the EU fishery market that it reached in 2000, foreign exchange revenue from the industry during the last decade would have been nearly 20 percent higher in 2009 than was actually achieved.
Agri-Foods
o Non-Price Factors: Our estimates show that non-price factors in the last decade have reduced Indonesia’s share of the EU agri-foods market by 15 percent, while improvements in the industry’s competitive export prices helped to increase market shares by an average of 6 percent. The net relative price gains were therefore not sufficient to offset the negative effects from EQI and other supply-related factors affecting the industry’s performance.
o EQI Issues: The major impediments to bringing processing operations to the country are associated with SPS requirements in the EU market.
o Potential for Increasing Exports: If Indonesia had overcome its supply impediments on exports and maintained its agri-foods market share at the beginning of the last decade, the industry’s foreign exchange revenue would have been two-thirds higher than actual levels in the last ten years.
Consumer Electronics
o Non-Price Factors: Our estimates suggest that there has been a large reduction in the earlier negative effects from non-price factors associated with supply impediments. The improvement in supply conditions is likely to be associated with the growing influence of multinational enterprises in the country, and improved EQI conditions in the components industry.
o EQI Issues: EQI issues range from product design to components purchases, assembly and packaging.
o Potential for Increasing Exports: Had Indonesia overcome its supply impediments on exports and maintained its share of the EU consumer electronics market that it reached at the beginning of the last decade, foreign exchange revenue from the industry would have been nearly 10 percent higher in 2009 than was actually achieved.
Furniture
o Non-Price Factors: Indonesia’s market share losses in the European Union have been largely due to non-price factors associated with supply-side impediments, although price movements and exchange rate pass-through effects have also contributed to the decline. Our estimates suggest these non-price factors were responsible for about one-third of Indonesia’s losses of shares in the EU furniture market during the past decade.

6
o EQI Issues: EQI issues relate to the moisture content of woods to prevent cracking, standardisation of products, quality of the finished products, and safety testing.
o Potential for Increasing Exports: Had the industry overcome supply-side impediments and maintained its share of the EU furniture market in the middle of the last decade, the industry would have generated an additional 20 percent of foreign exchange revenue in 2005-2009.
Natural Cosmetics
o Non-Price Factors: The industry experienced market share losses from non-price factors associated with supply impediments like EQI limitations. On average, the negative effect from non-price factors outweighed positive gains from price factors, causing a large net reduction in Indonesia’s export market share of natural cosmetics and their ingredients in the EU market.
o EQI Issues: The most important EQI issue is the ingredients used in products, where EU rules apply maximum concentration rates of allowable ingredients.
o Potential for Increasing Exports: To the extent that Indonesia could have overcome its supply impediments on exports and maintained its cosmetics market share at the beginning of the decade, foreign exchange revenue from the industry would have been 40 percent higher in the first half of the decade, and more than 10 percent larger in the second half.
8. Compliance with EU Quality Requirements also Helps Indonesian Exports to Other Developed MarketsOvercoming EQI and other supply-side obstacles will require considerable effort on the part of the industry. However, compliance with EU quality requirements would help Indonesian exporters not only gain greater access to the EU market, but also expand exports to other developed markets.
The benefits to the industry are considerable, as are the economy-wide effects that would be produced from additional employment and expenditures on downstream and supporting industries. These effects are particularly important for SMEs, which tend to predominate in upstream activities and have the greatest difficulties in getting their products to foreign markets.

7INDONESIA TRADE ACCESS TO THE EUROPEAN UNION: OPPORTUNITIES AND CHALLENGES
1.1 BackgroundStudy Context: The Government of Indonesia under its National Long-Term Development Plan 2005–2025 envisions a high and inclusive economic growth as a means of achieving sustained prosperity for its people and the protection of its natural resources and environment. To achieve that object, Indonesia will need to achieve high export growth rates to drive its economic development. Yet the country’s exports since the 1997 Financial Crisis have not been as strong as many of the other countries in the region. In terms of overall export growth during the present decade, the country ranks 9th out of 12 developing Asian economies (Table 1.1). Indonesia’s exports to the European Union (EU) have fared about the same as other countries in the region. A number of internal and external constraints hinder the country’s export performance, some associated with trade-related policies and others with the country’s hard and soft infrastructure. Continued reliance on non-fuel primary commodity exports also reduces linkages in the economy. As a result, Indonesia has yet to reach its full potential in terms of producing and exporting higher value-added activities in key sectors, which could otherwise significantly enhance the development of its economy.
Purpose of the Study: The present Study examines the EU market potential and constraints to export development for priority sectors, with particular emphasis on Export Quality Infrastructure (EQI) issues. It has three specific aims. First, it seeks to identify export opportunities in the EU market in light of the country’s competitiveness in priority sectors and trade compatibility with that market. Second, it aims to identify challenges to the realization of the country’s export potential in terms of EU market entry requirements, EQI constraints, the conduciveness of its trade policy, and the support provided by business associations. Third, it intends to provide recommendations to relevant parties like the Government of Indonesia, the European Commission, and the business community on actions that would help the country to fully realize its export potential.
1.2 ChallengesConstraints: Indonesia has numerous potential export opportunities but it is also burdened by a range of difficulties that undermine the country’s human and resource-based comparative advantage in some industries and therefore its intrinsic international competitiveness. Some of the notable
1 Introduction
Table 1.1:Developing Asian Countries‘ Average Annual Growth of Exports to World and EU,2000-2009*
World EU
China 20.21% 16%
Cambodia 19.60% 12%
Myanmar 10.02% 10%
India 17.41% 10%
Brunei 8.93% 9%
Viet Nam 7.03% 9%
Lao PDR 7.18% 7%
Thailand 10.66% 4%
Indonesia 9.95% 3%
Singapore 10.02% 1%
Malaysia 7.18% 1%
Philippines 1.59% -4%
* Ranked by EU growth rates. Source: United Nations, COMTRADE database, and EU Eurostat databases.
Table 1.2:Exposure of Asian Countries to EU Market, 2009
Country Total Ex-ports
Exports to EU % Exposure
Cambodia 4,358 1,068 24.50%
India 176,765 35,408 20.00%
China 1,201,647 299,648 24.90%
Viet Nam 62,685 10,844 17.30%
Philippines 38,436 5,330 13.90%
Brunei 7,636 36 0.50%
Indonesia 116,510 16,239 13.90%
Thailand 152,497 19,914 13.10%
Malaysia 157,195 20,460 13.00%
Lao PDR 1,768 193 10.90%
Myanmar 2,045 219 10.70%
Singapore 269,832 20,356 7.50%
Note: Trade exposure is measured as the country’s exports to the European Union relative to total exports to all destinations.Source: United Nations, COMTRADE database, and EU Eurostat databases.
(million US$ and percent)
8
internal problems are (1) insufficient organizational resources for export marketing, especially for small and medium-size enterprises (SMEs); (2) lack of export financing; (3) problems in meeting importer quality standards; (4) insufficient information about overseas markets to help producers identify appropriate overseas distributors and communication networks with overseas customers; (5) product problems related to quality and technical requirements of the targeted export market segment, such as export product design, style, quality, packaging and labeling requirements and product adaptation or modification; and (6) lack of knowledge of foreign markets.1 Poor infrastructure is also commonly cited as a major obstacle to exports.2 Moreover, difficulties encountered in meeting product requirements in export markets like that of the European Union puts Indonesian exporters in a competitive disadvantage relative to more efficient competitors located in other countries.3
Challenges: The wide range of challenges facing the country’s exports naturally places high expectations on the ability of the present Study to cover all these issues for the focal industries. In this respect, it is important to emphasize that the Study focuses on the potential and constraints of that market from the EU market side, and on EQI constraints impeding exports from Indonesia to the EU market. By itself, the identification and ranking of these constraints can make a valuable contribution and complement parallel work being carried out by other organizations in areas related to trade and transport logistics.
Another notable challenge for present Study has been the need to address the interests of both Government and the business community. While both stakeholders share similar overall objectives related to exports, their focus differs significantly from one another. As a facilitator, the Government’s interest centers on economic and trade policies, the regulatory environment, hard and soft infrastructure, and standards and conformance needed to ensure compliance with rules established by international organizations and acceptance of conformity assessment results by trade partners on a global basis. In contrast, business interests tend to focus on a cost-based assessment of the steps needed to move their exports from the production site to the final destination abroad. The type of information needed by businesses therefore tends to be more practical and involves both a strategic component for competing in the market and a knowledge-based approach to complying with export procedures within the country and import requirements in the foreign market.
1.3 Coverage of Export Quality InfrastructureEQI Issues: Export quality infrastructure is relevant for all export products that are required certain quality standards by the importers. For Indonesia’s exports to the EU market, EQI issues center on the system used to meet EU import standards and requirements, certification of products and management systems, competence of laboratories related to export, accreditation of laboratories, metrology and inspection. Most of the laboratories operating in export-related activities are presently accredited. However, parameters related to testing procedures and sample matrices for proficiency testing requirements in the accreditation agencies are often not relevant for export products. For this reason, the Study Team has gathered information about laboratory competences and analyzed the information for the focal industries. Information has also been gathered about laboratory accreditation, proficiency tests and certified reference material. For products with an inspection system, especially foods, an assessment have been carried out.
Progress under TSP-I: Considerable progress was made under the EC’s Trade Support Programme (TSP-I) in supporting the identification, adaptation and dissemination of EU technical standards to the local industries. The Programme also helped to improve quality control processes and SPS
1. For a recent survey of problems facing SMEs in Indonesia, see H. Siringoringo et al. “Problems Faced by Small and Medium Business in Exporting Products”. Delhi Business Review, 10(2), July-December 2009. See also Sefnedi, “Exploring the Export Marketing Competency of Indonesian Manufacturing Exporting Firms”. Available: http://www.docstoc.com/docs/29262839/Exploring-the-Export-Marketing-Competency-of-Indonesian-Manufacturing-Exporting-Firms/ . For the case of shrimp exports, see R. Oktaviani and Erwidodo, “Indonesia’s Shrimp Exports: Meeting the Challenge of Quality Standards”. WTO Secretariat, Managing The Challenges Of Wto Participation: Case Study 18. Available: http://www.wto.org/english/res_e/booksp_e/casestudies_ e/case18_e.htm. For fruits and vegetables, see H.K. Purwadaria, “Issues and Solutions of Fresh Fruit Exports in Indonesia”. Available at http://www.unapcaem.org/Activities%20Files/A22/p32_IssuesIndonesia.pdf
2. See, for example, “Indonesia’s shoddy infrastructure threatens exports of produce”. Available: http://www.freshplaza.com/news_detail.asp?id=62622
3. See, for example, T. Tambunan, “The Growth and Competitiveness of Indonesia’s Wood Furniture Export”. Kadin Indonesia-Jetro, August 2006.
9INDONESIA TRADE ACCESS TO THE EUROPEAN UNION: OPPORTUNITIES AND CHALLENGES
compliance by Indonesian exporters. Despite progress observed in the capacity of competent authorities, much still remains to be done. Large impediments remain because of the fragmentation of responsibilities in public institutions charged with export quality issues, the absence of a well-integrated roadmap to improve the system, and insufficient interaction between public sector institutions and representatives of private sector interests in the export sector.
EQIs in Focal Industries: For the focal industries, the Study Team has identified the relevant technical, safety, sanitary and phytosanitary standards for export to the European Union. In carrying out this activity, we have mapped out the requirements involved in each step of the for each industry’s value chain, from raw material supplier to distributors. Particular attention has been given to the following EQI components:
Standards: Access to standards is critical to their use and implementation. SMEs, but also larger companies, often have difficulty accessing this information because the distribution channels are opaque and the information itself obscure or unintelligible to enterprises having limited knowledge capability. We have therefore investigated distribution channels and the extent to which information contained therein is readily available and the contents able to be understood by smaller, resource limited enterprises.
Quality Testing: We have examined and identified existing constraints in the use of laboratories engaged in quality testing, including those operated by producers, independent laboratories and government agencies. The specific obstacles identified were the availability of export quality testing procedures, quality assurance, accreditation, and metrology aspects.
Conformity Assessment: Certification bodies normally conduct conformity assessments based on the aforementioned laboratory results and standards. We have examined and identified constraints on the certification process for export-related products and management systems.
Inspection Agencies: We investigated product-specific inspection institutes where such institutes exist in order to identify possible constraints in their inspection and accreditation process.
Cross-sectoral accreditation issues: We examined the extent to which there exist constraints in cross-sectoral laboratory accreditation and certification bodies.
1.4 How EQI Relates to WTO’s TBT-SPS AgreementsExport Quality Infrastructure comprises export quality management and control, standardization, inspections and certification, rapid alert systems and market surveillance.4 The term is used extensively by the European Commission for Indonesia’s Trade Support Programme in assisting with the identification, adaptation and dissemination of EU technical standards to local industries and, in the case of Indonesia’s food exports, with the improvement of quality control processes and sanitary and phytosanitary (SPS) compliance.
TBT-SPS Agreements: Under the World Trade Organization (WTO), these EQI issues relate to market access conditions covered within two WTO Agreements. The first is the Agreement on Technical Barriers to Trade (TBT) and the second is the Agreement on Sanitary and Phytosanitary (SPS) Measures. Both TBT and SPS measures and regulations address standards and safety. The SPS Agreement deals with food safety and animal and plant health and safety, while the TBT Agreement generally addresses product standards. The SPS Agreement in particular covers (a) sanitary measures for human and animal health, and (b) phytosanitary measures for plant health that apply to domestically produced food or local animal and plant diseases, as well as to products coming from other countries. The TBT Agreement covers technical requirements like regulations on packaging and labeling, and it includes procedures to assess compliance with those requirements (known as conformity assessment procedures). The most-favored-nation (MFN) and national treatment provisions apply to conformity assessment procedures. Both agreements have provisions on control, inspection and approval procedures. If an exporting country like Indonesia can demonstrate that the measures it applies to its exports achieve the same level of standards and safety as in the importing country, then the importing country is expected to accept the exporting country’s standards and methods.
4. European Commission, “Commission Decision on the Annual Action Programme 2008 in favour of Indonesia to be financed under Article 19.100101 of the general budget of the European Communities”. Brussels, 2008.

10
EU Obligations: Under the TBT and SPS Agreements, the European Union is obliged to notify other WTO members of its technical regulations and conformity assessment procedures. The European Commission has established an enquiry point, known as the EC-TBT Enquiry Point, which is responsible for the TBT notification procedure in each Member State. Member States are responsible for notification, with the Commission not being involved at this stage.5 However, the European Communities do intervene when one Member State receives a comment from a third country.6 For SPS measures, the EC notification authority is the Health and Consumers Directorate-General, Directorate D - Animal Health and Welfare, D3 - International questions (multilateral).7
1.5 Study OutlineThe Study is organized into four broad parts:
Overview of the European Union as a trading partner and Indonesia’s export performance in that market, and the selection process for the Study’s focal industries (Chapters 2-4).
Analysis of the export potential in the EU market for Indonesia’s focal industries, including the outlook for EU imports of products originating from those industries, and market access conditions that are essential to Indonesia’s exporters (Chapters 4-7).
Review and assessment of Indonesia’s competitiveness in the EU market, obstacles confronted by exporters in accessing the market, including constraints hampering their exports and foreign exchange losses resulting from those difficulties, the facilitation of those exports through the Government’s policies and regulatory environment, and the availability of business support services for exporters (Chapters 8-12).
Detailed analysis on focal industries (Annexes A to E)
5. The database is available at the following site: http://ec.europa.eu/enterprise/tbt/index.cfm?fuseaction=Search.viewMenu&dspLang=EN
6. The European Commission responsible body is Enterprise and Industry Directorate-General, Rue de la Loi 200, Brussels 1049, Belgium. Tel: (+32 2) 295 18 60. Email: [email protected]. Web site: http://ec.europa.eu/comm/enterprise/tbt/.
7. The contact information is Commission européenne, B-1049 Bruxelles / Europese Commissie, B-1049 Brussel - Belgium. Telephone: (32-2) 299 11 11. Office: F101, 2/52. Telephone: direct line (32-2) 2968185.
11INDONESIA TRADE ACCESS TO THE EUROPEAN UNION: OPPORTUNITIES AND CHALLENGES
PART I:
TRADE PATTERNS


13INDONESIA TRADE ACCESS TO THE EUROPEAN UNION: OPPORTUNITIES AND CHALLENGES
2.1 Overview of the European UnionThe European Union is an economic and political entity made up of 27 member states and having a combined population of 500 million people.8 One of its greatest accomplishments has been the creation of a single market with free movement of labor, capital, goods and services. In achieving this level of integration, the European Union has formed a common market in which a common external tariff is applied by all member states. As such, it is recognized as a single entity by the World Trade Organization (WTO). Other forms of unification of economic policies have occurred in the adoption by all member countries of common legal and regulatory systems governing such areas as agriculture and fisheries. In some cases, however, only a subset of members have adopted common economic and monetary policies like those of the Euro-zone, where 16 of the 27 members have adopted the euro as their common currency.
As a single entity, the European Union is the largest economic power in the world, outranking that of the United States or Japan and China combined (Figure 2.1). Its gross domestic product (GDP) of US$16.5 trillion represents 29 percent of total world output.9 The European
2 The EU Market
Highlights of the European Union
• The European Union (EU) is the largest economic power in the world. Its GDP represents 29% of total world output.
• The 27 member states have a population of 500 million.
• Supranational institutions harmonize key policy areas governing free movements of labor, capital, goods and services among members.
• Imports of the single market represent 18% of world trade.
• Five western European countries account for 70% of total EU income and have high consumption levels.
• The European Union is home for 45 of the world’s 100 largest transnationals.
• Economic differences among member states provide a range of opportunities for foreign suppliers.
• Foreign companies networking with transnationals are providing higher value products that target the high-income consumers in those EU member states.
• Other foreign companies are directly supplying basic electronics, foodstuffs and consumer durables through-out Europe.
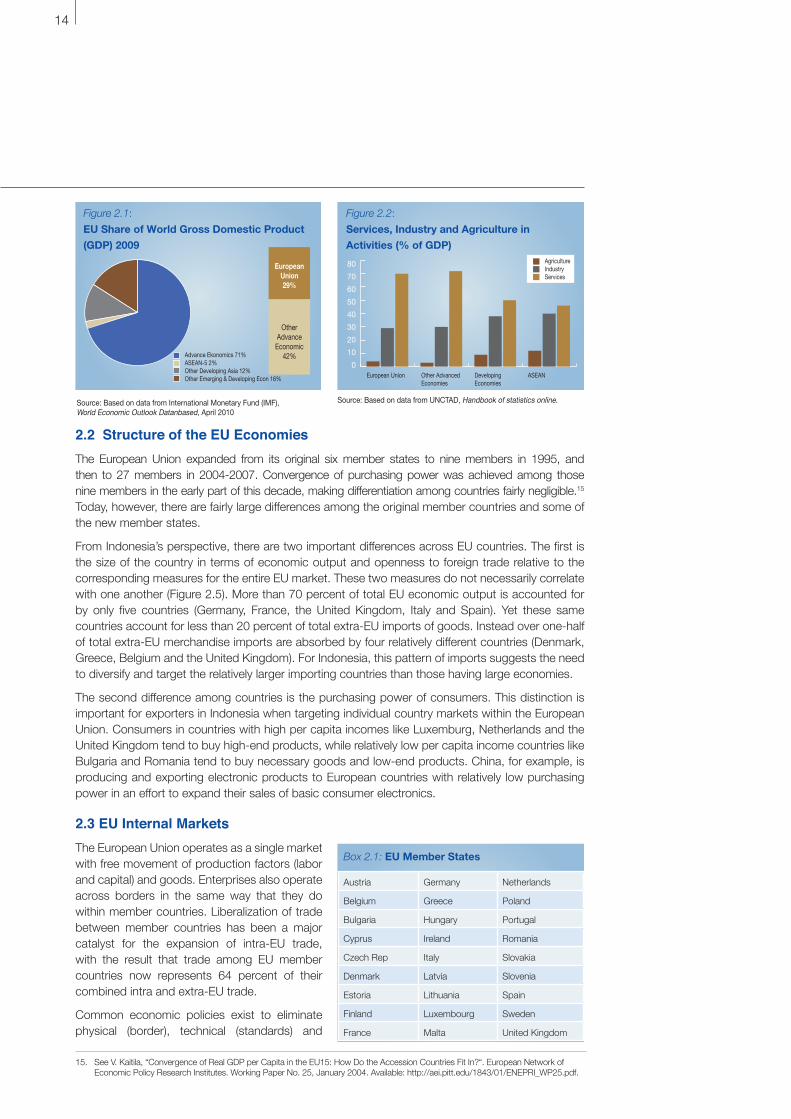
Union’s services sector contributes by far the most value added (74%) to the economy. Industrial and construction activity adds another 24 percent to total value added, and agriculture contributes the remaining 2 percent.10 The importance of services is similar to other advanced economies, whereas in developing and transition economies the agricultural and industrial sectors are normally more important (Figure 2.2). 11
With a total trade value relative to GDP of over 40 percent, the European Union’s openness to trade is greater than that of the United States (15%), Japan (17%) and Australia (25%).12 As a result, its importance as a global market is large. Total EU imported goods are about US$1.7 trillion, accounting for over 18 percent of total world trade (Figures 2.3 and 2.4).13 The main import partners are China, the United States, Russia, Switzerland and Norway. Together these five countries account for 52 percent of EU extra-regional imports.14 The ASEAN countries contribute 5 percent of all EU imports, with Indonesia accounting for 18 percent of that share. There are therefore large market opportunities for countries like Indonesia.
8. When first established under the Treaty of Rome in 1957, the European Economic Community (EEC) consisted of six member states. The Maastricht Treaty of 1993 defined the European Union (EU) and since then membership has grown to 27 countries. For details, see European Commission, “About the European Union”. Available: http://europa.eu/about-eu/index_en.htm.
9. Based on data for 2009 from International Monetary Fund, World Economic Outlook database (April 2010). Available: http://www.imf.org/external/pubs/ft/weo/2010/01/weodata/index.aspx.
10. Based on data for 2009 from Eurostat and Available: http://epp.eurostat.ec.europa.eu/portal/page/portal/statistics/search_database.
11. Based on data for 2008 from UNCTAD, Handbook of Statistics Online. Available: www.unctad.org/templates/Page.asp?intItemID=1890&lang=1
12. Trade to GDP ratio is estimated as an economy’s total trade of goods and commercial services (exports + imports, balance of payments basis) divided by GDP, on the basis of data for the three latest years available. GDP is measured in nominal terms and with market exchange rates. The measure of opennes is calculated using 2008 data, based on information from the OECD, “Country Statistical Profiles 2010“. Available: http://stats.oecd.org/Index.aspx?DataSetCode=CSP2010.
13. Based on data from WTO Secretariat, Statistical Database. Available: http://stat.wto.org/Home/WSDBHome.aspx?Language=E.
14. Based on data for 2009 from United Nations, COMTRADE database.
14
2.2 Structure of the EU EconomiesThe European Union expanded from its original six member states to nine members in 1995, and then to 27 members in 2004-2007. Convergence of purchasing power was achieved among those nine members in the early part of this decade, making differentiation among countries fairly negligible.15
Today, however, there are fairly large differences among the original member countries and some of the new member states.
From Indonesia’s perspective, there are two important differences across EU countries. The first is the size of the country in terms of economic output and openness to foreign trade relative to the corresponding measures for the entire EU market. These two measures do not necessarily correlate with one another (Figure 2.5). More than 70 percent of total EU economic output is accounted for by only five countries (Germany, France, the United Kingdom, Italy and Spain). Yet these same countries account for less than 20 percent of total extra-EU imports of goods. Instead over one-half of total extra-EU merchandise imports are absorbed by four relatively different countries (Denmark, Greece, Belgium and the United Kingdom). For Indonesia, this pattern of imports suggests the need to diversify and target the relatively larger importing countries than those having large economies.
The second difference among countries is the purchasing power of consumers. This distinction is important for exporters in Indonesia when targeting individual country markets within the European Union. Consumers in countries with high per capita incomes like Luxemburg, Netherlands and the United Kingdom tend to buy high-end products, while relatively low per capita income countries like Bulgaria and Romania tend to buy necessary goods and low-end products. China, for example, is producing and exporting electronic products to European countries with relatively low purchasing power in an effort to expand their sales of basic consumer electronics.
2.3 EU Internal MarketsThe European Union operates as a single market with free movement of production factors (labor and capital) and goods. Enterprises also operate across borders in the same way that they do within member countries. Liberalization of trade between member countries has been a major catalyst for the expansion of intra-EU trade, with the result that trade among EU member countries now represents 64 percent of their combined intra and extra-EU trade.
Common economic policies exist to eliminate physical (border), technical (standards) and
Figure 2.1:
EU Share of World Gross Domestic Product
(GDP) 2009
Advance Ekonomics 71%ASEAN-5 2%Other Developing Asia 12%Other Emerging & Developing Econ 16%
European Union29%
Other Advance Economic
42%
Source: Based on data from International Monetary Fund (IMF), World Economic Outlook Datanbased, April 2010
Figure 2.2:
Services, Industry and Agriculture in
Activities (% of GDP)
European Union Other Advanced Economies
Developing Economies
ASEAN
Source: Based on data from UNCTAD, Handbook of statistics online.
80
70
60
50
40
30
20
10
0
AgricultureIndustryServices
Box 2.1: EU Member States
Austria Germany Netherlands
Belgium Greece Poland
Bulgaria Hungary Portugal
Cyprus Ireland Romania
Czech Rep Italy Slovakia
Denmark Latvia Slovenia
Estoria Lithuania Spain
Finland Luxembourg Sweden
France Malta United Kingdom
15. See V. Kaitila, “Convergence of Real GDP per Capita in the EU15: How Do the Accession Countries Fit In?“. European Network of Economic Policy Research Institutes. Working Paper No. 25, January 2004. Available: http://aei.pitt.edu/1843/01/ENEPRI_WP25.pdf.

15INDONESIA TRADE ACCESS TO THE EUROPEAN UNION: OPPORTUNITIES AND CHALLENGES
fiscal (taxes) barriers. The European Union has competence over commercial policy, agriculture and fisheries, consumer protection, transport, common public health concerns, and monetary policy for the Euro-zone countries. It also operates a competition policy, or antitrust law, intended to ensure undistorted competition in the single market. That competitive policy aims to prevent cartels, monopolies and other anti-competitive practices that could render competition ineffectual both within the European Union and from actual or potential foreign suppliers to the market.16
Individual member countries cannot exercise control in the areas where the European Union has competence. Nonetheless individual countries can exercise control in areas such as policies related to industry, tourism, and social issues like health and education. Differences within the European Union can therefore arise because of the existence of remaining economic sovereignty, especially for those countries outside the Euro-zone. The resulting variations among EU countries are important for Indonesia’s suppliers to those markets in two ways. The first is in the differential demand for both inputs and consumer products across EU countries, and the second is in the supply sourcing of parts and components in value chains of multinational firms (MNFs) having distribution channels in Europe.
On the demand side, total consumption per inhabitant varies across EU member countries. Among the largest countries, however, there is considerable similarity in consumption levels (Figure 2.6).17 The index of consumption per capita averages 102 relative to the European Union as a whole, although some countries like the United Kingdom and Netherlands have high consumption levels. On the lower end, inhabitants of countries like Bulgaria and Romania consume half the amount as the European Union as a whole. For Indonesian suppliers to the EU market, these differences provide an indication of the overall strength of demand within the internal markets, which can be used in combination with information about the demand for specific products of interest to the supplier.
Source: Based on data from WTO Secretariat, International Trade Statistics.
Source: Based on data from European Commission, Eurostat database online.
Source: Based on data from WTO Secretariat, International Trade Statistics 2009.
Source: Based on data from European Commission, Eurostat database online.
Figure 2.5:GDP and Imports of Largest Member Countries (% of EU Total)
20%
15%
10%
5%
0%
Imports % of EUGDP % of EU
European UnionFrance U.K. Italy
Spain
NetherlandsBelgium
PolandSweden
AustriaGreece
Denmark
Figure 2.6:Consumption per Capita Index of Largest Counties (EU = 100)
U.K.Netherlands
FranceGermanyDenmark
AustriaSwedenBelgiumGreece
ItalySpain
Poland0 20 40 60 80 100 120 140 160
Figure 2.3:EU Share of World Imports of Goods, 2009
38%
15%6%7%
4%4%
3%3%
28%
European Union (27)United States Japan China Korea, Rep.ofCanada India Singapore Other
26%
15%
7%6%4%
4%3%
3%
32%
Figure 2.4:EU Share of World Imports of Services, 2009
Extra-EU (27) imports United States Japan China Korea, Rep.ofCanada India Singapore Other
16. For details, see the European Commissions web site on competition laws and regulations in the European Union. Available: http://ec.europa.eu/competition/index_en.html.
17. Measured by Actual Individual Consumption (AIC) per inhabitant. For detailes, see „Lars Svennebye, ”Large differences in GDP and consumption per inhabitant across Europe”. Eurostat Statistics in Focus, 95/2009. Available: http://epp.eurostat.ec.europa.eu/cache/ITY_OFFPUB/KS-SF-09-095/EN/KS-SF-09-095-EN.PDF.

16
On the supply side, the European Union is home to 45 of the top 100 transnational corporations in the world.18 The development of the EU single market and the rapid growth of South-East Asian economies have stimulated many of these transnational corporations to establish linkages with local producers in sectors that are of particular interest to Indonesia, for example, in chemicals, electrical equipment, food and beverage, motor vehicles, and pharmaceuticals. By integrating their supplies into global value chains, local Indonesian suppliers are increasingly becoming part of networks of cooperating firms that are involved in the full cycle of bringing a product to the final consumer. Arrangements between EU transnationals and local enterprises take the form of long-term contractual relationships, an equity arrangement, or outsourcing to local firms.19
2.4 EU Market PerformancesThe recent global financial crisis has given rise to concerns about Asia’s strong trade and financial linkages with the EU and US markets.20 Real GDP growth in the last ten years before the 2008 downturn averaged a modest 2.6 percent a year. Moreover, in 2008-2009 the 1.6 average annual contractions in the European Union were more severe than in most other areas of the world.21 Despite its poor domestic economic performance, the EU market has remained robust from the point of view of foreign suppliers, as overall merchandise imports have grown faster than those of the rest of the world (Figure 2.7). Indeed, between 2003 and 2008 the growth in the value of imports of the European Union averaged 12.8 percent.22 At this rate, EU imports outpaced those of the United States, Canada and Japan, and its import growth following the 2008 global financial crisis still continued to substantially exceed that of the other industrialized countries.
The European Union’s leading import sectors have been machinery and equipment, manufactures and, to a lesser extent, chemicals (Figure 2.8). Although raw material and foods represent a relatively small proportion of total imports, both of these sectors have experienced strong growth in the last decade. For every one percent increase in household incomes of the European Union, the overall demand for imports of goods and services has increased by 1.5 percent.23 But there has been considerable variation among the different types of goods imported. Chemical imports have experienced the highest response to income changes (1.8% expansion for every one percent increase in income), followed by manufactures and raw materials (both 1.6%), while foods have a relatively small responsiveness of 1.2 percent for every one percent change in EU income.
Figure 2.7:EU and Rest-of-World Imports(Percent change of US dollars)
25%
20%
15%
10% 2003 2004 2005 2006 2007 2008
Extra-EU Imports
Rest-of-World Imports
Figure 2.8:EU Imports by Type (billions of Euros)
1,000
750
500
250
02000 2003 2006 2009
Machinery & Equipment
Manufactures
ChemicalRaw Materials
Foods
Source: Based on data from WTO Secretariat. Source: European Commission, Eurostat database online.
18. UNCTAD, Foreign Investment Report 2009. Geneva, 2010. Annex A: Table A.I.11. Available: http://www.unctad.org/sections/dite_dir/docs/wir2009top100_dev_en.pdf
19. For details of the EU international sourcing, including a survey according to generic business functions, see European Union, International Sourcing. Available: http://epp.eurostat.ec.europa.eu/portal/page/portal/european_business/special_topics/international_sourcing.
20. For a recent review from the Asian perspective, see M. Lord, ”Is Asian Integration Sheltering the Region from the Crisis?”. Background Discussion Paper for DG ECFIN 6th Annual Research Conference: Crisis and Reform. December 2009.
21. Based on data for 2009 from International Monetary Fund, World Economic Outlook database (April 2010). Available: http://www.imf.org/external/pubs/ft/weo/2010/01/weodata/index.aspx.
22. Based on data from WTO Secretariat, Statistical Database. Imports of the European Union refer to extra-EU imports. Available: http://stat.wto.org/Home/WSDBHome.aspx?Language=E.
23. Estimates of the so-called „income elasticities of demand for imports“ are based on log-linear estimates of extra-EU imports and GDP in 1999-2008 for total imports and major product categories.

17INDONESIA TRADE ACCESS TO THE EUROPEAN UNION: OPPORTUNITIES AND CHALLENGES
Indonesia’s decline in its share of exports to the European Union in the last decade was paralleled by similar declines in the US and Japanese markets. While the share of exports to the EU market fell from 18 percent to 14 percent, that of exports to the US and Japanese markets fell from 23 to 16 percent and 14 to 9 percent. Together these three markets had absorbed nearly 55 percent of Indonesia’s exports in 2000 and by 2009 that share had fallen to under 40 percent. The bulk of this trade was diverted to the ASEAN regional market.
2.5 Regulatory Environment
2.5.1 EU Institutions and Decision-Making Processes in Trade-Related Matters
The European Union (EU) is a treaty-based, institutional framework that defines and manages economic and political cooperation among its 27 member states. The European Commission (EC) acts as the executive of the European Union. It is responsible for proposing legislation, implementing decisions, upholding the Union’s treaties and the day-to-day running of the European Union. The Commission is based in Brussels, but it also has offices in Luxembourg and representations in all EU member states. The role of the European Commission is to represent the common European interest to all the EU countries by participating in the decision-making process, including presenting proposals for European law, overseeing the correct implementation of the Treaties and European law, and carrying out common policies and managing funds. The Commission is also responsible for putting the European Union’s common policies like the Common Agricultural Policy into practice and managing the European Union’s budget and programs. The Directorate General for Trade of the European Commission is in charge of implementing the common trade policy of the European Union.
The Treaty on the European Union (as amended by the Treaty of Amsterdam and the Lisbon Treaty) sets down rules for situations where some Member States wish to proceed with cooperation in a specific area. This is known as ‘enhanced cooperation’. Enhanced cooperation means that a group of countries can act together without all 27 necessarily participating. It allows Member States to remain outside if they do not wish to join, without stopping other Member States from acting together. Examples of enhanced cooperation include the Euro zone and the Schengen agreement.24The Lisbon Treaty, which came into force in December 2009, reforms the European Union’s governing institutions and decision-making processes to enable the larger European Union to operate more effectively.25 One of the main objectives of the Lisbon Treaty is to increase the coherence and the efficiency of the European Union’s external action. To that end, the Lisbon Treaty brings the current European Commission’s external trade policies together in a more comprehensive manner. All elements of the EU’s external action are now submitted to the same principles and objectives, which include inter alia human rights, good governance, environmental protection and sustainable development. It implies that in formulating its trade policy, the Commission must not only consider the economic liberalization agenda, but also other objectives.
To increase the accountability of the EU trade policy, the Lisbon Treaty gives more power to the European Parliament in scrutinizing trade policy.26 EU legislation for implementing trade policies will now be co-decided by the European Council and the European Parliament.27 Furthermore, the Commission has to report regularly to the Special Committee of the EP on the progress of trade negotiations, and more importantly, the Parliament must give consent before a trade agreement can be adopted. However, powers to authorize the Commission to engage in trade negotiations belong exclusively to the Council.
24. See http://europa.eu/legislation_summaries/justice_freedom_security/free_movement_of _persons_asylum_immigration/l33020_en.htm
25. This material draws on http://www.eucentre.sg/articles/141/downloads/LisbonImpactonTrade-rev6Mar.pdf
26. The European Parliament consists of 785 members elected in each member state for five-year terms. The Parliament cannot enact laws like national parliaments, but it shares “co-decision” power in some areas with the Council of Ministers and can amend or reject the EU’s budget.
27. The Council of the European Union (Council of Ministers) is comprised of ministers from the national governments. As the main decision-making body, it enacts legislation based on proposals put forward by the Commission.

18
Since the implementation of the Lisbon Treaty, trade in goods and services, commercial aspects of intellectual property and foreign direct investment all fall under the exclusive competence of the European Union. Member states (MS) are no longer able to conclude its own bilateral investment treaties (BIT) unless they are empowered by the European Union to do so. All these changes to bring trade in goods and services and FDI under the exclusive competence of the EU are expected to contribute to a streamlining of the trade policy. Future trade agreements concluded by the European Union are likely to be comprehensive economic agreements covering all aspects of trade and investments.
2.5.2 Regulations and Restrictions on EU Imports
The EU market is often regarded as difficult to enter because of its regulations and restrictions on imports. Proponents of this view argue that the proportion of Indonesia’s exports directed to the European Union has fallen from around 14 percent at the beginning of the decade to around 10 percent at present as exporters seek easier markets. Indonesia’s declining share of exports directed to the EU market is, however, more a reflection of growing intra-ASEAN trade than it is of EU market access difficulties. Its exports to ASEAN member countries plus China have risen from 23 percent in 2000 to around 30 percent presently.28 Because of this phenomenon, there has been a substantial decline in the proportion of Indonesia’s total exports directed not only to Europe, but also North America, Japan and other regions of the world.
The European Union’s trade regime comprises tariff and non-tariff measures. The average ad valorem MFN tariff is 6.7 percent, with the highest rates applying to agricultural products. However, there are wide ranging preferential trade arrangements with non-ad valorem rates applying to about 10 percent of all tariff lines, mainly for agricultural products. These same products are in many instances subject to tariff quotas. Value-added tax and excise duties apply to imports and locally produced goods, but the rates are not harmonized among member countries. Customs procedures are applied uniformly across member countries based on a new Modernized Customs Code (MCC) that is being implemented between 2009 and 2013.
Requirements covering security, technical, sanitary, phytosanitary, environmental and other regulations are generally harmonized among EU member countries. Import licenses exist in cases where products are subject to quantitative restrictions, tariff quotas, safeguards or import monitoring and surveillance. Some non-agricultural products, including textile products, are subject to quantitative restrictions. According to the WTO Secretariat, there are about 140 technical requirements applied by the European Union and individual member state governments.29 The following are the general regulations and requirements of major interest to Indonesia exporters:30 31
Food and Feed Safety: The EU legislation on food safety protects human health and consumers’ interests. Animal feed regulations ensure the protection of both human and animal health as well as environmental protection. Importers of food and feed products must register the product source and country of origin in order to comply with traceability requirements. They must also report any residues, pesticides, veterinary medicines and contamination with trace substances in food. Special rules apply to genetically modified food and feed as well as foodstuffs for particular nutritional purposes. Food and feed safety also incorporates marketing and labeling requirements. The European Commission can implement protective measures when there is a possibility that a product can represent a serious risk to human or animal health or the environment. In some cases, enforcement of these measures includes the suspension of imports.
Environment Protection: The EU considers the environment a central priority, and all relevant EU policies therefore incorporate environment protection standards. There are four primary areas of concern: climate change, nature and biodiversity, environment and health, and sustainable
28. Based on data from ASEAN Secretariat external trade statistics. Available: http://www.aseansec.org/18137.htm.
29. WTO Secretariat, “Trade Policy Review: Report of the Secretariat. European Communities, Revised“. Geneva, 8 June 2009, WT/TPR/S/214/Rev.1.
30. Information based on European Commission Helpdesk for developing countries. Available: exporthelp.europa.eu.
31. Further details on the industries covered by this study are presented in Chapter 7 on market access issues for Indonesian exports and in the industry-specific annexes.

19INDONESIA TRADE ACCESS TO THE EUROPEAN UNION: OPPORTUNITIES AND CHALLENGES
management of natural resources and waste. These areas of concern may affect Indonesian exporters particularly in the following aspects:
o Chemicals: Imports of certain dangerous chemicals and persistent organic pollutants (POPs) are subject to control measures. The Registration, Evaluation, Authorization and Restriction of Chemicals (REACH) system was implemented in December 2006, and it applies to all chemicals. The European Chemicals Agency (ECHA) is responsible for the implementation of REACH in a manner that ensures consistency in the management of chemicals across the European Union.
o Classification, Packaging and Labeling of Dangerous Substances and Preparations: The European Commission requires the identification, labeling and packaging of the intrinsic chemicals hazards in manufactured or imported products.
o Plant Protection Products and Biocidal Products: The European Commission authorizes the placing of a plant protection product in the EU market, and biocidal products are subject to specific entry requirements.
o Packaging Waste: Another concern is the packaging waste of imports. The European Commission establishes requirements about the composition and re-use of packaging of products to be marketed in the European Union. Packaging must have appropriate markings to identify the purpose and nature of its packaging materials.
o Waste Electrical and Electronic Equipment (WEEE): Prevention of hazardous waste and the promotion of reuse, recycling and other forms of recover in electrical and electronic equipment
Marketing Standards for Agricultural and Fishery Products: For agricultural and fishery products, the European Commission has established marketing standards to assure the same level of quality for all fresh agricultural and fishery products in the EU market. Agricultural products standards require that products be fresh and have a minimum level of tolerance. Fishery products must comply with marketing standards on quality, size or weight, packing, presentation and labeling. Imported agricultural and fishery products must also comply with marketing standards through documental and physical inspections. As a voluntary scheme, organic production is subject to regulations on organic farming, which aims to provide environmental conservation and to promote quality products. If they meet organic standards, organic products can display the EU farming logo, which classifies the product as having satisfied organic standards.
Product Safety: Any products to be imported into the EU must comply with regulations of General Product Safety. Manufacturers and distributors are required to inform consumers of any potential product risks. They must also notify the appropriate authorities of hazardous products. The General Product Safety Directive applies to sectors like cosmetics, pharmaceuticals, and industrial products (for example, chemicals and electrical equipment). Inedible products that could be confused with food by their appearance, smell or packaging cannot be marketed, imported or manufactured in the European Union.
Technical Standardization: Technical harmonization aims to remove technical barriers. Since 1985 a new approach to technical harmonization and standards applies general rules, conformity assessment procedures, and the CE marking. The New Approach Directives address health and safety requirements, while the Global Approach Directives establish conformity assessment procedures. Certain sectors are still covered by the Old Approach Directives, including foodstuffs, motor vehicles, chemicals, cosmetics, detergents, biocides and pharmaceutical sectors. The modernization under the New Approach is intended to remove any obstacles to the circulation of products, while ensuring product safety in the EU market.
Three independent standardization bodies are charged with the implementation of the New Approach Directives: the European Committee for Standardization (CEN), the European Committee for Electrotechnical Standardization (CENELEC) and the European Telecommunications Standards Institute (ETSI). The directives are limited to the essential requirements of the EU market, like health,

20
safety, consumer and environmental protection. However, the application of harmonized standards is voluntary. Global Approach Directives set up procedures that evaluate whether the conformity of products comply with the essential requirements of the technical harmonization directives. The conformity assessment is conducted by the manufacturer or an independent agent.
Producers can affix the CE marking on their products to indicate compliance with the essential requirements of all applicable directives and their completion of the conformity assessment procedure. This process enables them to place their products in the EU market. Each Member State is responsible for checking whether the products use the CE marking correctly. Surveillance of the use of the CE marking on products is conducted through documentary checks and/or physical inspections.
Packaging: The general requirements on packaging aim to protect the environment and consumer health. They cover recycling materials, packaging waste prevention, size, nominal quantities and capacities, and the composition and constituents of materials that come in contact with foodstuffs. Any packaging made of wood or other plant products is subject to phytosanitary measures.
Labeling: The EU labeling requirements aim to protect consumers’ health and provide information to end users. Imported products must comply with labeling requirements in order to be marketed within the European Union. The EU Eco-label (a “Flower logo”) is a voluntary label affixed on products. It plays a significant role in improving key environmental aspects and advising consumers about the environmental impact of its products.
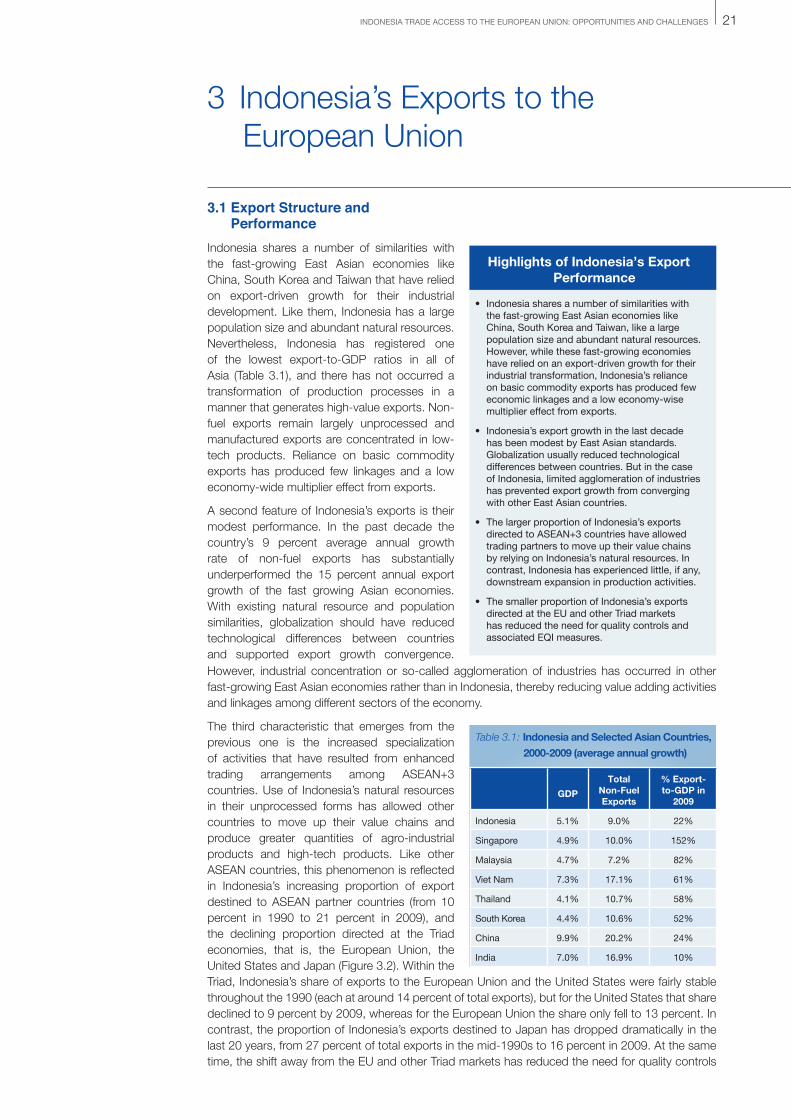
21INDONESIA TRADE ACCESS TO THE EUROPEAN UNION: OPPORTUNITIES AND CHALLENGES
However, industrial concentration or so-called agglomeration of industries has occurred in other fast-growing East Asian economies rather than in Indonesia, thereby reducing value adding activities and linkages among different sectors of the economy.
The third characteristic that emerges from the previous one is the increased specialization of activities that have resulted from enhanced trading arrangements among ASEAN+3 countries. Use of Indonesia’s natural resources in their unprocessed forms has allowed other countries to move up their value chains and produce greater quantities of agro-industrial products and high-tech products. Like other ASEAN countries, this phenomenon is reflected in Indonesia’s increasing proportion of export destined to ASEAN partner countries (from 10 percent in 1990 to 21 percent in 2009), and the declining proportion directed at the Triad economies, that is, the European Union, the United States and Japan (Figure 3.2). Within the Triad, Indonesia’s share of exports to the European Union and the United States were fairly stable throughout the 1990 (each at around 14 percent of total exports), but for the United States that share declined to 9 percent by 2009, whereas for the European Union the share only fell to 13 percent. In contrast, the proportion of Indonesia’s exports destined to Japan has dropped dramatically in the last 20 years, from 27 percent of total exports in the mid-1990s to 16 percent in 2009. At the same time, the shift away from the EU and other Triad markets has reduced the need for quality controls
3.1 Export Structure and PerformanceIndonesia shares a number of similarities with the fast-growing East Asian economies like China, South Korea and Taiwan that have relied on export-driven growth for their industrial development. Like them, Indonesia has a large population size and abundant natural resources. Nevertheless, Indonesia has registered one of the lowest export-to-GDP ratios in all of Asia (Table 3.1), and there has not occurred a transformation of production processes in a manner that generates high-value exports. Non-fuel exports remain largely unprocessed and manufactured exports are concentrated in low-tech products. Reliance on basic commodity exports has produced few linkages and a low economy-wide multiplier effect from exports.
A second feature of Indonesia’s exports is their modest performance. In the past decade the country’s 9 percent average annual growth rate of non-fuel exports has substantially underperformed the 15 percent annual export growth of the fast growing Asian economies. With existing natural resource and population similarities, globalization should have reduced technological differences between countries and supported export growth convergence.
3 Indonesia’s Exports to the European Union
Table 3.1: Indonesia and Selected Asian Countries,
2000-2009 (average annual growth)
GDP
Total Non-Fuel Exports
% Export-to-GDP in
2009
Indonesia 5.1% 9.0% 22%
Singapore 4.9% 10.0% 152%
Malaysia 4.7% 7.2% 82%
Viet Nam 7.3% 17.1% 61%
Thailand 4.1% 10.7% 58%
South Korea 4.4% 10.6% 52%
China 9.9% 20.2% 24%
India 7.0% 16.9% 10%
Highlights of Indonesia’s Export Performance
• Indonesia shares a number of similarities with the fast-growing East Asian economies like China, South Korea and Taiwan, like a large population size and abundant natural resources. However, while these fast-growing economies have relied on an export-driven growth for their industrial transformation, Indonesia’s reliance on basic commodity exports has produced few economic linkages and a low economy-wise multiplier effect from exports.
• Indonesia’s export growth in the last decade has been modest by East Asian standards. Globalization usually reduced technological differences between countries. But in the case of Indonesia, limited agglomeration of industries has prevented export growth from converging with other East Asian countries.
• The larger proportion of Indonesia’s exports directed to ASEAN+3 countries have allowed trading partners to move up their value chains by relying on Indonesia’s natural resources. In contrast, Indonesia has experienced little, if any, downstream expansion in production activities.
• The smaller proportion of Indonesia’s exports directed at the EU and other Triad markets has reduced the need for quality controls and associated EQI measures.

22
on exportable production activities that would otherwise be required to enter those markets. Unlike Indonesia, China has shifted its production to higher-value products and increased the share of its exports destined to the EU market, improving quality controls and standards on its products to meet the essential standards in the European Union.
The final noteworthy feature is Indonesia’s continued reliance on unprocessed exports. Based on conventional classification of goods according to stages of production, nearly 40 percent of the country’s non-fuel exports are in the form of unprocessed goods (Figure 3.3).32 In contrast, the fast-growing East Asian Economies concentrate a much larger proportion of their exports on manufactured products than does Indonesia (Figure 3.4).
3.2 Indonesia’s Exports to EU CountriesThere have been important shifts in Indonesia’s exports among the EU member states. At the beginning of this decade, the United Kingdom was Indonesia’s second most important market after the Netherlands. By 2009, however, the United Kingdom ranked as the sixth most important market and Germany had taken the second place position. Italy’s absorption of Indonesian exports to the European Union rose from 8 to 12 percent during the period. Spain now ranks as the third most important market, having increased its share from 10 to 13 percent.
Perhaps more significant than these shifts over the long run has been the enlargement of the EU market. Ten countries joined the European Union in 2004 and another two members joined in 2007. These countries were all from Eastern Europe and already existed as exports markets for Indonesia. Following their incorporation into the European Union, Indonesia’s exports to them expanded from 3 to 5 percent of all exports to the EU market as a whole.
The combination of these changes has impacted on the economic growth differentials among EU member states, the types of goods imported by different member states, especially between the larger and more advanced Western European countries and those in Eastern Europe, and the responsiveness of demand for foreign goods associated with changes in domestic incomes.
3.3 Indonesian-EU Trade CompatibilityOne way to identify potential trade opportunities for Indonesian exporters in the EU market is to measure the degree of compatibility between Indonesia’s exported products and those products imported by the European Union. Having established compatibility of traded products, it is then possible to apply performance indicators to reveal the extent to which Indonesian exporters have effectively competed in different EU product markets. Success in export markets – measured by rapidly expanding exports and rising market shares – provides guidance on the way that Indonesia could develop fast-growing exports into the EU market.
Figure 3.2:Geographic Distribution of Indonesia’s Exports 1990-2009
100%
75%
50%
25%
01990 1995 2000 2005 2009
Triad
ASEAN
Other
Source: United Nations, Comtrade database. Source: United Nations, Comtrade database.
Figure 3.1:Major Product Groupings of Indonesia’s Exports 1990-2009
1,000
750
500
250
02000 2003 2006 2009
Machinery & Equipment
Manufactures
ChemicalRaw Materials
Foods
32. Based on Indonesia’s exports using the SITC system, which classifies products according to stages of production. Unprocessed non-fuel products are SITC 0+1+2+4+68+667+971; fuels are SITC 3; manufactured goods (are ITC 5 to 8 less 667 and 68.

23INDONESIA TRADE ACCESS TO THE EUROPEAN UNION: OPPORTUNITIES AND CHALLENGES
The analysis of Indonesia’s trade compatibility with the European Union covers (a) all non-fuel exports of Indonesia; (b) product-specific performance measures at the 4-digit Harmonized System (HS) level;33 and (c) data analysis based on the last 10-year period for which data are available. The products are divided into the following three types: (a) large non-fuel exports, defined as those non-fuel products that generated at least US$500 million in the most recent year for which data were available (there were 27 products in this range); (b) medium-size exports, whose non-fuel product export value represented between US$250 and 499 million (there are 43 products in this range); and (c) small-size exports of between US$150 and 249 million (there are 42 products in this range). The resulting 112 products represent 50 percent of Indonesia’s total non-fuel exports.
The trade compatibility index measures the similarity between Indonesia’s exported products and products imported by the European Union.34 The index approaches zero when Indonesia exports none of what the European Union imports, and it approaches unity when the exports share of product i of Indonesia is identical to the import share of that product by the European Union. The index of compatibility is usually between 0.50 and 0.60 for trade between industrialized countries, and it averages about 0.20 for trade between developing countries.35
In the case of Indonesia’s export patterns and EU imports patterns, the index of trade compatibility across products equals 0.53, suggesting a relatively high degree of compatibility. However, there is greater compatibility among the medium and smaller size exports than among Indonesia’s large traditional exports like processed and unprocessed palm oil, rubber and copper ores (Table 3.2). These aggregate results, however, obscure a number of cases where Indonesia’s traditional raw material exports are indeed compatible with EU import patterns, a situation demonstrated in the section below matching high-growth exports with dynamic EU imports. The category of smaller-size exports includes a broad set of products that range from fishery products and spices to jewelry, textiles, machinery parts and electrical appliances. There are also a large number of products that are highly compatible with EU import requirements among the large and medium-size exports of Indonesia, including processed food products, wood joinery and carpentry products, plywood, and wooden furniture.
Table 3.2: Trade Compatibility Index between
Indonesian Exports and EU Imports
Indonesian Exports Index
Large-Size 0.30
Medium-Size 0.70
Emerging 0.59
Note: see text for explanation.
Figure 3.3:Indonesia’s Exports by Stages of Production, 2009
Fuels 29%
Chemical Products 5%
Machinery & Equipment 13%
Other Manufactures 21%
Unprocessed Non-Fuels
33%
Manufactures8%
Figure 3.4:Non-Fuel Unprocessed vs Manufactured Exports of Indonesia and Fast-Growing East Asian Economies, 2009
Indonesia
South Korea
China
Singapore
Thailand
Vietnam
0% 25% 50% 75% 100%
Manufactures Non-Fuel Primary Commodities
Source: United Nations, Comtrade database. Source: United Nations, Comtrade database.
33. Disaggregation at the HS 6-digit level yielded excessively high year-to-year variations and therefore poor trend performance indicators.
34. The index of compatibility (Cx/m) is computed using the following formula: Cx/m = 1 – (∑|xjd - mus|)/2, where xjd is Indonesia’s share of good i exports relative to its total exports, and mus is the share of EU good i imports relative to its total imports.
35. Michaely, M. (2000), “Trade Expansion in the Andean Group”. Mimeo. Washington, DC, The World Bank.

24
3.4 Indonesia’s Exports of the European Union’s Top ImportsAnother way to measure export opportunities to the EU market is to examine whether Indonesia is exporting the types of products most demanded by consumers and manufacturers in the European Union. Table 3.3 shows a mapping of the European Union’s top non-fuel imported products with the importance of those same products to Indonesia’s exports. There are just over 100 products that in 2009 jointly ranked among the top 1000 EU imports and account for at least US$100 million of Indonesia’s exports to all destinations.
The sectors having the largest number of matching EU imports and Indonesian exports are machinery and electronic equipment, textiles, transport equipment and chemical products. Together these four sectors account for 60 percent of the top imported products that are important exports of Indonesia. Other sectors having Indonesian product exports matching the top EU imports are plastics, rubber, base metals, pulp and paper, and prepared foods.
3.5 Matching High-Growth Exports with Dynamic EU ImportsThe third way to measure export opportunities to the EU market is to examine whether Indonesia’s exports have been directed at dynamic product markets and, if so, whether exporters have been expanding their activities in those markets. The potential growth of firms and industries in the world market and the EU market in particular are reflected in high rates of export growth and rising market shares. This type of analysis is suggestive of the actual or potential penetration into dynamic markets for Indonesian exporters.36
3.5.1 Measuring Penetration in Different Types of Markets
Indonesia’s export growth in different types of product markets in the EU market has been measured by the trend growth rate of product exports in the three product categories (large, medium and smaller exports), and the ratio of product exports relative to EU imports of those products. The export performance of Indonesia has been classified into the following four categories:
Exploited Market Opportunities: Products in which Indonesia has a rising market share and EU imports are expanding.
Increased Penetration in Stagnating Markets: Products in which Indonesia has a rising market share but EU imports are contracting.
Missed Markets Opportunities: Products in which Indonesia has a falling market share despite expanding EU imports.
Reduced Penetration in Stagnating Markets: Products in which Indonesia’s market share is falling and EU market is contracting.
36. The methodology was developed by the United Nations Economic Commission for Latin America (ECLAC) and applied to its Competitiveness Analysis of Nations (TradeCAN) software. Available: http://extop-workflow.worldbank.org/extop/ecommerce/catalog/product?context=drilldown&item_id=893378
Table 3.3. Summary of Matched between
EU Top 1000 Import and Top Products on
Indonesian Export (exceeding US$100 mils
US$) in 2008
HS Section Product Matches a/
1+2 Animal and vegetable 2
3 Fats and oils 3
4 Prepared foods 5
5 Mineral products 8
6 Chemical products 7
7 Plastics and rubber 7
9 Wood & its products 4
10 Pulp and paper 6
11 Textiles 15
12 Footwear 2
14 Semi-precious stones 3
15 Base metals 7
16 Machinery & equip. 23
127 Transport equipment 8
20 Misc manufactures 2
Total 102
Source: Derived from data in United Nations, COMTRADE database.
25INDONESIA TRADE ACCESS TO THE EUROPEAN UNION: OPPORTUNITIES AND CHALLENGES
The most desirable situation is for Indonesian exporters to be involved in either exploited market opportunities, where their products have made headway into dynamic markets, or missed market opportunities, where there is strong export growth potential if they improve their competitiveness and satisfy market access requirements.
3.5.2 Indonesia’s Smaller-Size Exports
Among Indonesia’s relatively smaller-size exports, machinery parts are the predominant type of products with rapidly growing EU markets where Indonesian producers have increased their penetration (Figure 3.5). Import growth rates in the European Union have ranged from 10 to 15 percent a year for these products, while Indonesia’s exports have grown between 25 and 50 percent a year during the last decade. Among the rapidly growing markets where Indonesian exporters have lost market shares because of sluggish exports are fresh and processed fish and foods, footwear, jewelry, and bicycle and motorcycle parts. In contrast, exports have grown rapidly in markets with relatively slow or stagnant EU markets, notably fresh animal products, rubber articles, and low-tech machinery and electronic products. Finally, stagnant EU markets with slow-growing Indonesian exports include fresh and chilled fish, cement, plastics and paper.
3.5.3 Indonesia’s Medium-Size Exports
Among medium-size exports, processed foods, chemicals, textiles and machinery and electronic equipment have high-growth EU markets where Indonesian exporters have increased their market penetration. Other fast-growing EU markets where Indonesian exporters have failed to increase their market shares are cocoa products (processed foods); acyclic alcohols, soaps and amino-compounds (chemicals), plastic containers (plastics); t-shirts; electric motors and generators and television and radio parts (electronics); and seats (furniture). Indonesian exporters have increased rapidly in a number of slow or stagnant EU markets: prepared crustaceans and mollusks, cigars and cigarettes, plastic plates, footwear with uppers of textiles, electric transformers and accumulators, radios and electrical switches. In other stagnating markets like those of finished clothing, batteries, low-tech audio equipment, and plastics, Indonesian exporters have reduced their market shares.
3.5.4 Indonesia’s Large-Size Exports
Among large-size exports, parts for motor vehicles, refined copper and nickel metallurgy, tires, copper ore and concentrates and palm oil have fast-growing EU markets where Indonesian exports have also expanded rapidly. In contrast, Indonesian exports have been sluggish in the fast-growing markets for furniture, motor vehicles, unprocessed crustaceans, coffee, plywood, footwear with leather uppers. Exports have, however, expanded rapidly in several slow-growing or stagnant EU markets: margarine and fatty acids (animal and vegetable fats); cocoa beans; nickel ores; ammonia (chemicals); iron rods and copper wire (minerals); and wire insulation.
3.5.5 Emerging Patterns
The pattern that emerges is one in which certain sectors like prepared foods, high-tech machinery and electronic equipment, and transportation equipment have strong growth markets in the European Union, while other markets are mixed. In those markets without a clear sector-wide growth pattern, there exist strong markets for some furniture and other wood products, different types of footwear, certain chemical products, and jewelry. In general, primary commodities have less dynamic markets than processed goods, as for example in the case of unprocessed fruits and vegetables versus processed food products, unprocessed versus processed metals, minerals and chemicals, and lumber and unfinished wood versus wood products and furniture.

26
Smaller-Size Exports
Increased Penetration in Stagnating Markets Exploited Market Opportunities
Milk and cream, concentrated 0402 Processed animal, vegetable oils 1518
Rubber clothing and accessories 4015 Aluminium ores and concentrates 2606
Paper, household, sanitary 4803 Gasoline and oil additives 3811
Yarn, artificial staple fibre 5510 Copper, copper alloy, waste or scrap 7404
Mens, boys suits,jackets,trousers 6103 Aluminium plates, sheets 7606
Refrigerators, freezers 8418 Parts for internal combustion engines 8409
Ignition/starter equipment 8511 Air, vacuum pumps, compressors 8414
Parts of audio, video equipment 8522 Electrical power, control board 8537
Electrical capacitors 8532 Diodes, transistors, semi-conductors 8541
Electric filament for lamps 8539 Tugs and pusher craft 8904
Thermionic and cold cathodes 8540 Musical instruments electrical 9207
Reduced Penetration in Stagnating Markets Missed Markets Opportunities
Fish, fresh or chilled, whole 0302 Fish fillets, fish meat, minced 0304
Pepper, crushed or ground 0904 Coconuts, Brazil nuts and cashew nuts 0801
Cement 2523 Prepared or preserved fish 1604
Polymers of vinyl chloride 3904 Fruit, nut, edible plant parts 2008
Ornaments of wood, jewel 4420 Organic surface active agent 3402
Newsprint 4801 Footwear with outer sole 6402
Cotton yarn not sewing thread 5205 Float glass, polished glass in sheets 7005
Woven fabric >85% synth + cotton 5513 Jewellery containing precious metal 7113
Mens, boys shirts, knit 6105 Parts of bicycles and motorcycles 8714
Medium-Size Exports
Increased Penetration in Stagnating Markets Exploited Market Opportunities
Crustaceans, prepared or preserved 1605 Animal and vegetable fats or oils 1516
Cigars, cigarettes 2402 Oil-cake other than soyabean 2306
Plastic plate, sheet, reinforced 3920 Cyclic hydrocarbons 2902
Wood continuously shaped 4409 Chemical industry products 3823
Artificial staple fibres 5504 Womens, girls blouses & shirts 6106
Womens, girls suit, dress, skirt 6104 Ferro-alloys 7202
Footwear with uppers of textile 6404 Tube or hollow profile 7304
Electric transformers 8504 Parts of structures of iron or steel 7308
Electric accumulators 8507 Parts for use with moving machinery 8431
Radio, radio-telephony receivers 8527 Television receivers, video monitors 8528
Electrical switches, connectors 8536 Passenger and goods transport ships 8901
Reduced Penetration in Stagnating Markets Missed Markets Opportunities
Fish, frozen, whole 0303 Cocoa butter, fat, oil 1804
Polyacetals, polyethers 3907 Acyclic alcohols and their derivatives 2905
Builders joinery of wood 4418 Oxygen-function amino-compounds 2922
Mens, boys overcoats 6201 Soaps 3401
Men's or boys' shirts 6205 Containers, bobbins of plastics 3923
Womens or girls' blouses, shirts 6206 T-shirts, singlets and other vests 6109
Brassieres, girdles, corsets 6212 Electric motors and generators 8501
Primary cells and primary batteries 8506 Electric apparatus 8517
Audio-electronic equipment 8518 Parts for radio, tv transmission 8529
Electronic integrated circuits 8542 Seats 9401
Figure 3.5:
Matching High-Growth Indonesian Exports with Dynamic EU Import, 2000-2009
Ind
one
sia’
s E
xpo
rts
Gro
wth
Ind
one
sia’
s E
xpo
rts
Gro
wth
EU Market Growth
EU Market Growth

27INDONESIA TRADE ACCESS TO THE EUROPEAN UNION: OPPORTUNITIES AND CHALLENGES
3.6 Indonesia’s EU Market Access Relative to Comparator CountriesDespite extensive opportunities offered by the EU market, Indonesia’s exports to that market have fallen short of several other countries with similar economies and structures. It ranks seventh among nine comparator countries (Table 3.4). Among the so-called BRICs, which consist of Brazil, Russia, India and China, it has performed somewhat better than Brazil, but fallen behind China, India and Russia. Its EU market share of 1.4 percent in 2009, nonetheless, remains the second lowest of all comparator countries. The modest penetration can be explained by the increasing proportion of Indonesia’s exports directed at intra-regional trade, largely due to the easier market access ASEAN+3 countries. However, other ASEAN countries included in the comparison all have higher share of the EU market than does Indonesia.
Partly because of the lack of stricter product standards required for market access, the transformation role of exports to development in the best-performing Asian economies has had less relevance to the Indonesian economy. In those fast-growing economies, there has been a steady climb along the value chain. In Indonesia, however, the composition of exports has changed less dramatically and economic activities have
Large-Size Exports
Increased Penetration in Stagnating Markets Exploited Market Opportunities
Margarine 1517 Palm oil and its fractions 1511
Monocarboxylic fatty acid, alcohol 1519 Coconut, palm kernel 1513
Cocoa beans, raw or roasted 1801 Copper ores and concentrates 2603
Nickel ores and concentrates 2604 Natural rubber and gums 4001
Ammonia, anhydrous 2814 New pneumatic tyres, of rubber 4011
Hot-rolled products, iron/steel 7208 Refined copper and copper alloys 7403
Copper wire 7408 Products of nickel metallurgy 7501
Equipment to spray liquid 8424 Unwrought tin 8001
Insulated wire and cable 8544 Parts for motor vehicles 8708
Reduced Penetration in Stagnating Markets Missed Markets Opportunities
Paper, board, clay, inorganic coated 4810 Crustaceans 0306
Synthetic filament yarn 5402 Coffee 0901
Woven synthetic filament yarn 5407 Plywood, veneered panels 4412
Yarn , synthetic staple fibre 5509 Chemical wood pulp 4703
Jerseys, pullovers, cardigans 6110 Uncoated paper 4802
Mens or boys suits, jackets 6203 Footwear with uppers of leather 6403
Womens, girls suits, jackets 6204 Hot-rolled products, iron 8521
Gold, unwrought 7108 Motor vehicles for transport 8703
Parts for office machine 8473 Furniture and parts 9403
Table 3.5 (Continued):
Matching High-Growth Indonesian Exports with Dynamic EU Import, 2000-2009In
do
nesi
a’s
Exp
ort
s G
row
th
EU Market Growth
Table 3.4: Export Growth Rates of Indonesia and Comparator Countries to EU Market, 2000-2009
Avg2001-2009
Market Share
2000 2005 2009
China 19.1% 6.9% 16.9% 25.0%
India 14.0% 1.2% 2.0% 3.0%
Vietnam 12.6% 1.3% 1.4% 1.7%
Russia 8.8% 0.9% 0.7% 0.4%
South Korea 8.2% 1.6% 1.9% 1.7%
Thailand 6.3% 2.5% 3.6% 3.7%
Indonesia 5.4% 1.1% 1.1% 1.4%
Brazil 4.6% 1.9% 2.0% 2.1%
Singapore 3.7% 6.4% 9.5% 9.6%
Malaysia 2.9% 1.7% 1.7% 1.7%
Sub-Total 11.3% 25.8% 41.5% 51.1%
Others -1.9% 74.2% 58.5% 48.9%
All EU Imports 2.8% 100% 100% 100%
Source: United Nations, COMTRADE database; and EU, Eurostat database.
28
remained concentrated in largely unprocessed products. The affected sectors include agricultural and fishery products, mining, low-skilled manufacturing activities like labor-intensive footwear products and medium to low-tech electronic equipment and machinery parts. These activities have been supported by a relatively lower skilled labor force, limited technicians involved in research and development, and obstacles to cross-border investment activities of multinational enterprises. Together they have combined to limit knowledge transfer and facilitate increase market access and export growth opportunities in high-value products. To ameliorate these conditions and reverse the current pattern of production, shift to technology-led growth is needed as a means of moving the production base to high value-adding activities.37 That process would be supported the development of appropriate export quality infrastructure needed to meet quality and regulatory standards of high value-adding activities for markets in the European Union and elsewhere.
Indonesia has an excellent opportunity to broaden its export base and accelerate exports to the European Union. One way to identify obstacles and opportunities for the country is to examine a set of industries that are representative of the types of activities that could be promoted as a means of not only expanding exports, but also generating greater value added for the country. In the chapter that follows, we identify some industries that are representative of such opportunities, and in subsequent chapters examine the situation confronting exports from those industries to the EU market.
37. See, in particular, Wing Thye Woo and Chang Hong, “Indonesia’s Economic Performance in Comparative Perspective, and a New Policy Framework for 2049“. Available: http://www.econ.ucdavis.edu/faculty/woo/SEA%20for%20webpage/2010-1-1.Woo.Indonesia-Need%20for%20New%20Policy%20Framework.pdf.
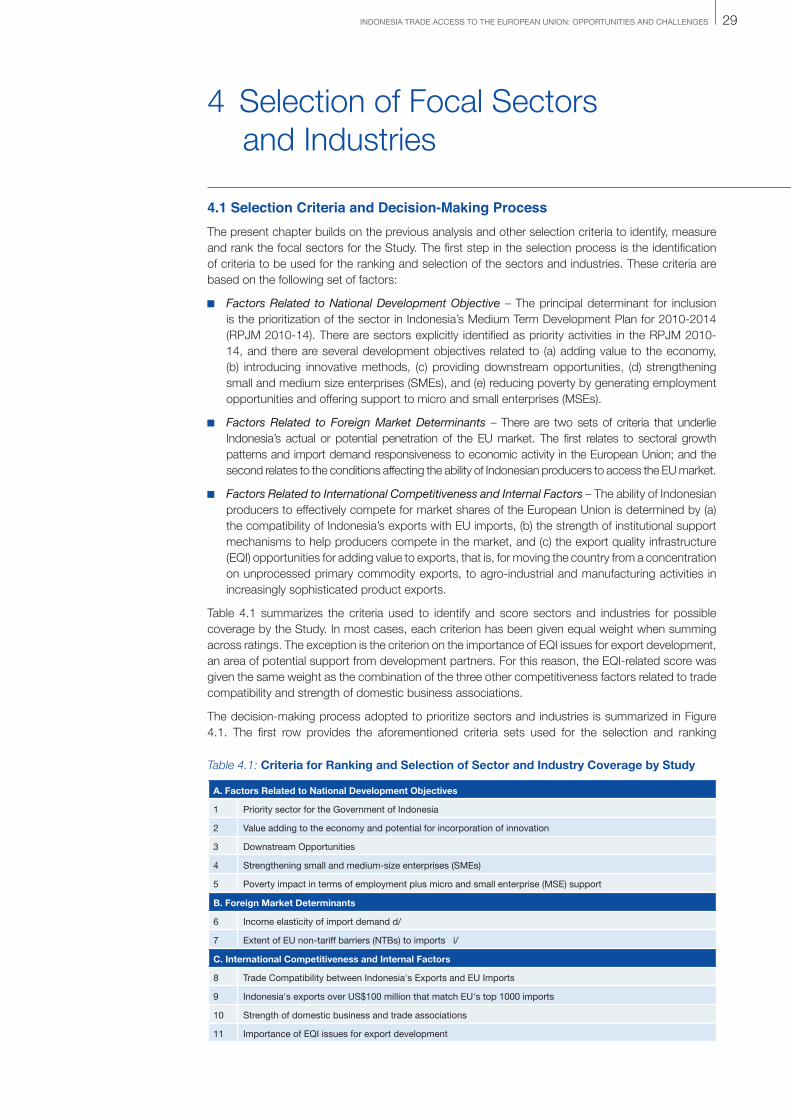
29INDONESIA TRADE ACCESS TO THE EUROPEAN UNION: OPPORTUNITIES AND CHALLENGES
4.1 Selection Criteria and Decision-Making ProcessThe present chapter builds on the previous analysis and other selection criteria to identify, measure and rank the focal sectors for the Study. The first step in the selection process is the identification of criteria to be used for the ranking and selection of the sectors and industries. These criteria are based on the following set of factors:
Factors Related to National Development Objective – The principal determinant for inclusion is the prioritization of the sector in Indonesia’s Medium Term Development Plan for 2010-2014 (RPJM 2010-14). There are sectors explicitly identified as priority activities in the RPJM 2010-14, and there are several development objectives related to (a) adding value to the economy, (b) introducing innovative methods, (c) providing downstream opportunities, (d) strengthening small and medium size enterprises (SMEs), and (e) reducing poverty by generating employment opportunities and offering support to micro and small enterprises (MSEs).
Factors Related to Foreign Market Determinants – There are two sets of criteria that underlie Indonesia’s actual or potential penetration of the EU market. The first relates to sectoral growth patterns and import demand responsiveness to economic activity in the European Union; and the second relates to the conditions affecting the ability of Indonesian producers to access the EU market.
Factors Related to International Competitiveness and Internal Factors – The ability of Indonesian producers to effectively compete for market shares of the European Union is determined by (a) the compatibility of Indonesia’s exports with EU imports, (b) the strength of institutional support mechanisms to help producers compete in the market, and (c) the export quality infrastructure (EQI) opportunities for adding value to exports, that is, for moving the country from a concentration on unprocessed primary commodity exports, to agro-industrial and manufacturing activities in increasingly sophisticated product exports.
Table 4.1 summarizes the criteria used to identify and score sectors and industries for possible coverage by the Study. In most cases, each criterion has been given equal weight when summing across ratings. The exception is the criterion on the importance of EQI issues for export development, an area of potential support from development partners. For this reason, the EQI-related score was given the same weight as the combination of the three other competitiveness factors related to trade compatibility and strength of domestic business associations.
The decision-making process adopted to prioritize sectors and industries is summarized in Figure 4.1. The first row provides the aforementioned criteria sets used for the selection and ranking
4 Selection of Focal Sectors and Industries
A. Factors Related to National Development Objectives
1 Priority sector for the Government of Indonesia
2 Value adding to the economy and potential for incorporation of innovation
3 Downstream Opportunities
4 Strengthening small and medium-size enterprises (SMEs)
5 Poverty impact in terms of employment plus micro and small enterprise (MSE) support
B. Foreign Market Determinants
6 Income elasticity of import demand d/
7 Extent of EU non-tariff barriers (NTBs) to imports i/
C. International Competitiveness and Internal Factors
8 Trade Compatibility between Indonesia's Exports and EU Imports
9 Indonesia's exports over US$100 million that match EU's top 1000 imports
10 Strength of domestic business and trade associations
11 Importance of EQI issues for export development
Table 4.1: Criteria for Ranking and Selection of Sector and Industry Coverage by Study

30
process. The second row contains the decision steps to identify, rank and prioritize sectors. The third row comprises the steps involved in identifying and ranking industries.
For sectors, the process involves the following steps:
Step 1: Determine whether a sector is (a) a priority export sector, (b) a priority sector for revitalization of the industrial sector, or (c) a priority sector of government ministry. In scoring the sectors, (i) 10 points are given to sectors that are priority export sectors in RPJM 2010-14; (ii) 8 points are assigned to sectors for revitalizing industrial activity in RPJM 2010-14; (iii) 5 points are assigned to wood products and furniture as special inclusive cases.
Step 2: Sectors that meet the prioritization criteria in Step 1 are retained for further consideration; others are excluded.
Step 3: Determine the extent to which a sector meets development objectives defined under RPJM 2010-14 criteria, which are related to value adding, innovation, SME/MSE support, poverty reduction, and employment generation. Score the contribution of each sector to the specific development objectives on a scale of 1 to 10, with 10 being the best score.
Step 4: Determine whether strong EU market demand exists and whether market access conditions are within actual or potential capacity of producers. Use quantitative techniques to measure and normalize scoring on a scale of 1 to 10.
Step 5: Determine whether existing exports of Indonesia are compatible with current EU import patterns, business association support, and EQI opportunities. Score the contribution of each criterion to Indonesia’s international competitiveness of the sector on a scale of 1 to 10.
Step 6: Rank sectors based on the scoring process in Steps 1-6 and select the top-rated four sectors.
Step 7: Within the four top-rated sectors, identify and score the potential demand growth prospects and opportunities for Indonesia’s different types of exports. In identifying products, the selection process has given attention to industries where EQI issues have a high incidence on competitiveness and market access.
Step 8: In consultation with government entities and business organizations, evaluate industries on the basis of Indonesia’s competitiveness and as having a strong potential to perform well in the EU market.
Figure 4.1:Selection Process for Priority Sectors and Industries in Study
Medium TermDevelopment
Plan 2010 - 2014 (MTDP-2)
Priority Sectors for Ministries of Government of
Indonesia
Medium TermDevelopment
Plan 2010 - 2014 (MTDP-2)
Import Demandand Market
Access Analysis
Trade, Business Association, EQI
Analysis
Priority Sectors Government of
Indonesia
Other NationalDevelopment
Objectives
Foreign MarketDeterminants
InternationalCompetition andInternal Factors
Determine whether sector is (a) priority export sector, or (b) Priority sector for
revitalization, or (c) special inclusive
cases.
1a1b
yes
no no
no no
no no
yesyes
yes yes
yes
2b
6b 7b 8
3b 4b 5
Score sectors (a) 10 for MPDP-2 priority export sectors, (b) 8 for MPDP-2 revitalization sector, (c) 5 for other priority
sector of ministries
iSector each
factor on scale of 1 to 10 being
best score
Foreign MarketDeterminants
6aInternational
competitivenessand Internal
Factors
7a
Sector each factor on scale of 1 to 10 being
best score
iiiSector each
factor on scale of 1 to 10 being
best score
iv
Determine whether sector meets other
MTDP-2 criteria for value adding, innovation, SME/
MSE support, poverty reduction. employee
2aDetermine whether strong EU Market
demend exists and if market access
conditions are within actual or potential
capacity of producers
Determine whether Indonesia exports
are compatible eith EU imports, business assoc. support, and
EQI opportunities
4aGoal priority
sector?
Sele
ctio
n C
riter
iaIn
dust
ry-L
evel
Se-
lect
ion
Proc
ess
Sect
or-L
evel
Sel
ectio
n Pr
oces
s
Excludesector?
Excludesector?
Exclude sector? Exclude sector?
Excludesector?
Excludesector?
SupportMTDP
objecttive?
Stong &accessibleMarket?
Potentiallycompetitive?
Strong &accessiblemarket?
Potentiallycompetitive?
PrioritySectors
PriorityIndustries
31INDONESIA TRADE ACCESS TO THE EUROPEAN UNION: OPPORTUNITIES AND CHALLENGES
Step 9: Based on the aforementioned analysis, select one or two industries within each of the four priority sectors.
The remained of this chapter elaborates on this decision-making process, and describes the results of each step in the process. It is important to note that the selection process has been based on measureable indicators, rather that any subjective or qualitative criteria. The following sections present the quantitative techniques used to make the selection.
4.2 Factors Related to National Development Objectives (Steps 1 and 2)The National Medium Term Development Plan for 2010-2014 (RPJM 2010-14) contains a list of priority export industries that underlie the prioritization of sectors and industries.38 Table 4.2 lists the sectors and industries that have been identified by the Government’s RPJM 2010-14, along with their associated International Standard Industrial Classification (ISIC). The coverage includes broad sectors like chemicals and chemical products, and narrowly defined industries like jewelry. In practice, the sequence for prioritization involves first identifying the sectors and subsequently identifying industries within the prioritized sectors. Within the confines of the time and available resources, the study focuses on four priority sectors. In turn, each priority sector covers one or two industries.
In principle, sectors are classified under the 4-digit level of International Standard Industrial Classification (ISIC) and the associated set of industries within those sectors, defined at the 6-digit ISIC level.39 Mapping between the ISIC categories and trade-based Harmonized System (HS) information is based on concordance tables. In practice, however, we define sectors using the international trade classification nomenclature of the Harmonized System (HS) because of the focus on the study on international trade rather than production activities. Sectors are accordingly classified into 21 section headings of the Harmonized System. Industries are classified into 96 chapters (2-digit HS codes). Products are classified at the 4-digit and 6-digit division levels.
Table 4.2 lists the priority export sectors and priority sectors for industrial revitalization under RPJM 2010-14, along with wood products and furniture prioritized by the Ministry of Agriculture and Ministry of Trade. Most prioritized activities are sectors, but both fisheries and furniture manufacturing are classified as industries. The activities represent the starting point in the decision-making process for prioritizing sectors in the Study.
Through the Presidential Decree number 28 of 2008, the Government established the National Industrial Policy. Its industry cluster priorities are as follows:
1. Agro-Industries, covering (i) palm oil industry; (ii) industrial rubber and rubber goods; (iii) cocoa and chocolate industry; (iv) coconut industry; (v) coffee industry; (vi) sugar industry; (vii) tobacco industry; (viii) fruit industry; (ix) industrial wood and wood products; (x) fisheries and marine products industry; (xi) pulp and paper industry; and (xii) industry milk processing.
2. Transport Industry, covering (i) motor vehicle industry; (ii) shipping industry; (iii) aerospace industry; and (iv) rail industry.
3. Industrial Electronics, covering (i) industrial electronics; (ii) industry telecommunications hardware and supporters; (iii) device industry broadcasters and their supporters; and (iv) computer industry and its equipment.
4. Manufacturing Industry Base, covering (i) basic materials industries, including iron and steel industry, cement industry, petrochemical industry, ceramic industry; (ii) machinery industry, including industrial electrical equipment and electrical machinery, general industrial machinery and equipment; (iii) labor-intensive manufacturing industries, including (i) textile industry and product textiles, footwear industry, and pharmaceutical industry with raw materials from Indonesia.
5. Creative Industries, covering (i) design of software and multimedia content; (ii) fashion industry designs; (iii) the arts and craft industry.
38. Available www.a4des.org/documents/RPJMN_Presentation_8Feb2010.pdf
39. Available http://unstats.un.org/unsd/cr/registry/regcst.asp?Cl=28

32
6. Small and Medium Size Enterprise-based Industries, covering (i) precious stones and jewelry industry; (ii) salt industry of the people; (iii) pottery and ceramics industry ornamental; (iv) oil industry; and (v) snack food industry.
For other national development objectives under RPJM 2010-14, a combination of techniques were used to score the criteria related to value adding, innovation, SME/MSE support, poverty reduction, and employment generation. These approaches included interviews with business associations and government agencies, and research into the sector characteristics based on existing sector-level studies.
4.3 Foreign Market Determinants (Step3)Quantitative analysis has been used to score (a) strength of import demand in the EU the potential (absolute and relative) growth and income responsiveness; and (b) the extent of EU non-tariff barriers (NTBs) to imports.
Import Demand – In the first case, income elasticity estimates of the demand for imports were estimated. These elasticities measure the responsiveness of sector-level imports to changes in domestic income, measured by GDP (Table 4.3). Elasticities greater than unity indicate that imports have a more-than-proportional response to changes in economic activity. These dynamic markets growing faster than overall economic activity are especially attractive to exporters in Indonesia. The estimates range from less than 1.7 for leather to a high of 4.4 for chemical products.40
Market Access – Trade restrictiveness indices measure tariff and non-tariff barriers on imports
Sector or Industry Priority Export Sector? 1/
Priority sector for industrial
revitalization?1/
Other Priority Sectors ofMinistries
ISIC 4Categories2/
Sector or Industry?
Agricultural Yes 01 Sector
Agro-processed products Yes 110 + 11 Sector
Chemicals and chemical products Yes Yes 3/ 20 Mixed
Fishery, fresh and processed Yes 032 Industry
Footwear Yes 152 Sector
Forestry Yes 4/ 16 Sector
Furniture and handicraft Yes 4/ 31 Industry
Leather products Yes 15 Sector
Machinery and electrical equipment Yes Yes 27 Sector
Transportation equipment Yes 49 to 53 Sector
Textiles and textile products Yes 13 +14 Sector
Table 4.2: Priority Sectors and Industries Identified by the Government
1/ Government of Indonesia Medium Term Development Plan 2010 - 20142/ ISIC - International Standard Industrial Classification3/ Fertilizer industry only.4/ Special inclusive sectors based on discussions with Ministry of Agriculture and Ministry of Trade
40. Based on log-linear estimates of extra-EU imports and GDP in 1999-2008 for total imports and major product categories.
Table 4.3: Sector-Level Import Demand Elasticities and Market Access Conditions in European Union
EU Income Elasticity of
Import Demand
Index of EU Import Restric-
tiveness 1/
Vegetable products 2.2 34
Fats & Oils 3.0 51
Foodstuffs & Beverages 2.4 34
Chemical Products 4.4 53
Leather Products 1.7 48
Wood Products 1.9 47
Textiles 1.7 49
Footwear 2.1 49
Machinery & Electronics 2.1 29
Transport Equip. 2.2 44
1/ Estimates based on log-linear estimates of extra-EU imports and GDP in 1999-2009 for each sector.
2/ Based on information in European Commission, “Non-Tariff Measures in EU-US Trade and Investment – An Economic Analysis. Highlights of the study”. Note by Directorate-General for Trade of the European Commission, 18 December 2009.

33INDONESIA TRADE ACCESS TO THE EUROPEAN UNION: OPPORTUNITIES AND CHALLENGES
and take a value between 0 (least restrictions) and 100 (most restrictions). The average level of trade restriction in the EU market equals 44 for the sectors. Above-average restrictions exist in the sectors for fats and oils, chemical products, textiles, footwear, leather and wood products. Below average restriction levels occur in the sectors of machinery equipment, processed foods and beverages, and fresh vegetables.
4.4 International Competitiveness and Internal Factors (Step 4)Trade compatibility between Indonesia’s exports and EU imports has been analyzed at the product-specific level in the previous chapter for large, medium and smaller export products. In this section we present the results of sector aggregation for purposes of sector prioritization (Figure 4.2).41 The analysis shows that the sectors with the fastest growing EU markets are chemicals, transport equipment, base metals and minerals, and vegetable fats and oils. Indonesia has also achieved high world-wide growth rates in all of these sectors. Slower EU market growth has taken place in the textile, pulp and paper, fresh vegetables, live animals, precious metals, plastics and footwear sectors.
Table 3.4 of Section 3.3 shows the sector ranking of sectors where Indonesia’s product exports match those that are among the top 1000 imports into the EU market. Base metals have the highest number of products (26), followed by textiles (15) and precious or semi-precious stones (13), mineral products (9), and machinery and equipment (8). Those sector having the fewest matching products are articles of stone, plaster and cement; optical equipment; live animals and their products; and vegetable products.
Strength of domestic business and trade associations has been evaluated on the basis of interviews and knowledge of resident Study team experts.
The final and most important criteria is relates to EQI opportunities. The possibility for EQI development is closely related to the generation of value added activities. Those sectors having the greatest opportunities are machinery and electrical components and appliances, processed foods and beverages, chemical products, and transport equipment.
41. The compatibility of Indonesia’s exports in the EU market is generally reflected in high rates of export growth and rising market shares. Following the approach used by the World Bank and others, the export performance of Indonesia has been classified into the following four categories: (a) Products in which Indonesia has a rising market share and EU imports are expanding; (b) Products in which Indonesia has a rising market share but EU imports are contracting; (c) Products in which Indonesia has a falling market share despite expanding EU imports; and (d) Products in which Indonesia’s market share is falling and EU are contracting. For details, see TradeCan, TradeCan Database and Software for a Competitiveness Analysis of Nations. Washington, DC: The World Bank and Economic Commission for Latin American and the Caribbean (ECLAC). Available: http://publications.worldbank.org/index.php?main_page=product_info&cPath=1&products_id=22127.
Figure 4.2:EU Import Growth versus Indonesia Export Growth, 2000-2009 (annual averages)
30
25
20
15
10
5
0
0 5 10 15 20 25 30 35 40 45
Footwear
Indonesia Exports
EU
Impo
rts
Misc Cement
Plastics
Precious Metals
Foodstuffs
Transp Equip
Chenicals Veg Oils
Mach & Elec
Base MetalsMinerals
Wood Products
Animals Vegetables
Pulp & PaperTextiles
High Growth EU ImportsLow Growth Indonesia Exports
High Growth EU ImportsHigh Growth Indonesia Exports
Low Growth EU ImportsLow Growth Indonesia Exports
Low Growth EU ImportsHigh Growth Indonesia Exports

34
Sector: Vegetable products
Fats & Oils Foodstuffs Beverages
Chemical Products
Leather Products
Wood Products
Textiles Foot-wear Machinery Electronics
Transport Equip.
HS Section II III IV VI VIII IX XI XII XVI XVII
A. Factors Related to National
Development Objectives
4.8 4.8 9.6 8.6 6.2 8.4 5 6.4 8.2 6.0
1 Priority sector for the Governmentof Indonesia
8 (a) 10 (a,b) 10 (a,b) 7 (b) 8 (a) 6 (c) 8 (a) 8 (a) 10 (a,b) 7 (b)
2 Value adding to the economy and potential for innovation
2 6 10 8 4 7 4 4 10 8
3 DownstreamOpportunities
2 4 10 10 6 9 6 5 8 8
4 Strengthening small and medium-size enterprises (SMEs)
4 2 10 9 7 10 4 7 8 5
Table 4.4: Criteria for Ranking and Selection of Sector and Industry Coverage by Study (Ratings from low of 1 to high of 10)
4.5 Recommended Focal SectorsTable 4.4 summarizes the scores and rankings of the sectors designated as being of national priority to RPJM 2010-14. Based on these findings, the proposed focal sectors for the study are as follows:
Machinery and Electrical Equipment: The sector has the highest overall rating and considerable potential for value adding activities in the economy. The European Union is Indonesia’s largest export market for consumer electronic products, and trade compatibility between Indonesia’s existing product exports and EU imports is the highest of any sector. There are opportunities to address existing EQI constraints related to the international recognition of certification and testing of products within Indonesia. Already there well-known Original Equipment Manufacturers (OEM) like Panasonic, Sanyo, Epson, Sharp Samsung and LG are operating in the country, and both Government and the private sector are keen to increase the domestic content of electronics products from OEMs.
Processed Foodstuff: This sector has the second-highest overall rating among all sectors, and also has large opportunities for exporters to move into high value-adding downstream activities. SMEs tend to predominate in food industry. Development of clusters and networking activities supporting the participation of SMEs along the value chain could provide large opportunities for knowledge and technology transfers to local producers. There are also important gains to be made in employment generation and poverty alleviation by helping micro and small size enterprises (MSEs) to become part of the farm supply of processed food manufacturers.
Chemical Products: The sector has the highest responsiveness of demand for imports to economic growth in the European Union. It therefore has the best EU market prospects among all sectors. Downstream activities involving the location of facilities for further processing are rapidly emerging in new manufacturing areas, where large research and development (R&D) inputs are also needed. Requirements for EQI improvements are therefore large in most Indonesian activities in this sector. But while the challenges are great, Indonesian exporters entering the EU market have an intrinsically strong position because of the country’s locational advantages.
Wood Products and Furniture: Development of this sector would offer large possibilities for SMEs and MSEs, employment generation, and poverty alleviation throughout Indonesia. The benefits from EQI activities could have a favorable environmental impact through improved quality management and control, standardization, inspections and certification. Domestic business and trade associations are strong and could provide support to exporters intending to enter the EU market.

35INDONESIA TRADE ACCESS TO THE EUROPEAN UNION: OPPORTUNITIES AND CHALLENGES
Note:Excludes live animals and products (HS I), mineral products (HS Section V), plastics and rubber (HS Section VII), pulp and paper (HS Section X), cement and stone products (HS Section XIII), precious stones (HS Section XIV), base metals (XV), medical equipment (HS Section XVIII), arms (HS Section XIX), other manufactures (HS Section XX), art works (Section XXI).
Rating Explanations:a Priority export sector in Government’s Medium Term Development Plan
2010 - 2014 (see page II.3-76): (a) agricultural products; (b) fishery and processed products; (c) processed foods and beverages; (d) textiles; (e) machinery and electrical equipment; (f) chemicals and chemical products; (g) leather products and footwear
b Priority sectors for revitalization of the industrial sector in Government’s
Medium Term Development Plan 2010 - 2014 (see page II.3-76): (a) fertilizer industry, (b) sugar industry, (c) palm oil-based industries, (d) transportation equipment, and (e) electronics.
c Priority sector for Ministry of Agriculture and Ministry of Trade
d Estimates based on log-linear estimates of extra-EU imports and GDP in 1999-2009 for each sector, then normalized for scale of 1 to 10.
e Directorate-General for Trade of the European Commission, “Non-Tariff
Measures in EU-US Trade and Investment – An Economic Analysis - High-lights of the study”. Brussels, 18 December 2009. Available: http://trade.ec.europa.eu/doclib/docs/2009/december/tradoc_145612.pdf
f Based on reports from European Commission Helpdesk. Available: http://
exporthelp.europe.eu. g Based on data in Table 3.5. h Based on data in Table 3.9 and refers to EU imports for HS 4-digit prod-
ucts exceeding US$0.5 million of EU imports and US$100 million i Measures the frequency of occurrence of NTBs in sector.
j Refers to cosmetics
Sector: Vegetable products
Fats & Oils Foodstuffs Beverages
Chemical Products
Leather Products
Wood Products
Textiles Foot-wear Machinery Electronics
Transport Equip.
HS Section II III IV VI VIII IX XI XII XVI XVII
B. Foreign MarketDeterminants
5.8 6.0 6.0 7.4 4.9 4.8 4.4 5.9 5.9 5.9
6 Income elasticity of import demand d/
5.0 6.9 5.5 10.0
3.8 4.3 3.8 4.8 4.7 5.0
7 Extent of EU non-tariff barriers (NTBs) toimports i/
6.6 (e) 5.0 (f) 6.6 (e) 4.7 (e) 6.0 (f) 5.3 (e) 5.1 (e) 7.0 7.2 (g) 6.8 (e)
C. InternationalCompetitiveness and
Internal Factors
4.3 4.6 7.3 7.3 3.8 6.1 6.8 4.2 9.2 7.1
8 Trade Compatibility: Indonesia's Exports and EU Imports
1.7 (g) 2.1 (g) 2.5 (g) 3.3 (g) - (g) 2.9 (g) 5.8 (g) 0.8 (g) 10.0
(g) 2.5 (g)
9 Matching Indonesia's exports with EU's top imports
0.0 (h) 3.3 (h) 3.3 (h) 2.7 (h) 0.0 (h) 2.7 (h) 10.0 (h) 1.3 (h) 5.3 (h) 0.0 (h)
10 Strength of domestic business and tradeassociations
6 7 8 8 (j) 5 7 7 5 10 10
11 Importance of EQI issues for export development
6 5 10 10 (j) 6 8 6 6 10 10
Unweighted Average 4.5 4.9 7.6 7.4 4.7 6.6 5.7 5.2 8.0 5.8
4.6 Selected Focal IndustriesThe selection of focal industries is largely based on the principal types of products exported by Indonesia within each of the focal sectors. It also reflects discussions held with industry representatives and government agencies. The resulting recommendations for industry coverage are as follows:
Processed Foodstuff: (a) The fisheries industry; and (b) the agri-foods industry. Both industries have large possibilities for Indonesian enterprises to move into high value-adding downstream activities. SMEs predominate in upstream activities of both industries, and networking activities along their value chains could improve opportunities for knowledge and technology transfers to local producers.
Consumer Electronics: The consumer electronics industry, which has large EQI assistance possibilities that could help move the Indonesian industry from low and medium-tech products to high-tech components.
Table 4.4 (Continued): Criteria for Ranking and Selection of Sector and Industry Coverage by Study (Ratings from low of 1 to high of 10)

36
Furniture: The furniture industry, which has location advantages in accessing raw material supplies, along with abundant skilled labor throughout the country. There are also important gains to be made in poverty alleviation by generating employment and sourcing supplies from MSEs
Natural Cosmetics: The natural cosmetic industry has a rapidly growing market throughout the European Union. Indonesia has a locational advantage in accessing raw material supplies.
37INDONESIA TRADE ACCESS TO THE EUROPEAN UNION: OPPORTUNITIES AND CHALLENGES
PART II:
EU MARKET POTENTIAL


39INDONESIA TRADE ACCESS TO THE EUROPEAN UNION: OPPORTUNITIES AND CHALLENGES
5 Market Prospects for Focal Industries
5.1 Import Demand Responsiveness to Income and Price ChangesFrom the perspective of Indonesian exporters, the EU market demand has two components. First, the demand for product imports in the European Union for the focal industry; second, the European Union’s demand for Indonesian exports of those products. The EU demand for exports of Indonesia depends on relative prices and other factors like quality and product differentiation between Indonesia’s and other suppliers of that type of product.42 In this chapter, we focus on the EU market and therefore on the first of these components related to EU demand for imports of the focal industries.
Income, population, and the rate of economic
growth in EU member countries have long been
recognized as key determinants of the European
Union’s demand for foreign products. Sustained
economic growth is expected to drive imports,
notwithstanding a slow growth in population. In
the short-run, relative price changes can cause
Highlights of Indonesia’s Exports to the EU Market
• Forecasts generated by econometric models for the focal industries point to a favorable outlook for import demand in the EU market because of the strong responsiveness of consumer demand to economic growth in the European Union.
• Those market prospects are, however, tempered by the fact that a strong response to economic activity unfavorably affects imports during a downturn like the one recently associated with the global economic crisis.
• Among the most dynamic markets are those of fisheries, wood furniture, and electronics.
• Cosmetics are in the mid-range and agri-foods have a moderate growth due to their low responsiveness to income changes.
• Among individual product groups, the fastest growing imports occur in crustaceans (shrimp), electrical transformers, essential oils, and optic fibers.
import demand to vary from year-to-year. But price effects are transient and do not impact on
the long run growth of imports, since relative prices changes cannot be sustained in one direction
continuously or else all consumers would shift to lower priced suppliers.43 In addition, there are
two types of shift factors impacting on imports. The first relates to structural changes in consumer
preferences, which can shift the relationship between the economic activity and demand for imports
of EU consumers of any type of product in the focal sectors of this study. The second type of shift can
occur from non-price factors affecting the easy or difficulty of consuming foreign goods rather than
domestically ones. Those non-price factors can be brought about by trade policies and regulations.
Study Team estimates shows that demand for imports is related to real incomes in the European Union (the long-term effect) and their relative prices (transitional effects).44 Those relative prices are composed of the own price of the product measured in constant local currency terms, and the real effective exchange rate of the European Union. The average income elasticity of import demand of the products from the focal industries equals 2 in the short run and 3.4 in the long run. This average is in line with other import demand estimates in general and especially for processed and manufactured goods showing that changes in income tend to produce a more-than-proportionate response in imports. The income elasticities range from a low of unity for insulated wire and cables to a high of 7 for electric transformers. Import prices are, on average inelastic in the short run (-0.3) and long run (-0.5). In contrast, import demand tends to respond strongly to changes in the exchange rate, the average elasticity being -1.7 in the long run.
For fisheries and agri-foods, demand derives from a combination of broad demand dynamics, domestic supply trends, and trade policies. Higher incomes typically induce increased expenditures on a broader array of processed agricultural products and fish. In addition to income, other important factors include the size, age, ethnic composition of the population, cultural and religious factors,
42. The EU consumer’s decison-making process is described by the so-called utility tree described in the Technical Appendix to this report. Product differentiation from quality differences and the perception of consumers about other differences in the product originating from Indonesia relative to other sources gives rise to a downward slowing demand schedule for Indonesia’s exports.
43. See, for example, Kai Christoffel, Günter Coenen and Anders Warne, “Forecasting with DSGE Models”. DG-Research, European Central Bank. 22 December 2009. Available: http://www.nottingham.ac.uk/economics/cfcm/FWDSGEModels.pdf
44. A Technical Appendix on the quantitative methodology used to derive the estimates is available upon request.
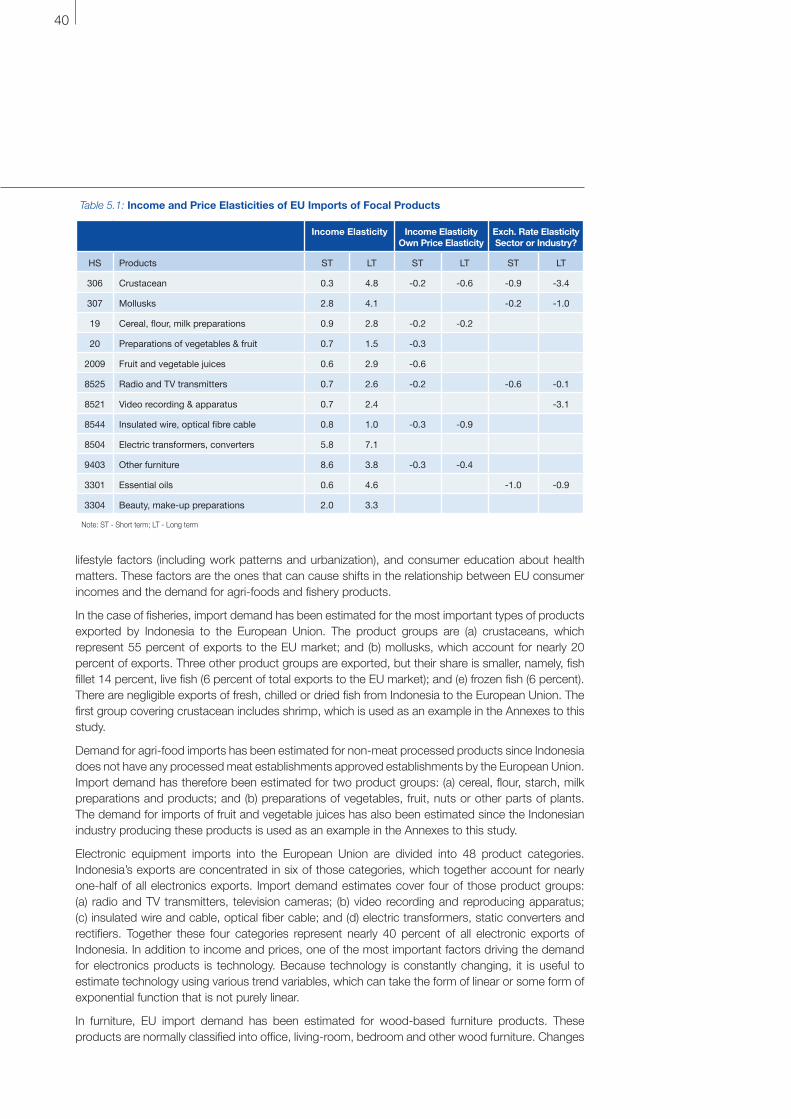
40
lifestyle factors (including work patterns and urbanization), and consumer education about health matters. These factors are the ones that can cause shifts in the relationship between EU consumer incomes and the demand for agri-foods and fishery products.
In the case of fisheries, import demand has been estimated for the most important types of products exported by Indonesia to the European Union. The product groups are (a) crustaceans, which represent 55 percent of exports to the EU market; and (b) mollusks, which account for nearly 20 percent of exports. Three other product groups are exported, but their share is smaller, namely, fish fillet 14 percent, live fish (6 percent of total exports to the EU market); and (e) frozen fish (6 percent). There are negligible exports of fresh, chilled or dried fish from Indonesia to the European Union. The first group covering crustacean includes shrimp, which is used as an example in the Annexes to this study.
Demand for agri-food imports has been estimated for non-meat processed products since Indonesia does not have any processed meat establishments approved establishments by the European Union. Import demand has therefore been estimated for two product groups: (a) cereal, flour, starch, milk preparations and products; and (b) preparations of vegetables, fruit, nuts or other parts of plants. The demand for imports of fruit and vegetable juices has also been estimated since the Indonesian industry producing these products is used as an example in the Annexes to this study.
Electronic equipment imports into the European Union are divided into 48 product categories. Indonesia’s exports are concentrated in six of those categories, which together account for nearly one-half of all electronics exports. Import demand estimates cover four of those product groups: (a) radio and TV transmitters, television cameras; (b) video recording and reproducing apparatus; (c) insulated wire and cable, optical fiber cable; and (d) electric transformers, static converters and rectifiers. Together these four categories represent nearly 40 percent of all electronic exports of Indonesia. In addition to income and prices, one of the most important factors driving the demand for electronics products is technology. Because technology is constantly changing, it is useful to estimate technology using various trend variables, which can take the form of linear or some form of exponential function that is not purely linear.
In furniture, EU import demand has been estimated for wood-based furniture products. These products are normally classified into office, living-room, bedroom and other wood furniture. Changes
Table 5.1: Income and Price Elasticities of EU Imports of Focal Products
Income Elasticity Income ElasticityOwn Price Elasticity
Exch. Rate ElasticitySector or Industry?
HS Products ST LT ST LT ST LT
306 Crustacean 0.3 4.8 -0.2 -0.6 -0.9 -3.4
307 Mollusks 2.8 4.1 -0.2 -1.0
19 Cereal, flour, milk preparations 0.9 2.8 -0.2 -0.2
20 Preparations of vegetables & fruit 0.7 1.5 -0.3
2009 Fruit and vegetable juices 0.6 2.9 -0.6
8525 Radio and TV transmitters 0.7 2.6 -0.2 -0.6 -0.1
8521 Video recording & apparatus 0.7 2.4 -3.1
8544 Insulated wire, optical fibre cable 0.8 1.0 -0.3 -0.9
8504 Electric transformers, converters 5.8 7.1
9403 Other furniture 8.6 3.8 -0.3 -0.4
3301 Essential oils 0.6 4.6 -1.0 -0.9
3304 Beauty, make-up preparations 2.0 3.3
Note: ST - Short term; LT - Long term

41INDONESIA TRADE ACCESS TO THE EUROPEAN UNION: OPPORTUNITIES AND CHALLENGES
in tastes and preferences are critical in consumer preferences. Shifts can occur in the type of furniture preferred by consumers, whether from the material content or the period style.
For cosmetics, EU import demand has been estimated for the two types of product groups in which Indonesia’s exports are concentrated: (a) essential oils, resinoids and terpenic by-products; and (b) beauty, make-up preparations. Together these two product groups account for one-half of all exports of cosmetic products by Indonesia. As in furniture, not only do income and prices drive demand, but consumer preferences play an important part in determining that demand.
5.2 Import Demand Forecasts for Focal IndustriesProjections of EU demand for imports of the focus products have been generated from the estimated import demand relationships estimated by the Study Team and described in the previous section. The forecasts for real GDP growth, prices and the exchange rate are based on the International Monetary Fund’s biannual projections.45 The forecast is for GDP to grow by 1 percent in real terms in 2010, and by another 1.3 percent in 2011. After 2011 a moderate 2 percent annual real GDP growth is assumed. We assume unchanged constant euro prices for the products and an average exchange rate of US$1.3 per euro over the medium term.
Figure 5.2 summarizes the results for the forecast period relative to the historical performance of the focal product group. The graph demonstrates the strong expansion predicted in EU imports relative to GDP growth, assuming a positive, sustained growth in 2010-2015. Based on the 1.7 percent
Figure 5.1:Actual and Projected Focal Product Imports versus GDP in European Union, 1999-2009 Actual & 2010-2015 Projected
1999 2003 2007 2011 2015
220
180
140
100Index of GDP 1999=100
Index of Focal Product Imports 1999=100
Actual Forecast
Source: Projects based on import demand estimates and IMF, World Economic Outlook assumptions abaout GDP growth.
45. See International Monetary Fund, “World Economic Outlook Update“. July 2010. Available: http://www.imf.org/external/pubs/ft/weo/2010/update/02/index.htm.
Table 5.2: EU Imports of Focal Products , Actual 2000-09 & Projected 2010-15(average annual growth of US dollar values)
2000-2004 2005-2009 2010-2015
03 Fisheries, of which: 5% 1% 10%
306 Crustacean 4% 1% 11%
307 Molluscs 8% 1% 8%
19+20 Agri-Foods, of which: 2% 4% 2%
19 Cereal, flour, milk preparations 8% 7% 2%
20 Preparation of veg & fruit, of which: 1% 4% 2%
2009 Fruit and Vegetable Juices -3% 4% 4%
85 Electronics, of which: 22% -8% 7%
8525 Radio and TV transmitters 2% 5% 4%
8521 Video recording apparaturs 24% -9% 2%
8544 Insulated wire, optical fibre cable 37% -14% 6%
8504 Electric Transformers, converters 6% 8% 12%
9403 Wood furniture 11% 5% 9%
33 Cosmetics, of which: 8% 4% 6%
3301 Essential oils 3% 2% 10%
3304 Make-up preparations 10% 5% 5%
Source: Projections based on econometric estimates detailed in Technical Appendix.
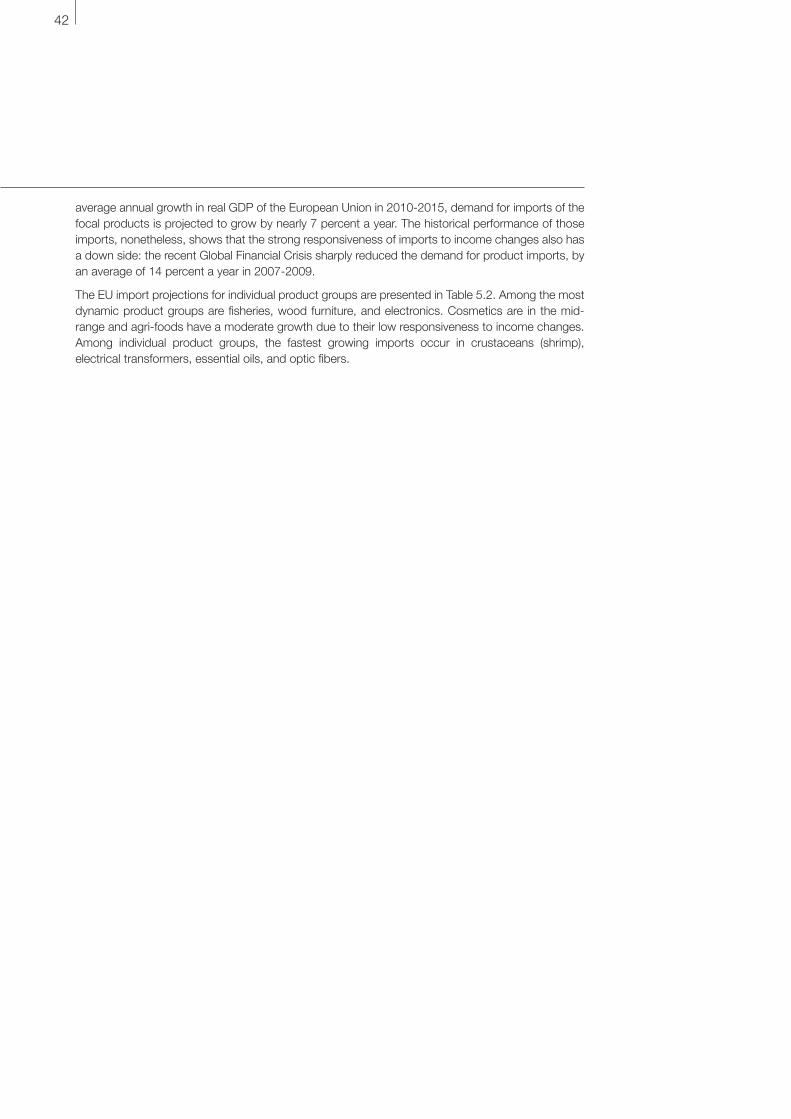
42
average annual growth in real GDP of the European Union in 2010-2015, demand for imports of the focal products is projected to grow by nearly 7 percent a year. The historical performance of those imports, nonetheless, shows that the strong responsiveness of imports to income changes also has a down side: the recent Global Financial Crisis sharply reduced the demand for product imports, by an average of 14 percent a year in 2007-2009.
The EU import projections for individual product groups are presented in Table 5.2. Among the most dynamic product groups are fisheries, wood furniture, and electronics. Cosmetics are in the mid-range and agri-foods have a moderate growth due to their low responsiveness to income changes. Among individual product groups, the fastest growing imports occur in crustaceans (shrimp), electrical transformers, essential oils, and optic fibers.

43INDONESIA TRADE ACCESS TO THE EUROPEAN UNION: OPPORTUNITIES AND CHALLENGES
6 EU Market Performance and Growth Potential for Focal Industries
6.1 Fisheries IndustryThe European Union is increasingly dependent on imports of fishery products to meet its domestic consumption needs (Figure 6.1). In 2009 the European Union imported US$17 billion worth of fishery products, which represented 2.5 times the volume of domestic production. Net imports in that year supplied one-half of domestic consumption.46
Fishery imports into the European Union are mainly in the form of processed fish, followed by fresh or chilled fish and crustaceans (Figure 6.2).47 Together these three types of imports account for 75 percent of all fishery imports. By itself, processed fish represents one-third of all fishery imports. It comprises fresh, chilled or frozen fillets of swordfish, salmon, trout, coalfish, haddock, herring and mackerel. Within these different product types, Indonesia mainly exports fish meat.
The most important fishery products imported into the European Union are shrimp and salmon, followed by cuttle fish, octopus, sturgeon, cod and scallops (Figure 6.3). Together these products account for nearly 80 percent of all fishery imports into the EU market. In 2009 Indonesia accounted for 6 percent of frozen shrimp supplied by foreign countries to the EU market.
The major foreign suppliers of fishery products to the European Union are Norway (24 percent of total imports in 2009), China (10 percent),
Highlights of Indonesia’s Exports to the EU Market
• With the EU enlargement, import demand growth rate differentials among EU countries have risen for the types of products exported by Indonesia.
• Trade compatibility between Indonesian exports and EU imports is high among wide-ranging products like wooden furniture, consumer electronics components for computers and televisions, shrimp and other mollusks, and soaps and organic preparations.
• There are over 100 important Indonesian products that are among the European Union’s 1000 top imports.
• Indonesia has numerous fast-growing exports that have dynamic import markets in the European Union. They include products in the sectors of foods, high-tech machinery and electronic equipment, and transportation equipment.
• There are strong EU markets for furniture and other wood products, footwear of various types, chemical products and jewelry.
• Indonesia’s primary commodity exports face less dynamic EU markets than those for processed goods. For example, unprocessed fruit and vegetable markets are less dynamic than those of processed food products; consumption of unrefined minerals and chemicals has grown more slowly than that of refined products; and the market for lumber and unfinished wood has grown more slowly than wood panel manufacturing and the furniture and furnishings industry.
Iceland (7 percent), Vietnam (6 percent), and the United States (5 percent). Together these five countries accounted for one-half of total EU imports in 2009. In frozen shrimp, the major suppliers are Ecuador (14 percent of total imports in 2009), India (13 percent), Argentina (12 percent), Bangladesh (9 percent), Thailand, Vietnam and China (each with 6 percent shares). Together these seven countries supply two-thirds of the EU market. Indonesia is the tenth largest supplier of frozen shrimp and has a 4 percent market share of the EU market.
The market for fish and crustaceans like shrimp is highly price competitive, and some countries have a competitive advantage because of preferential tariff rates under free trade arrangements (FTAs) with the European Union, under GSP plus,48 or under the Everything But Arms (EBA) arrangement that includes duty-free and quota-free access for products originating in Least Developed Countries (LDCs). Indonesia is a GSP beneficiary with preferential duties on fisheries. The GSP rates range from a low of zero for some products to a high of 18 to 19.5 percent in the case of some products like fresh, chilled or frozen sardines, some tunas like long-finned and yellow-fin tuna, and skipjack or stripe-bellied bonito.49
46. Imports relative to consumption data from Food and Agricultural Organization (FAO) data on supply and distribution of fisheries products. Available: http://www.fao.org/fishery/topic/16140/en. C
47. Under the harmonized system (HS), the fisheries subsector consists of chapter 3 (Fish and crustaceans, mollusks and other aquatic invertebrates) and part of chapter 16 covering prepared or preserved fish (1604) and crustaceans (1605).
48. Includes Ecuador, Colombia, Costa Rica, Guatemala, Honduras, Sri Lanka, Paraguay, El Salvador, and Venezuela. For the full list of countries qualifying for GSP+ status in 2009-2011, see http://eur-lex.europa.eu/LexUriServ/LexUriServ.do?uri=OJ:L:2008:334:0090:0091:EN:PDF
49. Based on data provided to the Study Team by the European Commission.
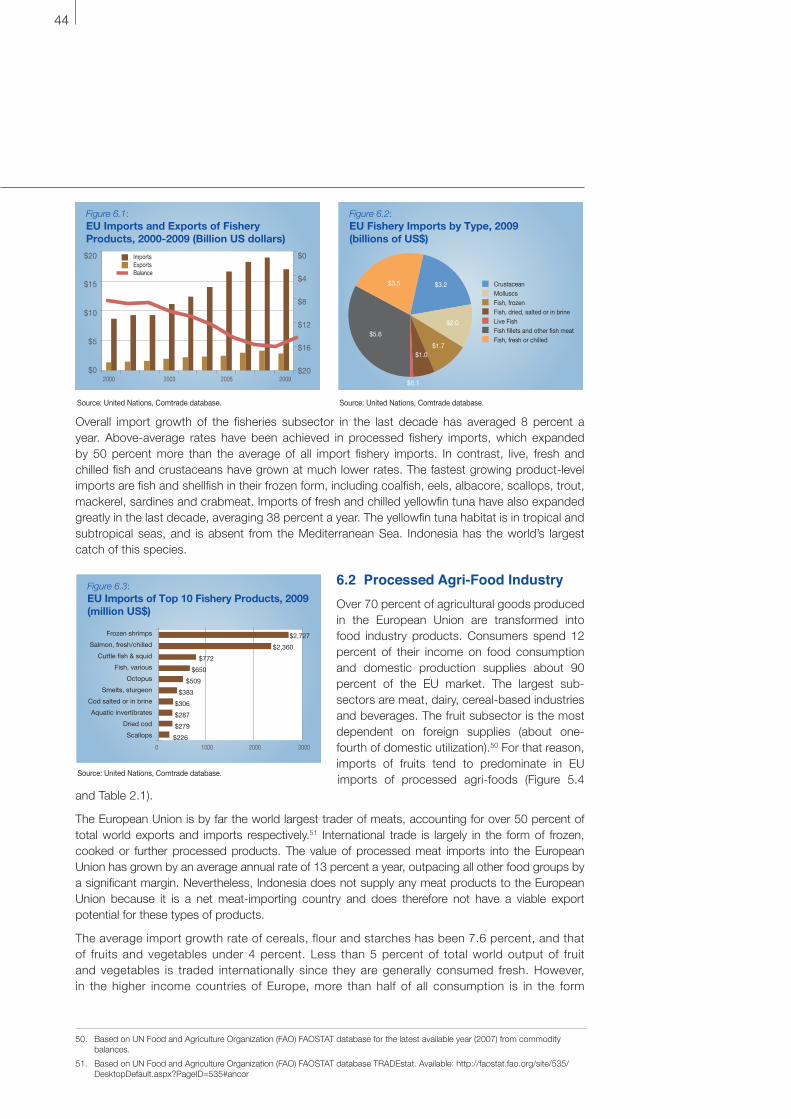
44
Overall import growth of the fisheries subsector in the last decade has averaged 8 percent a year. Above-average rates have been achieved in processed fishery imports, which expanded by 50 percent more than the average of all import fishery imports. In contrast, live, fresh and chilled fish and crustaceans have grown at much lower rates. The fastest growing product-level imports are fish and shellfish in their frozen form, including coalfish, eels, albacore, scallops, trout, mackerel, sardines and crabmeat. Imports of fresh and chilled yellowfin tuna have also expanded greatly in the last decade, averaging 38 percent a year. The yellowfin tuna habitat is in tropical and subtropical seas, and is absent from the Mediterranean Sea. Indonesia has the world’s largest catch of this species.
6.2 Processed Agri-Food IndustryOver 70 percent of agricultural goods produced in the European Union are transformed into food industry products. Consumers spend 12 percent of their income on food consumption and domestic production supplies about 90 percent of the EU market. The largest sub-sectors are meat, dairy, cereal-based industries and beverages. The fruit subsector is the most dependent on foreign supplies (about one-fourth of domestic utilization).50 For that reason, imports of fruits tend to predominate in EU imports of processed agri-foods (Figure 5.4
and Table 2.1).
The European Union is by far the world largest trader of meats, accounting for over 50 percent of total world exports and imports respectively.51 International trade is largely in the form of frozen, cooked or further processed products. The value of processed meat imports into the European Union has grown by an average annual rate of 13 percent a year, outpacing all other food groups by a significant margin. Nevertheless, Indonesia does not supply any meat products to the European Union because it is a net meat-importing country and does therefore not have a viable export potential for these types of products.
The average import growth rate of cereals, flour and starches has been 7.6 percent, and that of fruits and vegetables under 4 percent. Less than 5 percent of total world output of fruit and vegetables is traded internationally since they are generally consumed fresh. However, in the higher income countries of Europe, more than half of all consumption is in the form
Figure 6.1:EU Imports and Exports of Fishery Products, 2000-2009 (Billion US dollars)
2000 2003 2006 2009
$20
$15
$10
$5
$0
$0
$4
$8
$12
$16
$20
ImportsExportsBalance
Figure 6.2:EU Fishery Imports by Type, 2009 (billions of US$)
CrustaceanMolluscsFish, frozenFish, dried, salted or in brineLive FishFish fillets and other fish meatFish, fresh or chilled
$3.2
$2.0
$1.7$1.0
$0.1
$5.6
$3.5
Source: United Nations, Comtrade database. Source: United Nations, Comtrade database.
Source: United Nations, Comtrade database.
Figure 6.3:EU Imports of Top 10 Fishery Products, 2009 (million US$)
Frozen shrimps
Salmon, fresh/chilled
Cuttle fish & squid
Fish, various
Octopus
Smelts, sturgeon
Cod salted or in brine
Aquatic invertibrates
Dried cod
Scallops
0 1000 2000 3000
$2,727
$2,360
$772
$650
$509
$383
$306
$287
$279
$226
50. Based on UN Food and Agriculture Organization (FAO) FAOSTAT database for the latest available year (2007) from commodity balances.
51. Based on UN Food and Agriculture Organization (FAO) FAOSTAT database TRADEstat. Available: http://faostat.fao.org/site/535/DesktopDefault.aspx?PageID=535#ancor

45INDONESIA TRADE ACCESS TO THE EUROPEAN UNION: OPPORTUNITIES AND CHALLENGES
of processed fruit and vegetables, including juices.52
Among individual product categories, fruit and vegetable juices are the largest processed agri-food imported into the European Union. It alone accounts for over 18 percent of all agri-food imports. Prepared or preserved meats are the second largest imported product group, representing 17 percent of all agri-food imports. Other major imports are fruits, nuts, and edible plant parts (14 percent), prepared vegetables (13 percent), and concentrates of coffee and tea (7 percent). Bread, and pastries and sauces, condiments and seasonings each accounts for 5 percent of total agri-food imports into the European Union.
Among EU member countries, the largest importers of processed agri-foods are Netherlands (18 percent of all imports), United Kingdom (18 percent), Germany (17 percent), France (10 percent), Italy (8 percent), Spain (7 percent) and Belgium (7 percent). Together these seven countries account for 77 percent of all EU imports of processed agri-foods.
6.3 Electronics IndustryThe electronics industry produces a wide range of products, about half of which are for mass market consumption like mobile phones, televisions and personal computers (PCs); the other half are embedded in manufacturing processes, information technology (IT), and transportation equipment. The major applications are for the telecommunications, automotive, medical, and aerospace and defense industries.
Our focus in this report is on those products that are important to Indonesia, either in terms of exports or in terms domestic production of component for multinational enterprises.53 Intermediaries are particularly important to the international value distribution structure of electronics manufacturers, more so than in any other of the focal industries. Multinational firms are not tied to a particular location for sourcing electronics components.54 Instead, global production networks farm out production to diverse geographical locations to take advantage of lower costs and thereby obtain higher margins
Figure 6.4:EU Imports of Processed Agri-Foods, 2000-2009 (Billion US dollars and percentage)
2000 2003 2006 2009
$12
$9
$6
$3
$0
30%
15%
0%
-15%
All Agri-Foodsannual % change
Other Edible
Fruits & Vegetables
CerealMeats
Table 6.1: EU Top Agri-Food Product Imports, 2009 (Billion US dollars)
HS Product 2009
2009 Fruit and vegetable juices $ 2.1
1602 Prepared or preserved meat $ 2.0
2008 Fruit, nut, edible plant parts $ 1.6
2106 Other food preparations $ 1.5
2005 Vegetables, prepared/preserved $ 0.8
2101 Concentrates of tea, coffee, mate $ 0.6
1905 Baked bread, pastry $ 0.6
2103 Sauce, condiments, seasoning $ 0.5
1902 Pasta, couscous $ 0.4
1901 Malt extract, flourpreparations $ 0.4
2001 Vegetables & fruit in vinegar $ 0.3
2002 Tomatos preparations $ 0.3
2104 Soup preparations $ 0.1
2102 Yeast, baking powders $ 0.1
Sub-Total $ 11.2
All Agri-Foods $ 11.5
Source: United Nations, COMTRADE database.
52. J.H.M. Wijnands, B.M.J. van der Meulen, and K.J. Poppe (eds), “Competitiveness of the European Food Industry: An Economic and Legal Assessment”. European Commission, 2007. According to this study, producers of processed fruits and vegetables, particularly in the canning industry, are encountering stagnating consumption in high income regions like Western Europe. Under this situation, processors and other chain suppliers have attempted to exploit the increasing consumer preference for freshly processed fruits and vegetables like pre-cut, cleaned, pre-packed or as a ready-to-eat meal. Frozen products appeal to consumers as their nutritional values are almost the same as fresh vegetables and they can be stored for longer periods. Processed vegetables, fresh, canned or frozen, are also widely used in the food services.
53. The report covers electrical machinery and equipment under the Harmonized System (HS) chapter 85, and the six top Indonesian exports under HS chapter 86, namely, pumps, compressors, ventilating fans; refrigerators and freezers; parts for lifting and moving machinery; printing machinery; computers; and parts and accessories for office machine.
54. See UNCTAD, “Strengthening participation of developing countries in dynamic and new sectors of world trade: Trends, issues and policies in the electronics sector“. Geneva, September 2005. Available: http://www.unctad.org/en/docs/c1em28d2_en.pdf

46
and profits. The electronics industry value chain depends largely on component manufacturers, estimated at 30 percent of the equipment value. Equipment manufacturers include Original Equipment Manufacturers (OEM) and dedicated sub-contractors providing manufacturing services (EMS) or design services (ODM) to OEM clients.55
The top EU electronic product imports are fairly evenly distributed between mass market applications in home appliances, data processing uses, and audio and video, and in industry applications for medical, automobile, defense, and telecommunications (Table 6.2). Together these 20 imports represent 85 percent of all electronics imports.
The European Union is a net importer of electronic components. The market is by far the largest of all the focal industries. Imports in 2009 were US$280 billion. However, demand is highly responsive to income changes. As a result, year-to-year growth has varied widely, from a surge of 25 percent in the value of imports in 2004 to a
21 percent contraction in 2009 (Figure 5.5). The largest EU importers are Germany, France, United Kingdom and Italy, which together account for one-half of all electronics imports into the European Union.
6.4 Furniture IndustryThe European Union is a large and growing net importer of wood furniture, especially large furniture for offices, kitchens and bedrooms (Figure 5.6). The penetration of Chinese furniture into the EU market has grown to nearly 60 percent of the total of all types of furniture. In wood furniture, Indonesia accounts for 10 percent of all imports. However, the type of furniture supplied by Indonesia to the EU market is mainly in the form of small figurines and wood pieces rather than the more lucrative office, kitchen and bedroom furniture, where Indonesia’s market-share equal only 4 percent. The reason for this concentration is that Indonesia is less organized and exporters are small in size. They therefore find it easier to ship individual containers to the European Union than to ship larger volumes that require accredited certifications on the source of their materials for
Table 6.2: Top 20 EU Electronic ProductImports, 2009 (billion US$ and percent)
HS Product Billion US$
% of Total
8517 Electrics for linetelephony
43.1 22.1%
8541 Diodes, transistors 17.8 9.1%
8542 Electronic integrated circuits
15.6 8.0%
8529 Parts for radio &television
13.1 6.7%
8528 Television receivers & monitors
9.7 5.0%
8525 Radio and TV transmitters 8.8 4.5%
8544 Insulated wire, optical fiber cable
7.8 4.0%
8504 Electric transformers 7.5 3.9%
8536 Electrical switches,connectors
6.1 3.1%
8516 Equipment with heating element
5.7 2.9%
8523 Recording media 5.2 2.7%
8501 Electric motors andgenerators
3.4 1.7%
8520 Electronic recording equipment
3.3 1.7%
8534 Electronic printed circuits 3.3 1.7%
8518 Audio-electronicequipment
2.9 1.5%
8531 Electric sound/visual equipment
2.8 1.4%
8543 Electrical machinery nes 2.8 1.4%
8507 Electric accumulators 2.6 1.4%
8526 Radar, radio navigation equip
2.5 1.3%
8521 Video recordingapparatus
2.5 1.3%
Source: United Nations, COMTRADE database.
Figure 6.5:EU Electronics Imports (billion US$ and Percent)
2000 2003 2006 2009
$300
$225
$150
$75
$0
20%
5%
-10%
-25%
55. See Estudes Conseil, “World Electronics Industries 2008-2013“. April 2009. Available: http://www.decision.eu/doc/brochures/exec_wei_current.pdf.
Source: Based on data from United Nations, COMTRADE database

47INDONESIA TRADE ACCESS TO THE EUROPEAN UNION: OPPORTUNITIES AND CHALLENGES
their furniture items and, for their labor usage, certification of safety standards, occupational hazards, and compliance with child labor laws. These requirements are time-consuming and costly for Indonesian exporters to the EU market.
Within the European Union, the main producers are Italy and Germany, followed by France, Spain and the United Kingdom. Chain stores are the most important channel for furniture sales. On the production side, the Indonesian industry is dominated by micro enterprises having less than ten workers. These enterprises often have subcontracting arrangements with the large
manufacturers, supplying them with components and semi-finished products for the finishing and assembling of furniture.
Although there is no specific EU legislation for furniture, those related to the environment, chemicals, intellectual property, health and safety at work and trade impact on the industry. The Directive on Integrated Pollution Prevention and Control (IPPC) aims to minimize pollution from various industrial sources throughout the European Union. In addition, the European Committee for Standardization publishes voluntary quality standards that are increasingly being recognized as industry standards throughout the EU market.
Despite the obstacles created by the industry’s regulatory measures in the European Union, there is considerable potential for Indonesia producers to expand their presence in the markets for office, kitchen and bedroom furniture, especially by integrating into the value chains of large distributors. Indonesia’s competitive advantage in the EU market lies in its low labor and resources costs relative to EU producers. It also has a large skilled labor force in the wood furniture industry relative to an aging labor force in the European Union.
6.5 Cosmetic IndustryThe cosmetic market of the European Union is nearly as large as the combined markets of the United States and Japan. Common growth patterns are occurring throughout the European Union in sun care products to protect against rising concerns about skin cancer and exposure to harmful rays. In addition, the aging population of Europe is generating growing demand for anti-aging creams and anti-cellulite skin care products. There is also a growing demand for natural and organic products across all age groups.56
Barriers to entry in the EU market are mainly related to the prevalence of large multinational enterprises. Distribution channels are more important in Europe than in other markets like the United States. In Europe, consumers tend to differentiate the type of products that they purchase based on whether the product originates from mass distribution, specialized distribution, pharmacy sales and direct sales.57 Multinationals tend to have networking systems that allows them to place their products in appropriate retail outlets to target specific types of consumers. This situation makes it more difficult, but not impossible, for smaller companies to enter the market. However, in the areas of natural and organic cosmetics, there are a large number of
Figure 6.6:EU Exports and Imports of Wood Furniture, 2000-2009 (Billion US$)
2001 2003 2005 2007 2009
3.7
1.7
(0.3)
(2.3)
(4.3)
Bill.
US$
Exports of Large FurnitureExports of Other Furniture
Imports of Large FurnitureImports of Other Furniture
56. Based on data at www.euromonitor.com.
57. Global Insight, “A Study of the European Cosmetics Industry“. November 2007. Available: http://ec.europa.eu/enterprise/newsroom/cf/document.cfm?action=display&doc_id=4561&userservice_id=1
Source: United Nations, COMTRADE database
Source: United Nations, COMTRADE database
Figure 6.7: EU Cosmetic Imports by Major Product Category, 2000-2009 Average (percent distribution & growth)
Make-up, skin care
Odoriferous matter
Perfumes
Essential oils
Shaving & deodorizers
Hair preparations
Oral hygiene preps
0% 10% 20% 30%
Market share 2005-2009Growth Rate 2000-2009
11%
8%
13%
7%
10%
7%
10%

48
relatively small independent companies operating in the fast-growing European market.
The pertinent cosmetic products for Indonesia are those that use natural ingredients, either in conventional forms like creams or nonconventional ones like body scrubs. At present, Indonesia’s largest worldwide exports of cosmetics are under two broad classifications. The first is essential oils, resinoids and terpenic by-products under the HS 3301 classification; the other is beauty makeup preparations under the HS 3304 classification. Within these broad groupings, Indonesia mainly exports essential
oils of geranium, which accounts for over 70 percent of essential oils, resinoids and terpenic by-products, and essential oils of vetiver, which accounts for most of the remaining exports in this category. In the more processed products, Indonesia exports beauty makeup preparations other than those used for eyes, lips, skin or manicure or pedicure purposes.
Because of strong and rising consumption of cosmetic products in the European Union, imports have grown rapidly in the last ten years, averaging nearly 10 percent a year. The largest product categories are make-up and skin care (35 percent of all cosmetics), odoriferous substances (22 percent), perfumes (13 percent) and essential oils (11 percent). Of these product groups, imports of both make-up and skin care products and perfume products have had above-average growth rates for the period. In contrast, essential oil products, where Indonesia’s exports are mainly concentrated, have experience a sluggish growth relative to other product categories. Since the market for cosmetic products is dominated by multinationals like Procter and Gamble, L’Oreal Group, Unilever Group and Colgate-Palmolive, to participate in this growth market Indonesian, producers would have to either subcontract to these companies in pre-export processing activities within the country or export highly differentiated natural-based organic products in niche markets within Europe.
The major competitors to Indonesia in the EU cosmetic market are China, Switzerland, United States, Japan, Canada and India. These six countries supply over 80 percent of the EU market. Indonesia’s market share is currently small (0.6 percent), although it ranks number 19 in terms of largest foreign cosmetic providers to the European Union.
Figure 6.9: Market Shares of Major Developing Country Suppliers of Cosmetic Products to EU Market in 2009
9%
6%
3%
0%
IndonesiaMexico
ArgentinaThailand
BrazilIndia
China
0.6% 0.8% 1.0%1.4% 1.5%
2.1%
9.5%
Source: United Nations, COMTRADE database

49INDONESIA TRADE ACCESS TO THE EUROPEAN UNION: OPPORTUNITIES AND CHALLENGES
7 Market Access Issues for Indonesian Exporters
7.1 Trade Regulations with General Application The European Union formulates and implements its trade policies under two institutional mechanisms. The first is the Common Commercial Policy (CCP), which covers all aspects of trade in goods and some parts of standards and other technical regulations. The other mechanism is regulations of general application to trade that are enacted by the European Commission and affect all member states. The CCP ensures that trade policies are formulated and implemented at the supranational level and, as such, the European Commission (EC) manages tariffs and other trade policy instruments, including trade agreements with non-member countries. The resulting regulatory measures enacted by these institutions affect EU market access for all the focal sectors and subsectors covered in this study.
Highlights of Indonesia’s Exports to the EU Market
• Trade policies in the European Union are designed and implemented under two institutional mechanisms:
(a) The European Union’s Common Commercial Policy (CCP), which covers all aspects of trade in goods and some parts of standards and other technical regulations.
(b) Regulations of general application to trade that are enacted by the European Commission and affect all member states.
• Indonesia is a GSP beneficiary, under which it receives preferential market access.
• Non-tariff measures applicable to Indonesia and other third countries are in the form of cross-sectoral regulations and sector-specific requirements.
7.1.1 Preferential Trade Arrangements
Trade agreements between the European Union and non-European countries or groupings affect Indonesian exporters because they provide preferential conditions to competing suppliers to the EU market. Indonesia benefits from the European Union’s Generalized System of Preferences (GSP) for developing countries. Under this system, the European Union provides preferential access to 176 developing countries and territories. There is no expectation or requirement that this access be reciprocated.
Despite the benefit that the GSP provides to Indonesian exporters, there are a number of other preferences given numerous other countries that places Indonesia at a competitive disadvantage in the EU market. Preferential duty regimes under free trade agreements (FTAs) are given to countries like Chile, Mexico and South Africa and to country groupings like the Mediterranean countries, all of which have full or nearly complete duty-free access to the EU market. Additionally, the African, Caribbean and Pacific (ACP) countries receive bilateral trade preferences, and least-developed countries (LDCs) are provided duty-free access to the EU market under the Everything But Arms (EBA) initiative.
There is a preferential trade agreement being negotiated with ASEAN, under which Indonesia would benefit. However, there has been limited progress in the negotiations and the European Commission has instead opted to negotiate bilateral agreements with countries like Singapore and Vietnam. Because of its numerous preferential schemes, the EC’s entirely non-preferential MFN regime applies to only nine countries, which together supply about one-fourth of the European Union’s total imports.58 ASEAN member countries are GSP and/or EBA beneficiaries.
7.1.2 Tariffs
Most-favored-nation (MFN) rates in the European Union average 5 percent and GSP rates average less than 2 percent (Table 7.1). Nevertheless, the range of MFN tariffs is high among certain product groups. For example, the ad valorem tariff rate on processed food imports is 14 percent under the MFN schedule and 11 percent under the GPS schedule. In contrast, imports of cosmetics, electronics and furniture enter the European Union duty free for GSP beneficiary countries. In addition to the ad valorem tariff, the European Union applies other types of tariffs, excise charges, and a value added
58. Australia, Canada, Taiwan, Hong Kong, China, Japan, Republic of Korea, New Zealand, Singapore, and the United States. Based on estimates by WTO Secretariat, “Trade Policy Review: European Communities: Revision“. Report by the WTO Secretariat, 2009.

50
tax (VAT). These special tariffs are discussed in the following sections on market access conditions for the focal sectors and subsectors.59
Indonesia’s share of EU GSP eligibility has increased in the last decade (Figure 7.1). Of the total value of exports to the EU market, the proportion of exports eligible for GSP has increased from 62 to 73 percent, while the share subject to MFN rates has declined from 38 to 27 percent. It is important to underscore that these figures refer to eligibility rather than actual utilization of preferences. For utilization rates, only the early years are available, and they indicate a utilization rate of 62 percent in the mid-1990s and 63 percent in the early 2000s.60 Given these stable rates, it is likely that the same coverage applies to the more recent years.
7.1.3 Non-Tariff Measures
Prohibitions and surveillance on imports are maintained on technical, sanitary, phytosanitary, and environmental grounds. The measures generally applicable across Indonesia’s exports to the EU market are described in this section.61 Details about the specific and differentiated measures applicable to the focal sectors and subsectors are described in Section 7.2.
Licensing and quotas: Import surveillances apply to some textiles, steel products, and agricultural products, including cereals, rice, sugar, milk products, beef and veal, fresh fruit and vegetables,
59. For a general survey, see WTO Secretariat, “Trade Policy Review: European Communities: Revision“. Report by the WTO Secretariat, 2009.
60. Based on calculations in Ludo Cuyvers and Stijn Verherstraeten, “The EU’s Generalized System of Preferences and its ASEAN beneficiaries: a success story?” Centre for ASEAN Studies, CAS Discussion paper No 47, December 2005. Available: http://siteresources.worldbank.org/INTTRADERESEARCH/Resources/544824-1235150721870/ch03_candau_Jean_EU_preferences.pdf
61. For other measures, see WTO Secretariat, “Trade Policy Review: European Communities: Revision“. Report by the WTO Secretariat, 2009. This section draws on the material contained in this report and provides updates on the measures based on recent EC and WTO Secretariat reports.
Table 7.1: EU Tariffs, by Most-Favored-Nation (MFN) and by Preferences, 2010
Description #TariffLines
Min. Max. Avg GSPRate
Overall 8342 0.0 74.9 5.2 1.7
01 Live animals, animal products 459 2.0 23.0 10.0 6.5
02 Vegetable products 373 1.5 20.8 6.1 2.6
03 Animal or vegetable fats and oils 114 2.0 16.0 6.0 2.5
04 Prepared foodstuffs; beverages; tobacco 414 1.6 74.9 14.1 10.6
05 Wood and articles of wood 83 1.7 1.7 0.2 Duty free
06 Mineral products 111 0.7 8.0 1.9 Duty free
07 Products of the chemical 1244 1.5 9.0 4.2 Duty free
08 Plastics; rubber and articles thereof 351 2.0 6.5 4.7 1.2
09 Raw hides and skins, leather 113 1.7 9.7 4.0 0.5
10 Pulp of wood and paper 177 2.5 10.0 2.5 -10.0
11 Textiles and textile articles 1147 2.0 12.0 8.3 6.6
12 Footware, headgear, umbrellas 103 2.7 17.0 8.5 5.0
13 Articles of stone, plaster, cement 73 1.7 3.7 1.3 Duty free
14 Precious or semi-precious stones 63 2.0 4.0 0.7 Duty free
15 Base metals and article of base metals 885 1.5 10.0 2.1 Duty free
16 Machinery; appliances; electrical equipment 522 1.7 14.0 3.4 Duty free
17 Vahicles, and other transport equipment 266 1.7 3.7 5.1 Duty free
18 Optical, medical instruments 428 1.4 6.7 2.7 Duty free
19 Miscellaneous manufactures 70 1.7 7.7 3.3 Duty free
20 Works of art 0 0.0 0.0 0.0 Duty free
Source: WTO via Tariff Online Service, UNCTAD (EU’S GSP HANDBOOK)

51INDONESIA TRADE ACCESS TO THE EUROPEAN UNION: OPPORTUNITIES AND CHALLENGES
and processed fruits and vegetables. Tariff quotas apply to agricultural products and are managed either at the border or through import licensing. Licenses can be issued on a pro-rata or an historical basis. For agricultural products, the period of validity of import licenses depends on the product; general periods of validity are set in the relevant regulations. The validity of licenses allocated in the context of tariff quotas also varies, and it can only be extended in case of “force majeure”.
Technical requirements: Industrial products are subject to two types of requirements: those providing detailed and specific technical requirements, and those establishing essential requirements to meet health, safety, and environmental objectives. Foreign and domestic suppliers to the EU market must assume responsibility for compliance with EC legislation. Supplier must affix the “CE” mark on the product, symbolizing conformity of the product with the applicable EC requirements. 62
European Standards Organizations: At the supranational level, the European Standards Organizations (ESOs) are (i) European Committee for Standardization (CEN), (ii) European Committee for Electrotechnical Standardization (CENELEC), and (iii) European Telecommunications Standards Institute (ETSI). The European Committee for Standardization (CEN) is a European business facilitator for removing trade barriers for industry and consumers. It provides European Standards and technical specifications. The CENELEC prepares voluntary technical standards aimed at developing a Single European Market for electrical and electronic goods and services. The ETSI produces globally-applicable standards for Information and Communications Technologies (ICT), including fixed, mobile, radio, converged, broadcast and internet technologies.
Member-states accreditation conformity assessment bodies. In July 2010 a new regulation came into effect establishing common rules and structures for accreditation and market surveillance by member states. Each member state must appoint a single national accreditation body, which in turn must recognize the validity of services provided of other national accreditation bodies that have successfully passed a peer review. Under this system, member states cannot on competence grounds refuse certificates or test reports issued by other EU country-based conformity assessment bodies (CABs). Third-country CABs, such as those located in Indonesia, can take part in the European Union‘s conformity assessment activities through mutual recognition agreements (MRAs). However, at the moment Indonesia does not have any MRAs with the European Union, it does have MRAs with Asia Pacific Economic Cooperation (APEC) and the Association of Southeast Asian Nations (ASEAN).
Restrictions on Chemicals under REACH: The regime for the registration, evaluation, authorization and restriction of chemicals (REACH regulation) entered into force in 2007 to streamline previous EC legislation on chemicals. The European Chemicals Agency (ECHA) manages the technical, scientific and administrative aspects of the regulation. Under REACH, EU member countries must appoint a competent authority to cooperate with ECHA and the European Commission to carry out implementation of the regulation. The competent authority must register those chemicals that are manufactured or imported in a quantity above one ton a year, and assess the risks from their manufacture and use. The principle of nondiscrimination ensures that REACH is applied equally to locally manufactured and imported products throughout the European Union.
62. In cases where third-party certification is required, the conformity assessment is carried out by institutions designated by member states. For imports from non-European countries, compliance checks for product safety requirements are undertaken by member state authorities in charge of market surveillance, in cooperation with customs.
Figure 7.1:Indonesia’s Eligibility of EU GSP vs MFN Coverage
2000 2001 2002 2003 2004 2005 2006 2007 2008 2009
100%
75%
50%
25%
0%
62% 64% 64% 63% 67% 69% 66% 71% 74% 73%
EU GSP Preference Eligibility
EU MFN Eligibility
Source: Eurostat database adjusted EU-Extra imports by tariff regime.

52
Sanitary and phytosanitary (SPS): The European Commission applies five principles to its food safety activities: (i) food safety at all stages of the food chain; (ii) risk analysis as a fundamental component of food safety; (iii) assignment of full responsibility to producers and intermediaries for product safety of imported, produced, processed, and distributed products; (iv) traceability of products at all stages of the food chain; and (v) citizen rights to accurate and transparent information from public authorities. Key elements of the regulatory environment are as follows:
o EFSA: The European Food Safety Authority (EFSA) operates as the supranational independent risk assessment body.
o RASFF: Under the Rapid Alert System for Food and Feed (RASFF), member countries must notify the European Commission about measures requiring rapid action to protect animals and people.
o Phytosanitary Certificate: The European Commission’s phytosanitary regime covers the monitoring and control of pesticide residues, and it applies preventive measures against the introduction and spread of pests and plant diseases in the European Union. Under this regime, imports of specified plants and plant products like fresh fruit and vegetables must be accompanied by a phytosanitary certificate, issued by the national plant protection organization of the exporting country. Shipments are subject to a plant health check involving a documentary, identity, and physical check to ensure compliance with the EC’s import requirements. Reduced frequency health checks apply to some products from specific countries, based on risk profiling.
o Genetically Modified Foods: Traceability requirements apply to genetically modified (GM) food and feed to facilitate the withdrawal of products in case of unforeseen adverse effects on human and animal health. They also serve to facilitate labeling of genetically modified organisms (GMOs). Suppliers are required to inform those receiving the product that it contains GMOs, and must label their products accordingly.
7.2 Market Access Issues of Focal Industries
7.2.1 Fisheries Industry
The key elements of the regulatory environment for the fisheries industry are as follows:
Common Fisheries Policy: The Common Fisheries Policy (CFP) is the fisheries policy of the European Union. It sets quotas on the amounts of each type of fish that member states are allowed to catch. The CFP currently has four components: (i) regulation of production, quality, grading, packaging and labeling; (ii) encouraging producers organizations intended to protect fishermen from sudden market changes; (iii) setting minimum fish prices and financing buying up of unsold fish; and (iv) setting rules for trade with non-EU countries. Under the Common Organization of the Markets (COM), a system of trade creation with third countries allows the fish-processing industry to be supplied in a stable manner at competitive prices from countries like Indonesia. The intent is to ensure price stability and guarantee fair prices to producers.
EU Support to the Domestic Fisheries Industry: EU support for the sustainable development and structural adjustment of the fisheries and aquaculture subsector is provided through the Financial Instrument of Fisheries Guidance (FIFG) (structural measures in the fisheries and aquaculture subsector). Assistance is specifically granted for the restructuring of fishing fleets, aquaculture,
Box 7.1: EU Market Access for Fisheries
Tariffs: MFN GSP
Average 10.8 7.1
Maximum 23.0 19.5
Minimum 0.0 0.0
Product-Specific Requirements:• Control over illegal fishing.• Health control of fishery products intended for human consumption.• Health control of fishery products intended for animal consumption.• Labeling requirements.
• Rules of origin.
Sources: Tariffs provided by European Commission, Trade Directorate; requirements from EC Helpdesk.
53INDONESIA TRADE ACCESS TO THE EUROPEAN UNION: OPPORTUNITIES AND CHALLENGES
processing and marketing circuits, port facilities, and the revitalization of areas that depend on fisheries. There is also a Common Market Organisation (CMO) in Fishery and Aquaculture Products that provides financial compensation, carry-over aid, and private storage aid to members of the CMO. It also provides compensatory payment for the domestic tuna industry.
Control over Illegal Fishing: Beginning 1 January 2010, a certification scheme applies to marine fishery products.63 It does not, however, include aquaculture products like freshwater fish and ornamental fish. Otherwise, imports of fishery products must be accompanied by a catch certificate to demonstrate that the products concerned do not originate from Illegal, unreported and unregulated (IUU) fishing. The certificate must be submitted by the importer to the competent authorities of the EU member country to which the product is destined at least three working days before the estimated time of arrival at the place of entry into the EU territory. Beforehand, the certificate must be validated by a public authority in the home country of the fishing vessel that caught the fish to ensure that fishing vessels flying its flag comply with international rules on conservation and management of fisheries resources. The competent authorities of the EU member country can carry out all of the necessary verifications to ensure the legality of the products.
For Indonesian exporters shipping fishery products to the EU markets, the following are the specific market access requirements for fisheries:64
Tariffs: For fishery products, the average MFN rate is 10.8 percent, with a range of 0 to 23 percent; the average GSP rate is 7.1 percent, with a range from 0 to 19.5.65 For crustaceans, an ad valorem tariff of 11.1 percent applies to third countries, with a range of 6 to 18 percent; the preferential tariff rate for GSP recipient countries is 5.1 percent, with a range of 2.1 to 14.6 percent.
Specific requirements cover (a) control over illegal fishing; (b) health control of fishery products intended for human consumption; (c) health control of fishery products intended for animal consumption; (d) labeling requirements; and (e) rules of origin. These requirements are summarized below and detailed in Annex A as they relate specifically to Indonesia:
o Imports of fishery products into the European Union are subject to official certification, which is based on the recognition of the competent authority in the country by the European Commission. Specific conditions apply for imports of live or processed bivalve mollusks (e.g. mussels and clams), echinoderms (e.g. sea urchins) or marine gastropods (e.g. sea-snails and conchs). These imports are only permitted if they originate from approved and listed production areas.
o The national authorities of Indonesia are required to give guarantees on the classification of fishery products and the close monitoring of the production zones to exclude contamination with certain marine biotoxins causing shellfish poisoning. In the case of aquaculture products, a control plan on heavy metals, contaminants, residues of pesticides and veterinary drugs must be in place to verify compliance with EU requirements.
o Imports are only authorized from approved vessels and establishments like processing plants, freezer or factory vessels, cold stores that have been inspected by the competent authority of the exporting country and found to meet EU requirements. Indonesia’s establishments providing fishery products are on the European Commission’s Third Country Establishments List and those establishments are therefore able to export to the EU market.66
o Inspections by the Commission’s Food and Veterinary Office are necessary to confirm compliance with the above requirements. Border inspections are carried out, the frequency of which depends on the risk profile of the product and also on the results of previous checks.
63. European Commission, “Commission Regulation (EC) No 1010/2009 of 22 October 2009 laying down detailed rules for the implementation of Council Regulation (EC) No 1005/2008 establishing a Community system to prevent, deter and eliminate illegal, unreported and unregulated fishing”. Available: http://eur-lex.europa.eu/JOHtml.do?uri=OJ:L:2009:280:SOM:EN:HTML
64. The following information draws on material available at the European Commission’s Helpdesk for developing countries. Available: http://exporthelp.europa.eu.
65. Based on data provided to the Study Team by the European Commission.
66. For a list of approved fishery establishments in Indonesia, see European Commission, “Indonesia Fishery Products“. Available: https://sanco.ec.europa.eu/traces/output/FFP_ID_en.pdf.

54
o Under the rules of origin applicable to GSP status, all fishery products should be wholly obtained in the country from which the fish or crustaceans originate.
7.2.2 Agri-Food Processing
The key elements of the regulatory environment for the processed agri-foods industry are as follows:
Common Agricultural Policy: The Common Agricultural Policy (CAP) protects agriculture throughout the European Union by controlling prices and levels of production and by subsidizing farmers. About 40 percent of the EC budget is directed to this support scheme under the existing farm policy that extends to 2013.67 The mechanisms used by the CAP to maintain commodity price levels within the European Union and subsidize production are as follows:
o Import duties are applied to specified goods imported into the European Union in order to raise the world market price to the EU target price.
o Import quotas restrict the amount of food imported into the European Union.
o The European Commission maintains the internal market price between the intervention price and target price by purchasing goods when the internal market price falls below the intervention level.
o Direct subsidies are paid to farmers according to area of land in cultivation. This approach supersedes the previous method of paying farmers for the amount cultivated of a particular crop. Its introduction will be completed by 2011, although some EU member governments will retain control over how the new scheme is introduced.
o Legislative harmonization within the European Union is intended to ensure a level playing field for commodity trade between member countries.
Sanitary and Phytosanitary Measures: Measures related to Sanitary and Phytosanitary (SPS) are intended to protect the health of people, animals and plants. To this end, the European Union applies control standards over food and food product hygiene, animal health and welfare, plant health. It also provides rules on appropriate labeling for these foodstuffs and food products. This policy follows a so-called ‘From the Farm to the Fork’ approach that ensures a high level of safety for foodstuffs and food products at all stages of the production and distribution chains.68 This approach applies to food produced within the European Union and those imported from third countries.
Environmental Regulations: The principal components of the environmental legislation relating to the processed foods industry are (a) Integrated Pollution Prevention and Control Directive; (b) directive on packaging and packaging waste; (c) Framework Directive on Waste; and (d) climate change scheme known as the Emission Trading Scheme (ETS). The current ETS is compulsory for large food and drink companies, and is intended to reduce greenhouse gas (GHG) emissions caused by large installations at least cost.
Rules of Origin for GSP Status: The major materials such as fruits, nuts or other parts of plants and animals used in processing should be wholly obtained in the originating country, e.g., Indonesia. Manufacturing material used in the processing of the product should not exceed 30 percent of the ex-works price of the product for the non-originating materials.
Box 7.2: EU Market Access for Agri-Foods
Tariffs: MFN GSP
Average 16.9 12.4
Maximum 40.0 36.5
Minimum 0.0 0.0
Product-Specific Requirements:• Health control of non-animal foodstuffs.• Health control of products of animal origin for human consumption.• Plant health control.• Packaging.• Rules of origin.
Sources: Tariffs provided by European Commission, Trade Directorate; requirements from EC Helpdesk.
67. EU Observer, “Parliament sets out demands on CAP reform“. 08 July 2010. Available: http://euobserver.com/9/30449
68. For details, see European Commission, “Food Safety: General Provisions“. Available: http://europa.eu/legislation_summaries/food_safety/general_provisions/index_en.htm

55INDONESIA TRADE ACCESS TO THE EUROPEAN UNION: OPPORTUNITIES AND CHALLENGES
For Indonesian exporters shipping processed agri-food products to the EU markets, the following are the specific market access requirements in agri-food products:69
Tariffs: For meat preparations, an ad valorem tariff of 16.9 percent applies to third countries, and a preferential tariff rate of 12.4 percent applies to Indonesia. For processed cereals and starches, an ad valorem tariff of 6.4 percent plus 24.6 euro/100 kg and a non preferential tariff quota applies to third countries, and a preferential tariff rate of 7.4 percent applies to Indonesia. For preparations of vegetables, fruit, nuts or other parts of plants, an ad valorem tariff of 10.9 percent applies to third countries 14.4 percent (no preferential rate). Duty rates vary across individual products within each category.
Specific requirements cover (a) health control of non-animal foodstuffs; (b) health control of products of animal origin for human consumption; (c) plant health control; and (d) packaging. Imports of fishery products into the European Union are subject to official certification, which is based on the European Commission’s recognition of the competent authority in the country. Indonesia’s currently has no establishments providing processed animal products on the European Commission’s Third Country Establishments List, and there are therefore no exports of animal products to the EU market. Before being allowed entry into the EU market, Indonesian establishments would need to be approved by the national competent authority.70
7.2.3 Electronics
The key elements of the regulatory environment for the electronics industry are as follows:
Requirements in the electronics sector concern environmental and health-related problems associated with growing volumes of post-consumer waste from electrical and electronic equipment (EEE). These issues have resulted in significant environmental policy initiatives. Globalized supply chain management is important in the adjustments to new environmental requirements. Small and medium-sized enterprises (SMEs) also need to conform to requirements set by global supply chains, or risk being phased out as input providers.
For exporting countries like Indonesia, it is more effective and cost-efficient to combine adjustment to external requirements for exported EEE with adjustment to domestic needs for sound national collection and management of EEE waste, a process that extends further than mere recycling.
For GSP status, the material used in the manufacturing process cannot exceed 30 percent of the ex-works price of the product for the non-originating materials under the rules of origin.
For Indonesian exporters shipping electronics products to the EU markets, the following are the specific market access requirements:71
Tariffs: For electronics, the ad valorem tariff average of 2.8, ranges from 0 to 14 percent; the average GSP tariff rate ranges from 0 to 7 percent and averages 1.7 percent.
Specific requirements cover (a) essential requirements; (b) conformity assessment; (c) CE marking; (d) market surveillance; (e) marketing requirements; and (f) rules of origin.
Box 7.3: EU Market Access for Electronics
Tariffs: MFN GSP
Average 2.8 1.7
Maximum 14.0 7.0
Minimum 0.0 0.0
Product-Specific Requirements:• Essential requirements.• Conformity assessment.• CE marking.• Market surveillance• Marketing requirements• Rules of origin
Sources: Tariffs provided by European Commission, Trade Directorate; requirements from EC Helpdesk.
69. The following information draws on material available at the European Commission’s Helpdesk for developing countries. Available: http://exporthelp.europa.eu.
70. For a useful list of frequently asked questions (FAQs) about exporting food products to the EU market, see European Commission “Guidance Document: Key questions related to import requirements and the new rules on food hygiene and official food controls“. Health and Consumer Protection Directorate-General. Available: http://ec.europa.eu/food/international/trade/interpretation_imports.pdf
71. The following information draws on material available at the European Commission’s Helpdesk for developing countries. Available: http://exporthelp.europa.eu.
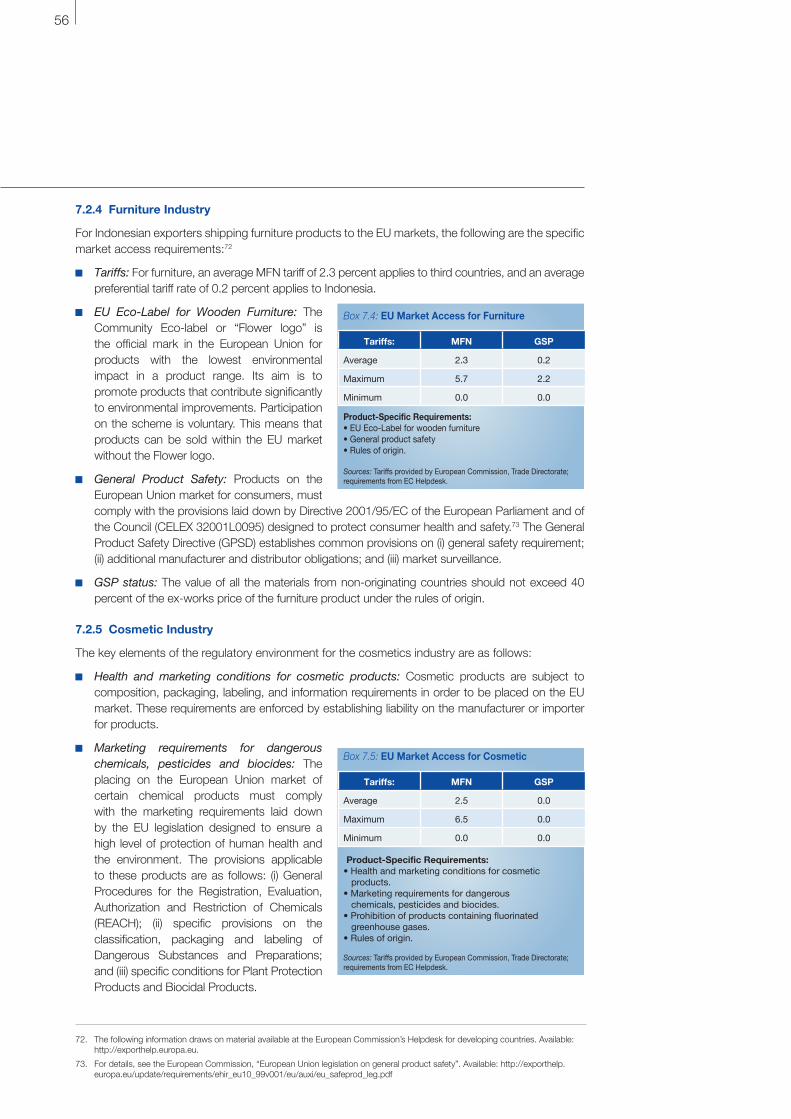
56
7.2.4 Furniture Industry
For Indonesian exporters shipping furniture products to the EU markets, the following are the specific market access requirements:72
Tariffs: For furniture, an average MFN tariff of 2.3 percent applies to third countries, and an average preferential tariff rate of 0.2 percent applies to Indonesia.
EU Eco-Label for Wooden Furniture: The Community Eco-label or “Flower logo” is the official mark in the European Union for products with the lowest environmental impact in a product range. Its aim is to promote products that contribute significantly to environmental improvements. Participation on the scheme is voluntary. This means that products can be sold within the EU market without the Flower logo.
General Product Safety: Products on the European Union market for consumers, must comply with the provisions laid down by Directive 2001/95/EC of the European Parliament and of the Council (CELEX 32001L0095) designed to protect consumer health and safety.73 The General Product Safety Directive (GPSD) establishes common provisions on (i) general safety requirement; (ii) additional manufacturer and distributor obligations; and (iii) market surveillance.
GSP status: The value of all the materials from non-originating countries should not exceed 40 percent of the ex-works price of the furniture product under the rules of origin.
7.2.5 Cosmetic Industry
The key elements of the regulatory environment for the cosmetics industry are as follows:
Health and marketing conditions for cosmetic products: Cosmetic products are subject to composition, packaging, labeling, and information requirements in order to be placed on the EU market. These requirements are enforced by establishing liability on the manufacturer or importer for products.
Marketing requirements for dangerous chemicals, pesticides and biocides: The placing on the European Union market of certain chemical products must comply with the marketing requirements laid down by the EU legislation designed to ensure a high level of protection of human health and the environment. The provisions applicable to these products are as follows: (i) General Procedures for the Registration, Evaluation, Authorization and Restriction of Chemicals (REACH); (ii) specific provisions on the classification, packaging and labeling of Dangerous Substances and Preparations; and (iii) specific conditions for Plant Protection Products and Biocidal Products.
Box 7.5: EU Market Access for Cosmetic
Tariffs: MFN GSP
Average 2.5 0.0
Maximum 6.5 0.0
Minimum 0.0 0.0
Product-Specific Requirements:• Health and marketing conditions for cosmetic products.• Marketing requirements for dangerous chemicals, pesticides and biocides.• Prohibition of products containing fluorinated greenhouse gases.• Rules of origin.
Sources: Tariffs provided by European Commission, Trade Directorate; requirements from EC Helpdesk.
Box 7.4: EU Market Access for Furniture
Tariffs: MFN GSP
Average 2.3 0.2
Maximum 5.7 2.2
Minimum 0.0 0.0
Product-Specific Requirements:• EU Eco-Label for wooden furniture• General product safety• Rules of origin.
Sources: Tariffs provided by European Commission, Trade Directorate; requirements from EC Helpdesk.
72. The following information draws on material available at the European Commission’s Helpdesk for developing countries. Available: http://exporthelp.europa.eu.
73. For details, see the European Commission, “European Union legislation on general product safety”. Available: http://exporthelp.europa.eu/update/requirements/ehir_eu10_99v001/eu/auxi/eu_safeprod_leg.pdf

57INDONESIA TRADE ACCESS TO THE EUROPEAN UNION: OPPORTUNITIES AND CHALLENGES
Rules of Origin Applicable to GSP Status: Materials of the same product classification group as the cosmetic product can be used, provided that the total value does not exceed 20 percent of the ex-works price of the product for non-originating materials. For manufactured cosmetics, the value of all the materials from non-originating countries should not exceed 40 percent of the ex-works price of the product.
For Indonesian exporters shipping cosmetics products to the EU markets, the following are the specific market access requirements:74
Tariffs: For cosmetics, an average MFN rate of 2.5, and an average preferential tariff rate of 0.2 percent applies to Indonesia.
Specific requirements on technical standards applicable to cosmetic products cover (a) health and marketing conditions for cosmetic products; (b) marketing requirements for dangerous chemicals, pesticides and biocides (when intended to be used in plant protection products and/or biocides); (c) prohibition of products containing fluorinated greenhouse gases (when used with aerosols for entertainment and decorative purposes containing hydrofluorocarbons); and (d) rules of origin.
74. The following information draws on material available at the European Commission’s Helpdesk for developing countries. Available: http://exporthelp.europa.eu.

59INDONESIA TRADE ACCESS TO THE EUROPEAN UNION: OPPORTUNITIES AND CHALLENGES
PART III:
INDONESIA’S POSITION TO TACKLE EU MARKET POTENTIAL

60
8.1 Export Drivers EU Import demand for Indonesia’s exports can be described as a two-stage process. First, the consumer decides how much of a particular product he or she wants to buy; second, he or she decides from whom to buy the product.75 The first stage is described in Chapter 5 and is reflected in the magnitude of import demand estimates calculated by the Study Team. In this Chapter, we describe and estimate the EU demand for Indonesia’s exports of products from each of the focal industries.76 Here we provide an intuitive explanation of that relationship, summarize the estimated equations, and use those estimates to generate medium-term forecasts of Indonesia’s exports to the EU market for products of the focal industries.
The main drivers of EU demand for Indonesia’s exports are the overall demand for EU product imports and price and non-price factors. As mentioned earlier, import demand depends on income in the long-run, while price effects tend to have a transitional effect on that demand. All other things being equal, Indonesia’s exports would have a proportional response to EU imports, that is, they would tend to grow by the same proportion as imports. Hence, Indonesia’s market shares would remain the same as long as competing suppliers to the market did not alter their market shares through changes in their competitive positions.
8 Outlook for Exports to EU Market
Highlights of Indonesia’s Export Outlook in EU Market
• Indonesia has suffered important losses in EU market shares in all products originating from the focal sectors.
• Export price movements were responsible for some losses, notably in the early part of the decade and in 2007, while the exchange rate pass-through caused by the real cross-rate appreciation of the rupiah relative to the euro brought about significant market share losses in 2002 and 2006.
• However, it was the non-price factors that were consistently responsible for the deterioration in Indonesia’s participation of the EU market beginning.
• To the extent that Indonesia could have overcome its supply impediments on exports and maintained its share of the EU market for the focal industry products, foreign exchange revenue from the industry would have been nearly 13 percent higher in 2005-2009 than was actually achieved.
• Overcoming those obstacles will require considerable effort on the part of the industries, particularly in terms of EQI requirements. However, the benefits to the industries are considerable, as are the economy-wide impact that would be produced from additional employment and expenditures on other sectors.
Price and non-price factors can affect the competitiveness of Indonesia relative to comparator countries and cause export growth to exceed or fall short of the demand for imports.77 Demand for Indonesia’s exports is therefore driven by foreign market incomes, while deviations from the growth in import demand arise from price and non-price differentials between Indonesia’s exports and those of competing suppliers. From the point of view of the European consumer, the price differential depends on both the local currency prices of products originating in the focal industries and the real exchange rate, measured by the nominal exchange rate of Indonesia adjusted by inflation differential with the comparator countries.
Table 10.1 summarizes the income and price elasticities of the demand for Indonesia’s exports in the focal subsectors, based on the Study Team’s estimated equations. The average foreign income elasticity of export demand of the products from the focal industries equals 7 in the short run and 8.4 in the long run. Furniture and electronics have fairly low foreign income elasticities, ranging from 1.3 to 2.5 in the long-run. In contrast, cosmetics, fruit juices and shrimp have long-run foreign income elasticities ranging from 9.3 to 17.2. Although high and therefore very beneficial to exporters, they are within international elasticities of export demand for emerging exports to high-growth markets,
75. In consumer welfare economics, this process is referred to as the ‘utility tree’. For the theoretical underpinnings, see Deaton, A. and J. Muellbauer (1980), “An Intertemporal System of Dynamic Consumer Demand Functions”. CLE Discussion Paper. For the econometric technique used to measurement the process, see Brown, M., and D. Heien (1972), “The S-Branch Utility Tree: A Generalization of the Linear Expenditure System”. Econometrica 40(4): 737-47.
76. A Technical Appendix on the quantitative methodology used by the Study Team is available upon request.
77. Note that the supply of imports is always assumed to perfectly price elastic in the international trade literature. For a derivation of the complete system of trade in the utility tree, see Montague Lord, Imperfect competition and international commodity trade : theory, dynamics, and policy modelling. Clarendon Press, Oxford, 1991.
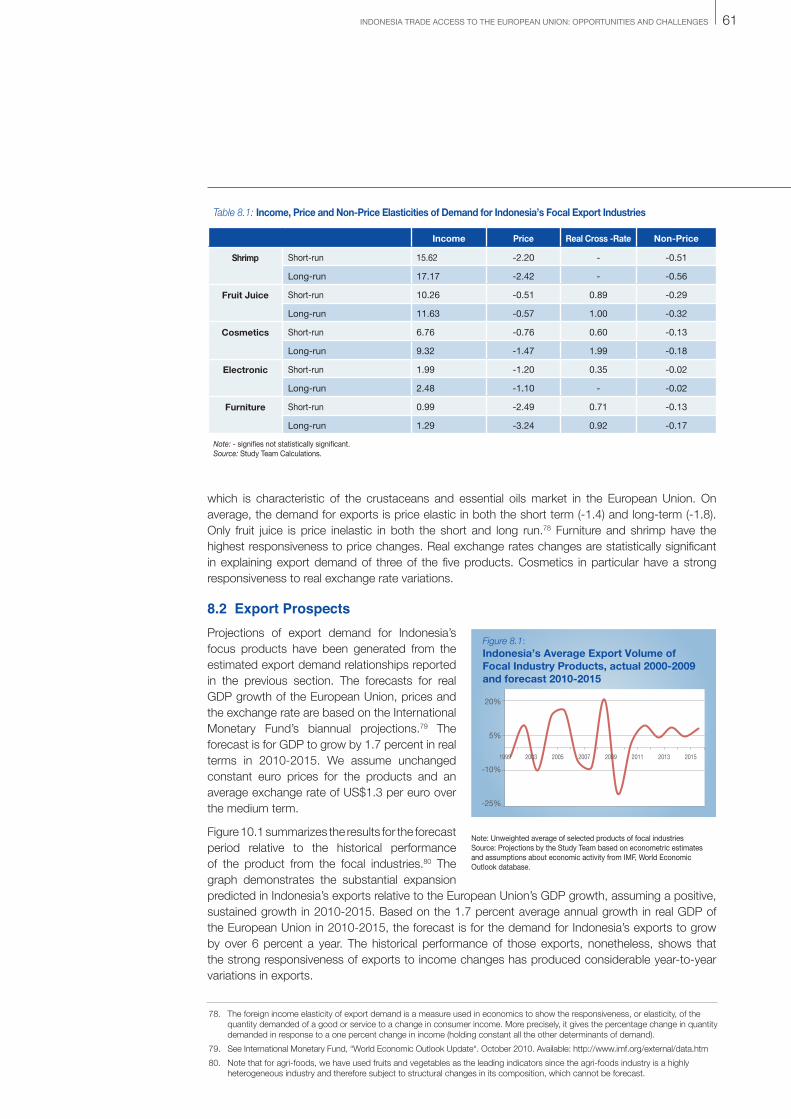
61INDONESIA TRADE ACCESS TO THE EUROPEAN UNION: OPPORTUNITIES AND CHALLENGES
which is characteristic of the crustaceans and essential oils market in the European Union. On average, the demand for exports is price elastic in both the short term (-1.4) and long-term (-1.8). Only fruit juice is price inelastic in both the short and long run.78 Furniture and shrimp have the highest responsiveness to price changes. Real exchange rates changes are statistically significant in explaining export demand of three of the five products. Cosmetics in particular have a strong responsiveness to real exchange rate variations.
8.2 Export ProspectsProjections of export demand for Indonesia’s focus products have been generated from the estimated export demand relationships reported in the previous section. The forecasts for real GDP growth of the European Union, prices and the exchange rate are based on the International Monetary Fund’s biannual projections.79 The forecast is for GDP to grow by 1.7 percent in real terms in 2010-2015. We assume unchanged constant euro prices for the products and an average exchange rate of US$1.3 per euro over the medium term.
Figure 10.1 summarizes the results for the forecast period relative to the historical performance of the product from the focal industries.80 The graph demonstrates the substantial expansion predicted in Indonesia’s exports relative to the European Union’s GDP growth, assuming a positive, sustained growth in 2010-2015. Based on the 1.7 percent average annual growth in real GDP of the European Union in 2010-2015, the forecast is for the demand for Indonesia’s exports to grow by over 6 percent a year. The historical performance of those exports, nonetheless, shows that the strong responsiveness of exports to income changes has produced considerable year-to-year variations in exports.
Table 8.1: Income, Price and Non-Price Elasticities of Demand for Indonesia’s Focal Export Industries
Income Price Real Cross -Rate Non-Price
Shrimp Short-run 15.62 -2.20 - -0.51
Long-run 17.17 -2.42 - -0.56
Fruit Juice Short-run 10.26 -0.51 0.89 -0.29
Long-run 11.63 -0.57 1.00 -0.32
Cosmetics Short-run 6.76 -0.76 0.60 -0.13
Long-run 9.32 -1.47 1.99 -0.18
Electronic Short-run 1.99 -1.20 0.35 -0.02
Long-run 2.48 -1.10 - -0.02
Furniture Short-run 0.99 -2.49 0.71 -0.13
Long-run 1.29 -3.24 0.92 -0.17
Note: - signifies not statistically significant.Source: Study Team Calculations.
Figure 8.1:Indonesia’s Average Export Volume of Focal Industry Products, actual 2000-2009 and forecast 2010-2015
20%
5%
-10%
-25%
1999 2003 2005 2007 2009 2011 2013 2015
Note: Unweighted average of selected products of focal industriesSource: Projections by the Study Team based on econometric estimates and assumptions about economic activity from IMF, World Economic Outlook database.
78. The foreign income elasticity of export demand is a measure used in economics to show the responsiveness, or elasticity, of the quantity demanded of a good or service to a change in consumer income. More precisely, it gives the percentage change in quantity demanded in response to a one percent change in income (holding constant all the other determinants of demand).
79. See International Monetary Fund, “World Economic Outlook Update“. October 2010. Available: http://www.imf.org/external/data.htm
80. Note that for agri-foods, we have used fruits and vegetables as the leading indicators since the agri-foods industry is a highly heterogeneous industry and therefore subject to structural changes in its composition, which cannot be forecast.

62
The export projections for individual products are presented in Table 10.2. Among the most dynamic products are fisheries and cosmetics. The other product groups, nevertheless, are also expected to have robust growth rates, ranging from nearly 5 percent for electronics to over 6 percent for agri-foods.
8.3 Regaining Market SharesIndonesia has suffered important losses in EU market shares since 2005 in all products originating from the focal sectors. Our estimates of the export relationships of these products suggest that those losses were largely due to non-price factors, which include supply impediments like EQI limitations (Figure 10.2). Export price movements were responsible for some losses, notably in 2000-2001 and 2007, and exchange rate pass-through caused by the real cross-rate appreciation of the rupiah relative to the euro brought about significant market share losses in 2002 and 2006. However, it was the non-price factors that were consistently responsible for the deterioration in Indonesia’s participation of the EU market beginning.
In fisheries, Indonesia’s share of the EU market has steadily declined since 2000. It began the decade with 5.9 percent of total EU imports from third countries and it ended the decade with a 4.1 percent share. Our estimates suggest that those losses were largely due to non-price factors associated with supply impediments like EQI limitations. Export price movements had a positive effect on Indonesia’s market shares in the first half of the decade, and a significantly negative impact in 2008. Exchange rate pass-through caused by the real cross-rate appreciation of the rupiah relative to the euro was not found to have significantly impact on Indonesia’s competitiveness in the EU market. Non-price factors, however, had a consistently negative impact on Indonesia’s competitiveness through the decade. That negative impact was especially noticeable at the beginning of the decade and in 2009. On average, the non-price effects on Indonesia’s export competitiveness in the EU market more than offset improvements in the relative price of the products themselves, thereby producing an overall reduction in Indonesia’s share of EU imports from third countries.
In agri-foods, Indonesia’s share of the agri-foods market in the European Union has fallen over the last decade. Our estimates of the export relationship for the Indonesian agri-food industry suggest that those losses were almost wholly due to non-price factors associated with supply impediments
like EQI limitations. Export price movements had a favorable impact on market shares, with the exception of 2007 and, to a lesser extent, at the beginning and end of the decade. On average, non-price factors reduced Indonesia’s market share by 15 percent. In contrast, the industry’s competitive export prices helped to improve market shares by an average of 6 percent during the period. The net gains, however, were not enough to offset the negative effects from EQI and other supply-related factors affecting the industry’s performance.
In consumer electronics, Indonesia’s share of the EU consumer electronics market has
Table 8.2: Income, Price and Non-Price Elasticities of Demand for Indonesia’s Focal Export Industries
Tariffs: 2001-2009 2010-2015
Fisheries -10% 7.8%
Agri-Foods -6% 6.3%
Electronics 18% 4.9%
Furniture -6% 5.8%
Cosmetics 10% 7.3%
Average 1.4% 6.4%
Source: Projections by the Study Team based on econometric estimates and assumptions about economic activity from IMF, World Economic Outlook database.
Figure 8.2: Price and Non-Price Factors Impacting on Indonesia’s Shares of EU Market for Focal Sectors, 2000-2009
2001 2002 2004 2006 2008
15.%
10.%
5%
0%
-5%
-0%
-15%
Relative export price effectReal cross-rate effectNon-price effects
Source: Derived from estimates in Technical Annex to Interim Report 3.Background paper to the Study..
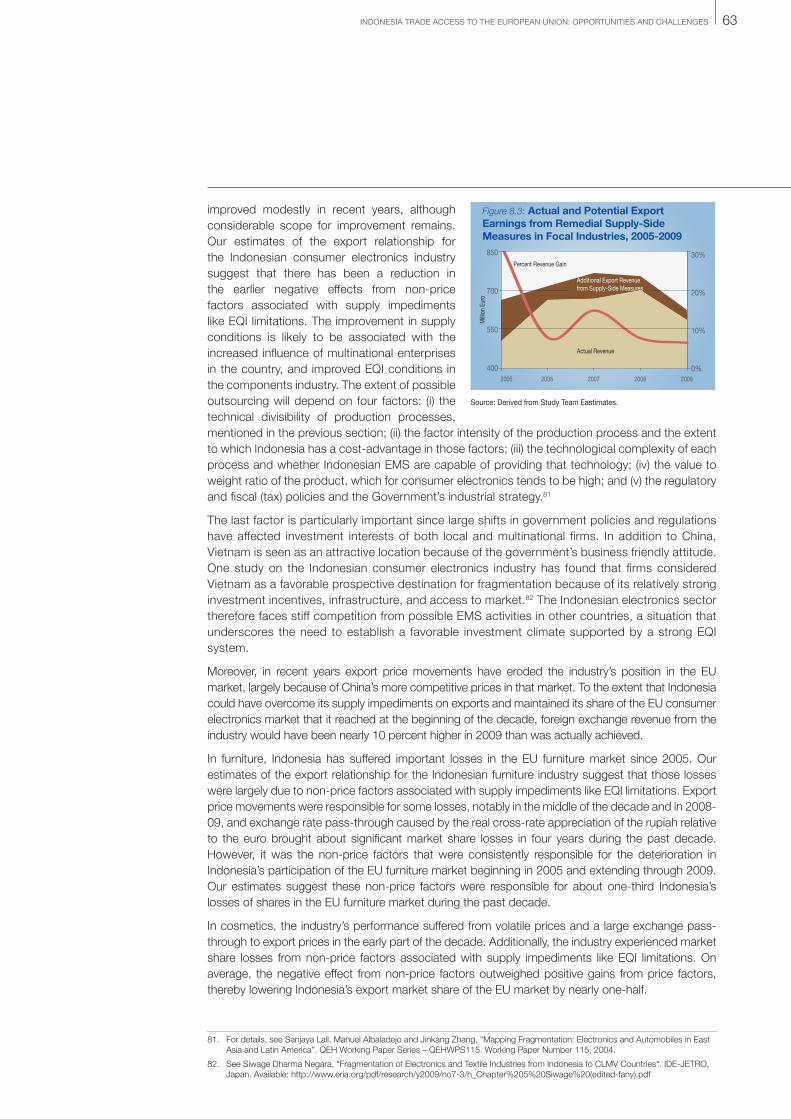
63INDONESIA TRADE ACCESS TO THE EUROPEAN UNION: OPPORTUNITIES AND CHALLENGES
improved modestly in recent years, although considerable scope for improvement remains. Our estimates of the export relationship for the Indonesian consumer electronics industry suggest that there has been a reduction in the earlier negative effects from non-price factors associated with supply impediments like EQI limitations. The improvement in supply conditions is likely to be associated with the increased influence of multinational enterprises in the country, and improved EQI conditions in the components industry. The extent of possible outsourcing will depend on four factors: (i) the technical divisibility of production processes, mentioned in the previous section; (ii) the factor intensity of the production process and the extent to which Indonesia has a cost-advantage in those factors; (iii) the technological complexity of each process and whether Indonesian EMS are capable of providing that technology; (iv) the value to weight ratio of the product, which for consumer electronics tends to be high; and (v) the regulatory and fiscal (tax) policies and the Government’s industrial strategy.81
The last factor is particularly important since large shifts in government policies and regulations have affected investment interests of both local and multinational firms. In addition to China, Vietnam is seen as an attractive location because of the government’s business friendly attitude. One study on the Indonesian consumer electronics industry has found that firms considered Vietnam as a favorable prospective destination for fragmentation because of its relatively strong investment incentives, infrastructure, and access to market.82 The Indonesian electronics sector therefore faces stiff competition from possible EMS activities in other countries, a situation that underscores the need to establish a favorable investment climate supported by a strong EQI system.
Moreover, in recent years export price movements have eroded the industry’s position in the EU market, largely because of China’s more competitive prices in that market. To the extent that Indonesia could have overcome its supply impediments on exports and maintained its share of the EU consumer electronics market that it reached at the beginning of the decade, foreign exchange revenue from the industry would have been nearly 10 percent higher in 2009 than was actually achieved.
In furniture, Indonesia has suffered important losses in the EU furniture market since 2005. Our estimates of the export relationship for the Indonesian furniture industry suggest that those losses were largely due to non-price factors associated with supply impediments like EQI limitations. Export price movements were responsible for some losses, notably in the middle of the decade and in 2008-09, and exchange rate pass-through caused by the real cross-rate appreciation of the rupiah relative to the euro brought about significant market share losses in four years during the past decade. However, it was the non-price factors that were consistently responsible for the deterioration in Indonesia’s participation of the EU furniture market beginning in 2005 and extending through 2009. Our estimates suggest these non-price factors were responsible for about one-third Indonesia’s losses of shares in the EU furniture market during the past decade.
In cosmetics, the industry’s performance suffered from volatile prices and a large exchange pass-through to export prices in the early part of the decade. Additionally, the industry experienced market share losses from non-price factors associated with supply impediments like EQI limitations. On average, the negative effect from non-price factors outweighed positive gains from price factors, thereby lowering Indonesia’s export market share of the EU market by nearly one-half.
Source: Derived from Study Team Eastimates.
Figure 8.3: Actual and Potential Export Earnings from Remedial Supply-Side Measures in Focal Industries, 2005-2009
2005 2006 2007 2008 2009
850
700
550
400
30%
20%
10%
0%
Percent Revenue Gain
Milli
on E
uro
Additional Export Revenue from Supply-Side Measures
Actual Revenue
81. For details, see Sanjaya Lall, Manuel Albaladejo and Jinkang Zhang, “Mapping Fragmentation: Electronics and Automobiles in East Asia and Latin America”. QEH Working Paper Series – QEHWPS115. Working Paper Number 115, 2004.
82. See Siwage Dharma Negara, “Fragmentation of Electronics and Textile Industries from Indonesia to CLMV Countries“. IDE-JETRO, Japan. Available: http://www.eria.org/pdf/research/y2009/no7-3/h_Chapter%205%20Siwage%20(edited-fany).pdf

65INDONESIA TRADE ACCESS TO THE EUROPEAN UNION: OPPORTUNITIES AND CHALLENGES
9.1 Importance of Focal Industries
9.1.1 Importance of Focal Industries to Indonesia
Fisheries – Although frozen forms of fish and crustaceans dominate exports, Indonesia is increasingly supplying processed products to overseas customers. The globalization of fishery value chains is also growing fast, and an increasing number of producers in Indonesia and other developing countries are therefore linking their export-oriented fishery products with firms located abroad. Outsourcing of processing operations is also spreading quickly. But for Indonesia the major impediment to bringing processing operations to the country is sanitary and phytosanitary (SPS) requirements in the EU and other developed markets. If Indonesian processing facilities are able to meet quality and safety standards in Europe, their lower processing costs will compare favorably with EU-based fisheries that face reduced margins from higher capital and labor costs and the growing scarcity of fish stocks.
Agri-Foods – In the last decade the industry has steadily increased its contribution to the total output value of the Indonesian economy. The share of agri-food production in the economy’s
9 Indonesia’s Export Performance in EU Market
Highlights of Indonesia’s Export Performance to EU Market
• Globalization of value chains for Indonesia’s focal industries is providing scale economies for local producers linking their products with overseas firms.
• Despite the European Union’s dominance predominance in global consumption of the focal industry products, Indonesia’s share of exports destined for the EU market is under-represented in terms of that market’s importance.
• Indonesia faces stiff competition from China and other fast growing exporters to the EU market. There is, nevertheless, considerable competition among third country suppliers to that market, and market shares are quickly changing.
• Indonesia’s export prices in the EU market are generally competitive in local currency units, but undervalued currencies of many competitors have undermined Indonesia’s competitiveness.
• Indonesia is a beneficiary of EU trade preferences, but has not taken full advantage of those opportunities.
• An EU-ASEAN FTA would deepen opportunities for Indonesia through increased foreign investment, technology and knowledge transfers, and development assistance, especially in supporting small producers with as-yet unrealized export potential to the EU market.
total output rose from 13 percent to more than 16 percent during the decade. This development has produced important benefits to the growth and employment of other sectors because of upstream and downstream linkages to input activities and service-related industries. These effects are particularly important for small and medium size enterprises (SMEs), which predominate in upstream activities.
Consumer Electronics – Electronics is the largest contributor to Indonesia’s foreign exchange earnings from manufactured exports. It accounts for nearly one-fifth of total manufacturing exports, with consumer electronics leading industrial electronics by a two-to-one ratio. There are currently 235 electronics companies operating in Indonesia, most of which produce basic rather than cutting edge technology-based products. Both the Government and the private sector would like to increase the domestic content of electronics products from the original equipment manufacturers (OEMs). However, major obstacles remain from poor infrastructure, particularly road, electricity and logistics. Moreover, exports of consumer electronics are heavily concentrated in a few basic types of products.
Furniture – Indonesia’s furniture industry has been one of the fastest growing manufacturing activities in the country. Moreover, while the furniture industry has steadily grown, the value added of wood and other wood product activities to the economy has fallen in all but one year. As a result, the furniture industry’s contribution to the total value added of wood-based manufacturing activities has grown from less than one-quarter at the beginning of the decade to more than one-half of all wood-based manufacturing activities. Over 75 percent of Indonesia’s furniture exports are in the form of wood-based items. This type of furniture is widely produced throughout the world and is commonly imported throughout the European Union, as well as the United States.

66
Cosmetics – Indonesia’s interests in natural cosmetics are in both the end products and the ingredients used to make natural cosmetics. Indonesian producers have a natural advantage over suppliers in most other countries because of the country’s biodiversity. However, they face stiff competition in both domestic and foreign markets from low-cost producers in China. In the area of end-use products, Indonesia exports beauty makeup preparations in the form of perfumes and fragrances, hair care and styling products. In the area of ingredients used in the production of natural cosmetics, Indonesia mainly exports essential oils of geranium, which accounts for over 70 percent of essential oils, resinoids and terpenic by-products, and essential oils of vetiver, which accounts for most of the remaining exports in this category.
9.1.2 Major Export Markets
Fisheries – The European Union is the world’s largest importer of fishery products, accounting for 25 of the world total. Yet the EU market only accounts of 11 percent of Indonesia’s total exports. While the United States and Japan each account for a much lower share (16 percent) of total world imports, Indonesia exports 35 percent of its fishery products to the United States and another 27 percent to Japan. There is therefore considerable scope for Indonesia to increase the amount that it exports to the EU market. If it were to expand its share of exports to the EU market to the same proportion as the European Union’s share of world imports, Indonesia’s foreign exchange revenue from its fishery exports would more than double, expanding from US$253 million to US$561 million in terms of the value of those exports in 2009.
Agri-Foods – Agri-food exports of Indonesia are highly concentrated in the ASEAN regional market, with over 40 percent of this industry’s exports directed at neighboring countries. The EU and U.S. markets each absorb about 15 percent of Indonesia’s agri-food exports. The share of exports destined for countries in Europe, the United States and Japan is small compared with the size and agri-food absorption of those markets. The European Union, for example is the world’s largest market for these types of products, and Japan is the world’s largest net importer of food products.
Consumer Electronics – The European Union is Indonesia’s largest export market for consumer electronic. Important export markets are Germany, Netherlands, Belgium and the United Kingdom. The United States is Indonesia’s second largest export market followed by that of the ASEAN member countries. Within the Asian region, the most important markets are the Philippines, Malaysia, Thailand, Vietnam, and Singapore for both the domestic market and transshipments to other markets.
Furniture – Indonesia’s furniture exports are predominantly directed at three markets: the European Union (33 percent of all furniture exports), the United States (30 percent), and Japan (16 percent). Within the European Union, the largest individual country markets are Germany, France, Netherlands, United Kingdom, and Belgium. Among the different types of furniture, over two-thirds of exports to the EU market are in the form of wooden furniture and the remaining one-third is made of bamboo, rattan, cane or osier.
Cosmetics – Indonesia’s cosmetics exports are largely directed to other ASEAN member countries. Exports to the European Union only absorb 10 of total cosmetic exports, and the bulk of those exports are directed to the large economies of Germany, France, the United Kingdom, the Netherlands and Spain.
9.1.3 Major Global Competitors
Fisheries – China dominates the global seafood markets for both processed and unprocessed fish. In addition to exports from domestic fisheries sources, China also exports reprocessed imported raw material, adding considerable value in the process. Indonesia ranks number 10 in terms of major world exporters of fish. Other major exporters are Norway, the United States, Canada, Chile and Thailand.
Agri-Foods – Five countries dominate third country competition in the EU market for agri-foods: Brazil, Turkey, China, United States and Thailand. Together these countries account for one-half
67INDONESIA TRADE ACCESS TO THE EUROPEAN UNION: OPPORTUNITIES AND CHALLENGES
of the European Union’s imports of food products from non-EU suppliers. Indonesia’s share of the EU market is modest and there is considerable room for growth. An important growth area is organic food ingredients and food products, since Europe has been unable to supply its population in this sub-sector. Direct exports of organic food ingredients to end customers are possible through specialized companies and supermarket chains.
Consumer Electronics – The EU market for consumer electronics is dominated by China’s products. Almost 60 percent of all non-EU products imports originate in China. Turkey, with 13 percent of the market, is the only other country with a significantly large market share. Although Indonesia is the seventh largest non-EU supplier of consumer electronics to the market its 2 percent market share is small.
Furniture – China’s share of world furniture trade increased from 7.5 to 25 percent between 2000 and 2009. This remarkable expansion has been due to China’s low-wage labor, access to raw materials, and favorable exchange rates. However, the industry faces rising labor costs, increasing protection of its natural forests, and a lack of branding by the multitude of small and medium size enterprises in the industry. At the same time, several relatively small producers have aggressively increased overseas sales. Vietnam in particular has enhanced its domestic production and overseas sales because of manufacturing wage rates that are even lower than those in China and the Government of Vietnam’s support to the industry’s upgrading of its processing equipment. Among the major industrialized furniture producing countries, only Germany has succeeded in significantly increasing its share of the global furniture market in the last decade by focusing on quality furniture products.
Cosmetics – The top three suppliers to the EU cosmetics market are the United States, Switzerland and China, which together provide three-fourths of all EU cosmetics imports from third countries. There has been considerable competition among these and other suppliers, and market shares have changed considerably in the last ten years. Other foreign suppliers with significant market shares are Japan, Canada and India. Indonesia’s market share is small (0.6 percent), although it ranks number 19 in terms of largest foreign cosmetics providers to the European Union.
9.2 Export Competitiveness in EU MarketIndonesia ranks number 44 out of 134 countries in the World Economic Forum’s Global Competitiveness Ranking, behind comparator countries like Singapore (number 3), South Korea (22), Malaysia (26), China (27), Brunei (28), and Thailand (38).83 It is also ranked number 121 out of 183 countries in terms of ease of doing business, and number 41 in terms of ease of trading across borders.84 Past studies on Indonesia’s competitiveness have attempted to identify internal and external constraints of the country’s trade underperformance relative to many of its ASEAN and other Asian peers.85 In general, they find that while Indonesia has been a relatively low-tariff country by developing-country standards, non-tariff barriers (NTBs) have increased in the last decade.86 Equally important, the lack of consistency and a single authority over trade policies have contributed to the proliferation of NTBs.87 More importantly for purposes of the present study is the finding that general trends about Indonesia’s performance and associated competitiveness mask several important developments at the sector, sub-sector or industry level. These more specific developments have taken place in greater protection in consumer electronics and other areas, as well as Infrastructural limitations, restrictions on foreign direct investment, and product and labor market regulations, which have all contributed to the sub-optimal trade performance of Indonesia. These more specific findings underscore the importance of examining the obstacles impeding the development of Indonesia’s full export potential to the EU market.
83. See World Economic Forum, “The Global Competitiveness Report 2010-2011”. Available: http://www3.weforum.org/docs/WEF_GlobalCompetitivenessReport_2010-11.pdf.
84. See International Financial Corporation (IFC), “Doing Business”. Available: http://www.doingbusiness.org/rankings.
85. ADB, “Indonesia: Critical Development Constraints”. Country Diagnostics Studies, 2010.
86. See OECD, “Recovery and Beyond: Enhancing Competitiveness to Realize Indonesia’s Trade Potential”. TAD/TC/WP(2008)14.
87. See Ash Center for Democratic Governance and Innovation, “From Reformasi to Institutional Transformation: A Strategic Assessment of Indonesia’s Prospects for Growth, Equity and Democratic Governance”. Harvard Kennedy School, April 2010.

68
The present study goes beyond these generalizations to examine how Indonesia’s competitiveness in specific sub-sectors and industries is largely determined by four interrelated conditions: (i) export prices relative to those of competing suppliers to the market; (ii) the magnitude and type of accessible demand; (iii) accessibility and reliability of supporting industries; and (iv) firm strategy and rivalry that affect how various enterprises conduct business. The following sections describe each of these conditions for Indonesia’s competitiveness in the EU market.88
9.2.1 Export Prices and Real Cross Rates
Real Cross Rates – Foreign demand for Indonesia’s exports is determined by the rupiah-denominated price of exports. From the point of view of European buyers, that price is denominated in euros. The price differential between Indonesia’s exports and those of other competitors to the EU market therefore depends on the product price in each supplying country and the cross exchange rate between the rupiah and the euro, adjusted for inflation in each country.89 What is most striking about exchange rate developments in the last decade is Indonesia’s loss of EU market shares in many products, a situation that has paralleled the rise in the real cross-rates of many competing suppliers to the EU market. Notable among the competing suppliers is China, whose undervalued currency has made its products highly price-competitive in the EU market. In contrast, Indonesia has maintained a relatively stable currency so that the rupiah remained nearly unchanged in real terms vis-à-vis the euro. Exchange rate differentials have therefore significantly undermined the price competitiveness of Indonesia’s exports in the EU market relative to the same products exported by competing suppliers to that market.
Fisheries – The industry-specific conditions affecting the export price of fishery products are largely associated with labor and infrastructure-related costs. In shrimp and crustaceans, Indonesia ranks near Thailand in terms of its price competitiveness, but well below China, Canada, India, Ecuador, Russia and Vietnam. In fresh and chilled fish, Indonesia is the highest priced supplier among the comparator countries. These price variations could reflect differences in the product composition of the two groups, as well as quality differences.
Agri-Foods – Indonesia’s production costs have been low when compared with neighboring countries’ like Thailand and Malaysia, and other competing suppliers’ like South Africa and India. This situation has been reflected in the lower nominal unit price of agri-food exports from Indonesia compared with these other countries.
Electronics – Indonesia remains a relatively high cost producer of electronics products relative to the leading foreign suppliers of those types of products to the EU market. Although these cost differences could reflect higher quality end products, Indonesia’s consumer electronic industry is middle level technology and should therefore have a similar cost structure to that of the leading suppliers like Russia, Korea and China. Its price-competitiveness has, nevertheless improved in recent years as domestic labor costs in China and the other large EU suppliers have risen in constant local currency terms.
Furniture – Indonesia has a cost advantage in its proximity to high quality timber and its abundant labor supply, which helps to offset the shipping costs of furniture to the EU market. Indonesia ranks near India in terms of its price competitiveness, but well below Brazil, Malaysia, South Africa, Thailand, China, Taiwan and Vietnam. Only Singapore, Mexico and South Korea have higher unit trade prices. These price differentials could of course simply reflect quality differences.
Cosmetics – Because of its proximity to abundant natural cosmetic ingredients, Indonesia is likely to have a cost-advantage with all the large natural cosmetic producing countries. The exception is Brazil, which also has plentiful natural cosmetic ingredients. In fact, only Brazil and China have had lower cost exports than Indonesia in the past few years. Indonesia’s therefore has a large and, as yet, unexploited price-competitiveness in the EU market.
88. For details, see the Annexes to this report.
89. The real bilateral exchange rate takes the relative price of tradable and non-tradable products as an indicator of a country’s competitiveness level in the foreign trade. The rationale behind this definition is that the cost differential between trading countries are closely related with the relative price structures in their economies. Mathematically, the real exchange rate, r, is defined as r = Pt/Pn = eP*/Pn, where Pt and Pn represent the price of tradable and non-tradable products, e is the nominal exchange rate, and P* is the international price of tradables.

69INDONESIA TRADE ACCESS TO THE EUROPEAN UNION: OPPORTUNITIES AND CHALLENGES
9.2.2 Demand Conditions
Fisheries – Links to overseas consumers exist for some exporters of fishery products that operate in direct collaboration with larger suppliers. Examples are fresh and frozen tuna exporters that operate their own fleet having contract supply arrangements with long line fleet operators, and shrimp processors with a vertically integrated farming operation linked to export activities. These exporters are regulated by the Ministry of Fisheries and Marine Affairs (MMAF), which classifies fish processing operations of enterprises based on their compliance with Good Manufacturing Practices (GMP) and Hazard Analysis Critical Control Points (HACCP) standards. Only establishments that are classified as A are permitted to supply the EC market.
Agri-Foods – Indonesia’s agri-foods industry is, for the most part, directed to the domestic and ASEAN markets. Consumer tastes and preferences in those markets are vastly different from those in the European Union and the United States. Moreover, ASEAN member country regulations governing marketing, health and packaging are not as strict as those in the European Union and the United States. Despite competitive prices, lack of experience in extra-regional markets has greatly reduced the overall competitiveness of Indonesian firms relative to major suppliers of agri-foods from the United States, China, Brazil, and South Africa.
Consumer Electronics – Specialization of countries in various phases of the production and distribution process has lead to what is called two-way trade for a country like Indonesia. Imports of component parts may be assembled and exported to foreign markets, thereby appearing in aggregated trade statistics as though Indonesia is importing and exporting the same types of products. For example, the components of television receivers have the same 2-digit trade classification as the finished television products. It therefore appears as though a country like Indonesia is trading the same product, when in fact the country is importing parts and assembling them into the final product before shipping it to foreign markets.
Furniture – Few firms are linked directly to overseas consumers. The multitude of micro and small scale enterprises (MSEs) in the industry having little if any networking capabilities prevent them linking up with large chains or independent retailers. This situation often leads to the dependence on commercial intermediaries, which are able extract economic benefits from their information and linkages with distributors and retailers in foreign markets. The result is a situation that engenders the entrenchment of the current situation for domestic furniture producers, especially MSEs.
Cosmetics – Indonesia’s natural cosmetic industry is, for the most part, directed to the domestic market, and few firms are linked directly to overseas consumers. Overseas sales are mostly limited to the regional markets within the ASEAN community, where regulations governing marketing, health and packaging are not as strict as in the EU and US markets.
9.2.3 Industry Networking
Fisheries – The fishery industry is composed by the formal sector that operates in a regulated market and often supplies the more than 700 fish processing enterprises in the country. Those processing units include eight fish canneries and about 50 processors or fresh and frozen tuna products. Other types of enterprises are primarily fish freezing, salting and drying processors. For the large number of small vessels and aquaculture producers, there are large numbers of domestic traders and distributors who consolidate fishery products originating from widely dispersed fishery and landing sites and provide them to domestic and export markets.
Agri-Foods – Indonesian producers lack overseas networking capabilities with distributors in EU and US markets. Supermarkets now dominate food sales in developed markets and are rapidly expanding their global presence. At the same time, international mergers and acquisitions and aggressive pricing strategies have concentrated market power in the hands of a few major retailers. Although global sourcing has created new opportunities for the Indonesian agri-foods industry, only large companies are normally able to take advantage of them.
70
Consumer Electronics – The development of the global electronics industry is largely driven by technology diffusion and capability development of countries like Indonesia within global production networks. In these networks, OEMs allocate, or outsource, production, marketing and distribution activities in different countries in such a way as to benefit from input and production costs, technological activities, marketing, logistic, and other differences. The networks therefore operated through a fragmentation of activities among different countries. While this fragmentation has had a dramatic effect on Indonesia’s production, employment, exports and technological activities, the system is effectively footloose, meaning that it is independent of resources other than capital, and skilled and unskilled labor. Changes in entry or exit of activities in a country can therefore take place quickly.
Furniture – Furniture production that is concentrated in industrial complexes like the one in Jepara provides important networking support. In these clusters, a large number of MSEs are able to establish supporting and subcontracting relationships that allow them to effectively compete with larger integrated units. Opportunities abound for vertical cooperation along the value chain, and for horizontal cooperation with clusters of similar firms or with dominant firms that can play a lead role in overseas operations.
Cosmetics – The industry is dominated by small scale enterprises, which have little if any networking capabilities. This situation prevents them from linking up with large chains or independent retailers, especially with multinationals. Moreover, enterprises are fairly widely distributed in Bali, Lampung, Riau, DKI Jakarta, North Sumatera, and East Kalimantan, making it more difficult for them to network with one another.
9.2.4 Conditions for Conducting Business
Fisheries – There is a relatively high degree of competition among the larger fish processing firms and that competition is reflected in firm strategies to increase the volume of fish processing within Indonesia. Strong competition from other foreign suppliers like China, Vietnam, and Ecuador and the costs of switching export markets has intensified efforts to retain or expand existing overseas markets. For the small producers, the large number of enterprises competing for customers gives rise to considerable rivalry. High storage costs and perishability of marine products intensifies competition for customers.
Agri-Foods – Access to the EU agri-foods market is subject to stringent food safety and agricultural health standards of the European Commission (EC) and EU member country governments. There is also a trend for supermarkets to go beyond mandatory regulations to begin implementing their own private standards. In an effort to harmonize supply chain standards worldwide for good agricultural practice (GAP), several European supermarket chains and their major suppliers have sought to bring conformity to different retailers’ supplier standards. These standards make it difficult for SMEs to compete because of the time and cost associated with obtaining the required audits. Without the certification, it is impossible to sell to supermarkets.
Consumer Electronics – Location of production activities depend on political, social and economic stability, good infrastructure, efficient export processing zones (EPZs), access to markets and inputs, and efficient regulatory procedures. The higher the technology involved in the electronics product, the higher the skill level that is needed of workers, as well as technical and managerial capabilities. More mature industries in Indonesia contain a greater proportion of local content than emerging industries, for which there is need of efficient local suppliers, service providers and institutions for training, quality testing, certification, and other EQI requirements of the industry. These EQI requirements explain why OEMs locate in medium-wage economies like Indonesia rather than low wage ones like Laos, Myanmar, or countries in Africa, where skills, capabilities and infrastructure are lacking and regulatory procedures are complex.
Furniture – Business strategies of most furniture enterprises are relatively unsophisticated, often based on short-term price concessions, rather than manufacturing and design improvements. Most
71INDONESIA TRADE ACCESS TO THE EUROPEAN UNION: OPPORTUNITIES AND CHALLENGES
firms compete on the basis of price with similar products from their competitors. They also compete in their ability to maintain strategic alliances with commercial intermediaries or in their subcontracting arrangements with larger firms. There are no business networks providing direct furniture sales to overseas customers and, as a result, most companies are dependent on commercial intermediaries to place their products abroad.
Cosmetics – Business strategies of most natural cosmetics enterprises remain relatively unsophisticated and largely directed at domestic consumers. Most firms lack knowledge about pricing policies of similar products from their overseas competitors. Lack of overseas contacts makes companies dependent on commercial intermediaries to place their products abroad. Overcoming these obstacles is difficult because of the large number of market segments and distribution channels in Europe. The existence of different market niches requires different marketing and distribution strategies than higher-volume markets. There is also considerable variation among European markets, depending on national preferences, location, and age groups.
9.3 International and Regional Trade Agreements
9.3.1 Indonesia Membership in WTO, ASEAN and APEC
Indonesia is an original and an active Member of the WTO. It is also a founding member of ASEAN and Asia-Pacific Economic Cooperation (APEC). Within ASEAN, Indonesia participates in the Common Effective Preferential Tariff (CEPT) Scheme, which aims to achieve an ASEAN Free Trade Area (AFTA). The CEPT tariff reductions are granted on a reciprocal basis and local-content requirements apply. Indonesia has already reduced tariffs on 11,034 tariff lines to 5 percent or less for products of ASEAN origin.90 Under the terms of AFTA, Indonesia applies three lower tiers of 0 percent, 2.5 percent, and 5 percent for all goods imports from ASEAN members that meet the AFTA rules of origin requirements.
In APEC, Indonesia has been instrumental in advancing regional and global trade and investment liberalization.91 The 21 APEC economies collectively account for 46 percent of world trade and 57 percent of global GDP. APEC member countries aim to achieve free and open trade and investment. However there is still significant work ahead to achieve this goal.
Indonesia also has bilateral trade agreements with the United States Japan92, New Zealand93, and Switzerland. Agreements with important trading partners like India, Australia and the United States have been discussed but not concluded.
9.3.2 Indonesia Market Access under the European Union’s GSP
Indonesia is a beneficiary of trade preferences under various international arrangements. It receives special treatment under the Generalized System of Preferences (GSP) from the European Union, Canada, Japan, New Zealand, Norway, Switzerland, United States, Australia, and Turkey. The European Union’s GSP grants products imported from GSP beneficiary countries either duty-free access or a tariff reduction. From the total EU imports from Indonesia of 13 billion euros, almost 40 percent is eligible to the preferential treatment under the GSP facility.94 Indonesia could, however, improve its usage of the GSP since only about 3 billion euros of imports are actually covered under the scheme. Indonesian export products, which have especially been using the GSP facility, are telecommunications instruments, television and audio equipment, garments and footwear.
In order to be eligible for the tariff preferences under the GSP, products exported from Indonesia must fulfill rules of origin. In general this means that goods must either (a) be manufactured from raw materials or components which have been grown or produced in the beneficiary country, or (b) at least undergo a certain amount of working or processing in the beneficiary country. Generally, all
90. WTO Secretariat, “Trade Policy Review: Indonesia”. Report by the Secretariat, WT/TPR/S/184/Rev.1, 2007.
91. The material on APEC draws from WTO Secretariat, “Trade Policy Review: Indonesia”. Report by the Secretariat, WT/TPR/S/184/Rev.1, 2007.
92. See http://www.worldtradelaw.net/fta/agreements/JapIndoFTA.pdf.
93. See http://www.asean.fta.govt.nz/indonesia-bilateral-linkages/.
94. Based on information available at http://ec.europa.eu/delegations/indonesia/eu_indonesia/trade_relation/market_access/index_en.htm

72
working and processing for origin purposes must have been carried out in the beneficiary country of export. However, “regional accumulation” applies for ASEAN countries, which means that when a product has been manufactured in two or more ASEAN countries, inputs from other ASEAN countries are treated as if they originate in the exporting beneficiary country.
The GSP scheme is currently working under the regulation for 2009-2011.95 The scheme could be revised after 2011 for Indonesia and other countries since there are rules for graduation from the system. Graduation is triggered when a country becomes competitive in one or more product groups and is therefore considered no longer to be in need of the preferential tariff rates. Triggers bring about either a suspension of preferences or their re-establishment whenever a country’s performance in the EU market over three years exceeds or falls below a set threshold. The calculations for these triggers are made on the basis of the ‘product sections’ in the Harmonized System (HS). Under the current GSP Regulation for 2009-11, Indonesia has had preferences re-established for wood and articles of wood, and it has had no suspension of preferences in any product group.
9.3.3 Indonesia’s Partnership and Cooperation Agreement (PCA) with European Union
Indonesia has committed to a policy dialog with the European Union to enhance cooperation in the areas of trade and investment, and in areas like the environment, energy, education, science and technology, migration and counter-terrorism. It is also working through its ASEAN membership towards the establishment of a Free Trade Agreement (FTA) with the European Union.
In July 2009 Indonesia and the European Union (EU) signed a Partnership and Cooperation Agreement (PCA) covering diverse areas of cooperation that included trade and investment.96 The PCA with Indonesia is the first such agreement to be signed by the EU with an Asian country. New areas of cooperation are being explored, including those related to research and development, and sectoral committees that will help to identify opportunities and more rapidly address obstacles in key sectors of commercial interest. As well as trade and investment, the PCA provides opportunity to expand EU engagement in environment, energy, education, science and technology, migration and counter-terrorism. A new EU-Indonesia Human Rights Dialogue was also launched in 2009 to intensify exchanges on questions of mutual interest.
95. Based on information available at http://trade.ec.europa.eu/doclib/docs/2008/july/tradoc_139988.pdf. Also available at http://www.europa-eu-un.org/articles/en/article_8044_en.htm.
96. This section is based on material from Alexander C. Chandra, “Working towards mutually beneficial economic relations: Indonesia’s expected challenges in pursuing an FTA with the EU”. International Institute for Sustainable Development (IISD) , September 2009. Available: http://www.scribd.com/doc/34166567/Indonesia%E2%80%99s-expected-challenges-in-pursuing-an-FTA-with-the-EU.

73INDONESIA TRADE ACCESS TO THE EUROPEAN UNION: OPPORTUNITIES AND CHALLENGES
10.1 Cross-Cutting IssuesThe common EQI issues for Indonesian industries marketing their products in the European Union are related to testing and accreditation and, in the case of fish and agri-foods, food safety and SPS requirements.
Food Safety and SPS Requirements: In the case of fish, the Ministry of Fisheries and Marine Affairs (MMAF) of the Government of Indonesia is the Competent Authority (CA); in the case of agri-foods, the Ministry of Agriculture and Ministry of Health regulate the industry. The National Agency for Food and Drugs (BPOM) is cooperating with the European Union to establish the National Rapid Alert System for Food products in Indonesia. Through this program, the European Commission is providing technical assistance to strengthen national capacities in the risk management for food safety through establishing a national Rapid Alert System for Food in Indonesia. The mechanism gathers and analyzes food safety information coming from border inspections and domestic market surveillance.
Laboratory Testing: A common issue among industries is the lack of competence of testing laboratories. Laboratories often do not have the facilities to perform the appropriate tests needed to comply with EU requirements. Moreover, quality assurance, calibration and method verification needs improvement. Proficiency tests and certified reference materials are rarely used. As a result, Indonesian laboratories are often unable to perform all testing and analysis required by the European Union.
Accreditation: There are numerous bodies in each industry that provide certification for Good
10 EQI Constraints in Focal Industries
Highlights of Export Constraints
• Indonesian industries confront common EQI issues in the EU market related to testing and accreditation.
• Indonesian laboratories are often unable to perform all testing and analysis required by the European Union
• Accreditation by the large number of certification bodies are not always recognized internationally.
• For Indonesian food products the major impediment to bringing processing operations to the country is SPS requirements in the EU market.
• For fisheries, quality and food safety improvements are needed in fish vessels, fishing ports and at landing sites, while in fish farming the presence of antibiotics in fishery products remains a major issue for Indonesia’s export to the EU market.
• In consumer electronics, EQI issues range from product design to components purchases, assembly and packaging.
• In furniture, EQI issues relate to the moisture content of woods to prevent cracking, , standardization of products, quality of the finished products, and safety testing.
• In natural cosmetics, the most important EQI issue is the ingredients used in new products, where EC rules apply maximum concentration rates of allowable ingredients.
• Apart from EQI limitations, major obstacles remain from poor infrastructure, particularly road, electricity and logistics, as well as lack of marketing expertise and networking in extra-regional markets.
• SMEs confront great challenges in meeting EU standards since they often lack information and face excessively high costs in meeting those standards.
Aquaculture Practice (GAP), Good Handling Practice (GHdP), Good Manufacturing Practices (GMP) and Hazardous Analysis and Critical Control Point (HACCP). One common certification body is the National Accreditation Body of Indonesia (KAN), which provides accreditation services in the following areas: (i) quality management system certification bodies; (ii) environmental management system certification bodies; (iii) food safety system management certification bodies; (iv) information security management system certification bodies; (v) product certification bodies; (vi) personnel certification bodies; (vii) eco-label certification bodies; (viii) organic certification bodies; (ix) testing laboratories; (x) calibration laboratories; (xi) inspection bodies; and (xii) medical laboratories. To ensure measurement traceability from test result, calibration result and inspection result, KAN established the traceability to International System of Units (denoted SI) to comply with the international structure of laboratory accreditation and mutual recognition arrangements (MRAs) under the International Laboratory Accreditation Cooperation (ILAC) and Asia Pacific Laboratory Accreditation Cooperation (APLAC).97
97. The International System of Units (abbreviated SI from the French Le Système International d’Unités) is the modern form of the metric system and is generally a system of units of measurement devised around seven base units and the convenience of the number ten. It is the world’s most widely used system of measurement, both in everyday commerce and in science
74
SMEs: Small and medium size enterprises (SMEs) confront far greater challenges than large enterprises in meeting the standards needed to market their products in the European Union. Many MSEs are unable to provide the required quality and are often not even aware of the required specifications. Lack of information access, excessive costs associated with meeting standards, and the inability to access credit needed to implement quality standards all contribute to the problem. The Government of Indonesia is attempting to address SME constraints through a series of measures aimed at (i) increasing product quantity; (ii) reducing losses due to non-conforming product; and (iv) ensure supply sustainability. Networking and development of clusters that would provide scale economies to the small producers is also being attempted in many industries. However, the task is of an enormous proportion because of the vast size of Indonesia and the large number of micro and small size enterprises.
10.2 Fisheries IndustryExport of fishery products to the European Union requires health certificates. The Indonesian government is responsible for issuing health certificates. The European Union has appointed the Ministry of Fisheries and Marine Affairs (MMAF) of the Government of Indonesia as the Competent Authority (CA).
10.2.1 EQI Issues in Wild Catch
Quality issues in wild catch are primarily related to temperature and hygienic conditions on board the vessels and at the harbor. Under present conditions, there is considerable scope for quality and food safety improvements in fish vessels, fishing ports and at landing sites. Inspection of these facilities by the CA needs to be improved. There is insufficient inspection of vessels providing raw material to processors for export to the European Union. Only a small percentage of the operating fishing vessels are inspected by the relevant Indonesian authorities. Block ice factories supplying fishery vessels do not maintain appropriate sanitary standards. Records on fishing vessels are insufficient at both the central and provincial levels.98 The situation is particularly difficult for micro and small scale fishing enterprises. Quality issues found on small fishing boats are associated with the lack of adequate hygienic and temperature controls. Small fishing boats have problems in complying with the strict hygienic requirements due to insufficient knowledge on hygiene and limited space on the boats. Proper storage of the catch with ice is usually not ensured and hygienic conditions are uncontrolled.
10.2.2 EQI Issues in Fish and Shrimp Farming
The presence of antibiotics in fishery products remains a major issue for Indonesia’s export to the EU market. This situation is reflected in the European Union’s border inspection of 20 percent of aquaculture products originating from Indonesia.99 To ensure the quality and food safety for aquaculture products, Indonesian fish and shrimp farmers are required to implement Good Aquaculture Practice (GAP).100 The aim of GAP is to grow and harvest shrimp in a controlled environment by rigorous control of sanitation as well as controlled application of feed, fish drugs, chemicals and biological substances in aquaculture.
The problem is that in practice Indonesian farms are spread over a large area and are often located in remote areas. Extensive traditional farming is usually done by small, family sized businesses. Small farmers lack information on GAP and Good Handling Practices (GHP). At present there is widespread use of antibiotics for disease prevention in fishery farming, since farmers often lack information about EU regulations and restrictions on antibiotics. Transport of shrimps from the farmer to the middlemen is often conducted in containers with unhygienic conditions and without the required use of ice or other types of refrigeration. It is often difficult to trace the shrimps back to the point of farming due
98. Final report of a mission carried out in Indonesia from 23.2.2009 to 6.3.2009 in order to evaluate the control system in place governing the production of fishery products intended for export to the European Union, DG(SANCO)/2009-8044-MR-FINAL, http://ec.europa.eu/food/fvo/ir_search_en.cfm
99. See (Commission Decision C(2010) 2358). Available: http://www.fsai.ie/uploadedFiles/Legislation/FSAI_-_Legislation/2010/04_apr2010/Dec2010_220.pdf
100. See Decree Kep 02/MEN/2007. Available: http://library.enaca.org/certification/publications/expertworkshop/21%20Aquaculture%20Certification%20Indonesia.pdf

75INDONESIA TRADE ACCESS TO THE EUROPEAN UNION: OPPORTUNITIES AND CHALLENGES
to the use of middlemen in the collection system. Improved monitoring and controls are needed to overcome this problem.
This situation points to the lack of competence of a large number of fish and shrimp farmers, which is insufficient in the following areas: production process control, knowledge of diseases and disease prevention, antibiotics, application of medicines and feed, applicable Indonesian and EU regulations, GAP and the handling of products. Systematic flow of information to the small farmers is not provided, resulting in insufficient knowledge about GAP and GHP. To overcome this problem, MMAF is currently implementing programs aimed at helping farmers to achieve GAP certification. However, the management system of the Directorate of Production in the MMAF needs to be improved to ensure control of the GAP certification process.
10.2.3 EQI Issues in Collection by Middlemen and Transport to Processor
The collection and transport of shrimp and fish from farms to processors is conducted under uncontrolled conditions. The required cooling chain is not properly implemented and it is still common practice by farmers and collectors to increase the weight by storing the shrimp in water and without ice over several hours as a means of increasing the weight of the shrimp by up to 10 percent. Middlemen collect shrimps from several farmers and usually mix the products from different sources making traceability impossible. Despite the fact that middlemen have been advised to implement GHdP in some areas, implementation of GHdP remains weak.
10.2.4 EQI Issues in Fish Processing
Companies exporting to the European Union need a Company Approval issued by the European Union. Currently 149 exporters are registered and approved. Processing companies exporting to the European Union are required to implement Good Manufacturing Practices (GMP), certified with the “Sertifikat Kelayakan Pengolahan” Grade A (SKP A) and have to be certified for Hazardous Analysis and Critical Control Point (HACCP). The fishery processors are also required to conduct second party audits on their suppliers and must ensure traceability to their sources of raw material. At present, proper application of the required GMP and HACCP is not ensured and numerous shortcomings in hygiene and sanitation issues persist in companies. Notwithstanding the use of certified HACCP and GMP systems by fishery product processors exporting to the European Union, shortcomings in hygiene and sanitation are still evident, indicating that audits are not being properly conducted.
10.2.5 EQI Issues in Laboratories
Improvements in the testing laboratories are needed. However, it appears to be quite difficult for the Government to improve all 88 of those laboratories, as well as three reference laboratories in the fishery sector. One possible approach would be to either consolidate activities of the laboratories, or to focus on a sub-sector of those laboratories and address changes needed within a limited number of them.
10.3 Agri-Foods IndustryIndonesian agri-food producers must comply with the European Union’s food regulation “from Farm to Fork”, which is based on a process-oriented system in which each business operator in the food chain is responsible for ensuring that food placed on the EU market meets the required food safety standards.
10.3.1 EQI Issues in Farming
Good Agriculture Practices (GAP) should be applied in farming to avoid contamination arising from soil, water, fertilizer, plant protection and biocides. Hazardous Analysis and Critical Control Point (HACCP) and hygiene are the most frequently applied measures to ensure food safety. However,
76
since the application of HACCP is generally not feasible for primary fruit producers, Good Agriculture Practices (GAP) are used. At present, Indonesian small and medium size farmers are unable to provide reliable supplies to processors. To address this problem the Indonesian Ministry of Agriculture has developed a strategy to improve the agriculture sector in Indonesia. It focuses on: (i) increase of production quantity; (ii) reduction of losses due to non-conforming product; (iii) quality and safety of the food; and (iv) sustainability of supply. However, the task is one of an enormous proportion because of the vast size of Indonesia.
10.3.2 EQI Issues from Farm to Processor
In the purchasing process, EQI issues are related to contaminants that are permissible in the product up to a certain concentration specified in EU regulations. Raw material purchased must not contain substances at a level that will exceed the maximum allowed contaminant level in the final product. In fruit juice production usually only visual inspections are performed. Since this procedure does not allow detection of contaminants, the risk of exceeding allowed contaminant level in the final product is high. As a result, Indonesian fruit juice producers, especially those exporting to the European Union, are facing a serious supply problem.
10.3.3 EQI Issues in Processing
The processing of food products must comply with Good Manufacturing Practices (GMP) and with an established Hazard Analysis and Critical Control Point (HACCP) system. SMEs are also often unaware of hygiene problems and the advantages of GMP practices. Many regard the HACCP system as too administrative, too complicated and expensive. SMEs are unaware that these systems’ requirements are proportional to the business size and nature of its activities, and thus not as demanding for SMEs carrying out a simple process than for large companies with complex processes. As a result, only large Indonesian fruit juice producers apply GMP and HACCP.
10.3.4 EQI Issues in Product Quality Testing
During final inspection fruit juices must be tested for pesticides, heavy metal and microbiological criteria in relation to food safety. Certificates on these tests are usually required by EU clients. Additional analyses are conducted regarding acidity, total suspended solids, vitamin C, water content, sum of sugar (saccharose, fructose) and citrate acid. Testing can be performed in company owned laboratories or in external laboratories. Large companies usually have their own quality laboratory while smaller companies mostly rely on testing in external laboratories.
EQI issues related to laboratories are associated with problems of achieving traceability and with the lack of proper testing methods. Indonesian laboratories are currently unable to perform all testing and analysis required by the European Union. The laboratories either lack equipment, properly trained analysts or analytical methods. Certified Reference Materials (CRM) are often unavailable and are relatively expensive. Indonesia the National Agency for Food and Drugs (BPOM) and Balai Besar Industri Agro (BBIA) are planning to produce chemical CRM, but a local producer for biological CRM is not likely to be available in the near future. To market agri-foods in the European Union, Indonesian laboratories need have to extend the scope of their testing methods. Required parameters and suitable test methods will have to be identified, applied and verified.
10.4 Consumer Electronics IndustryRelevant EQI issues are the International Electrotechnical Commission (IEC) regulations for safety, the European Electro Magnetic Compatibility (EMC) regulations, Restriction of Hazardous Substances (RoHS) and Waste Electrical and Electronic Equipment (WEEE) environmental regulations. The EQI issues for consumer electronics are (i) design in compliance with technical specifications; (ii)

77INDONESIA TRADE ACCESS TO THE EUROPEAN UNION: OPPORTUNITIES AND CHALLENGES
compliance of technical and environmental requirements for all components; (iii) final inspection of product; (iv) product packaging; and (v) product approval and marking.
10.4.1 EQI Issues in Product Design
EQI issues in the design phase relate to quality, safety and environment. While designers are usually quite familiar with safety and EMC aspects, they are less familiar with environmental issues. To be in compliance with the European Union’s RoHS directive, the design of electronic equipment using hazardous substances needs to be avoided. In addition, all products should also take into account the dismantling and recovery of components and materials for potential re-use and recycling. The design phase is therefore of utmost importance to ensure that all applicable requirements on safety (IEC standards), electromagnetic compatibility (EMC), environmental aspects (RoHS and WEEE) and requirements on packaging and labeling may be fulfilled.
10.4.2 EQI Issues in Component Purchases
To ensure compliance with RoHS regulations, raw material and components must fulfill IEC safety requirements and not contain hazardous substances. It is therefore necessary that suppliers provide test results and Material Safety Data Sheets (MSDS) on the material and components. Supplier audits are conducted to allow producers to verify that the supplier undertakes the correct quality management and assurance measures. In some cases, producers include clauses in their contracts and agreements with suppliers to ensure that they control adherence to standards. Suppliers of packaging material are also expected to provide all the required information on packaging material. The aim is to control the entire supply chain to ensure that the specifications of all materials and components are met.
10.4.3 EQI Issues in Assembly
Controls must be performed at all relevant or critical phases of the assembly process. Special attention must be given to areas with high voltage components. Quality management systems such as ISO 9001 are often implemented and maintained to achieve reliable process control. During assembly no particular control measures are applied with regard to EMC and environmental aspects (RoHS & WEEE) as these issues have been considered and controlled during design, purchase and incoming inspection.
10.4.4 EQI Issues in Inspection and Packaging
During the final inspection the appearance and all functions of the product are checked according to specifications. Tests on electrical safety and environmental compliance are usually not performed, as these aspects have been covered in earlier stages. As a consequence, final inspection does not require extended testing since all relevant aspects concerning safety and environmental issues have been completed in earlier phases of the production process.
10.5 Furniture IndustryThe relevant quality parameters in furniture production are (i) compliance with technical specifications, (ii) design, (iii) on-time delivery, (iii) delivery time, (iv) ordering flexibility, (v) illegal logging and sustainable forestry, and (vi) other management certifications.
10.5.1 EQI Issues in Buying and Cutting the Wood
The major EQI issue relates to the origin of the wood. Teak wood is the main raw material used by Indonesian furniture manufacturers. All teak wood comes from government plantations or from private forests or gardens since it is not indigenous to Indonesian forests, except in some parts of Sulawesi. Nevertheless, even though most teak wood comes from plantations, many buyers are concerned about the issue of illegal logging and sustainable forestry.

78
10.5.2 EQI Issues in Drying the Wood
There are important EQI issues related to possible cracking of wood due to improper moisture content. Appropriate values are achieved by a slow drying process in a kiln dryer. However, many MSEs avoid the drying process because of its high costs, resulting in lower wood quality. MSEs often fail to execute the drying process properly.
10.5.3 EQI Issues in Production and Assembly
EQI issues exist on workmanship, materials used and management. Good workmanship is necessary to ensure high-quality products. Components have to be assembled in a way that ensures the product is strong enough for its purpose and will not shrink or tear after it is sent to Europe. Larger companies are more automated and can therefore work faster and with lower tolerance. Components can be assembled to any single product of the same type, which allows for more flexibility and for better organization of the production process. Smaller tolerances, reproducibility, and a well-organized work process will result in products of higher quality. Exporters face major challenges during this production step. Low-quality work will often only be discovered at the buyer’s premises or even when it reaches the consumer. Complaints after delivery cannot be corrected anymore, and the loss for the exporter is high. Therefore many exporters supervise this production step with their own personnel.
10.5.4 EQI Issues in Finishing
EQI issues involved in finishing exist because many MSEs are unable to provide the required quality in this production step and are often not even aware of the required specifications in this production step. Because of the lack of quality in the finishing process, exporters often buy unfinished products and conduct the finishing on their own. The added value of the finishing process is then lost for the MSEs. Moreover, exporters confront major challenges because low-quality work often is not discovered immediately. After delivery, complaints are difficult and costly to correct, thus the financial loss of the exporter can be significant. Exporting companies and local retailers often take over the finishing process due to these quality problems. They want to ensure the quality of the finishing process and of the final product, so they only buy unfinished products from the producers. Usually they subcontract the finishing service to groups of workers, who are paid a lump-sum amount.
10.5.5 EQI Issues in Testing
Some buyers in Europe demand certified safety tests for certain furniture products. In such cases, export companies in Indonesia test their products with foreign testing laboratories and institutions such as Technischer Überwachungsverein (TÜV) or Asian Pacific Inspection (API). One local testing institute is Laboratory for Quality Testing of Export and Import Goods, or Balai Pengujian Mutu Barang Export dan Impor (BPMBEI). BPMBEI is responsible for testing export products, including furniture. Many laboratories are combined in this institution such as instrumental laboratory, textile and toys laboratory, footwear laboratory, food laboratory, cosmetics laboratory, furniture and electro and electronics laboratory. The laboratory also performs tests on safety for furniture. However, the buyers prefer certificates from internationally recognized institutions despite that fact that many tests can be performed in Indonesia. Indonesian producers prefer to conduct the tests in Indonesia as tests in other countries are much more expensive and time-consuming.
10.6 Cosmetics IndustryCosmetics exported to the European Union are subject to EU requirements on composition, packaging, labeling and information provided.
79INDONESIA TRADE ACCESS TO THE EUROPEAN UNION: OPPORTUNITIES AND CHALLENGES
10.6.1 EQI Issues in New Product Designs
During the design phase of natural cosmetics, the most important EQI issues are related to the ingredients used in new products. The European Union has identified prohibited ingredients and defined the maximum concentration rates for allowed ingredients.101 In addition, EU requirements prohibit the use of ingredients that have been tested on animals if an alternative method without animal testing has been validated and adopted by the European Centre for the Validation of Alternative Methods (ECVAM). Both the EU regulation and the Indonesian regulation also contain lists of prohibited coloring agents, preservatives and UV filters.102
In Indonesia each cosmetic product has to be approved and registered with the National Agency for Drug and Food Control (BPOM). Effective January 2011, a new ASEAN regulations based on notification will be applicable to Indonesia. A Product Information File (PIF) will need to be provided to BPOM with all necessary data including test results of ingredients and the final product. The main sources of toxicological data on ingredients are the suppliers. Prior to submission for notification the PIF must be assessed regarding quality, efficacy and safety by a certified Safety Assessor. The file will then be submitted to BPOM for review and notification. Companies who have registered their products prior to 1 January 2011 have to provide additional information on safety, side effects and efficacy. Successful completion of the notification and submission to BPOM does not constitute approval for sale or agreement that the product is in compliance with all regulatory requirements. The manufacturer of the products or the distributor bears the full responsibility for compliance with all requirements.
10.6.2 EQI Issues in Processing and Testing
EQI issues related to laboratories are (i) lack of international recognition of the Indonesian laboratories, and (ii) the limited number of independent laboratories. Testing in other countries leads to increased costs and requires more time due to distance and transport. SMEs and MSEs need a competent laboratory with reasonable prices to perform product quality testing. Currently only BPOM operates comprehensive testing facilities for cosmetic products but does not have the capacity to serve the cosmetics companies with quality testing. At present other government laboratories such as BPMBEI provide only limited testing.
101. See Annex of Council Directive 76/768/EEC. The National Agency for Drug and Food Control (BPOM) has issued a regulation on cosmetics “Peraturan Kepala Badan Pengawas Obat dan Makanan Republik Indonesia No: HK.00.05.42.1018, 25.2.2008. The regulation defines the product cosmetic and which ingredients are not allowed at all or are allowed up to a certain level.
102. See Annex of Council Directive 76/768/EEC. Annex IV and V Peraturan Kepala Badan Pengawas Obat dan Makanan Republik Indonesia No: HK.00.05.42.1018, 25.2.2008.
80
11.1 Institutional Framework
11.1.1 Trade Policy Formulation
The Ministry of Trade is the main government agency responsible for formulating and implementing trade policies. Under Decree No. 49/M-DAG/KEP/3/2006, the Minister coordinates matters on trade with the following agencies: (a) Ministry of Foreign Affairs for issues related to cooperation and development; (b) Ministry of Finance and the Central Bank for issues on services and e-commerce; (c) Ministry of Agriculture for all issues related to agriculture; (d) Ministry of Industry for issues on negotiations of trade in non-agricultural goods; (e) Ministry of Foreign Affairs and Ministry of Environment for issues on the environment; (f) National Development Planning Body/BAPPENAS for issues on government procurement; (g) Ministry of Justice and the National Agency of Drug Control for issues on intellectual property rights; (h) Ministry for Economy and Indonesia’s Investment Coordinating Board for issues on investment; (i) Commission for Supervision of Business Competition and BAPPENAS for issues on competition policy; (j) Ministry of Finance for issues on trade facilitation.
Ultimate responsibility for Indonesia’s trade and economic policies lies with the President and the Cabinet. Inter-agency teams coordinate the Government’s strategies and positions on trade dialogues and negotiations, and facilitate
11 Export Policies and Regulatory Environment
Highlights of Indonesia’s Export Polices & Regulatory Environment
• The Ministry of Trade collaborates with other agencies in trade-related matters, and to help deliver effective services, the EC is providing support through its Trade Support Programs (TSPs).
• Export price movements were responsible for some losses, notably in the early part of the decade and in 2007, while the exchange rate pass-through caused by the real cross-rate appreciation of the rupiah relative to the euro brought about significant market share losses in 2002 and 2006.
• However, it was the non-price factors that were consistently responsible for the deterioration in Indonesia’s participation of the EU market beginning.
• To the extent that Indonesia could have overcome its supply impediments on exports and maintained its share of the EU market for the focal industry products, foreign exchange revenue from the industry would have been nearly 13 percent higher in 2005-2009 than was actually achieved.
• Overcoming those obstacles will require considerable effort on the part of the industries, particularly in terms of EQI requirements. However, the benefits to the industries are considerable, as are the economy-wide impact that would be produced from additional employment and expenditures on other sectors.
the development of strategic sectors.103 Those sectors are identified in the National Medium Term Development Plan for 2010-2014 (RPJM 2010-14), which emerged as part of the Government’s National Long Term Development Plan (RPJPN) 2005-2025. Prioritization is based on a number of development objectives related to (a) adding value to the economy, (b) introducing innovative methods, (c) providing downstream opportunities, (d) strengthening small and medium size enterprises (SMEs), and (e) reducing poverty by generating employment opportunities and offering support to micro and small enterprises (SMEs).
The first inter agency coordinating team is the National Team for Increasing Exports and Investment (Tim Nasional Peningkatan Ekspor dan Peningkatan Investasi or PEPI). Its main tasks cover (a) formulation of policies to improve exports and investments; (b) determine what actions are needed to increase exports and investments; and (c) evaluate strategic issues related to export and investment promotion. The second team is the Indonesian National Trade Negotiation Team, with coordinating responsibility by the Minister for the Economy and chaired by the Minister for Trade. Its main tasks are (a) to improve Indonesia’s participation in international forums; (b) to evaluate the impact of international trade issues on the national economy; (c) to prepare and formulate strategies and positions for trade negotiations; and (d) to communicate the results of negotiations to Indonesian stakeholders.
At present the Government lacks a cohesive and integrated trade strategy that reflects the new political and economic realities of the country. Capacity constraints in the Ministry of Trade arise
103. WTO Secretariat, “Trade Policy Review: Indonesia”. Report by the Secretariat, WT/TPR/S/184/Rev.1, 2007.

81INDONESIA TRADE ACCESS TO THE EUROPEAN UNION: OPPORTUNITIES AND CHALLENGES
from both a general shortage of staff, lack of knowledge about trade policies and they application to Indonesia, knowledge limitations about how to assess policies and their potential economy-wide and sector or industry-specific impact, inadequate information about the major issues confronting the global economy and Indonesia’s stake in multilateral and bilateral relations, and lack of general management knowhow. Intermittent training and other capacity building projects and programs have helped to reverse this situation, but lack of program cohesion and sustainability has limited their usefulness and impact.
11.1.2 Institutional Capacity
The Ministry of Trade and other agencies involved in trade-related matters are working to facilitate and promote Indonesia’s exports. Support is being provided by the European Commission’s (EC) Trade Support Programmes (TSPs), as well as the World Bank, International Monetary Fund, United States Agency for International Development (USAID), Asian Development Bank (ADB), Centre for Strategic and International Studies (CSIS-Indonesia), and Japan International Cooperation Agency (JICA). Institutional capacity building support has helped to deliver effective services in formulating and implementing trade and investment policies, implementing these policies, negotiating trade agreements, and managing the human resources and operations of the Ministry of Trade and other trade-related agencies of the Government. Significant obstacles remain in coordinating policies and actions plans and programs among agencies. There also remain challenges for the Government in facilitating business formalization and market access for new private sector entrants by working to reduce obstacles both at the national and sub-national levels, improve linkages between producers and distributors in the EU market and elsewhere. These issues are particularly crucial to SMEs, to help them better understand market requirements and the need to adopt new standards and practices to meet those market requirements.
Government’s ability to design and implement an effective trade policy framework is constrained by the fragmentation of trade-related activities among ministries. At least 15 government agencies are currently responsible for formulating trade policies, which prevents an effective decision-making process in the implementation of the Government’s national and sectoral development plans supporting the country’s exports. Most of these agencies have insufficient capability, knowledge and organizational capacity to address the new challenges of the country’s trade agenda. Furthermore, there is a general lack of effective coordination of trade facilitating activities and measures among these agencies, and between them and the private sector or civil societies within the country.
11.2 Cross-Cutting Policies and RegulationsIndonesia’s main general and sector-specific trade policy goals and priorities are to (i) improve its business climate and regional competitiveness; (ii) attract greater foreign and domestic investment, especially in infrastructure and export sectors; and (iii) generate high-quality job growth needed for sustained economic development. To this end, the Government is promoting bilateral, regional, and multilateral trade, with the aim of expanding international markets and supporting global efforts to liberalize trade while protecting Indonesia’s economic interests and maximizing the potential benefits for national welfare.
Rules of Origin Certification - Ministry of Trade Decree No. 111/2002 authorizes agencies to issue Certificates of Origin for Indonesia’s exports of goods.104 They are (a) Office of Trade and Industry (provincial and city level); (b) PT Kawasan Berikat Nusantara (bonded warehouse operator, state owned company); (c) Sabang freezone operating board; and (d) Indonesian Tobacco Institute (in Medan, Surakarta, Surabaya and Jember). Each trading country or group of countries set the criteria for certificates of origin according to their own criteria for giving preferences and imposing quotas or restrictions through bilateral or multilateral agreements. For Indonesia, they include the following:
Preferential Certificates of Origin: For the European Union, they include: (i) Certificate in Regard to Certain Handicraft Products; (ii) Certificate Relating to Silk or Cotton Handlooms Products; and (iii)
104. Information based on ADB, “Regional Seminar on Rules of Origin. Country Report: Indonesia.” Available: http://www.adb.org/Documents/Events/2004/Rules_of_Origin/roo_ino.pdf/
82
Certificate of Authenticity Tobacco. For other markets, they include (i) ASEAN CEPT COO (Form D), (ii) Global System of Trade Preference (GSTP), (iii) Certificate in Regard to Traditional Handicraft Batik Fabric of Cotton (Japan); (iv) Industrial Craft Certificate (Australia); and (v) Certificate of Handicraft Goods (Canada).
Non-Preferential Certificates of Origin: For the European Union, they include (i) export certificate for cassava; (ii) certificate of origin for imports of agricultural products; (iii) export license for textile products; (iv) certificate of origin for handlooms textile handicrafts and traditional textile products of the cottage industry; and (v) certificate of origin for textile products that do not qualify for GSP from the European Union. Others include (i) International Coffee Organization (ICO) certificate of origin for coffee; (ii) fisheries certificate of origin to the United States; (iii) certificate of origin for textile and article thereof to the United States; (iv) certificate of origin Form K for textile and article thereof to Canada; (v) certificate of origin Form N for textile product to Norway; (vi) certificate of origin for handlooms textile handicraft, traditional Indonesian handicraft, batik and traditional textile products of the cottage industry shipped to Norway; and (vii) certificate of origin for textile and article thereof to Mexico.
11.3 Industry-Specific Policies and RegulationsThe Annexes to this Study contain detailed information about the policies and regulations governing the Study’s focal industries. In this section we provide a brief summary for each industry.
Fisheries – Indonesia’s main fishery authority is the Ministry of Marine Affairs and Fisheries (MMAF). It is responsible for marine and fishery sector planning, management and administration in Indonesia. The Ministry comprised six line offices that consist of an Agency for Marine Affairs and Fisheries and five Directorate Generals covering Aquaculture, Capture Fisheries, Coastal and Small Islands, Marine and Fisheries Resource Controls and Capacity Building and Marketing. Responsibility for local-level marine fishery management rests with the Provincial Marine and Fisheries Service (Dinas Kelautan dan Perikanan Propinsi), which has offices at province, district and sub-district levels. Since the adoption of Law No. 22/1999, the Provincial Marine and Fisheries Services have been given more responsibilities as well as greater autonomy in carrying out their functions, being no longer under the technical supervision of the MMAF.
The basic law governing fisheries is Law No. 31 of 2004 on Fisheries, which replaces Law No. 9 of 1985. The new law underscores the importance of sustainable use of aquatic resources in the development of fisheries. Under Law No. 22 of 1999 on Regional Administration, provincial governments are held responsible for the management, use and conservation of marine resources within territorial waters. Overall compliance with the laws and regulations is the responsibility of the Directorate General of Surveillance and Control of Marine Resources and Fisheries in the Ministry of Marine Affairs and Fisheries. Its jurisdiction is limited to vessels exceeding 30 gross tons, while provincial governorates are responsible for overseeing smaller vessels. The armed forces are also responsible for law enforcement. Lack of cooperation between these agencies weakens their effectiveness.
Notwithstanding recent changes, regulation of the fishing industry remains weak. The key problems are (a) confusion over the jurisdiction of MMAF and other enforcement agencies; (b) lack of adequate infrastructure and manpower to control vessels in the high seas; and (c) weak governance at the provincial level.105 These constraints have made it difficult for the Government to ensure full compliance with the EC’s catch certification requirements. They also weaken the ability of the Government to effectively control illegal, unreported and unregulated (IUU) fishing.
Agri-Foods – The Ministry of Health and Ministry of Agriculture regulates (i) food safety, (ii) packaging, (iii) quality assurance, and (iv) registration. On food safety, the Government of Indonesia has ratified the World Trade Organization (WTO) Sanitary and Phytosanitary (SPS) Agreement through Law No. 7/1994. In order to implement the law, specific requirements for nutrition labeling in foods in Indonesia have been established. Under Act No. 7/1996, every label or advertisement of food must
105. Didik Mohamed Sodik, “Combating IUU Fishing in Indonesian Waters; the need for fisheries legislative reform”, PhD Thesis, University of Woliongong, Australia, 2007.

83INDONESIA TRADE ACCESS TO THE EUROPEAN UNION: OPPORTUNITIES AND CHALLENGES
contain accurate information and the ingredients of the product. Regulation 69 provides additional requirements on food labeling and advertisement. The regulation also applies to foods claiming to contain nutrients, including energy, protein fat, and carbohydrate content as well as levels of vitamins and minerals. Nutrition labeling is also mandatory for foods that are required to be fortified or enriched with specific nutrients required by the national legislations.
Consumer Electronics – The Government has not developed a strategy and action plan that would serve as the basis for regulating and supporting the development of the electronics industry. Instead, it relies on fiscal and non-fiscal incentives to promote the industry. Fiscal incentives are covered under Commercial Ministry Decree No. 137/PMK.011/2008, where incentives are provided for the following: (a) industries with Pioneer Status, i.e., high technology companies; (b) infrastructure-related industries; (c) industries involved in the preservation and protection of the environment. Non-fiscal incentives are also covered under Commercial Ministry Decree No. 137/PMK.011/2008 for (a) quality control services facility; (b) laboratories facility; (c) credit schemes; and (d) standard and certification (Standar Nasional Indonesia(SNI).
Export Processing Zones (EPZs) in Indonesia are concentrated in two main areas: (a) the Kawasan Berikat Nasantara KBN on the outskirts of Jakarta; and (b) an area in Batam Island in the Riau Islands Province of Indonesia. The Batam EPZ was developed with investment mainly from Singapore. The most important industry located there is that of electronics, followed by precision parts. Although its location provides the Batam EPZ with a large potential for investment in consumer electronics, it suffers from legal uncertainty, labor issues, and poor infrastructure. Labor issues relate to the problems with the minimum wage, severance pay and labor unions, while infrastructure conditions are poor in the areas of road quality and electricity.106 These constraints make competing areas in nearby countries more attractive, notably, the Iskandar Development Region (IDR) in South Johor, Malaysia, as well as Vietnam and China.
Furniture – Indonesia’s exports of products from forest industries are currently regulated by Minister of Trade Regulation No. 02/M-DAG/PER/2/2006 on Rules on Export of Products of Forestry Industries, dated 2 February 2006.107 Products of forestry industries are specified in Attachment I of the regulation. Forestry companies certified as Registered Exporters of Products of Forestry Industry (ETPIK) by the Minister of Trade may export products of forestry industries (arts. 4 to 6). Article 7 specifies the documents necessary to obtain a certificate of ETPIK. Companies that own a certificate of ETPIK may undergo inspection to verify the legality of documents, export and production activities (arts. 8 and 9). Forestry companies certified as ETPIK must submit to the Director General of Foreign Trade annual production plans, realization of production per semester, annual export plans, and export realization per semester (art. 10). Articles 11-14 contain provisions on the suspension, reactivation and revocation of ETPIK Certificates.
An important aspect of the forthcoming regulatory environment for this industry is the EU-Indonesia Action Plan for Forest Law Enforcement Governance and Trade (FLEGT). A cooperation project between the Government of Indonesia and the European Union to promote the role of forests in the sustainable and equitable development of Indonesia is in progress and the Government of Indonesia and the European Union are negotiating a Voluntary Partnership Agreement (VPAs) that would support forest sector reforms in Indonesia and prevent illegal timber and timber products from entering the EU market.108 So far there have been three Senior Officials Meetings (SOMs) between the EU Delegation and the Government. In the latest meeting held in Jakarta during March 2010, the Delegation conveyed the progress on a proposed new EC “Illegal Logging Regulation”, which is expected to be approved as EU legislation by the end of 2010. It will require EU timber importers to take measures to minimize the risk of illegal timber entering the EU market. The draft regulation foresees that timber imported from countries that have concluded a VPA will be considered as legal.
106. See Wong Poh Kam and Ng Kwan Kee, “Batam, Bintan and Karimun – Past History and Current Development : Towards Being A SEZ”. Asia Competitiveness Institute, National University of Singapore, August 2009. Available: http://www.spp.nus.edu.sg/aci/docs/research_outputs/BBK_Past_History_and_Current_Development_Towards_Being_A_SEZ_24Aug09.pdf
107. Minister of Trade Regulation No. 09/M-DAG/PER/2/2007 on Provisions on the Export of Products of Forestry Industry. Available: http://faolex.fao.org/faolex/index.htm. The the Basic Forestry Act (No.5/1997) and the Forestry Law (No.41/1999) the primary source of guidance for all forest administration and regulations. It enables forest areas to be classified and delineated according to functions (e.g. protection, production, nature reserves and recreational purposes).
108. For details about FLEGT, see http://ec.europa.eu/environment/forests/flegt.htm.
84
Implementation of VPA would give a significant advantage to timber products from VPA partner countries.
Natural Cosmetics – The Minister of Health has issued Regulation No. 1175/MENKES/PER/VIIII/2010 on the registration of enterprises involved in the production of cosmetics.109 Only companies that are registered and licensed are permitted to produce and distribute cosmetic products to domestic and foreign markets. There are two types of licenses: type A allows the production of all forms and types of cosmetic preparations; and type B only allows the production of basic or low-tech, forms of cosmetics preparations. Type A permits have the following requirements as they relate to possible export: (1) cosmetics are produced by a qualified pharmacist that is fully responsible for the cosmetic product; (2) cosmetics are produced in appropriate facilities in accordance with the characteristics of cosmetic products; (3) the facility contains a laboratory division; and (4) the production methods follows the so-called Good Cosmetic Production Method (CPKB). Type B permits have the following requirements as they relate to distribution abroad: (1) cosmetics are produced by a qualified pharmacist that is fully responsible for cosmetic products; (2) cosmetics are produced in and appropriate facility with adequate technology; and (3) the staff of the facility is able to perform appropriate sanitation, hygiene, and documentation based on CPKB.
Indonesia has also become involved since 2003 in the ASEAN Harmonized Cosmetic Regulatory Scheme. Under this agreement, member countries agree to undertake actions leading to the harmonization of the cosmetics industry so that exports of ASEAN member countries are compatible with the domestic regulations of other members. Harmonization is being developed in the following areas: (i) definition of cosmetics; (ii) cosmetic ingredients listings and their publication in the ASEAN Handbook of Cosmetic Ingredients; (iii) cosmetic labeling requirements; (iv) cosmetic claims guidelines; (v) product registration requirements; (vi) cosmetic import-export requirements; and (vii) guidelines for Cosmetic Good Manufacturing Practice.
109. Ministry of Health. Regulation of Minister of Health No. 1175/MENKES/PER/VIIII/2010. 2010 Regarding the Registration for Cosmetic Production License. Jakarta, Indonesia.

85INDONESIA TRADE ACCESS TO THE EUROPEAN UNION: OPPORTUNITIES AND CHALLENGES
12.1 SME Knowledge about EU Market Access RequirementsAs part of the present study, interviews were conducted with small and medium size enterprises (SMEs) to gather information about their perceptions and awareness of market access conditions in the European Union. The findings of the survey are as follows:
Awareness on EU Standards: Many of the micro and small enterprises interviewed were unaware of EU market access standards. When questioned about specific standards for their industry, they did not recognize the standards or have any knowledge about their meaning. There were also unaware of institutions that offer certifications. In those cases where SMEs were aware of standards, they did not believe the cost of certification was within their reach. They also expressed concerns about being able to understand the standards, despite recognizing the importance of having those standards applied to their products. In general, SMEs see standards and regulations as a constraint instead of a tool to benefit them, and they perceive the standardization process as being inflexible. Furthermore, SMEs were often unaware of how they could find documentation on standards. They did, however, recognize that stricter requirements would lead to better quality products.
12 Business Associations Support
Highlights of Business Association Support
• SME survey results point to the lack of awareness of EU market access requirements, product design needed for European customers, and available government support programs. Information dissemination by both Government and business associations is therefore an important means of ensuring that SMEs are able to successfully participate in value chains supplying the EU and other markets.
• In the case of fishers, support services from the major institutions are effective, a situation that was supported under the European Union’s TSP-I.
• In agri-foods, the three principal organizations support the industry’s competence in food safety, processing and nutrition, especially for SMEs.
• In electronics, the multinationals tend to control R&D, although local research centers an universities provide support to the industry.
• In furniture, there is a wide range of public and private organization that could provide an effective vehicle for micro and small scale furniture makers to gain access to the EU market.
• In cosmetics, both public and private organizations help SMEs to understand international safety standards and packaging requirements to enhance their export potential.
Awareness on design required by EU customers: In general, SME producers awareness about the design required of EU customers is rudimentary. There is generally a lack of understanding about the differences between European customer tastes and preferences and those of Asian consumers. Often distributors in Europe must explain to furniture, cosmetics or agri-food producers about European requirements, a situation that is difficult for micro and small enterprises having no overseas networks.
Awareness on Government and Association support: The findings of the survey reveal that SMEs are generally unaware of government programs or support activities of other agencies that would help them access the EU market. Some SMEs are aware of local organizations but usually express skepticism about the benefits that they could derive from their services. As a result, they are reluctant to join the association.
12.2 Business Support in Focal Industries
12.2.1 Fisheries Industry
The four most important institutions supporting business activity in the fisheries industry are (i) the Ministry of Marine Affairs and Fishery; (ii) the Association for Fish Processing and Marketing Companies in Indonesia; (iii) the Shrimp Club Indonesia (SCI); and (iv) the Seafood Service Center in Surabaya. In general, the support services from these institutions are effective, a situation that has been enhanced by the focused activities of TSP-I in developing their capacity.

86
In the Ministry of Marine Affairs and Fishery (MMAF), the Production Directorate of the Directorate General for Aquaculture provides guidelines and certification for Good Aquaculture Practices (GAP), and technical guidance on fish farming for various fish species, fish feeding and feed production. The Directorate also provides guidance to farmers during field visits. MMAF has a wide network through the provincial fishery laboratories and has direct access to producers, farmers and shipping vessels.
The Association for Fish Processing and Marketing Companies in Indonesia (AP5I) is a processing and marketing association of Indonesian fishery processors. AP5I has been effective in conducting seminars, training, workshops and meetings with business stakeholders, as well as providing information on markets and applicable regulatory legislation. It publishes a newsletter about relevant issues to the industry. There is, however, no website for the Association, which prevents AP5I from having a wider dissemination of its services. It also supports developing human resources in the fields of planning, production, fishing, cultivation, processing and marketing of fishery products. AP5I endeavors to increase the awareness of its members in quality, quality improvement, and product safety standards such as required GMP standards, HACCP food safety management system, and International Organization for Standardization (ISO) standards. AP5I has excellent access to processors and is therefore capable of disseminating information to its members.
The Shrimp Club of Indonesia (SCI) is a shrimp farmers association that was established in 2005 to tack global issues on shrimp farming and processing. Issues that are closely followed by SCI include dumping, sustainable aquaculture, traceability and food safety. It has 360 members, mainly intensive shrimp farms on the islands of Sumatra, Java, Borneo, Sulawesi, Lombok, Sumbawa and Bali. The SCI promotes healthy shrimp farming without the application of antibiotics and creates awareness about the environmental impact of shrimp farming and provides guidance on the management of effluents. SCI appears to be a suitable cooperation partner for pilot projects with farmer groups and could facilitate nationwide capacity building for farmers.
The Seafood Service Center in Surabaya provides consultancy and training on market information, market access requirements, including those of the European Union, as well as export assistance, export marketing, management training, and diversification into value-added products. The Seafood Service Center provides Training of Trainers on export marketing and development and trends in the European market for fishery products. This center has been cooperating with Dutch, Swiss and Indonesian projects and is probably the only professional private organization in Indonesia, which provides such services. It appears that this organization works quite effectively for its customers.
Based on field interviews and discussions with both the associations and members, there appear to be adequate support services for the industry. Those currently being provided contribute significantly to improvements in the fishery value chain. Capacity building measures could be planned and performed in cooperation with these four institutions.
12.2.2 Agri-Foods Industry
There are three organizations providing supporting services to the food industry: (i) Gabungan Pengusaha Makanan dan Minuman Seluruh Indonesia (GAPMMI); (ii) Ministry of Industry (MOI); and Balai Besar Industri Agro (BBIA-MOI). GAPMMI promotes Indonesian food business in an effort to create a conducive business climate for the food and beverage industry. It seeks to strengthen its members’ competence in the field of food safety, processing, health and nutrition. It also acts as a spokesman for the food industry before the Indonesian Government. GAPMMI is actively supporting SMEs by supporting their development and providing networking services for them.
In the Ministry of Industry (MoI), the Directorate of Food and Beverage Industry provides support to SMEs working in the fruit juice production sector. One interesting pilot project in Kuningan, West Java, supports farmers and fruit juice producers by building their capacity in Good Agriculture Practices (GAP). The Directorate also provides technical support for the development of SME fruit processing

87INDONESIA TRADE ACCESS TO THE EUROPEAN UNION: OPPORTUNITIES AND CHALLENGES
companies in the area of fruit juice processing technology. MoI has been effective in providing its services through external consultants knowledgeable in best practices for fruit processing.
Balai Besar Industri Agro (BBIA) conducts research on food processing and provides consultancy, training and counseling to companies in the food production sector. BBIA is also an inspection body for the sterilization of food and inspects the temperature and time of the sterilization process. BBIA also provides Hazard Analysis Critical Control Point (HACCP) consultancy and certification.
12.2.3 Consumer Electronics Industry
There are several government and private sector institutions supporting the Indonesian electronic industry. The Ministry of Industry (MoI) provides support through training and information dissemination. The National Standardization Agency (BSN) develops national standards that are generally in line with international standards. Research and development (R&D) is provided by research centers, universities, and other institutions. However, the industry is controlled by multinationals with their own support systems. Those companies convey to their component suppliers the necessary information on quality, safety and environmental issues related to the products. Those business associations that exist provide limited support to local producers.110
The major research center for supporting the local industry is Balai Besar Bahan dan Barang Teknik (B4T). It is part of the Ministry of Industry and it provides services on testing, calibration, technical inspection, certification, technical training and research. B4T has good relationships with the electronic industry and conducts tests on electronic products and components. It also provides training to enhance technical standards and testing methods, and it supports BSN in developing national standards. It is likely to be the best conduit for capacity building of local producers in the industry.
12.2.4 Furniture Industry
There are several government and private institutions supporting the Indonesian furniture industry. The largest business association is Asosiasi Industri Permebelan dan Kerajinan Indonesian (ASMINDO). A regional association exists in Jepara, known as Asosiasi Pengrajin Kecil Jepara (APKJ). ASMINDO supports exporters, finishing companies and mechanized furniture producers, while APKJ helps small-scale furniture producers. In addition, Balai Pengujian Mutu Barang Ekspor Impor (BPMBEI) is a laboratory that provides quality and safety testing for furniture.
ASMINDO represents more than 2000 companies that are engaged in manufacturing and exporting furniture and furniture-related products, wood working and handicrafts. Its main activities involve marketing and promotion Indonesia furniture, securing raw material supply and financing, warehouse management for raw materials, and channeling of financial resources provided by the Ministry of Cooperatives to micro and small enterprises. It also conducts seminars, training and forums for its members on international marketing, export strategies, furniture design and finishing. ASMINDO participates in major international trade furniture shows and organizes the Indonesia Annual Furniture Fair IFFINA (Indonesia Furniture & Craft Fair). APKJ represents over 60 furniture producers in Jepara. It supports collaboration among producers in an effort to improve their bargaining power. It also supports local forest conservation by ensuring the wood used by the members comes from legal sites and is harvested sustainably and efficiently.
The Laboratory for Quality Testing of Export and Import Goods (BPMBEI) provides testing on furniture for various safety parameters. Other existing laboratories are controlled by the Ministry of Trade (Pusat Pelatihan Export Import; Export Import training centre, in Slipi, Jakarta) and under the Ministry of Forestry (Litbang Perhutanan; Forest Research and Development Division). BPMBEI is well-equipped with measurement devices for testing on furniture. However, it does not provide information to Indonesian furniture industry, and it is not well-known to furniture companies.
110. Two associations that have been identified, and neither maintains a web site or provides information about their activities. They are the Indonesian Electronic and Electrical Household Appliances Industrial Association GABEL (Gabungan Industri Elektronika dan Alat-Alat Listrik Rumah Tangga) and the Association of Electric Goods and Services ABE (Asosiasi Perusahaan Jasa dan Barang Teknik Elektronika).

88
It is apparent that ASMINDO and APKJ could provide important capacity building services in their respective areas. ASMINDO has the resources for country-wide activities, while APKJ focuses on the producer in Jepara. They would both be useful in projects like FLEGT or national quality improvement programs.
12.2.5 Cosmetics Industry
There are three business associations and two government laboratories supporting the cosmetic sector. The business associations are (i) Persatuan Perusahaan Kosmetik Indonesia (PERKOSMI); (ii) Gabungan Pengusaha Jamu dan Obat Tradisional Indonesia (GP JAMU); and (iii) Asian Cosmetic Association (ACA). The government laboratories are (i) BPMBEI of the Ministry of Trade (MoT), which provides quality and safety testing for cosmetics; and (ii) Balai Besar Kimia dan Kemasan (BBKK) of the Ministry of Industry (MoI), which provides testing on packaging for foods and cosmetics, as well as some limited testing on cosmetic products.
PERKOMSI is the largest cosmetics association, with membership covering both large and small producers and distributors. It collaborates with the Government to prepare and apply regulations concerning the cosmetics business, and it helps members to comply with rules and regulations governing cosmetics. It also supports SMEs and SMEs through training and the provision of information on export opportunities, and it plans to extend its services to information about EU regulations in an effort to help SMEs enter EU markets.
GP-JAMU is a small association for producers and suppliers of natural products. It focuses its activities on Indonesian herbs and traditional medicines, and it supports SMEs and farmers of natural ingredients.


