Impacts of extreme weather events, climate change, and crop waterrelationship for crops grown in Western Canada
Khakbazan M., Grant C., Mohr R.
in
López-Francos A. (comp.), López-Francos A. (collab.). Economics of drought and drought preparedness in a climate change context
Zaragoza : CIHEAM / FAO / ICARDA / GDAR / CEIGRAM / MARMOptions Méditerranéennes : Série A. Séminaires Méditerranéens; n. 95
2010pages 63-70
Article available on line / Article disponible en ligne à l’adresse :
--------------------------------------------------------------------------------------------------------------------------------------------------------------------------
http://om.ciheam.org/article.php?IDPDF=801326
--------------------------------------------------------------------------------------------------------------------------------------------------------------------------
To cite th is article / Pour citer cet article
--------------------------------------------------------------------------------------------------------------------------------------------------------------------------
Khakbazan M., Grant C., Mohr R. Impacts of extreme weather events, climate change, and crop
water relationship for crops grown in Western Canada. In : López-Francos A. (comp.), López-
Francos A. (collab.). Economics of drought and drought preparedness in a climate change context.
Zaragoza : CIHEAM / FAO / ICARDA / GDAR / CEIGRAM / MARM, 2010. p. 63-70 (Options
Méditerranéennes : Série A. Séminaires Méditerranéens; n. 95)
--------------------------------------------------------------------------------------------------------------------------------------------------------------------------
http://www.ciheam.org/http://om.ciheam.org/
Options Méditerranéennes, A no. 95, 2010 � Economics of drought and drought preparedness in a climate change context
63
Impacts of extreme weather events, climate change, and crop water relationship for crops
grown in Western Canada
M. Khakbazan, C. Grant and R. Mohr
Agriculture and Agri-Food Canada, Brandon Research Centre, PO Box 1000A, R.R #3, Brandon, MB, R7A 5Y3 (Canada)
e-mail: [email protected]
Abstract. The objective of this paper was to study the impact of drought and adaptation measures on the economics of production for some major crops grown in Western Canada. Crop yields, yield variability, and crop losses were analyzed to quantify drought impacts and statistical models were developed to estimate the relationship between yield and growing season precipitation for wheat, canola, oats, and barley. The linear and quadratic precipitation terms were found to have the correct sign and to be significantly related to yield (p < 0.01) for most crops studied. Results also indicated that ongoing technological advancements and increase in use of N fertilizer have had significant effects on yield improvement of crops grown in Western Canada. Crop yields in Western Canada show a positive trend over time with frequencies of crop losses due to extreme weather declining in recent years. Crop variability and crop losses have also declined over time indicating that adaptation practices and programs to diminish the impacts of extreme weather events and droughts were effective in Western Canada.
Keywords. Extreme weather � Climate change � Economic loss � Crop-water relationship.
Répercussions des conditions météorologiques exceptionnelles, du changement climatique et de la relation précipitations-culture sur les cultures dans l'Ouest canadien
Résumé. La présente étude a comme objectif d'examiner les répercussions de la sécheresse et des mesures d'adaptation sur les variables économiques de production pour certaines des principales récoltes produites dans l'Ouest canadien. Une analyse du rendement des cultures, de la variabilité des rendements et des pertes de récoltes a été faite afin de quantifier les répercussions de la sécheresse. Des modèles statistiques ont été élaborés pour évaluer la relation entre le rendement et les précipitations pendant la période de végétation pour les cultures de blé, de canola, d'avoine et d'orge. Les termes linéaires et quadratiques de précipitations ont un signe correct et un lien significatif au rendement (p < 0,01) relatif à la majorité des cultures à l'étude. En outre, les résultats démontrent que les avancées technologiques et l'utilisation accrue de fertilisant N ont de fortes répercussions sur l'amélioration du rendement des récoltes dans l'ouest du Canada. En effet, ces récoltes affichent au fil du temps une tendance positive, avec un déclin ces dernières années de la fréquence des pertes de récoltes causées par les conditions météorologies exceptionnelles. La variabilité des rendements et les pertes de récoltes ont également reculé au fil du temps, ce qui démontre la pertinence des pratiques et des programmes d'adaptation visant à atténuer les répercussions des conditions météorologiques exceptionnelles et des sécheresses dans l'Ouest canadien.
Mots-clés. Conditions météorologiques exceptionnelles – Changement climatique – Pertes économiques – Relations précipitations culture.
I – Introduction Western Canada has experienced some major droughts that had significant impacts on a wide range of economic activities and environmental resources including agriculture, forestry, water resources, waterfowl, fisheries, recreation, transportation, and hydroelectric energy. Drought-related issues included soil degradation and erosion, vegetation damage, slough and lake
Options Méditerranéennes, A no. 95 64
deterioration and wildlife loss. Western Canada has a short growing season and climatic conditions that vary widely across years and regions. The prospect of changing weather patterns has created concern regarding potential increases in the frequency and magnitude of extreme weather events and water deficits in drier regions of Canada. Historical records in Western Canada documents crop loss resulting from extreme weather events in many years. Drought caused significant crop losses in the 1930's, 1961, 1988, and more recently in 2001-2003. Climate change and trends in drought-related crop losses across Canada would suggest that the potential for crop losses due to extreme weather events is still a significant concern for Canadian farmers. Understanding the crop-water relationship will help to partially address some of these concerns and to minimize consequent impacts.
Crop water use is complex and is affected by several factors including crop type, soil water content, temperature, relative humidity, solar radiation, wind velocity, and canopy size (Curwen, 1993; King and Stark, 1997; Shaykewich et al., 2002). Each crop has differing responses to moisture, or lack thereof, and also to the timing of moisture deficits during the growing season. As such, water use for a given crop is a function of both the amount of water available to the crop and when that water is available relative to crop demand. While a simple crop and precipitation relationship may not provide sufficient explanation for crop yield variation, in general, crop yields should potentially increase with more rainfall and decrease with higher temperatures. Also, crop yield variability should decrease with increases in rainfall and increase with an increase in temperature (Wilcox, 2006). Taking into account this general relationship between weather and yields, the current study investigated drought and weather impacts for major crops grown in Western Canada and determined the extent to which weather changes had predictable effects on crop production.
Climate change models for the Canadian prairies generally predict an increased frequency of extreme weather events, and longer, warmer and drier summers, with greater potential for precipitation in the spring and winter (Tyrchniewicz and Yusishen, 2000). As a result, climate change is expected to have mixed effects on Western Canadian crop production. More spring precipitation could mean enough moisture for germination but it could also mean more frequent floods. Drier summers could mean an increased risk of drought while warmer summers could allow greater crop diversification including increased production of heat-loving crops like corn, and soybeans (Wilcox, 2006). Milder winter temperatures could increase the survival of winter cereals but could also increase the over winter survival of harmful insects and plant diseases (Wilcox, 2006). Pesticides might also become less effective as temperatures rise. While theories exist regarding the potential impacts of changing weather patterns on agriculture, the future impacts of new climatic conditions on crop production or the frequency of extreme weather events is largely unknown and lacking in empirical evidence. The objective of this paper is first to study the effects of extreme weather events, in particular drought impacts, on crop losses in Western Canada and second, to investigate and to understand the crop water relationship for major crops grown in Western Canada.
II – Materials and methods
1. Crop loss analysis
Crop yield data and climate data were analyzed to determine crop losses due to drought and extreme weather events in Western Canada. Climate data included total precipitation and temperature for the growing season (May-August) for the period 1901 to 2009. The annual average growing season precipitation ranged from 222 mm in Saskatchewan to 272 mm in Manitoba. Precipitation and temperature data from a few weather stations in each province were employed to calculate the average growing season's precipitation and heat units for the crop growing areas. Crop yields can be impacted by extreme events, by temperature variability (drought, frost), precipitation type (rain, snow, hail), timing, frequency, and intensity, and by
Economics of drought and drought preparedness in a climate change context 65
wind events (windstorms, tornadoes) (Wilcox, 2006). The non-statistical crop loss analysis employed in the first part of this study includes aggregate annual losses due to drought and extreme events but does not break the data down into type of losses such as frost or hail damage. In order to minimize over- or under-estimation of loss, the average crop loss due to drought or extreme events is compared to the average crop yield of the period in which the event occurred. For example, crop loss from the 1961 drought event was compared to at least 10 years of crop yield data around that event.
2. Climate change and yield and yield variability
Analysis of crop yield data should show any yield trends and reveal if there is evidence of effects of climate change on yields. Climate variability should lead to increased crop yield variation. The coefficient of variability (CV) measures the ratio of the standard deviation of a variable relative to its mean. The CV was used to show climate change impacts on yield variability because it was shown by Longley (1952, 1953) that CV is the best and most stable measure of precipitation variability.
3. Crop water relationship: Model specification
In general, crop yield functions have been specified as linear across most production inputs with quadratic or logarithmic measures of particular production inputs denoting nonconstant marginal physical products (Hansen, 1991). The crop yield function employed in this study is given by:
ttttt TIMETEMPWWY μλλββα +++++= 212
210 (1)
where, Yt is crop yield (kilograms/hectare) at time t, Wt is total precipitation (mm) during the growing period (May-August) at time t, Wt
2 is growing season precipitation squared at time t,
TEMPt is temperature (°C) during the growing period (May-August) at time t, and TIME (year) represents the ongoing technological advancements in agriculture. Total growing season precipitation is specified as a quadratic to allow for the possibility of a negative marginal product. The expected sign on the precipitation parameter is expected to be positive while the quadratic water term will be negative. The average provincial crop yield data were fitted to annual growing season weather data to determine crop responses to the precipitation and temperature during growing season. The data set in our study consisted of time-series data obtained from Statistics Canada (2010) and from Environment Canada monitoring weather stations (2010). Various factors have the potential to influence crop yield including environmental conditions, management practices and cultivar selection. Precipitation, temperature, and technological change were included in the model and other variables assumed constant. Ordinary least squares (OLS) estimation of equation (1) is consistent if E(Wt µt) = 0 for t = 1, 2, � T and provides consistent estimates for the ȕ's.
III – Results and discussion
1. Historical extreme weather events and crop loss impacts
A. 1930's
The multi-year droughts of the 1930's were considered among the most severe droughts on the Canadian prairies. Most of the years in 1930's were very dry years and received as low as 60% normal precipitation. Some weather stations recorded 45 days with maximum temperatures above 30°C in 1936 and 52 days above 30°C in 1937. Erosion was common for most of the years in many parts of province. Percentage of wheat yield lost was as high as 47% for Manitoba when compared to the period mean yield of 1.15 t/ha (data not shown). Wheat loss
Options Méditerranéennes, A no. 95 66
due to drought was significant and in 1931, for example, total wheat loss was near half a million tonnes in Manitoba. Barley yield loss was also high and for the majority of years was near or above 40% compared to the 1.35 t/ha of the period mean. Oat yield was impacted more severely than wheat and barley and the percentage of crop loss was near 50% for some years when compared to the 1.3 t/ha period mean. Total oat loss was near 0.4 million tonnes in 1931.
The impact of drought on crop losses during the 1930's was more severe in Saskatchewan than in Manitoba. Saskatchewan also experienced below normal precipitation and above average temperatures for most of these years (data not shown). Yield losses also occurred over a longer period compared to Manitoba and extended well into the 1940's. Wheat yield loss was near 50% for most years and in 1937 it went up as high as 85% yield loss or the equivalent of 5.5 million tonnes. The yield losses in barley and oat was similar and crop loss due to drought in 1937, for example, was 81% and 85% or the equivalent of 0.52 and 2 million tonnes of barley and oat, respectively.
Alberta also experienced severe drought in 1930's. Wheat loss ranged from 10 to 50% compared to the period mean of 1.3 t/ha (data not shown). In 1936 alone, more than 2 million tonnes of wheat were lost due to generally low precipitation and above normal temperatures. Large amounts of barley and oat were also lost due to drought impacts with losses as high as 35 and 42% in 1936 for barley and oats, respectively. Like Saskatchewan, severe yield losses also extended well into the 1940's in Alberta.
B. 1954
In contrast to the 1930's, 1954 was a relatively wet year especially in Saskatchewan and Alberta. All three prairie provinces experienced crop losses not due to drought, but rather due to excess moisture. Manitoba lost 38, 20 and 35% of wheat, barley and oat yield, respectively, compared to the period mean yield of 1.5, 1.35 and 1.4 t/ha (data not shown). Saskatchewan experienced a significant loss in wheat yield of 47% or about 4 million tonnes due to excessive moisture and cooler than normal temperature. However, yield losses in barley and oat were only 12% (data not shown). Alberta also experienced excess moisture and cooler than normal temperature but saw the opposite trend to Saskatchewan with respect to crop yield loss. Alberta experienced only 7% yield loss in wheat but comparatively higher losses of 23% and 20% in barley and oat, respectively (data not shown).
C. 1961
The most severe and extensive single-year drought on the Canadian Prairies in the 20th
century occurred in 1961 (data not shown). Growing season precipitation was less than 42% of normal and temperature was much higher than normal. Crop loss in Manitoba was 47, 45 and 50% for wheat, barley, and oat, respectively (data not shown). Saskatchewan lost 55% or more than 4 million tonnes of wheat in that year due to severe drought (data not shown). Yield loss in barley and oat was 58 and 63%, or, 0.6 and 0.5 million tonnes, respectively. Alberta crop loss due to drought in 1961 was not as severe as the other two provinces in Western Canada. Alberta lost 17, 10 and 6% of average wheat, barley, and oat yields, respectively (data not shown).
D. 1988
The three Western Canadian provinces experienced substantially lower than normal precipitation and above normal temperature in 1988. May to August growing season temperature in Manitoba was near 19.7°C, far above the normal of 16.4°C. Table 1 shows the impacts of the 1988 drought on the agricultural productivity of the prairie provinces. Although Alberta was not affected greatly by drought, Saskatchewan and Manitoba lost almost 50% of their agricultural productivity due to drought in that year. Crop loss of wheat, barley, oat, and canola for Manitoba was 40, 14, 26 and 23% of the period mean yield of 2, 2.2, 1.9 and 1.3 t/ha, respectively. Crop loss of wheat, barley, oat, and canola for Saskatchewan was 47, 15, 17 and
Economics of drought and drought preparedness in a climate change context 67
23% of the period mean yield of 1.7, 2, 1.8 and 1.3 t/ha, respectively. Saskatchewan and Alberta also experienced multi-year droughts in the 1980s and lost crops in 1984-1985.
Table 1. Impacts of the 1988 drought on the agricultural productivity
of the prairie provinces (thousands of tonnes, rounded to the nearest tonne)
1987 1988 10-year mean (1979-1988)
Alberta 23,525 22,889 23,698
Saskatchewan 23,333 11,250 22,153
Manitoba 10,619 6,228 10,291
Source: Lawford, 1992.
E. 2001-03
Again in 2001 the Canadian Western provinces experienced drought especially in Saskatchewan and Alberta. Saskatchewan experienced more severe drought than Alberta and Manitoba and lost 15, 19, 22 and 21% of its period mean yield of 2, 2.6, 2.3, 1.4 tonnes/ha for wheat, barley, oat, and canola, respectively. Yield losses in Manitoba were in the order of 6 to 13% depending upon the crop species, and ranged from 0 to 8% in Alberta.
F. 2005
In 2005 in Manitoba and in 2002 in Saskatchewan and Alberta, excess moisture and cooler than normal temperatures prevailed. Manitoba in 2005 lost 4, 25, 27, 13 and 10% and Alberta in 2002 lost 25, 23, 20, 14 and 9% of wheat, barley, oat, canola and potato yield, respectively. Saskatchewan in 2002 also lost 30, 31, 26 and 29% of wheat, barley, oat and canola yield, respectively. Crop production levels in 1954 and 2002 in Saskatchewan and Alberta and 2005 in Manitoba reveal that crop losses in Canada not only happen due to droughts but also as a result of other extreme weather events such as excess moisture, cool temperature and frost. In fact, a study in Manitoba indicates that excess moisture, drought, frost, hail, and heat accounted for 36.9, 29.9, 10.6, 7.7 and 5.5% of total crop losses (Wilcox, 2006).
One noticeable observation of each crop loss event was that crop loss has diminished over time. Crop loss from the 2001 drought period was much lower than the 1988 drought and the impact of the 1988 drought on crop loss was substantially lower that the 1961 drought. It appears that Western Canada has gained better experience in managing extreme weather events and put programs and practices in place to diminish the severity of drought damage. Zero or conservation tillage, crop rotations, crop diversification, new technologies for improving drought (or flooding) forecasting, investments in infrastructure, major changes to the landscape, investments in efficient irrigation systems, integrated pest management, and the development of heat- or drought-tolerant cultivars are a few practices that help to mitigate against extreme weather.
2. Climate change and yield and yield variability
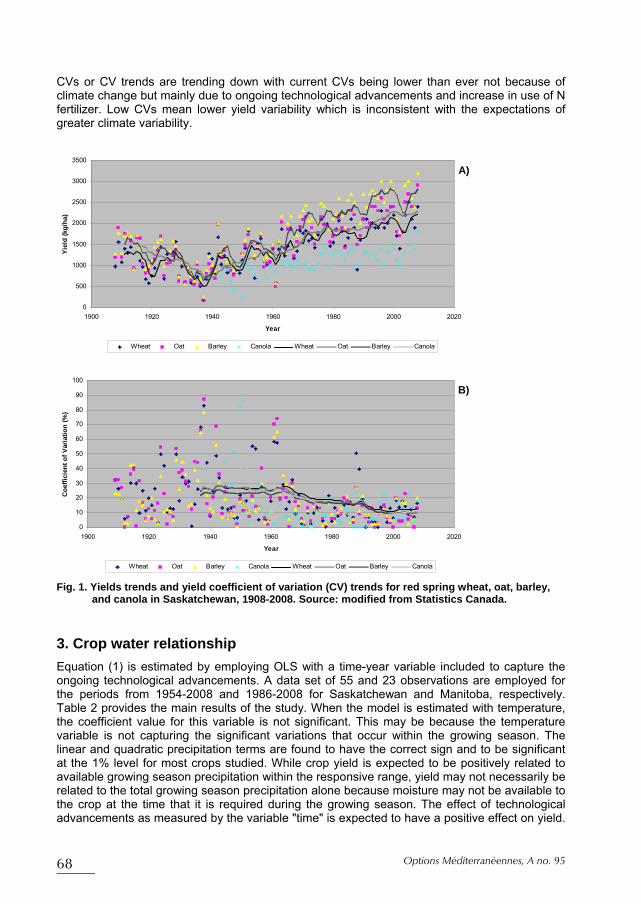
Figure 1A plots the average annual yields and the yield and Fig. 1B plots CV for wheat, oat, barley, and canola since 1908 in Saskatchewan. A trend line was plotted through the data. Based on a non-statistical analysis of the trend lines, the yields or yield trends in recent years can not be attributed to climate change. Overall crop yields have increased over time in a trend that could be explained mainly by ongoing technological advancements and increase in use of N fertilizer. The data show effects of extreme weather events, either drought or excess moisture or cool temperature, but it is very difficult to link variation to any climate change effects. The
Options Méditerranéennes, A no. 95 68
CVs or CV trends are trending down with current CVs being lower than ever not because of climate change but mainly due to ongoing technological advancements and increase in use of N fertilizer. Low CVs mean lower yield variability which is inconsistent with the expectations of greater climate variability.
Fig. 1. Yields trends and yield coefficient of variation (CV) trends for red spring wheat, oat, barley, and canola in Saskatchewan, 1908-2008. Source: modified from Statistics Canada.
3. Crop water relationship
Equation (1) is estimated by employing OLS with a time-year variable included to capture the ongoing technological advancements. A data set of 55 and 23 observations are employed for the periods from 1954-2008 and 1986-2008 for Saskatchewan and Manitoba, respectively. Table 2 provides the main results of the study. When the model is estimated with temperature, the coefficient value for this variable is not significant. This may be because the temperature variable is not capturing the significant variations that occur within the growing season. The linear and quadratic precipitation terms are found to have the correct sign and to be significant at the 1% level for most crops studied. While crop yield is expected to be positively related to available growing season precipitation within the responsive range, yield may not necessarily be related to the total growing season precipitation alone because moisture may not be available to the crop at the time that it is required during the growing season. The effect of technological advancements as measured by the variable "time" is expected to have a positive effect on yield.
0
10
20
30
40
50
60
70
80
90
100
1900 1920 1940 1960 1980 2000 2020
Year
Coe
ffici
ent o
f Var
iatio
n (%
)
Wheat Oat Barley Canola Wheat Oat Barley Canola
0
500
1000
1500
2000
2500
3000
3500
1900 1920 1940 1960 1980 2000 2020
Year
Yie
ld (
kg/h
a)
Wheat Oat Barley Canola Wheat Oat Barley Canola
A)
B)
Economics of drought and drought preparedness in a climate change context 69
Our results indicate that the ongoing technological advancements have positive and significant effects on yield improvement of most of the crops studied.
Table 2. Results of OLS regression model for crop yield and precipitation relationship
Manitoba Saskatchewan Variable
Wheat Barley Oat Canola Wheat Barley Oat Canola
Intercept -65221
(-3.00)�
-46687(-1.87)
-74682(-3.04)
-50050 (-4.24)
-30371(-6.47)
-48600(-9.05)
-38015(-8.27)
-21144 (-7.76)
Precip. (W)�� 14.143(2.06)
15.978(2.02)
16.361(2.11)
8.181 (2.19)
14.409 (3.59)
15.157(3.30)
13.644(3.47)
3.288 (1.41)
W2 -0.024
(2.99) -0.028(1.88)
-0.028(3.02)
-0.014 (4.23)
-0.029 (6.37)
-0.028 (8.96)
-0.025(8.17)
-0.005 (7.89)
Time 32.883(3.00)
23.817(1.88)
37.533(3.02)
25.270 (4.24)
15.338 (6.37)
24.671(8.96)
19.258(8.17)
11.025 (7.89)
Durbin Watson 2.012 2.132 1.913 1.982 1.882 1.760 1.592 1.484
Akaike criterion 14.630 14.913 14.878 13.413 14.151 14.420 14.110 13.064
Adj R-squared 0.378 0.229 0.390 0.528 0.566 0.689 0.671 0.583
�The numbers in parentheses are t-values. ��W is total growing season (May-Aug) precipitation.
IV – Conclusions Western Canada has experienced periodic drought conditions and many extreme weather events which had significant effects on a wide range of economic and environmental activities. Extreme weather events not only affect grain farmers, livestock producers, and associated businesses but also result in severe socioeconomic impacts. In the 1930s, for example, drought was the principal cause for the migration of over a quarter of a million people from the Prairies. We used provincial yield data for major crops grown in Canada to measure economic impacts of extreme weather events and water availability. Many parts of Canada experience extreme weather events once every four or five years and, although provincial yield data alone do not fully address the impact of extreme weather, these data show the consequences of and the relative severity of such events and demonstrate the importance of understanding crop water relationships. Western Canada has gained significant experience over time in managing severe weather and has reduced the potential impact of such events by putting in place programs, plans, technologies, infrastructure, knowledge and practices to prepare for, manage, and minimize the damage resulting from extreme weather.
Acknowledgements
The authors gratefully acknowledge financial support from Agriculture and Agri-Food Canada (AAFC). We also would like to thank Roger Fortier for technical support on this project.
References Curwen D., 1993. Water management. In: Rowe R.C. (ed.). Potato Health Management. St. Paul, Minn.:
APS Press, p. 67-75. ISBN: 0-89054-144-2. Environment Canada, 2010. Climate Data and Weather Data by Stations. Available on:
http://climate.weatheroffice.ec.gc.ca/climateData/canada_e.html. Accessed February 2, 2010. Hansen L., 1991. Farmer response to changes in climate: The case of corn production. In: Journal of
Agricultural Economics Research, 43(4), p. 18-25.
Options Méditerranéennes, A no. 95 70
King B.A. and Stark J.C., 1997. Potato irrigation management. In: University of Idaho Cooperative Extension System BUL-789.
Lawford R.G., 1992. Research implications of the 1988 Canadian Prairie provinces drought. In: Natural Hazards, 6, p. 109-129.
Longley R.W., 1952. Measure of the variability of precipitation. In: Mon. Weather Rev., 80, p. 111-117. Longley R.W., 1953. Variability of annual precipitation in Canada. In: Mon. Weather Rev., 81, p. 131-134. Shaykewich C.F., Raddatz R., Ash G., Renwick R. and Tomasiewicz D., 2002. Water use and yield
response of potatoes. In: 3rd Annual Manitoba Agronomists Conference, Winnipeg (MB), 10-11 December 2002, p. 172-178. http://www.umanitoba.ca/afs/agronomists_conf/2002/pdf/shaykewich.pdf.
Statistics Canada, 2010. CANSIM-Crops and horticulture. http://estat.statcan.ca/cgi- win/cnsmcgi.pgm?LANG=E&C2DB=EST&ROOTDIR=ESTAT/&ResultTemplate=ESTAT/CII_FLst&SrchVer=2&ChunkSize=50&CIITables=2024. Accessed 2 February 2010.
Tyrchniewicz A. and Yusishen B., 2000. Agriculture and Climate Change: Workshop Report, 23 March 2000. International Institute for Sustainable Development, Winnipeg, 15 p.
Wilcox D., 2006. Manitoba not yielding to climate change? In: Manitoba Agronomists Conference 2006 Proceedings, 12-13 December 2006. Faculty of Agricultural and Food Sciences, University of Manitoba.


