
Heather CooleyKristina Donnelly
Rapichan PhurisambanMadhyama Subramanian
August 2015
Impacts of calIfornIa’s ongoIng Drought:
agriculture

Impacts of calIfornIa’s ongoIng Drought:agriculture
August 2015
ISBN-10: 1893790665
ISBN-13: 978-1-893790-66-7
© 2015 Pacific Institute. All rights reserved.
Pacific Institute 654 13th Street, Preservation ParkOakland, California 94612Phone: 510.251.1600 | Facsimile: 510.251.2203www.pacinst.org
Designer: Bryan Kring, Kring Design Studio
Cover photo: Pgiam, istock.com

Impacts of calIfornIa’s ongoIng Drought: agrIculture I
about the pacIfIc InstItute
The Pacific Institute envisions a world in which society, the economy, and the environment have the water they need to thrive now and in the future. In pursuit of this vision, the Pacific Institute creates and advances solutions to the world’s most pressing water challenges, such as unsustainable water management and use, climate change, environmental degradation, food, fiber, and energy production, and basic lack of access to fresh water and sanitation.
Since 1987, the Pacific Institute has cut across traditional areas of study and actively collaborated with a diverse set of stakeholders, including leading policy makers, scientists, corporate leaders, international organizations such as the United Nations, advocacy groups, and local communities. This interdisciplinary and independent approach helps bring diverse groups together to forge effective real-world solutions.
More information about the Pacific Institute and its staff, board of directors, and programs can be found at www.pacinst.org.
about the authors
HeatHer Cooley
Heather Cooley is Director of the Pacific Institute’s Water Program. Her research interests include water conservation and efficiency, desalination, climate change, and Western water. Ms. Cooley holds an M.S. in Energy and Resources and a B.S. in Molecular Environmental Biology from the University of California at Berkeley. Ms. Cooley has received the U.S. Environmental Protection Agency’s Award for Outstanding Achievement for her work on agricultural water conservation and efficiency and has testified before the U.S. Congress on the impacts of climate change for agriculture and on innovative approaches to solving water problems in the Sacramento–San Joaquin Delta. Ms. Cooley has served on the California Commercial, Industrial, and Institutional Task Force and currently serves on the Board of Directors of the California Urban Water Conservation Council and the California Urban Stakeholder Committee.
Kristina Donnelly
Kristina Donnelly is a Research Associate with the Pacific Institute’s Water Program. Her research interests include: the social, economic, and policy aspects of water conservation; conflict and conflict management over transboundary water resources; low-impact development and green infrastructure policy and planning; and U.S. water policy and economics. Ms. Donnelly received a B.S. in Mathematics from American University and an M.S. in Natural Resources and Environment from the University of Michigan. Ms. Donnelly was selected as the 2008/09 Sea Grant Fellow with the Great Lakes Commission in Ann Arbor, Michigan. Prior to joining the Institute, she worked for the Arava Institute for Environmental Studies in southern Israel, conducting transboundary water research and organizing educational opportunities for Israelis, Jordanians, Palestinians, and other nationalities.

Impacts of calIfornIa’s ongoIng Drought: agrIculture II
rapiCHan pHurisamban
Rapichan Phurisamban is a Research Assistant with the Pacific Institute’s Water Program, where her primary work centers on the economic analysis of California’s water supply and storage initiatives and efficiency measures. She brings experience in California water rights law, climate change adaptation in water resources management, and international development. Prior to joining the Pacific Institute, she was a research consultant and project coordinator at a Thai nonprofit organization, working to promote sustainable food and agricultural systems. Ms. Phurisamban holds a B.A. in Economics from the University of British Columbia and an M.A. in Public Policy from the University of California at Berkeley.
maDHyama subramanian
Madhyama Subramanian is a sustainability professional with over nine years of experience in project management, research, and communications for various projects. She has worked with multilateral organizations, NGOs, and corporations in South Asia, Israel, and the United States. Ms. Subramanian received a B.A. in Visual Communication Design from the National Institute of Design in Delhi and an M.S. in Master of Development Practice from the University of California at Berkeley.
acknowleDgments
This report was funded by the Kindling Foundation, the Conrad N. Hilton Foundation, and the Wallace H. Gerbode Foundation. We thank them for their generosity and support. We would also like to thank all those who have offered ideas, data, information, and comments on the report, including Juliet Christian-Smith, Peter Gleick, Katy Mamen, Jeffrey Michaels, Kate Poole, Kurt Stock, and Robert Wilkinson.

Impacts of calIfornIa’s ongoIng Drought: agrIculture III
contents
introduction ............................................................................................................................... 1
scope and objective ................................................................................................................. 2
background: Water supplies for California agriculture ........................................................... 3
agricultural production and the Drought ................................................................................. 5Harvested Acreage .................................................................................................................................5Crop Revenue ........................................................................................................................................8
Drought and Food prices ......................................................................................................... 10
agricultural employment ........................................................................................................ 11
Water transfers ........................................................................................................................ 12
summary and Conclusions ..................................................................................................... 16
references ............................................................................................................................... 19
appendix 1: Data sources ....................................................................................................... 22
FiguRes And TAbles
Table 1. Comparison of senior and junior CVP contract holders’ annual water supply allocations
received as a percentage of maximum contract quantities, 2005–2014 .................................................................... 4
Table 2. Total annual deliveries from the SWP and contract deliveries from the CVP, 2005-2014 (in acre-feet) ............... 4
Figure 1. Municipal wastewater recycling by end use, 2009 ................................................................................... 5
Figure 2. California harvested acreage by crop type, 2000–2014 (in million acres) ................................................... 6
Figure 3. New plantings for selected crops, 2001–2014 (in acres) .......................................................................... 7
Figure 4. California crop revenue, by crop type, 2000–2014 (in billions of dollars) ................................................... 9
Figure 5. Cumulative groundwater depletion in the Central Valley since 1962 (in cubic kilometers) ............................ 10
Table 3. California share of U.S. production for select fruit, nut, and vegetable crops (in percentages) ........................ 11
Figure 6. Average number of jobs produced per acre of irrigated land, by major crop type ...................................... 13
Figure 7. Total volume of water transfers, 2009–2014 (in acre-feet) ....................................................................... 14
Figure 8. Water transfers by hydrologic region, 2009–2014 (in acre-feet) .............................................................. 15
Figure 9. Revenue generated from water transfers, 2009–2014 (in millions of dollars) ............................................. 16
\ Click on any of the figures to view larger in a web browser. | Figures and tables are free to use with proper attribution.
Impacts of calIfornIa’s ongoIng Drought: agrIculture 1
IntroDuctIon
California is one of the world’s most productive agricultural regions. The state is the nation’s largest agricultural
producer, supplying both U.S. and international markets with more than 400 different farm products. In 2013, total California farm output was valued at $50.2 billion, or about one-tenth of the total for the entire nation.1 Of this amount, $33.5 billion was from crops; $13 billion from livestock, poultry, and livestock products; and $2.4 billion from nursery, greenhouse, and floriculture (NASS 2015a, 2015b). California is the nation’s largest agricultural exporter, with exports reaching a record $21.5 billion in 2013 (CDFA 2015).
Several factors are putting pressure on the state’s agricultural economy: California has the most variable climate in the United States (Dettinger et al. 2011) and is prone to extreme hydrologic events, including multiyear droughts. The most significant statewide droughts have occurred during the six-year period from 1929 to 1934, the two-year period from 1976 to 1977, and the six-year period from 1987 to 1992 (DWR 2015a). More recently, California experienced a relatively modest drought from 2007 to 2009 and, as of this writing, is in the midst of a major drought that began in 2012.
1 All monetary values have been adjusted for inflation and are stated in year 2015 dollars, unless specified otherwise.
The current drought is the most severe in nearly 120 years of instrumental record.2 California has a Mediterranean climate, receiving very little precipitation during the summer months. California’s “water year” starts on October 1 and ends on September 30. The 2014 water year was the third driest on record, and 2012–2014 was the driest three-year period in the instrumental record. At 25% of average, the snowpack in 2014 was then the lowest ever recorded, but even this record was broken in 2015, when the snowpack reached a new low of 5% of average. The drought has also been extraordinarily warm. Dry conditions across the state have been exacerbated by high temperatures, with 2014 the hottest year on record and 2012–2014 the hottest three-year period on record (Mann and Gleick 2015).
Droughts have wide-ranging effects. However, assessing their impact is challenging because there is no standard methodology for measuring and comparing diverse impacts, data are often lacking, and it is difficult to isolate drought from other factors. Despite these difficulties, several studies have conducted retrospective analyses of the impacts of past droughts on the state’s agricultural sector (e.g., Gleick and Nash 1991; Christian-Smith
2 While some weather data are available from the mid-1800s and even earlier, consistent, high-quality instrumental data on temperature and precipitation typically date from around 1895. These data are maintained by the National Climate Data Center of the National Oceanic and Atmospheric Administration, www.ncdc.noaa.gov

Impacts of calIfornIa’s ongoIng Drought: agrIculture 2
million acre-feet would cause losses of $810 million in crop revenue and $203 million in dairy and other livestock value and that the added groundwater pumping would impose additional costs of $454 million on agriculture. Those projections did not incorporate the financial impact of crop and insurance programs or declines in other expenses (such as chemical, fertilizer, or labor costs), nor did it attempt to estimate the economic costs and benefits of market trades in water. That modeling study was completed in July 2014, but no detailed assessment of the actual agricultural impacts has yet been completed until this current study.
scope anD objectIve
This report examines the impacts of the ongoing drought on California’s agricultural sector through 2014. This analysis reports acreage (harvested cropland) and gross crop revenue (the total market value of agricultural products) for 2000–2014, based on data from the USDA National Agricultural Statistics Survey. All monetary values here are reported in year 2015 dollars. The value of production represents the gross revenue of agricultural commodities—the units produced multiplied by their per-unit market value in a given year. It does not include other sources of income (e.g., direct payments from the government, sales of farm-related goods and services, or noncash income such as the value of home consumption of self-produced food). Nor does it include cash and noncash expenses. It therefore does not reflect net farm income.
We limit our analysis to impacts on three major crop categories: field crops; vegetables and melons; and fruits and nuts.3 We do not examine
3 Field crops are crops other than fruits and vegetables that are grown for agricultural purposes and include corn, alfalfa, cotton, rice, grains, etc.
et al. 2015; Michael et al. 2010; Dziegielewski et al. 1993). Most recently, Christian-Smith et al. (2015) evaluated the agricultural acreage, yield, and revenue during the 2007–2009 drought, which at the time was the state’s 12th driest three-year period on record. The authors found that in 2009, gross revenue from California farms and ranches was the third highest on record, behind only 2007 and 2008. Not surprisingly, however, impacts varied within and between counties. For example, gross revenue increased by 2% in Fresno County during the drought years but declined by 9% and 19% in neighboring Kern and Kings Counties, respectively.
The resilience of the agricultural sector during the 2007–2009 drought was due to several factors, including the sector’s strong financial position before the drought began, high crop prices, and the variety of response strategies employed. In particular, growers changed crops, improved their irrigation practices, fallowed land, engaged in water transfers, received insurance payments, and pumped more groundwater. These strategies helped buffer the state’s agricultural sector from drought-period losses and contributed to far fewer job losses than had been projected (Michael et al. 2010; Howitt et al. 2011). Christian-Smith et al. (2011), however, noted that “some of the response strategies such as groundwater mining were short-term fixes that would not provide water security in the face of a longer or more severe drought.”
The current drought is much more severe than the 2007–2009 drought, and its full impacts are not yet known. In a recent modeling effort, Howitt et al. (2014) projected that the 2014 drought would reduce surface water availability for agriculture by 6.6 million acre-feet but that these reductions would be partially offset by increased groundwater pumping of 5.1 million acre-feet. They then projected that the resulting water shortage of 1.5

Impacts of calIfornIa’s ongoIng Drought: agrIculture 3
with riparian rights and pre-1914 appropriative water rights) are given higher priority than junior water rights holders.4 During a drought, those with junior water rights (also referred to as post-1914 water rights) are more likely to be subject to cutbacks to protect senior right holders. Likewise, there is a hierarchy of water contracts within the CVP and SWP (Table 1). Nearly all the users who receive priority deliveries from the CVP are agricultural users, and while USBR may reduce their supply during drought conditions, it has done so only six times since 1977. Similarly, while some users of SWP water will receive less than their contracted amount, the supply to others is near guaranteed even in times of drought. Even during a prolonged drought, substantial volumes of surface water are delivered through the state and federal systems (Table 2).
Groundwater is the second key water source for California farmers, accounting for nearly 40% of the water used for irrigation in 2010 (USGS 2014). State totals, however, hide regional dependence on groundwater. Groundwater accounts for more than 90% of irrigation withdrawals in ten counties, most of which are located along the coast. Large volumes of groundwater are also used for irrigation in Tulare, Kern, and Fresno Counties, which together account for more than a quarter of the state’s irrigated area. During drought years, when surface supplies are limited, groundwater becomes an important supplemental supply for farmers. However, the current use of groundwater far exceeds the natural rate of recharge. This has resulted in a decline of groundwater levels across large parts of the state, saltwater intrusion and other water-quality impairments, land subsidence, lost storage, and increased energy costs, among
4 Riparian rights are tied to property that is connected to a stream or river. Appropriative water rights are based on the “first in time, first in right” principle, in which pre-1914 rights have priority over post-1914 rights.
the impacts on animal products (e.g., livestock and dairy) or nursery products, because complete data for 2014 are not yet available for these sectors. Moreover, we focus on data aggregated at the state level because complete county and regional data are not yet available. We note, however, that there will certainly be important differences between and within counties due to water availability. As these data are made available, we will provide a more detailed analysis of regional impacts.
backgrounD: water supplIes for calIfornIa agrIculture
Water for California agriculture comes from three key sources: surface water, groundwater, and recycled water. Of these, surface water is the largest source, providing about 60% of the agricultural water supply in an average year. While some farmers and irrigation districts hold surface water rights, which are administered by the State Water Resources Control Board, others have contracts from the federal Central Valley Project (CVP) or the State Water Project (SWP). Those contracts are administered by the U.S. Bureau of Reclamation (USBR) and the California Department of Water Resources (DWR), respectively. Contracts do not represent a water right. Rather, a contract is signed between a water right holder and an entity taking delivery of the water diverted under a particular water right. For example, the SWP district has a contract with DWR specifying the amount of water it is entitled to if full allocations are available. The SWP district then has contracts with landowners for distribution of the water it receives.
Total demand for water in the form of water rights claims greatly exceeds surface water availability in all years (Grantham and Viers 2014), and the allocation of available water is largely determined by California’s complex water rights system. Under this system, senior water rights holders (those

Impacts of calIfornIa’s ongoIng Drought: agrIculture 4
Table 1.
Comparison of senior and junior CVP contract holders’ annual water supply allocations received as a percentage of maximum contract quantities, 2005–2014
CVP Contractor (Sacramento Valley Water Year Hydrologic Classification)
2005(AN)
2006(W)
2007(D)
2008(C)
2009(D)
2010(BN)
2011(W)
2012(BN)
2013(D)
2014(C)
San Joaquin Exchange/Sacramento River Settlement Contractors
100% 100% 100% 100% 100% 100% 100% 100% 100% 65%/75%
Friant Division
Class I 100% 100% 65% 100% 77% 100% 100% 50% 62% 0%
Class II 100% 100% 0% 5% 18% 15% 20% 0% 0% 0%
Other Contractors
North-of-Delta Agriculture 100% 100% 100% 40% 40% 100% 100% 100% 75% 0%
North-of-Delta Urban 100% 100% 100% 75% 75% 100% 100% 100% 100% 50%
South-of-Delta Agriculture 85% 100% 50% 40% 10% 45% 80% 40% 20% 0%
South-of-Delta Urban 100% 100% 75% 75% 60% 75% 100% 75% 70% 50%
Notes: Sacramento Valley hydrologic classification abbreviations: W: wet; AN: above normal; BN: below normal; D: dry; C: critical. The Friant Division delivers water to contractors from Millerton Reservoir, and that water is allocated according to two classes: Classes 1 and 2. Class 1 water is the firm supply of up to 800,000 acre-feet, while Class 2 is the next increment of supply of up to 1,400,000 acre-feet and is only allocated once Class 1 needs are met.
Source: USBR 2015a
Table 2.
Total annual deliveries from the SWP and contract deliveries from the CVP, 2005-2014 (in acre-feet)
Year State Water Project Central Valley Project
2005 4,726,363 6,375,091
2006 4,827,082 6,237,911
2007 4,061,696 5,586,232
2008 2,838,128 5,316,167
2009 2,918,056 4,900,789
2010 3,505,140 5,590,610
2011 4,630,798 6,328,195
2012 3,967,453 4,648,840
2013 3,343,134 4,764,307
Note: An acre-foot is a quantity of water that would flood an acre of land one foot deep, or 325,851 gallons. The CVP data shown here are for contract deliveries only and exclude deliveries for other types of water, e.g., 215 water, spill water, well water, water rights-storage, and water transported under the Warren Act, because these are not considered contracted deliveries. The SWP data shown here cover all deliveries, including Table A, Article 21, Feather River diversions, and other SWP water deliveries.
Source: USBR 2015b; DWR 2015b; SWP data for 2013–2014 provided by DWR

Impacts of calIfornIa’s ongoIng Drought: agrIculture 5
agrIcultural proDuctIon anD the Drought
California’s agricultural sector is dynamic, responding to a host of local, national, and global conditions that change over time. We focus here on recent trends affecting harvested acreage, cropping patterns, production, and revenue. We also describe the impacts of the drought on food prices and employment.
HarvesteD aCreage
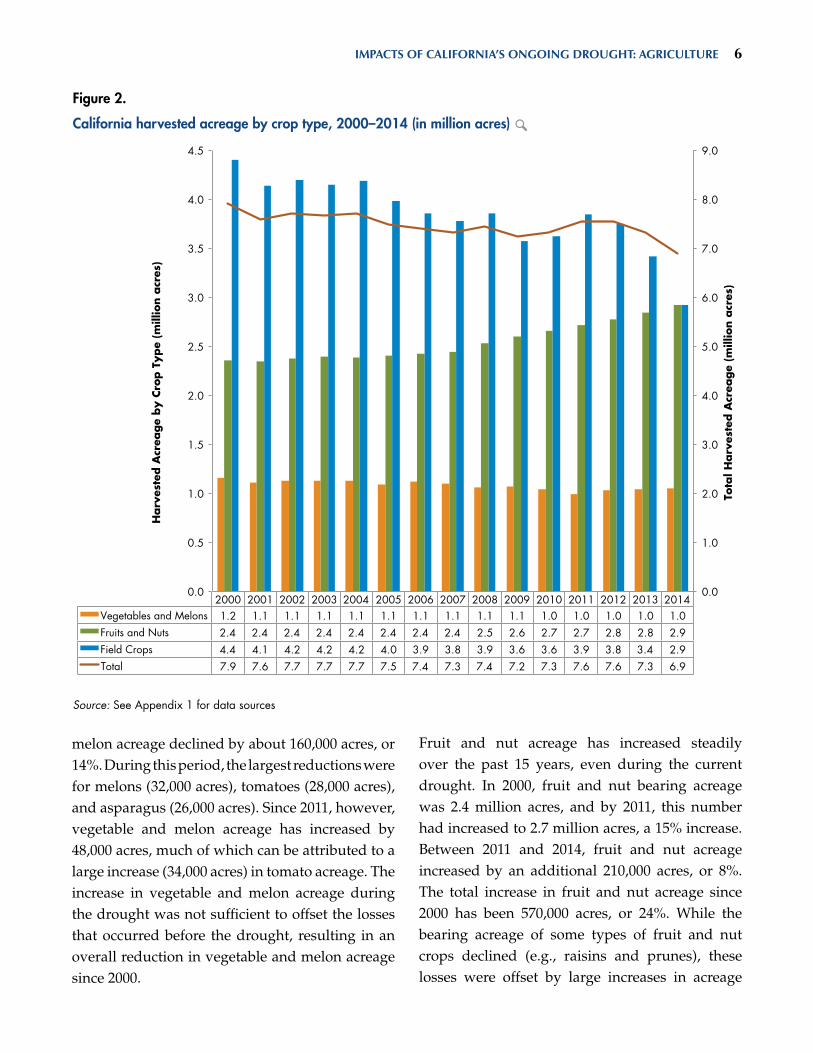
In 2000, nearly 7.9 million acres of land were harvested in California for a wide variety of vegetable, fruit and nut, and field crops (Figure 2). Between 2000 and 2011, annual harvested acreage averaged 7.5 million acres, with a slight downward trend over this period. Compared to this 12-year average, harvested acreage was 23,000 acres higher in 2012 but down by 216,000 acres in 2013 and 640,000 acres in 2014. By 2014 harvested acreage was 6.9 million acres, its lowest level in the past 15 years.
The types of crops grown in California have changed over the past 15 years, with reductions in the land area devoted to field crops, vegetables, and melons and an expansion of fruit and nut acreage. Between 2000 and 2011, total field crop acreage declined by 550,000 acres, or 13%. While the area planted with some types of field crops increased during this period (e.g., corn, wheat, and rice), others experienced large reductions. For example, cotton lost 460,000 acres, a 50% reduction; alfalfa lost 140,000 acres, a 14% reduction; and sugar lost 67,000 acres, a 73% reduction. During the drought, these trends accelerated, with field crops declining by an additional 930,000 acres (or 24%) between 2011 and 2014.
Vegetable and melon acreage has also been declining. Between 2000 and 2011, vegetable and
other adverse impacts. According to DWR (2014), “about 76 percent of the average annual groundwater extraction goes toward agricultural uses, with about 22 and 2 percent going toward urban and managed wetland uses, respectively.”
Recycled water also represents a modest additional water supply for California agriculture. The most recent statewide recycled-water survey, conducted in 2009, found that the annual reuse of municipal wastewater was 670,000 acre-feet, of which 245,000 acre-feet (37%) was for agriculture (Newton et al. 2012) (Figure 1).5 Additionally, recycled water used to recharge groundwater basins near agricultural areas indirectly supplies irrigation water to farmlands. Although agriculture is the single largest user of recycled water and has been using it as a supply for more than 100 years, it currently meets less than 1% of total agricultural water demand.
5 An acre-foot is the quantity of water that would flood an acre of land one foot deep, or 325,851 gallons.
Figure 1.
Municipal wastewater recycling by end use, 2009 \
Urban Irrigation
23%
Agricultural Irrigation
37% Commercial
and Industrial 9%
Geothermal Energy
2%
Groundwater Recharge
19%
Recreation 4%
Environment 4%
Other 2%
Source: Newton et al. 2012
Impacts of calIfornIa’s ongoIng Drought: agrIculture 6
Fruit and nut acreage has increased steadily over the past 15 years, even during the current drought. In 2000, fruit and nut bearing acreage was 2.4 million acres, and by 2011, this number had increased to 2.7 million acres, a 15% increase. Between 2011 and 2014, fruit and nut acreage increased by an additional 210,000 acres, or 8%. The total increase in fruit and nut acreage since 2000 has been 570,000 acres, or 24%. While the bearing acreage of some types of fruit and nut crops declined (e.g., raisins and prunes), these losses were offset by large increases in acreage
melon acreage declined by about 160,000 acres, or 14%. During this period, the largest reductions were for melons (32,000 acres), tomatoes (28,000 acres), and asparagus (26,000 acres). Since 2011, however, vegetable and melon acreage has increased by 48,000 acres, much of which can be attributed to a large increase (34,000 acres) in tomato acreage. The increase in vegetable and melon acreage during the drought was not sufficient to offset the losses that occurred before the drought, resulting in an overall reduction in vegetable and melon acreage since 2000.
Figure 2.
California harvested acreage by crop type, 2000–2014 (in million acres) \
2000 2001 2002 2003 2004 2005 2006 2007 2008 2009 2010 2011 2012 2013 2014 Vegetables and Melons 1.2 1.1 1.1 1.1 1.1 1.1 1.1 1.1 1.1 1.1 1.0 1.0 1.0 1.0 1.0 Fruits and Nuts 2.4 2.4 2.4 2.4 2.4 2.4 2.4 2.4 2.5 2.6 2.7 2.7 2.8 2.8 2.9 Field Crops 4.4 4.1 4.2 4.2 4.2 4.0 3.9 3.8 3.9 3.6 3.6 3.9 3.8 3.4 2.9 Total 7.9 7.6 7.7 7.7 7.7 7.5 7.4 7.3 7.4 7.2 7.3 7.6 7.6 7.3 6.9
0.0
1.0
2.0
3.0
4.0
5.0
6.0
7.0
8.0
9.0
0.0
0.5
1.0
1.5
2.0
2.5
3.0
3.5
4.0
4.5
Tota
l Harv
este
d A
crea
ge
(mill
ion a
cres
)
Harv
este
d A
crea
ge
by C
rop T
ype
(mill
ion a
cres
)
Source: See Appendix 1 for data sources

Impacts of calIfornIa’s ongoIng Drought: agrIculture 7
limited, information is available for some crops, including almonds, grapes, pistachios, and citrus (Figure 3). We found that new plantings have occurred every year since 2000, although there have been fewer new plantings during drought years for all of these crops, except pistachios. It is unclear to what extent these new plantings represent new acreage under development or whether they simply replaced old or unproductive trees and vines.
Both the type and the extent of harvested acreage in California are dynamic, affected to some degree by water availability and price but also by global
for other fruit and nut crops, especially almonds, pistachios, and wine grapes.
It is important to note that some of the increase in bearing acreage seen during the drought was the result of plantings in previous years. It often takes several years for trees and vines to become established and bear a crop that can be harvested (in what is referred to as “bearing acres”). Therefore, the change in the number of bearing trees and vines from year to year reflects young trees and vines going from “nonbearing” to “bearing” and old trees and vines being taken out of production. While data on new plantings are
Figure 3.
New plantings for selected crops, 2001–2014 (in acres) \
0
10,000
20,000
30,000
40,000
50,000
60,000
70,000
80,000
90,000
100,000
110,000
120,000
2000 2001 2002 2003 2004 2005 2006 2007 2008 2009 2010 2011 2012 2013 2014
New
Pla
ntings
(acr
es)
Citrus Raisin Grapes Table Grapes Wine Grapes Pistachios Almonds
Note: These are gross, not net, annual plantings. Some of these plantings contribute to the expansion of fruit and nut acreage seen across the state, but others reflect the replacement of trees that are no longer productive.
Source: See Appendix 1 for data sources

Impacts of calIfornIa’s ongoIng Drought: agrIculture 8
billion in 2011. Fruit and nut revenue continued to grow in 2012 and 2013, but declined slightly (by $140 million, or less than 1%) from 2013 to 2014. Despite this decline, fruit and nut revenue in 2014 was still higher than it was during the pre-drought period. Much of the increased revenue between 2000 and 2014 can be attributed to almonds (whose revenue increased by $5.0 billion) and to a lesser degree walnuts ($1.4 billion), strawberries ($1.4 billion), pistachios ($1.3 billion), citrus ($1.1 billion), and table grapes ($980 million).
By contrast, revenue from vegetables and melons has been fairly steady over the past 15 years, increasing in some years and decreasing in others. For example, in 2011, vegetable and melon revenue was down slightly from 2000 levels but then increased moderately in 2013 and 2014. Prior to the drought, revenue from field crops had generally been increasing despite reductions in field crop acreage; since 2011, however, field crop revenue has declined every year, although it remained higher in 2014 than it has been in seven of the past 15 years.
The long-term increase in crop revenue was driven by several factors. First, as noted above, there has been a shift from lower- to higher-value crops, as evidenced by the reduction in field crop acreage and the expansion of fruit and nut acreage. In 2014, for example, field crops generated $1,300 per acre, while vegetables generated $7,600 per acre and fruits and nuts generated $7,300 per acre. Second, the productivity—as measured by the tonnage produced per acre—has increased for some key crops, including almonds, rice, strawberries, tomatoes, and walnuts. Tomato productivity, for example, was 35 tons per acre in 2000 but increased to 45 tons per acre in 2014. Third, crop prices have increased for most crops grown in California. For example, almonds generated $2,600 per ton in 2000 but $6,400 per ton in 2014. Likewise, table
market conditions, including crop prices. The long-term trends include a slight reduction in harvested acreage and large changes from field to fruit and nut crops. These trends have accelerated during the drought. Much of the recent reductions in harvested acreage are due to short-term fallowing. Farmers fallow land for a variety of reasons, including a lack of water, low crop prices, and soil recovery. They may even sell water to another user. Most fruits and nuts are perennials that require water year-round and remain productive for many years. Thus, they cannot be fallowed when water is limited. Most field, vegetable, and melon crops, by contrast, are annuals that can be fallowed if needed. While vegetables and melons can be fallowed, they are generally of higher value than field crops and are thus less likely to be fallowed. Indeed, nearly all of the reductions in harvested acreage that have occurred since 2011 were field crops.
Crop revenue
Revenue from crops has increased markedly over the past 15 years. Figure 4 shows California’s crop revenue between 2000 and 2014 (adjusted for inflation and shown in year 2015 dollars). Between 2000 and 2011, crop revenue increased from $21 billion to $28 billion. During 2012 and 2013—the first two years of the drought—crop revenue continued to grow, reaching a record high of $34 billion in 2013. In 2014, crop revenue declined by $480 million, representing a 1.4% reduction from 2013 levels. Thus even during the most severe drought on record, agricultural revenue from crop production in 2013 and 2014 was the highest and second highest, respectively, in California history.
Higher crop revenue can largely be attributed to the expansion of fruit and nut crop acreage and strong market prices. Revenue from fruit and nut crops increased from $9.5 billion in 2000 to $16

Impacts of calIfornIa’s ongoIng Drought: agrIculture 9
an estimated 6.6 million acre-feet reduction in surface water availability. While data on actual groundwater usage are not available, recent satellite data indicate significant groundwater depletion in some areas both over the long term and especially in response to the current drought (Figure 5). Long-term declines in groundwater levels and a host of associated adverse impacts have underscored the fact that current levels of groundwater use in California are unsustainable.
Continued groundwater overdraft, while reducing
grapes generated $780 per ton in 2000 and $1,400 per ton in 2014. These factors have helped buffer the agricultural sector from the impacts of water shortages during the current drought.
In addition to these economic factors, farmers have increased groundwater pumping. California agriculture relies on groundwater for 40% of its water supply in average years and much more in dry years. Indeed, Howitt et al. (2014) projected that groundwater extraction in 2014 would increase by 5.1 million acre-feet statewide to offset
Figure 4.
California crop revenue, by crop type, 2000–2014 (in billions of dollars) \
2000 2001 2002 2003 2004 2005 2006 2007 2008 2009 2010 2011 2012 2013 2014 Vegetables and
Melons $7.5 $6.6 $6.7 $7.6 $6.9 $6.3 $6.9 $7.0 $6.9 $7.6 $7.0 $6.8 $6.4 $7.5 $7.9
Fruits and Nuts $9.5 $9.3 $10.2 $10.3 $11.6 $13.0 $12.1 $12.7 $12.5 $13.6 $15.2 $16.2 $19.1 $21.6 $21.5 Field Crops $3.7 $3.6 $3.8 $3.9 $4.1 $3.8 $3.5 $4.3 $5.1 $3.7 $4.1 $5.3 $4.8 $4.7 $4.0 Total $20.6 $19.5 $20.7 $21.8 $22.7 $23.1 $22.6 $24.1 $24.5 $24.9 $26.3 $28.2 $30.3 $33.8 $33.4
$0
$6
$12
$18
$24
$30
$36
$0
$4
$8
$12
$16
$20
$24
Tota
l Rev
enue
($ b
illio
ns)
Rev
enue
by C
rop T
ype
($ b
illio
ns)
Note: All values have been adjusted for inflation and are shown in year 2015 dollars. Revenue from livestock, poultry, and products, as well as from nursery, greenhouse, and floriculture are not included here because these data are not yet available for 2014.
Source: See Appendix 1 for data sources

Impacts of calIfornIa’s ongoIng Drought: agrIculture 10
Drought anD fooD prIces
California is a major agricultural producer, and for some crops, such as broccoli, grapes, almonds, and pistachios, the state accounts for more than 90% of the nation’s production (Table 3). Thus, concerns have been raised about the impact of the drought on food prices, especially as agricultural lands are fallowed and production costs rise (Koba 2014). Despite this concern, the U.S. Department of Agriculture (USDA) Economic Research Service (ERS) found that crop prices have seen both increases and decreases, but no evidence that increases are associated with the drought:
the economic impacts of the drought for the agricultural sector now, has shifted the burden to others. Individuals and communities whose wells have run dry have been forced to dig deeper wells or find alternative drinking water sources. Municipalities and other public entities must repair infrastructure damaged by subsidence. Moreover, future generations will pay more to access groundwater from greater depths and have less water available to meet their needs. The economic costs of these additional impacts are not included in this analysis, and no good estimate is available.
Figure 5.
Cumulative groundwater depletion in the Central Valley since 1962 (in cubic kilometers) \
Note: The red line shows data from USGS-calibrated groundwater model simulations (Faunt 2009) from 1962 to 2003. The green line shows GRACE-based estimates of groundwater storage losses from Famiglietti et al. (2011) and updated through November 2014. Background colors represent periods of drought (dark tan), of variable to dry conditions (light tan), of variable to wet conditions (light blue), and of wet conditions (dark blue).
Source: Figure courtesy of Jay Famiglietti, University of California at Irvine and NASA Jet Propulsion Laboratory. USGS data from Claudia Faunt.

Impacts of calIfornIa’s ongoIng Drought: agrIculture 11
While final data on 2015 food prices are not yet available, the USDA ERS projects that retail food price inflation will be normal to slightly lower than average due in part to the strength of the U.S. dollar and lower oil prices (USDA 2015a).
agrIcultural employment
An initial modeling effort by Howitt et al. (2014) projected that the drought would result in a loss of 17,100 seasonal and part-time jobs. New employment data from 2014 suggest that the actual impact of the drought on agricultural employment was much less than had been initially projected. Indeed, in 2014, California
“Increases in the retail prices for fresh fruits and vegetables in 2014 were primarily driven by an increase in the price for citrus fruit. However, rising citrus prices were reflective of two factors unrelated to the California drought. The first was the ongoing greening disease of Florida citrus commodities, which has damaged or destroyed substantial portions of the orange crop. The second was the December 2013 freeze in southern California that reduced the U.S. fresh orange crop. In 2014 fresh vegetable prices deflated 1.3 percent, despite the drought. Prices for fresh vegetables fell in 2014 after seeing higher than average price increases in 2013” (USDA 2015a).
Table 3.
California share of U.S. production for select fruit, nut, and vegetable crops (in percentages) \
California share of U.S.
production
California share of U.S.
production
California share of U.S.
production
Artichokes* 100% Strawberries* 90% Oranges 27%
Dates* 100% Cauliflower* 88% Onions * 26%
Figs* 100% Leaf lettuce, * 86% Pears 25%
Kiwifruit* 100% Avocados* 86% Cabbage 25%
Olives* 100% Carrots* 83% Sweet potatoes 24%
Almonds* 100% Romaine lettuce* 76% Sweet cherries 22%
Pistachios* 100% Head lettuce* 75% Sweet corn 22%
Walnuts* 100% Honeydew* 73% Squash 17%
Garlic* 98% Peaches* 72% Watermelon 17%
Plums and prunes* 97% Tangerines and 69% Pumpkins 16%
Broccoli* 95% mandarins* Grapefruit 14%
Celery* 95% Spinach* 63% Snap beans 13%
Lemons* 93% Chili peppers* 60% Cucumbers 10%
Apricots* 90% Raspberries* 57% Blueberries 8%
Tomatoes 90% Bell peppers* 56% Potatoes 3%
Grapes* 90% Asparagus* 47% Apples 3%
Notes: Calculated based on production in 2011–2013. Crops shown with an asterisk indicate those for which California ranks first in U.S. production.
Source: USDA 2015b

Impacts of calIfornIa’s ongoIng Drought: agrIculture 12
improving allocations. California has for several decades maintained a limited water market that allows for the temporary, long-term, or permanent transfer of the right to use water in exchange for compensation. Early efforts to facilitate the trade of water began in the late 1970s in response to a severe drought (DWR 1978). Market activity was slow in the early 1980s, with an annual average of 100,000 acre-feet in traded volume. Spurred by state and federal agencies’ dry-year purchases of water for resale and environmental protection, a voluntary water market expanded significantly after the 1987–1992 drought. Between 2003 and 2011, an average of 2.1 million acre-feet was committed annually for sale or lease, with 1.4 million acre-feet actually moving between parties (Hanak and Stryjewski 2012). The volume of water traded was 3.2% of statewide water use during that period. Hanak and Stryjewski (2012) found that long-term and permanent trades are becoming more common, accounting for more than half of the water actually traded and three-quarters of the water committed. An informal market also operates in California whereby farmers may sell their water to other farmers within the same region, but data on these trades are not available because farmers are not required to report to, or gain approval from, water authorities to complete these transactions.
For this analysis, we examine the extent to which water transfers have been used to mitigate the economic impact of the current drought on California’s agricultural sector. Since the onset of the drought, efforts have been made to improve the water-transfer process. For example, in May 2013, Governor Jerry Brown issued an executive order to streamline approvals for water transfers. However, the lack of a statewide database on water transfers is a major barrier to a comprehensive analysis of the voluntary reallocation of water between competing uses. Our analysis relies
agriculture employed a record-high 417,000 people (California Employment Development Department 2015a). According to the California Employment Development Department (2015b), agricultural employment in the third quarter of 2014—the period of peak farm employment—increased by 3,100 jobs from the same quarter in 2013. The agency further found that agricultural employment has increased every year since 2010 by an average of 9,000 jobs per year, although the increase in 2014 was less than in other years during that period. Agricultural employment was higher in 2014 than 2013 in the state’s coastal and desert areas, as well as in the Sacramento Valley. In an example of the regional differences in drought impacts, agricultural employment was lower in the San Joaquin Valley, which had more land fallowed than other parts of the state.
While employment data suggest that overall agricultural employment has reached record-high levels, agricultural employment would likely have been even higher if there had been less fallowing. Water availability, however, is only one factor affecting agricultural employment. The total number of jobs also depends on the types of crops grown. As shown in Figure 6, the shift away from field crops and toward tree crops and tomatoes, for example, has likely contributed to the growth in agricultural employment. Moreover, as recently as 2012, a survey by the California Farm Bureau Federation found that “farmers in every growing region of California reported having a difficult time hiring enough employees to work in agriculture and harvest their crops” (California Farm Bureau 2012).
water transfers
Some California water analysts have proposed using expanded water markets and water transfers as tools for addressing water shortages and

Impacts of calIfornIa’s ongoIng Drought: agrIculture 13
Figure 6.
Average number of jobs produced per acre of irrigated land, by major crop type \
- 20 40 60 80 100 120 140 160 180
Average Number of Jobs per Irrigated Acre
Corn
Irrigated Pastures
Dry beans
Grains
Rice
Safflower
Alfalfa
Other field crops
Almonds, pistachios
Cotton
Subtropical fruits
Sugar beets
Processing tomatoes
Deciduous fruits
Vineyards
Potatoes
Onions, garlicVegetables, horticulture,
non-tree fruits
Fresh tomatoes
Cucurbits
Note: Crop categories are defined by DWR. Cucurbits refer to melons, squash, and cucumbers. Other field crops include flax, hops, grain sorghum, sudan, castor beans, miscellaneous fields, sunflowers, hybrid sorghum/sudan, millet, and sugar cane. Deciduous fruits include apples, apricots, cherries, peaches, nectarines, pears, plums, prunes, figs, walnuts, and miscellaneous deciduous. Subtropical fruits include grapefruit, lemons, oranges, dates, avocados, olives, kiwis, jojoba, eucalyptus, and miscellaneous subtropical fruit.
Source: Data on irrigated crop acreage for 2010 are from the DWR. Employment estimates are from Medellin-Azuara et al. 2015 and based on data from the California Employment and Development Department and IMPLAN economic model.

Impacts of calIfornIa’s ongoIng Drought: agrIculture 14
Figure 7 shows the water transfer volumes between 2009 and 2014. Water transfer volumes are variable and are typically higher in dry years. From the available data, we estimate that water transfers in 2014 exceeded 710,000 acre-feet, which was 40,000 acre-feet less than was transferred in 2013 but more than in previous years. Of the transfers in 2014, 45% (or 310,000 acre-feet) were within the agricultural sector (i.e., between farmers or irrigation districts), while 38% (or 290,000 acre-feet) were transfers from agriculture to municipal and industrial users and 14% (97,000 acre-feet) from agriculture to fish and wildlife. A small amount of water was transferred between municipal and industrial users (4,800 acre-feet) and even less (4,000 acre-feet) from municipal and industrial users to agriculture.
Figure 8 shows water transfer volumes by hydrologic region. Note that all regions have had transfers at some time during this six-year
on data from several sources. They include the State Water Board’s temporary water transfer orders; DWR’s record of transfers that used SWP Delta export facilities;6 purchases by State Water Contractors;7 the Mojave Basin Watermaster; and major water sellers and buyers (e.g., Glenn Colusa Irrigation District, Yuba County Water Agency, Kern County Water Agency, Merced Irrigation District, and the San Luis and Delta Mendota Water Agency). While we have attempted to capture key data sources, actual transfer volumes likely exceed our current estimates. Thus, our results are minimum estimates of water transfer activities for the agricultural sector over the past six years.
6 Only available for 2014. These kinds of transfers can occur only when the DWR has met all operational and regulatory requirements and additional conveyance is available.
7 Only available for 2014 from the State Water Contractors. Other records were obtained from sellers transferring water to the agency’s members.
Figure 7.
Total volume of water transfers, 2009–2014 (in acre-feet) \
Note: Ag = agriculture M&I = municipal and industrial F&W = fish and wildlife
0
100,000
200,000
300,000
400,000
500,000
600,000
700,000
800,000
2009 2010 2011 2012 2013 2014
Wate
r V
olu
me
(acr
e-fe
et)
M&I to F&W M&I to M&I M&I to Ag Ag to F&W Ag to M&I Ag to Ag
0
100,000
200,000
300,000
400,000
500,000
600,000
700,000
800,000
2009 2010 2011 2012 2013 2014
Wate
r V
olu
me
(acr
e-fe
et)
M&I to F&W M&I to M&I M&I to Ag Ag to F&W Ag to M&I Ag to Ag

Impacts of calIfornIa’s ongoIng Drought: agrIculture 15
agricultural areas. However, the South Coast is the largest net importer of water, averaging 230,000 acre-feet per year. While transfers to the San Francisco Bay hydrologic region are generally small, they increased considerably during 2013 and 2014 in response to the drought.
Water markets serve as a mechanism to mitigate drought-induced losses. Figure 9 shows the value of water transfers between 2009 and 2014, where the value is based on the volume of water sold and the price for that water. The value of water transfers in 2014 was $210 million, much higher than in previous years, even though the volume of transferred water was less than it was in 2013 and only slightly more than it was in 2009. This was due to the relatively high price for water in 2014. The average price for water transfers in 2014 was $370 per acre-foot; it was $170 per acre-foot in 2013.
period. In some cases, transfers were into a region, sometimes out of a region, and many times both. We show here the net transfers, with negative values indicating net water exporters, and positive values net water importers. Given California’s unique hydrology and relatively abundant surface water supplies in the northern and mountainous areas of the state, much of the water transferred is from users in the Sacramento River region. For example, in 2014, net water transfers out of the Sacramento River region were 350,000 acre-feet, 92% more than in 2013. Net transfers from the Colorado River hydrologic region, largely a result of long-term water transfer contracts, have ranged from 165,000 to 200,000 acre-feet over the past six years. As the drought has intensified, the number of regions importing water from other parts of the state has increased. In particular, a large volume of water has been transferred to the Tulare Lake and San Joaquin River regions, the nation’s leading
Figure 8.
Water transfers by hydrologic region, 2009–2014 (in acre-feet) \
Note: Transfers involving the 2009 Water Bank, pools, or multiple entities where sources and destinations of water could not be identified have been excluded from this chart. Negative values indicate net water exporters, and positive values indicate net water importers.
-600,000
-400,000
-200,000
0
200,000
400,000
600,000
2009 2010 2011 2012 2013 2014
Wate
r V
olu
me
(acr
e-fe
et) Tulare Lake
South Lahontan
South Coast
SF Bay Area
San Joaquin River
Sacramento River
North Coast
Colorado River
Central Coast
-600,000
-400,000
-200,000
0
200,000
400,000
600,000
2009 2010 2011 2012 2013 2014
Wate
r V
olu
me
(acr
e-fe
et) Tulare Lake
South Lahontan
South Coast
SF Bay Area
San Joaquin River
Sacramento River
North Coast
Colorado River
Central Coast

Impacts of calIfornIa’s ongoIng Drought: agrIculture 16
volumes of water to the agricultural sector. The state, however, is prone to multi-year droughts. Indeed, California is in the midst of the most severe drought in nearly 120 years of instrumental record. The drought, which began in 2012, is having far-reaching effects that will intensify as the drought continues. This report examines the impacts of the ongoing drought on California’s agricultural sector through 2014. Our focus is on changes in total harvested acreage, gross crop revenue, and agricultural employment over the past 15 years and is based on data from the USDA National Agricultural Statistics Survey and the California Employment Development Department. We do not examine production costs, impacts on animal or nursery products, or regional impacts, as these data are not yet available.
We find that while harvested acreage in California has declined during the drought, agricultural revenue remains high. In 2014, harvested acreage was 6.9 million acres, lower than at any time in the
As described earlier, the agricultural sector was involved in about 99% of the water transfers in 2014, in some cases as buyers but in other cases as sellers. Of the $210 million in water transfers in 2014, nearly 70% (or $144 million) represented a transfer within the agricultural sector, likely from lower- to higher-value crops, helping to minimize losses in agricultural revenue. While agriculture paid nearly $640,000 to purchase water from municipal and industrial users, agriculture received nearly $66 million by selling water to other users. This represents another source of revenue for the agricultural sector that offset some of the crop revenue losses seen in 2014.
summary anD conclusIons
California is one of the most productive agricultural regions in the world, and that productivity has been made possible by a vast and integrated water infrastructure network that provides large
Figure 9.
Revenue generated from water transfers, 2009–2014 (in millions of dollars) \
Note: All values have been adjusted for inflation and are shown in year 2015 dollars. Ag = agriculture M&I = municipal and industrial F&W = fish and wildlife
$0
$50
$100
$150
$200
$250
2009 2010 2011 2012 2013 2014
Rev
enue
($ m
illio
ns)
M&I to M&I
M&I to Ag
Ag to F&W
Ag to M&I
Ag to Ag
$0
$50
$100
$150
$200
$250
2009 2010 2011 2012 2013 2014
Rev
enue
($ m
illio
ns)
M&I to M&I
M&I to Ag
Ag to F&W
Ag to M&I
Ag to Ag

Impacts of calIfornIa’s ongoIng Drought: agrIculture 17
food prices. Employment has increased in every year since 2010 by an average of 9,000 jobs, although the annual increase in 2014 was less than in other years during that period. By 2014, California’s agricultural sector employed a record-high 417,000 people. However, as an example of the regional differences, agricultural employment was up in the state’s coastal and desert areas and in the Sacramento Valley, but down in the San Joaquin Valley. Food prices appear to be largely unaffected by the drought. Although final data on 2015 food prices are not yet available, the USDA projects that retail food price inflation will be normal to slightly lower than average due in part to the strength of the U.S. dollar and lower oil prices.
It is important to note that statewide and even regional estimates can hide local variability. State agricultural revenue and employment remain high, but there are undoubtedly winners and losers. County-level acreage and revenue data are not yet available; however, the drought is very likely having a real impact on local economies in some areas, especially those areas with extensive fallowing. Fallowing means fewer employment opportunities for farm workers in those areas, and while some may be able to find work elsewhere, others may not.
Pressures on California agriculture are not merely a result of the drought. Rather, the drought is highlighting water management problems that have persisted for decades. For example, it is widely recognized that groundwater pumping rates are unsustainable in some major agricultural centers, such as the Tulare Lake and southern San Joaquin River hydrologic regions. In these areas, pumping will have to be slowed and recharge expanded to bring these aquifers back to a more sustainable balance. Moreover, climate change is making California’s temperature and precipitation patterns more variable, leading to more frequent
past 15 years. Reductions in field crops accounted for nearly all the cuts in harvested acreage since 2011. Bearing fruit and nut acreage, however, continued to increase, especially for almonds, pistachios, and wine grapes. While some of these were planted before the drought began, farmers have continued to plant new fruit and nut crops throughout the drought. Crop revenue was at its highest level in California’s history, peaking in 2013 at $34 billion. In 2014, crop revenue declined by $480 million, but it remained the second highest ever recorded.
California farmers have employed a range of strategies to respond to the drought, including under-irrigating their fields, fallowing land, shifting crops, purchasing insurance, and pumping more groundwater. Water transfers have also mitigated the impact of the drought. In some cases, farmers with lower-value crops sold their water to farmers with higher-value crops, thereby reducing total losses in agricultural revenue. Some farmers also sold their water for use by municipalities, industry, or the environment. These sales represent another source of revenue for the agricultural sector. Although data are incomplete, we estimate that voluntary sales from agriculture to non-agricultural users boosted agricultural revenue by at least $66 million in 2014, offsetting some of the losses from fallowing. These water transfers, however, may have resulted in socio-economic and environmental impacts that are not well understood or quantified. For example, while farmers may have received compensation for selling water, a farm worker may simply be out of a job. The impacts of water markets on California’s agricultural sector, society, and the environment are not well established and require further analysis.
Concerns have also been raised about the impacts of the drought on agricultural employment and

Impacts of calIfornIa’s ongoIng Drought: agrIculture 18
infrastructure damaged by subsidence. Water transfers have also played a role; however, the broader social and environmental impacts of these transfers are not well understood. Finally, short- and long-term shifts in the types of crops grown and improvements in irrigation technologies and practices have also improved the resilience of the state’s agricultural sector to extreme weather events. The impacts of the drought on California agriculture and its response provide insight into how the state can maintain a healthy agricultural sector in a future likely to see less water, more extreme weather, and greater uncertainty.
and intense floods and droughts and even higher crop water demands.
We conclude that the impacts of the drought on California’s agricultural sector through 2014 were less than expected. The current boon can be explained in part by the increased, but unsustainable, groundwater pumping. Continued groundwater overdraft, while reducing the economic impacts of the drought for the agricultural sector now, has shifted the burden to others, including current and future generations forced to dig deeper wells, find alternative drinking water sources, and repair

Impacts of calIfornIa’s ongoIng Drought: agrIculture 19
California Department of Water Resources (DWR). (1978). The 1976–1977 California Drought: A Review, 95–97.
California Department of Water Resources (DWR). (2014). California Water Today. California Water Plan Update 2013, Bulletin 160–13, 3–47.
California Department of Water Resources (DWR). (2015a). California’s Most Significant Droughts: Comparing Historical and Recent Conditions. Retrieved August 10, 2015, from http://www.water.ca.gov/waterconditions/docs/a9237_CalSignficantDroughts_v10_int.pdf.
California Department of Water Resources (DWR). (2015b). Table H-1. Management of the California State Water Project. Bulletin 132–13. Retrieved July 27, 2015, from http://www.water.ca.gov/swpao/docs/bulletins/bulletin132/Bulletin132-13.pdf.
California Department of Food and Agriculture (CDFA). (2015). California Agricultural Production Statistics. Retrieved June 9, 2015, from http://www.cdfa.ca.gov/statistics/.
California Employment Development Department. (2015a). Statewide Historical Annual Average Employment by Industry Data, 1990–2014. Retrieved July 29, 2015, from http://www.labormarketinfo.edd.ca.gov/LMID/Employment_by_Industry_Data.html.
California Employment Development Department. (2015b). Economic Update. Presentation by P. Wessen. Employment Development Department. Labor Market Information Division. Retrieved June 5, 2015, from http://www.calmis.ca.gov/file/Advisory-Group/Handouts/May_15/Economic_Update.pdf.
California Farm Bureau Federation. (2012). Walking the Tightrope: California Farmers Struggle with Employee Shortages. California Farm Bureau Federation, Federal Policy Division. Retrieved July 29, 2015, from http://www.cfbf.com/cfbf/_documents/issues/CFBF_Farm_Employment_Survey2012.pdf.
Christian-Smith, J., M. Levy, and P. H. Gleick. (2011). Impacts of the California Drought from 2007 to 2009. Oakland, Calif.: Pacific Institute.
Christian-Smith, J., M. Levy, and P.H. Gleick. (2015). Maladaptation to drought: a case report from California, USA. Sustainability Science 10(3): 491–501.
Dettinger, M.D., F.M. Ralph, T. Das, P.J. Neiman, and D.R. Cayan. (2011). Atmospheric rivers, floods and the water resources of California. Water, 3: 445–478.
references

Impacts of calIfornIa’s ongoIng Drought: agrIculture 20
Mann, M.E. and P.H. Gleick. (2015). Climate change and California drought in the 21st century. Proceedings of the National Academy of Sciences, 112(13): 3858–3859. www.pnas.org/cgi/doi/10.1073/pnas.1503667112.
Medellin-Azuara, J., J.R. Lund, and R.E. Howitt. (2015). Jobs per drop irrigation California crops. California WaterBlog. Retrieved July 29, 2015, from http://californiawaterblog.com/2015/04/28/jobs-per-drop-irrigating-california-crops/.
Michael, J., R. Howitt, J. Medellin-Azuara, and D. MacEwan. (2010). A retrospective estimate of the economic impacts of reduced water supplies to the San Joaquin Valley in 2009. Retrieved October 5, 2014, from http://forecast.pacific.edu/water-jobs/sjv_rev_jobs_2009_092810.pdf.
National Agricultural Statistics Service (NASS). (2015a). Crop values annual summary. Retrieved August 10, 2015, from https://usda.mannlib.cornell.edu/MannUsda/viewDocumentInfo.do?documentID=1050.
National Agricultural Statistics Service (NASS). (2015b). California agricultural statistics 2013 crop year. Retrieved August 10, 2015, from http://www.nass.usda.gov/Statistics_by_State/California/Publications/California_Ag_Statistics/Reports/2013cas-all.pdf.
National Agricultural Statistics Service (NASS). (2015c). Crop production annual summary. Retrieved August 10, 2015, from https://usda.mannlib.cornell.edu/MannUsda/viewDocumentInfo.do?documentID=1047.
Dziegielewski, B., H. Garbharran, and J.F. Langowski. (1993). Lessons Learned from the California Drought (1987–1992). Fort Belvoir, Va.: U.S. Army Corps of Engineers Water Resources Support Center, Institute for Water Resources, IWR Report 93-NDS-5.
Gleick, P.H. and L. Nash. (1991). The societal and environmental costs of the continuing California drought. Oakland, Calif.: Pacific Institute.
Grantham, T.E. and J.H. Viers. (2014). 100 years of California’s water rights system: patterns, trends, and uncertainty. Environ. Res. Lett., 9: 10pp.
Hanak, E. and E. Stryjewski. (2012). California’s Water Market, By the Numbers: Update 2012. San Francisco, Calif: Public Policy Institute of California.
Howitt, R.E., D. MacEwan, and J. Medellin-Azuara. (2011). Drought, Jobs, and Controversy: Revisiting 2009, ARE Update 14(6):1–4. University of California Giannini Foundation of Agricultural Economics.
Howitt, R.E., J. Medellin-Azuara, D. MacEwan, J. Lund, and D. Sumner. (2014). Economic analysis of the 2014 drought for California agriculture. Davis, Calif: UC–Davis Center for Watershed Sciences. https://watershed.ucdavis.edu/files/content/news/Economic_Impact_of_the_2014_California_Water_Drought.pdf.
Koba, M. (2014). Your food, your wallet and the California drought. CNBC. Retrieved July 31, 2015, from http://www.cnbc.com/2014/04/17/california-drought-rising-prices-on-these-fruits-vegetables.html.
Impacts of calIfornIa’s ongoIng Drought: agrIculture 21
United States Department of Agriculture (USDA) Economic Research Service. (2015a). California Drought: Food Prices and Consumers. Retrieved June 5, 2015, from http://www.ers.usda.gov/topics/in-the-news/california-drought-farm-and-food-impacts/california-drought-food-prices-and-consumers.aspx.
United States Department of Agriculture (USDA) Economic Research Service. (2015b). California Drought: Crop Sectors. Retrieved June 5, 2015, from http://www.ers.usda.gov/topics/in-the-news/california-drought-farm-and-food-impacts/california-drought-crop-sectors.aspx.
United States Geological Survey (USGS). (2014). California water use estimates for 2010. Retrieved October 5, 2014, from http://ca.water.usgs.gov/water_use/.
National Agricultural Statistics Service (NASS). (2015d). Non-citrus fruit and nut. Retrieved August 10, 2015, from https://usda.mannlib.cornell.edu/MannUsda/viewDocumentInfo.do?documentID=1113.
Newton, D., D. Balgobin, D. Badyal, R. Mills, T. Pezzetti, and H.M. Ross. (2012). Results, challenges, and future approaches to California’s municipal wastewater recycling survey. Retrieved April 10, 2015, from http://www.waterboards.ca.gov/water_issues/programs/grants_loans/water_recycling/docs/article.pdf.
United States Bureau of Reclamation (USBR). (2015a). Summary of water supply allocations. Retrieved August 10, 2015, from http://www.usbr.gov/mp/cvo/vungvari/water_allocations_historical.pdf.
United States Bureau of Reclamation (USBR). (2015b). CVP contract water delivery information. Retrieved August 10, 2015, from http://www.usbr.gov/mp/PA/water/docs/CVP_Water_Deliveries.pdf.

Impacts of calIfornIa’s ongoIng Drought: agrIculture 22
fIgure 2 – harvesteD acres
•Vegetableandmelonacreagetotalsrepresentthesumofharvestedacreageforthestate’sprincipalfresh market and processing vegetable crops. - 2000–2012 data are contained in the report “Vegetables - Final Estimates,” published every
five years by NASS (http://usda.mannlib.cornell.edu/MannUsda/viewDocumentInfo.do?documentID=1525).
- 2013 and 2014 data are contained in the 2015 report “Vegetables Annual Summary” (https://usda.mannlib.cornell.edu/MannUsda/viewDocumentInfo.do?documentID=1183).
•Fieldcropacreagetotalsrepresentthesumofharvestedacreageforthestate’sprincipalfieldcrops.- 2000–2012 data are contained in the report “Field Crops Final Estimates,” published every five
years (http://usda.mannlib.cornell.edu/MannUsda/viewDocumentInfo.do?documentID=1529). - 2013 and 2014 data are contained in the January 2015 report “Crop Production Annual Summary”
(https://usda.mannlib.cornell.edu/MannUsda/viewDocumentInfo.do?documentID=1047). •Fruitandnutacreagewascalculatedbysummingindividualacreageforthefollowingcrops(values
indicate acres bearing unless otherwise specified): almonds, apples, apricots, avocados, blueberries (acres harvested), sweet cherries, citrus (oranges, grapefruit, lemons, tangelos, and tangerines), dates, figs, grapes (raisin, table, and wine), kiwifruit, nectarines, olives, peaches, pears, pecans, pistachios, plums, prunes, raspberries (acres harvested), strawberries (acres harvested), english walnuts. - 2000–2012 data are contained in the reports “Citrus Fruits - Final Estimates” (http://usda.mannlib.
cornell.edu/MannUsda/viewDocumentInfo.do?documentID=1515) and “Noncitrus Fruits and Nuts - Final Estimates” (http://usda.mannlib.cornell.edu/MannUsda/viewDocumentInfo.do?documentID=1511). Avocado acreage was not available in 2012. Therefore, acreage value was carried forward from the previous year.
- 2013 and 2014 data are contained in the reports “Citrus Fruits” (https://usda.mannlib.cornell.edu/MannUsda/viewDocumentInfo.do?documentID=1031) and “Noncitrus Fruits and Nuts” (https://usda.mannlib.cornell.edu/MannUsda/viewDocumentInfo.do?documentID=1113).
fIgure 3 – new plantIngs
•Grapes:CaliforniaGrapeAcreageBulletins,2007–2015.http://www.nass.usda.gov/Statistics_by_State/California/Publications/Grape_Acreage/Reports/index.asp.
•2014CaliforniaAlmondAcreageReport,2015.http://www.nass.usda.gov/Statistics_by_State/California/Publications/Fruits_and_Nuts/201505almac.pdf.
appenDIX 1:
Data sources

Impacts of calIfornIa’s ongoIng Drought: agrIculture 23
•PistachioReportfromtheAdministrativeCommitteeforPistachios.http://www.acpistachios.org/pdf/2014Statistics.pdf.
•CaliforniaCitrusAcreageReports,2006–2014.http://www.nass.usda.gov/Statistics_by_State/California/Publications/Acreage/index.asp. Citrus includes grapefruit, lemons, limes, oranges, pummelos and hybrids, and mandarins and mandarin hybrids.
fIgure 4 – revenue
•Revenuetotalsbycroptype:- 2000–2012 data taken from “Crop Values Final Estimates,” published every five years (http://usda.
mannlib.cornell.edu/MannUsda/viewDocumentInfo.do?documentID=1513).- 2013 and 2014 data taken from “Crop Value Annual Summary Reports” (https://usda.mannlib.
cornell.edu/MannUsda/viewDocumentInfo.do?documentID=1050)•Vegetableandmelonrevenuetotalsforeachindividualcrop:
- 2000–2012 data taken from “Vegetables Final Estimates,” published every five years (http://usda.mannlib.cornell.edu/MannUsda/viewDocumentInfo.do?documentID=1525)
- 2013 and 2014 data taken from “Vegetables Annual Summary” (https://usda.mannlib.cornell.edu/MannUsda/viewDocumentInfo.do?documentID=1183).
•Fieldcroprevenuetotalsforeachindividualcrop:- 2000–2012 data taken from “Crop Values Final Estimates,” published every five years (http://usda.
mannlib.cornell.edu/MannUsda/viewDocumentInfo.do?documentID=1513).- 2013 and 2014 data taken from “Crop Values Annual Summary” (https://usda.mannlib.cornell.
edu/MannUsda/viewDocumentInfo.do?documentID=1050). Sugarbeet revenue was not available for 2014. Sugarbeet revenue was estimated using 1,003,000 tons at $52 per ton (2012 and 2013 price = $52.10) (NASS 2015a; NASS 2015c). Corn silage revenue was excluded from field crop revenue totals as it is generally just used on the farm and not sold as a product.
•Fruitandnutrevenuetotalsforeachindividualcrop:- 2000–2012 data are contained in the reports “Citrus Fruits - Final Estimates” (http://usda.mannlib.
cornell.edu/MannUsda/viewDocumentInfo.do?documentID=1515) and “Noncitrus Fruits and Nuts - Final Estimates” (http://usda.mannlib.cornell.edu/MannUsda/viewDocumentInfo.do?documentID=1511). Avocado acreage was not available in 2012. Therefore, revenue value was carried forward from the previous year.
- 2013 and 2014 data are contained in the reports “Citrus Fruits” (https://usda.mannlib.cornell.edu/MannUsda/viewDocumentInfo.do?documentID=1031) and “Noncitrus Fruits and Nuts” (https://usda.mannlib.cornell.edu/MannUsda/viewDocumentInfo.do?documentID=1113).

Impacts of calIfornIa’s ongoIng Drought: agrIculture 24
proDuCtion
•Vegetableandmelonproductiontotalsforeachindividualcrop:- 2000–2012 data taken from “Vegetables Final Estimates,” published every five years (http://usda.
mannlib.cornell.edu/MannUsda/viewDocumentInfo.do?documentID=1525)- 2013 and 2014 data taken from “Vegetables Annual Summary” (https://usda.mannlib.cornell.edu/
MannUsda/viewDocumentInfo.do?documentID=1183).•Fieldcropproductiontotalsforeachindividualcrop:
- All production data from “Crop Production Annual Summary” (https://usda.mannlib.cornell.edu/MannUsda/viewDocumentInfo.do?documentID=1047).
•Fruitandnutproductiontotalsforeachindividualcrop:- 2000–2012 data are contained in the reports “Citrus Fruits - Final Estimates” (http://usda.mannlib.
cornell.edu/MannUsda/viewDocumentInfo.do?documentID=1515) and “Noncitrus Fruits and Nuts - Final Estimates” (http://usda.mannlib.cornell.edu/MannUsda/viewDocumentInfo.do?documentID=1511). Avocado production was not available in 2012. Therefore, production value was carried forward from the previous year.
- 2013 and 2014 data are contained in the reports “Citrus Fruits” (https://usda.mannlib.cornell.edu/MannUsda/viewDocumentInfo.do?documentID=1031) and “Noncitrus Fruits and Nuts” (https://usda.mannlib.cornell.edu/MannUsda/viewDocumentInfo.do?documentID=1113).
- The following conversion factors were used to convert all production values into tons:- 1 hundredweight (cwt) = 0.05 short ton- 1 pound (lb) = 0.0005 short ton- 1 bushel barley = 48 lbs = 0.024 short ton- 1 bushel oats = 0.016 short ton- 1 bushel corn grain = 56 lb = 0.028 short tons- 1 bushel wheat = 60 lb = 0.03 short tons- 1 bushel oats = 32 lb = 0.016 short tons- 1 bale cotton = 480 lb = 0.24 short tons

Pacific Institute654 13th St. Preservation Park Oakland, CA 94612510-251-1600 | [email protected] | pacinst.org
ISBN-10: 1893790665
ISBN-13: 978-1-893790-66-7
© 2015 Pacific Institute. All rights reserved.


