Harrisburg School DistrictAct 141 Update
January 13, 2014
Public Financial Management, Inc.
Two Logan Square, Suite 160018th and Arch Streets
Philadelphia, PA 19103-2770215 567 6100

2
Agenda
• Review of recovery status• HSD revenues and expenditures• Baseline scenario• Impact of charter school growth• Alternatives• Discussion
2
Act 141 and the Chief Recovery Officer role
• Act 141 of 2012, the Commonwealth of Pennsylvania’s law to assist financially-challenged school districts, requires the appointment of a Chief Recovery Officer (CRO) for districts deemed to be in “recovery status”
• The CRO is charged with developing a financial and academic recovery plan with goal of quality education and multi-year balanced budgets
• During Plan drafting the CRO:– Regularly meets with School Board, Superintendent, an Advisory
Committee, and other key stakeholders– Holds public meetings to explain process and receive input– Works with community and learn hopes/concerns– Develops sound financial and academic recovery plan, working with
outside financial and academic experts
3
Why is HSD in “Recovery Status? Financial challenges Long-term budget imbalance Growing costs for charter schools, employee benefits Debt service a high proportion of annual spending Local revenue source is primarily property tax; 47% of
property is tax-exempt State revenues growing slowly Federal revenues down sharply
Academic performance In 2011 HSD ranked 494 out of 501 school districts In 2012 only 45% of Harrisburg students graduated high
school (state average 83% ) Only one Harrisburg school had a sufficient score on the
state’s new School Performance Profile issued last month
4
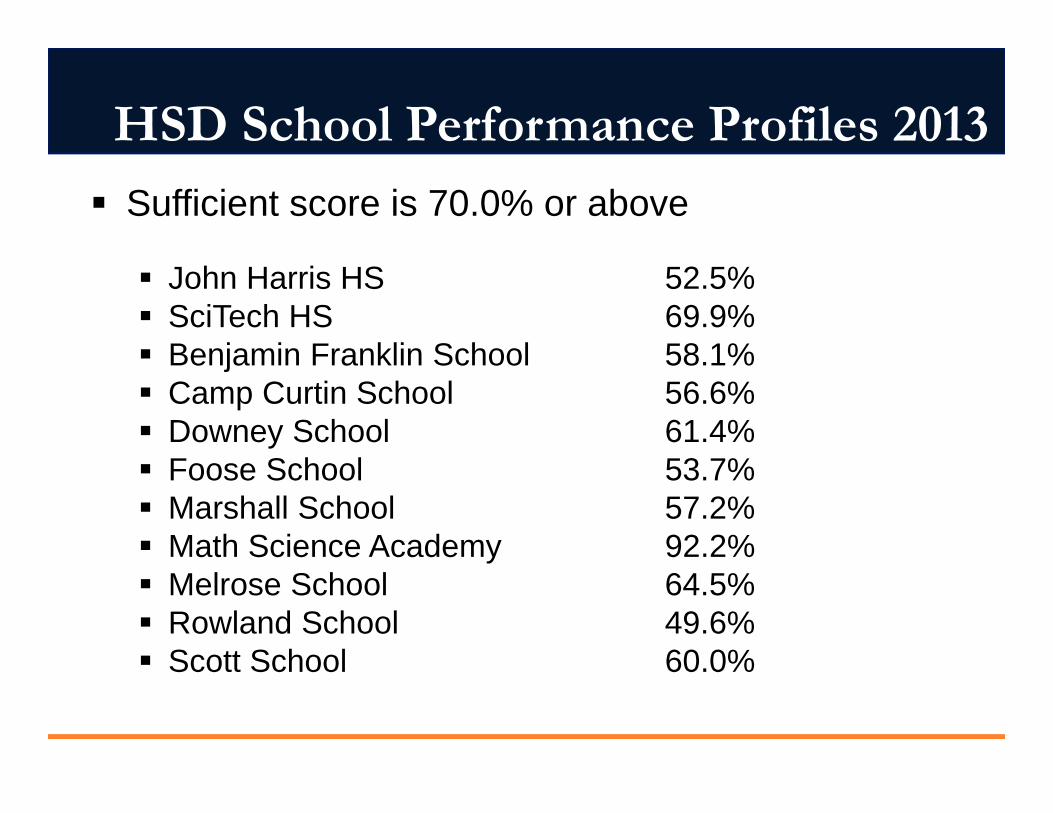
HSD School Performance Profiles 2013
Sufficient score is 70.0% or above
John Harris HS 52.5% SciTech HS 69.9% Benjamin Franklin School 58.1% Camp Curtin School 56.6% Downey School 61.4% Foose School 53.7% Marshall School 57.2% Math Science Academy 92.2% Melrose School 64.5% Rowland School 49.6% Scott School 60.0%
5
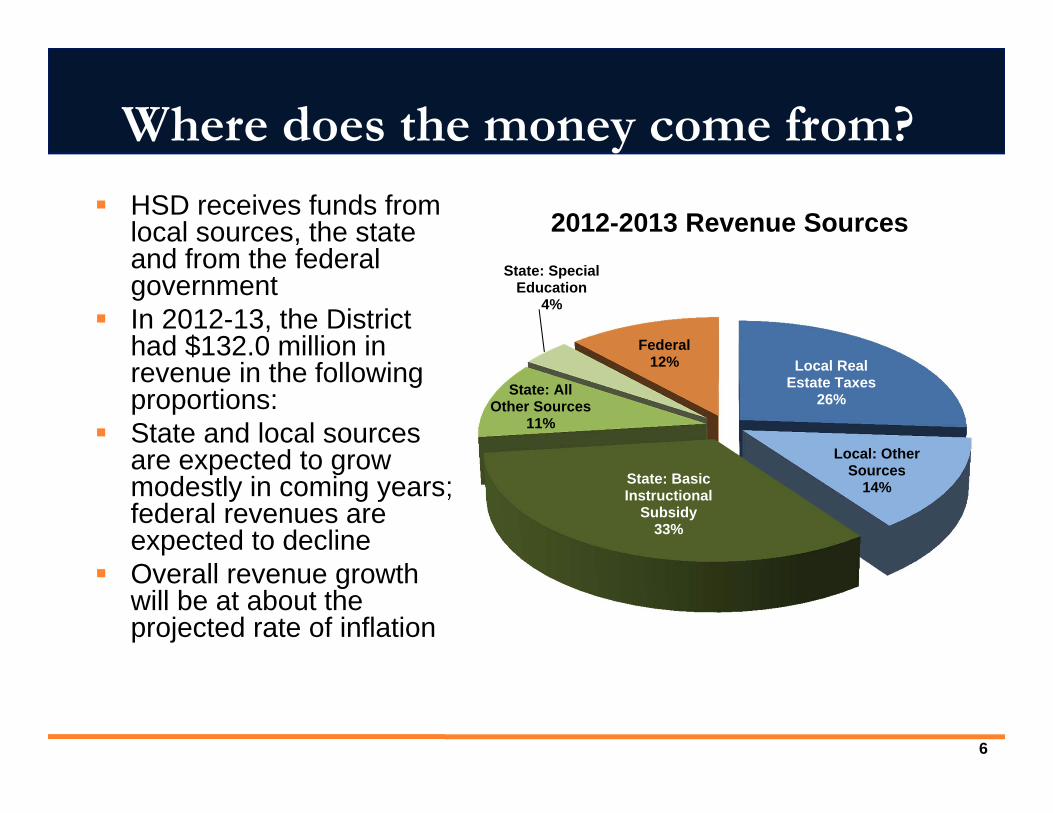
Where does the money come from?
HSD receives funds from local sources, the state and from the federal government
In 2012-13, the District had $132.0 million in revenue in the following proportions:
State and local sources are expected to grow modestly in coming years; federal revenues are expected to decline
Overall revenue growth will be at about the projected rate of inflation
Local Real Estate Taxes
26%
Local: Other Sources
14%State: Basic Instructional
Subsidy33%
State: All Other Sources
11%
State: Special Education
4%
Federal12%
2012-2013 Revenue Sources
6
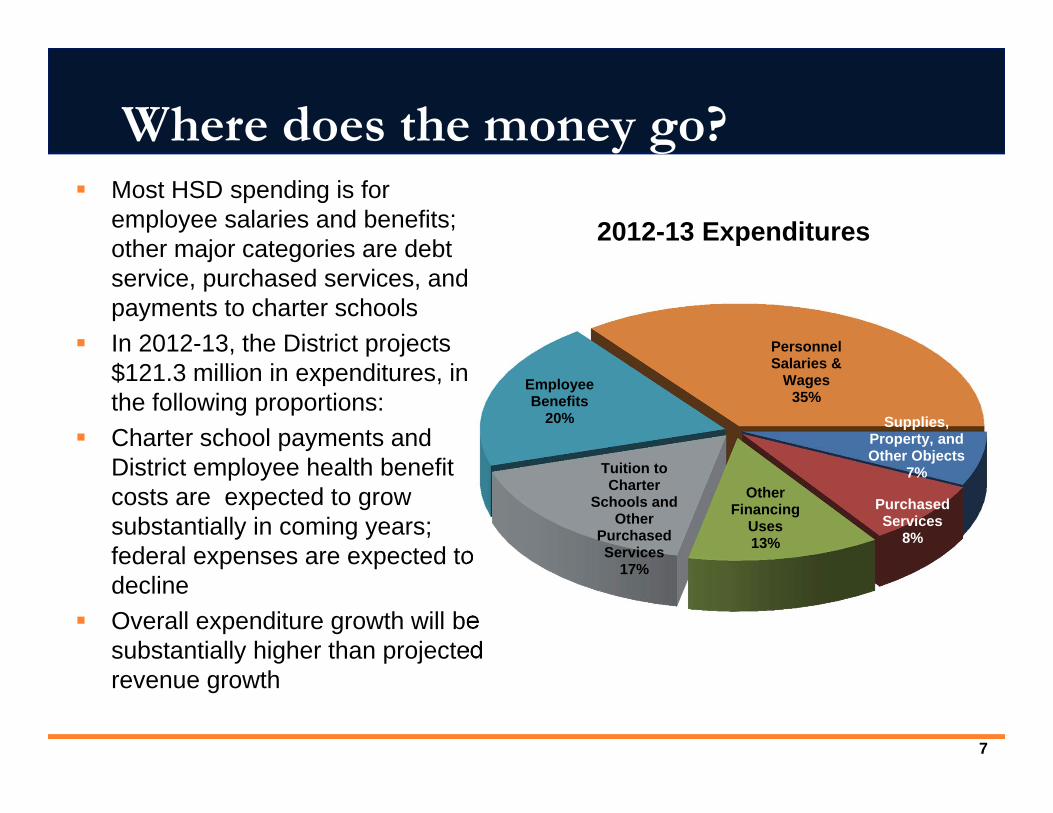
Where does the money go? Most HSD spending is for
employee salaries and benefits; other major categories are debt service, purchased services, and payments to charter schools
In 2012-13, the District projects $121.3 million in expenditures, in the following proportions:
Charter school payments and District employee health benefit costs are expected to grow substantially in coming years; federal expenses are expected to decline
Overall expenditure growth will be substantially higher than projected revenue growth
Supplies, Property, and Other Objects
7%
Purchased Services
8%
Other Financing
Uses13%
Tuition to Charter
Schools and Other
Purchased Services
17%
Employee Benefits
20%
Personnel Salaries &
Wages35%
2012-13 Expenditures
7
Progress of Act 141 in Harrisburg
• The Act 141 Recovery Plan for the Harrisburg School District was drafted in the winter and spring of 2013, submitted to the Board in April 2012, and approved by the Board in May 2013. Subsequently, the state Secretary of Education also approved the Plan, as required
• Major plan initiatives:– Improve academic performance on an annual basis based on standardizes test scores– Cut all salaries by 5% in FY 13 and FY 14– Cap growth in District benefit costs– Improve District cyber school over all academics to stop growth in charter schools– Employ a CFO to focus on District finance and operation– Grow real estate taxes in the future by maximum index– Right size food service and operations and maintenance– Move administration to a District owned building
• Numerous Plan provisions were implemented in 2013• In the fall of 2013, the District determined that actual financial results for the 2012-13 school year were
significantly better than anticipated when the plan was drafted• Subsequently, the District reviewed 2013-14 budget and concluded that this year’s performance will
also be better than originally projected• Despite recent financial improvements, significant financial and academic challenges remain• In order to recognize the better-than-expected short-term financial results while still addressing the
long-term challenges as required by Act 141, the CRO will develop and propose a new Recovery Plan early this year
• The remainder of this presentation focuses on the District’s key financial drivers and their impact on budget balance through the next five years
8
9
Baseline Scenario – 5 year Forecast of Finances
• PFM created a new baseline scenario to reflect the status quo – what do District finances look like through 2017-18 if no changes are made to current revenue and spending? – Updated 2012-13 and 2013-14 financials working with
CRO, CFO and Business Manager– Projected out years with no major changes to current
situation• 5% salary cut in July 2013
– Wages frozen thereafter (do not implement 5% cut next year)• No tax increases after 2013-14
– 1% annual assessed value growth assumed• No Transitional Loan from the Commonwealth or repayments• Charter enrollment growth based on change in December
enrollment from 2012-13 to 2013-14 (13.7%)
9
10
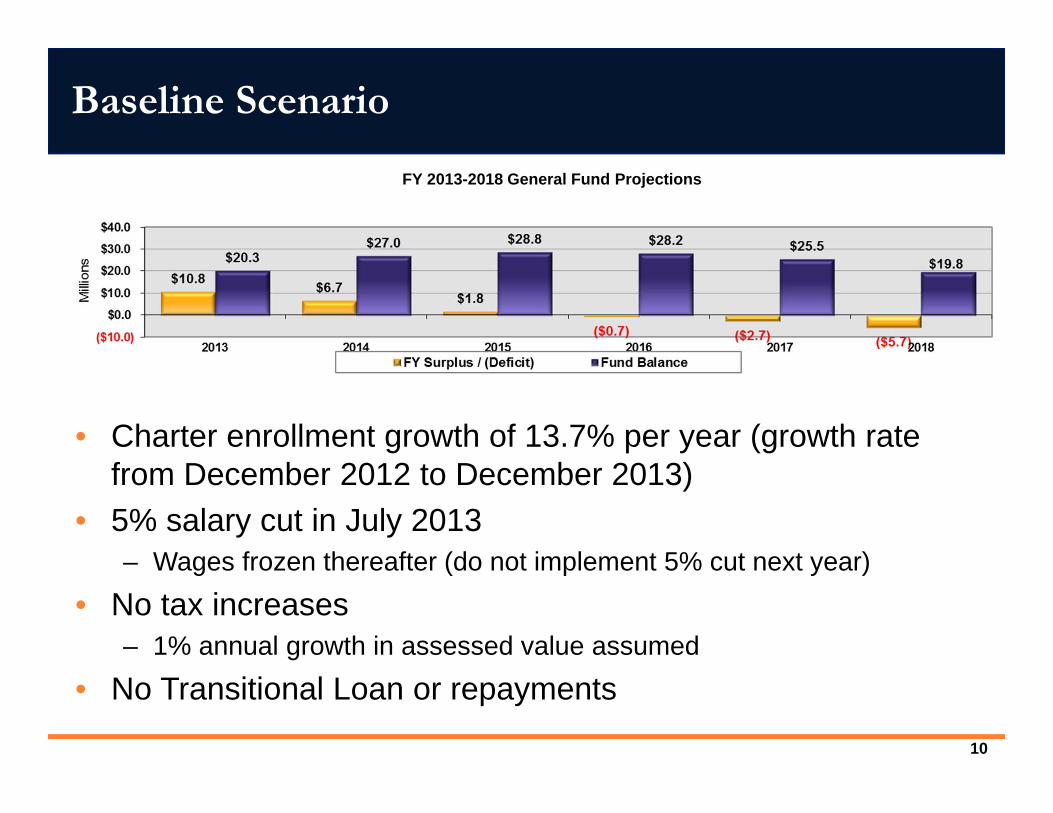
Baseline Scenario
• Charter enrollment growth of 13.7% per year (growth rate from December 2012 to December 2013)
• 5% salary cut in July 2013– Wages frozen thereafter (do not implement 5% cut next year)
• No tax increases– 1% annual growth in assessed value assumed
• No Transitional Loan or repayments
FY 2013-2018 General Fund Projections
10
11
What are the major reasons for the deficit in 2014-15 and through 2017-18?
• Increased charter school expenditures ($19.5 million)
• Growing pension costs ($10.9 million)• Growing employee health care costs ($10.2
million)• Scheduled debt service increase ($13.4 million)• Reduced federal funding ($24.0 million)• Growth in other revenue sources slower and
lower than growth in expenditures
11
12
Charter School Enrollment Growth a Key Assumption in District Financial Projections
• Assumptions about charter school enrollment are critical to the academic and financial future of the Harrisburg School District
• Although charter school enrollment growth over the last year appears to be less rapid than in the recent past, it still increased slightly faster than the Recovery Plan’s assumptions
• Charter growth has shifted from cyber charters to brick & mortar schools
12
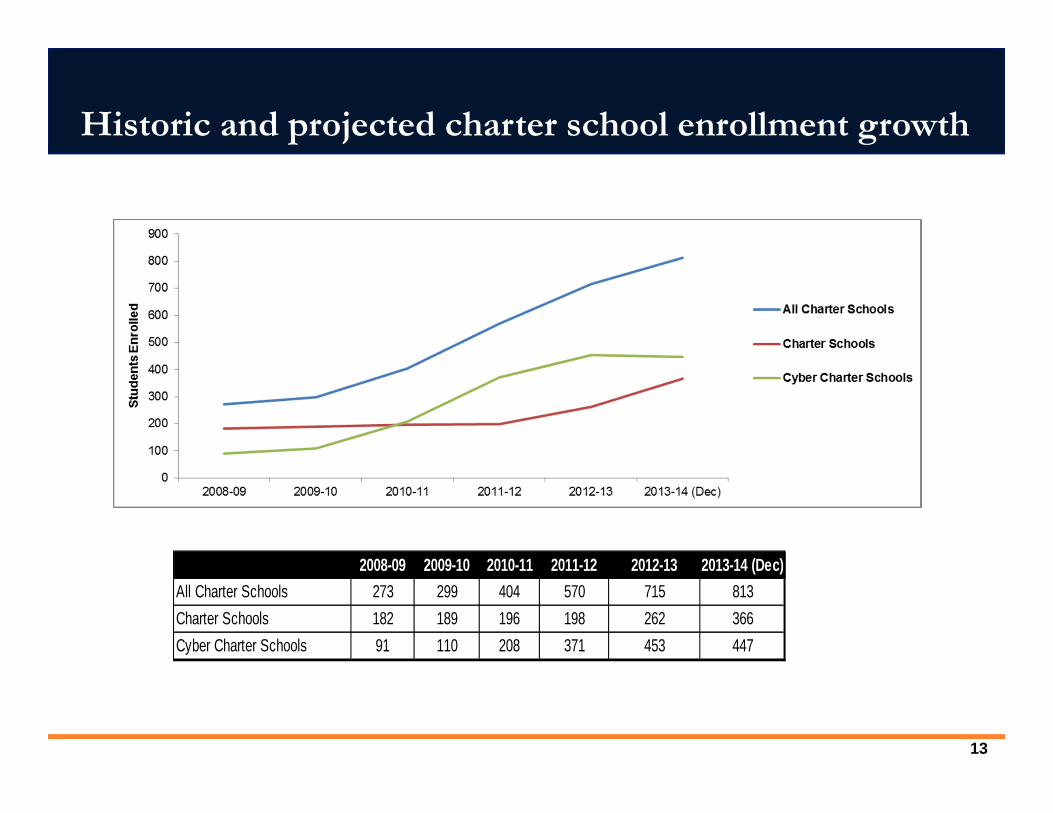
Historic and projected charter school enrollment growth
2008-09 2009-10 2010-11 2011-12 2012-13 2013-14 (Dec)All Charter Schools 273 299 404 570 715 813Charter Schools 182 189 196 198 262 366Cyber Charter Schools 91 110 208 371 453 447
13
14
Alternative Scenarios for Harrisburg School District
• Act 141 requires that the District achieve recurring annual positive financial results and improve academics– What happens if the 2013-14 wage cuts are
restored?– What if additional programs are added?
• In order to add expenditures for personnel or programs, need to find additional savings or more revenue to balance the annual budget after next year and in the long run
14
15
Alternatives to explore to fill the gap
• Charter School Growth– Devise a credible strategy to compete successfully with charter schools to
reduce the pace of their enrollment growth• Taxes
– Increase taxes to the Act 1 index in years after 2014-15• Wages
– Phase in restoration of 5% wage cut– Tie wage restoration to improved financial and academic performance
• Benefits– Cap District share of health care cost growth– Cap amount of health benefit opt-out
• Other– Eliminate Food Service Fund transfer from General Fund and repay prior
General Fund subsidy– Renegotiate energy contracts and increase energy efficiency – Increase delinquent real estate and earned income tax collection– Develop partnerships with tax-exempt entities to generate voluntary payments– Optimize ACCESS reimbursement– Reduce staff absenteeism
15


