Printed in Addis Ababa, Ethiopia by the ECA Documents Publishing and Distribution Unit. ISO 14001 : 2004 certified.
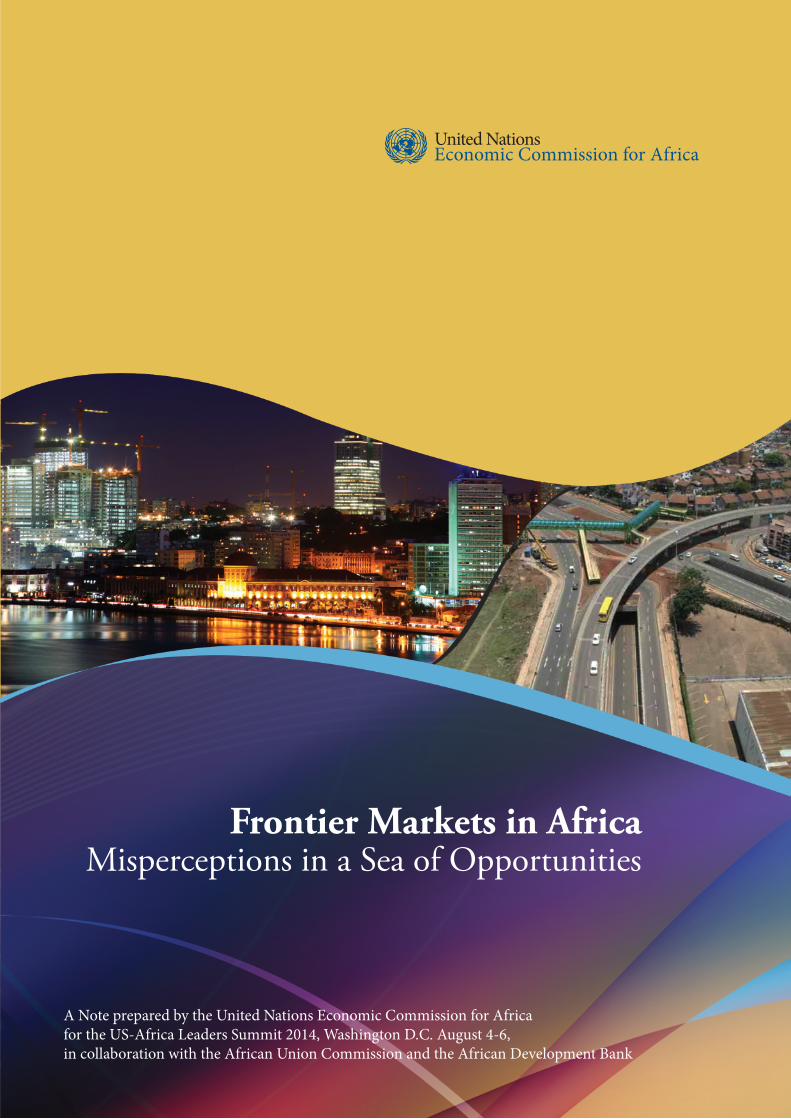
Frontier Markets in Africa Misperceptions in a Sea of Opportunities
A Note prepared by the United Nations Economic Commission for Africa for the US-Africa Leaders Summit 2014, Washington D.C. August 4-6, in collaboration with the African Union Commission and the African Development Bank

Frontier Markets in Africa- Misperceptions in a Sea of Opportunities
The present note identifies the opportunities for investment in Africa, corrects misperceptions about the business environment on the continent and suggests general areas of focus for future partnership between Africa and the United States of America.
18 July 2014
Cover photo (Left): By Miguel Costa/[email protected]
ii Frontier Markets in Africa - Misperceptions in a Sea of Opportunities
AcknowledgementsThe Report was prepared by the United Nations Economic Commission for Africa (ECA) in collaboration with the African Union Commission (AUC) and the African Development Bank (AfDB), following discussions between the three institutions and the Office of the United States Ambassador to the African Union and ECA on African economic dynamics and the US corporate engagement in Africa.
Under the overall guidance of Adam Elhiraika, Director of the Macroeconomic Policy Division, the research and analysis was carried out by an ECA team led by Bartholomew Armah, Chief of the Renewal of Planning Section. The team members included Hopestone Chavula, Aissatou Gueye, Jane Karonga, George Mugabe and Matfobhi Riba.
Research and statistical assistance was provided by Zivanemoyo Chinzara and Molla Hunegnaw.
1Frontier Markets in Africa - Misperceptions in a Sea of Opportunities
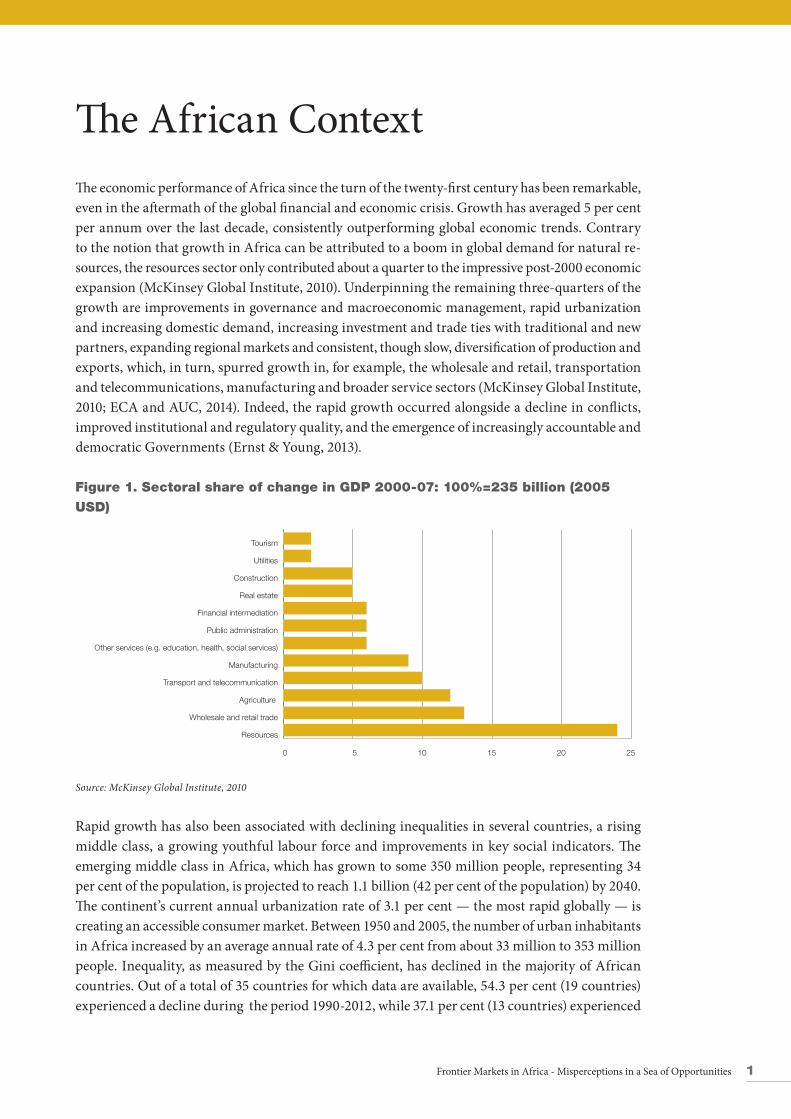
The African ContextThe economic performance of Africa since the turn of the twenty-first century has been remarkable, even in the aftermath of the global financial and economic crisis. Growth has averaged 5 per cent per annum over the last decade, consistently outperforming global economic trends. Contrary to the notion that growth in Africa can be attributed to a boom in global demand for natural re-sources, the resources sector only contributed about a quarter to the impressive post-2000 economic expansion (McKinsey Global Institute, 2010). Underpinning the remaining three-quarters of the growth are improvements in governance and macroeconomic management, rapid urbanization and increasing domestic demand, increasing investment and trade ties with traditional and new partners, expanding regional markets and consistent, though slow, diversification of production and exports, which, in turn, spurred growth in, for example, the wholesale and retail, transportation and telecommunications, manufacturing and broader service sectors (McKinsey Global Institute, 2010; ECA and AUC, 2014). Indeed, the rapid growth occurred alongside a decline in conflicts, improved institutional and regulatory quality, and the emergence of increasingly accountable and democratic Governments (Ernst & Young, 2013).
Figure 1. Sectoral share of change in GDP 2000-07: 100%=235 billion (2005
USD)
0 5 10 15 20 25
Resources
Wholesale and retail trade
Agriculture
Transport and telecommunication
Manufacturing
Other services (e.g. education, health, social services)
Public administration
Financial intermediation
Real estate
Construction
Utilities
Tourism
Source: McKinsey Global Institute, 2010
Rapid growth has also been associated with declining inequalities in several countries, a rising middle class, a growing youthful labour force and improvements in key social indicators. The emerging middle class in Africa, which has grown to some 350 million people, representing 34 per cent of the population, is projected to reach 1.1 billion (42 per cent of the population) by 2040. The continent’s current annual urbanization rate of 3.1 per cent — the most rapid globally — is creating an accessible consumer market. Between 1950 and 2005, the number of urban inhabitants in Africa increased by an average annual rate of 4.3 per cent from about 33 million to 353 million people. Inequality, as measured by the Gini coefficient, has declined in the majority of African countries. Out of a total of 35 countries for which data are available, 54.3 per cent (19 countries) experienced a decline during the period 1990-2012, while 37.1 per cent (13 countries) experienced
2 Frontier Markets in Africa - Misperceptions in a Sea of Opportunities
an increase, compared to corresponding figures of 58 per cent and 32.3 per cent, respectively, in Asia (United Nations, 2013).
Declining inequality, a rising middle class and urban growth have contributed to a vibrant consumer market and created strong demand for modern goods, particularly information and communica-tion technologies (ICTs), clothing and automobiles. In 2013, consumer spending in Africa stood at US$ 680 billion; it is projected to increase to$1 trillion by 2020 and $2.2 trillion by 2030 (Ernst & Young, 2013; Hatch, Becker and M. Zyl, 2011). Collectively, these developments have expanded the fiscal and policy space for Africa to transform its economies and thereby, improve the living standards of its people.
While the responsibility of a successful transformation agenda rests squarely on the shoulders of African leaders, the pace of this process will undoubtedly be quickened through mutually benefi-cial partnerships and cooperation with development partners, particularly with regards to foreign direct investment (FDI) and trade. Despite these achievements, negative perceptions of Africa as a high-risk market have obscured the opportunities that the continent can provide to investors.
Perceptions and Misperceptions about AfricaThe positive recent characterization of Africa as a rising continent is derived in part from the rapid socioeconomic changes and improvements in governance that have transpired. However, more importantly, it reflects the fact that limited information and long-held misperceptions about Africa don’t match reality.
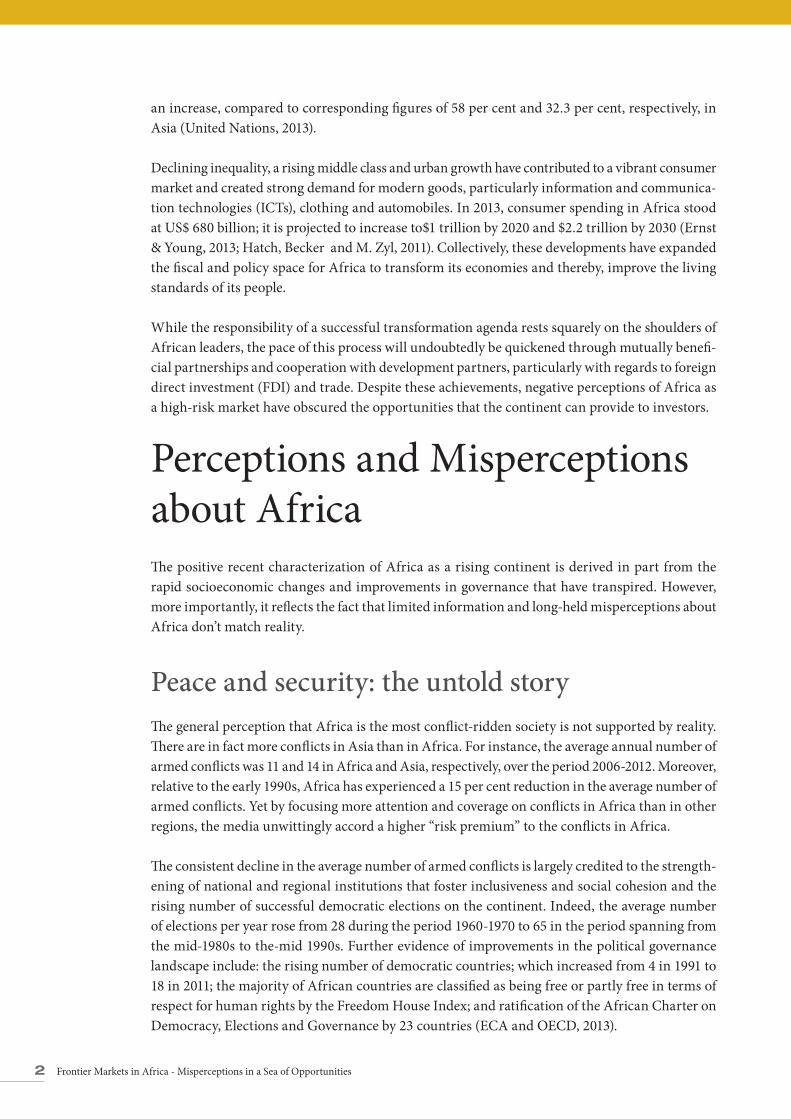
Peace and security: the untold storyThe general perception that Africa is the most conflict-ridden society is not supported by reality. There are in fact more conflicts in Asia than in Africa. For instance, the average annual number of armed conflicts was 11 and 14 in Africa and Asia, respectively, over the period 2006-2012. Moreover, relative to the early 1990s, Africa has experienced a 15 per cent reduction in the average number of armed conflicts. Yet by focusing more attention and coverage on conflicts in Africa than in other regions, the media unwittingly accord a higher “risk premium” to the conflicts in Africa.
The consistent decline in the average number of armed conflicts is largely credited to the strength-ening of national and regional institutions that foster inclusiveness and social cohesion and the rising number of successful democratic elections on the continent. Indeed, the average number of elections per year rose from 28 during the period 1960-1970 to 65 in the period spanning from the mid-1980s to the-mid 1990s. Further evidence of improvements in the political governance landscape include: the rising number of democratic countries; which increased from 4 in 1991 to 18 in 2011; the majority of African countries are classified as being free or partly free in terms of respect for human rights by the Freedom House Index; and ratification of the African Charter on Democracy, Elections and Governance by 23 countries (ECA and OECD, 2013).
3Frontier Markets in Africa - Misperceptions in a Sea of Opportunities
Nevertheless, isolated challenges toward achieving peace and stability still remain in the form of civil wars, armed insurgencies, coup d’état’s, the increasing threat of piracy off the coast of Somalia, terrorism in Kenya, Mali, Nigeria, and Somalia, and social unrest in countries, such as the Democratic Republic of the Congo, the Central Africa Republic, Libya, Mali, Somalia, South Sudan and Sudan. Some of these challenges result from lack of inclusive political and social systems, contested elections, ineffective and weak State-building institutions, as well as from contestations over the control of natural resources. Mindful of the above mentioned challenges, African leaders have identified peace and security as one of the pillars of the development agenda beyond 2015.
Figure 2. Average number of armed conflicts by region
0
5
10
15
20
AmericasMiddle East EuropeAsia Africa
2006-20122001-20051996-20001990-1995
Source: Themnér and Wallensteen (2013).
Illicit flows: the elephant in the chamber of corruption
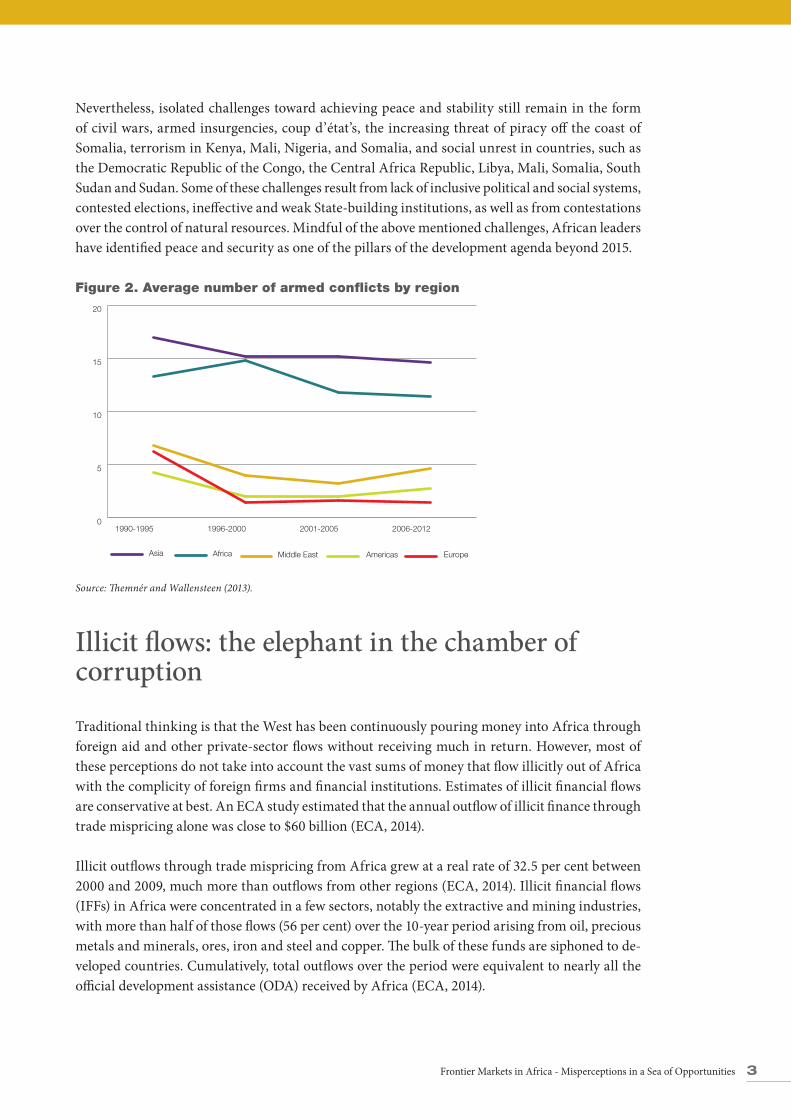
Traditional thinking is that the West has been continuously pouring money into Africa through foreign aid and other private-sector flows without receiving much in return. However, most of these perceptions do not take into account the vast sums of money that flow illicitly out of Africa with the complicity of foreign firms and financial institutions. Estimates of illicit financial flows are conservative at best. An ECA study estimated that the annual outflow of illicit finance through trade mispricing alone was close to $60 billion (ECA, 2014).
Illicit outflows through trade mispricing from Africa grew at a real rate of 32.5 per cent between 2000 and 2009, much more than outflows from other regions (ECA, 2014). Illicit financial flows (IFFs) in Africa were concentrated in a few sectors, notably the extractive and mining industries, with more than half of those flows (56 per cent) over the 10-year period arising from oil, precious metals and minerals, ores, iron and steel and copper. The bulk of these funds are siphoned to de-veloped countries. Cumulatively, total outflows over the period were equivalent to nearly all the official development assistance (ODA) received by Africa (ECA, 2014).
4 Frontier Markets in Africa - Misperceptions in a Sea of Opportunities
Figure 3: Illicit flows in Africa: 1980-2009
Great Lakes3%
Horn of Africa2%
Southern Africa27%
North Africa31%
West Africa37%
Source: Kar and others, 2013
Halting illicit financial flows1 in Africa is paramount, as they fuel conflict and instability by un-dermining the capacity of the State to provide basic social services, eroding citizens’ trust in State institutions and promote short-term rent seeking (Lopes, 2014). In addition, IFFs are a potential source of domestic resource mobilization, which, if properly tapped, will have a positive impact on the continent’s development. Indeed, the need to tackle IFFs has been included in the com-mon African position in setting the goals of the development agenda beyond 2015. It is, therefore, important to recognize that IFFs are a serious African problem that requires a global solution, essentially at the political level.
Significant strides in human development will yield dividends in labour productivity
The performance of Africa in achieving the Millennium Development Goals is often cited as yet another example of the poor social conditions on the continent. However, these conclusions are flawed in the sense that they fail to take into account the initial conditions of most African econo-mies prior to the setting of the Goals and the effort countries have made towards achieving them despite the disadvantaged initial conditions.
1 Global Financial Integrity defines illicit financial flows as: “money illegally earned, transferred or used”. It comprises three components, commercial activities, criminal activities, and bribery and abuse of office.
5Frontier Markets in Africa - Misperceptions in a Sea of Opportunities
Figure 4. Quality of human life in Africa, 1980-2012
0.2
0.3
0.4
0.5
0.6
0.7
0.8
HDI education indexHDI health Index Human development Index (HDI)
201220102005200019901980
Source: Human Development Report, UNDP
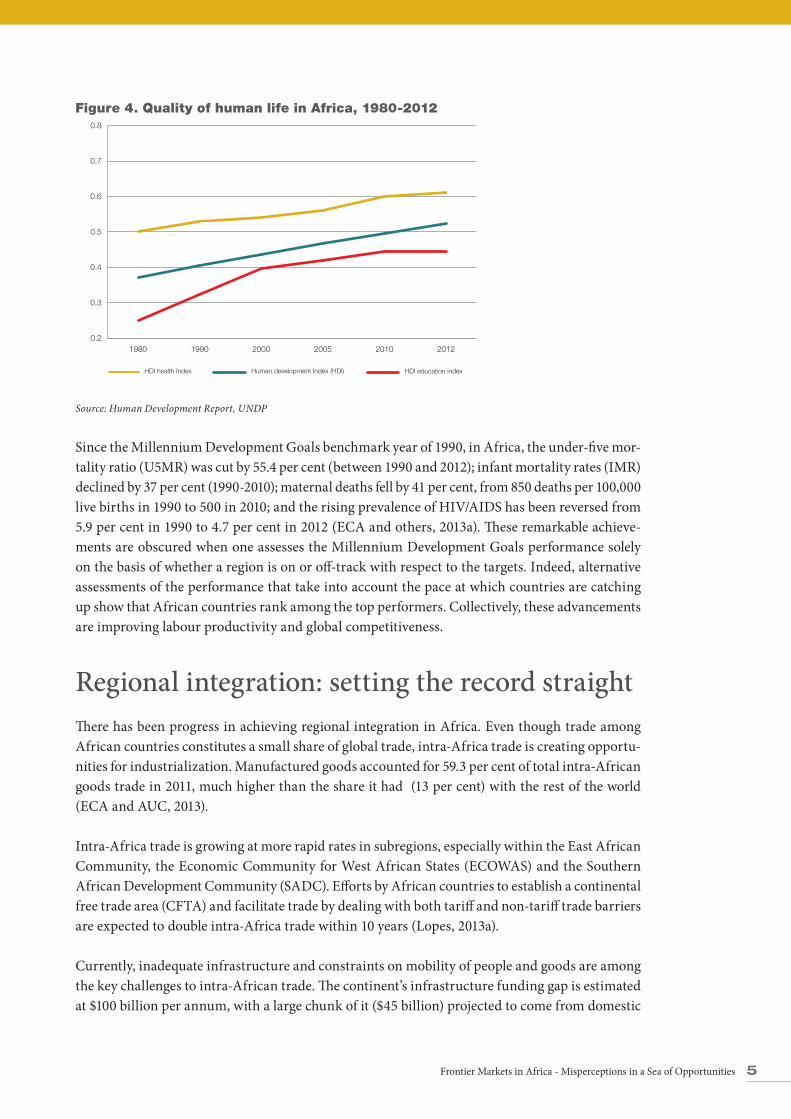
Since the Millennium Development Goals benchmark year of 1990, in Africa, the under-five mor-tality ratio (U5MR) was cut by 55.4 per cent (between 1990 and 2012); infant mortality rates (IMR) declined by 37 per cent (1990-2010); maternal deaths fell by 41 per cent, from 850 deaths per 100,000 live births in 1990 to 500 in 2010; and the rising prevalence of HIV/AIDS has been reversed from 5.9 per cent in 1990 to 4.7 per cent in 2012 (ECA and others, 2013a). These remarkable achieve-ments are obscured when one assesses the Millennium Development Goals performance solely on the basis of whether a region is on or off-track with respect to the targets. Indeed, alternative assessments of the performance that take into account the pace at which countries are catching up show that African countries rank among the top performers. Collectively, these advancements are improving labour productivity and global competitiveness.
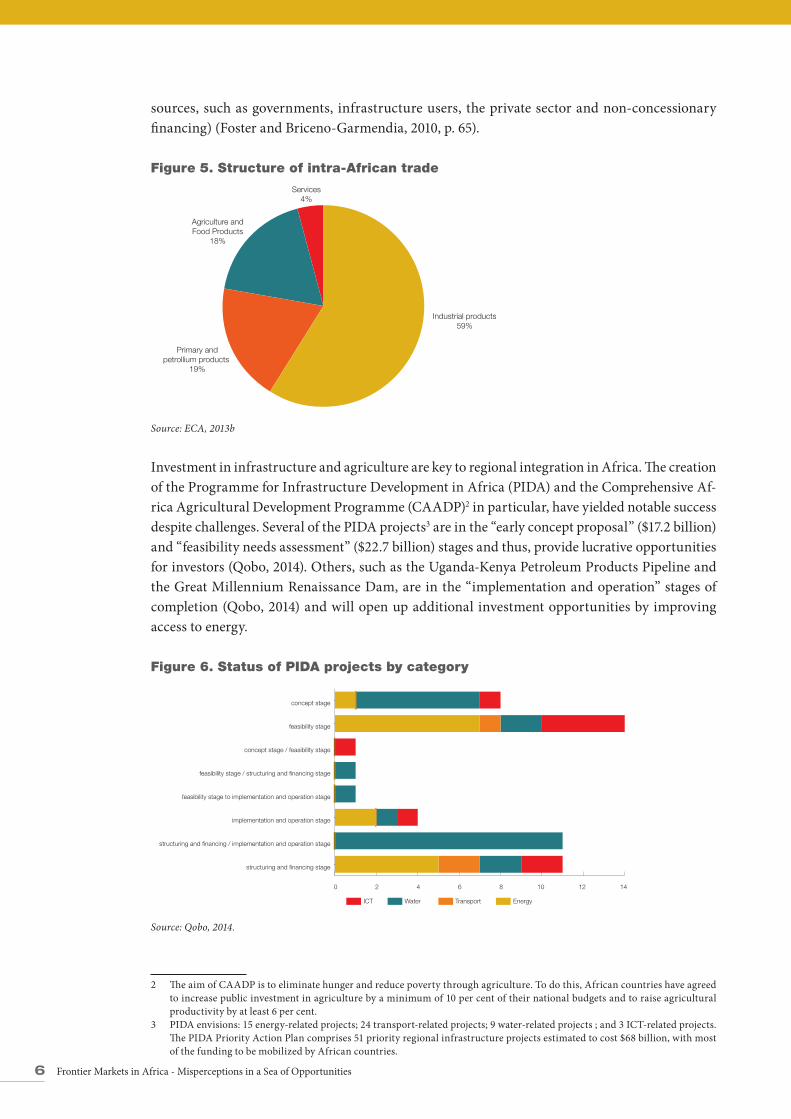
Regional integration: setting the record straightThere has been progress in achieving regional integration in Africa. Even though trade among African countries constitutes a small share of global trade, intra-Africa trade is creating opportu-nities for industrialization. Manufactured goods accounted for 59.3 per cent of total intra-African goods trade in 2011, much higher than the share it had (13 per cent) with the rest of the world (ECA and AUC, 2013).
Intra-Africa trade is growing at more rapid rates in subregions, especially within the East African Community, the Economic Community for West African States (ECOWAS) and the Southern African Development Community (SADC). Efforts by African countries to establish a continental free trade area (CFTA) and facilitate trade by dealing with both tariff and non-tariff trade barriers are expected to double intra-Africa trade within 10 years (Lopes, 2013a).
Currently, inadequate infrastructure and constraints on mobility of people and goods are among the key challenges to intra-African trade. The continent’s infrastructure funding gap is estimated at $100 billion per annum, with a large chunk of it ($45 billion) projected to come from domestic
6 Frontier Markets in Africa - Misperceptions in a Sea of Opportunities
sources, such as governments, infrastructure users, the private sector and non-concessionary financing) (Foster and Briceno-Garmendia, 2010, p. 65).
Figure 5. Structure of intra-African trade
Services4%
Agriculture andFood Products
18%
Primary andpetrollium products
19%
Industrial products59%
Source: ECA, 2013b
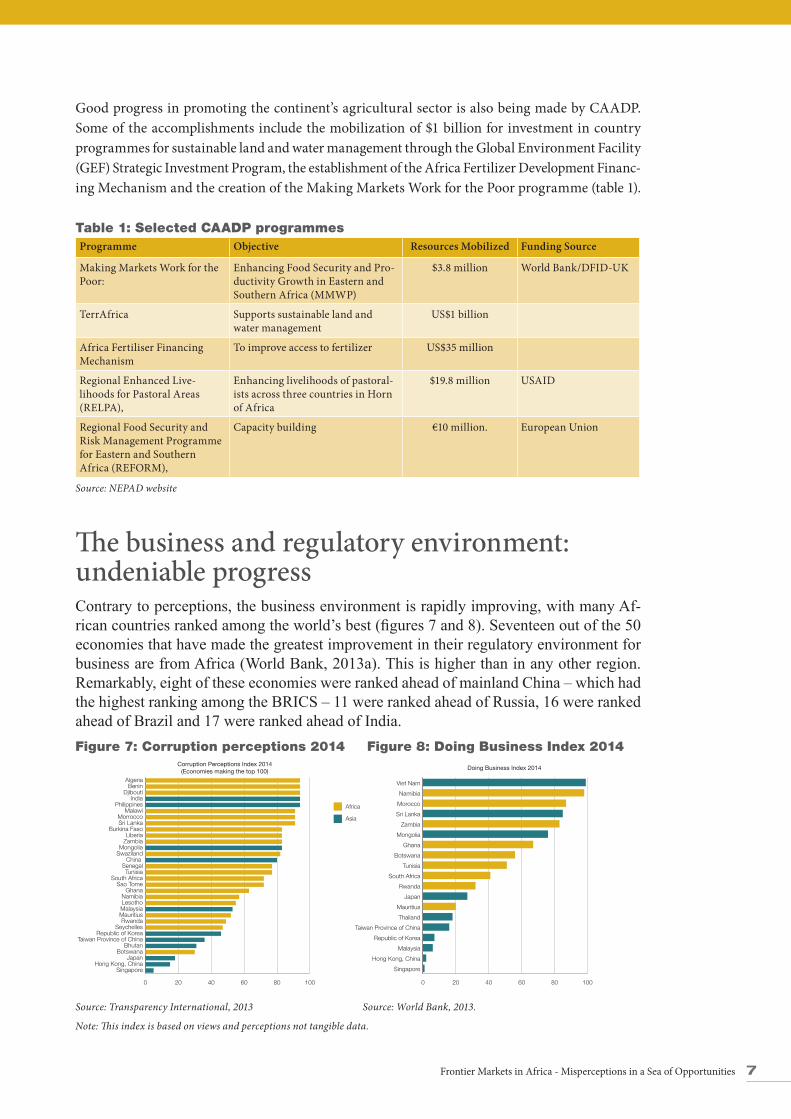
Investment in infrastructure and agriculture are key to regional integration in Africa. The creation of the Programme for Infrastructure Development in Africa (PIDA) and the Comprehensive Af-rica Agricultural Development Programme (CAADP)2 in particular, have yielded notable success despite challenges. Several of the PIDA projects3 are in the “early concept proposal” ($17.2 billion) and “feasibility needs assessment” ($22.7 billion) stages and thus, provide lucrative opportunities for investors (Qobo, 2014). Others, such as the Uganda-Kenya Petroleum Products Pipeline and the Great Millennium Renaissance Dam, are in the “implementation and operation” stages of completion (Qobo, 2014) and will open up additional investment opportunities by improving access to energy.
Figure 6. Status of PIDA projects by category
0 2 4 6 8 10 12 14
ICT Water Transport Energy
structuring and financing stage
structuring and financing / implementation and operation stage
implementation and operation stage
feasibility stage to implementation and operation stage
feasibility stage / structuring and financing stage
concept stage / feasibility stage
feasibility stage
concept stage
Source: Qobo, 2014.
2 The aim of CAADP is to eliminate hunger and reduce poverty through agriculture. To do this, African countries have agreed to increase public investment in agriculture by a minimum of 10 per cent of their national budgets and to raise agricultural productivity by at least 6 per cent.
3 PIDA envisions: 15 energy-related projects; 24 transport-related projects; 9 water-related projects ; and 3 ICT-related projects. The PIDA Priority Action Plan comprises 51 priority regional infrastructure projects estimated to cost $68 billion, with most of the funding to be mobilized by African countries.
7Frontier Markets in Africa - Misperceptions in a Sea of Opportunities
Good progress in promoting the continent’s agricultural sector is also being made by CAADP. Some of the accomplishments include the mobilization of $1 billion for investment in country programmes for sustainable land and water management through the Global Environment Facility (GEF) Strategic Investment Program, the establishment of the Africa Fertilizer Development Financ-ing Mechanism and the creation of the Making Markets Work for the Poor programme (table 1).
Table 1: Selected CAADP programmesProgramme Objective Resources Mobilized Funding Source
Making Markets Work for the Poor:
Enhancing Food Security and Pro-ductivity Growth in Eastern and Southern Africa (MMWP)
$3.8 million World Bank/DFID-UK
TerrAfrica Supports sustainable land and water management
US$1 billion
Africa Fertiliser Financing Mechanism
To improve access to fertilizer US$35 million
Regional Enhanced Live-lihoods for Pastoral Areas (RELPA),
Enhancing livelihoods of pastoral-ists across three countries in Horn of Africa
$19.8 million USAID
Regional Food Security and Risk Management Programme for Eastern and Southern Africa (REFORM),
Capacity building €10 million. European Union
Source: NEPAD website
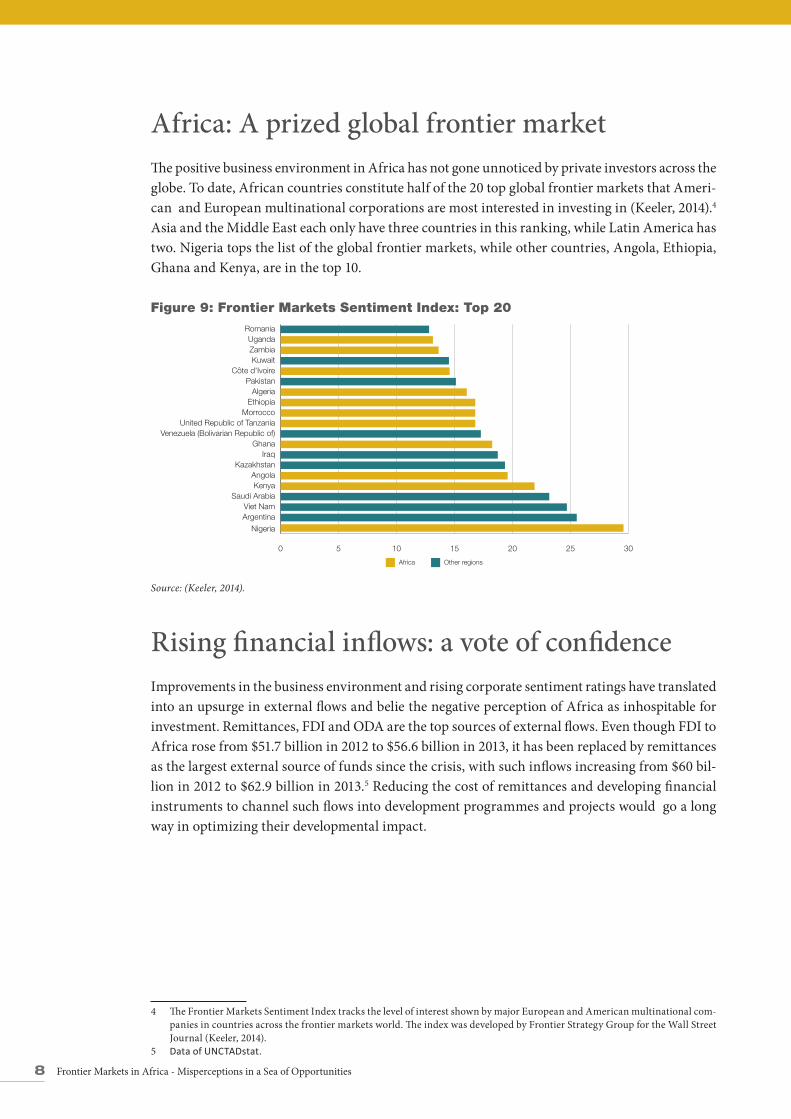
The business and regulatory environment: undeniable progress Contrary to perceptions, the business environment is rapidly improving, with many Af-rican countries ranked among the world’s best (figures 7 and 8). Seventeen out of the 50 economies that have made the greatest improvement in their regulatory environment for business are from Africa (World Bank, 2013a). This is higher than in any other region. Remarkably, eight of these economies were ranked ahead of mainland China – which had the highest ranking among the BRICS – 11 were ranked ahead of Russia, 16 were ranked ahead of Brazil and 17 were ranked ahead of India.Figure 7: Corruption perceptions 2014 Figure 8: Doing Business Index 2014
0 20 40 60 80 100
Singapore
Hong Kong, China
Malaysia
Republic of Korea
Taiwan Province of China
Thailand
Mauritius
Japan
Rwanda
South Africa
Tunisia
Botswana
Ghana
Mongolia
Zambia
Sri Lanka
Morocco
Namibia
Viet Nam
0 20 40 60 80 100
SingaporeHong Kong, China
JapanBotswana
BhutanTaiwan Province of China
Republic of KoreaSeychelles
RwandaMauritiusMalaysiaLesothoNamibia
GhanaSao Tome
South AfricaTunisia
SenegalChina
SwazilandMongolia
ZambiaLiberia
Burkina FasoSri LankaMorrocco
MalawiPhilippines
IndiaDjibouti
BeninAlgeria
Corruption Perceptions Index 2014(Economies making the top 100) Doing Business Index 2014
Africa
Asia
Source: Transparency International, 2013 Source: World Bank, 2013.
Note: This index is based on views and perceptions not tangible data.
8 Frontier Markets in Africa - Misperceptions in a Sea of Opportunities
Africa: A prized global frontier marketThe positive business environment in Africa has not gone unnoticed by private investors across the globe. To date, African countries constitute half of the 20 top global frontier markets that Ameri-can and European multinational corporations are most interested in investing in (Keeler, 2014).4 Asia and the Middle East each only have three countries in this ranking, while Latin America has two. Nigeria tops the list of the global frontier markets, while other countries, Angola, Ethiopia, Ghana and Kenya, are in the top 10.
Figure 9: Frontier Markets Sentiment Index: Top 20
0 5 10 15 20 25 30
Nigeria
ArgentinaViet Nam
Saudi ArabiaKenya
AngolaKazakhstan
IraqGhana
Venezuela (Bolivarian Republic of)United Republic of Tanzania
MorroccoEthiopiaAlgeria
PakistanCôte d'Ivoire
KuwaitZambiaUganda
Romania
Other regionsAfrica
Source: (Keeler, 2014).
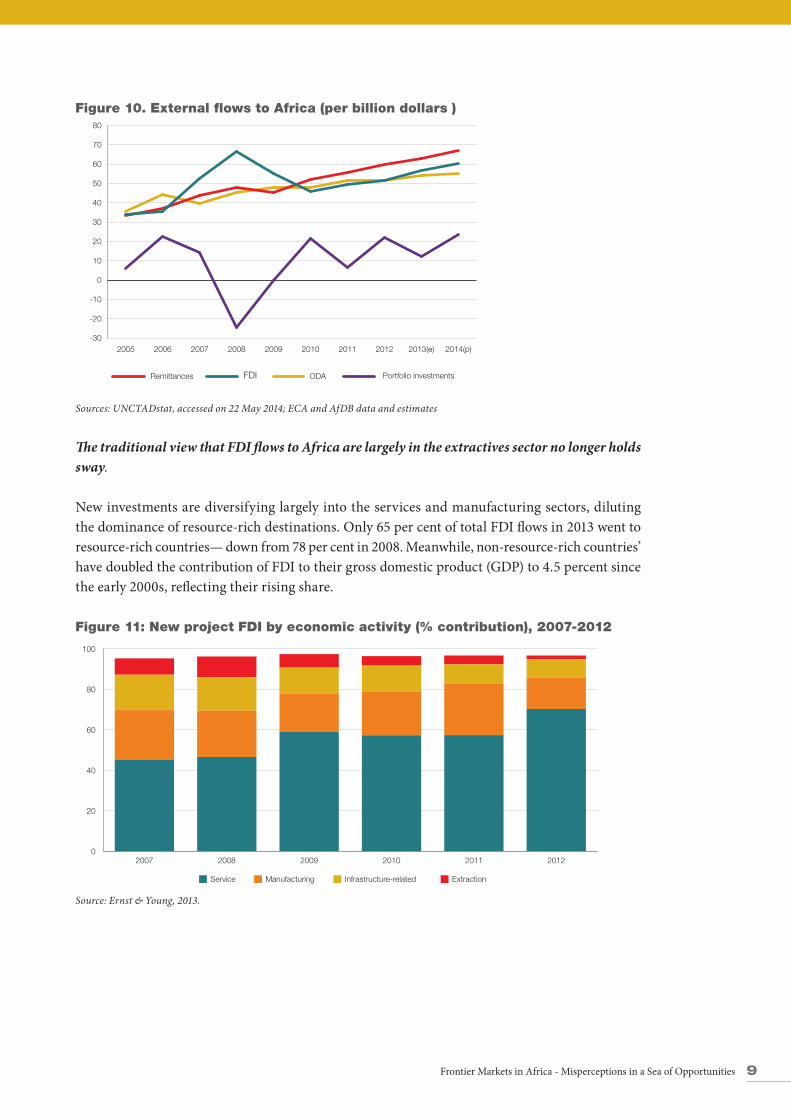
Rising financial inflows: a vote of confidenceImprovements in the business environment and rising corporate sentiment ratings have translated into an upsurge in external flows and belie the negative perception of Africa as inhospitable for investment. Remittances, FDI and ODA are the top sources of external flows. Even though FDI to Africa rose from $51.7 billion in 2012 to $56.6 billion in 2013, it has been replaced by remittances as the largest external source of funds since the crisis, with such inflows increasing from $60 bil-lion in 2012 to $62.9 billion in 2013.5 Reducing the cost of remittances and developing financial instruments to channel such flows into development programmes and projects would go a long way in optimizing their developmental impact.
4 The Frontier Markets Sentiment Index tracks the level of interest shown by major European and American multinational com-panies in countries across the frontier markets world. The index was developed by Frontier Strategy Group for the Wall Street Journal (Keeler, 2014).
5 Data of UNCTADstat.
9Frontier Markets in Africa - Misperceptions in a Sea of Opportunities
Figure 10. External flows to Africa (per billion dollars )
-30
-20
-10
0
10
20
30
40
50
60
70
80
ODA Remittances Portfolio investmentsFDI
2014(p)2013(e)20122011201020092008200720062005
Sources: UNCTADstat, accessed on 22 May 2014; ECA and AfDB data and estimates
The traditional view that FDI flows to Africa are largely in the extractives sector no longer holds sway.
New investments are diversifying largely into the services and manufacturing sectors, diluting the dominance of resource-rich destinations. Only 65 per cent of total FDI flows in 2013 went to resource-rich countries— down from 78 per cent in 2008. Meanwhile, non-resource-rich countries’ have doubled the contribution of FDI to their gross domestic product (GDP) to 4.5 percent since the early 2000s, reflecting their rising share.
Figure 11: New project FDI by economic activity (% contribution), 2007-2012
0
20
40
60
80
100
201220112010200920082007
Service Manufacturing Infrastructure-related Extraction
Source: Ernst & Young, 2013.
10 Frontier Markets in Africa - Misperceptions in a Sea of Opportunities
Who is Investing in Africa?
Emerging countries are challenging the dominance of OECD investors in Africa
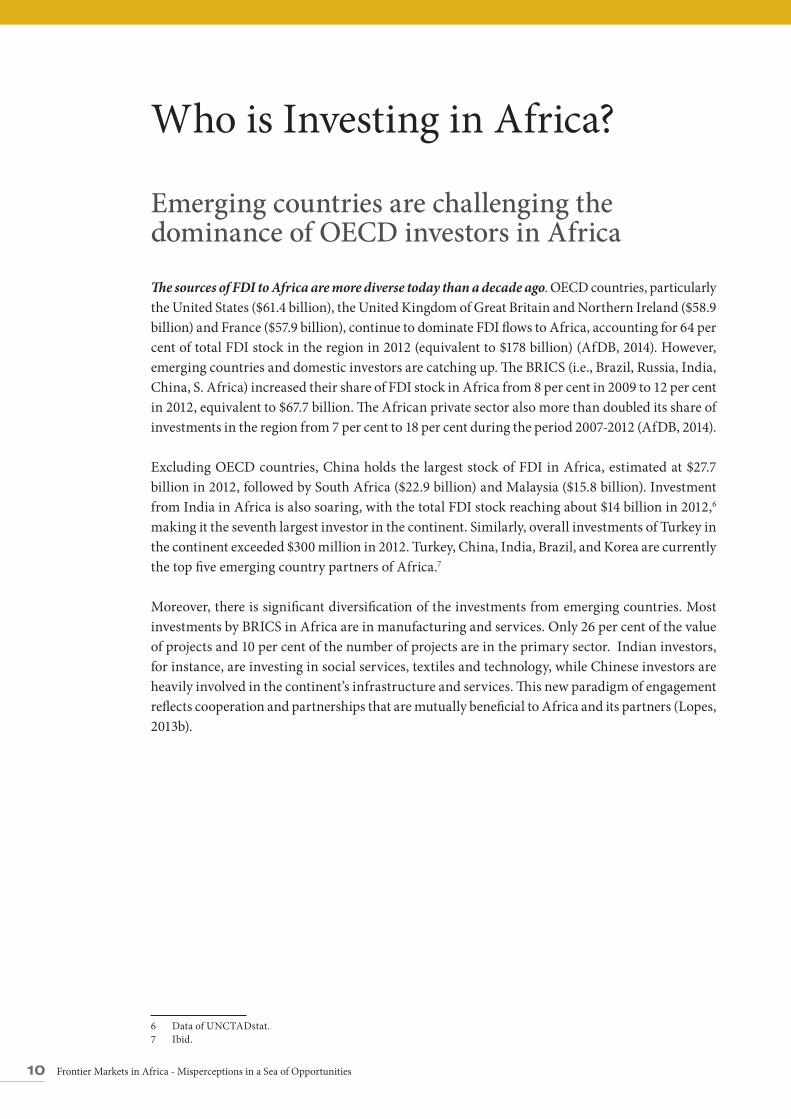
The sources of FDI to Africa are more diverse today than a decade ago. OECD countries, particularly the United States ($61.4 billion), the United Kingdom of Great Britain and Northern Ireland ($58.9 billion) and France ($57.9 billion), continue to dominate FDI flows to Africa, accounting for 64 per cent of total FDI stock in the region in 2012 (equivalent to $178 billion) (AfDB, 2014). However, emerging countries and domestic investors are catching up. The BRICS (i.e., Brazil, Russia, India, China, S. Africa) increased their share of FDI stock in Africa from 8 per cent in 2009 to 12 per cent in 2012, equivalent to $67.7 billion. The African private sector also more than doubled its share of investments in the region from 7 per cent to 18 per cent during the period 2007-2012 (AfDB, 2014).
Excluding OECD countries, China holds the largest stock of FDI in Africa, estimated at $27.7 billion in 2012, followed by South Africa ($22.9 billion) and Malaysia ($15.8 billion). Investment from India in Africa is also soaring, with the total FDI stock reaching about $14 billion in 2012,6 making it the seventh largest investor in the continent. Similarly, overall investments of Turkey in the continent exceeded $300 million in 2012. Turkey, China, India, Brazil, and Korea are currently the top five emerging country partners of Africa.7
Moreover, there is significant diversification of the investments from emerging countries. Most investments by BRICS in Africa are in manufacturing and services. Only 26 per cent of the value of projects and 10 per cent of the number of projects are in the primary sector. Indian investors, for instance, are investing in social services, textiles and technology, while Chinese investors are heavily involved in the continent’s infrastructure and services. This new paradigm of engagement reflects cooperation and partnerships that are mutually beneficial to Africa and its partners (Lopes, 2013b).
6 Data of UNCTADstat.7 Ibid.
11Frontier Markets in Africa - Misperceptions in a Sea of Opportunities
Why should private investment flow to Africa?Active policies to attract investmentThe success of Africa in courting a broad range of investors did not happen by accident. It is a result of deliberate policies and reforms, which were aimed at institutional strengthening and improvements in the business environment.
Institutional reforms
Significant institutional reforms have taken place in the majority of African countries since the turn of the millennium. Consistent improvements of African countries in the global corruption and ease of doing business rankings is testimony that these reforms are yielding dividends. Rapid improvement in the institutional, governance and the general business environment have inspired confidence and renewed interest in Africa as an investment destination. Cross-border African investment is booming, at a 23 per cent annual compound rate, helping to deepen regional inte-gration (Sulaiman, 2013).
Uganda has been one of the main destinations of FDI in Africa in recent years partly due to its predictable investment climate. The economic and political climate of Ghana has also been cited as a key aspect in attracting international investors (AfDB, World Bank and World Economic Forum, 2011).
Sound macroeconomic policies
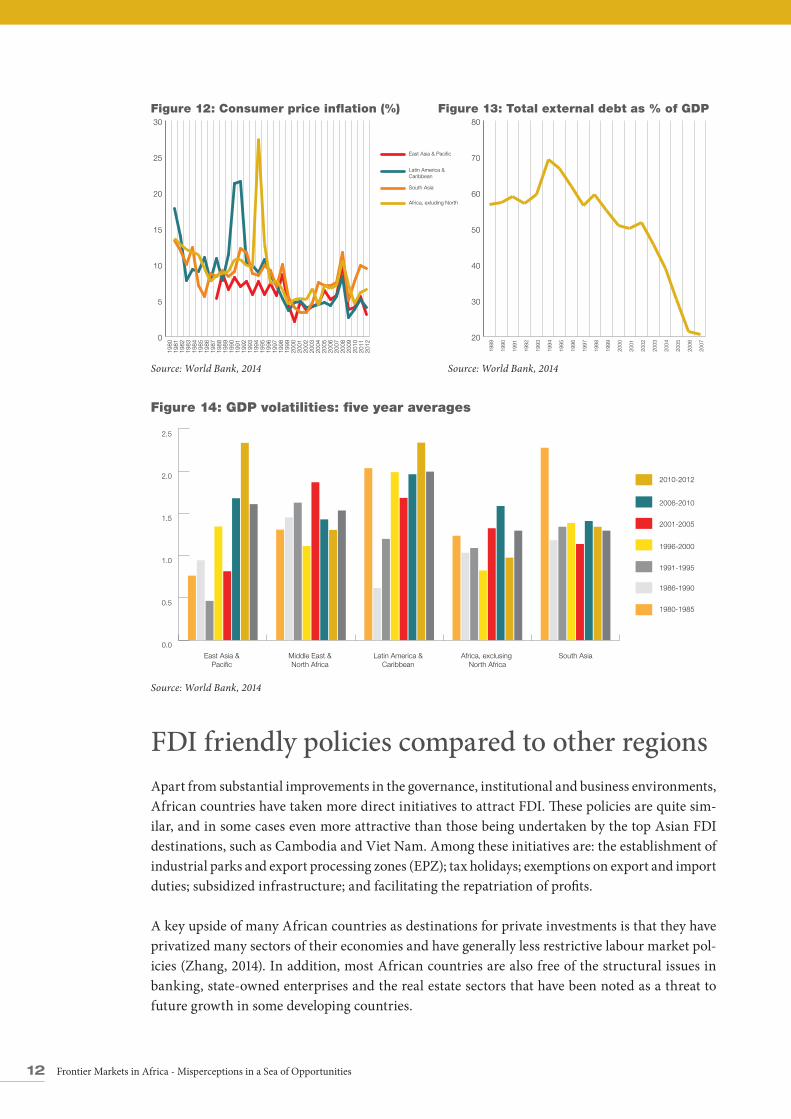
Most African countries have consistently strengthened their macroeconomic policy formulation and implementation capacity. The pursuit of a sound monetary policy since the late 1990s has resulted in low and stable inflation in many African countries. Since 2000, the average annual in-flation rate for the continent has been approximately 6.2 per cent, 0.5 percentage point below that of South Asia (figure 12). African countries have been prudent with regards to monetary policy, with many of them maintaining debt sustainability. This is evident from the sharp decline in external debt as a percentage of GDP since 2000 (figure 13). The decline in foreign debt has minimized the exposure of African economies to foreign currency volatility and other external shocks. Sound macroeconomic policy has led to stable and sustained growth in Africa with low GDP volatility. The reduction in volatility coupled with high returns on investment implies that the risk-return profile of Africa is becoming more lucrative than that of other regions.
12 Frontier Markets in Africa - Misperceptions in a Sea of Opportunities
Figure 12: Consumer price inflation (%) Figure 13: Total external debt as % of GDP
0
5
10
15
20
25
30
East Asia & Pacific
Latin America & Caribbean
South Asia
Africa, exluding North
20
30
40
50
60
70
80
1980
1981
1982
1983
1984
1985
1986
1987
1988
1989
1990
1991
1992
1993
1994
1995
1996
1997
1998
1999
2000
2001
2002
2003
2004
2005
2006
2007
2008
2009
2010
2011
2012
1989
1990
1991
1992
1993
1994
1995
1996
1997
1998
1999
2000
2001
2002
2003
2004
2005
2006
2007
Source: World Bank, 2014 Source: World Bank, 2014
Figure 14: GDP volatilities: five year averages
0.0
0.5
1.0
1.5
2.0
2.5
2010-2012
2006-2010
2001-2005
1996-2000
1991-1995
1986-1990
1980-1985
South AsiaAfrica, exclusing North Africa
Latin America & Caribbean
Middle East & North Africa
East Asia & Paci�c
Source: World Bank, 2014
FDI friendly policies compared to other regionsApart from substantial improvements in the governance, institutional and business environments, African countries have taken more direct initiatives to attract FDI. These policies are quite sim-ilar, and in some cases even more attractive than those being undertaken by the top Asian FDI destinations, such as Cambodia and Viet Nam. Among these initiatives are: the establishment of industrial parks and export processing zones (EPZ); tax holidays; exemptions on export and import duties; subsidized infrastructure; and facilitating the repatriation of profits.
A key upside of many African countries as destinations for private investments is that they have privatized many sectors of their economies and have generally less restrictive labour market pol-icies (Zhang, 2014). In addition, most African countries are also free of the structural issues in banking, state-owned enterprises and the real estate sectors that have been noted as a threat to future growth in some developing countries.
13Frontier Markets in Africa - Misperceptions in a Sea of Opportunities
Other opportunities for private investors Lucrative markets in Africa offer higher rates of return than their Asian competitors Africa offers a lucrative market for investors due to a large and young population, which is estimated to reach 20 per cent of the world’s population in 2050 (BCG, 2014), the rising middle class and the rapid urbanization that is taking place. In 2013, consumer spending in Africa stood at US$ 680 billion; it is projected to increase to $1 trillion by 2020 and $2.2 trillion by 2030 (Ernst & Young, 2013; Hatch, Becker and Zyl, 2011).
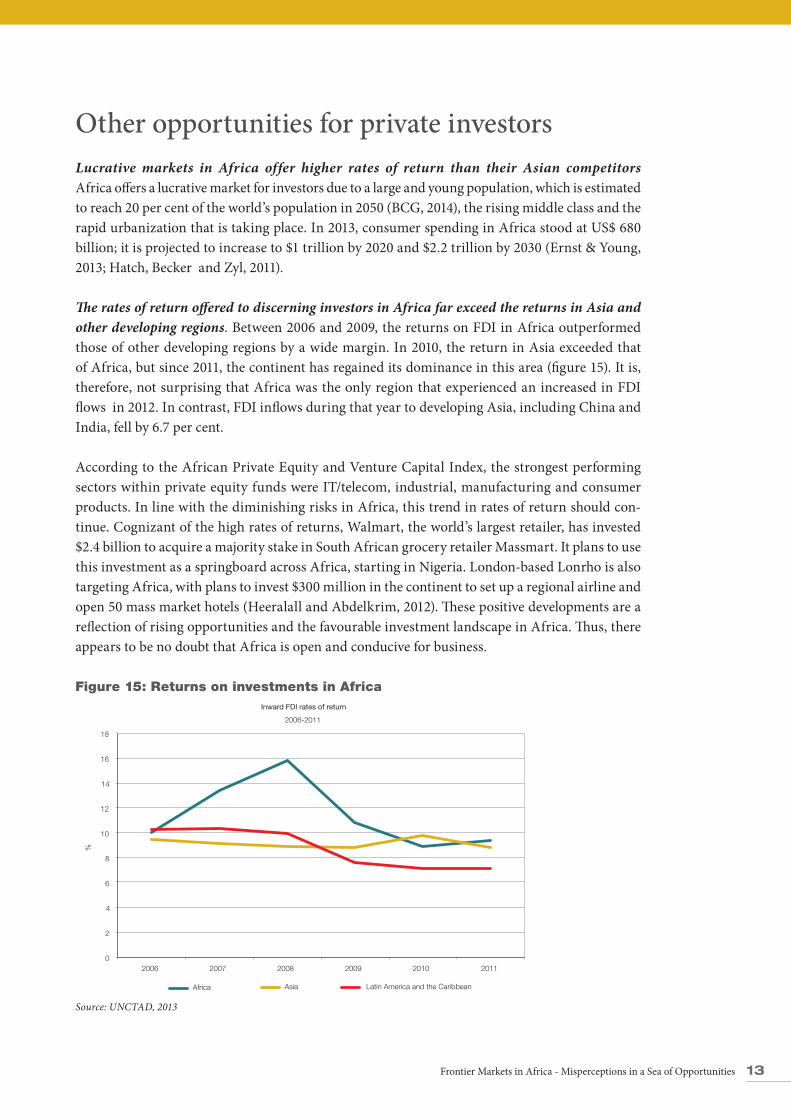
The rates of return offered to discerning investors in Africa far exceed the returns in Asia and other developing regions. Between 2006 and 2009, the returns on FDI in Africa outperformed those of other developing regions by a wide margin. In 2010, the return in Asia exceeded that of Africa, but since 2011, the continent has regained its dominance in this area (figure 15). It is, therefore, not surprising that Africa was the only region that experienced an increased in FDI flows in 2012. In contrast, FDI inflows during that year to developing Asia, including China and India, fell by 6.7 per cent.
According to the African Private Equity and Venture Capital Index, the strongest performing sectors within private equity funds were IT/telecom, industrial, manufacturing and consumer products. In line with the diminishing risks in Africa, this trend in rates of return should con-tinue. Cognizant of the high rates of returns, Walmart, the world’s largest retailer, has invested $2.4 billion to acquire a majority stake in South African grocery retailer Massmart. It plans to use this investment as a springboard across Africa, starting in Nigeria. London-based Lonrho is also targeting Africa, with plans to invest $300 million in the continent to set up a regional airline and open 50 mass market hotels (Heeralall and Abdelkrim, 2012). These positive developments are a reflection of rising opportunities and the favourable investment landscape in Africa. Thus, there appears to be no doubt that Africa is open and conducive for business.
Figure 15: Returns on investments in Africa
0
2
4
6
8
10
12
14
16
18
2006 2007 2008 2009 2010 2011
%
Inward FDI rates of return
2006-2011
Africa Asia Latin America and the Caribbean
Source: UNCTAD, 2013
14 Frontier Markets in Africa - Misperceptions in a Sea of Opportunities
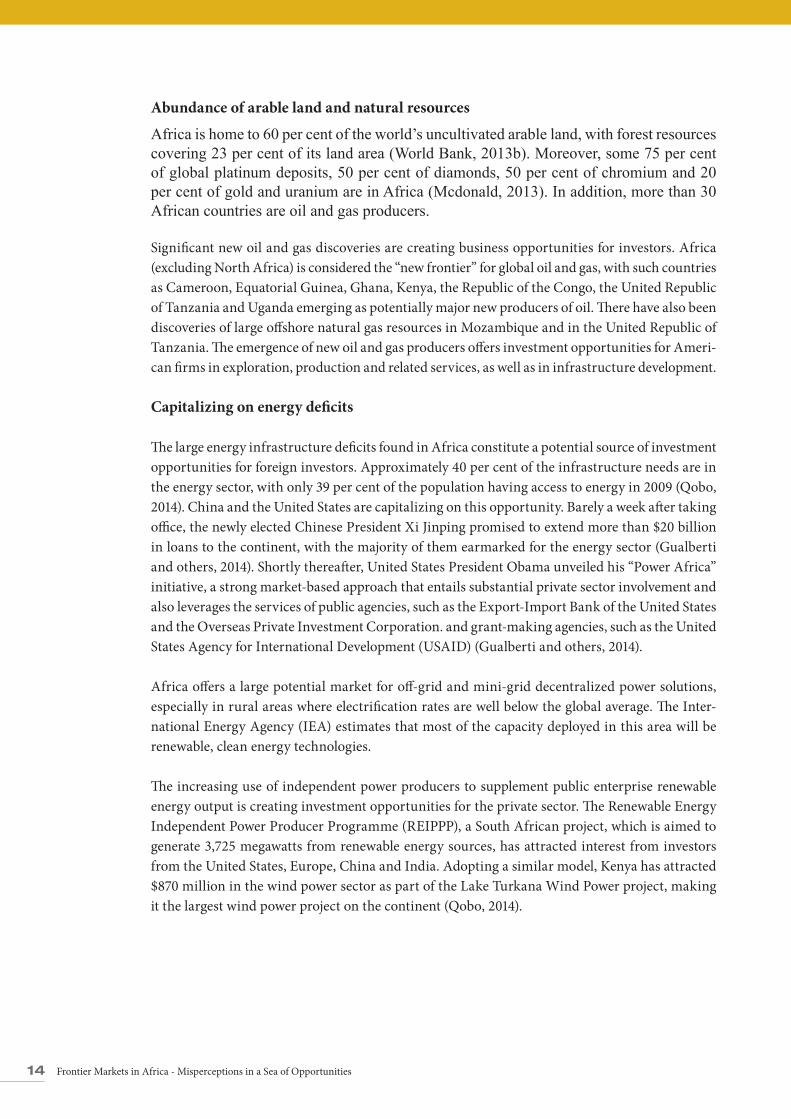
Abundance of arable land and natural resources
Africa is home to 60 per cent of the world’s uncultivated arable land, with forest resources covering 23 per cent of its land area (World Bank, 2013b). Moreover, some 75 per cent of global platinum deposits, 50 per cent of diamonds, 50 per cent of chromium and 20 per cent of gold and uranium are in Africa (Mcdonald, 2013). In addition, more than 30 African countries are oil and gas producers.
Significant new oil and gas discoveries are creating business opportunities for investors. Africa (excluding North Africa) is considered the “new frontier” for global oil and gas, with such countries as Cameroon, Equatorial Guinea, Ghana, Kenya, the Republic of the Congo, the United Republic of Tanzania and Uganda emerging as potentially major new producers of oil. There have also been discoveries of large offshore natural gas resources in Mozambique and in the United Republic of Tanzania. The emergence of new oil and gas producers offers investment opportunities for Ameri-can firms in exploration, production and related services, as well as in infrastructure development.
Capitalizing on energy deficits
The large energy infrastructure deficits found in Africa constitute a potential source of investment opportunities for foreign investors. Approximately 40 per cent of the infrastructure needs are in the energy sector, with only 39 per cent of the population having access to energy in 2009 (Qobo, 2014). China and the United States are capitalizing on this opportunity. Barely a week after taking office, the newly elected Chinese President Xi Jinping promised to extend more than $20 billion in loans to the continent, with the majority of them earmarked for the energy sector (Gualberti and others, 2014). Shortly thereafter, United States President Obama unveiled his “Power Africa” initiative, a strong market-based approach that entails substantial private sector involvement and also leverages the services of public agencies, such as the Export-Import Bank of the United States and the Overseas Private Investment Corporation. and grant-making agencies, such as the United States Agency for International Development (USAID) (Gualberti and others, 2014).
Africa offers a large potential market for off-grid and mini-grid decentralized power solutions, especially in rural areas where electrification rates are well below the global average. The Inter-national Energy Agency (IEA) estimates that most of the capacity deployed in this area will be renewable, clean energy technologies.
The increasing use of independent power producers to supplement public enterprise renewable energy output is creating investment opportunities for the private sector. The Renewable Energy Independent Power Producer Programme (REIPPP), a South African project, which is aimed to generate 3,725 megawatts from renewable energy sources, has attracted interest from investors from the United States, Europe, China and India. Adopting a similar model, Kenya has attracted $870 million in the wind power sector as part of the Lake Turkana Wind Power project, making it the largest wind power project on the continent (Qobo, 2014).
15Frontier Markets in Africa - Misperceptions in a Sea of Opportunities
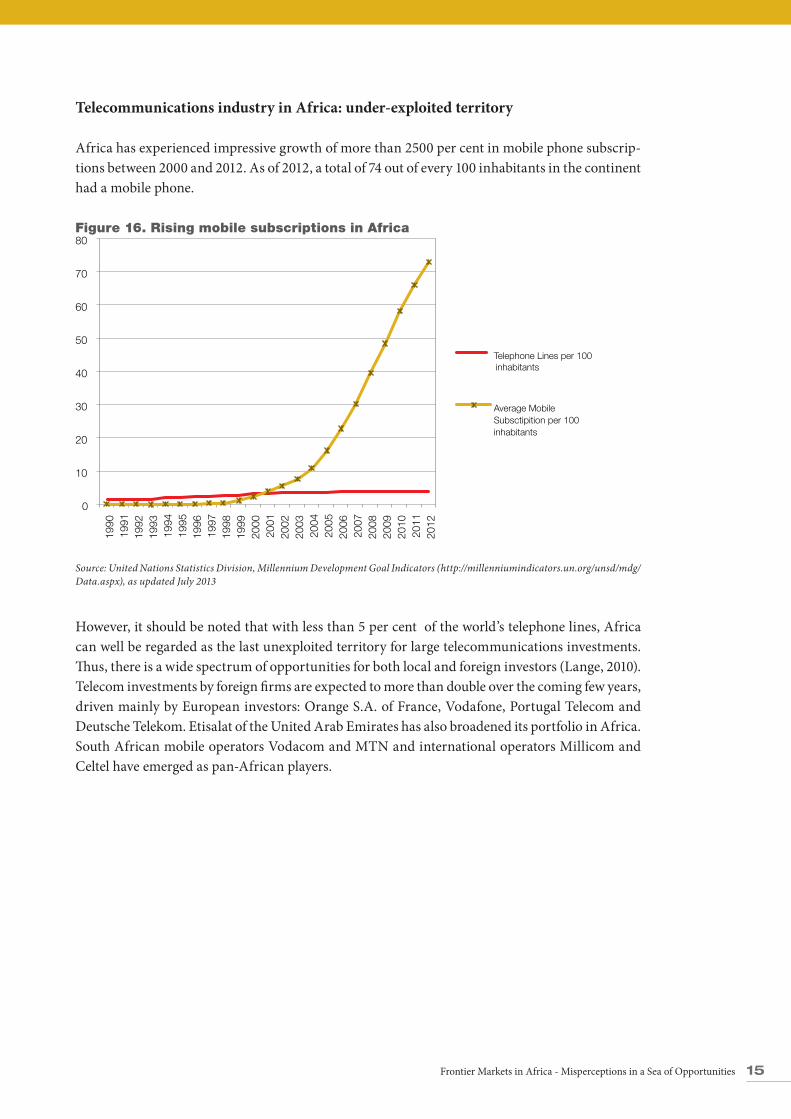
Telecommunications industry in Africa: under-exploited territory
Africa has experienced impressive growth of more than 2500 per cent in mobile phone subscrip-tions between 2000 and 2012. As of 2012, a total of 74 out of every 100 inhabitants in the continent had a mobile phone.
Figure 16. Rising mobile subscriptions in Africa
0
10
20
30
40
50
60
70
80
1990
19
91
1992
19
93
1994
19
95
1996
19
97
1998
19
99
2000
20
01
2002
20
03
2004
20
05
2006
20
07
2008
20
09
2010
20
11
2012
Telephone Lines per 100 inhabitants
Average Mobile Subsctipition per 100 inhabitants
Source: United Nations Statistics Division, Millennium Development Goal Indicators (http://millenniumindicators.un.org/unsd/mdg/Data.aspx), as updated July 2013
However, it should be noted that with less than 5 per cent of the world’s telephone lines, Africa can well be regarded as the last unexploited territory for large telecommunications investments. Thus, there is a wide spectrum of opportunities for both local and foreign investors (Lange, 2010). Telecom investments by foreign firms are expected to more than double over the coming few years, driven mainly by European investors: Orange S.A. of France, Vodafone, Portugal Telecom and Deutsche Telekom. Etisalat of the United Arab Emirates has also broadened its portfolio in Africa. South African mobile operators Vodacom and MTN and international operators Millicom and Celtel have emerged as pan-African players.
16 Frontier Markets in Africa - Misperceptions in a Sea of Opportunities
Leveraging Africa’s relations with the United StatesAfrica Growth and Opportunity Act The Africa Growth and Opportunity Act was designed and implemented by the United States as a unilateral preference programme to do the following: promote trade and investment flows between the United States and Africa; increase the diversification of African exports; and support Africa in its effort to meet the challenges of development in the twenty-first century. These primary ob-jectives remain valid and should constitute the core aim of any trade and economic relationship between the United States and Africa.
The Act has had a measurable impact on African trade with the United States since its entry into force in 2001, with United States imports from AGOA-eligible countries increasing more than sevenfold from about $7.6 billion in 2001 to more than $56 billion in 2008. African exports under AGOA have declined since 2008 to close to $25 billion in 2013. United States exports to Africa, excluding North Africa, also tripled between 2001 and 2011, rising to $22.6 billion in 2012, re-sulting in the creation of an estimated 100,000 jobs in the United States. (United States, 2012). Petroleum products comprise a majority of African exports under AGOA, though there has also been a notable increase in non-oil products, such as apparel, leather products, cut flowers and processed agricultural goods.
From an African perspective, experts estimate that more than 300,000 jobs, many of which were taken by women, have been generated through AGOA, raising the income of African citizens. Kenya and Lesotho are excellent examples of countries that have benefited from AGOA as it has enabled them to access textiles, apparel and horticulture value chains.
Although both Africa and the United States have derived benefits from their economic and trade relationship under AGOA, the potential for the growth of the relationship and further benefits are far from being fully realized. The current levels of the flows of trade and investment between the two sides do not reflect the position of the United States as the world’s largest economy and importer, and a major source of global FDI. Neither do they reflect the rising profile of Africa as the next frontier of global economic growth, a region with among the highest rates of return on investment and where the majority of the world’s ten most rapidly growing economies are located. Africa accounts for only about one per cent of FDI in United States.
Fortunately and in line with the Africa 2063 Agenda, the United States Strategy Toward Sub-Sa-haran Africa, set by President Barack Obama in June 2012, is aimed at building on past initiatives and strengthening future partnerships between the United States and Africa. The strategy seeks to do the following: (a) strengthen democratic institutions; (b) spur economic growth, trade, and investment; (c) advance peace and security; and (c) promote opportunity and development. The strategy demonstrates a conviction of the United States that Africa is a promising region with growing opportunities. Thus, stronger partnerships between the United States and African
17Frontier Markets in Africa - Misperceptions in a Sea of Opportunities
countries that remove trade and investment barriers, overcome productive and infrastructural capacity deficits and add value to African products are imperative for the successful attainment of the strategic objectives of both parties.
The search for a new Africa-United States economic and trade arrangement provides an oppor-tunity for the United States to adopt a new trade and development policy towards Africa, which would take into account the experiences under AGOA, reflect the continent’s growing strategic importance in the world and serve as an effective instrument for the attainment of rapid and sus-tainable economic growth in Africa.
InvestmentInvestments in regional integration across Africa would create market platforms that have suffi-cient economies of scale to be attractive locations for both American and African investors. The establishment of a continental free trade area would offer opportunities to trade infrastructure services, such as through electricity power pools, which, in turn, would ensure security in energy supply. The development of a continental free trade area and the strengthening of the regional power pools are expected to significantly increase the size of the consumer market for large-scale infrastructure investments for both American and African investors (Frost and Sullivan (2011). In this context the United States can invest in the PIDA priority projects that are aimed at facilitating regional integration in Africa.
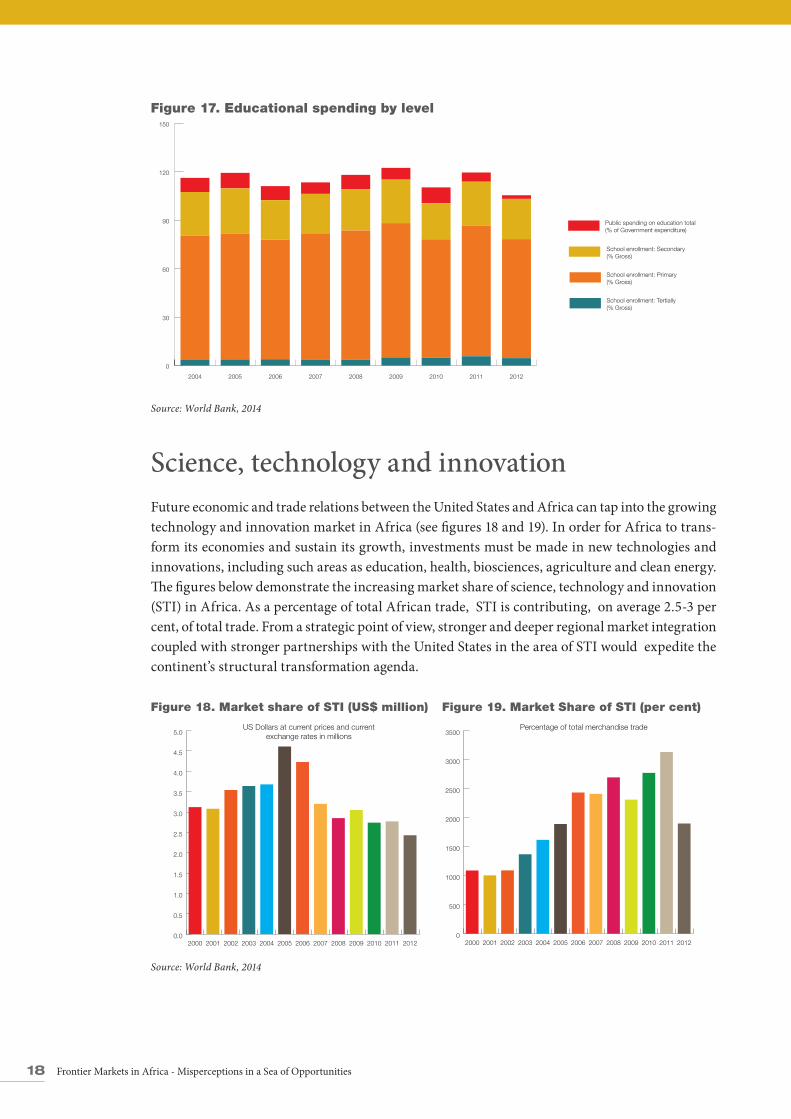
EducationWith 60 per cent of its population classified as young people, Africa is poised to be the world’s largest labour force market as the population of China begins to age (Roland Berger Strategy Con-sultants, 2012). The continent has experienced remarkable improvements in primary enrolment with a notable increase in women enrolling in schools a compared to a decade ago. However, for Africa to be globally competitive, it must continue to strengthen its institutions of higher learning, improve retention rates, particularly at the primary level, and enhance the quality and relevance of its educational system to the labour market. The United States track record in developing high quality tertiary institutions and a highly productive labour force constitute a basis for collabora-tion with Africa.
18 Frontier Markets in Africa - Misperceptions in a Sea of Opportunities
Figure 17. Educational spending by level
0
30
60
90
120
150
Public spending on education total (% of Government expenditure)
School enrollment: Secondary (% Gross)
School enrollment: Primary (% Gross)
School enrollment: Tertially (% Gross)
201220112010200920082007200620052004
Source: World Bank, 2014
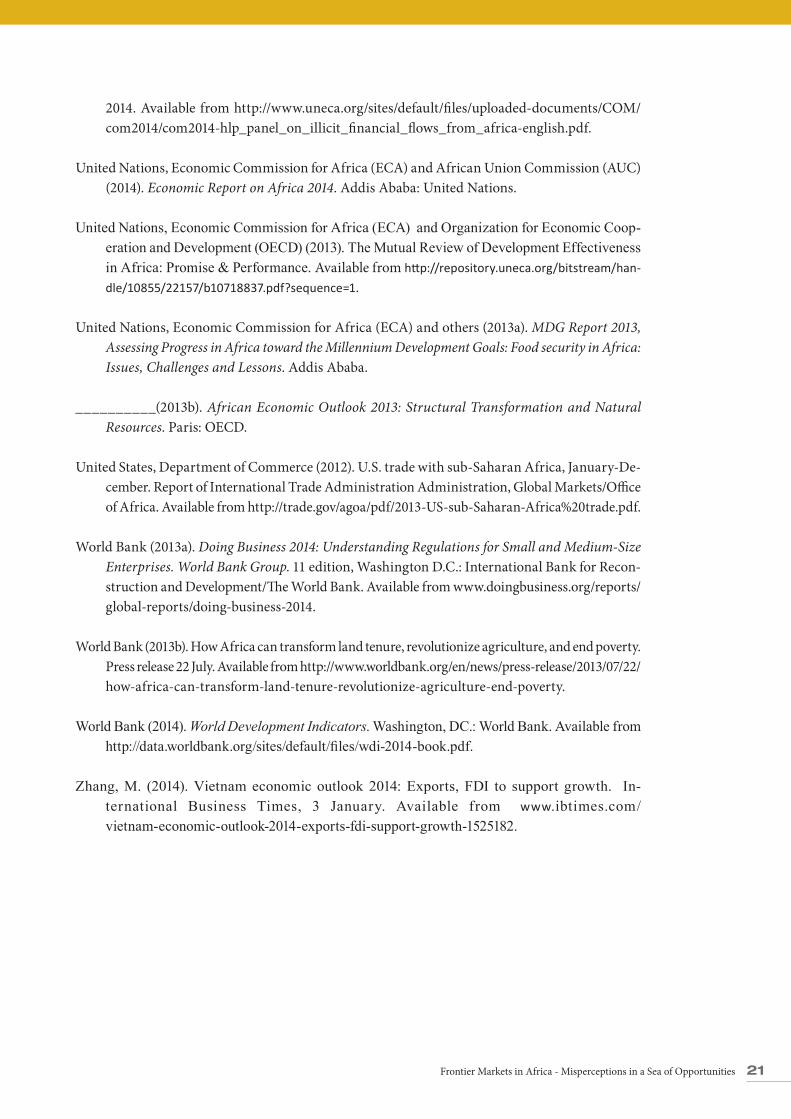
Science, technology and innovation Future economic and trade relations between the United States and Africa can tap into the growing technology and innovation market in Africa (see figures 18 and 19). In order for Africa to trans-form its economies and sustain its growth, investments must be made in new technologies and innovations, including such areas as education, health, biosciences, agriculture and clean energy. The figures below demonstrate the increasing market share of science, technology and innovation (STI) in Africa. As a percentage of total African trade, STI is contributing, on average 2.5-3 per cent, of total trade. From a strategic point of view, stronger and deeper regional market integration coupled with stronger partnerships with the United States in the area of STI would expedite the continent’s structural transformation agenda.
Figure 18. Market share of STI (US$ million) Figure 19. Market Share of STI (per cent)
0
500
1000
1500
2000
2500
3000
3500
20122011201020092008200720062005200420032002200120000.0
0.5
1.0
1.5
2.0
2.5
3.0
3.5
4.0
4.5
5.0
2012201120102009200820072006200520042003200220012000
US Dollars at current prices and current exchange rates in millions
Percentage of total merchandise trade
Source: World Bank, 2014
19Frontier Markets in Africa - Misperceptions in a Sea of Opportunities
ReferencesAfrican Development Bank (AfDB) (2014). Tracking Africa’s Progress in Figures.
African Development Bank (AfDB), World Bank, and World Economic Forum (2011). The Africa Competitiveness Report 2011. Geneva: World Economic Forum. Available from http://www3.weforum.org/docs/WEF_GCR_Africa_Report_2011.pdf.
Boston Consulting Group (BCG) ( 2014). Winning in Africa: From trading posts to ecosystems. BCG Perspectives, 9 January. Available from https://www.bcgperspectives.com/content/articles/globalization_growth_winning_africa_from_trading_posts_ecosystems/.
Ernst & Young (2013). Africa on the move: The question for sustainable growth. EYGM Limited. Available from http://www.ey.com/Publication/vwLUAssets/Africa-on-the-move/$FILE/Skolkovo_Africa_on_the_move_Report.pdf.
Foster, Vivien, and C. Briceno-Garmendia, eds (2010). Africa Infrastructure: A Time for Trans-formation. Washington D.C.: World Bank.
Frost and Sullivan (2011). Africa 2020 and beyond - Are you ready for the future?. 11 August. Available from www.frost.com/prod/servlet/press-release.pag?docid=239973472.
Gualberti, G., M. Bazilian, and T. Moss (2014). Energy investments in Africa by the U.S., Europe and China. International Association for Energy Economics.
Hatch G., P. Becker, and M. Zyl (2011). The dynamic African donsumer market: Exploring growth opportunities in sub-Saharan Africa. Accenture. Available from http://www.accenture.com/SiteCollectionDocuments/Local_South_Africa/PDF/Accenture-The-Dynamic-African-Con-sumer-Market-Exploring-Growth-Opportunities-in-Sub-Saharan-Africa.pdf
Heeralall, N., and R. B. Abdelkrim ( 2012). The world’s fastest-growing middle class. UHY. Available from www.uhy.com/the-worlds-fastest-growing-middle-class/.
Kar, Dev, and others (2013). Illicit financial flows and the problem of net resource transfers from Africa: 1980-2009. Joint report of Global Financial Integrity and the African Development Bank, May. Available from http://www.gfintegrity.org/storage/gfip/documents/reports/Af-ricaNetResources/gfi_afdb_iffs_and_the_problem_of_net_resource_transfers_from_afri-ca_1980-2009-web.pdf.
Keeler, D. (2014). Nigeria, Argentina and Vietnam Prove Top Picks for Multinationals. The Wall Street Journal, 6 June.
Lange, P. (2010). Africa - Foreign investments in telecommunications. Telecoms Market Research. Available from http://www.telecomsmarketresearch.com/resources/Foreign_Investments_in_Africa.shtml.
20 Frontier Markets in Africa - Misperceptions in a Sea of Opportunities
Lopes, C. (2013a), Can trade make a difference in Africa?. ECA, The Executive Secretary’s Blog, 1 July. Available from http://www.tradeforum.org/article/can-trade-make-a-difference-in-Africa/.
Lopes, C. (2013b). How can African countries capitalize on the current geopolitical changes?. ECA, The Executive Secretary’s Blog, 10 October. Available from http://www.uneca.org/es-blog/how-can-african-countries-capitalize-current-geopolitical-changes.
Lopes, C. (2014). Illicit activities impact on peace and security, ECA, Executive Secretary Blog, 24 May. Available from http://allafrica.com/stories/201405271514.html.
Mcdonald, S. (2013). How should America respond to economic opportunities in Af-rica?. The Wilson Center. Available from http://www.wilsoncenter.org/publication/how-should-america-respond-to-economic-opportunities-africa.
McKinsey Global Institute (2010). Lions on the move: The progress and potential of African econ-omies. McKinsey and Company, June. Available from http://www.mckinsey.com/insights/africa/lions_on_the_move.
Organization for Economic Cooperation and Development (OECD) (2013). Development Aid at a Glance – Statistics by Region. Paris: OECD.
Qobo M. (2014). High ambitions and high risks for infrastructure development in Africa. Heinrich Boll Stiftung. Washington DC. April.
Roland Berger Strategy Consultants (2012). Africa — our next opportunity for sustainable growth and development. Global Topics Inside Africa. Available from http://www.rolandberger.com/media/pdf/Roland_Berger_Global_Topics_Inside_Africa_20120315.pdf.
Sulaiman, Tosin (2013). Africa investment-from FDI to AIA: Africans investing in Af-rica. Reuters, 8 August. Available from www.reuters.com/article/2013/08/08/africa-investment-idUSL6N0G92SW20130808.
Themnér, L. and P. Wallensteen ( 2013). Armed Conflict, 1946-2012. Journal of Peace Research, July, vol. 50, No. 4, pp. 509-528. Available from http://jpr.sagepub.com/content/50/4/509.short.
Transparency International. 2013. Corruption Perceptions Index. Available from http://cpi.trans-parency.org/cpi2013.
United Nations Conference on Trade and Development (UNCTAD) (2013) World Investment Report. Global Value Chains: Investment and Trade for Development.(United Nations Publi-cation, Sales no. E.13II.D.5).
United Nations, Economic Commission for Africa (ECA) (2014). Progress report of the High-level Panel on Illicit Financial Flows in Africa. Presented at the Seventh Joint Annual Meetings of the ECA Conference of African Ministers of Finance, Planning and Economic Development and AU Conference of Ministers of Economy and Finance, Abuja, Nigeria, 29 and March
21Frontier Markets in Africa - Misperceptions in a Sea of Opportunities
2014. Available from http://www.uneca.org/sites/default/files/uploaded-documents/COM/com2014/com2014-hlp_panel_on_illicit_financial_flows_from_africa-english.pdf.
United Nations, Economic Commission for Africa (ECA) and African Union Commission (AUC) (2014). Economic Report on Africa 2014. Addis Ababa: United Nations.
United Nations, Economic Commission for Africa (ECA) and Organization for Economic Coop-eration and Development (OECD) (2013). The Mutual Review of Development Effectiveness in Africa: Promise & Performance. Available from http://repository.uneca.org/bitstream/han-
dle/10855/22157/b10718837.pdf?sequence=1.
United Nations, Economic Commission for Africa (ECA) and others (2013a). MDG Report 2013, Assessing Progress in Africa toward the Millennium Development Goals: Food security in Africa: Issues, Challenges and Lessons. Addis Ababa.
__________(2013b). African Economic Outlook 2013: Structural Transformation and Natural Resources. Paris: OECD.
United States, Department of Commerce (2012). U.S. trade with sub-Saharan Africa, January-De-cember. Report of International Trade Administration Administration, Global Markets/Office of Africa. Available from http://trade.gov/agoa/pdf/2013-US-sub-Saharan-Africa%20trade.pdf.
World Bank (2013a). Doing Business 2014: Understanding Regulations for Small and Medium-Size Enterprises. World Bank Group. 11 edition, Washington D.C.: International Bank for Recon-struction and Development/The World Bank. Available from www.doingbusiness.org/reports/global-reports/doing-business-2014.
World Bank (2013b). How Africa can transform land tenure, revolutionize agriculture, and end poverty. Press release 22 July. Available from http://www.worldbank.org/en/news/press-release/2013/07/22/how-africa-can-transform-land-tenure-revolutionize-agriculture-end-poverty.
World Bank (2014). World Development Indicators. Washington, DC.: World Bank. Available from http://data.worldbank.org/sites/default/files/wdi-2014-book.pdf.
Zhang, M. (2014). Vietnam economic outlook 2014: Exports, FDI to support growth. In-ternational Business Times, 3 January. Available from www.ibtimes.com/vietnam-economic-outlook-2014-exports-fdi-support-growth-1525182.


Printed in Addis Ababa, Ethiopia by the ECA Documents Publishing and Distribution Unit. ISO 14001 : 2004 certified.
Misperceptions in a Sea of Opportunities
A Note prepared by the United Nations Economic Commission for Africa for the US-Africa Leaders Summit 2014, Washington D.C. August 4-6, in collaboration with the African Union Commission and the African Development Bank


