
FINAL MAYO CREEK SALT MARSH RESTORATION FEASIBILITY STUDY AND HYDRODYNAMIC
MODELING
Prepared For: Town of Wellfleet Ms. Hillary Greenberg 220 West Main Street Wellfleet, MA 02667 Prepared By: Woods Hole Group, Inc. 81 Technology Park Drive East Falmouth, MA 02536 January 2011

Final
Mayo Creek Salt Marsh Restoration Feasibility Study and Hydrodynamic Modeling
January 2011
Prepared for: Town of Wellfleet
Ms. Hillary Greenberg 220 West Main Street Wellfleet, MA 02667
Prepared by: Woods Hole Group
81 Technology Park Drive East Falmouth MA 02536
(508) 540-8080

Woods Hole Group
Final Mayo Creek Salt Marsh Restoration i January 2011 Feasibility Study and Hydrodynamic Modeling 2009-118
Table of Contents EXECUTIVE SUMMARY .......................................................................................................... 1
1.0 INTRODUCTION .............................................................................................................. 5
2.0 MODEL DEVELOPMENT ............................................................................................... 7
2.1 TECHNICAL APPROACH .........................................................................................................7
2.2 MODEL CONFIGURATION ......................................................................................................9
2.3 MODEL CALIBRATION .........................................................................................................19
2.4 MODEL VALIDATION ..........................................................................................................20
3.0 EXISTING CONDITIONS .............................................................................................. 22
3.1 NORMAL TIDES ...................................................................................................................22
3.2 SEA LEVEL RISE ..................................................................................................................23
3.3 STORM EVENTS ..................................................................................................................25
4.0 ALTERNATIVES ............................................................................................................. 27
4.1 DUCKBILL VALVE REMOVAL ..............................................................................................29
4.1.1 Normal Tides ........................................................................................................ 29
4.1.2 Sea Level Rise ....................................................................................................... 32
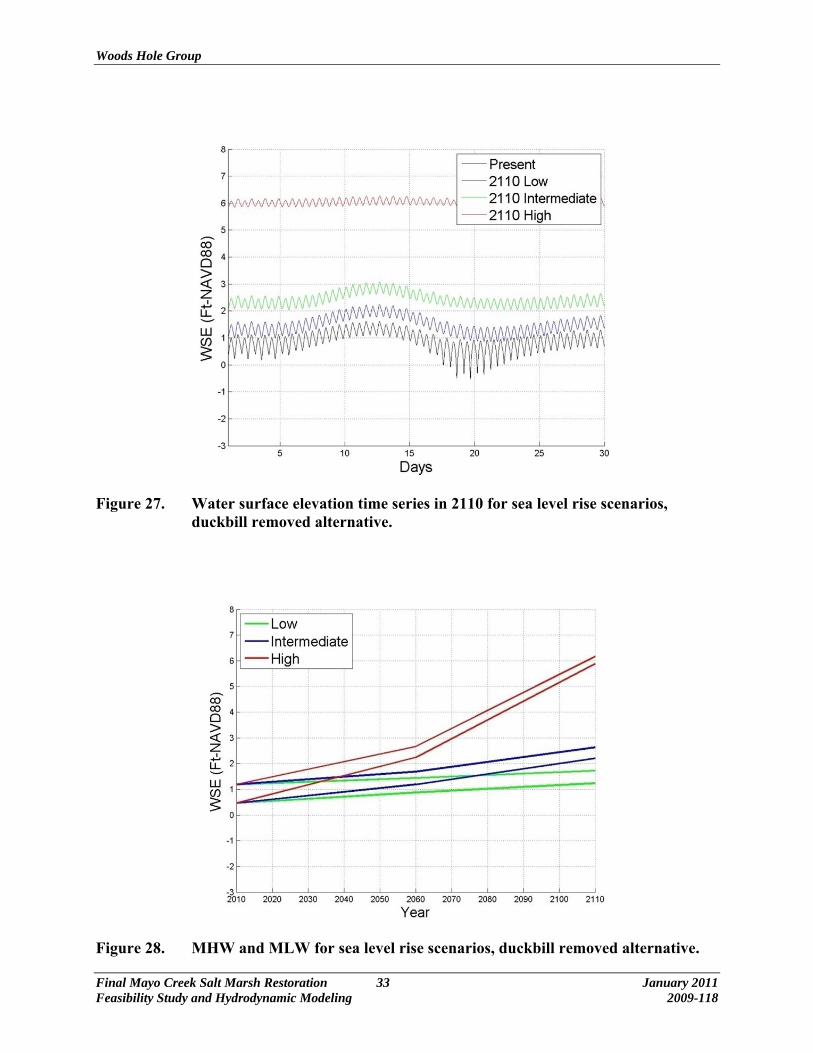
4.1.3 Storm Events ......................................................................................................... 34
4.2 PIPE SIZE ALTERNATIVES ....................................................................................................36
4.2.1 Normal Tides ........................................................................................................ 37
4.2.2 Sea Level Rise ....................................................................................................... 39
4.2.3 Storm Events ......................................................................................................... 42
5.0 CONCLUSIONS AND RECOMMENDATIONS .......................................................... 44
6.0 REFERENCES .................................................................................................................. 46
Woods Hole Group
Final Mayo Creek Salt Marsh Restoration ii January 2011 Feasibility Study and Hydrodynamic Modeling 2009-118
List of Figures Figure 1. Location map of Mayo Creek. The magenta outline shown on the inset of the
map indicates the extent of the modeling domain and encompasses the area that is less than 10 feet in elevation (NAVD, 1988). ..........................................................6
Figure 2. 2010 RTK-GPS survey points for Mayo Creek. ....................................................10 Figure 3. 2006 Photogrammetry survey points for Mayo Creek. ..........................................11 Figure 4. Tide Gauge Deployment Locations. ......................................................................12 Figure 5. In-Situ aqua TROLL 200 and Seabird Electronics SBE37 Microcat prior to
deployment. ............................................................................................................13 Figure 6. Barometric pressure and daily rainfall from the Provincetown Airport (KPVC). .14 Figure 7. Water Surface Elevation time series for Mayo Creek and Wellfleet Harbor. .......14 Figure 8. Salinity time series for Mayo Creek and Wellfleet Harbor. ..................................15 Figure 9. Temperature time series for Mayo Creek and Wellfleet Harbor. ..........................15 Figure 10. Combined RTK-GPS and Photogrammetry elevation contours. ...........................16 Figure 11. Hypsometric curve for Mayo Creek lower basin. ..................................................17 Figure 12. Hypsometric curve for Mayo Creek upper basin. ..................................................17 Figure 13. Harmonic reconstruction of the Wellfleet harbor tide. ..........................................18 Figure 14. Water surface elevation time series for calibration period. ...................................20 Figure 15. Water surface elevation time series for validation period. ....................................21 Figure 16. Water surface elevation time series for existing conditions, normal tides. ...........23 Figure 17. Water surface elevation time series in 2060 for sea level rise scenarios, existing
conditions. ..............................................................................................................24 Figure 18. Water surface elevation time series in 2110 for sea level rise scenarios, existing
conditions. ..............................................................................................................25 Figure 19. MHW and MLW for sea level rise scenarios, existing conditions. .......................25 Figure 20. Water surface elevation in Mayo Creek after significant flooding under existing
conditions. ..............................................................................................................26 Figure 21. Mayo Creek Basin Hypsometric curve with mean tide ranges in Wellfleet Harbor
and Mayo Creek. ....................................................................................................28 Figure 22. Mayo Creek Basin with contours of MHW, MLW, and Spring High tide under
existing conditions (does not consider rainfall). ....................................................28 Figure 23. Water surface elevation time series for no duckbill alternative. ............................30 Figure 24. Existing tide range, remove duckbill alternative tide range, and Mayo Creek Basin
hypsometric curve. .................................................................................................31 Figure 25. Mayo Creek Basin with contours of MHW, MLW, and Spring High tide, remove
duckbill alternative. ................................................................................................31 Figure 26. Water surface elevation time series in 2060 for sea level rise scenarios, duckbill
removed alternative. ...............................................................................................32 Figure 27. Water surface elevation time series in 2110 for sea level rise scenarios, duckbill
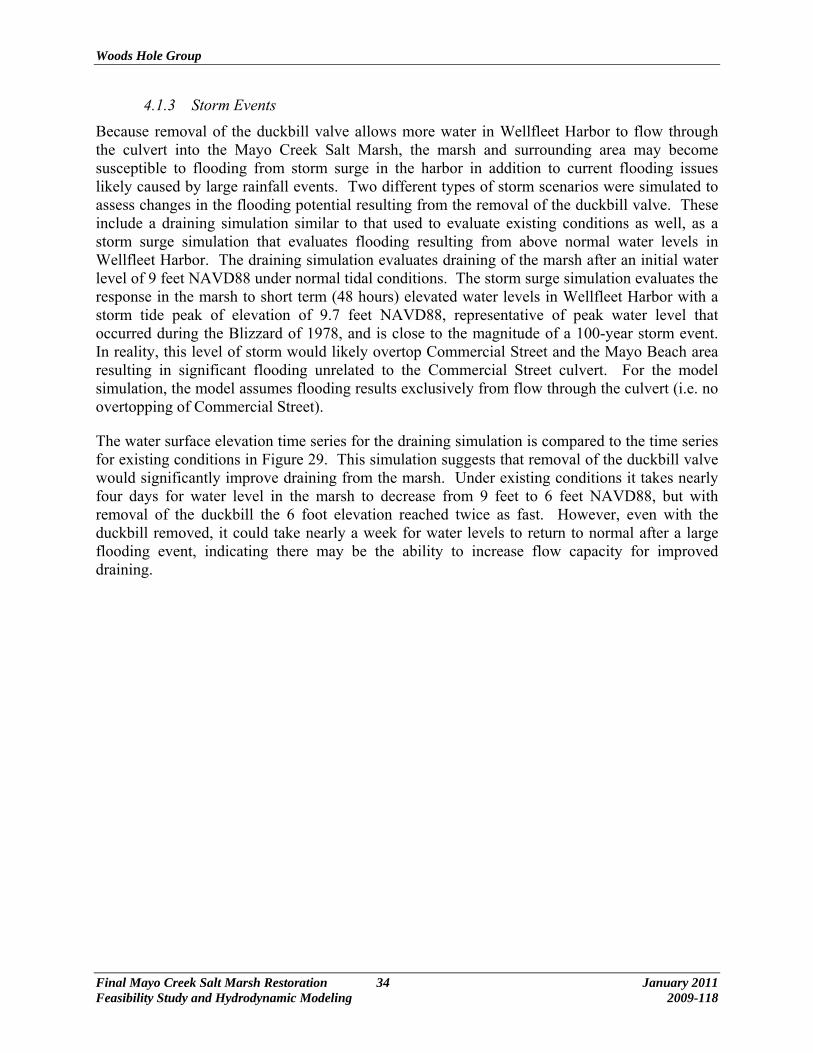
removed alternative. ...............................................................................................33 Figure 28. MHW and MLW for sea level rise scenarios, duckbill removed alternative. ........33 Figure 29. Water surface elevation in Mayo Creek after significant flooding comparing the
duckbill removed alternative and existing conditions. ..........................................35 Figure 30. Water surface elevation in Mayo Creek during storm surge in Wellfleet Harbor,
duckbill removed alternative. .................................................................................36

Woods Hole Group
Final Mayo Creek Salt Marsh Restoration iii January 2011 Feasibility Study and Hydrodynamic Modeling 2009-118
Figure 31. MHW and MLW versus pipe diameter for pipe size alternatives. ........................37 Figure 32. Water surface elevation time series for forty inch pipe alternative. ......................38 Figure 33. Existing tide range, forty inch pipe alternative tide range, and Mayo Creek Basin
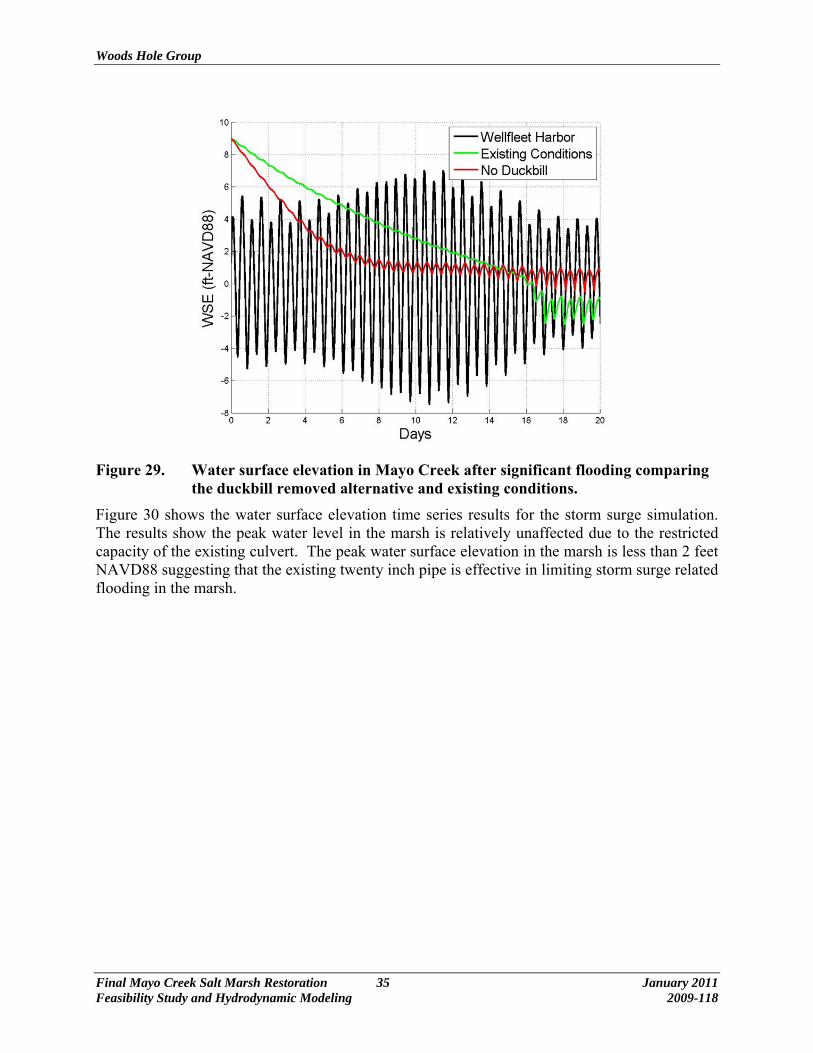
hypsometric curve. .................................................................................................38 Figure 34. Mayo Creek Basin with contours of MHW, MLW, and Spring High tide, forty
inch pipe alternative. ..............................................................................................39 Figure 35. Water surface elevation time series in 2060 for sea level rise scenarios, 40 inch
pipe alternative. ......................................................................................................40 Figure 36. Water surface elevation time series in 2110 for sea level rise scenarios, 40 inch
pipe alternative. ......................................................................................................41 Figure 37. MHW and MLW for sea level rise scenarios, 40 inch pipe alternative. ................41 Figure 38. Water surface elevation in Mayo Creek after significant flooding, comparison of
40 inch pipe alternative and existing conditions. ...................................................42 Figure 39. Water surface elevation in Mayo Creek during storm surge in Wellfleet Harbor,
forty inch pipe alternative. .....................................................................................43
List of Tables Table 1. Parameters required for the Mayo Creek analytical estuarine culvert model. .........9 Table 2. Mayo Creek culvert locations and invert elevations. .............................................11 Table 3. Error statistics for calibration period. ....................................................................20 Table 4. Error statistics for validation period. .....................................................................21 Table 5. Top five tidal constituents in Wellfleet Harbor. ....................................................22 Table 6. Water surface elevation statistics for existing conditions, normal tides (ft-
NAVD88). ..............................................................................................................23 Table 7. Sea level rise scenarios for Mayo Creek, sea level increase from 2010 (feet). .....24 Table 8. Water surface elevation statistics for the remove duckbill alternative, normal tides
(ft-NAVD88)..........................................................................................................30 Table 9. Water surface elevation statistics for the forty inch pipe alternative, normal tides
(ft-NAVD88)..........................................................................................................39 Table 10. Estimated, engineering, permitting, and construction costs associated with the two
restoration options. .................................................................................................45
Woods Hole Group
Final Mayo Creek Salt Marsh Restoration 1 January 2011 Feasibility Study and Hydrodynamic Modeling 2009-118
EXECUTIVE SUMMARY
The Mayo Creek Salt Marsh, which is connected to Wellfleet Harbor by a single 2 foot diameter circular culvert under Commercial Street, is a degraded salt marsh system. The culvert is equipped with a duckbill valve that prevents incoming tide from entering the former tidal creek and limits tidal exchange. The elevation of the culvert combined with the unidirectional influence of the duckbill valve has reduced the tidal range as well as the mean water level in the creek to such a degree that normal tidal inundation of the surrounding marsh area no longer occurs. This report describes the development of dynamic, analytical estuarine culvert model for the Mayo Creek System. It presents the application of the model to evaluate existing conditions, (including storm events and sea level rise scenarios) to identify feasible restoration alternatives and to provide recommendations regarding tidal restoration of the Mayo Creek System. The technical approach utilized by the Mayo Creek culvert model involves a simple procedure for calculating the tidal response in a marsh connected to the ocean by a fully or partially full culvert. For Mayo Creek, the flow control structure is either a DuckBill Valve (DBV) representing existing conditions, the existing culvert with the DBV removed or a circular pipe culvert (alternative conditions).
The required data to develop the model include topographic data to define the model geometry and tidal data to provide model boundary conditions and calibration ability. The Mayo Creek analytical culvert model requires a prescribed relationship between the inundated surface area of the marsh and water surface elevation. This relationship can be determined from the detailed topographic data and described by a hypsometric curve. A week long time period between April 2nd and April 9th 2010 was selected as the calibration period. Good agreement between the observed data and model results was observed, with errors less than a tenth of an inch. The model was also validated over a month between March 20th, 2010 and April 20th, 2010. The validation period includes a number of rainfall events as well allowing an assessment of model’s ability to simulate the water level response in the marsh to rainfall. During the validation period the model was also able to predict water surface elevation within a fraction of an inch.
The validated model was applied to simulate a number of hypothetical situations to aid in understanding the behavior of the Mayo Creek system in its existing state. Results of the existing conditions simulations are also useful since they provide a baseline for comparison to simulations that examine the restoration potential and possible impacts of different restoration alternatives.
Existing Conditions, Normal Tides - Relatively small water surface elevation fluctuations occur in the creek as a result of periodic interruption of the discharge flow as the duckbill valve is closed by high tides in Wellfleet Harbor. Existing tidal fluctuations in the marsh are also caused by leaking around the culvert through the Commercial Street embankment. Actual observed high water levels in the existing system corresponding to rainfall events are significantly higher than the modeled maximum water surface elevation resulting from tidal forcing only.
Existing Conditions, Sea Level Rise - The USACE guidance for predicted rates of sea level rise (high, intermediate, and low) in the design of civil works projects was used to
Woods Hole Group
Final Mayo Creek Salt Marsh Restoration 2 January 2011 Feasibility Study and Hydrodynamic Modeling 2009-118
determine projected sea level rise rates. This method derives locally specific estimates for sea level rise that span a broader range of scenarios than the IPCC estimates alone. In general, the results show that we can expect future sea level rise to cause in increase in the mean water level in Mayo Creek accompanied by a reduction in the tidal range if the existing culvert configuration remains unchanged.
Existing Conditions, Storm Events - Under existing conditions, the DBV installed on the Commercial Street culvert effectively limits flooding in Mayo Creek basin caused by high tides and storm surge events. As such, storm surge events are not evaluated for existing conditions since the DBV eliminates extreme water surface elevation increases in the Mayo Creek System. Current flooding in the Mayo Creek Marsh would more likely result from a large rainfall event or a storm surge large enough to overtop Commercial Street and/or Kendrick Avenue. Under these conditions, the model shows that it would take approximately 17 days for the water levels in the marsh to return to normal if the marsh were flooded to an elevation of 9 feet NAVD88 (approximately overtopping Commercial Street). Even if the marsh were flooded only to an elevation of approximately 3 feet NAVD88, it would take about a week to return to normal. Results of this simulation suggest that the duckbill severely restricts draining from the marsh, particularly when a large area of the marsh is flooded. As such, although the duckbill offers flood protection from coastal storm events, the combined DBV and culvert also inhibit draining that may result in unwarranted flooding as well.
The restoration goals for the Mayo Creek Salt Marsh include increasing both the tidal range and the area of the inter-tidal zone in the marsh, limiting high water levels to prevent flooding of nearby infrastructure, and increasing the ability of the marsh to drain after storm events. These goals are somewhat interrelated as increasing the tidal range must also consider potential upland flooding impacts. A number of alternative conditions for tidal restoration of the marsh were considered that involve modification of the existing Commercial Street culvert and duckbill valve. Modeled scenarios for the restoration alternatives include evaluation of normal tides, sea level rise, and storm events (i.e. both rainfall and storm surge). The first restoration alternative considers removal of the duckbill valve from the existing pipe culvert at Commercial Street. Next, a series of simulations consider the effect of replacing the culvert with a larger diameter pipe, using normal tides. The pipe diameter alternative simulations are utilized to select a pipe size that limits Spring High tide to an elevation less than 3.0 ft-NAVD88.
Duckbill Valve Removal, Normal Tides – This alternative simulation suggests that removal of the duckbill valve would cause an overall increase in the mean water level in the marsh of approximately two feet. This is accompanied with reduction in the mean tidal range (i.e. difference between MHW and MLW) due to the larger surface area wetted (as shown in the hypsometry), but a slight increase the overall range in water level between monthly minimum and maximum water level. The increased overall water level raises the mean water surface elevation above the creek banks allowing significantly more tidal inundation of the marsh surface. This also produces a significant increase in the area of the inter-tidal zone. Existing conditions has a minimal intertidal area, while the removal of the duckbill produces 20 acres of intertidal area.
Woods Hole Group
Final Mayo Creek Salt Marsh Restoration 3 January 2011 Feasibility Study and Hydrodynamic Modeling 2009-118
Duckbill Valve Removal, Sea Level Rise – As with the present sea level, the future mean tide level would be greater with the duckbill valve removed than with it in place. However, with the duckbill removed the tidal range is not muted as significantly as it is for existing conditions. With the duckbill removed, the Spring High tide remains under approximately 3 ft NAVD88 for the next 50 years even under the high sea level rise scenario. Projecting 100 years into the future only the high sea level rise projection exceeds approximately 3 ft NAVD88 in the marsh. However, under the projected high sea level rise scenario in 100 years water would flow over Commercial Street. As such, the culvert (existing or proposed) is irrelevant for the high sea level rise rate.
Duckbill Valve Removal, Storm Events – With the duckbill valve removed, drainage is significantly improved in the Mayo Creek system. Under existing conditions it takes nearly four days for water level in the marsh to decrease from 9 feet to 6 feet NAVD88, but with removal of the duckbill the drainage is twice as fast. However, even with the duckbill removed, it could take nearly a week for water levels to return to normal after a large flooding event, indicating there may be the ability to increase flow capacity for improved draining. During a large storm surge event (short of overtopping Commercial Street), the peak water surface elevation in the marsh is less than 2 feet NAVD88, suggesting that the existing twenty inch pipe is effective in limiting storm surge related flooding in the marsh even without the duckbill valve. It is also important to note that during large storm events, Commercial Street and Kendrick Avenue would likely be overtopped by waves and storm surge causing significant flooding unrelated to the culvert.
A series of simulation were also conducted under normal tidal conditions to evaluate the effect increasing the size of the Commercial Street culvert on water levels in the Mayo Creek Marsh. These simulations assume invert elevations would be unchanged from existing conditions and that the roadway embankment would be rebuilt to eliminate leaking. This suite of simulations shows that increasing the pipe diameter in general causes an increase in tidal range in Mayo Creek. When compared to existing conditions, all simulations show an increase in the mean sea level as well. Based on these results an inner pipe diameter of forty inches was chosen for additional simulations to evaluate sea level rise and storm scenarios. The forty inch diameter pipe was chosen since spring high water is limited to less than 3 feet NAVD88 and does not produce any upland flooding during all normal tidal conditions. The 3 feet NAVD88 elevation is also below all surveyed upland infrastructure elevations as provided by the Town of Wellfleet. Low-lying infrastructure lies between 3.5 to 5.0 feet NAVD88.
New pipe simulations, Normal Tides – When compared to existing conditions, replacement of the culvert with a forty inch diameter pipe would result an increase in MHW of about 3.3 feet, and an increase of about 1.2 feet in MTL. The mean inter-tidal area would be increased to nearly 38 acres.
New pipe simulation, Sea Level Rise – In general, the response to sea level rise in the marsh is similar to that for existing conditions and for the duckbill removed alternative. There is an increase in mean water level accompanied by a decrease in tidal range in the marsh as sea level increases. For the 40 inch pipe replacement alternative, the projected sea level rise results in potential upland flooding over a shorter time horizon than the
Woods Hole Group
Final Mayo Creek Salt Marsh Restoration 4 January 2011 Feasibility Study and Hydrodynamic Modeling 2009-118
duckbill removal alternative for the intermediate and high rates. Again, the projected high sea level rise scenario in 100 years would result in water flowing over Commercial Street. As such, the culvert (existing or proposed) is irrelevant for the high sea level rise rate.
New pipe simulations, Storm Events – Drainage ability improves significantly with a larger pipe. With a forty inch pipe water levels return to normal in three tidal cycles (about 36 hours). This is a significant improvement over existing condition and the duckbill removal alternative. Some upland flooding can be expected during larger storm events; however, this flooding also may occur naturally due to overtopping of Commercial Street and Kendrick Avenue, as for other cases.
Based on this analysis Woods Hole Group believes that removal of the duckbill valve from the existing culvert would provide some restoration benefit for the Mayo Creek Salt Marsh by increasing the area of inter-tidal zone in the marsh. Removal of the duckbill valve would also provide the benefit of increased drainage and reduction of flooding potential from storm water runoff. Improved drainage ability, especially during storm events and under expected sea level rise, is an important aspect of the potential restoration.
Woods Hole Group also understands that leaking around the existing culvert has caused potential degradation of the Commercial Street embankment and the need for repairs to the embankment and roadway. Therefore, if the Town of Wellfleet chooses to replace the culvert and repair and Commercial Street roadway and embankment, the Town may want to consider replacing the culvert with a larger diameter pipe.
Woods Hole Group
Final Mayo Creek Salt Marsh Restoration 5 January 2011 Feasibility Study and Hydrodynamic Modeling 2009-118
1.0 INTRODUCTION
The Town of Wellfleet, Massachusetts is conducting a study to assess the feasibility of restoring tidal flow to the degraded Mayo Creek Salt Marsh (Figure 1). Presently, Mayo Creek (the creek) is connected to Wellfleet Harbor by a single 2 foot diameter circular culvert under Commercial Street. The culvert is equipped with a duckbill valve that prevents incoming tide from entering the former tidal creek; while still allowing freshwater discharge (e.g. precipitation) to exit the marsh when the tide is low in Wellfleet Harbor. Relatively small water surface elevation fluctuations occur in the creek as a result of periodic interruption of the discharge flow as the duckbill valve is closed by high tides in Wellfleet Harbor. Existing tidal fluctuations in the marsh are also caused by leaking around the culvert through the Commercial Street embankment. The elevation of the culvert combined with the unidirectional influence of the duckbill valve has reduced the tidal range as well as the mean water level in the creek to such a degree that normal tidal inundation of the surrounding marsh area no longer occurs. However, inundation of the marsh surface does occasionally occur as a result of increased freshwater input. Infrastructure currently is situated within the former marsh plain limiting the extent that tidal flow may be restored to the marsh. The Town of Wellfleet has contracted Woods Hole Group to develop and apply a hydrodynamic model of Mayo Creek to gain a better understanding of the hydraulics of the Mayo Creek Marsh System in its existing state, as well as provide guidance in determining potential alternatives for tidal restoration of the Mayo Creek Salt Marsh.
This report describes the development of dynamic, analytical estuarine culvert model for the Mayo Creek System. It presents the application of the model to evaluate existing conditions, (including storm events and sea level rise scenarios) to identify feasible restoration alternatives and to provide recommendations regarding tidal restoration of the Mayo Creek System. The report is divided into the following sections:
Section 1.0 – Introduction Section 2.0 – Model Development Section 3.0 – Existing Conditions Model Section 4.0 – Alternatives Assessment Section 5.0 – Conclusions and Recommendations
Section 2.0 describes the technical approach and data used to develop, calibrate, and validate the Mayo Creek culvert model. Section 3.0 presents the results of simulations of the existing system under various forcing conditions including: normal tidal conditions, projected sea level rise, and storm events. Section 4.0 presents results of simulations designed to identify restoration alternatives for modification or replacement of the Commercial Street Culvert and compares results to existing conditions. Section 5.0 summarizes the results of the modeling effort and provides guidance and recommendations for restoring of the Mayo Creek Salt Marsh by replacement of the Commercial Street culvert.

Woods Hole Group
Final Mayo Creek Salt Marsh Restoration 6 January 2011 Feasibility Study and Hydrodynamic Modeling 2009-118
Figure 1. Location map of Mayo Creek. The magenta outline shown on the inset of the map indicates the extent of the modeling domain and encompasses the area that is less than 10 feet in elevation (NAVD, 1988).
Mayo Creek
Woods Hole Group
Final Mayo Creek Salt Marsh Restoration 7 January 2011 Feasibility Study and Hydrodynamic Modeling 2009-118
2.0 MODEL DEVELOPMENT
Preliminary modeling for the Mayo Creek Salt Marsh restoration feasibility study confirmed the potential to restore the Mayo Creek Salt Marsh, and the need to assess potential impacts of restoration alternatives (WHG, 2010a). This section describes the technical approach, model configuration, calibration, and validation for the Mayo Creek analytical estuarine culvert model used to assess the system.
2.1 TECHNICAL APPROACH
The technical approach utilized by the Mayo Creek culvert model involves a simple procedure for calculating the tidal response in a marsh connected to the ocean by a fully or partially full culvert. The assumptions are that the sea level in the marsh is independent of position, and that the flow through the culvert is described by a standard head-loss relationship, which depends on the type flow control structure and depth of flow. For Mayo Creek, the flow control structure is either a DuckBill Valve (DBV) representing existing conditions, the existing culvert with the DBV removed or a circular pipe culvert (alternative conditions). The head-loss vs. discharge relationship is assumed to be linear for the DBV or quadratic for a circular pipe.
Given the assumption of a horizontal sea surface within the marsh, the conservation-of-mass equation for the water in the marsh is
leakraingwculvertmarsh
marsh QQQQdt
dhhA )(
(1)
(2)
where t is time; )(thmarsh is the elevation of the water level in the marsh (NAVD 88 feet); A is
the surface area of the marsh, which is prescribed as a function of marshh through the measured
hypsometric relationship; )(ta is the cross-sectional area of flow in the culvert; and )(tu is the average flow velocity in the culvert. Velocity is defined as positive when flowing from the marsh toward the ocean (i.e. downstream). Qgw and Qrain are volumetric flow rates into the marsh resulting from groundwater input and rainfall, respectively. Direct observation of flow through the Commercial Street embankment during low tide as well as observation of salt water intrusion into the marsh during high tides during the Mayo Creek Tide Study indicate the need to include a the Qleak term in equation (1) to account for water leaking through the embankment (WHG, 2010a). The leak volume is assumed to depend on the head difference across the embankment and follow Darcy’s law for flow through a porous medium.
(3)
Where kleak is the permeability of the medium, aleak is the cross sectional area of the medium; μ is the viscosity of the fluid, L is the length of the medium, and hmarsh and hocean are pressure head in the marsh and ocean, respectively.
Woods Hole Group
Final Mayo Creek Salt Marsh Restoration 8 January 2011 Feasibility Study and Hydrodynamic Modeling 2009-118
For circular pipe culverts, it is straightforward to calculate the relevant geometric parameters required to determine the velocity (cross-sectional area ,a the wetted perimeter P, and hydraulic
diameter Padh /4 ).
The quadratic head-loss relationship for the flow through a circular pipe culvert(s) is:
g
uu
d
fLKKhh
hexitentranceoceanmarsh 2
, (4)
where g is the acceleration due to gravity, entranceK and exitK are the dimensionless head-loss
coefficients for the entrance and exit to the culvert, respectively, L is the length of the culvert,
hd is the hydraulic diameter, and f is the empirical Darcy-Weisbach friction factor.
The solution of (14) for the velocity u is
oceanmarsh
oceanmarsh
hexitentrance
oceanmarsh
hh
hh
d
fLKK
hhgu
2/1
2 . (5)
The friction factor, f varies depending roughness and flow velocity in the pipe and is calculated the iteratively using the implicit Colebrook-White equation:
f
d
fh
Re
51.2
7.3log2
110
(6)
Where ε is the roughness height in the pipe, and Re is the Reynolds number calculated from the flow velocity, pipe length and kinematic viscosity, υ.
uL
Re (7)
Standard values for the parameters ε, Kentrance, Kexit, g, and υ are given in Table 1. These values were applied in calibration, validation, and simulation of all existing and alternative cases.

Woods Hole Group
Final Mayo Creek Salt Marsh Restoration 9 January 2011 Feasibility Study and Hydrodynamic Modeling 2009-118
Table 1. Parameters required for the Mayo Creek analytical estuarine culvert model.
Parameter Value
Roughness Length for Concrete Pipe, ε 0.001 ft
Entrance Loss Coefficient, Kentrance 0.5
Exit Loss Coefficient, Kexit 1.0
Acceleration due to Gravity, g 32.2 ft2/sec.
Kinematic Viscosity of water, υ 0.000023 lb-s/ft2
Length of Culvert, L 75 ft
Under existing conditions however, the DBV installed on Commercial Street culvert blocks the flooding tide and serves as the primary restriction for the ebbing tide. In this case, the flow area through the culvert is not simply a function of depth in the pipe, but depends on the pressure distribution at the lip of the DBV. As the head difference across the DBV increases, the DBV opens and flow area increases as well. This results in a nearly linear head-discharge relationship for the DBV (Lee et al., 2001). The discharge is approximated by
hmarsh>hocean (8)
0 hmarsh<hocean (9)
Where the coefficient KDB is a discharge coefficient that depends on the physical properties of the DBV. When the DBV is not completely submerged the flow area may be less than the opening area, and the above relationship does not apply. In this case, the discharge through the DBV is calculated with equation (8) but is reduced by scaling with the ratio of actual flow area to total pipe area at the upstream end of the culvert.
The above equations are solved in time by means of standard first-order finite difference approach. Results of the computations include the water level time series in the marsh, time-dependant water surface area in the Marsh, and discharge volume through the culvert.
2.2 MODEL CONFIGURATION
This section presents site specific data from Mayo Creek and describes how these data are used to configure the to the Mayo Creek analytical culvert model. The required data include topographic data to define the model geometry and tidal data to provide model boundary conditions. Site specific tidal data and supplemental topographic data for Mayo Creek were collected as part of the Mayo Creek Tide Study conducted by Woods Hole Group for Commonwealth of Massachusetts Department of Ecological Restoration (MA-DER) in March and April 2010 (WHG, 2010b). Site specific topography (via aerial photogrammetry) was collected in 2006 and provided by Massachusetts Coastal Zone Management (MACZM).

Woods Hole Group
Final Mayo Creek Salt Marsh Restoration 10 January 2011 Feasibility Study and Hydrodynamic Modeling 2009-118
Topographic Data
Woods Hole Group conducted a supplemental topographic survey to provide additional topographic data required to define the Mayo Creek culvert model geometry. The topographic survey data collected as part of the Mayo Creek Tide Study (WHG, 2010b) are complementary to the existing photogrammetric data collected in 2006 and provided by Massachusetts Coastal Zone Management (MACZM). Woods Hole Group conducted the survey using a Real-Time Kinematic Global Positioning System (RTK-GPS), which allowed for accurate measurement of creek bottom elevations, culvert inverts, and tide gauge elevations. Figures 2 and 3 show the locations of the 2010 RTK-GPS survey points and the 2006 photogrammetry survey points, respectively. Table 2 provides a list of the culvert locations and invert elevations from the 2010 RTK-GPS survey.
Figure 2. 2010 RTK-GPS survey points for Mayo Creek.

Woods Hole Group
Final Mayo Creek Salt Marsh Restoration 11 January 2011 Feasibility Study and Hydrodynamic Modeling 2009-118
Figure 3. 2006 Photogrammetry survey points for Mayo Creek.
Table 2. Mayo Creek culvert locations and invert elevations.
Feature Northing MA State Plane Coordinates
(ft)
Easting MA State Plane Coordinates
(ft)
Elevation NAVD88
(ft) Commercial Street Culvert,
Downstream invert (duck bill)
2803202.779 1056251.444 -4.73
Commercial Street Culvert, Upstream invert
(inner pipe ) 2803224.623 1056167.248 -3.59
Chequessett Neck Road Culvert, Downstream invert
2805346.298 1054345.709 -2.34
Chequessett Neck Road Culvert, Upstream invert
2805423.910 1054317.898 -1.17
Tide Data
Woods Hole Group deployed two instruments to measure conductivity, temperature, and pressure for the Mayo Creek Tidal Study. A SeaBird Electronics SBE37 Mircocat gauge was deployed in Wellfleet Harbor to record conditions just outside Mayo Creek (Wellfleet Harbor). During the same time period, an In-Situ Aqua TROLL 200 gauge was deployed within Mayo
Woods Hole Group
Final Mayo Creek Salt Marsh Restoration 12 January 2011 Feasibility Study and Hydrodynamic Modeling 2009-118
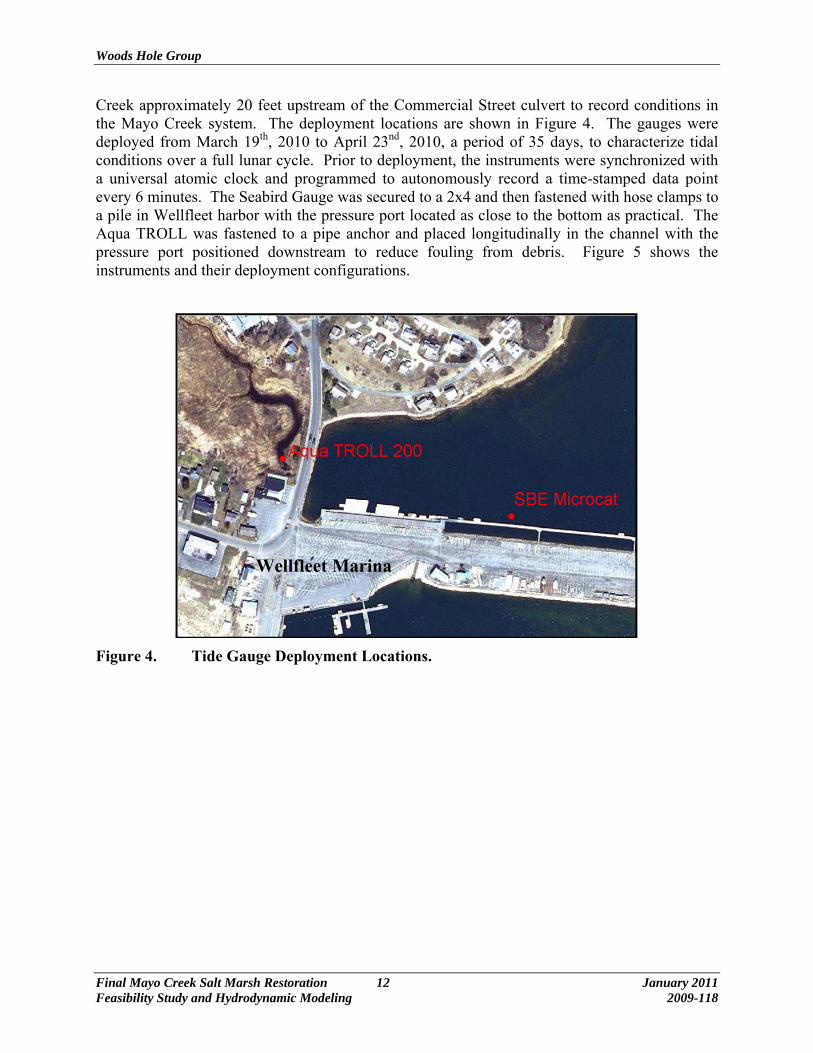
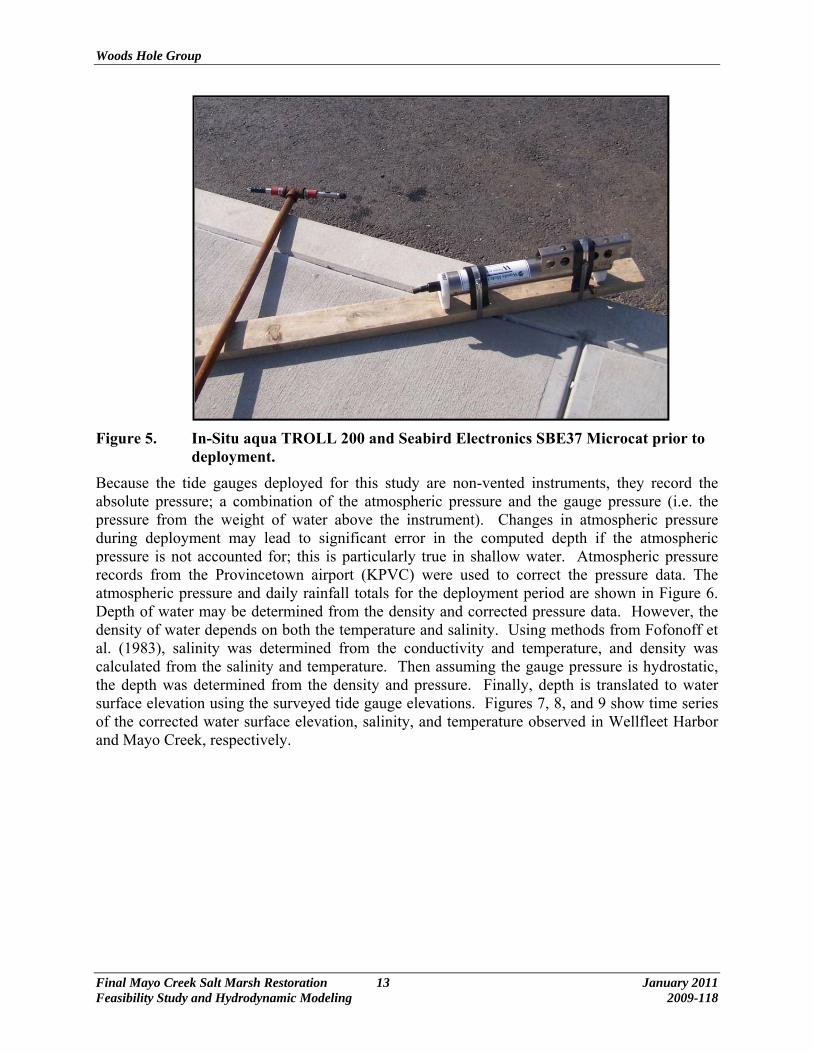
Creek approximately 20 feet upstream of the Commercial Street culvert to record conditions in the Mayo Creek system. The deployment locations are shown in Figure 4. The gauges were deployed from March 19th, 2010 to April 23nd, 2010, a period of 35 days, to characterize tidal conditions over a full lunar cycle. Prior to deployment, the instruments were synchronized with a universal atomic clock and programmed to autonomously record a time-stamped data point every 6 minutes. The Seabird Gauge was secured to a 2x4 and then fastened with hose clamps to a pile in Wellfleet harbor with the pressure port located as close to the bottom as practical. The Aqua TROLL was fastened to a pipe anchor and placed longitudinally in the channel with the pressure port positioned downstream to reduce fouling from debris. Figure 5 shows the instruments and their deployment configurations.
Figure 4. Tide Gauge Deployment Locations.
Wellfleet Marina
Woods Hole Group
Final Mayo Creek Salt Marsh Restoration 13 January 2011 Feasibility Study and Hydrodynamic Modeling 2009-118
Figure 5. In-Situ aqua TROLL 200 and Seabird Electronics SBE37 Microcat prior to deployment.
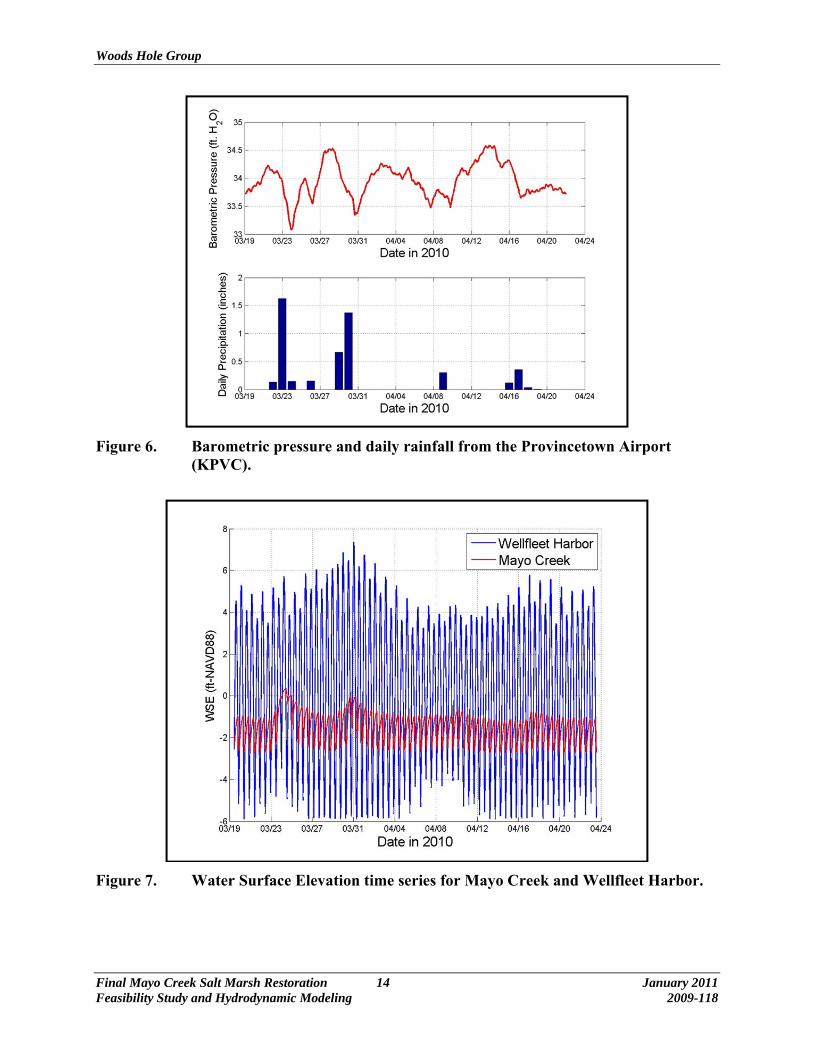
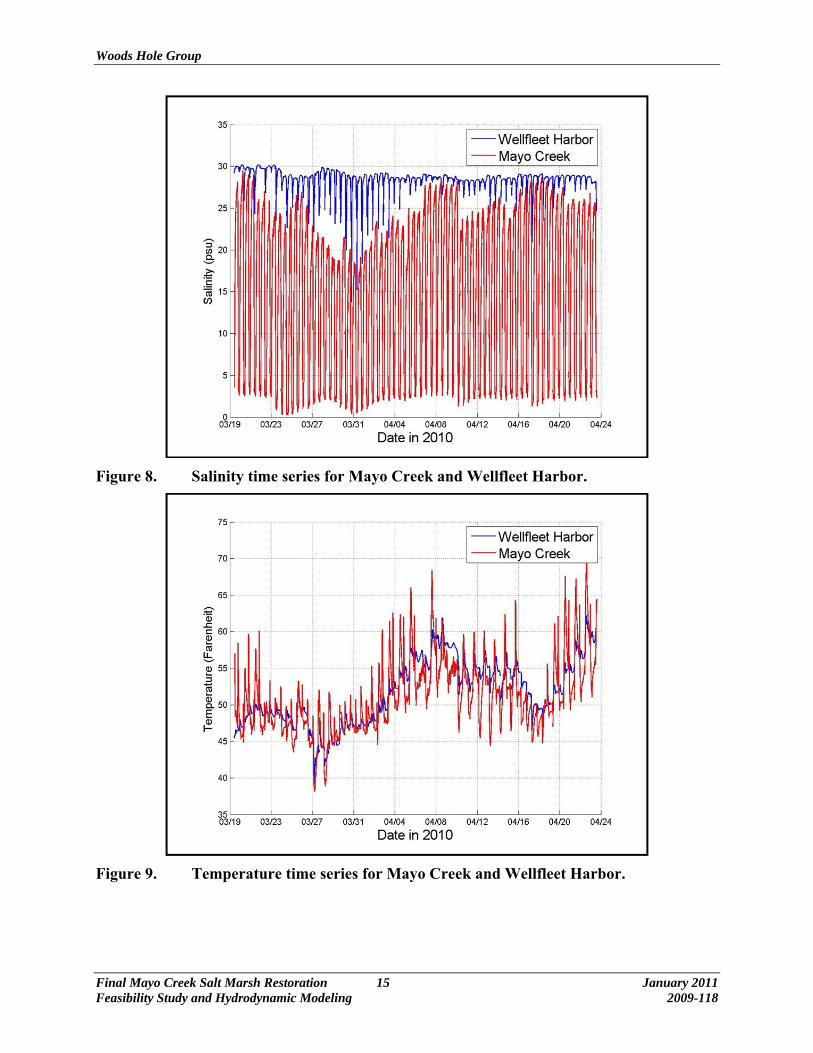
Because the tide gauges deployed for this study are non-vented instruments, they record the absolute pressure; a combination of the atmospheric pressure and the gauge pressure (i.e. the pressure from the weight of water above the instrument). Changes in atmospheric pressure during deployment may lead to significant error in the computed depth if the atmospheric pressure is not accounted for; this is particularly true in shallow water. Atmospheric pressure records from the Provincetown airport (KPVC) were used to correct the pressure data. The atmospheric pressure and daily rainfall totals for the deployment period are shown in Figure 6. Depth of water may be determined from the density and corrected pressure data. However, the density of water depends on both the temperature and salinity. Using methods from Fofonoff et al. (1983), salinity was determined from the conductivity and temperature, and density was calculated from the salinity and temperature. Then assuming the gauge pressure is hydrostatic, the depth was determined from the density and pressure. Finally, depth is translated to water surface elevation using the surveyed tide gauge elevations. Figures 7, 8, and 9 show time series of the corrected water surface elevation, salinity, and temperature observed in Wellfleet Harbor and Mayo Creek, respectively.
Woods Hole Group
Final Mayo Creek Salt Marsh Restoration 14 January 2011 Feasibility Study and Hydrodynamic Modeling 2009-118
Figure 6. Barometric pressure and daily rainfall from the Provincetown Airport (KPVC).
Figure 7. Water Surface Elevation time series for Mayo Creek and Wellfleet Harbor.
Woods Hole Group
Final Mayo Creek Salt Marsh Restoration 15 January 2011 Feasibility Study and Hydrodynamic Modeling 2009-118
Figure 8. Salinity time series for Mayo Creek and Wellfleet Harbor.
Figure 9. Temperature time series for Mayo Creek and Wellfleet Harbor.
Woods Hole Group
Final Mayo Creek Salt Marsh Restoration 16 January 2011 Feasibility Study and Hydrodynamic Modeling 2009-118
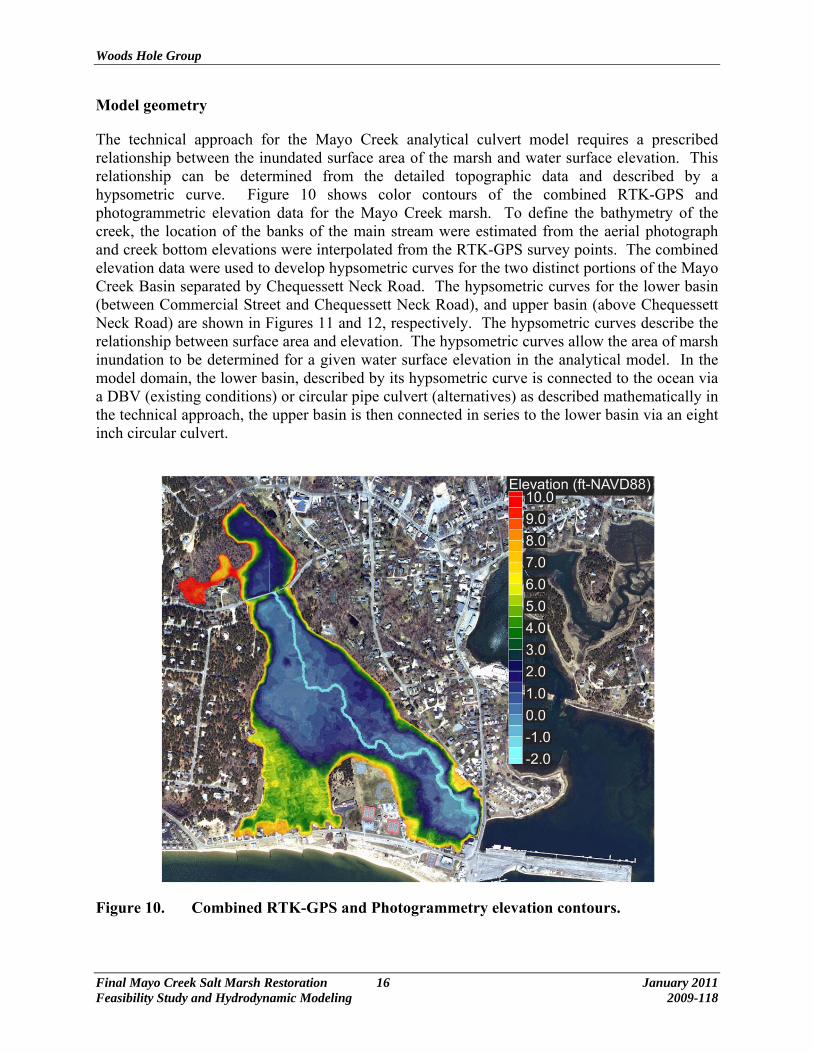
Model geometry
The technical approach for the Mayo Creek analytical culvert model requires a prescribed relationship between the inundated surface area of the marsh and water surface elevation. This relationship can be determined from the detailed topographic data and described by a hypsometric curve. Figure 10 shows color contours of the combined RTK-GPS and photogrammetric elevation data for the Mayo Creek marsh. To define the bathymetry of the creek, the location of the banks of the main stream were estimated from the aerial photograph and creek bottom elevations were interpolated from the RTK-GPS survey points. The combined elevation data were used to develop hypsometric curves for the two distinct portions of the Mayo Creek Basin separated by Chequessett Neck Road. The hypsometric curves for the lower basin (between Commercial Street and Chequessett Neck Road), and upper basin (above Chequessett Neck Road) are shown in Figures 11 and 12, respectively. The hypsometric curves describe the relationship between surface area and elevation. The hypsometric curves allow the area of marsh inundation to be determined for a given water surface elevation in the analytical model. In the model domain, the lower basin, described by its hypsometric curve is connected to the ocean via a DBV (existing conditions) or circular pipe culvert (alternatives) as described mathematically in the technical approach, the upper basin is then connected in series to the lower basin via an eight inch circular culvert.
Figure 10. Combined RTK-GPS and Photogrammetry elevation contours.

Woods Hole Group
Final Mayo Creek Salt Marsh Restoration 17 January 2011 Feasibility Study and Hydrodynamic Modeling 2009-118
Figure 11. Hypsometric curve for Mayo Creek lower basin.
Figure 12. Hypsometric curve for Mayo Creek upper basin.

Woods Hole Group
Final Mayo Creek Salt Marsh Restoration 18 January 2011 Feasibility Study and Hydrodynamic Modeling 2009-118
Boundary conditions
In order for the Mayo Creek culvert model to compute a unique solution for water surface elevation within the marsh, it is necessary to specify the model variables on the model domain boundary. The primary boundary condition is the water level time series specified in the ocean. Other boundary conditions include rainfall input and freshwater input from groundwater.
The water levels observed in Wellfleet Harbor are used as the ocean boundary condition for model calibration and validation. Direct rainfall input (on water surface and not from the watershed) is determined from hourly rainfall records at the Provincetown airport. Assuming the rainfall is distributed evenly across the Mayo Creek basin, the volumetric input from rainfall is determined by multiplying the rainfall rate by the total area (65 acres) of the Mayo Creek Basin.
For existing conditions simulations and alternative simulations, tidal boundary conditions are applied at the ocean boundary. The tidal boundary conditions are based on a harmonic reconstruction of the observed water level time series data in Wellfleet Harbor. Figure 13 shows the harmonic reconstruction of the tide in Wellfleet Harbor. The residual, the difference between the observed water level and harmonic predicted water level, is shown as the green line. A comparison of the residual to the rainfall data during the same time period suggests correlation between the non-tidal fluctuations in water level and rainfall events. Harmonic reconstruction of the water level time series effectively removes the influence of non-periodic forces on the water level such as rainfall, wind, storm surge. Thus the reconstructed boundary condition is more representative of average tidal conditions.
Figure 13. Harmonic reconstruction of the Wellfleet harbor tide.
Woods Hole Group
Final Mayo Creek Salt Marsh Restoration 19 January 2011 Feasibility Study and Hydrodynamic Modeling 2009-118
For all simulations a freshwater input (base flow) rate for Mayo Creek of 0.51 cfs is applied based. This rate is consistent with results of groundwater modeling conducted by the United States Geological Survey (Masterson, 2004).
2.3 MODEL CALIBRATION
Model calibration is a process in which unknown model parameters are adjusted within a reasonable range of values until model results match observations with an acceptable level of error. Standard measures of error are used to quantify the model error. For the Mayo Creek culvert model, two unknown model parameters were varied within reasonable ranges to calibrate the model; the discharge coefficient for the DBV, Kdb, and the permeability of the leaky embankment, kleak (as presented in Section 2.1). A week long time period between April 2nd and April 9th 2010 was selected as the calibration period because there was no rainfall during this time. A large number of simulations were conducted with systematically varied values for Kdb and kleak. Results for water level in Mayo Creek were compared to actual observations during that period. Values of 3.0 ft2/sec for Kdb and 5x10⁻⁷ ft2 for kleak were shown to provide acceptable agreement between modeled and observed water levels in Mayo Creek.
The results are presented visually as a time series plot and absolute error of the model is quantified by calculating the Bias and Root Mean Square Error (RMSE). The time series plot allows for a direct visual comparison of how the observed and modeled variables evolve through time by providing a qualitative view of the performance of the model. The overall error for a given observation time series is quantified in two ways
n
ppBias
n
obs 1
mod
(14)
n
ppRMSE
n
obs 1
2mod
(15)
Where pmod and pobs are the modeled and observed values, respectively, and n is the number of discrete measurements in the time series. The bias provides a measure of how close on average the modeled results are to the observed data. A positive value indicates that the model is over-predicting the observation, while a negative value indicates that the model is under-predicting the observations. A bias of zero indicates that on average over the time series the model reproduces the observations. The RMSE is an average of the magnitude of the error of each discrete measurement in the time series. RMSE is always positive with smaller values indicating better model performance. Both the bias and RMSE are measures of absolute error having the same units of the measured quantity from which they are computed.
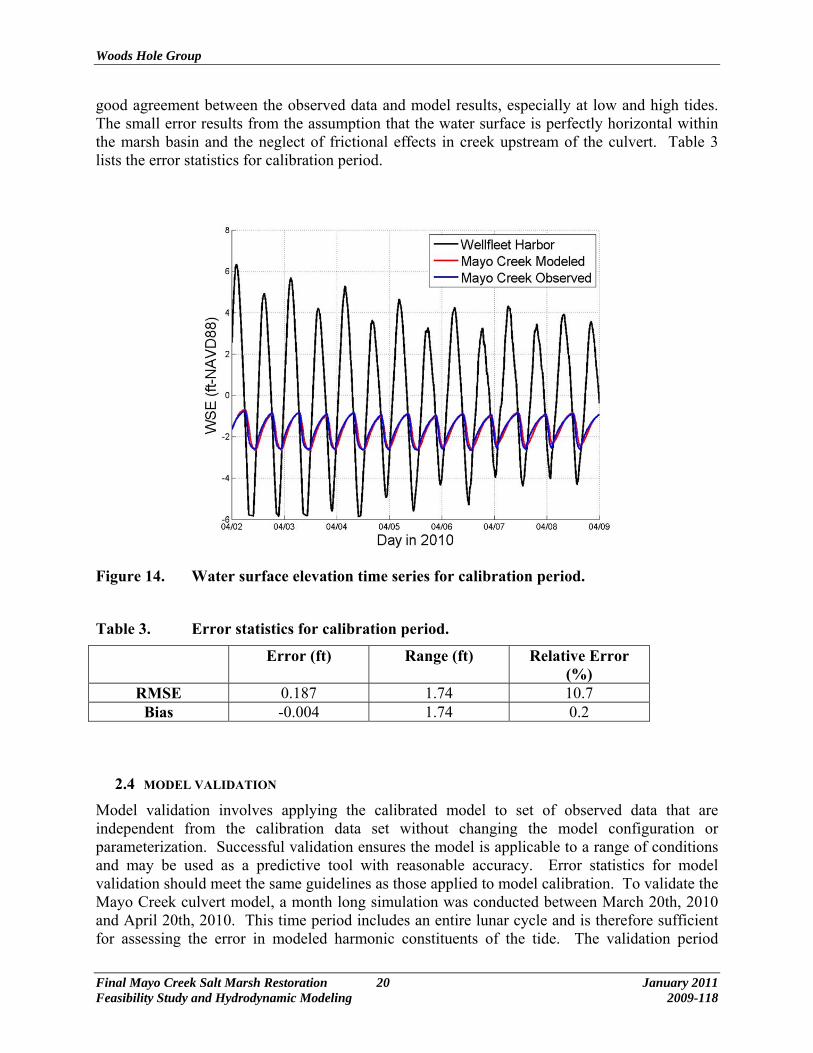
The U.S. EPA provides technical guidance on error statistic criteria for estuarine water quality models recommending that hydrodynamic variables (i.e. water surface elevation) have relative error less than 30% (EPA, 1990). To compute relative error for water surface elevation the RMSE is related to the mean tidal range for Mayo Creek of 1.74 ft. Figure 14 shows the time series comparison for the calibration period, while the RMSE and bias computed for the calibration period are shown as 0.187 ft and -0.005 ft, respectively. The time series plot shows
Woods Hole Group
Final Mayo Creek Salt Marsh Restoration 20 January 2011 Feasibility Study and Hydrodynamic Modeling 2009-118
good agreement between the observed data and model results, especially at low and high tides. The small error results from the assumption that the water surface is perfectly horizontal within the marsh basin and the neglect of frictional effects in creek upstream of the culvert. Table 3 lists the error statistics for calibration period.
Figure 14. Water surface elevation time series for calibration period.
Table 3. Error statistics for calibration period.
Error (ft) Range (ft) Relative Error (%)
RMSE 0.187 1.74 10.7 Bias -0.004 1.74 0.2
2.4 MODEL VALIDATION
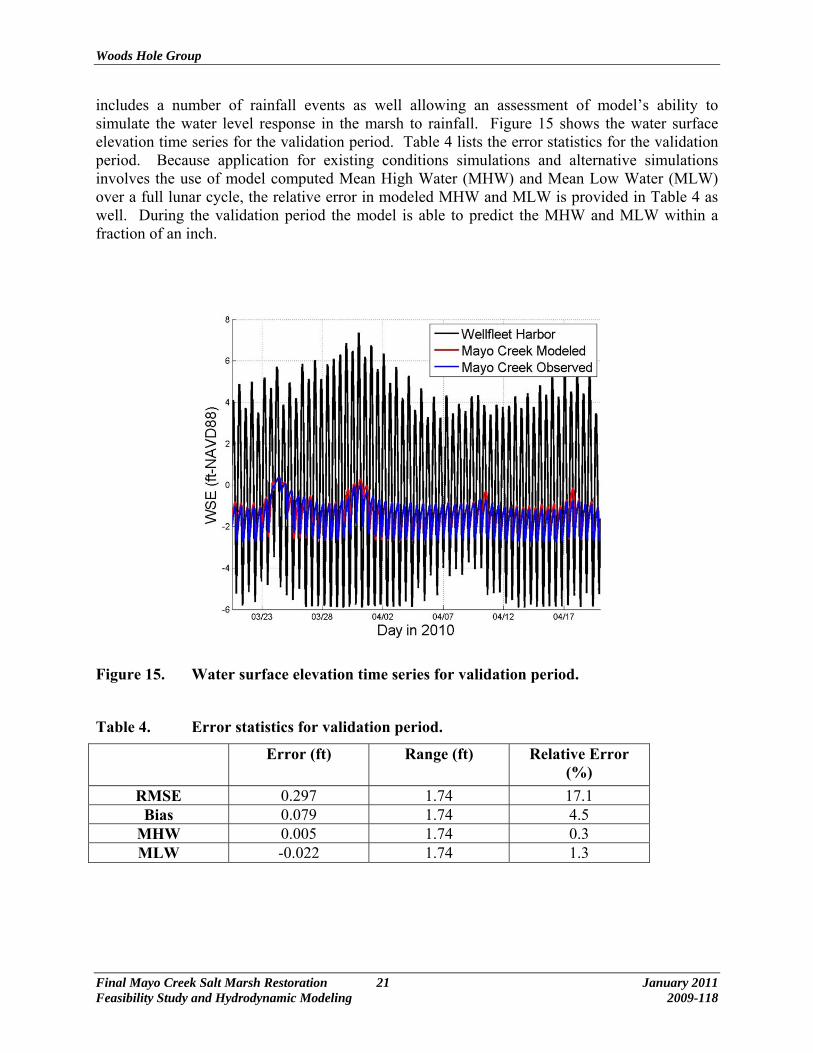
Model validation involves applying the calibrated model to set of observed data that are independent from the calibration data set without changing the model configuration or parameterization. Successful validation ensures the model is applicable to a range of conditions and may be used as a predictive tool with reasonable accuracy. Error statistics for model validation should meet the same guidelines as those applied to model calibration. To validate the Mayo Creek culvert model, a month long simulation was conducted between March 20th, 2010 and April 20th, 2010. This time period includes an entire lunar cycle and is therefore sufficient for assessing the error in modeled harmonic constituents of the tide. The validation period
Woods Hole Group
Final Mayo Creek Salt Marsh Restoration 21 January 2011 Feasibility Study and Hydrodynamic Modeling 2009-118
includes a number of rainfall events as well allowing an assessment of model’s ability to simulate the water level response in the marsh to rainfall. Figure 15 shows the water surface elevation time series for the validation period. Table 4 lists the error statistics for the validation period. Because application for existing conditions simulations and alternative simulations involves the use of model computed Mean High Water (MHW) and Mean Low Water (MLW) over a full lunar cycle, the relative error in modeled MHW and MLW is provided in Table 4 as well. During the validation period the model is able to predict the MHW and MLW within a fraction of an inch.
Figure 15. Water surface elevation time series for validation period.
Table 4. Error statistics for validation period.
Error (ft) Range (ft) Relative Error (%)
RMSE 0.297 1.74 17.1 Bias 0.079 1.74 4.5
MHW 0.005 1.74 0.3 MLW -0.022 1.74 1.3
Woods Hole Group
Final Mayo Creek Salt Marsh Restoration 22 January 2011 Feasibility Study and Hydrodynamic Modeling 2009-118
3.0 EXISTING CONDITIONS
The validated model is applied to simulate a number of hypothetical situations to aid in understanding the behavior of the Mayo Creek system in its existing state. Results of the existing conditions simulations are also useful since they provide a baseline for comparison to simulations that examine the restoration potential and possible impacts of different restoration alternatives. The existing conditions simulations utilize the calibrated and validated model without making any changes to model parameters; only the model boundary conditions are modified to represent storm events and sea level rise scenarios. Hypothetical boundary conditions for the existing conditions simulation are all based on harmonic reconstruction of the observed tide in Wellfleet Harbor. These include: a simulation of normal tide conditions using the unmodified harmonically predicted boundary condition, sea level rise simulations for which the boundary condition is increased by a constant value, storm simulations designed to simulate draining of the marsh system after a significant rainfall storm event, and storm surge events in Wellfleet Harbor.
3.1 NORMAL TIDES
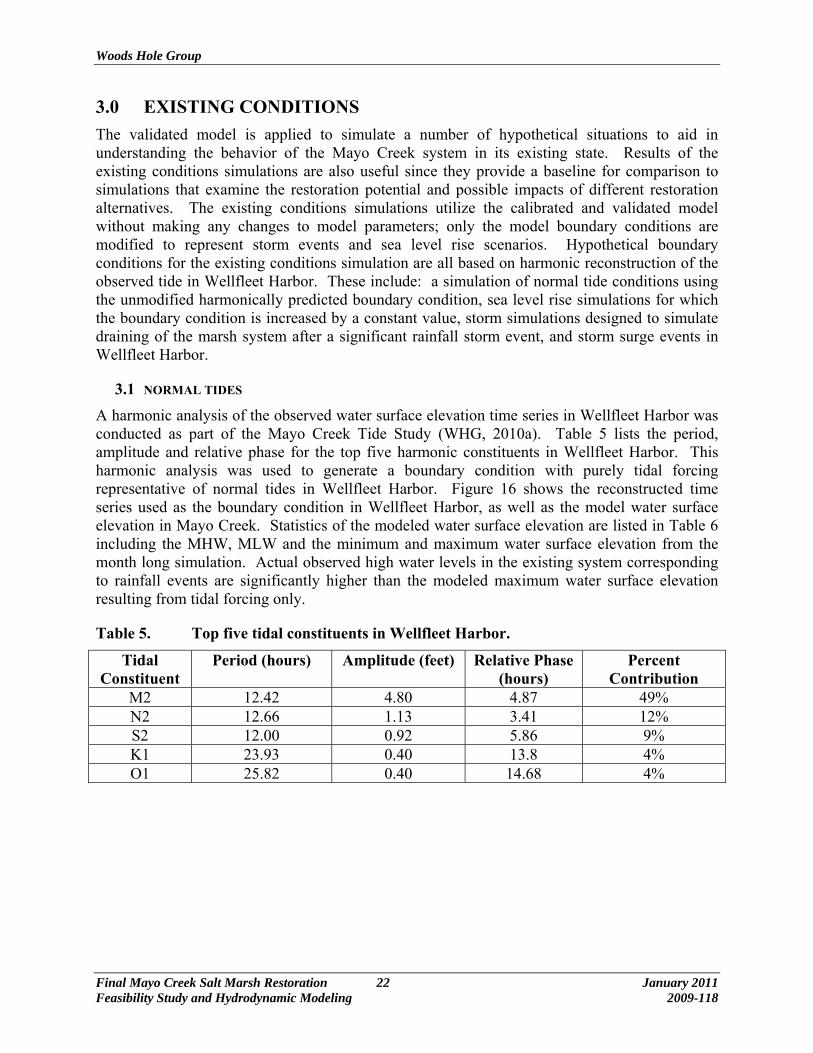
A harmonic analysis of the observed water surface elevation time series in Wellfleet Harbor was conducted as part of the Mayo Creek Tide Study (WHG, 2010a). Table 5 lists the period, amplitude and relative phase for the top five harmonic constituents in Wellfleet Harbor. This harmonic analysis was used to generate a boundary condition with purely tidal forcing representative of normal tides in Wellfleet Harbor. Figure 16 shows the reconstructed time series used as the boundary condition in Wellfleet Harbor, as well as the model water surface elevation in Mayo Creek. Statistics of the modeled water surface elevation are listed in Table 6 including the MHW, MLW and the minimum and maximum water surface elevation from the month long simulation. Actual observed high water levels in the existing system corresponding to rainfall events are significantly higher than the modeled maximum water surface elevation resulting from tidal forcing only.
Table 5. Top five tidal constituents in Wellfleet Harbor.
Tidal Constituent
Period (hours) Amplitude (feet) Relative Phase (hours)
Percent Contribution
M2 12.42 4.80 4.87 49% N2 12.66 1.13 3.41 12% S2 12.00 0.92 5.86 9% K1 23.93 0.40 13.8 4% O1 25.82 0.40 14.68 4%

Woods Hole Group
Final Mayo Creek Salt Marsh Restoration 23 January 2011 Feasibility Study and Hydrodynamic Modeling 2009-118
Figure 16. Water surface elevation time series for existing conditions, normal tides.
Table 6. Water surface elevation statistics for existing conditions, normal tides (ft-NAVD88).
MHW MLW MTL Min WSE Max WSE
-0.84 -2.56 -1.70 -0.73 -2.65
3.2 SEA LEVEL RISE
The potential impacts of sea level rise present another scenario to consider in evaluating the restoration potential of the Mayo Creek Marsh system. The topic of accelerated sea level rise in the 21st century and beyond has been the subject of much debate. The Intergovernmental Panel on Climate Change (IPCC) has spent considerable time and energy reviewing and analyzing the current state of knowledge of past and future changes in sea level in relation to climate change. Taking this information, the United States Army Corp of Engineers (USACE) has developed guidance for incorporating sea-level change considerations in civil works programs (USACE, 2009). Under this design guidance, the USACE provides three (3) predicted rates of sea level rise (high, intermediate, and low) to use in the design of civil works projects. The Corps guidance uses current local sea level rise rates based on historic tide data to form projections for the “low” scenario, and a combination of these local rates with IPCC (2007) scenarios and the National Research Council’s (1987) equations for the “intermediate” and “high” scenarios for accelerated sea level rise. This method derives locally specific estimates for sea level rise that span a broader range of scenarios than the IPCC estimates alone. Sea level change values for the
Woods Hole Group
Final Mayo Creek Salt Marsh Restoration 24 January 2011 Feasibility Study and Hydrodynamic Modeling 2009-118
three scenarios at 50 and 100 years based on these methods are listed in table. These values were added to the normal tides boundary condition to produce boundary conditions for the sea level rise scenarios. It is important to consider, however, that as global and regional sea level changes the tidal hydrodynamics outside Wellfleet Harbor will likely result non-uniform changes in sea level within the Harbor. Thus, the assumption that sea level will rise uniformly in Wellfleet Harbor, in addition to the inherent uncertainty in sea level rise prediction alone, leads to a significant amount of uncertainty in the results of sea level rise simulations.
Table 7. Sea level rise scenarios for Mayo Creek, sea level increase from 2010 (feet).
Future Year Low Intermediate High 2060 0.43 0.82 2.03 2110 0.89 2.0 5.74
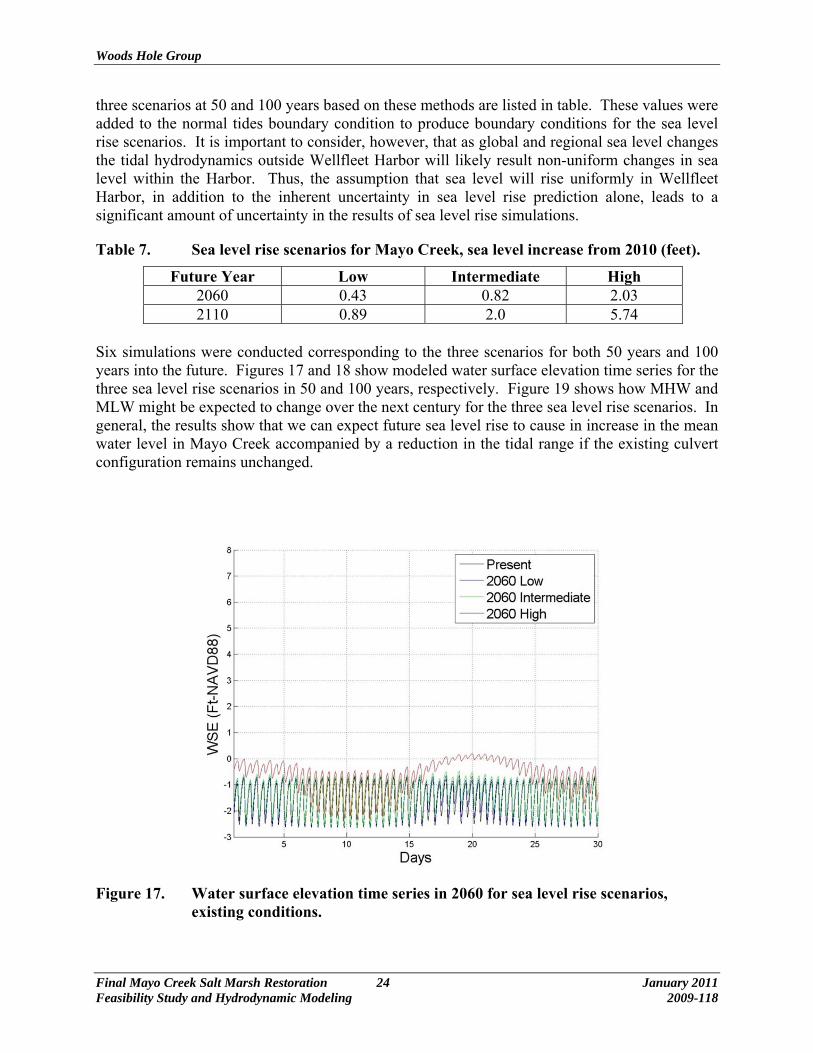
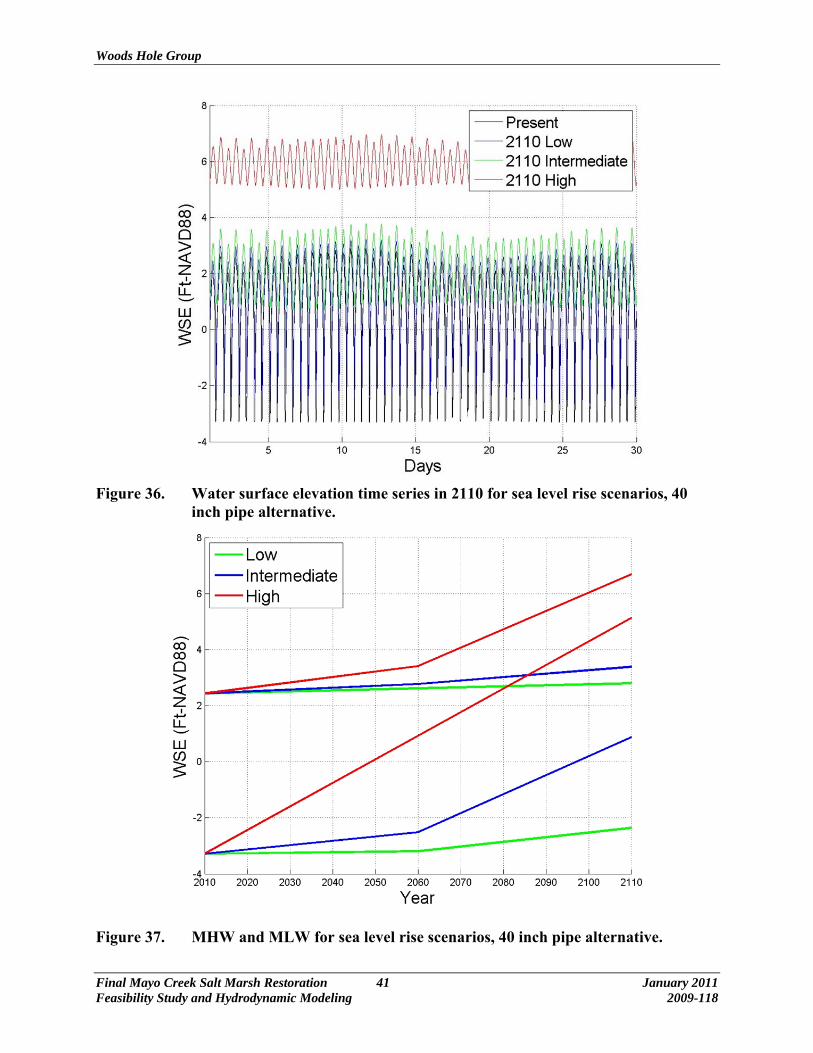
Six simulations were conducted corresponding to the three scenarios for both 50 years and 100 years into the future. Figures 17 and 18 show modeled water surface elevation time series for the three sea level rise scenarios in 50 and 100 years, respectively. Figure 19 shows how MHW and MLW might be expected to change over the next century for the three sea level rise scenarios. In general, the results show that we can expect future sea level rise to cause in increase in the mean water level in Mayo Creek accompanied by a reduction in the tidal range if the existing culvert configuration remains unchanged.
Figure 17. Water surface elevation time series in 2060 for sea level rise scenarios, existing conditions.

Woods Hole Group
Final Mayo Creek Salt Marsh Restoration 25 January 2011 Feasibility Study and Hydrodynamic Modeling 2009-118
Figure 18. Water surface elevation time series in 2110 for sea level rise scenarios, existing conditions.
Figure 19. MHW and MLW for sea level rise scenarios, existing conditions.
3.3 STORM EVENTS
Under existing conditions, the DBV installed on the Commercial Street culvert effectively limits flooding in Mayo Creek basin caused by high tides and storm surge events. As such, storm surge
Woods Hole Group
Final Mayo Creek Salt Marsh Restoration 26 January 2011 Feasibility Study and Hydrodynamic Modeling 2009-118
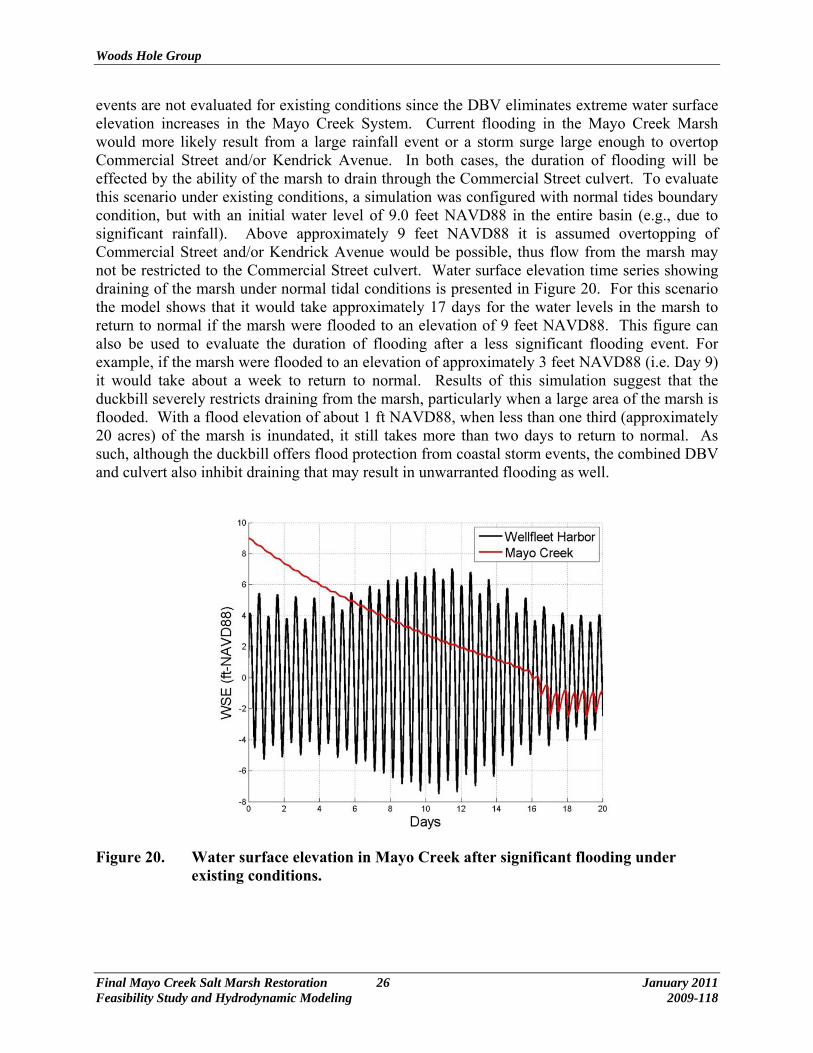
events are not evaluated for existing conditions since the DBV eliminates extreme water surface elevation increases in the Mayo Creek System. Current flooding in the Mayo Creek Marsh would more likely result from a large rainfall event or a storm surge large enough to overtop Commercial Street and/or Kendrick Avenue. In both cases, the duration of flooding will be effected by the ability of the marsh to drain through the Commercial Street culvert. To evaluate this scenario under existing conditions, a simulation was configured with normal tides boundary condition, but with an initial water level of 9.0 feet NAVD88 in the entire basin (e.g., due to significant rainfall). Above approximately 9 feet NAVD88 it is assumed overtopping of Commercial Street and/or Kendrick Avenue would be possible, thus flow from the marsh may not be restricted to the Commercial Street culvert. Water surface elevation time series showing draining of the marsh under normal tidal conditions is presented in Figure 20. For this scenario the model shows that it would take approximately 17 days for the water levels in the marsh to return to normal if the marsh were flooded to an elevation of 9 feet NAVD88. This figure can also be used to evaluate the duration of flooding after a less significant flooding event. For example, if the marsh were flooded to an elevation of approximately 3 feet NAVD88 (i.e. Day 9) it would take about a week to return to normal. Results of this simulation suggest that the duckbill severely restricts draining from the marsh, particularly when a large area of the marsh is flooded. With a flood elevation of about 1 ft NAVD88, when less than one third (approximately 20 acres) of the marsh is inundated, it still takes more than two days to return to normal. As such, although the duckbill offers flood protection from coastal storm events, the combined DBV and culvert also inhibit draining that may result in unwarranted flooding as well.
Figure 20. Water surface elevation in Mayo Creek after significant flooding under existing conditions.
Woods Hole Group
Final Mayo Creek Salt Marsh Restoration 27 January 2011 Feasibility Study and Hydrodynamic Modeling 2009-118
4.0 ALTERNATIVES
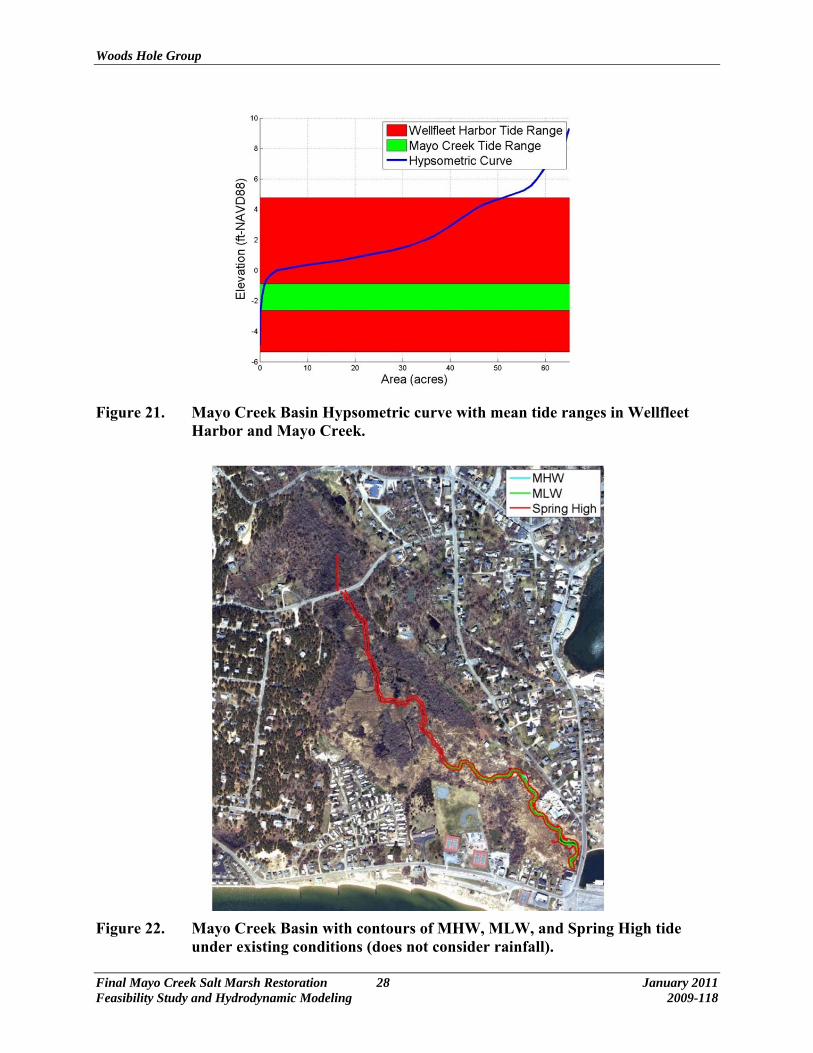
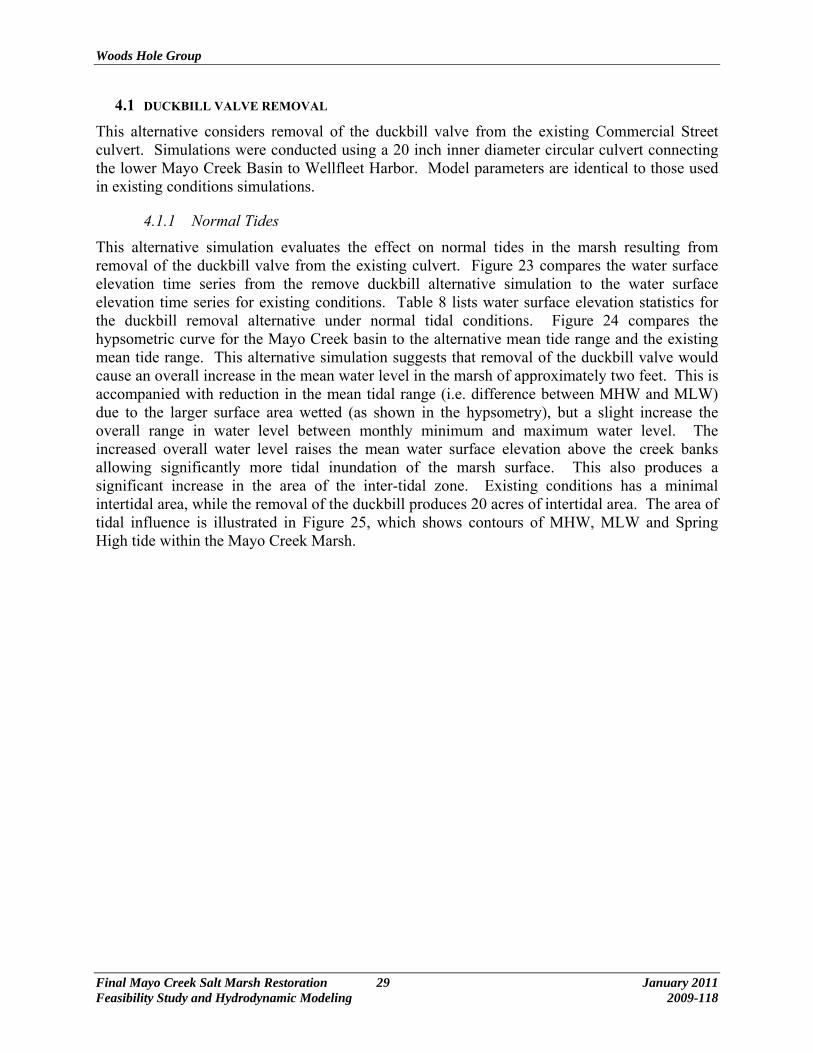
The restoration goals for the Mayo Creek Salt Marsh include increasing both the tidal range and the area of the inter-tidal zone in the marsh, limiting high water levels to prevent flooding of nearby infrastructure, and increasing the ability of the marsh to drain after storm events. These goals are somewhat interrelated as increasing the tidal range must also consider potential upland flooding impacts. Figure 21 illustrates the potential for increasing the tidal range and inter-tidal area in the Mayo Creek Marsh by comparing the existing tide range in Mayo Creek to the existing tide range in Wellfleet Harbor. The blue line is a hypsometric curve for the combined lower and upper basins of the marsh, the red shaded area represents the tidal range in Wellfleet Harbor, and the green shaded area represents existing tidal range in Mayo Creek. A fully unrestricted tide would expand the green shaded area to the red shaded area within the mayo Creek System. Presently, the tidal range in Mayo Creek is less than two feet and the water level is such that the intertidal zone is essentially limited to within the banks of the perennial stream. Figure 22 illustrates this with contours of MHW (Mean High Water), MLW (Mean Low Water) and Spring High tide for existing conditions. This figure does not show larger areas of the marsh that are occasionally inundated by rainfall events. If the full range of Wellfleet Harbor tides were allowed in the Mayo Creek Marsh the average inter-tidal zone could be increased to nearly 50 acres. However, this fully unrestricted case would also result in likely flooding of nearby infrastructure.
A number of alternative conditions for tidal restoration of the marsh were considered that involve modification of the existing Commercial Street culvert and duckbill valve. The alternatives were evaluated using the Mayo Creek culvert model, as presented in Chapter 3. Modeled scenarios for the restoration alternatives include evaluation of normal tides, sea level rise, and storm events (i.e. both rainfall and storm surge). The first restoration alternative considers removal of the duckbill valve from the existing pipe culvert at Commercial Street. Next, a series of simulations consider the effect of replacing the culvert with a larger diameter pipe, using normal tides. The pipe diameter alternative simulations are utilized to select a pipe size that limits Spring High tide to an elevation less than 3.0 ft-NAVD88. Finally, additional simulations were conducted to evaluate the response in the marsh to sea level rise and storm events for both alternative cases.
Woods Hole Group
Final Mayo Creek Salt Marsh Restoration 28 January 2011 Feasibility Study and Hydrodynamic Modeling 2009-118
Figure 21. Mayo Creek Basin Hypsometric curve with mean tide ranges in Wellfleet Harbor and Mayo Creek.
Figure 22. Mayo Creek Basin with contours of MHW, MLW, and Spring High tide under existing conditions (does not consider rainfall).
Woods Hole Group
Final Mayo Creek Salt Marsh Restoration 29 January 2011 Feasibility Study and Hydrodynamic Modeling 2009-118
4.1 DUCKBILL VALVE REMOVAL
This alternative considers removal of the duckbill valve from the existing Commercial Street culvert. Simulations were conducted using a 20 inch inner diameter circular culvert connecting the lower Mayo Creek Basin to Wellfleet Harbor. Model parameters are identical to those used in existing conditions simulations.
4.1.1 Normal Tides
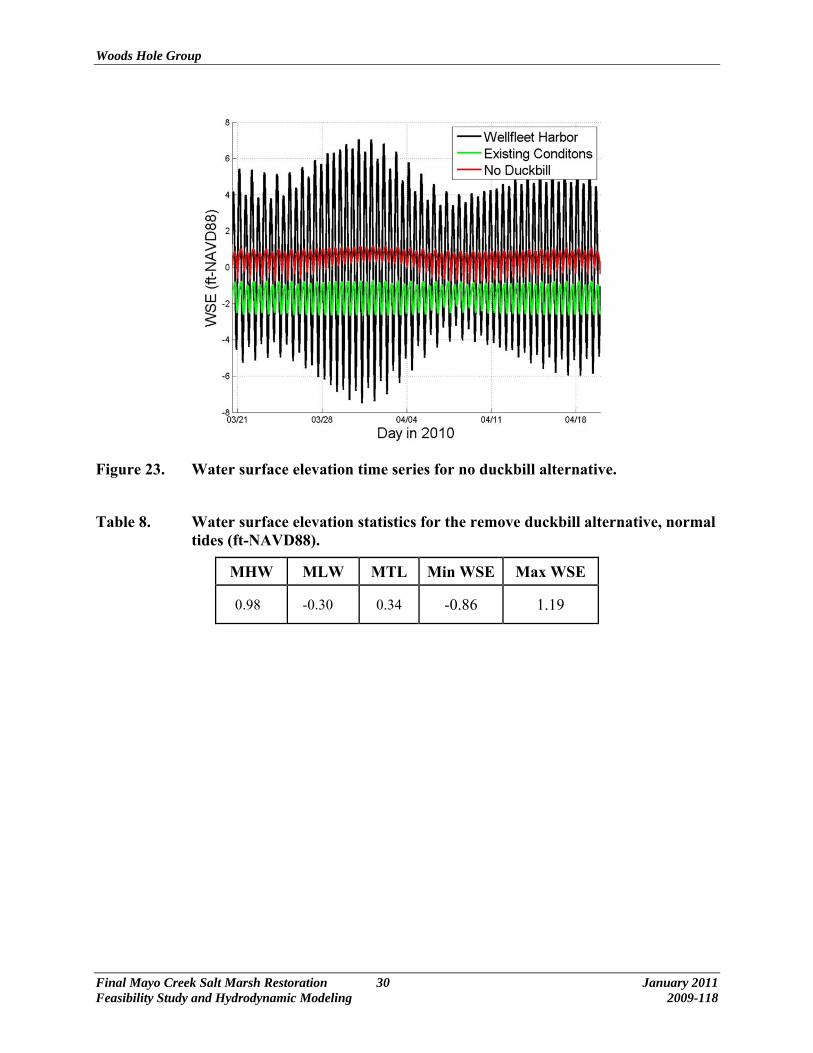
This alternative simulation evaluates the effect on normal tides in the marsh resulting from removal of the duckbill valve from the existing culvert. Figure 23 compares the water surface elevation time series from the remove duckbill alternative simulation to the water surface elevation time series for existing conditions. Table 8 lists water surface elevation statistics for the duckbill removal alternative under normal tidal conditions. Figure 24 compares the hypsometric curve for the Mayo Creek basin to the alternative mean tide range and the existing mean tide range. This alternative simulation suggests that removal of the duckbill valve would cause an overall increase in the mean water level in the marsh of approximately two feet. This is accompanied with reduction in the mean tidal range (i.e. difference between MHW and MLW) due to the larger surface area wetted (as shown in the hypsometry), but a slight increase the overall range in water level between monthly minimum and maximum water level. The increased overall water level raises the mean water surface elevation above the creek banks allowing significantly more tidal inundation of the marsh surface. This also produces a significant increase in the area of the inter-tidal zone. Existing conditions has a minimal intertidal area, while the removal of the duckbill produces 20 acres of intertidal area. The area of tidal influence is illustrated in Figure 25, which shows contours of MHW, MLW and Spring High tide within the Mayo Creek Marsh.
Woods Hole Group
Final Mayo Creek Salt Marsh Restoration 30 January 2011 Feasibility Study and Hydrodynamic Modeling 2009-118
Figure 23. Water surface elevation time series for no duckbill alternative.
Table 8. Water surface elevation statistics for the remove duckbill alternative, normal tides (ft-NAVD88).
MHW MLW MTL Min WSE Max WSE
0.98 -0.30 0.34 -0.86 1.19

Woods Hole Group
Final Mayo Creek Salt Marsh Restoration 31 January 2011 Feasibility Study and Hydrodynamic Modeling 2009-118
Figure 24. Existing tide range, remove duckbill alternative tide range, and Mayo Creek Basin hypsometric curve.
Figure 25. Mayo Creek Basin with contours of MHW, MLW, and Spring High tide, remove duckbill alternative.
Woods Hole Group
Final Mayo Creek Salt Marsh Restoration 32 January 2011 Feasibility Study and Hydrodynamic Modeling 2009-118
4.1.2 Sea Level Rise
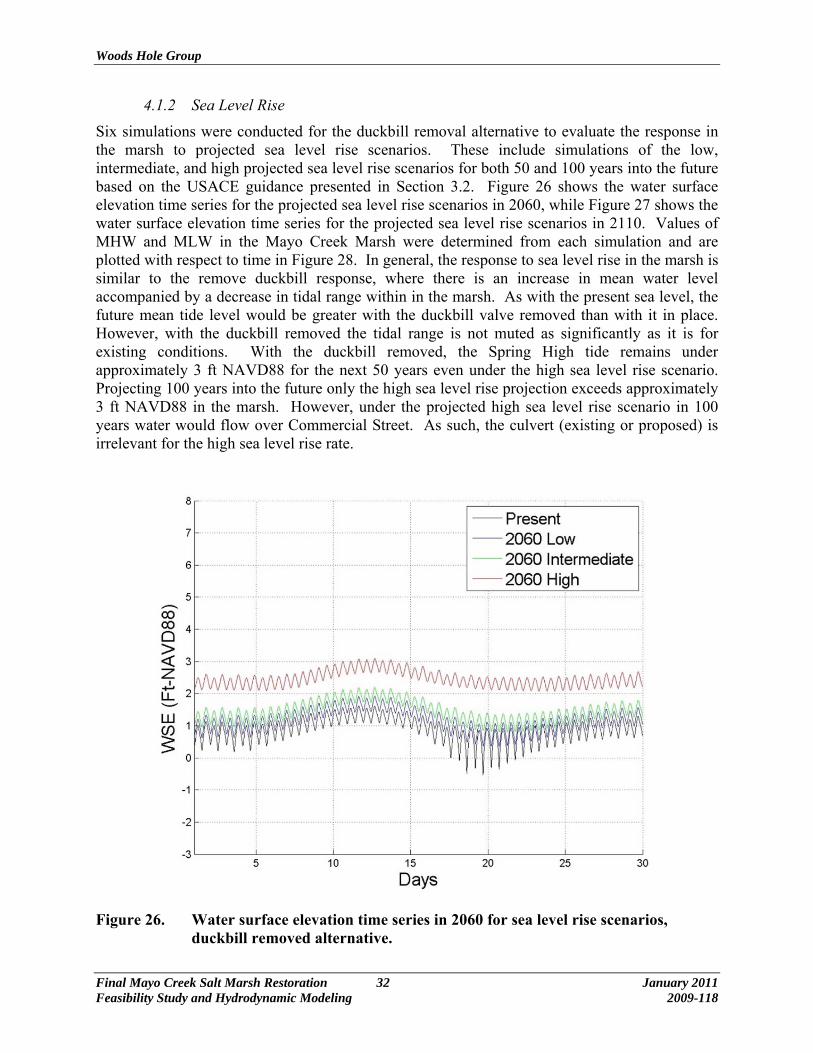
Six simulations were conducted for the duckbill removal alternative to evaluate the response in the marsh to projected sea level rise scenarios. These include simulations of the low, intermediate, and high projected sea level rise scenarios for both 50 and 100 years into the future based on the USACE guidance presented in Section 3.2. Figure 26 shows the water surface elevation time series for the projected sea level rise scenarios in 2060, while Figure 27 shows the water surface elevation time series for the projected sea level rise scenarios in 2110. Values of MHW and MLW in the Mayo Creek Marsh were determined from each simulation and are plotted with respect to time in Figure 28. In general, the response to sea level rise in the marsh is similar to the remove duckbill response, where there is an increase in mean water level accompanied by a decrease in tidal range within in the marsh. As with the present sea level, the future mean tide level would be greater with the duckbill valve removed than with it in place. However, with the duckbill removed the tidal range is not muted as significantly as it is for existing conditions. With the duckbill removed, the Spring High tide remains under approximately 3 ft NAVD88 for the next 50 years even under the high sea level rise scenario. Projecting 100 years into the future only the high sea level rise projection exceeds approximately 3 ft NAVD88 in the marsh. However, under the projected high sea level rise scenario in 100 years water would flow over Commercial Street. As such, the culvert (existing or proposed) is irrelevant for the high sea level rise rate.
Figure 26. Water surface elevation time series in 2060 for sea level rise scenarios, duckbill removed alternative.
Woods Hole Group
Final Mayo Creek Salt Marsh Restoration 33 January 2011 Feasibility Study and Hydrodynamic Modeling 2009-118
Figure 27. Water surface elevation time series in 2110 for sea level rise scenarios, duckbill removed alternative.
Figure 28. MHW and MLW for sea level rise scenarios, duckbill removed alternative.
Woods Hole Group
Final Mayo Creek Salt Marsh Restoration 34 January 2011 Feasibility Study and Hydrodynamic Modeling 2009-118
4.1.3 Storm Events
Because removal of the duckbill valve allows more water in Wellfleet Harbor to flow through the culvert into the Mayo Creek Salt Marsh, the marsh and surrounding area may become susceptible to flooding from storm surge in the harbor in addition to current flooding issues likely caused by large rainfall events. Two different types of storm scenarios were simulated to assess changes in the flooding potential resulting from the removal of the duckbill valve. These include a draining simulation similar to that used to evaluate existing conditions as well, as a storm surge simulation that evaluates flooding resulting from above normal water levels in Wellfleet Harbor. The draining simulation evaluates draining of the marsh after an initial water level of 9 feet NAVD88 under normal tidal conditions. The storm surge simulation evaluates the response in the marsh to short term (48 hours) elevated water levels in Wellfleet Harbor with a storm tide peak of elevation of 9.7 feet NAVD88, representative of peak water level that occurred during the Blizzard of 1978, and is close to the magnitude of a 100-year storm event. In reality, this level of storm would likely overtop Commercial Street and the Mayo Beach area resulting in significant flooding unrelated to the Commercial Street culvert. For the model simulation, the model assumes flooding results exclusively from flow through the culvert (i.e. no overtopping of Commercial Street).
The water surface elevation time series for the draining simulation is compared to the time series for existing conditions in Figure 29. This simulation suggests that removal of the duckbill valve would significantly improve draining from the marsh. Under existing conditions it takes nearly four days for water level in the marsh to decrease from 9 feet to 6 feet NAVD88, but with removal of the duckbill the 6 foot elevation reached twice as fast. However, even with the duckbill removed, it could take nearly a week for water levels to return to normal after a large flooding event, indicating there may be the ability to increase flow capacity for improved draining.
Woods Hole Group
Final Mayo Creek Salt Marsh Restoration 35 January 2011 Feasibility Study and Hydrodynamic Modeling 2009-118
Figure 29. Water surface elevation in Mayo Creek after significant flooding comparing the duckbill removed alternative and existing conditions.
Figure 30 shows the water surface elevation time series results for the storm surge simulation. The results show the peak water level in the marsh is relatively unaffected due to the restricted capacity of the existing culvert. The peak water surface elevation in the marsh is less than 2 feet NAVD88 suggesting that the existing twenty inch pipe is effective in limiting storm surge related flooding in the marsh.

Woods Hole Group
Final Mayo Creek Salt Marsh Restoration 36 January 2011 Feasibility Study and Hydrodynamic Modeling 2009-118
Figure 30. Water surface elevation in Mayo Creek during storm surge in Wellfleet Harbor, duckbill removed alternative.
4.2 PIPE SIZE ALTERNATIVES
A series of simulation were conducted under normal tidal conditions to evaluate the effect increasing the size of the Commercial Street culvert on water levels in the Mayo Creek Marsh. These simulations assume invert elevations would be unchanged from existing conditions and that the roadway embankment would be rebuilt to eliminate leaking. For each simulation MHW, MLW, Mean Sea Level (MSL) and Spring High tide were determined from the modeled water surface elevation. The results are plotted versus pipe diameter in Figure 31 in comparison to the existing tidal range in Mayo Creek and Wellfleet Harbor. This suite of simulations shows that increasing the pipe diameter in general causes an increase in tidal range in Mayo Creek. When compared to existing conditions, all simulations show an increase in the mean sea level as well. Based on these results an inner pipe diameter of forty inches was chosen for additional simulations to evaluate sea level rise and storm scenarios. The forty inch diameter pipe was chosen since spring high water is limited to less than 3 feet NAVD88 and does not produce any upland flooding during all normal tidal conditions. The 3 feet NAVD88 elevation is also below all surveyed upland infrastructure elevations as provided by the Town of Wellfleet. Low-lying infrastructure lies between 3.5 to 5.0 feet NAVD88.

Woods Hole Group
Final Mayo Creek Salt Marsh Restoration 37 January 2011 Feasibility Study and Hydrodynamic Modeling 2009-118
Figure 31. MHW and MLW versus pipe diameter for pipe size alternatives.
4.2.1 Normal Tides
Figure 32 shows the time series of water surface elevation in Mayo Creek for the forty inch diameter pipe alternative; as well as the time series for existing conditions in Mayo Creek and Wellfleet Harbor. The mean tide range computed from the alternative time series is plotted on Figure 33 as the red shaded area along with the hypsometric curve for the entire Mayo Creek basin. Statistics for the water surface elevation time series are listed in Table 9. When compared to existing conditions, replacement of the culvert with a forty inch diameter pipe would result an increase in MHW of about 3.3 feet, and an increase of about 1.2 feet in MTL. The mean inter-tidal area would be increased to nearly 38 acres. The approximate spatial distribution of the inter-tidal area is shown in Figure 34.

Woods Hole Group
Final Mayo Creek Salt Marsh Restoration 38 January 2011 Feasibility Study and Hydrodynamic Modeling 2009-118
Figure 32. Water surface elevation time series for forty inch pipe alternative.
Figure 33. Existing tide range, forty inch pipe alternative tide range, and Mayo Creek Basin hypsometric curve.
Woods Hole Group
Final Mayo Creek Salt Marsh Restoration 39 January 2011 Feasibility Study and Hydrodynamic Modeling 2009-118
Table 9. Water surface elevation statistics for the forty inch pipe alternative, normal tides (ft-NAVD88).
MHW MLW MTL Min WSE
Max WSE
2.44 -3.28 -0.42 -3.30 2.91
Figure 34. Mayo Creek Basin with contours of MHW, MLW, and Spring High tide, forty inch pipe alternative.
4.2.2 Sea Level Rise
Figures 35 and 36 show water surface elevation time series for the 2060 and 2110 simulations of sea level rise scenarios with the forty inch diameter pipe culvert, respectively. Values for MHW and MLW in the Mayo Creek Marsh were determined from each simulation and are plotted with

Woods Hole Group
Final Mayo Creek Salt Marsh Restoration 40 January 2011 Feasibility Study and Hydrodynamic Modeling 2009-118
respect to time in Figure 37. In general, the response to sea level rise in the marsh is similar to that for existing conditions and for the duckbill removed alternative. There is an increase in mean water level accompanied by a decrease in tidal range in the marsh as sea level increases. For the 40 inch pipe replacement alternative, the projected sea level rise results in potential upland flooding over a shorter time horizon than the duckbill removal alternative for the intermediate and high rates. Again, the projected high sea level rise scenario in 100 years would result in water flowing over Commercial Street. As such, the culvert (existing or proposed) is irrelevant for the high sea level rise rate.
Figure 35. Water surface elevation time series in 2060 for sea level rise scenarios, 40 inch pipe alternative.
Woods Hole Group
Final Mayo Creek Salt Marsh Restoration 41 January 2011 Feasibility Study and Hydrodynamic Modeling 2009-118
Figure 36. Water surface elevation time series in 2110 for sea level rise scenarios, 40 inch pipe alternative.
Figure 37. MHW and MLW for sea level rise scenarios, 40 inch pipe alternative.
Woods Hole Group
Final Mayo Creek Salt Marsh Restoration 42 January 2011 Feasibility Study and Hydrodynamic Modeling 2009-118
4.2.3 Storm Events
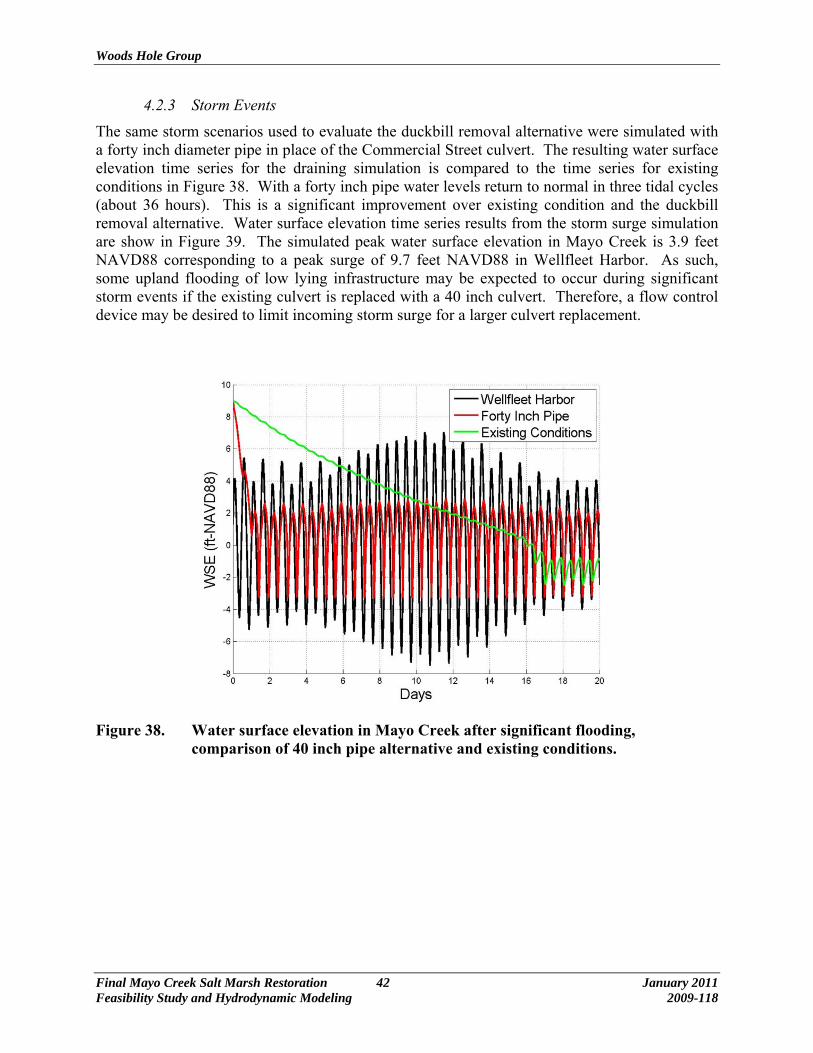
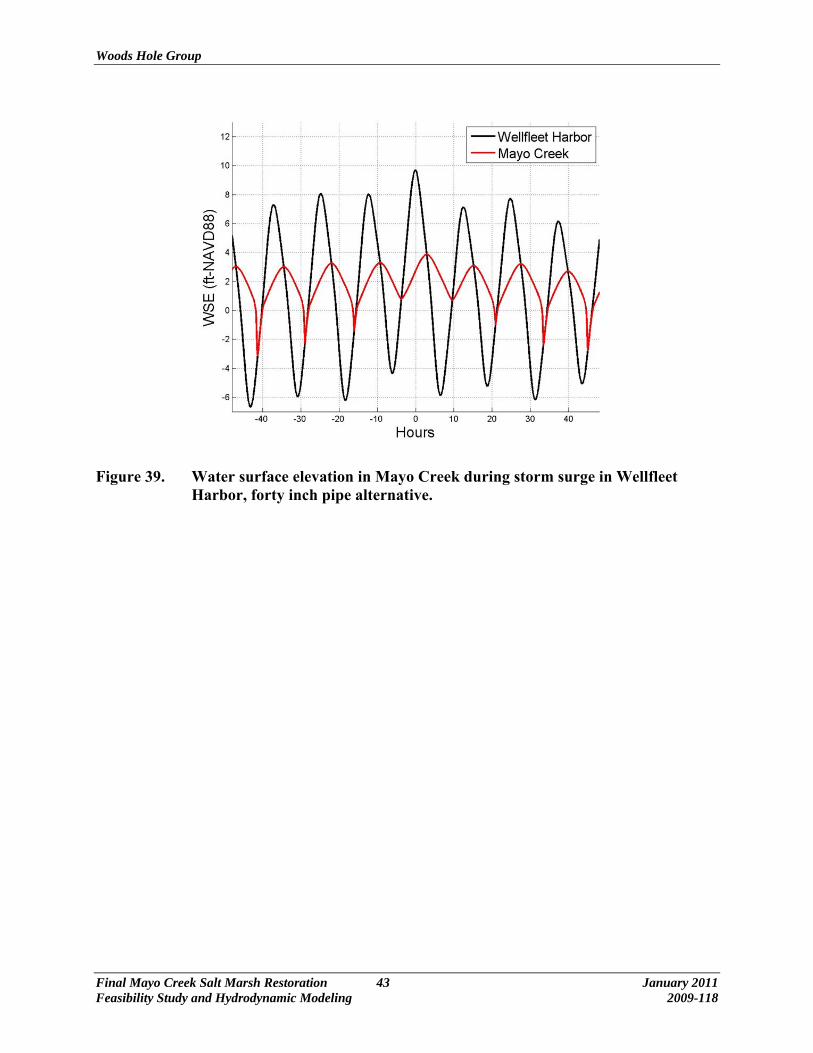
The same storm scenarios used to evaluate the duckbill removal alternative were simulated with a forty inch diameter pipe in place of the Commercial Street culvert. The resulting water surface elevation time series for the draining simulation is compared to the time series for existing conditions in Figure 38. With a forty inch pipe water levels return to normal in three tidal cycles (about 36 hours). This is a significant improvement over existing condition and the duckbill removal alternative. Water surface elevation time series results from the storm surge simulation are show in Figure 39. The simulated peak water surface elevation in Mayo Creek is 3.9 feet NAVD88 corresponding to a peak surge of 9.7 feet NAVD88 in Wellfleet Harbor. As such, some upland flooding of low lying infrastructure may be expected to occur during significant storm events if the existing culvert is replaced with a 40 inch culvert. Therefore, a flow control device may be desired to limit incoming storm surge for a larger culvert replacement.
Figure 38. Water surface elevation in Mayo Creek after significant flooding, comparison of 40 inch pipe alternative and existing conditions.
Woods Hole Group
Final Mayo Creek Salt Marsh Restoration 43 January 2011 Feasibility Study and Hydrodynamic Modeling 2009-118
Figure 39. Water surface elevation in Mayo Creek during storm surge in Wellfleet Harbor, forty inch pipe alternative.
Woods Hole Group
Final Mayo Creek Salt Marsh Restoration 44 January 2011 Feasibility Study and Hydrodynamic Modeling 2009-118
5.0 CONCLUSIONS AND RECOMMENDATIONS
5.1 OVERALL SUMMARY
Restoration of the Mayo Creek Salt Marsh must involve a compromise between restoration of the full range of the Wellfleet Harbor tide and the prevention of adverse impacts to homes and other infrastructure that are located on or near the former marsh plain. The feasibility of restoring the Mayo Creek Salt Marsh ultimately depends on the ability of a restoration plan to meet these competing needs. The Mayo Creek analytical estuarine culvert model has been developed as tool to aid in understanding the hydraulics of the existing system and to help identify and evaluate potential restoration alternatives. The model assists in feasibility assessment by quantifying the restoration (e.g. tidal range, inter-tidal area), as well as potential adverse impacts (e.g. peak water surface elevation, draining rate), allowing for the potential balance of these competing goals. In some cases, the model may help identify a course of action that meets restoration goals while also reducing flooding potential. However, because of the inherent uncertainties in modeling and future sea level, it is important that any plan to restore the Mayo Creek Salt Marsh include provisions for future monitoring and adaptive management of the system. This will ensure goals are met as best as possible for the time being and into the future.
In the existing system, the culvert and duckbill valve at Commercial Street have effectively reduced the mean water level and tide range within the marsh preventing flooding from high tides and moderate storm surges. However, observations and model results indicate that freshwater draining from the existing system is also severely restricted by the culvert and duckbill. This restriction makes the marsh area susceptible to prolonged flooding from storm water runoff and large rainfall events. Removal of the duckbill valve would somewhat improve the drainage ability and also increase the intertidal area in the marsh. However, this would also increase in the mean water level and reduce the tidal range such that the marsh would not fully drain during all low tides. Replacement of the culvert with a forty inch inner diameter pipe would increase the tide range and mean water level in the marsh, while also significantly enhancing drainage of the system. This culvert replacement would also lower MLW compared to the existing system. All these factors result in significantly enhanced ecological benefit. The enhanced drainage would significantly reduce the potential for flooding from storm water runoff and the duration of potential flooding caused by high tides and storm surges. The model predicts Spring High tide elevation on the marsh would be limited to less than 3 feet NAVD88 and storm surges would be limited to less than 4 feet NAVD88 with a 40 inch diameter pipe. Replacement of the culvert with a larger pipe (larger than 40 inch diameter) is unlikely to provide any additional drainage benefit, and would allow increased high tide elevations and storm surge susceptibility in the marsh.
Based on this analysis Woods Hole Group believes that removal of the duckbill valve from the existing culvert would provide some restoration benefit for the Mayo Creek Salt Marsh by increasing the area of inter-tidal zone in the marsh. Removal of the duckbill valve would also provide the benefit of increased drainage and reduction of flooding potential from storm water runoff. However, Woods Hole Group also understands that for ecological reasons, as well as leaking around the existing culvert that has caused potential degradation of the Commercial Street embankment and the need for repairs to the embankment and roadway, The Town of Wellfleet may desire to replace the culvert. Therefore, if the Town of Wellfleet chooses to

Woods Hole Group
Final Mayo Creek Salt Marsh Restoration 45 January 2011 Feasibility Study and Hydrodynamic Modeling 2009-118
replace the culvert and repair and Commercial Street roadway and embankment, the Town may want to consider replacing the culvert with a larger diameter pipe, which offers greater restoration and ecological benefits than simply removing the duckbill alone. In this case, (and possibly the duckbill removal alternative as well) the culvert could be equipped with a means of regulating incoming tidal flow to provide protection from storm surge without reducing drainage ability. For example, a device such as the Golden Harvest Inc. GH-35 Self Regulating Tide Gate specifically modified for a circular culvert, could be considered, to allow for normal tidal flushing while providing protection from storm surges.
5.2 ENGINEERING, PERMITTING, AND CONSTRUCTION COSTS
Potential engineering, permitting, and construction cost estimates associated with the two restoration options are presented below. It is not expected that permitting would be overly problematic in either of the cases. Construction costs are estimated based on culvert replacement of a similar scale that have been completed in the New England region between 1997 and 2008.
Table 10. Estimated, engineering, permitting, and construction costs associated with the two restoration options.
Restoration Option Estimated Engineering Costs
Estimated Permitting Costs
Estimated Construction Costs
Remove Duckbill from existing culvert
None Minimal (Town could complete)
None
3.5’ diameter Culvert Replacement
~$25,000 ~$15,000 ~$150,000-$200,000
Woods Hole Group
Final Mayo Creek Salt Marsh Restoration 46 January 2011 Feasibility Study and Hydrodynamic Modeling 2009-118
6.0 REFERENCES
Fofonoff, P. and R.C. Millard, Jr. 1983. Algorithms for computation of fundamental properties of seawater, 1983. Unesco Tech. Pap. in Mar. Sci._, No. 44, 53 pp.
Lee, Joseph H.W., D.L. Wilkinson, and I.R. Wood. 2001. On the Head-Discharge Relation of a “Duckbill” Elastomer Check Valve, Journal of Hydraulic Research, Vol. 39, No. 6.
Masterson, J.P. 2004. Simulated Interaction between Freshwater and Saltwater and Effects of Ground-water Pumping and Sea-level change, Lower Cape Cod Aquifer System, Massachusetts: U.S. Geological Survey Scientific Investigations Report 2004-5014, 72 p.
USACE. 2009. Water Resource Policies and Authorities Incorporating Sea-level Change Considerations in Civil Works Programs. Department of the Army, U.S. Army Corps of Engineers, Washington DC 20314-1000. Engineering Circular No. 1165-2-211.
U.S. Environmental Protection Agency. 1990. Technical Guidance Manual for Performing Waste Load Allocations, Book III Estuaries, Part 2, Application of Estuarine Waste Load Allocation Models. EPA 823-R-92-003.
Woods Hole Group. 2010a. Mayo Creek Salt Marsh Restoration Feasibility Study – Phase I Culvert Analysis. Technical Memorandum to Ms. Hillary Greenberg, Health and Conservation Agent, Town of Wellfleet. April 9, 2010.
Woods Hole Group. 2010b. Mayo Creek Tidal Study. Report to the Commonwealth of Massachusetts Division of Ecological Restoration. June 2010.


