Fermentation versus composting
Research by:
Feed Innovation Services BV,
Wageningen,
The Netherlands
For:
EM Agriton BV,
Noordwolde (Friesland),
The Netherlands
2013
Fermentation versus composting
Feed Innovation Services BV
Authors:
Anke Hitman BSc
Klaas Bos PhD
Marlou Bosch PhD
Arjan van der Kolk MSc
Generaal Foulkesweg 72
6703 BW Wageningen
T: 0317 465 570
F: 0317 410 773
info@feed‐innovation.com
www.feed‐innovation.com
BTW: NL 0071.53.582.B.01
KVK: 17086023
‐ Bankgegevens ‐
ING Bank, Helmond
Rek. nr. 66.21.43.310
BIC: INGBNL2A
Iban: NL89 INGB 0662 1433 10
Fermentation versus composting
3
Contents
1 Introduction .................................................................................................................................................... 4
2 Materials and methods .................................................................................................................................. 5
3 Results .......................................................................................................................................................... 11
3.1 Temperature .......................................................................................................................................... 11
3.2 Weight ................................................................................................................................................... 11
3.3 Composition........................................................................................................................................... 12
3.3.1 Analytical results ............................................................................................................................ 12
3.3.2 Minerals .......................................................................................................................................... 15
3.4 CO2‐foot print ........................................................................................................................................ 17
4 Discussion ..................................................................................................................................................... 18
5 Conclusions ................................................................................................................................................... 19
Literature ......................................................................................................................................................... 20
Appendix I: Log book
Appendix II: CO2‐foot print calculation
Fermentation versus composting
4
1 Introduction
Composting of organic (waste) materials has already been applied for many years in the agro‐ and horticulture. During composting, the material is aerated by regularly turning the windrow with a grinder. This strongly stimulates the growth of microorganisms. These microorganisms break down the organic matter. This will heat up the windrow and a considerable part of the organic matter will get lost during this process.
Another option is fermentation of the organic (waste) materials. This process takes place without aeration and without any extra processing. Seashell lime, Clay minerals and Microferm (Effective Microorganisms) are added to the windrow when the windrow is prepared for fermentation. After this the windrow will be closed by putting a plastic foil tightly stretched over the windrow. After a period of 6 to 8 weeks the windrow is fermented. This is called Bokashi; fermentated organic matter.
The goal of this experiment was to compare the effect of fermentation of organic (waste) materials with the common way of composting. It was expected that through anaerobic conversion (fermentation) of organic material more nutrients will be retained in the product.
This report describes first the materials and methods. In chapter 3 the results are given. After this follows a discussion. The conclusions are given in chapter 5.
Fermentation versus composting
5
2 Materials and methods
The following materials were used for the experiment: ‐ 26,800 kg road side cutting material
‐ 29 liter Microferm
‐ 293 liter well water
‐ 300 kg Edasil clay minerals
‐ 300 kg Ostrea seashell lime
‐ 200 liter tank
‐ 2 x 12 liter buckets
‐ 2 x 10 liter watering cans
‐ Weigh bridge
‐ Tractor with dumper
‐ Tractor with grinder
‐ Wheel loader (with a closed bucket)
‐ Temperature indicator
‐ Silage plastic of minimal 4 by 20 m
‐ Gravel bags
‐ Sand
‐ Protection cover of minimal 3 by 19 m,
for protecting the silage plastic
‐ Air tight bags
‐ Waterproof marker
‐ Scales for up to 5 kg
The experiment was carried out at Van den Hengel farm composting in Achterveld (The Netherlands). Two windrows were made in a barn with a concrete floor:
1. Bokashi: made by the Bokashi method of Agriton;
2. Common Compost: made by the traditional composting method.
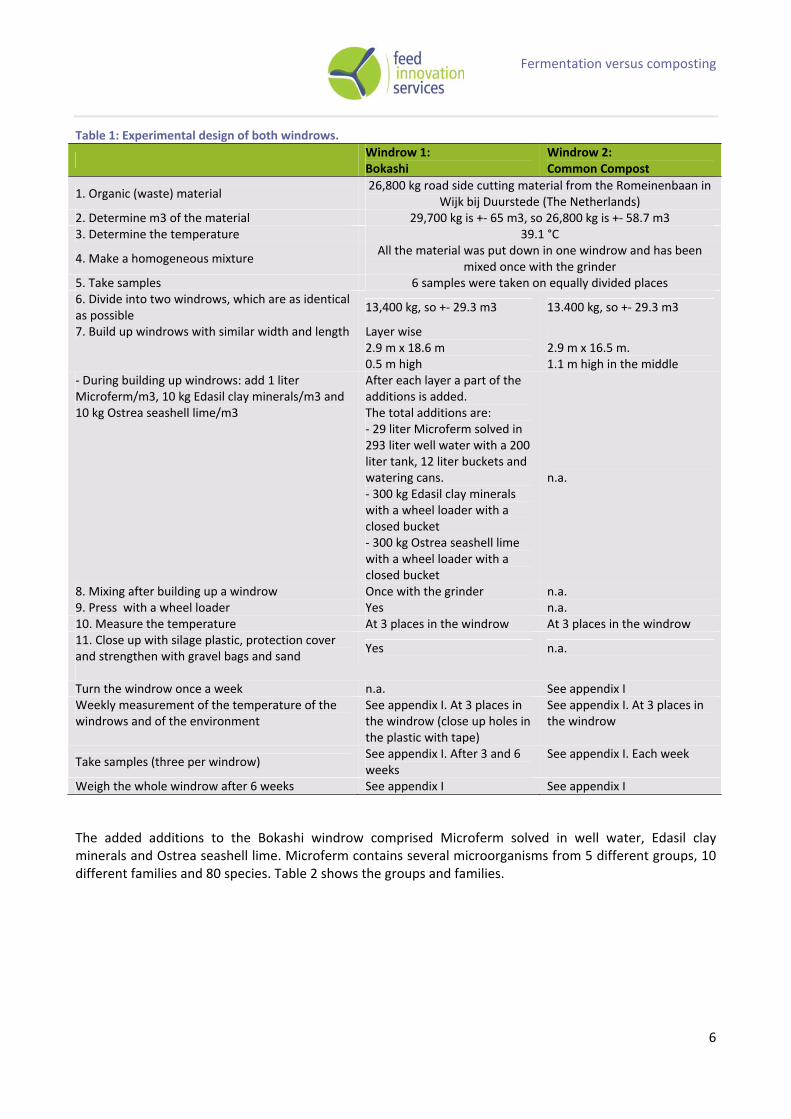
Table 1 shows the experimental design per windrow.
Fermentation versus composting
6
Table 1: Experimental design of both windrows.
Windrow 1:Bokashi
Windrow 2: Common Compost
1. Organic (waste) material 26,800 kg road side cutting material from the Romeinenbaan in
Wijk bij Duurstede (The Netherlands) 2. Determine m3 of the material 29,700 kg is +‐ 65 m3, so 26,800 kg is +‐ 58.7 m33. Determine the temperature 39.1 °C
4. Make a homogeneous mixture All the material was put down in one windrow and has been
mixed once with the grinder 5. Take samples 6 samples were taken on equally divided places6. Divide into two windrows, which are as identical as possible
13,400 kg, so +‐ 29.3 m3 13.400 kg, so +‐ 29.3 m3
7. Build up windrows with similar width and length Layer wise2.9 m x 18.6 m 0.5 m high
2.9 m x 16.5 m. 1.1 m high in the middle
‐ During building up windrows: add 1 liter Microferm/m3, 10 kg Edasil clay minerals/m3 and 10 kg Ostrea seashell lime/m3
After each layer a part of the additions is added. The total additions are: ‐ 29 liter Microferm solved in 293 liter well water with a 200 liter tank, 12 liter buckets and watering cans. ‐ 300 kg Edasil clay minerals with a wheel loader with a closed bucket ‐ 300 kg Ostrea seashell lime with a wheel loader with a closed bucket
n.a.
8. Mixing after building up a windrow Once with the grinder n.a. 9. Press with a wheel loader Yes n.a. 10. Measure the temperature At 3 places in the windrow At 3 places in the windrow11. Close up with silage plastic, protection cover and strengthen with gravel bags and sand
Yes n.a.
Turn the windrow once a week n.a. See appendix I Weekly measurement of the temperature of the windrows and of the environment
See appendix I. At 3 places in the windrow (close up holes in the plastic with tape)
See appendix I. At 3 places in the windrow
Take samples (three per windrow) See appendix I. After 3 and 6 weeks
See appendix I. Each week
Weigh the whole windrow after 6 weeks See appendix I See appendix I
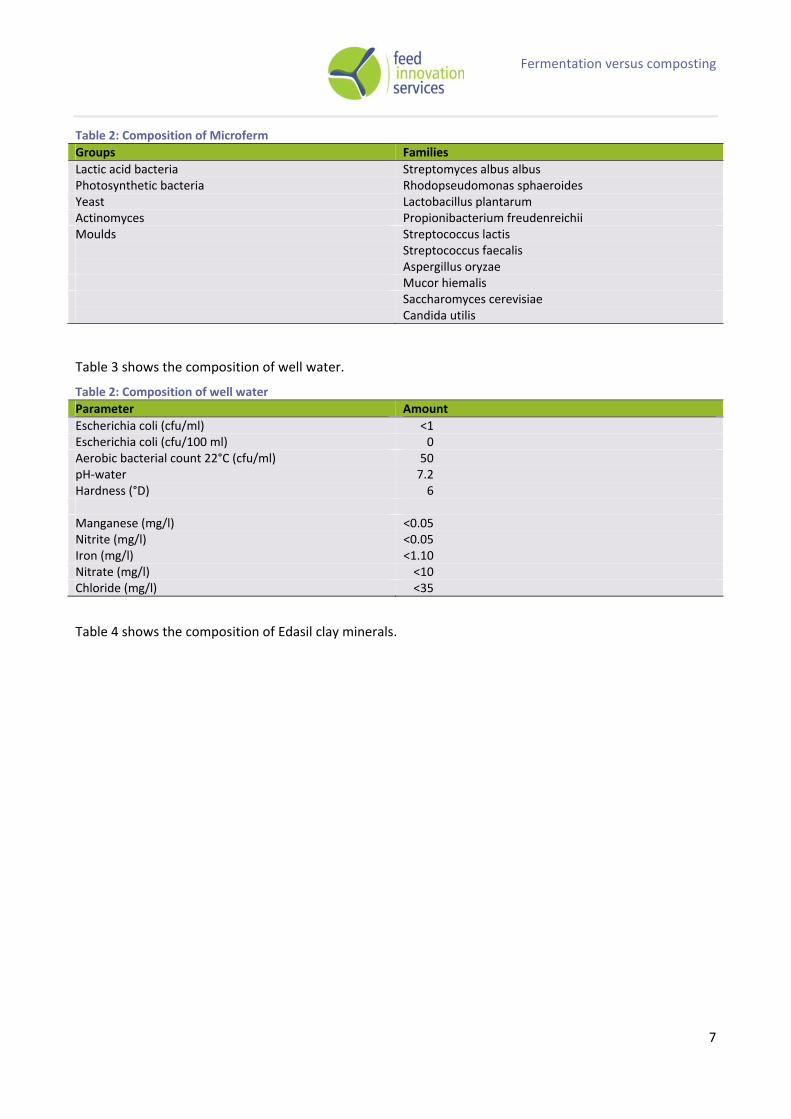
The added additions to the Bokashi windrow comprised Microferm solved in well water, Edasil clay minerals and Ostrea seashell lime. Microferm contains several microorganisms from 5 different groups, 10 different families and 80 species. Table 2 shows the groups and families.
Fermentation versus composting
7
Table 2: Composition of Microferm
Groups Families
Lactic acid bacteria Streptomyces albus albusPhotosynthetic bacteria Rhodopseudomonas sphaeroides Yeast Lactobacillus plantarumActinomyces Propionibacterium freudenreichii Moulds Streptococcus lactis Streptococcus faecalis Aspergillus oryzae Mucor hiemalis Saccharomyces cerevisiae Candida utilis
Table 3 shows the composition of well water.
Table 2: Composition of well water
Parameter Amount
Escherichia coli (cfu/ml) <1Escherichia coli (cfu/100 ml) 0Aerobic bacterial count 22°C (cfu/ml) 50pH‐water 7.2Hardness (°D) 6 Manganese (mg/l) <0.05Nitrite (mg/l) <0.05Iron (mg/l) <1.10Nitrate (mg/l) <10Chloride (mg/l) <35
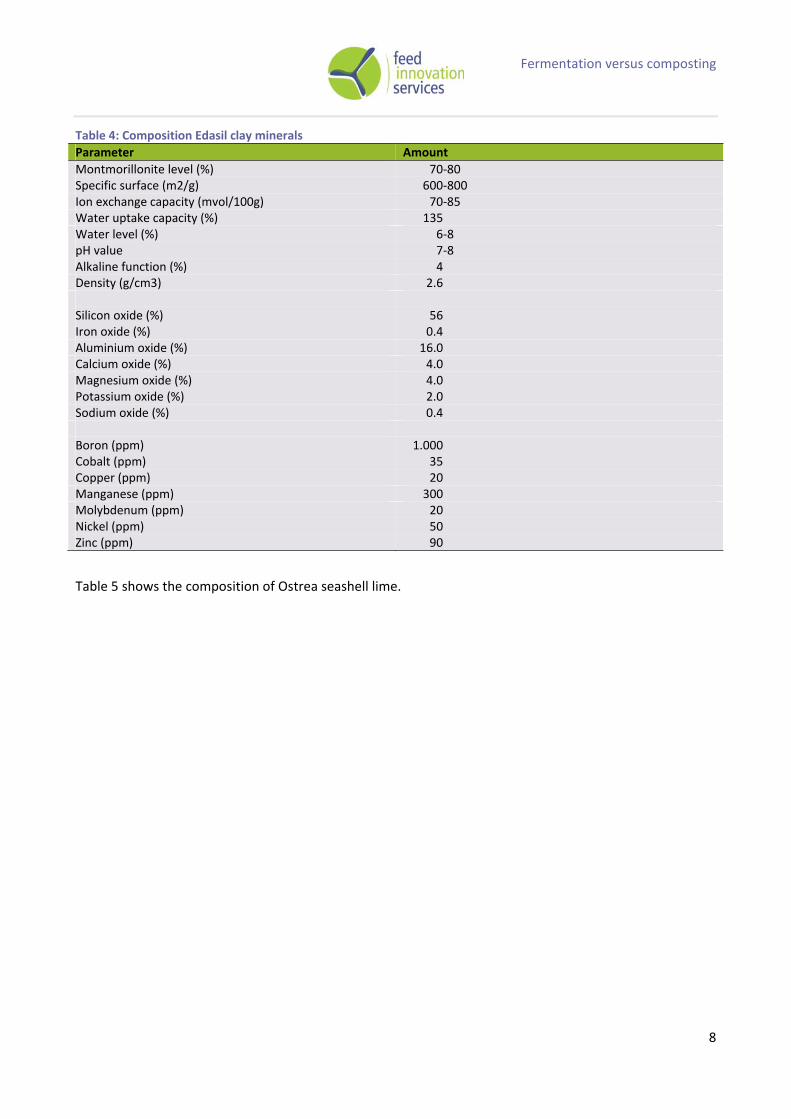
Table 4 shows the composition of Edasil clay minerals.
Fermentation versus composting
8
Table 4: Composition Edasil clay minerals
Parameter Amount
Montmorillonite level (%) 70‐80Specific surface (m2/g) 600‐800Ion exchange capacity (mvol/100g) 70‐85Water uptake capacity (%) 135Water level (%) 6‐8pH value 7‐8Alkaline function (%) 4Density (g/cm3) 2.6 Silicon oxide (%) 56Iron oxide (%) 0.4Aluminium oxide (%) 16.0Calcium oxide (%) 4.0Magnesium oxide (%) 4.0Potassium oxide (%) 2.0Sodium oxide (%) 0.4 Boron (ppm) 1.000Cobalt (ppm) 35Copper (ppm) 20Manganese (ppm) 300Molybdenum (ppm) 20Nickel (ppm) 50Zinc (ppm) 90
Table 5 shows the composition of Ostrea seashell lime.
Fermentation versus composting
9
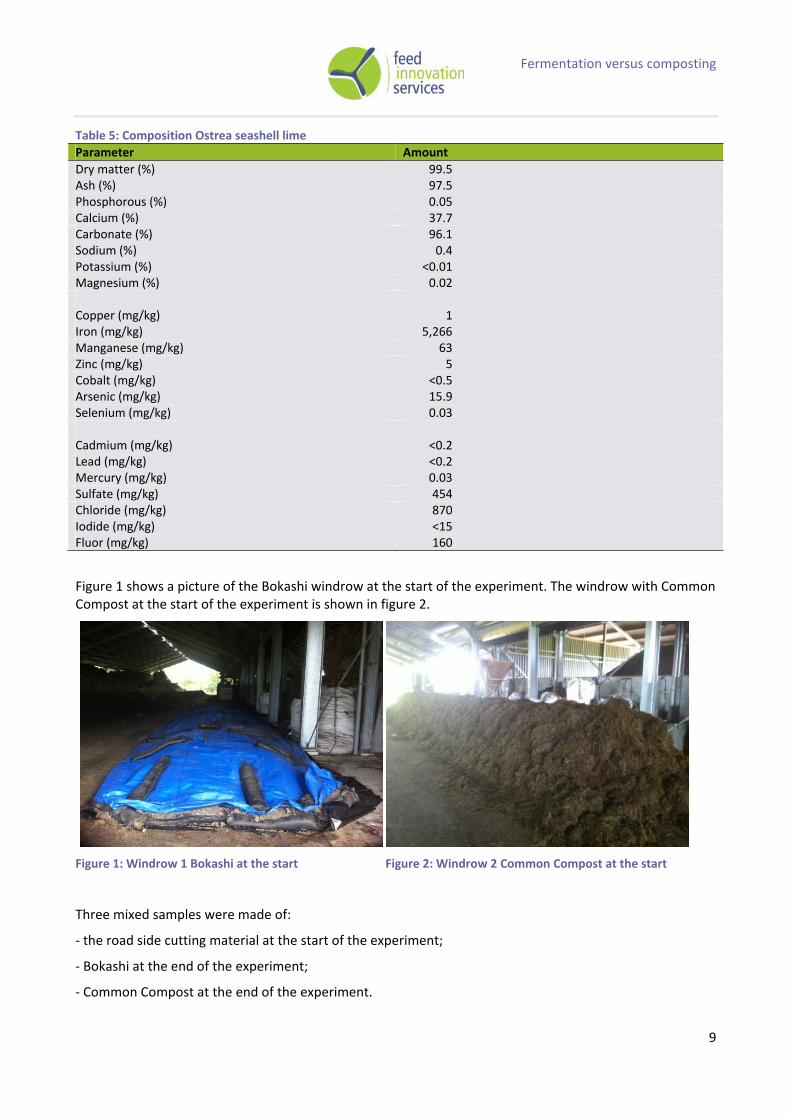
Table 5: Composition Ostrea seashell lime
Parameter Amount
Dry matter (%) 99.5Ash (%) 97.5Phosphorous (%) 0.05Calcium (%) 37.7Carbonate (%) 96.1Sodium (%) 0.4Potassium (%) <0.01Magnesium (%) 0.02 Copper (mg/kg) 1Iron (mg/kg) 5,266Manganese (mg/kg) 63Zinc (mg/kg) 5Cobalt (mg/kg) <0.5Arsenic (mg/kg) 15.9Selenium (mg/kg) 0.03 Cadmium (mg/kg) <0.2Lead (mg/kg) <0.2Mercury (mg/kg) 0.03Sulfate (mg/kg) 454Chloride (mg/kg) 870Iodide (mg/kg) <15Fluor (mg/kg) 160
Figure 1 shows a picture of the Bokashi windrow at the start of the experiment. The windrow with Common Compost at the start of the experiment is shown in figure 2.
Figure 1: Windrow 1 Bokashi at the start Figure 2: Windrow 2 Common Compost at the start
Three mixed samples were made of:
‐ the road side cutting material at the start of the experiment;
‐ Bokashi at the end of the experiment;
‐ Common Compost at the end of the experiment.
Fermentation versus composting
10
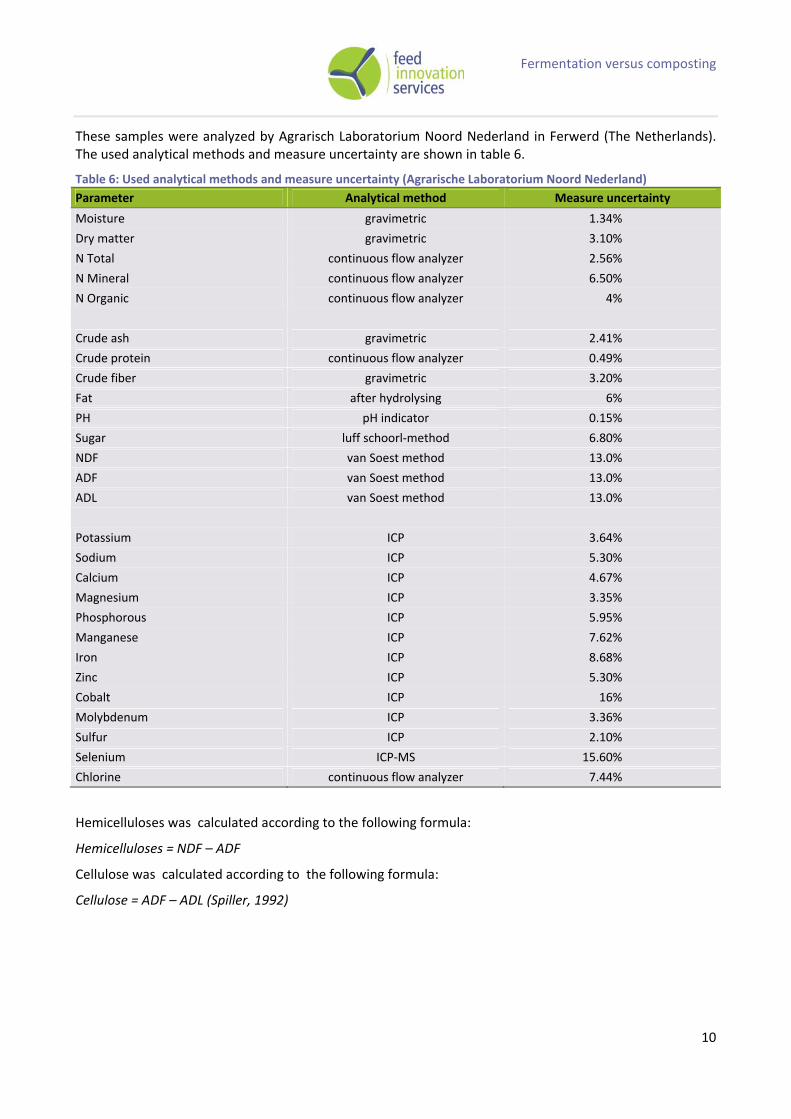
These samples were analyzed by Agrarisch Laboratorium Noord Nederland in Ferwerd (The Netherlands). The used analytical methods and measure uncertainty are shown in table 6.
Table 6: Used analytical methods and measure uncertainty (Agrarische Laboratorium Noord Nederland)
Parameter Analytical method Measure uncertainty
Moisture gravimetric 1.34%
Dry matter gravimetric 3.10%
N Total continuous flow analyzer 2.56%
N Mineral continuous flow analyzer 6.50%
N Organic continuous flow analyzer 4%
Crude ash gravimetric 2.41%
Crude protein continuous flow analyzer 0.49%
Crude fiber gravimetric 3.20%
Fat after hydrolysing 6%
PH pH indicator 0.15%
Sugar luff schoorl‐method 6.80%
NDF van Soest method 13.0%
ADF van Soest method 13.0%
ADL van Soest method 13.0%
Potassium ICP 3.64%
Sodium ICP 5.30%
Calcium ICP 4.67%
Magnesium ICP 3.35%
Phosphorous ICP 5.95%
Manganese ICP 7.62%
Iron ICP 8.68%
Zinc ICP 5.30%
Cobalt ICP 16%
Molybdenum ICP 3.36%
Sulfur ICP 2.10%
Selenium ICP‐MS 15.60%
Chlorine continuous flow analyzer 7.44%
Hemicelluloses was calculated according to the following formula:
Hemicelluloses = NDF – ADF
Cellulose was calculated according to the following formula:
Cellulose = ADF – ADL (Spiller, 1992)
Fermentation versus composting
11
3 Results
3.1 Temperature
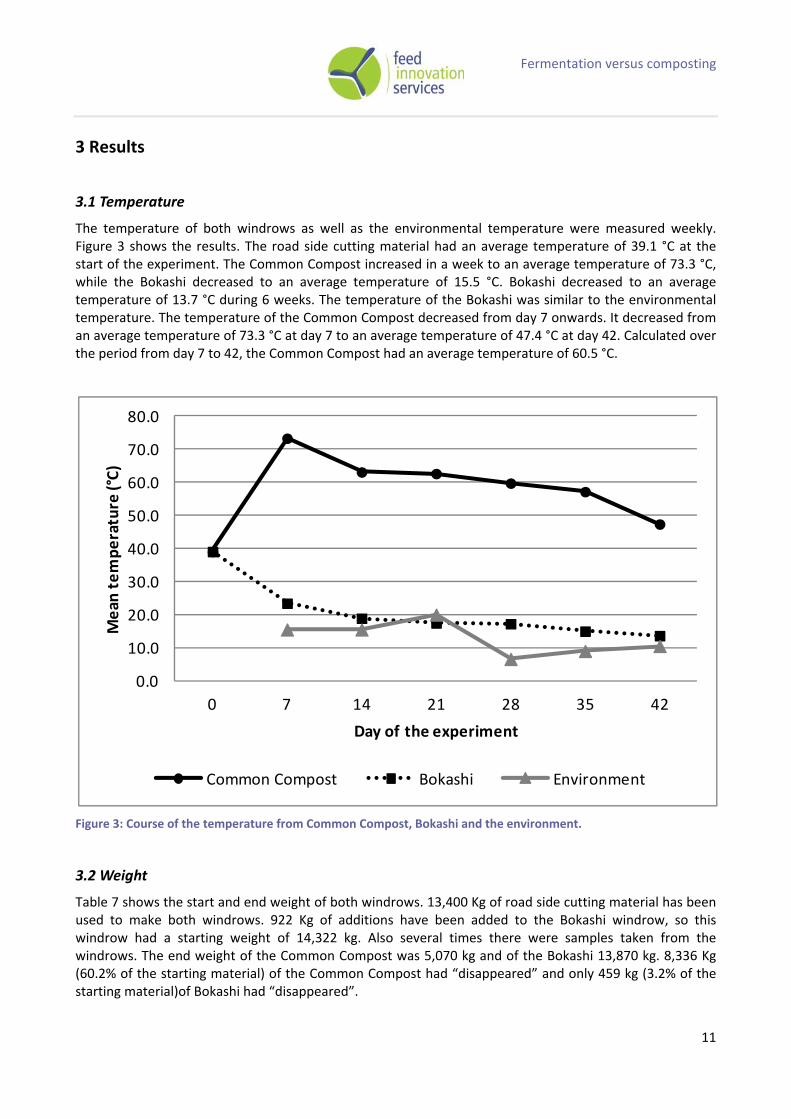
The temperature of both windrows as well as the environmental temperature were measured weekly. Figure 3 shows the results. The road side cutting material had an average temperature of 39.1 °C at the start of the experiment. The Common Compost increased in a week to an average temperature of 73.3 °C, while the Bokashi decreased to an average temperature of 15.5 °C. Bokashi decreased to an average temperature of 13.7 °C during 6 weeks. The temperature of the Bokashi was similar to the environmental temperature. The temperature of the Common Compost decreased from day 7 onwards. It decreased from an average temperature of 73.3 °C at day 7 to an average temperature of 47.4 °C at day 42. Calculated over the period from day 7 to 42, the Common Compost had an average temperature of 60.5 °C.
Figure 3: Course of the temperature from Common Compost, Bokashi and the environment.
3.2 Weight
Table 7 shows the start and end weight of both windrows. 13,400 Kg of road side cutting material has been used to make both windrows. 922 Kg of additions have been added to the Bokashi windrow, so this windrow had a starting weight of 14,322 kg. Also several times there were samples taken from the windrows. The end weight of the Common Compost was 5,070 kg and of the Bokashi 13,870 kg. 8,336 Kg (60.2% of the starting material) of the Common Compost had “disappeared” and only 459 kg (3.2% of the starting material)of Bokashi had “disappeared”.
0.0
10.0
20.0
30.0
40.0
50.0
60.0
70.0
80.0
0 7 14 21 28 35 42
Mean
temperature (°C)
Day of the experiment
Common Compost Bokashi Environment
Fermentation versus composting
12
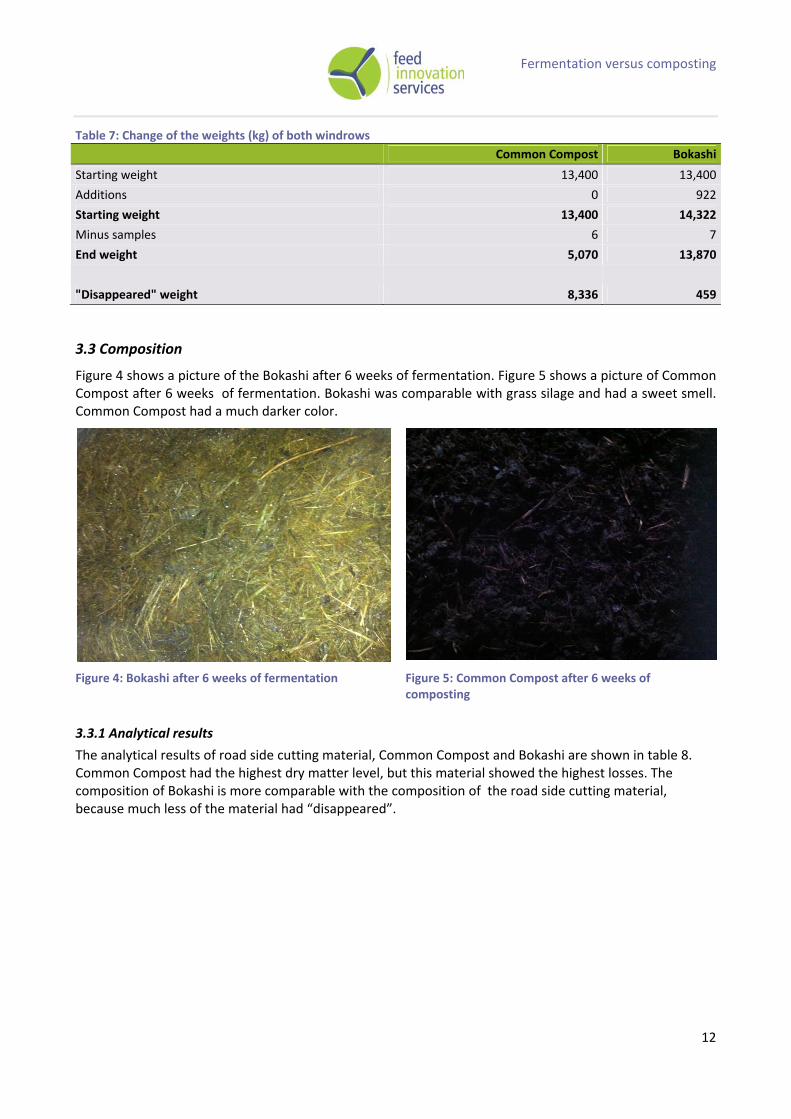
Table 7: Change of the weights (kg) of both windrows
Common Compost Bokashi
Starting weight 13,400 13,400
Additions 0 922
Starting weight 13,400 14,322
Minus samples 6 7
End weight 5,070 13,870
"Disappeared" weight 8,336 459
3.3 Composition
Figure 4 shows a picture of the Bokashi after 6 weeks of fermentation. Figure 5 shows a picture of Common Compost after 6 weeks of fermentation. Bokashi was comparable with grass silage and had a sweet smell. Common Compost had a much darker color.
Figure 4: Bokashi after 6 weeks of fermentation Figure 5: Common Compost after 6 weeks of composting
3.3.1 Analytical results
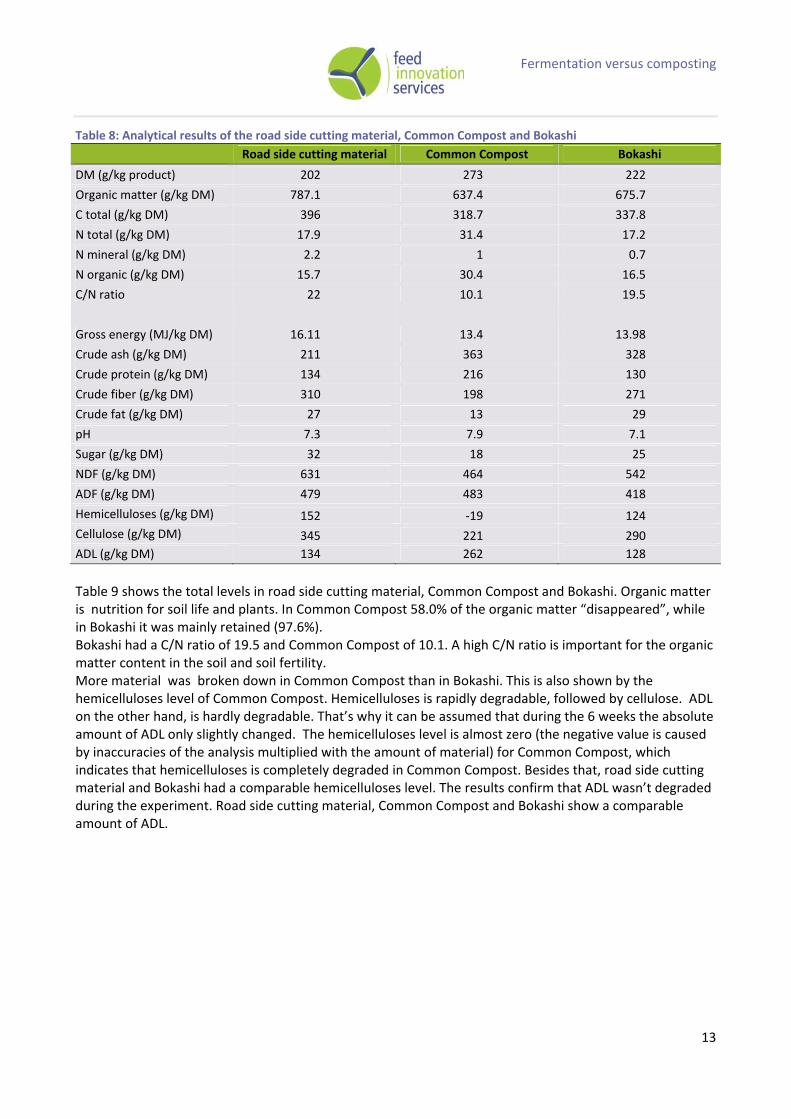
The analytical results of road side cutting material, Common Compost and Bokashi are shown in table 8. Common Compost had the highest dry matter level, but this material showed the highest losses. The composition of Bokashi is more comparable with the composition of the road side cutting material, because much less of the material had “disappeared”.
Fermentation versus composting
13
Table 8: Analytical results of the road side cutting material, Common Compost and Bokashi
Road side cutting material Common Compost Bokashi
DM (g/kg product) 202 273 222
Organic matter (g/kg DM) 787.1 637.4 675.7
C total (g/kg DM) 396 318.7 337.8
N total (g/kg DM) 17.9 31.4 17.2
N mineral (g/kg DM) 2.2 1 0.7
N organic (g/kg DM) 15.7 30.4 16.5
C/N ratio 22 10.1 19.5
Gross energy (MJ/kg DM) 16.11 13.4 13.98
Crude ash (g/kg DM) 211 363 328
Crude protein (g/kg DM) 134 216 130
Crude fiber (g/kg DM) 310 198 271
Crude fat (g/kg DM) 27 13 29
pH 7.3 7.9 7.1
Sugar (g/kg DM) 32 18 25
NDF (g/kg DM) 631 464 542
ADF (g/kg DM) 479 483 418
Hemicelluloses (g/kg DM) 152 ‐19 124
Cellulose (g/kg DM) 345 221 290
ADL (g/kg DM) 134 262 128
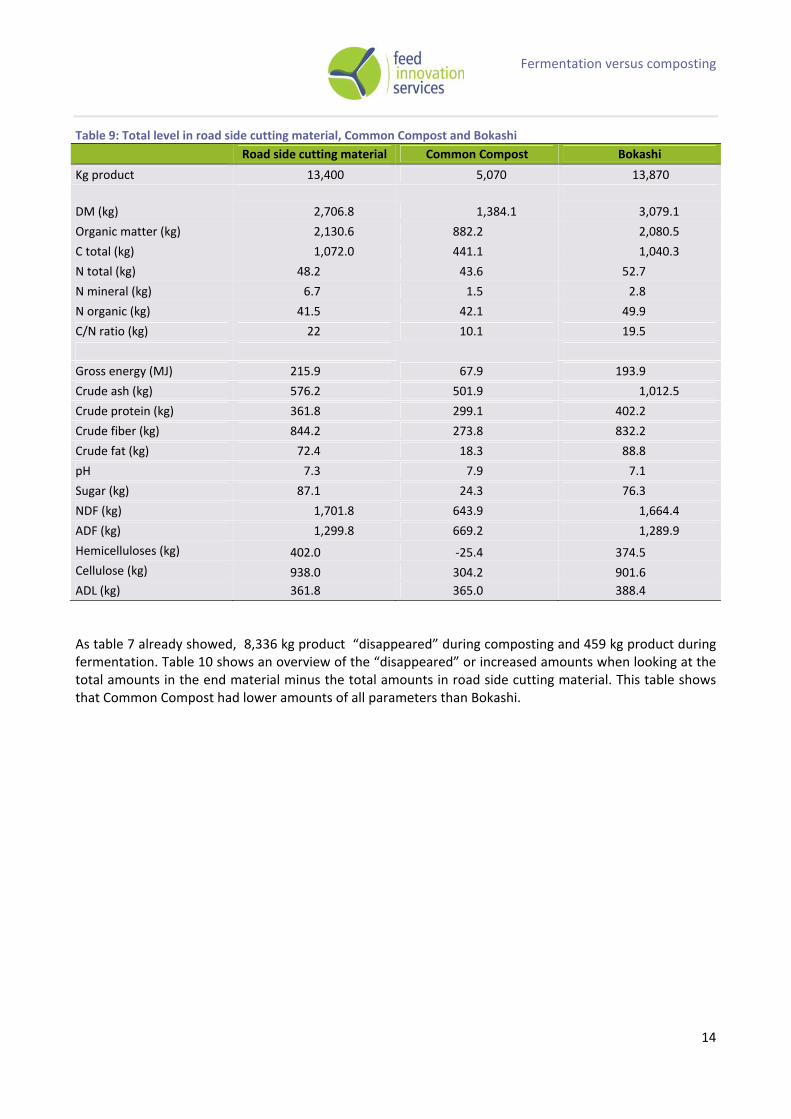
Table 9 shows the total levels in road side cutting material, Common Compost and Bokashi. Organic matter is nutrition for soil life and plants. In Common Compost 58.0% of the organic matter “disappeared”, while in Bokashi it was mainly retained (97.6%). Bokashi had a C/N ratio of 19.5 and Common Compost of 10.1. A high C/N ratio is important for the organic matter content in the soil and soil fertility. More material was broken down in Common Compost than in Bokashi. This is also shown by the hemicelluloses level of Common Compost. Hemicelluloses is rapidly degradable, followed by cellulose. ADL on the other hand, is hardly degradable. That’s why it can be assumed that during the 6 weeks the absolute amount of ADL only slightly changed. The hemicelluloses level is almost zero (the negative value is caused by inaccuracies of the analysis multiplied with the amount of material) for Common Compost, which indicates that hemicelluloses is completely degraded in Common Compost. Besides that, road side cutting material and Bokashi had a comparable hemicelluloses level. The results confirm that ADL wasn’t degraded during the experiment. Road side cutting material, Common Compost and Bokashi show a comparable amount of ADL.
Fermentation versus composting
14
Table 9: Total level in road side cutting material, Common Compost and Bokashi
Road side cutting material Common Compost Bokashi
Kg product 13,400 5,070 13,870
DM (kg) 2,706.8 1,384.1 3,079.1
Organic matter (kg) 2,130.6 882.2 2,080.5
C total (kg) 1,072.0 441.1 1,040.3
N total (kg) 48.2 43.6 52.7
N mineral (kg) 6.7 1.5 2.8
N organic (kg) 41.5 42.1 49.9
C/N ratio (kg) 22 10.1 19.5
Gross energy (MJ) 215.9 67.9 193.9
Crude ash (kg) 576.2 501.9 1,012.5
Crude protein (kg) 361.8 299.1 402.2
Crude fiber (kg) 844.2 273.8 832.2
Crude fat (kg) 72.4 18.3 88.8
pH 7.3 7.9 7.1
Sugar (kg) 87.1 24.3 76.3
NDF (kg) 1,701.8 643.9 1,664.4
ADF (kg) 1,299.8 669.2 1,289.9
Hemicelluloses (kg) 402.0 ‐25.4 374.5
Cellulose (kg) 938.0 304.2 901.6
ADL (kg) 361.8 365.0 388.4
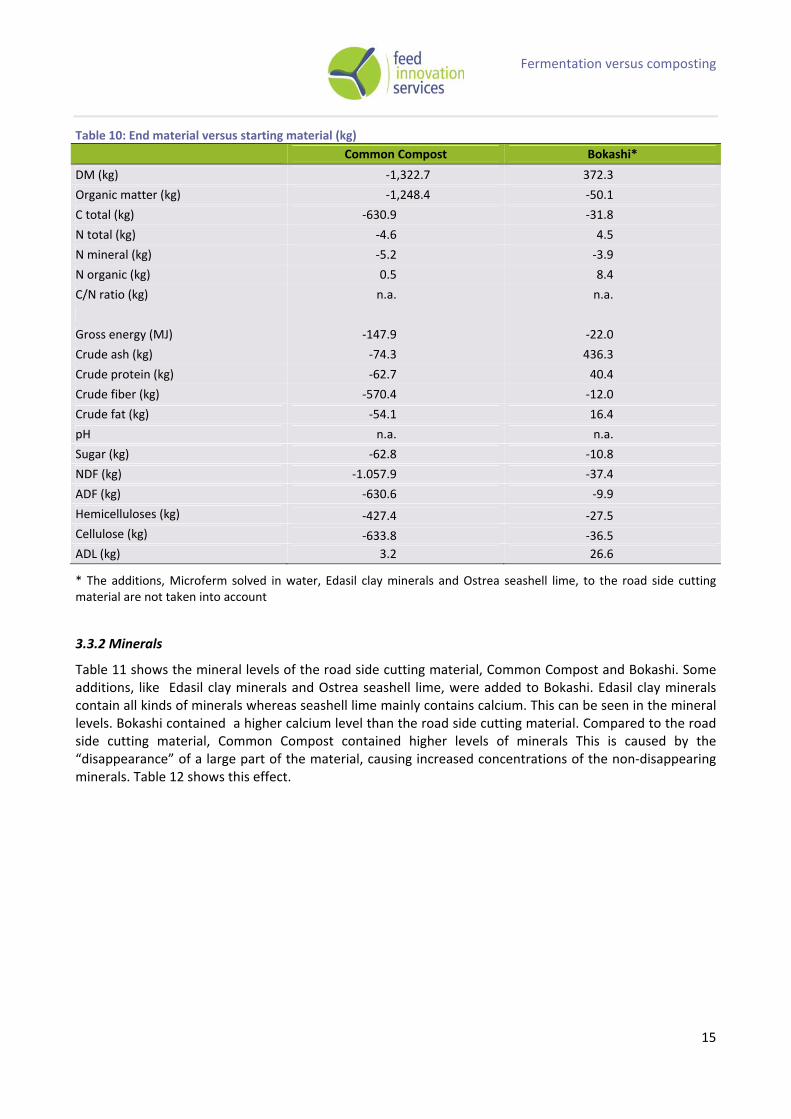
As table 7 already showed, 8,336 kg product “disappeared” during composting and 459 kg product during fermentation. Table 10 shows an overview of the “disappeared” or increased amounts when looking at the total amounts in the end material minus the total amounts in road side cutting material. This table shows that Common Compost had lower amounts of all parameters than Bokashi.
Fermentation versus composting
15
Table 10: End material versus starting material (kg)
Common Compost Bokashi*
DM (kg) ‐1,322.7 372.3
Organic matter (kg) ‐1,248.4 ‐50.1
C total (kg) ‐630.9 ‐31.8
N total (kg) ‐4.6 4.5
N mineral (kg) ‐5.2 ‐3.9
N organic (kg) 0.5 8.4
C/N ratio (kg) n.a. n.a.
Gross energy (MJ) ‐147.9 ‐22.0
Crude ash (kg) ‐74.3 436.3
Crude protein (kg) ‐62.7 40.4
Crude fiber (kg) ‐570.4 ‐12.0
Crude fat (kg) ‐54.1 16.4
pH n.a. n.a.
Sugar (kg) ‐62.8 ‐10.8
NDF (kg) ‐1.057.9 ‐37.4
ADF (kg) ‐630.6 ‐9.9
Hemicelluloses (kg) ‐427.4 ‐27.5
Cellulose (kg) ‐633.8 ‐36.5
ADL (kg) 3.2 26.6
* The additions, Microferm solved in water, Edasil clay minerals and Ostrea seashell lime, to the road side cutting material are not taken into account
3.3.2 Minerals
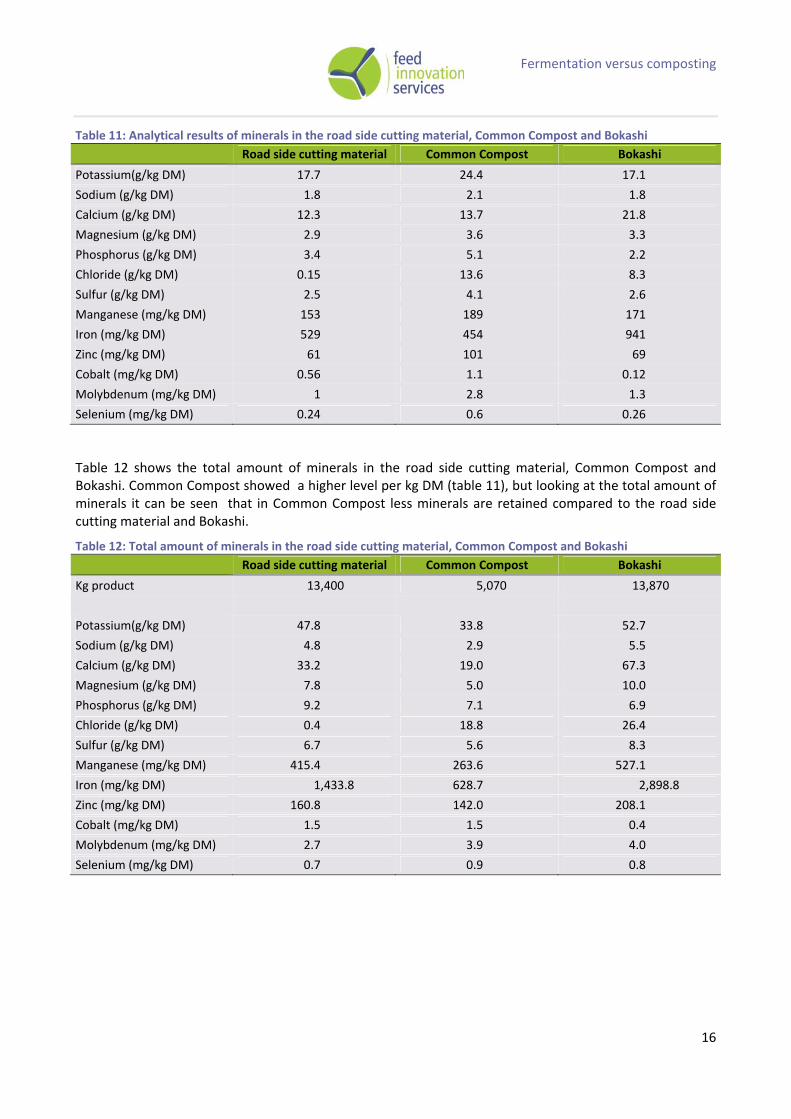
Table 11 shows the mineral levels of the road side cutting material, Common Compost and Bokashi. Some additions, like Edasil clay minerals and Ostrea seashell lime, were added to Bokashi. Edasil clay minerals contain all kinds of minerals whereas seashell lime mainly contains calcium. This can be seen in the mineral levels. Bokashi contained a higher calcium level than the road side cutting material. Compared to the road side cutting material, Common Compost contained higher levels of minerals This is caused by the “disappearance” of a large part of the material, causing increased concentrations of the non‐disappearing minerals. Table 12 shows this effect.
Fermentation versus composting
16
Table 11: Analytical results of minerals in the road side cutting material, Common Compost and Bokashi
Road side cutting material Common Compost Bokashi
Potassium(g/kg DM) 17.7 24.4 17.1
Sodium (g/kg DM) 1.8 2.1 1.8
Calcium (g/kg DM) 12.3 13.7 21.8
Magnesium (g/kg DM) 2.9 3.6 3.3
Phosphorus (g/kg DM) 3.4 5.1 2.2
Chloride (g/kg DM) 0.15 13.6 8.3
Sulfur (g/kg DM) 2.5 4.1 2.6
Manganese (mg/kg DM) 153 189 171
Iron (mg/kg DM) 529 454 941
Zinc (mg/kg DM) 61 101 69
Cobalt (mg/kg DM) 0.56 1.1 0.12
Molybdenum (mg/kg DM) 1 2.8 1.3
Selenium (mg/kg DM) 0.24 0.6 0.26
Table 12 shows the total amount of minerals in the road side cutting material, Common Compost and Bokashi. Common Compost showed a higher level per kg DM (table 11), but looking at the total amount of minerals it can be seen that in Common Compost less minerals are retained compared to the road side cutting material and Bokashi.
Table 12: Total amount of minerals in the road side cutting material, Common Compost and Bokashi
Road side cutting material Common Compost Bokashi
Kg product 13,400 5,070 13,870
Potassium(g/kg DM) 47.8 33.8 52.7
Sodium (g/kg DM) 4.8 2.9 5.5
Calcium (g/kg DM) 33.2 19.0 67.3
Magnesium (g/kg DM) 7.8 5.0 10.0
Phosphorus (g/kg DM) 9.2 7.1 6.9
Chloride (g/kg DM) 0.4 18.8 26.4
Sulfur (g/kg DM) 6.7 5.6 8.3
Manganese (mg/kg DM) 415.4 263.6 527.1
Iron (mg/kg DM) 1,433.8 628.7 2,898.8
Zinc (mg/kg DM) 160.8 142.0 208.1
Cobalt (mg/kg DM) 1.5 1.5 0.4
Molybdenum (mg/kg DM) 2.7 3.9 4.0
Selenium (mg/kg DM) 0.7 0.9 0.8
Fermentation versus composting
17
3.4 CO2‐foot print
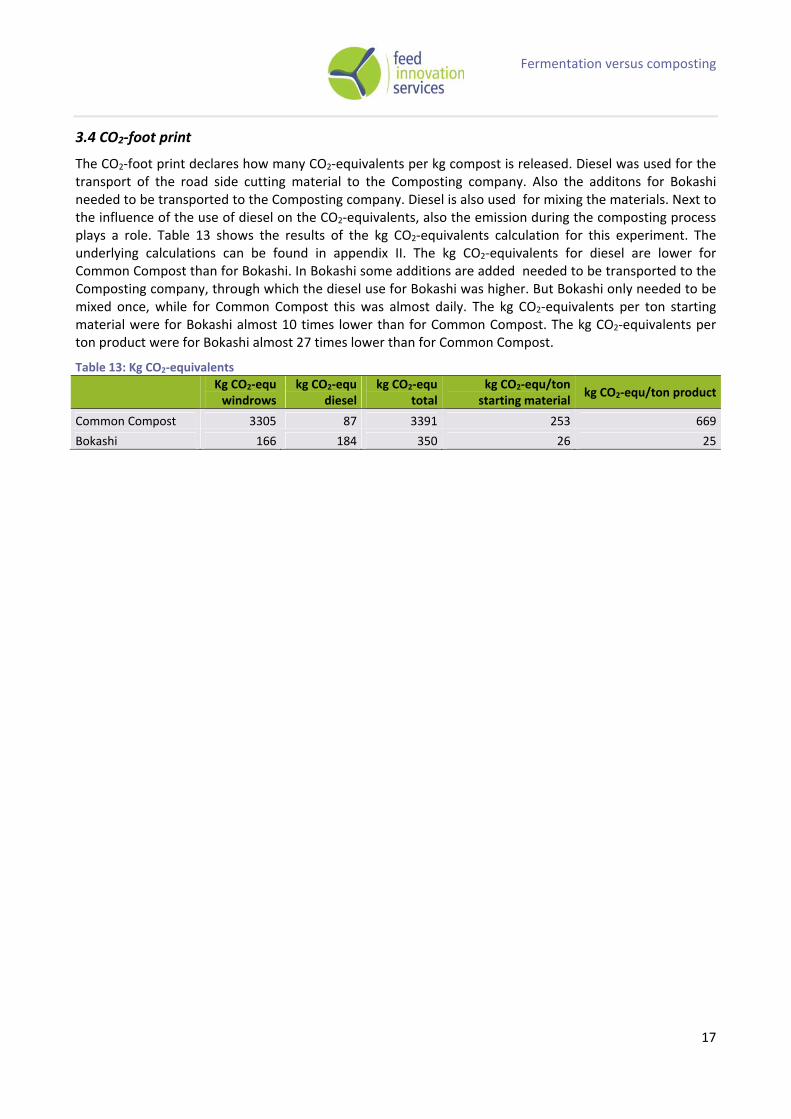
The CO2‐foot print declares how many CO2‐equivalents per kg compost is released. Diesel was used for the transport of the road side cutting material to the Composting company. Also the additons for Bokashi needed to be transported to the Composting company. Diesel is also used for mixing the materials. Next to the influence of the use of diesel on the CO2‐equivalents, also the emission during the composting process plays a role. Table 13 shows the results of the kg CO2‐equivalents calculation for this experiment. The underlying calculations can be found in appendix II. The kg CO2‐equivalents for diesel are lower for Common Compost than for Bokashi. In Bokashi some additions are added needed to be transported to the Composting company, through which the diesel use for Bokashi was higher. But Bokashi only needed to be mixed once, while for Common Compost this was almost daily. The kg CO2‐equivalents per ton starting material were for Bokashi almost 10 times lower than for Common Compost. The kg CO2‐equivalents per ton product were for Bokashi almost 27 times lower than for Common Compost.
Table 13: Kg CO2‐equivalents
Kg CO2‐equ windrows
kg CO2‐equ diesel
kg CO2‐equ total
kg CO2‐equ/ton starting material
kg CO2‐equ/ton product
Common Compost 3305 87 3391 253 669
Bokashi 166 184 350 26 25
Fermentation versus composting
18
4 Discussion
The temperature increased during composting. Through this, “combusting” took place and material “disappeared”. 62.2% Of the material of the Common Compost “disappeared” and 3.2% of Bokashi. The temperature didn’t increase during fermentation. The high temperatures of Common Compost has the advantage that weed seeds lose their germination capacity. Weed seeds lose their germination capacity at a temperature of more than 50°C. Common Compost had an average temperature of 60.5°C. Practical experiments of Agriton using the Bokashi method, showed that fertilizing with Bokashi did not lead to weed in the land or garden. Probably the weed seeds germinate during the Bokashi process, but die through a lack of light. This could be investigated in an additional small experiment by adding seeds to the starting material and checking the condition of the seeds after the process.
Both windrows were laying in a barn on a concrete floor. This means that no rain from the sky or organisms from the soil could enter the windrows. It was, however, possible that water ran out of the windrows. Herewith, water soluble minerals, like potassium and sodium, could also disappear.
Cell‐wall proteins and pectins also play a role in calculating hemicelluloses and cellulose. For the calculation it is assumed that the effect of cell‐wall proteins and pectins are negligible.
Table 10 shows an overview of the “disappeared” or increased levels in both windrows compared to the starting material. Only the road cutting material is included in the calculation of the end material of Bokashi minus the starting material. The additions, Microferm solved in water, Edasil clay minerals and Ostrea seashell lime, also belong to the starting material, but aren’t included in the calculation. Microferm solved in water influences especially the fermentation. Edasil clay minerals contain especially clay minerals which influenced the mineral composition of the end material. Ostrea seashell lime is mainly a calcium source and influences the calcium level. This can be found back in the analytical results. Bokashi contains a higher calcium level than the road side cutting material.
Several assumptions are made for the calculation of the CO2‐foot print. This calculation resulted in an estimation of the CO2‐foot print. The CO2 emission for Bokashi is per ton of end product considerably lower than for Common Compost. The biggest part of the difference is caused by the huge difference in losses, respectively 3.2% and 62.2%, for Bokashi and Common Compost.
Fermentation gives a valuable product according to the results; hardly any energy losses take place. Herewith, the availability of the nutrients for plants hasn’t been taken in account. This point needs further research.
Fermentation versus composting
19
5 Conclusions
Fermentation has several advantages compared to composting according to this experiment:
Nutrients were more retained by fermentation of the (waste) materials than by composting these
materials.
Fermentation didn’t need extra processing during the process, while compost needed to be mixed
regularly.
Fermentation took place with a comparable temperature as the environment, while compost had
an average temperature of 60.5°C.
3.2% of the starting material “disappeared” during fermentation, while 60.2% “disappeared” during
composting.
A large part of the organic matter degraded and disappeared (under influence of the strong
aeration) with the traditional way of composting, while 97.6% of the organic matter was retained
with the Bokashi method. The organic matter is good for the soil life and eventually for the crops.
The Bokashi method had a considerably lower CO2‐foot print than Common Compost.
The effects of Bokashi on plant growth after addition to the soil needs to be further investigated.
Fermentation versus composting
20
Literature
Boldrin, A., J.K. Andersen, J. Møller, T.H. Christensen & E. Favoino. 2009. Composting and compost utilization: accounting of greenhouse gases and global warming contributions. Waste Management & Research. 27: 800‐812.
Dekker, P.H.M., M. van Zeeland & J.G.M. Paauw. 2010. Levenscyclusanalyse groencompost. Praktijkonderzoek Plant & Omgeving, Business‐unit Akkernouw, Groene Ruimte en Vollegrondsgroente. PPO nr. 3250109709.
Mombarg, H.F.M., A. Kool, W.J. Corré, J.W.A. Langeveld & W. Sukkel. 2003. De telen met toekomst energie‐ en klimaatmeetlat. Plant Research International, Wageningen.
Spiller, G.A. 1992. CRC Handbook of Dietary fiber in human nutrition 2nd edition.
Fermentation versus composting
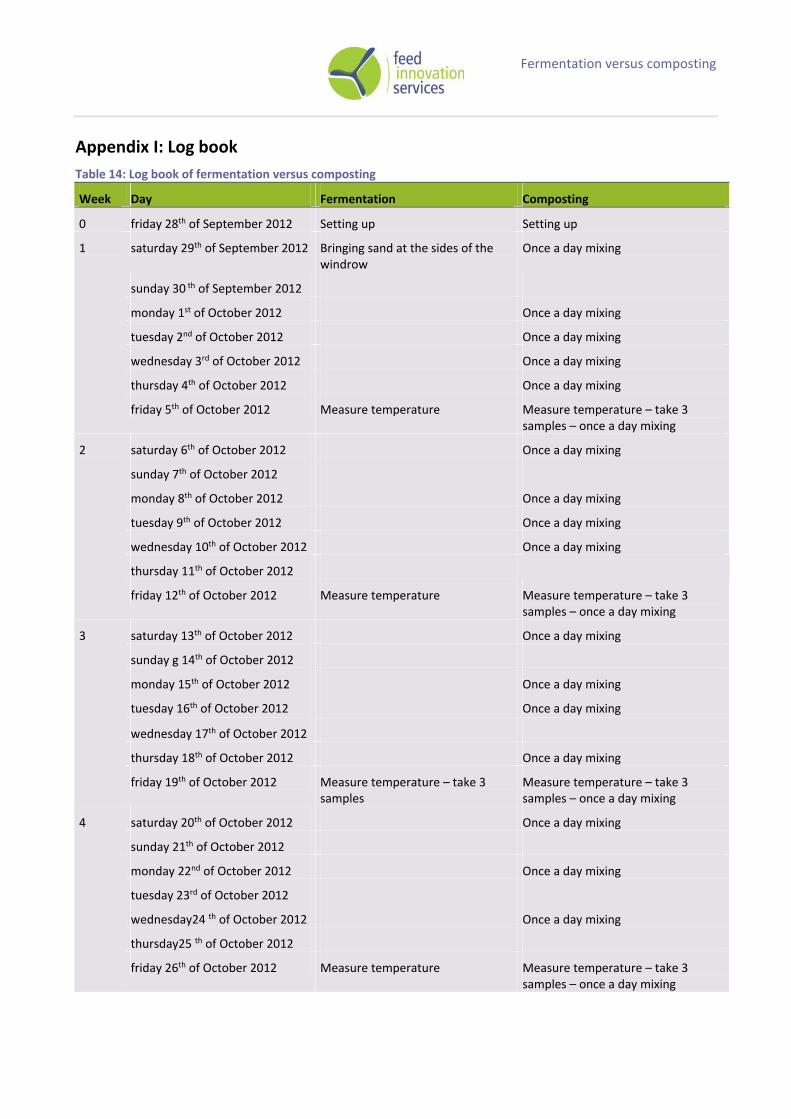
Appendix I: Log book
Table 14: Log book of fermentation versus composting
Week Day Fermentation Composting
0 friday 28th of September 2012 Setting up Setting up
1 saturday 29th of September 2012 Bringing sand at the sides of the windrow
Once a day mixing
sunday 30 th of September 2012
monday 1st of October 2012 Once a day mixing
tuesday 2nd of October 2012 Once a day mixing
wednesday 3rd of October 2012 Once a day mixing
thursday 4th of October 2012 Once a day mixing
friday 5th of October 2012 Measure temperature Measure temperature – take 3 samples – once a day mixing
2 saturday 6th of October 2012 Once a day mixing
sunday 7th of October 2012
monday 8th of October 2012 Once a day mixing
tuesday 9th of October 2012 Once a day mixing
wednesday 10th of October 2012 Once a day mixing
thursday 11th of October 2012
friday 12th of October 2012 Measure temperature Measure temperature – take 3 samples – once a day mixing
3 saturday 13th of October 2012 Once a day mixing
sunday g 14th of October 2012
monday 15th of October 2012 Once a day mixing
tuesday 16th of October 2012 Once a day mixing
wednesday 17th of October 2012
thursday 18th of October 2012 Once a day mixing
friday 19th of October 2012 Measure temperature – take 3 samples
Measure temperature – take 3 samples – once a day mixing
4 saturday 20th of October 2012 Once a day mixing
sunday 21th of October 2012
monday 22nd of October 2012 Once a day mixing
tuesday 23rd of October 2012
wednesday24 th of October 2012 Once a day mixing
thursday25 th of October 2012
friday 26th of October 2012 Measure temperature Measure temperature – take 3 samples – once a day mixing
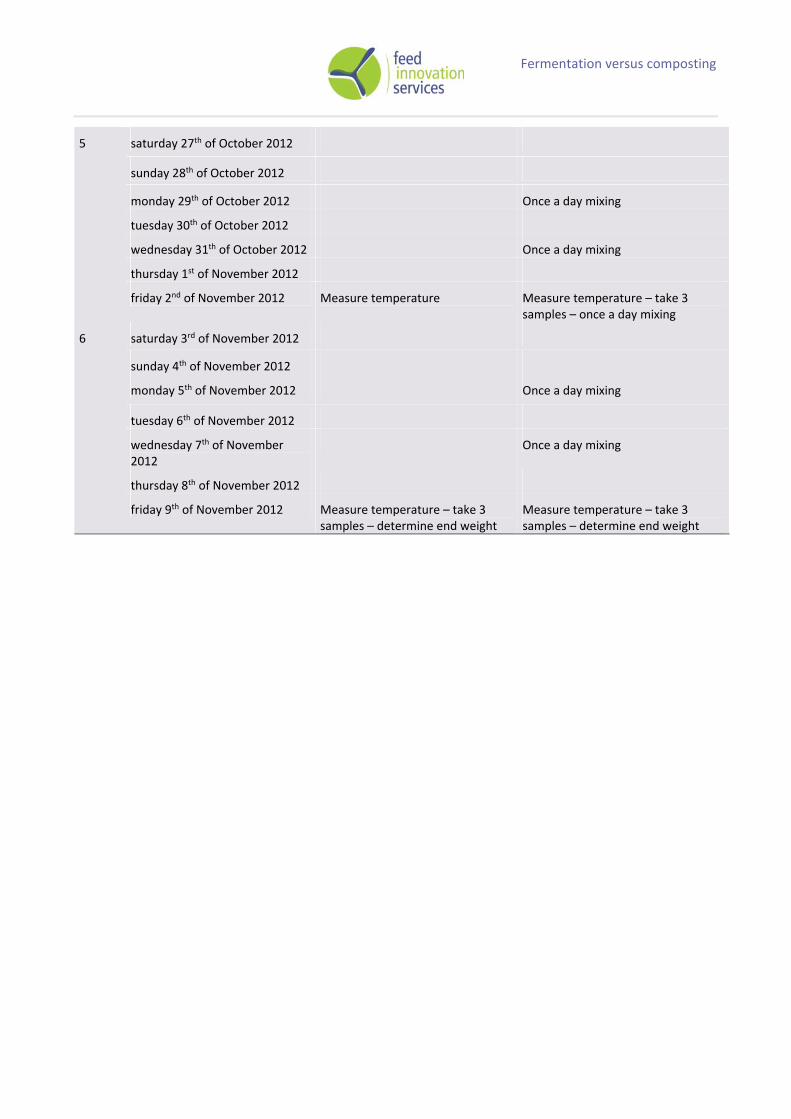
Fermentation versus composting
5 saturday 27th of October 2012
sunday 28th of October 2012
monday 29th of October 2012 Once a day mixing
tuesday 30th of October 2012
wednesday 31th of October 2012 Once a day mixing
thursday 1st of November 2012
friday 2nd of November 2012 Measure temperature Measure temperature – take 3 samples – once a day mixing
6 saturday 3rd of November 2012
sunday 4th of November 2012
monday 5th of November 2012 Once a day mixing
tuesday 6th of November 2012
wednesday 7th of November 2012
Once a day mixing
thursday 8th of November 2012
friday 9th of November 2012 Measure temperature – take 3 samples – determine end weight
Measure temperature – take 3 samples – determine end weight
Fermentation versus composting
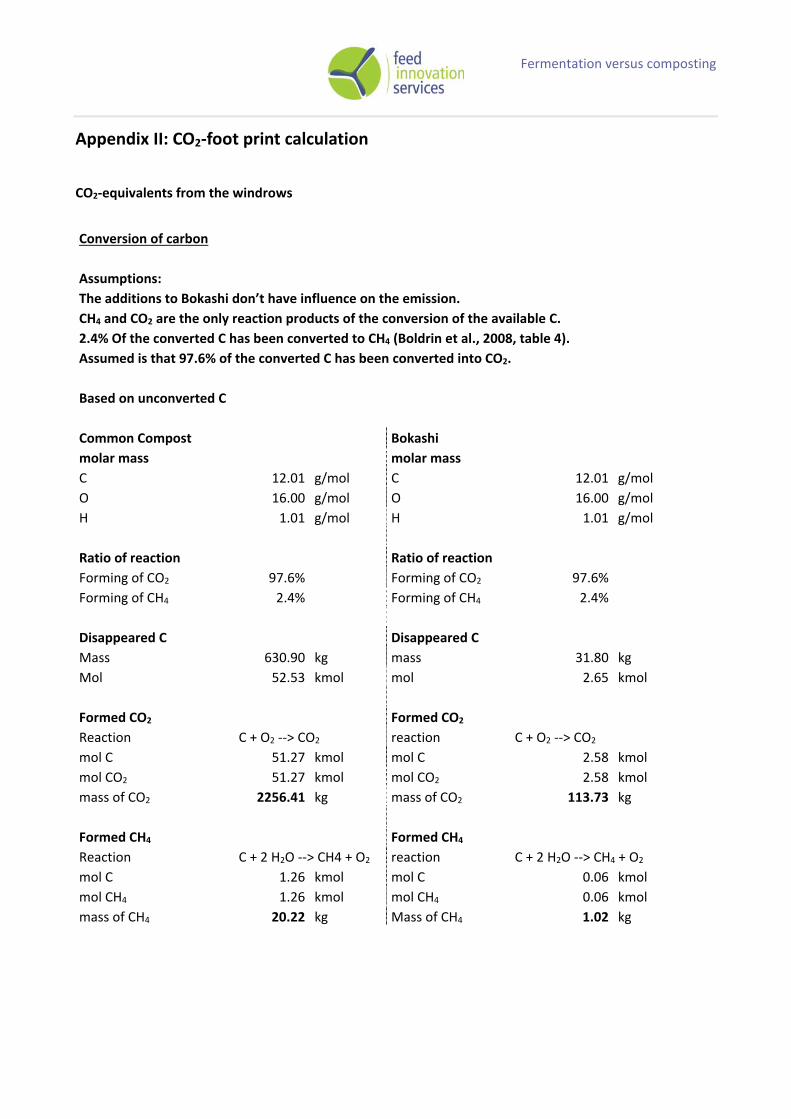
Appendix II: CO2‐foot print calculation
CO2‐equivalents from the windrows
Conversion of carbon
Assumptions:
The additions to Bokashi don’t have influence on the emission.
CH4 and CO2 are the only reaction products of the conversion of the available C.
2.4% Of the converted C has been converted to CH4 (Boldrin et al., 2008, table 4).
Assumed is that 97.6% of the converted C has been converted into CO2.
Based on unconverted C
Common Compost Bokashi
molar mass molar mass
C 12.01 g/mol C 12.01 g/mol
O 16.00 g/mol O 16.00 g/mol
H 1.01 g/mol H 1.01 g/mol
Ratio of reaction Ratio of reaction
Forming of CO2 97.6% Forming of CO2 97.6%
Forming of CH4 2.4% Forming of CH4 2.4%
Disappeared C Disappeared C
Mass 630.90 kg mass 31.80 kg
Mol 52.53 kmol mol 2.65 kmol
Formed CO2 Formed CO2
Reaction C + O2 ‐‐> CO2 reaction C + O2 ‐‐> CO2
mol C 51.27 kmol mol C 2.58 kmol
mol CO2 51.27 kmol mol CO2 2.58 kmol
mass of CO2 2256.41 kg mass of CO2 113.73 kg
Formed CH4 Formed CH4
Reaction C + 2 H2O ‐‐> CH4 + O2 reaction C + 2 H2O ‐‐> CH4 + O2
mol C 1.26 kmol mol C 0.06 kmol
mol CH4 1.26 kmol mol CH4 0.06 kmol
mass of CH4 20.22 kg Mass of CH4 1.02 kg
Fermentation versus composting
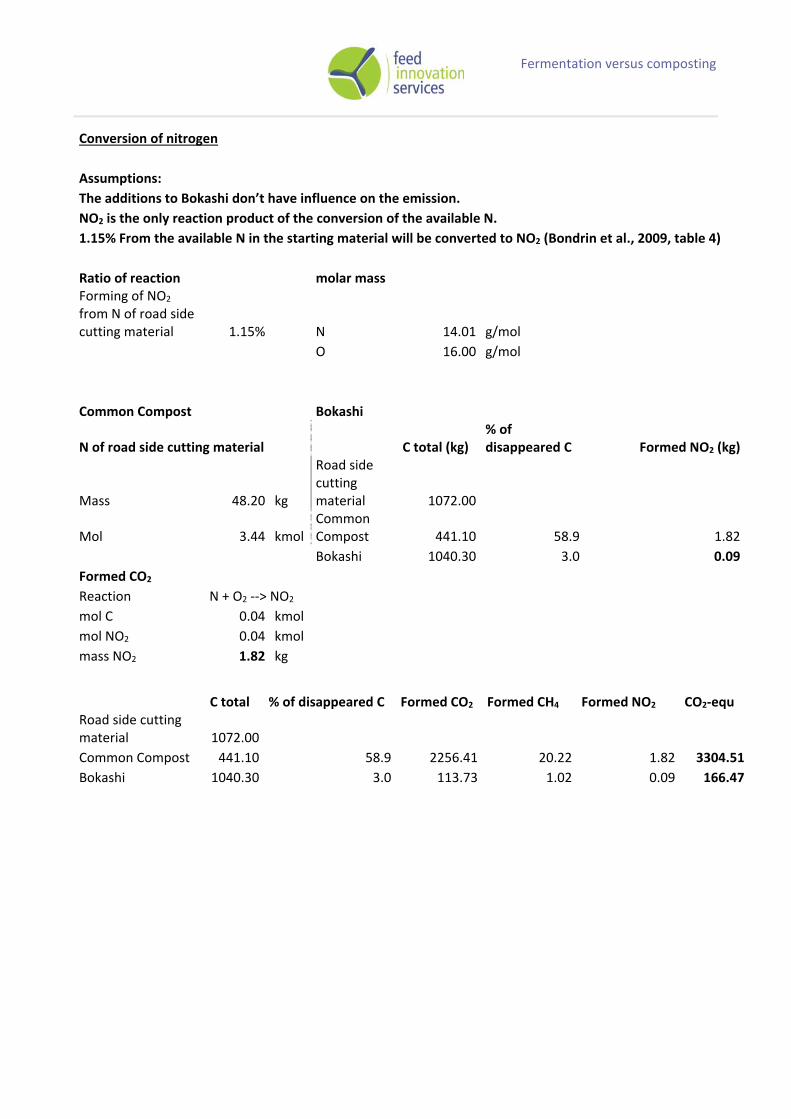
Conversion of nitrogen
Assumptions:
The additions to Bokashi don’t have influence on the emission.
NO2 is the only reaction product of the conversion of the available N.
1.15% From the available N in the starting material will be converted to NO2 (Bondrin et al., 2009, table 4)
Ratio of reaction molar mass Forming of NO2 from N of road side cutting material 1.15% N 14.01 g/mol
O 16.00 g/mol
Common Compost Bokashi
N of road side cutting material C total (kg) % of disappeared C Formed NO2 (kg)
Mass 48.20 kg
Road side cutting material 1072.00
Mol 3.44 kmol Common Compost 441.10 58.9 1.82
Bokashi 1040.30 3.0 0.09
Formed CO2
Reaction N + O2 ‐‐> NO2
mol C 0.04 kmol
mol NO2 0.04 kmol
mass NO2 1.82 kg
C total % of disappeared C Formed CO2 Formed CH4 Formed NO2 CO2‐equ Road side cutting material 1072.00
Common Compost 441.10 58.9 2256.41 20.22 1.82 3304.51
Bokashi 1040.30 3.0 113.73 1.02 0.09 166.47
Fermentation versus composting
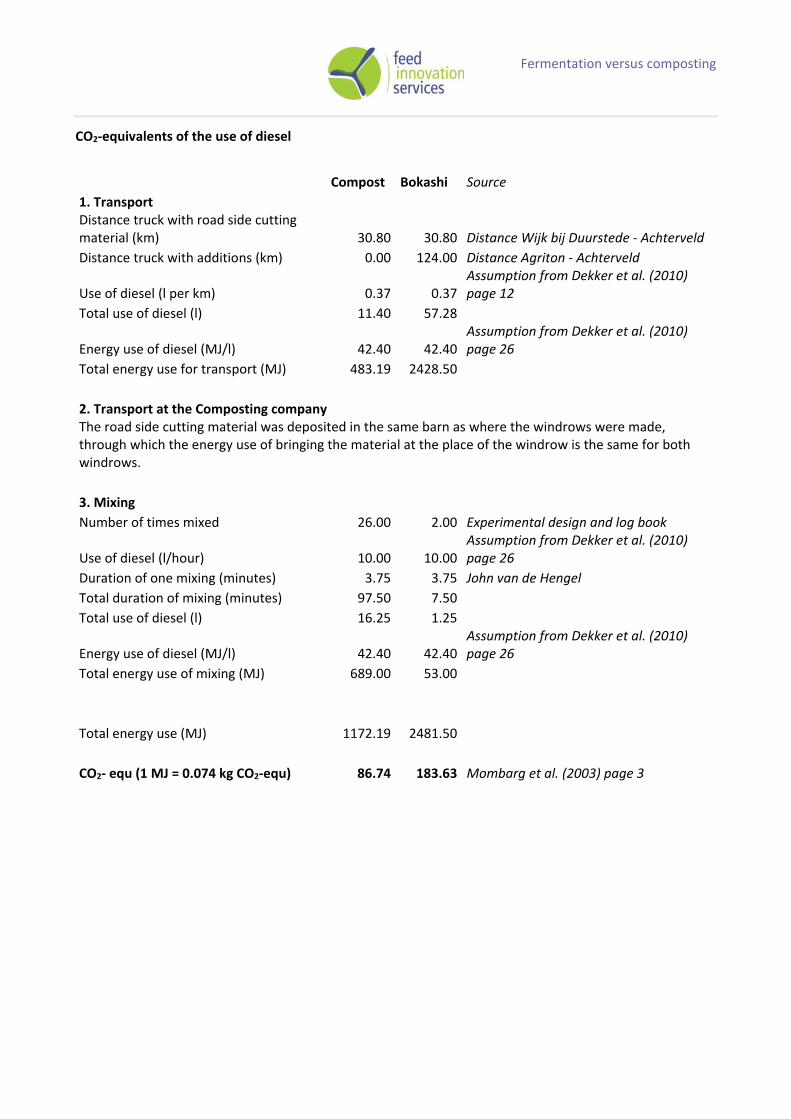
CO2‐equivalents of the use of diesel
Compost Bokashi Source
1. Transport Distance truck with road side cutting material (km) 30.80 30.80 Distance Wijk bij Duurstede ‐ Achterveld
Distance truck with additions (km) 0.00 124.00 Distance Agriton ‐ Achterveld
Use of diesel (l per km) 0.37 0.37Assumption from Dekker et al. (2010) page 12
Total use of diesel (l) 11.40 57.28
Energy use of diesel (MJ/l) 42.40 42.40Assumption from Dekker et al. (2010) page 26
Total energy use for transport (MJ) 483.19 2428.50
2. Transport at the Composting company The road side cutting material was deposited in the same barn as where the windrows were made, through which the energy use of bringing the material at the place of the windrow is the same for both windrows.
3. Mixing
Number of times mixed 26.00 2.00 Experimental design and log book
Use of diesel (l/hour) 10.00 10.00Assumption from Dekker et al. (2010) page 26
Duration of one mixing (minutes) 3.75 3.75 John van de Hengel
Total duration of mixing (minutes) 97.50 7.50
Total use of diesel (l) 16.25 1.25
Energy use of diesel (MJ/l) 42.40 42.40Assumption from Dekker et al. (2010) page 26
Total energy use of mixing (MJ) 689.00 53.00
Total energy use (MJ) 1172.19 2481.50
CO2‐ equ (1 MJ = 0.074 kg CO2‐equ) 86.74 183.63 Mombarg et al. (2003) page 3


