
Experimental comparison of heterodyne and direct detectionfor pulsed differential absorption CO2 lidar
D. K. Killinger, N. Menyuk, and W. E. DeFeo
A pulsed dual-wavelength dual-CO 2 -laser differential-absorption lidar (DIAL) system has been developedwhich permits simultaneous heterodyne and direct detection of the same lidar returns. This system hasbeen used to make an experimental comparison of the SNRs and statistical and temporal characteristics ofthe DIAL returns from several topographic targets. These results were found to be in general agreementwith theory and were used to quantify the relative merits of the two detection techniques. The measuredparameter values were applied to an analytical treatment to predict system trade-offs for the remote sensingof atmospheric species, with application to both path-averaged and range-resolved measurements.
1. Introduction
The use of differential-absorption lidar (DIAL) sys-tems with CO2 laser sources has proven to be a sensitivemethod for achieving remote measurements of selectedspecies in the atmosphere.' In general, most remotesensing measurements using CO2 DIAL have been madeusing either pulsed CO2 lasers in conjunction with direct(noncoherent) detection 2 -4 or cw5
,6 and Q-switched cw7
CO2 lasers with heterodyne (coherent) detection. Theadvantages of using heterodyne detection with pulsedCO2 DIAL have been studied theoretically8 1 0 but haveyet to be verified experimentally.
In this paper, an experimental comparison is madeof the relative merits of heterodyne and direct detection.Measurements were made using a pulsed dual-wave-length dual-CO2-laser differential-absorption lidar(DIAL) system which permitted simultaneous hetero-dyne and direct detection of the same lidar return. Thissystem was utilized to obtain a direct experimentalcomparison of the SNRs and statistical and temporalcharacteristics of the DIAL returns. The resultsquantify the increase in the average detected lidarbackscatter intensity relative to the average noise levelfor heterodyne compared with direct detection, andthey provide a measure of the relative accuracy of thetwo detection techniques when applied to DIAL mea-surements.
The authors are with MIT Lincoln Laboratory, P.O. Box 73, Lex-ington, Massachusetts 02173.
Received 8 October 1982.0003-6935/83/050682-08$01.00/0.t© 1983 Optical Society of America.
A description of the experimental apparatus is givenin Sec. II. Section III presents the experimental resultswhich quantify the SNR, temporal correlation, andstatistical fluctuation of the lidar returns; these resultsare shown to be in reasonable agreement with theory.The parameter values determined in Sec. III are usedin an analytical treatment in Sec. IV to provide physicalinsight into the relative trade-offs between the twodetection techniques. Finally, Sec. V presents anoverview of the conclusions and experimental results.
11. Experimental Apparatus
A schematic of the dual-laser DIAL system is shownin Fig. 1. Two grating tuned nonstabilized hybrid-TEACO2 lasers provide the pulsed, tunable, single-frequencyradiation near 10 Aim. Each laser is similar to that re-ported previously 11 12 but with an additional 36-cm longlow-pressure gain cell placed within the 1.32-m cavity;the low-pressure gain cell reduced the TEMoo outputlinewidth of the laser from about four longitudinalmodes to a single frequency. The output coupler is a93% reflectivity 1.5-m radius-of-curvature mirror placedon a PZT mount. The TEA laser operated at a prf ofup to 100 Hz. The output energy of the hybrid-TEAlaser was -10 mJ/pulse with a pulse length of 200 nsec.The low-pressure (10 Torr) gain cell was operatedcontinuously at slightly above threshold, with an outputpower of 100 mW. No active or passive stabilization ofthe hybrid-TEA laser cavity was utilized except tomount the mirror components on large (15 X 15 X 15cm) aluminum blocks. Laser 2 was fired a few secafter laser 1 to provide temporal separation of the twopulses.
The frequency of each hybrid-TEA laser was adjustedto an offset frequency of -20 MHz relative to that of agrating tuned, stable, 100-mW cw CO2 laser local os-
682 APPLIED OPTICS / Vol. 22, No. 5 / 1 March 1983
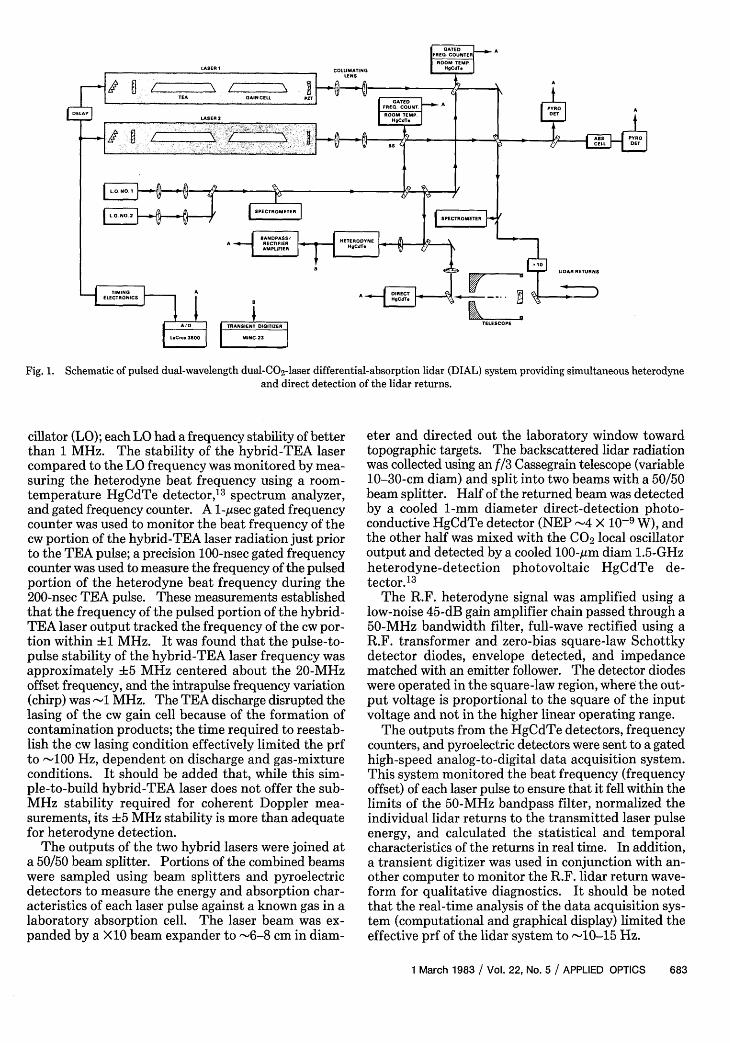
Fig. 1. Schematic of pulsed dual-wavelength dual-CO 2 -laser differential-absorption lidar (DIAL) system providing simultaneous heterodyneand direct detection of the lidar returns.
cillator (LO); each LO had a frequency stability of betterthan 1 MHz. The stability of the hybrid-TEA lasercompared to the LO frequency was monitored by mea-suring the heterodyne beat frequency using a room-temperature HgCdTe detector, 3 spectrum analyzer,and gated frequency counter. A 1-psec gated frequencycounter was used to monitor the beat frequency of thecw portion of the hybrid-TEA laser radiation just priorto the TEA pulse; a precision 100-nsec gated frequencycounter was used to measure the frequency of the pulsedportion of the heterodyne beat frequency during the200-nsec TEA pulse. These measurements establishedthat the frequency of the pulsed portion of the hybrid-TEA laser output tracked the frequency of the cw por-tion within +1 MHz. It was found that the pulse-to-pulse stability of the hybrid-TEA laser frequency wasapproximately +5 MHz centered about the 20-MHzoffset frequency, and the intrapulse frequency variation(chirp) was -1 MHz. The TEA discharge disrupted thelasing of the cw gain cell because of the formation ofcontamination products; the time required to reestab-lish the cw lasing condition effectively limited the prfto -100 Hz, dependent on discharge and gas-mixtureconditions. It should be added that, while this sim-ple-to-build hybrid-TEA laser does not offer the sub-MHz stability required for coherent Doppler mea-surements, its +5 MHz stability is more than adequatefor heterodyne detection.
The outputs of the two hybrid lasers were joined ata 50/50 beam splitter. Portions of the combined beamswere sampled using beam splitters and pyroelectricdetectors to measure the energy and absorption char-acteristics of each laser pulse against a known gas in alaboratory absorption cell. The laser beam was ex-panded by a X10 beam expander to -6-8 cm in diam-
eter and directed out the laboratory window towardtopographic targets. The backscattered lidar radiationwas collected using an f/3 Cassegrain telescope (variable10-30-cm diam) and split into two beams with a 50/50beam splitter. Half of the returned beam was detectedby a cooled 1-mm diameter direct-detection photo-conductive HgCdTe detector (NEP -4 X 10⁻⁹ W), andthe other half was mixed with the CO2 local oscillatoroutput and detected by a cooled 100-,m diam 1.5-GHzheterodyne-detection photovoltaic HgCdTe de-tector. 13
The R.F. heterodyne signal was amplified using alow-noise 45-dB gain amplifier chain passed through a50-MHz bandwidth filter, full-wave rectified using aR.F. transformer and zero-bias square-law Schottkydetector diodes, envelope detected, and impedancematched with an emitter follower. The detector diodeswere operated in the square-law region, where the out-put voltage is proportional to the square of the inputvoltage and not in the higher linear operating range.
The outputs from the HgCdTe detectors, frequencycounters, and pyroelectric detectors were sent to a gatedhigh-speed analog-to-digital data acquisition system.This system monitored the beat frequency (frequencyoffset) of each laser pulse to ensure that it fell within thelimits of the 50-MHz bandpass filter, normalized theindividual lidar returns to the transmitted laser pulseenergy, and calculated the statistical and temporalcharacteristics of the returns in real time. In addition,a transient digitizer was used in conjunction with an-other computer to monitor the R.F. lidar return wave-form for qualitative diagnostics. It should be notedthat the real-time analysis of the data acquisition sys-tem (computational and graphical display) limited theeffective prf of the lidar system to -10-15 Hz.
1 March 1983 / Vol. 22, No. 5 / APPLIED OPTICS 683

erodyne-detection optical path to permit an accuratecomparison of the two detection techniques. In general,the measured SNR value for the heterodyne-detectedreturns was found to be a factor of -500-2000 greaterthan that for the direct-detected returns. As an ex-ample, using the side of a large, painted, corrugatedmetal building at a range of 2.7 km as a diffuse reflectingtarget, the direct-detection SNR was -10, and theheterodyne-detection SNR after optical attenuation of1000 was -10 (i.e., SNR -10,000). This observed dif-ference in the measured SNR values may be comparedwith theory (valid for SNR -1). The noise equivalentpower (NEP) of the noncoherent detector is -4 X 10⁻⁹W. The noise of the heterodyne detector with sufficientlocal oscillator power is given15 by
Fig. 2. CRT display showing dual-laser lidar returns from a targetat a range of 2.7 km (time of flight of 17 gsec). Top trace is the di-rect-detection returns, and the bottom trace is the heterodyne-de-tection returns; the transmitted laser pulse at zero delay time is alsoevident in the bottom trace. Temporal separation between lasers 1
and 2 was 5 psec.
Figure 2 is a photograph of a CRT display showingthe simultaneous lidar returns using a diffuse target(flame-sprayed aluminum plate) 14 at a range of 2.7 km.The upper trace shows the direct-detection returns forlidars 1 and 2, and the lower trace shows the corre-sponding envelope-detected heterodyne returns. Toproperly compare the relative intensity of the returnsfor the two detection techniques, it should be noted thatthe current (and hence voltage output) for the direct-detection detector is proportional to the square of thereceived optical electric field, Ek ER, which is the in-tensity of the received lidar return. For heterodynedetection, the output current of the HgCdTe detectorat the beat frequency is proportional to the product ofE* ELO, when ELO is the optical electric field from thelocal oscillator.15 The square-law detector chain isoperated so that the output voltage V is proportionalto the square of the input voltage VN so that V a VIN
EE2 0 . Therefore, the voltage signals seen in Fig. 2are proportional to the received lidar intensity for bothdirect and heterodyne detection.
Ill. Experimental Data
A. Average SNR of Lidar Returns
The average SNR of the lidar returns, which repre-sents the ratio of the average intensity to the averagenoise, was measured for different targets at severalranges. Calibrated attenuators were used in the het-
PN hB/n, (1)
where q is the quantum efficiency of the detector, andB is the bandwidth of the detector amplifier in hertz.Using typical values for our operating system of = 2.8X 10¹³ Hz, - 0.5, and B = 50 MHz, Eq. (1) indicatesa heterodyne-detection noise value of 2 X 10⁻¹ 2 W. Theratio of the estimated heterodyne-detection and thedirect-detection noise value is -2000 and in reasonableagreement with the observed experimental values forthe ratio of the observed SNR values of 1000; thisagreement is actually better than indicated since theexperimental SNR was -10.13
It is also instructive to compare the observed lidarreturn intensity with that predicted theoretically. Thereturn lidar signal PR is given12 approximately by
D IFFUSE TARGET RANGE 2.7 Km
TEMPORAL HISTORY OF LIDAR RETURNS
HETERODYNE
DIRECT
HISTOGRAM (STATISTICAL DISTRIBUTION)
HETERODYNE
D I RECT
Fig. 3. Computer display showing temporal history and statisticaldistribution (histogram) of the lidar returns from a diffuse target(metal building) at a range of 2.7 km. The prf of the lidar was
-10 Hz.
684 APPLIED OPTICS / Vol. 22, No. 5 / 1 March 1983
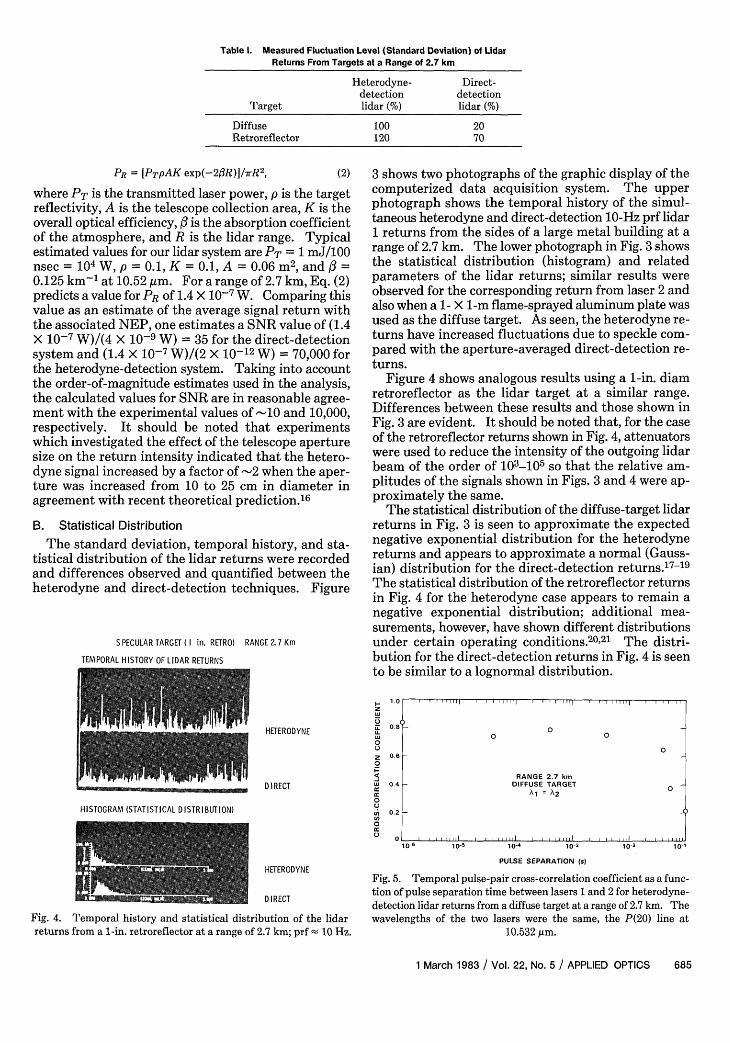
Table 1. Measured Fluctuation Level (Standard Deviation) of LidarReturns From Targets at a Range of 2.7 km
Heterodyne- Direct-detection detection
Target lidar (%) lidar (%)
Diffuse 100 20Retroreflector 120 70
PR = [PTpAK exp(-23R)]/rR 2 , (2)
where PT is the transmitted laser power, p is the targetreflectivity, A is the telescope collection area, K is theoverall optical efficiency, is the absorption coefficientof the atmosphere, and R is the lidar range. Typicalestimated values for our lidar system are PT = 1 mJ/100nsec = 104 W, p = 0.1, K = 0.1, A = 0.06 M2
, and f3 =0.125 km-' at 10.52 ,um. For a range of 2.7 km, Eq. (2)predicts a value for PR of 1.4 X 10⁻⁷ W. Comparing thisvalue as an estimate of the average signal return withthe associated NEP, one estimates a SNR value of (1.4X 10⁻⁷ W)/(4 X 10-9 W) = 35 for the direct-detectionsystem and (1.4 X 10⁻⁷ W)/(2 X 10-12 W) = 70,000 forthe heterodyne-detection system. Taking into accountthe order-of-magnitude estimates used in the analysis,the calculated values for SNR are in reasonable agree-ment with the experimental values of -10 and 10,000,respectively. It should be noted that experimentswhich investigated the effect of the telescope aperturesize on the return intensity indicated that the hetero-dyne signal increased by a factor of -2 when the aper-ture was increased from 10 to 25 cm in diameter inagreement with recent theoretical prediction.' 6
B. Statistical Distribution
The standard deviation, temporal history, and sta-tistical distribution of the lidar returns were recordedand differences observed and quantified between theheterodyne and direct-detection techniques. Figure
S PECULAR TARGET ( I in. RETRO) RANGE 2.7 Km
TEMPORAL HISTORY OF LIDAR RETURNS
mIHETERODYNE
D I RECT
HISTOGRAM (STATISTICAL DISTRIBUTION)
3 shows two photographs of the graphic display of thecomputerized data acquisition system. The upperphotograph shows the temporal history of the simul-taneous heterodyne and direct-detection 10-Hz prf lidar1 returns from the sides of a large metal building at arange of 2.7 km. The lower photograph in Fig. 3 showsthe statistical distribution (histogram) and relatedparameters of the lidar returns; similar results wereobserved for the corresponding return from laser 2 andalso when a 1- X 1-m flame-sprayed aluminum plate wasused as the diffuse target. As seen, the heterodyne re-turns have increased fluctuations due to speckle com-pared with the aperture-averaged direct-detection re-turns.
Figure 4 shows analogous results using a 1-in. diamretroreflector as the lidar target at a similar range.Differences between these results and those shown inFig. 3 are evident. It should be noted that, for the caseof the retroreflector returns shown in Fig. 4, attenuatorswere used to reduce the intensity of the outgoing lidarbeam of the order of 103-105 so that the relative am-plitudes of the signals shown in Figs. 3 and 4 were ap-proximately the same.
The statistical distribution of the diffuse-target lidarreturns in Fig. 3 is seen to approximate the expectednegative exponential distribution for the heterodynereturns and appears to approximate a normal (Gauss-ian) distribution for the direct-detection returns. 7-19
The statistical distribution of the retroreflector returnsin Fig. 4 for the heterodyne case appears to remain anegative exponential distribution; additional mea-surements, however, have shown different distributionsunder certain operating conditions.20'21 The distri-bution for the direct-detection returns in Fig. 4 is seento be similar to a lognormal distribution.
I-Z
0.80.8 O
w ~~~0 00o 0Z 0.680
RANGE 2.7 kmus 0.4 - DIFFUSE TARGET 0
0Uc 0.2 -
00
101
HETERODYNE
DIRECT
Fig. 4. Temporal history and statistical distribution of the lidarreturns from a 1-in. retroreflector at a range of 2.7 km; prf 10 Hz.
lo-6 10- 10-4 10PU loE A 1-2
PULSE SEPARATION (s)
Fig. 5. Temporal pulse-pair cross-correlation coefficient as a func-tion of pulse separation time between lasers 1 and 2 for heterodyne-detection lidar returns from a diffuse target at a range of 2.7 km. Thewavelengths of the two lasers were the same, the P(20) line at
10.532 Am.
1 March 1983 / Vol. 22, No. 5 / APPLIED OPTICS 685

Table 11. Measured Cross-Correlation Coefficient p at Short Delay Timesfor Dual-Laser Lidar Returns (Target Range 2.7 km)
Direct detection Heterodyne detectionTarget X1 = 2 XI PX X2 X1 = 2 XI 1 0 \ 2
Diffuse 0.5 0.5 0.9 0.2aRetroreflector 0.9 0.9 0.9 0.9
a Dependent on target surface roughness and XI - 2 ; the valueshown is for XI - X2 = 0.016 ,m.
The statistical distributions shown in Figs. 3 and 4 areconsistent with previously measured results for the di-rect-detection system as well as those predicted fromtheory and associated measurements for the heterodynetechnique.12,17-20 The exact distributions shown inFigs. 3 and 4 will have an influence on the accuracy ofa DIAL measurement since they affect the standarddeviation of the fluctuations. The standard deviationwill influence the accuracy of a DIAL measurementsince it determines the error in the estimate of the meanvalue of the lidar returns.
The measured standard deviation of the lidar returnsfor the two different targets at a range of 2.7 km is shownin Table I. As seen, the normalized standard deviationof the fluctuation in the lidar returns was found to be-20% and 100% for the diffuse target returns and 70%and 120% for the 1-in. retroreflector return for directdetection and heterodyne detection, respectively; re-sults obtained using the aluminum plate or the metalbuilding as the diffuse target were essentially the same.These values are in order-of-magnitude agreement withtheoretical predictions22 23 and quantify the differencesbetween the two detection techniques. Further analysisof these results will be presented in later sections.
C. Temporal Correlation
The temporal pulse-pair cross-correlation coeffi-cient2 4 p of the two return pulses for the two lasers wasmeasured as a function of the temporal separation be-tween the two laser pulses. The correlation coefficientis a measure of how well-correlated the fluctuations oflidar 1 returns are compared with the fluctuations oflidar 2 returns.
Figure 5 shows results obtained for the correlationcoefficient of the dual-laser heterodyne returns from adiffuse target when the two laser wavelengths were thesame. As seen, p is near unity at close separation timesand falls off at typical atmospheric decorrelation timesof the order of 10-50 msec.24 The value of p at short(<50 ,usec) delay times was found, however, to be de-pendent on the nature of the target, the relative wave-lengths of the pulse pairs, and the type of detectionsystem used. Table II shows typical approximate(+0.1) values of p measured. It should be added that,while typical of our experimental conditions, the ob-served atmospheric decorrelation times shown in Fig.5 are dependent, in general, on atmospheric conditions(wind speed, wind direction, and Cn2 value), the di-mensions of the transmit/receive optics, and the dy-namics of the scattered far-field speckle pattern. 24
z0
a
4a
I
U
ccI-(z
100
50
10
5
1 10 100 1000
NUMBER OF PULSES AVERAGED
Fig. 6. Standard deviation in the estimate of the mean of the lidarreturns as a function of the number of pulses integrated for returns
from a diffuse target at a range of 2.7 km.
The value of p is seen in Table II to be large for re-troreflector returns for all cases, including those inwhich the wavelength of the two lasers differed fromeach other by as much as 1 um. This result is mostprobably due to the relative physical size of the retro-reflector compared with the size of the modulated in-tensity patterns within the transmitted laser beam.One estimates that under the conditions of our experi-ments, the size of the intensity modulations (i.e., co-herence length) was -10-50 cm.22 25 In this case, theretroreflector is essentially sampling the modulatedintensity patterns within the transmitted laser beamand, as expected, should not be a strong function ofwavelength or of the detection technique.
The results for the diffuse target show, however,strong dependence of the detection technique and of thelaser wavelength separation. While the direct-detec-tion results are consistent with previous results,12 24 theheterodyne-detection results are notable for two rea-sons. First, the high value of p observed in Fig. 5 atshort delay times indicates that the same interferenceor speckle pattern is being detected by both lidars 1 andlidar 2; the falloff of p at time separations of the orderof 10-50 msec indicates that the detected speckle pat-tern is being modulated by atmospheric turbulence.Second, p is seen in Table II to be significantly reducedfor heterodyne detection from a diffuse target case whenAI differs from 2 by as little as 0.016 Azm, the differencebetween two adjacent CO2 laser lines. This result ismost probably due to the effect of decorrelation of thespeckle pattern caused by the surface roughness of thetarget when the wavelength of the radiation is varied.2 6
The functional relationship of p on surface roughnessand wavelength may be expressed as p =exp[-(Akaz/,\/)2], where o-, is the standard deviationof the surface roughness, and Ak is the difference in thelaser frequencies.26 As an order-of-magnitude esti-mate, one may take an estimated value of a. = 2 mmand k _ 27rAX/X2 = 0.00091 (m)- 1. Using these
686 APPLIED OPTICS / Vol. 22, No. 5 / 1 March 1983

0.20
I-2
U,w
IL)U-
0
0
0C.)
0.15
0.10
0.05
o , ,,, I I I I il ,- .i .j0.1 1 10 100
CORRELATION TIME INTERVAL (sI
Fig. 7. Temporal autocorrelation coefficient of the lidar returns (prf10 Hz) as a function of temporal separation between the
measurements.
values, one predicts a value of p 0.2, in reason-able agreement with the observed value shown inTable II.
The above results obtained for the value of p for thetwo different detection techniques are of interest be-cause they influence the degree to which the effect of thelidar return fluctuations can be reduced by the use ofa dual-laser system.2 7 In particular, the low value of pobserved for the heterodyne and diffuse target casewhen XA F X2 with the two wavelengths separated byas little as 0.016 gim implies that little reduction will beobtainable for such a DIAL system. The detailed im-plications of such effects will not be covered here butwill be published in a later paper which will combine theeffect of both cross-correlation and long-term atmo-spheric-induced effects on DIAL remote-sensing er-rors.2 8
D. Measurement Accuracy in Determination ofAverage Lidar Return
The accuracy of a laser remote-sensing measurementis related to the determination of the average value ofthe lidar return signal. Previous experiments usingdirect detection have shown the limitation imposed onthe accuracy of such measurements by the atmo-spheric-turbulence-induced temporal correlation of thelidar returns.12 To establish this relative accuracy forboth heterodyne and direct detection, the standarddeviation of the mean, ,29 of the idar return wasmeasured. Figure 6 shows the measured standard de-viation of the mean value of the 10-Hz prf lidar returnsas a function of the number of pulses integrated, n. Asseen, on, and hence the fluctuation-induced error of thedirect-detection system, is lower than that for the het-erodyne system, reflecting the decreased fluctuationsin Fig. 3 and Table I.
The deviation from the expected square-root de-pendence on n, the number of pulses integrated, is dueto the nonzero temporal autocorrelation of the returns.30
Figure 7 shows the measured temporal autocorrelation
NEPDIRECT
2 NEPHEERODYNE
10- DIRECT
0
P T 1 J/PUlseTOPOGRAPHIC TARGET
0.1 1 10 100
RANGE (km)
Fig. 8. Calculated minimum detectable path-averaged concentrationof ethylene, Nmin, as a function of range for heterodyne- and direct-
detection DIAL.
coefficient for the same data as in Fig. 6 and clearly in-dicates the nonrandom nature of the returns. It is in-teresting to note that both detection techniques displaysimilar long-term correlation effects indicative of similarabsorption or scattering properties of the atmosphereunder these conditions. The results shown in Fig. 6indicate an effective limit30 to the improvement in theSNR (i.e., standard deviation of the mean) of the orderof 6 or 7 for both the heterodyne- and the direct-de-tection cases under the conditions of our experiments.The implications of this on laser remote-sensing accu-racy will be discussed in Sec. IV.
It should be added that the results shown in Figs. 5-7are fairly typical results yet are indicative of the par-ticular experimental conditions (atmosphere, range,system parameters) while the measurements were beingmade. In general, significant changes in the measuredvalues of (, and p can occur over time periods as shortas a few seconds to a few minutes (see Figs. 11 and 12 inRef. 29).
IV. Comparison of DIAL Measurement Accuracy forAtmospheric Species
The previous sections presented experimental resultswhich indicated the differences in the signal strengthand fluctuation levels of the two detection techniques.In this section, these results will be used along withappropriate analysis to numerically predict the accuracyof a laser remote-sensing measurement for heterodynedetection and for direct detection.
Previous analysis has shown that the accuracy of aDIAL measurement may be limited by the effect of thefluctuations of the lidar returns at close-in ranges andby the noise of the detector at far ranges.1229 To ex-press this limitation, one may relate the minimumpath-averaged concentration of gas that can be de-tected, Nmin, to the NEP of the detector as
1 March 1983 / Vol. 22, No. 5 / APPLIED OPTICS 687

10%
2
NEP
U. 10 DIRECT > I HETERODYNE
DIREC2%
NEPDIRECT
0PT = mJ/PulseATMOSPHERIC BACKSCATTERP 0.5 X 0-,3 10-7 (m-sr)
1
0.1 1 10 100RANGE km)
Fig. 9. Calculated minimum detectable range-resolved concentrationof ethylene, Nmin, as a function of range. Range resolution is 500 m.
Nmin (NEP)7rR/[2po-KAPT exp(-2flR)], (3)
where a is the absorption cross section of the gas.The corresponding equation for the fluctuation-
limited case is
Nmin uo/(2taR), (4)
where o- is the standard deviation of the mean value ofthe lidar returns.
Equations (3) and (4) may be used to compare thedetection accuracy of both heterodyne- and direct-detection DIAL systems. As an example, one may usethe same parameter values as those used earlier in Eq.(2). In addition, reasonable values for a, may be ob-tained from Fig. 6; for n = 512, 0on = 5% and 17% for thedirect and heterodyne cases, respectively. A nominalvalue for oa is 32 X 105 (km atm)-', representative ofthe absorption cross section of ethylene near 10.532
im.3Using these values in Eqs. (3) and (4), one obtains the
curves shown in Fig. 8. The envelope of detection foreach system is the area of the region bounded by the twodetection limits for each system, respectively. As seen,at close-in ranges, the sensitivity or accuracy of the di-rect-detection DIAL system is better, while at longrange, the increase in average SNR of the heterodynesystem is responsible for the improved detectivity atthese ranges. Figure 8 succinctly illustrates the ap-propriate trade-offs of the increased signal strengthcoupled with increased fluctuations of the heterodynesystem compared to the increased accuracy but shorterdetection ranges of the direct-detection system for agiven laser pulse energy.
A similar analysis can also be applied to range-re-solved DIAL measurements which utilize backscatterfrom aerosols in the atmosphere instead of topographictarget returns. In this case, for a CO2 lidar systemwhich has sufficient sensitivity to detect backscatterfrom atmospheric aerosols, Eqs. (3) and (4) should be
modified by replacing p with ('AR) and (7a with(o- AR/R), where AR is the range resolution of thesystem, and /3' is the Mie backscatter coefficient. Forthe assumed values PT - 100 mJ, p - 0.5 X 10⁻⁴ (for A'= 10-7 m-1-sr-1 and AR = 500 m), (,, - 10% and 2% forheterodyne32 and direct detection,33 respectively, forn = 100, and with the other parameter values taken tobe the same as in the preceding example, the range-resolved detection curves shown in Fig. 9 are obtained.Figure 9 shows a detection envelope similar to that inFig. 8, except that the close-in detection sensitivity isindependent of range since Eq. (4) has been modifiedto Nmin n/(2a AR), and at the long ranges Eq. (3)has been modified to be proportional to (NEP)R 2/exp(-2R). In the latter case, the relative increase indetection range for heterodyne compared with directdetection is dominated by the exp(-20R) term at veryfar ranges and the 1/R2 contribution at closer ranges;this is why the NEP curves for direct and heterodynedetection are not related to each other simply by thesquare root of the ratio of the respective NEP values inFig. 9.
It should be noted that Eqs. (3) and (4) representapproximations and were presented to provide physicalinsight into the relative detection limits. In the moregeneral case, the values of NEP and n as well as therange dependence in Eqs. (3) and (4) would be depen-dent on several factors. These include the range de-pendence of the fluctuation or atmospheric turbulencelevels, 2 0 aperture-averaging effects,2 3 the use of coldinterference filters and amplifiers to reduce the di-rect-detection NEP value,13 the use of heterodyne de-tector arrays to reduce speckle-induced fluctuations,34
increased signal averaging through the use of high-prflasers,22 and the trade-offs between the effects of short-and long-term temporal correlation for DIAL remotesensing of atmospheric species.28 This latter consid-eration is expected to be important for range-resolvedheterodyne detection of atmospheric aerosols; as anexample, low short-term correlation values may drive
688 APPLIED OPTICS / Vol. 22, No. 5 / 1 March 1983
the system design toward the use of high-prf lasers inorder to reduce the speckle-induced o- values undercertain operating conditions. However, long-termtemporal changes in the atmosphere may indicate theadvantages of a dual-laser DIAL system in spite of lowshort-term cross-correlation.28 29
V. Conclusions
This paper has presented an overview of our CO2heterodyne- and direct-detection DIAL measurements.Using a relatively simple-to-build hybrid-TEA CO2laser, lidar returns have been detected simultaneouslyboth coherently and noncoherently from several targets.The relative average SNR and fluctuation levels of thetwo systems were measured and found to qualitativelyagree within factors of the order of unity with previoustheoretical predictions. Finally, analytical equationswere presented which related the detection sensitivityof the two systems as a function of range. The examplespresented clearly indicate the sensitivity trade-offs ofthe two systems as a function of range and providephysical insight into the relative differences. It shouldbe noted, however, that while the overall trade-offanalysis as outlined in this paper shows the relativetechnical merits, other considerations such as systemcomplexity should be considered for a complete systemperformance analysis.References
1. R. L. Byer, Opt. Quantum Electron. 17, 147 (1975).2. J. L. Bufton, R. W. Stewart, and C. Weng, Appl. Opt. 18, 3363
(1979).3. E. R. Murray and J. E. van der Laan, Appl. Opt. 17, 814
(1978).4. K. Asai, T. Itabe, and T. Igarashi, Appl. Phys. Lett. 35, 60
(1979).5. M. S. Shumate, R. T. Menzies, W. B. Grant, and D. S. McDougal,
Appl. Opt. 20,545 (1981); R. T. Menzies and M. S. Shumate, Appl.Opt. 15, 2080 (1976).
6. W. Wiesemann, R. Beck, W. Englisch, and K. Gurs, Appl. Phys.15, 257 (1977).
7. S. Lundqvist, C. 0. Faelt, U. Persson, B. Marthinsson, and S. T.Eng, Appl. Opt. 20, 2534 (1981).
8. R. M. Hardesty, "A Comparison of Heterodyne and Direct De-tection CO2 DIAL Systems for Ground-Based Humidity Profil-ing," NOAA Tech. Memo. ERL-WPL-64, Oct. 1980.
9. P. Brockman, R. V. Hess, L. D. Staton, and C. H. Bair, "DIALwith Heterodyne Detection Including Speckle Noise," NASATech. Paper 1725, Aug. 1980.
10. B. J. Rye, Appl. Opt. 17, 3862 (1978).11. N. Menyuk and P. F. Moulton, Rev. Sci. Instrum. 51, 216
(1980).12. D. K. Killinger and N. Menyuk, IEEE J. Quantum Electron.
QE-17, 1917 (1981).
13. D. L. Spears, Proc. Soc. Photo-Opt. Instrum. Eng. 300,174 (1981);D. L. Spears, "IR Detectors: Heterodyne and Direct," TechnicalDigest of Workshop on Optical and Laser Remote Sensing,Monterey, 9-11 Feb. (1982).
14. R. A. Brandewie and W. C. Davis, Appl. Opt. 11, 1526 (1972).15. R. H. Kingston, Detection of Optical and Infrared Radiation
(Springer, New York, 1978).16. J. Y. Wang, Appl. Opt. 21,464 (1982).17. R. M. Hardesty, R. J. Keeler, M. J. Post, and R. A. Richter, Appl.
Opt. 20, 3763 (1981).18. C. M. McIntyre, M. H. Lee, and J. H. Churnside, J. Opt. Soc. Am.
70, 1084 (1980).19. J. F. Holmes, M. H. Lee, and J. R. Kerr, J. Opt. Soc. Am. 70,355
(1980).20. S. F. Clifford and R. J. Hill, J. Opt. Soc. Am. 71, 112 (1981).21. E. Jakeman and P. N. Pusey, Phys. Rev. Lett. 40, 546 (1978).22. J. H. Shapiro, B. A. Capron, and R. C. Harney, Appl. Opt. 20,3292
(1981); J. H. Shapiro, "Target Detection with a Direct-DetectionOptical Radar," Project Report TST-27, MIT Lincoln Labora-tory, Nov. 1978, ADA No. 065 627.
23. For a negative exponential distribution, the value of the standarddeviation equals that of the mean; therefore, the normalizedstandard deviation is 1. This is equivalent to the statement thatthe SNR = 1 since, as in Ref. (22), the voltage SNR may be de-fined as the ratio of the mean value divided by the standard de-viation.
24. N. Menyuk and D. K. Killinger, Opt. Lett. 6, 301 (1981).25. R. E. Hufnagel, "Propagation Through Atmospheric Turbulence,"
in The Infrared Handbook, W. L. Wolfe and G. J. Zissis, Eds.(Office of Naval Research, Washington, D.C., 1978), Chap. 6.
26. G. Parry, "Speckle Patterns in Partially Coherent Light," in LaserSpeckle and Related Phenomena, J. C. Dainty, Ed. (Springer,New York, 1975), p. 100; N. George and A. Jain, Appl. Phys. 4,201(1974).
27. D. K. Killinger and N. Menyuk, Appl. Phys. Lett. 38, 968(1981).
28. N. Menyuk, D. K. Killinger, and C. R. Menyuk (to be submittedfor publication, Appl. Opt.)
29. N. Menyuk, D. K. Killinger, and W. E. DeFeo, Appl. Opt. 21, 2275(1982).
30. N. Menyuk, D. K. Killinger, and C. R. Menyuk, Appl. Opt. 21,3377 (1982).
31. A. Mayer, J. Comera, H. Chatpenties, and C. Jaussaud, Appl. Opt.17, 391 (1978).
32. R. J. Hull, MIT Lincoln Laboratory; private communication; CO2lidar range-resolved heterodyne detection of atmospheric aero-sols.
33. J. L. Bufton, NASA Goddard; private communication; CO 2 lidarrange-resolved direct detection of atmospheric aerosols.
34. Detector arrays may be used in heterodyne-detection lidar toreduce the effects of speckle-induced fluctuations. For the caseof an optimized detection system as in Refs. 8and 9, the reductionin a2 is predicted to be offset by a corresponding decrease in SNR;however, for a lidar system in which (en is dominated by atmo-spheric effects rather than being related to SNR, relative detec-tion advantages can be gained from the use of a detector array.
The authors would like to thank D. Spears for themanufacture and use of the HgCdTe detectors and E.Casazza for construction of the electronics. In addition,technical discussions with A. Mooradian and P. L.Kelley were most helpful.
This work was sponsored by the National Aeronau-tical and Space Administration and the Air Force En-gineering and Services Center.
1 March 1983 / Vol. 22, No. 5 / APPLIED OPTICS 689


