Biomass and Bioenergy 22 (2002) 159–167
Energy yields in intensive and extensivebiomass production systems
S. Nonhebel ∗
IVEM, Center for Energy and Environmental Studies, University of Groningen, Nijenborgh 4, 9747 AG Groningen, Netherlands
Received 14 May 2001; received in revised form 12 November 2001; accepted 15 November 2001
Abstract
As for agricultural crops, biomass crops can be grown in intensive production systems (external inputs such as pesticides andarti,cial fertilisers) or extensive systems with few external inputs. The choice between an intensive or extensive productionsystem has consequences for yields. A method is presented to estimate biomass yields in intensive and=or extensive productionsystems. This method is applied to a poplar coppice production system. Results of the method are used to evaluate severalintensive and extensive production systems with respect to bioenergy yield and fossil fuel use e/ciency. The energy yield(GJ=ha) of the intensive systems was highest, while the extensive systems show the better fossil fuel use e/ciency (GJoutput=GJ fossil energy input). ? 2002 Elsevier Science Ltd. All rights reserved.
Keywords: Energy crops; Input–output relations; Production systems; Energy yields; Energy use e/ciency; Europe
1. Introduction
The growing of agricultural crops require land,machinery, plant material, fertilisers and crop pro-tection agents for the maintenance of the crops. Theproduction method varies between extensive produc-tion systems with minimal inputs to intensive systemswith large inputs including arti,cial fertilisers andagri-chemicals. In general yields produced from ex-tensive systems are lower than those of intensivesystems.The inputs used require energy both for their pro-
duction (indirect energy) and for their application(direct energy such as diesel to power the tractor).During the last decade many studies have been under-taken to calculate the use of fossil energy in food crop
∗ Tel.: +050-363-4611; fax: +050-363-7168.E-mail address: [email protected] (S. Nonhebel).
production systems [1–4]. These studies includedcomparison between organic agricultural productionversus high-input production, impact of technologicaldevelopments in agriculture on energy use, and com-parison of energy use in agriculture in di?erent coun-tries. All studies showed that energy use in systemswith limited inputs is less than in high-input systems.Absolute energy use (GJ=ha) and relative energy use(expressed as energy requirements per unit of prod-uct) were both higher in the high-input systems. Inaddition, fossil fuel energy was used most e/cientlyin low-input crop production systems which producedthe most biomass per unit of energy applied.There is no physiological di?erence between the
production of plant material for food or for energy.Sometimes even the same crops are used such as oilseed rape. This implies that reduction of energy usee/ciency with increasing inputs that is observed infood crops would also be expected for energy crops.
0961-9534/02/$ - see front matter ? 2002 Elsevier Science Ltd. All rights reserved.PII: S 0961 -9534(01)00071 -X
160 S. Nonhebel / Biomass and Bioenergy 22 (2002) 159–167
For food production, energy use e/ciency is of limitedinterest since the value of the harvested material is notdetermined by its heating value. For biomass crops,fossil fuel energy use e/ciency and energy yield areimportant parameters since they determine the poten-tial for growing these crops. Only crops that yield sig-ni,cantly more energy than is required to grow themare suitable as energy crops. Greater potential existsfor crops with increasing net yields leading to greaterdi?erences between energy inputs and energy outputs.This boundary condition does not exist for food crops,and many examples exist where energy required toproduce the crop is higher than the energy that couldbe obtained from it, such as the production of tomatoesin greenhouses. The importance of the energy ratio pa-rameters with respect to energy crops justi,es furtherinvestigation.The objective of this paper is to compare energy
yields and energy use e/ciencies of extensive andintensive biomass production systems. A method todetermine these parameters is presented and resultsare evaluated.
2. Material and methods
To determine energy use e/ciencies informationon energy inputs and energy outputs (crop yield)is required. For food producing systems this infor-mation can be obtained from annual agriculturalstatistics (published by organisations such as Foodand Agricultural Organisation (FAO) of the UN, andnational statistical o/ces like Statistics Netherlands,but also in the reports of agricultural research insti-tutes like Agricultural Economics Research Institute(LEI) in The Netherlands. For energy crops, simi-lar sources of data are lacking since these crops arepresently only grown in ,eld experiments. There-fore, in this paper the target oriented approach wasused [5], whereby the yield level (output) is ,rstde,ned and then the required energy inputs to reachthis yield level are determined. To determine theyields of intensive and extensive production sys-tems in this paper the following assumptions weremade.The yield of the intensive production system was
de,ned as the potential production level of the cropin a certain region. The potential production is (by
de,nition) the production that can be obtained whena crop is optimally supplied with water and nutrientsand free from pests and diseases [5]. This implies thatonly crop characteristics, air temperature and solar ra-diation determine this yield. Potential production canbe determined with crop growth simulation models,where crop growth is simulated in relation to air tem-perature and solar radiation. The potential yield levelis a measure for what can be obtained under optimalgrowing conditions in a region. Sometimes this yieldlevel can be reached in well-designed ,eld experi-ments with irrigation.Irrigation requires a certain infrastructure, fur-
ther application of water involves extra inputs(labour, pumps, fuel, etc.) and irrigation of cropsis often not feasible. This makes that the calcu-lated potential production has limited to do withthe actual yield possibilities in a region. Thereforethe so-called water-limited production level isrecognised. This production level is by de,nition:“the production of a crop that is optimallysupplied with nutrients and free from pests anddiseases, but yield is limited by the availability ofwater” [5].The magnitude of the water-limited production is
also determined with crop growth simulation modelsbut in these models a soil–water balance is incorpo-rated to simulate water availability to the crop. Thewater-limited yield is often interpreted as the attain-able yield level for individual farmers. Good cropmanagement can reduce e?ects of nutrient shortagesand pest damage. Irrigation, however, may requireinvestments on a regional scale; an individual farmercannot establish this. It should be realised that theactual yields obtained in Europe lay far below thesepotential levels; as will be discussed later. In regionswith relative large amounts of precipitation nowater shortage occurs during the growing seasons ofthe crops. In these regions, the calculated potentialyields and the calculated water-limited yields are thesame.To determine the yield in the extensive systems
forests are taken as a starting point, where inputsare applied only during planting and harvesting. Inthese systems, the only available nitrogen originatesfrom natural sources after decomposition and depo-sition. The available amount of nitrogen from thenatural sources is very small in comparison with
S. Nonhebel / Biomass and Bioenergy 22 (2002) 159–167 161
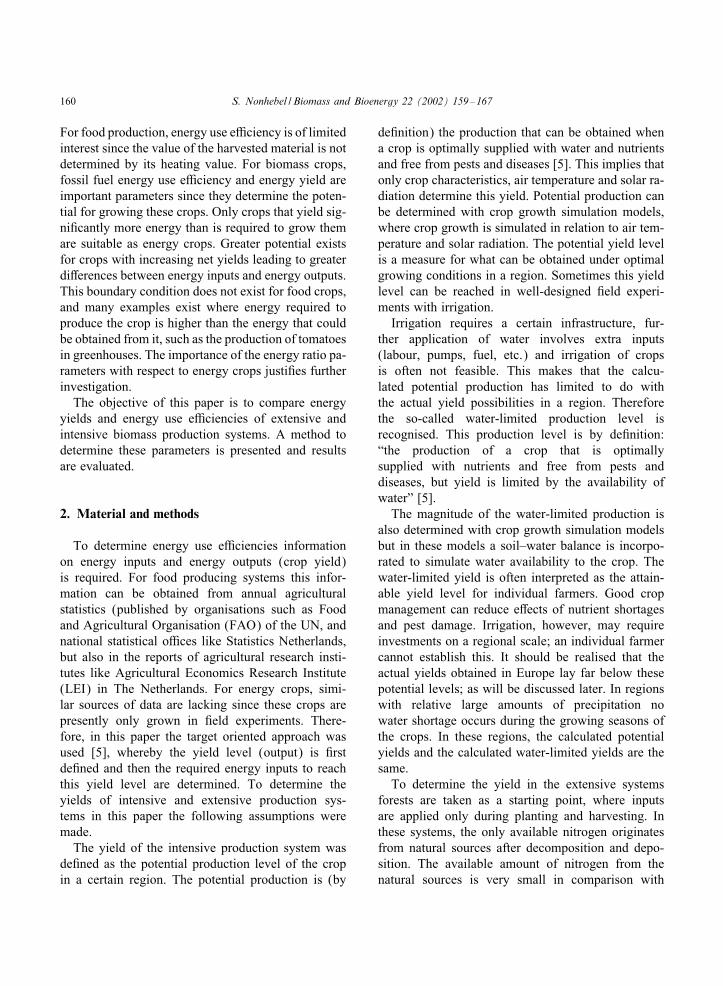
Fig. 1. Simulated potential production (tonne=ha=yr) of short rotation poplar systems in various regions in Europe [7].
nitrogen applications in intensive production sys-tems. It is assumed that nitrogen is the limiting factorin the extensive systems and that yield is linearlyrelated to available nitrogen. When the nitro-gen content of the harvested material (Cn[kg=kg])is known, the yield (kg=ha) dependent on theavailable nitrogen (N[kg=ha]) can be calculatedas
Yield =NCn: (1)
2.1. Description of the biomass productionsystems studied
In principle all crops with a positive energy ratiocould be used for energy supplies. Comparative stud-ies between a range of crops showed that productionof biomass in short rotation forestry systems was mostpromising [6]. Therefore, this type of biomass produc-tion system is evaluated here.The system concerned a short rotation poplar sys-
tem. The trees were planted in spring with a densityof 1 tree=m2 (10; 000 trees=ha), every fourth year thecrop is harvested and chipped. It was assumed that theplantation has a total lifespan of 20 years, so that 5harvests can take place before replanting. It was as-sumed that the production is similar each year.
2.2. Determination of yields
2.2.1. Intensive production systemsYield potentials derived in a study on produc-
tion possibilities for biomass crops grown in variousEuropean regions were used as a starting point [7]. Inthat study a crop growth simulation model was de-veloped to simulate production of biomass crops. Themodel was based on the linear relationship betweenintercepted radiation and above ground biomass pro-duction, being light use e/ciency [8]. A soil waterbalance was incorporated to simulate the e?ects ofwater shortage on crop production. The model re-quired monthly averages of global radiation, tem-perature and precipitation and crop characteristics tosimulate production [7]. In what publication, informa-tion can be found on both potential- and water-limitedyields of several biomass crops in over 50 regions inEurope. The data for poplar were used.Large di?erences in simulated potential yields
existed: varying from 12 tonne=ha in north-westernEurope to over 40 tonne=ha in southern Spain andPortugal (Fig. 1). Di?erences in climatological cir-cumstances are the cause of the yield di?erences.Characteristics of the contrasting climates are givenin Table 1 as well as data on the duration of thegrowing season of the crop and the amount of
162 S. Nonhebel / Biomass and Bioenergy 22 (2002) 159–167
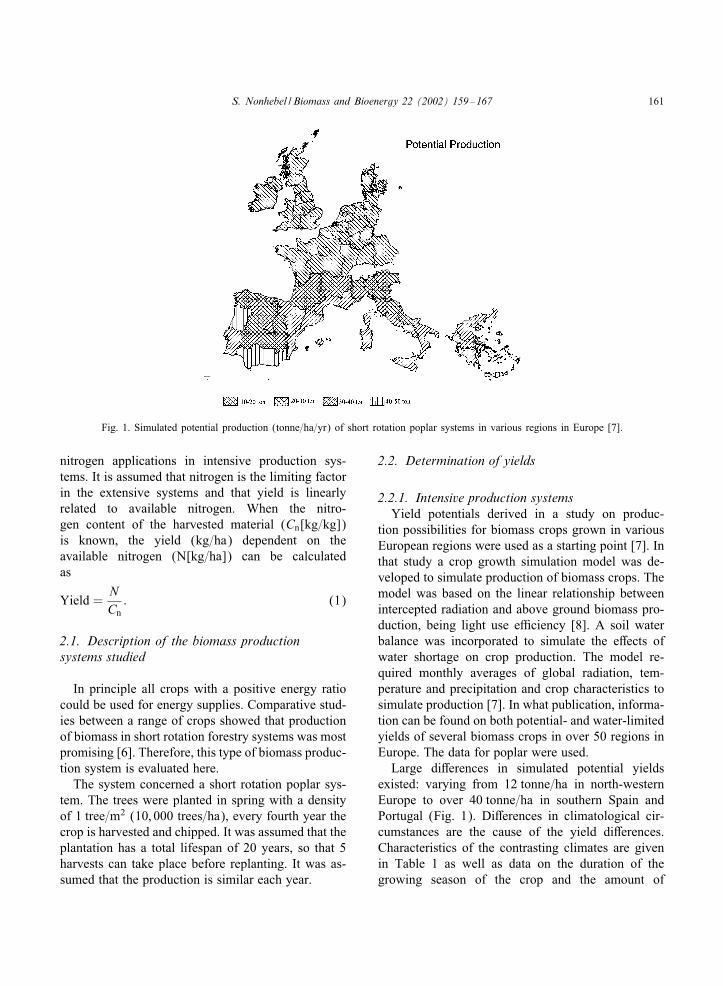
Table 1Climate characteristics of the two regions considered and theconsequences for simulated duration of the growing season andthe irrigation requirements∗
N- W Europe Portugal
Climate characteristicsAverage temperature (
◦C) 9.8 14.5
Solar radiation (MJ=m2) 3418 6122Precipitation (mm) 765 1150
Crop characteristicsDuration growing season (d) 140 240Irrigationrequired (mm) 0 495
∗Data obtained from Stol [9]; north-western Europe: weatherstation de Bilt, Portugal: weather station Beja.
irrigation required. The simulated growing seasonof the poplar coppice is twice as long in Portugalas in northern Europe. In the model the crop startsto grow at a temperature-sum of 200-degree-days(base temperature 5◦C). Due to di?erences in cli-mate the crop in Portugal starts to grow in Febru-ary and the crop in northern Europe in May. Thislonger growing season in combination with higherradiation levels is the main cause for the higherpotential yields in Portugal. The longer growing
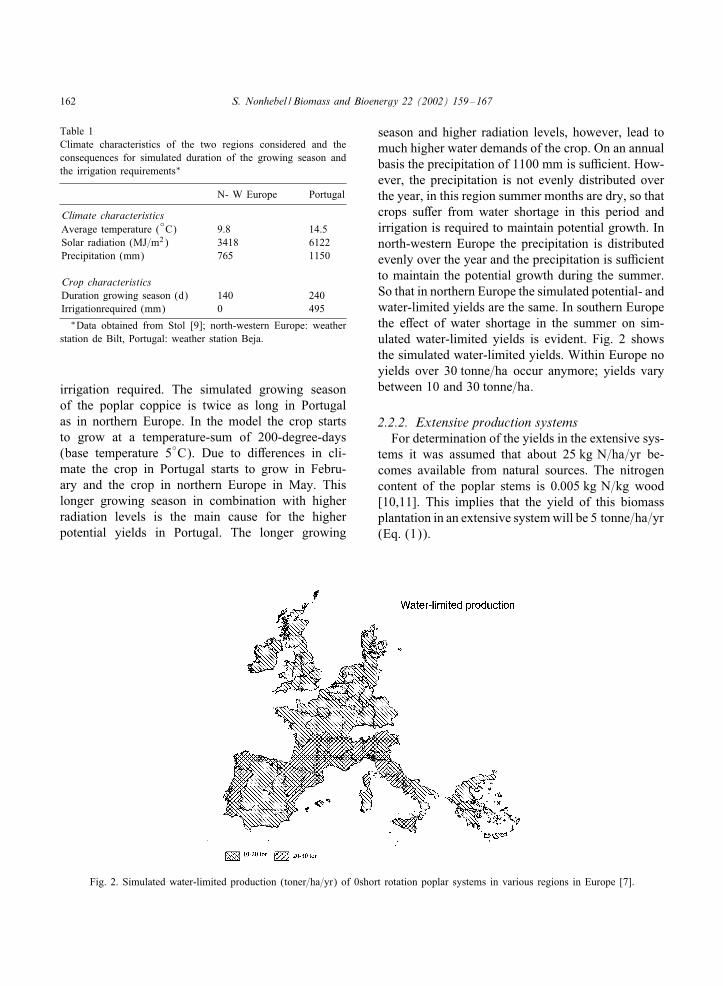
Fig. 2. Simulated water-limited production (toner=ha=yr) of 0short rotation poplar systems in various regions in Europe [7].
season and higher radiation levels, however, lead tomuch higher water demands of the crop. On an annualbasis the precipitation of 1100 mm is su/cient. How-ever, the precipitation is not evenly distributed overthe year, in this region summer months are dry, so thatcrops su?er from water shortage in this period andirrigation is required to maintain potential growth. Innorth-western Europe the precipitation is distributedevenly over the year and the precipitation is su/cientto maintain the potential growth during the summer.So that in northern Europe the simulated potential- andwater-limited yields are the same. In southern Europethe e?ect of water shortage in the summer on sim-ulated water-limited yields is evident. Fig. 2 showsthe simulated water-limited yields. Within Europe noyields over 30 tonne=ha occur anymore; yields varybetween 10 and 30 tonne=ha.
2.2.2. Extensive production systemsFor determination of the yields in the extensive sys-
tems it was assumed that about 25 kg N=ha=yr be-comes available from natural sources. The nitrogencontent of the poplar stems is 0:005 kg N=kg wood[10,11]. This implies that the yield of this biomassplantation in an extensive systemwill be 5 tonne=ha=yr(Eq. (1)).
S. Nonhebel / Biomass and Bioenergy 22 (2002) 159–167 163
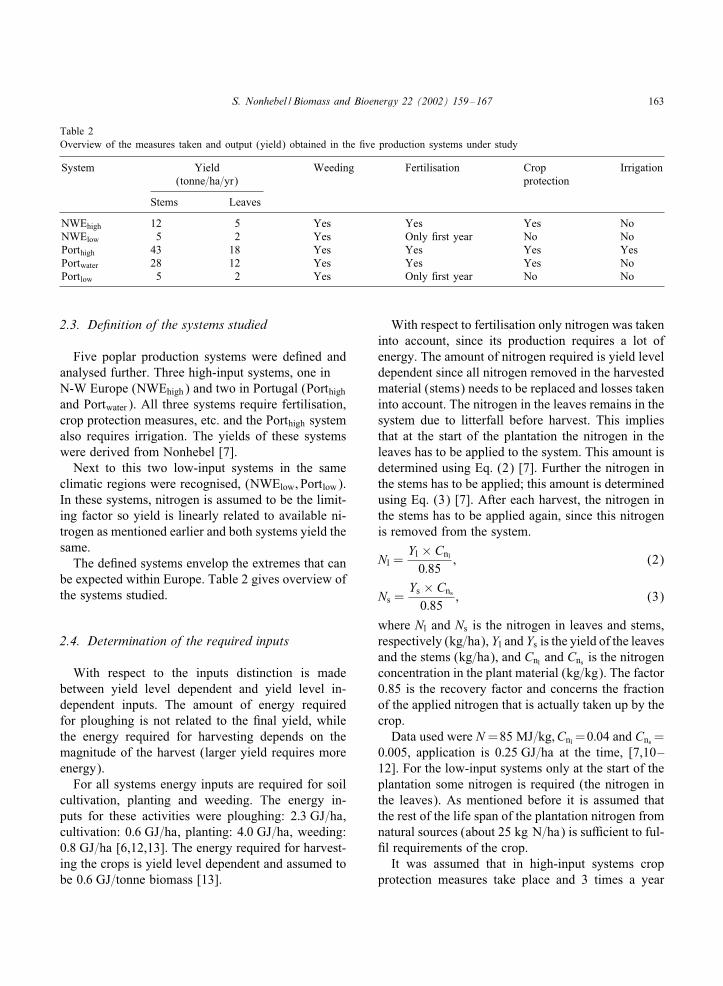
Table 2Overview of the measures taken and output (yield) obtained in the ,ve production systems under study
System Yield Weeding Fertilisation Crop Irrigation(tonne=ha=yr) protection
Stems Leaves
NWEhigh 12 5 Yes Yes Yes NoNWElow 5 2 Yes Only ,rst year No NoPorthigh 43 18 Yes Yes Yes YesPortwater 28 12 Yes Yes Yes NoPortlow 5 2 Yes Only ,rst year No No
2.3. De6nition of the systems studied
Five poplar production systems were de,ned andanalysed further. Three high-input systems, one inN-W Europe (NWEhigh) and two in Portugal (Porthighand Portwater). All three systems require fertilisation,crop protection measures, etc. and the Porthigh systemalso requires irrigation. The yields of these systemswere derived from Nonhebel [7].Next to this two low-input systems in the same
climatic regions were recognised, (NWElow ;Portlow).In these systems, nitrogen is assumed to be the limit-ing factor so yield is linearly related to available ni-trogen as mentioned earlier and both systems yield thesame.The de,ned systems envelop the extremes that can
be expected within Europe. Table 2 gives overview ofthe systems studied.
2.4. Determination of the required inputs
With respect to the inputs distinction is madebetween yield level dependent and yield level in-dependent inputs. The amount of energy requiredfor ploughing is not related to the ,nal yield, whilethe energy required for harvesting depends on themagnitude of the harvest (larger yield requires moreenergy).For all systems energy inputs are required for soil
cultivation, planting and weeding. The energy in-puts for these activities were ploughing: 2:3 GJ=ha,cultivation: 0:6 GJ=ha, planting: 4:0 GJ=ha, weeding:0:8 GJ=ha [6,12,13]. The energy required for harvest-ing the crops is yield level dependent and assumed tobe 0:6 GJ=tonne biomass [13].
With respect to fertilisation only nitrogen was takeninto account, since its production requires a lot ofenergy. The amount of nitrogen required is yield leveldependent since all nitrogen removed in the harvestedmaterial (stems) needs to be replaced and losses takeninto account. The nitrogen in the leaves remains in thesystem due to litterfall before harvest. This impliesthat at the start of the plantation the nitrogen in theleaves has to be applied to the system. This amount isdetermined using Eq. (2) [7]. Further the nitrogen inthe stems has to be applied; this amount is determinedusing Eq. (3) [7]. After each harvest, the nitrogen inthe stems has to be applied again, since this nitrogenis removed from the system.
Nl =Yl × Cnl0:85
; (2)
Ns =Ys × Cns0:85
; (3)
where Nl and Ns is the nitrogen in leaves and stems,respectively (kg=ha), Yl and Ys is the yield of the leavesand the stems (kg=ha), and Cnl and Cns is the nitrogenconcentration in the plant material (kg=kg). The factor0.85 is the recovery factor and concerns the fractionof the applied nitrogen that is actually taken up by thecrop.Data used were N =85 MJ=kg; Cnl =0:04 and Cns =
0:005, application is 0:25 GJ=ha at the time, [7,10–12]. For the low-input systems only at the start of theplantation some nitrogen is required (the nitrogen inthe leaves). As mentioned before it is assumed thatthe rest of the life span of the plantation nitrogen fromnatural sources (about 25 kg N=ha) is su/cient to ful-,l requirements of the crop.It was assumed that in high-input systems crop
protection measures take place and 3 times a year
164 S. Nonhebel / Biomass and Bioenergy 22 (2002) 159–167
the crops are sprayed with pesticides. Energy re-quirements of these measures were 0:2 GJ=ha indirectenergy for the applied pesticide and 0:2 GJ=ha for theapplication per spraying round [12,14]. It should benoted that the indirect energy of the pesticides is inthe same order as the direct energy for application.This is in contrast with the fertilisation were the indi-rect energy of the fertiliser is over 10 times as highas the application cost (70 kg N=ha = 6 GJ, whileapplication requires 0:25 GJ=ha).In the Porthigh system irrigation is required. The
amount required (I , mm) is derived from the simula-tion results in [7] as
I =Tpot − Twl
0:6; (4)
where Tpot (mm) is the transpiration of the crop inthe potential growth simulation run and Twl (mm)the transpiration of the crop in the water-limitedsimulation run. Since not all water applied can betaken up by the crop a ,eld application e/ciency of0.6 is used [15].The energy required for irrigation depends on the
distances over which water has to be transported. Val-ues of 0:13–7:7 MJ=m3 (1 MJ=m3 = 10 MJ=mm=ha)are found in literature [16]. The value 7:7 MJ=m3 isused here.It should be noted that values used both for nitrogen
recovery and for water use e/ciency (0.85 and 0.6)are high, in practice values will be lower.For all systems, the energy requirements of the in-
puts over the complete life span of the plantationare determined, based on the assumptions describedabove.
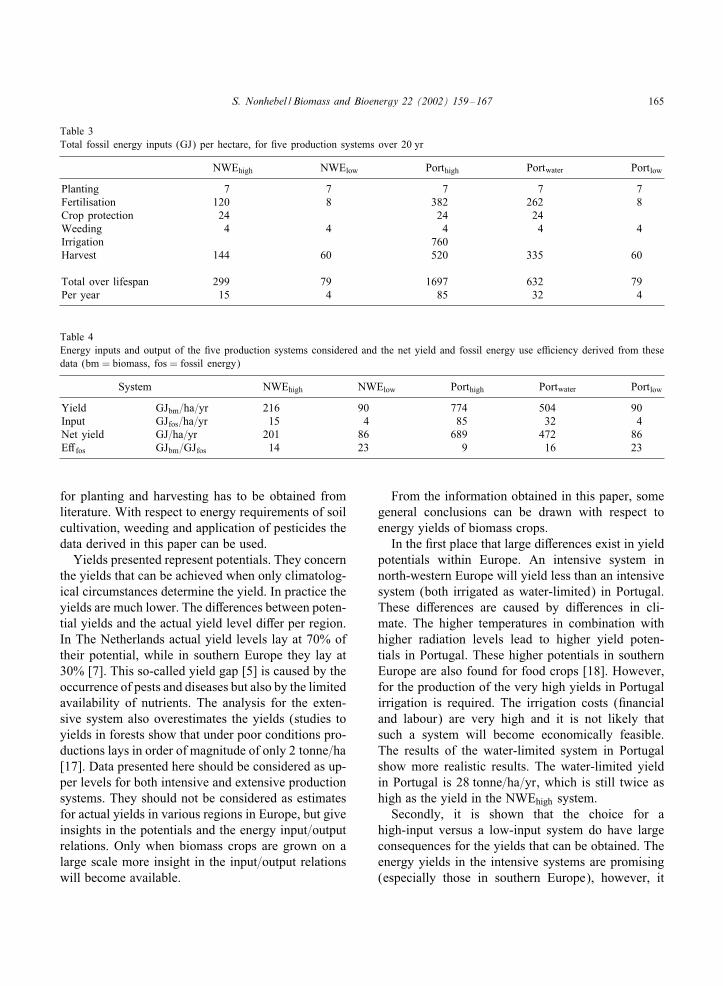
3. Results
The fossil energy inputs required for the produc-tion systems studied are summarised in Table 3 andinvolve total inputs over the complete lifespan of theplantation (20 yr). The high-input systems requiredmore fossil energy per hectare than the low-inputsystems, and the requirements of the Porthigh systemare about 5 times higher than the NWEhigh system.The inputs for planting, weeding and crop protectionwere similar for all production systems, while energyinputs for fertilisation and harvesting di?ered. The
energy requirements for irrigation were large. The en-ergy inputs of the Portwater system are only one-thirdof the energy inputs of the Porthigh system. In pro-duction systems that are not irrigated fertilisation andharvest are the largest energy users. Since the amountof nitrogen applied is related to the magnitude ofthe yield, high-yielding systems require more nitrogenthan the low-yielding systems. The same accounts forharvesting.The explanation for the very low-energy require-
ments of the low-input systems is that most of thenitrogen used in these systems originates from naturalsources (decomposition etc.) so that no fossil energyis required for the production of arti,cial nitrogen andnone for the application of it.The heating value of poplar wood is 18 MJ=kg (dry
weight). By multiplying yield in kg with the heatingvalue the energy yield can be calculated. The resultsare given in Table 4. The net yield is the di?erencebetween harvested energy and the energy inputs. Forall systems this value is positive. This implies that allsystems are net energy producers and are in principlesuitable for energy production. The intensive systemin Portugal produces about 7 times as much energy perhectare as the extensive systems (689 versus 86 GJ).The e/ciency in which the systems use fossil en-
ergy di?ers a lot and is expressed in the value of theenergy use e/ciency (also given in Table 4). Thelow-input systems produce 23 GJ biomass (GJbm)per GJ fossil energy (GJfos) while the high-inputsystems in The Netherlands and Portugal only9–16 GJbm=GJfos.So the choice for a low-input system implies that
fossil energy is used very e/ciently, but that not muchenergy is gained, while the choice for a high-inputsystem implies that a lot of energy is gained but thatfossil energy is not used very e/ciently.
4. Discussion
In this paper the characteristics for a short rota-tion poplar system were determined. The method pre-sented, however, can also be used to evaluate energye/ciencies other energy crops. In that case potential-and water-limited yields of these crops can be ob-tained from [7]. Information on nitrogen contents ofthe harvested material and on energy requirements
S. Nonhebel / Biomass and Bioenergy 22 (2002) 159–167 165
Table 3Total fossil energy inputs (GJ) per hectare, for ,ve production systems over 20 yr
NWEhigh NWElow Porthigh Portwater Portlow
Planting 7 7 7 7 7Fertilisation 120 8 382 262 8Crop protection 24 24 24Weeding 4 4 4 4 4Irrigation 760Harvest 144 60 520 335 60
Total over lifespan 299 79 1697 632 79Per year 15 4 85 32 4
Table 4Energy inputs and output of the ,ve production systems considered and the net yield and fossil energy use e/ciency derived from thesedata (bm = biomass, fos = fossil energy)
System NWEhigh NWElow Porthigh Portwater Portlow
Yield GJbm=ha=yr 216 90 774 504 90Input GJfos=ha=yr 15 4 85 32 4Net yield GJ=ha=yr 201 86 689 472 86E?fos GJbm=GJfos 14 23 9 16 23
for planting and harvesting has to be obtained fromliterature. With respect to energy requirements of soilcultivation, weeding and application of pesticides thedata derived in this paper can be used.Yields presented represent potentials. They concern
the yields that can be achieved when only climatolog-ical circumstances determine the yield. In practice theyields are much lower. The di?erences between poten-tial yields and the actual yield level di?er per region.In The Netherlands actual yield levels lay at 70% oftheir potential, while in southern Europe they lay at30% [7]. This so-called yield gap [5] is caused by theoccurrence of pests and diseases but also by the limitedavailability of nutrients. The analysis for the exten-sive system also overestimates the yields (studies toyields in forests show that under poor conditions pro-ductions lays in order of magnitude of only 2 tonne=ha[17]. Data presented here should be considered as up-per levels for both intensive and extensive productionsystems. They should not be considered as estimatesfor actual yields in various regions in Europe, but giveinsights in the potentials and the energy input=outputrelations. Only when biomass crops are grown on alarge scale more insight in the input=output relationswill become available.
From the information obtained in this paper, somegeneral conclusions can be drawn with respect toenergy yields of biomass crops.In the ,rst place that large di?erences exist in yield
potentials within Europe. An intensive system innorth-western Europe will yield less than an intensivesystem (both irrigated as water-limited) in Portugal.These di?erences are caused by di?erences in cli-mate. The higher temperatures in combination withhigher radiation levels lead to higher yield poten-tials in Portugal. These higher potentials in southernEurope are also found for food crops [18]. However,for the production of the very high yields in Portugalirrigation is required. The irrigation costs (,nancialand labour) are very high and it is not likely thatsuch a system will become economically feasible.The results of the water-limited system in Portugalshow more realistic results. The water-limited yieldin Portugal is 28 tonne=ha=yr, which is still twice ashigh as the yield in the NWEhigh system.Secondly, it is shown that the choice for a
high-input versus a low-input system do have largeconsequences for the yields that can be obtained. Theenergy yields in the intensive systems are promising(especially those in southern Europe), however, it
166 S. Nonhebel / Biomass and Bioenergy 22 (2002) 159–167
should be realised that the production systems stud-ied are comparable the intensive food productionsystems (use of crop protection agents and fertilis-ers). The environmental impacts of the intensivefood production systems are large. Within Europea shift to more environmental friendly (organic)agriculture is observed. This implies that the fea-sibility of high input-intensive biomass productionsystems in future will be small. From that point ofview extensive biomass production systems are morepromising. The energy yields of the low-input sys-tems are very low. Low yields imply that more land isrequired to produce the same amount of energy.(Example the low-input systems require 7 times asmuch land for the production of the same amount ofenergy as the irrigated system in Portugal.)The reduction of the fossil energy use e/ciency as
is observed in the food studies is also found in theanalysis of biomass crops done in this paper. With theintensi,cation of the production system the fossil en-ergy use e/ciency declines, but the net energy yieldincreases. Which shows that the fossil fuel use e/-ciency is not an appropriate tool to evaluate biomassproduction systems.In practice the feasibility of these systems is deter-
mined by the cost-e?ectiveness of the systems. Sincethe ,xed costs of these systems (land, plant material)are high, changes in yields will have large impact onthe cost-e?ectiveness. Which shows the importance ofappropriate yield data for evaluating the biomass pro-duction systems.It is shown that yield potentials di?er per region and
that the production systems (extensive=intensive) ap-plied have large impacts on yields. Since yields are thekey factors in all discussions on suitability of biomassas an energy source, variables as regional growingconditions and production systems applied should beincluded in the assessments.
5. Conclusion
Like food crops, biomass crops can also be grownin di?erent production systems (varying from exten-sive to intensive systems. The choice for a certain sys-tem has large consequences for the (energy) yieldsthat can be expected. The production of the extensivesystems is much lower than the production of the in-
tensive systems. In here a di?erence of a factor 7 wasfound. The fossil energy use e/ciency of the exten-sive systems is, however, higher: these systems pro-duce more energy per unit of fossil energy.
References
[1] Naylor RL. Energy and resource constraints on agriculturalproduction. Annual Review of Energy and the Environment1996;21:99–123.
[2] Kramer KJ, Moll HC, Nonhebel S. Total greenhouse gasemissions related to the Dutch crop production system.Agriculture, Ecosystems & Environment 1999;72:9–16.
[3] Schroll H. Energy-Row and ecological sustainability inDanish agriculture. Agriculture, Ecosystems & Environment1994;51:301–10.
[4] Conforti P, Giampietro M. Fossil energy use in agriculture:an international comparison. Agriculture, Ecosystems &Environment 1997;65:231–43.
[5] Ittersum MKv, Rabbinge R. Concepts in production ecologyfor analysis and quanti,cation of agricultural input–outputcombinations. Field Crops Research 1997;52:197–208.
[6] Lysen EH, Daey Ouwens C, Onna MJG, Blok K, OkkenPA, Goudriaan J. De haalbaarheid van de productievan biomassa voor de Nederlandse energie huishouding.Apeldoorn, November, 1992.
[7] Nonhebel S. Harvesting the sun’s energy usingagro-ecosystems. Quantiative Approaches in SystemsAnalysis No 13. Wageningen, AB-DLO, 1997.
[8] Monteith JL. Climate and the e/ciency of crop production inBritain. Philosophical Transactions Royal Society of London1977;282:277–94.
[9] Stol W. Synoptic and climatic data for agro-ecologicalresearch. The AB-Met database. Simulation report CABO-TTNo 37. Wageningen, 1994.
[10] Nilson LO, Eckersten H. Willow production as a functionof radiation and temperature. Agricultural Meteorology1983;30:49–57.
[11] Eckersten H, Slapokas T. Modelling nitrogen and productionin an irrigated shortrotation forest. Agricultural and ForestMeteorology 1990;50:99–123.
[12] Eriks WA, Exel JCVP, Fabler FJ, Mager A, Pietersma D.Energie uit landbouw, PGO verslag, Vakgroep Agrotechnieken-fysica, LUW, Wageningen, 1991.
[13] Hall DO, RosilloCale F, Williams RH, Woods J. Biomass forenergy: supply prospects. In: Johansson TB, Kelly H, ReddyAKN, Williams RH, editors. Renewable energy. Washington:Island Press, 1993. p. 593–651.
[14] Pimentel 1980. Handbook of energy utilization in agriculture.Boca Raton, FL, CRC Press, p. 45–8.
[15] Koning GHJ de, Janssen H, van Keulen H. Input and outputcoe/cients of various cropping and livestock systems in theEuropean Communities. Netherlands Scienti,c Council forGovernment Policy, The Hague, 1992.
[16] Stanhill G. E/ciency of water, solar energy and fossil fueluse in crop production. In: Johnson CB, editor. Physiological

S. Nonhebel / Biomass and Bioenergy 22 (2002) 159–167 167
processes limiting plant productivity. Proceedings of the30th University of Nottingham Easter School in AgriculturalScience. London [etc.]: Butterworths, 2–5 April 1979. 1981.p. 39–51.
[17] Cannell MGR. World forest biomass and primary productiondata. London: Academic Press, 1982. 391pp.
[18] WRR. Grond voor keuzen. Wetenschappelijke Raad voor hetRegeringsbeleid, Sdu uitgeverij, Den Haag, 1992.


