Emily Miller, Fred Croom, Tene Franklin Hamilton, Kimberly Glenn
Cardiac Deaths and Food Deserts
in Knox County, TN

This project is intended for the Office of Minority Health and Disparities Elimination in the Tennessee Department of Health as a product of a student internship. The work will be presented to East Tennessee State University as a sign of completing objectives defined by the College of Public Health for the required internship for the Master’s program and is a part of the student’s culminating experience.
Background
This study hopes to address the link between cardiac deaths and access to healthy foods for Knox County, TN
Introduction
DefinitionFor this study we used Death Statistical Systems
data from Vital Records in the Tennessee Department of Health
ICD-10 codes for myocardial infarction, heart failure, stroke, and coronary artery disease. The events were selected as being the Underlying Cause of Death, which includes codes: I21.0-I21.4, I21.9-122.1, I22.8-I23.6, I23.8; I11.0, I13.0, I42.0-I42.9, I50.0, I50.1, I50.9, I51.7; I60.0-I60.9, I61.0-I61.9, I63.0-I63.9, I64, I65.0-I65.9; I20.0, I20.8, I20.9, I21.0-I25.9 and I51.6.
Cardiac Deaths
Age-Adjustment
Since age is a risk factor associated with cardiac deaths it is important that we use age-adjusted rates in order to compare two populations
Cardiac Deaths
Data from the 2010 census was used for demarcating populations within Knox County
This was better than zip code data since these lines fall outside of county boundaries
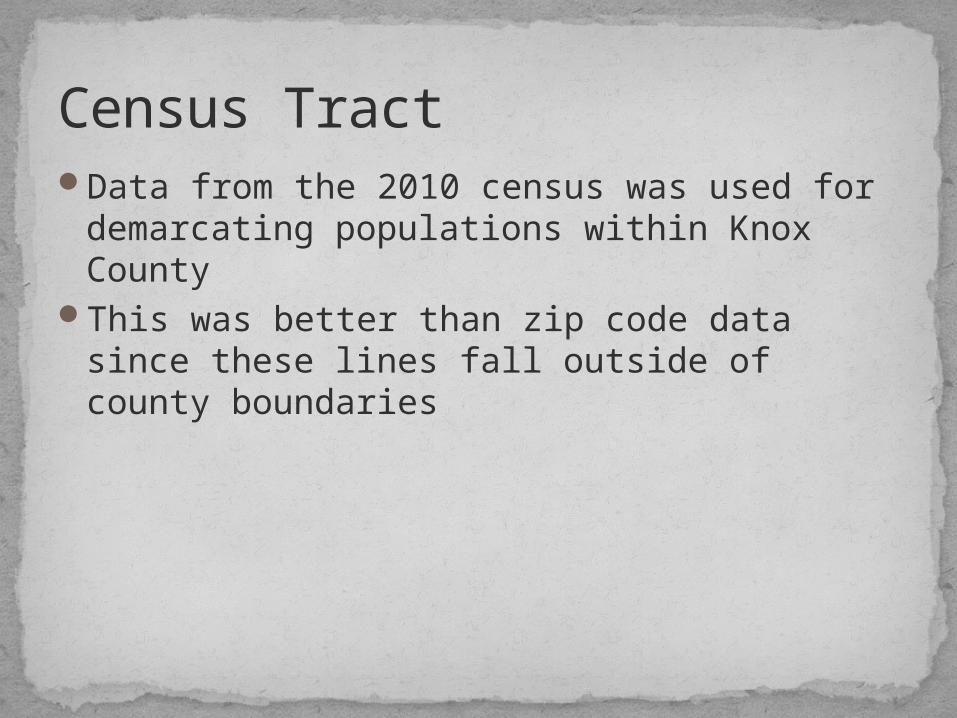
Census Tract
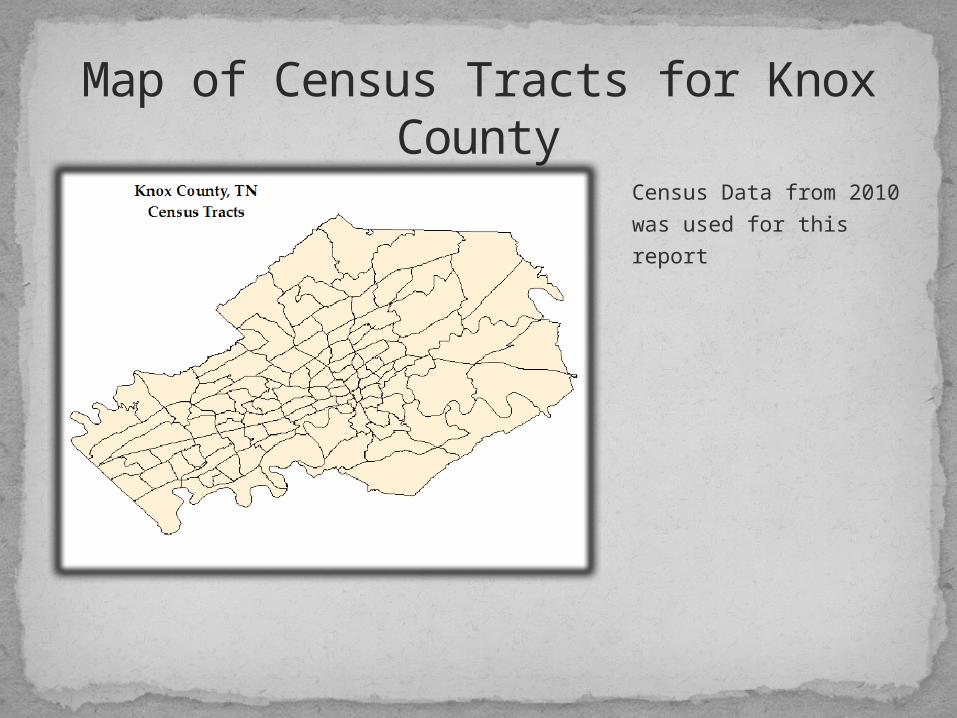
Map of Census Tracts for Knox County
Census Data from 2010
was used for this report
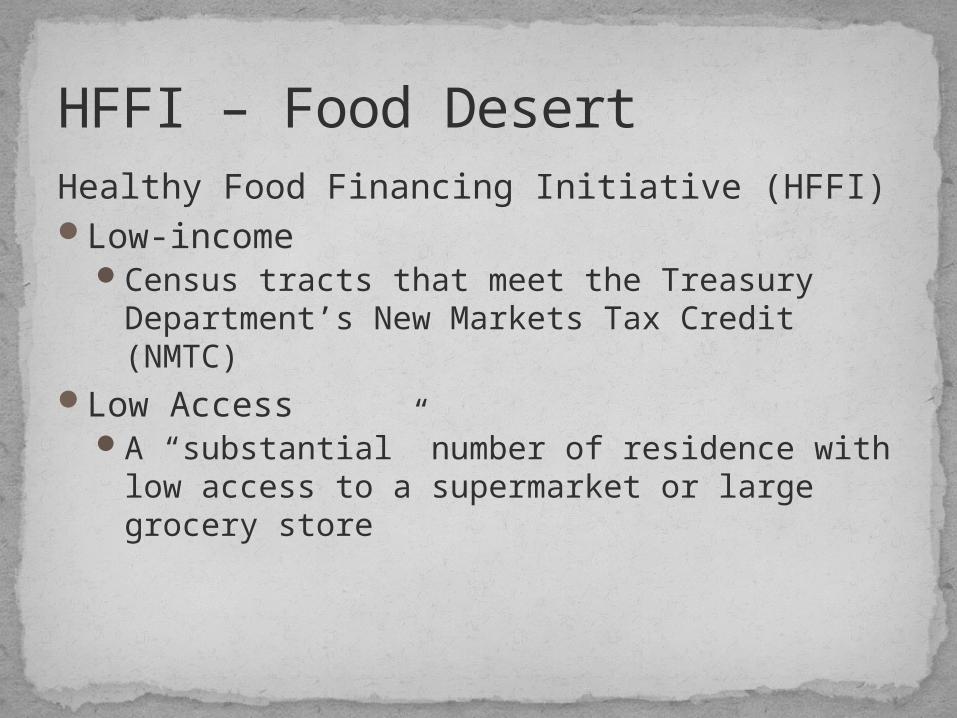
Healthy Food Financing Initiative (HFFI)Low-income
Census tracts that meet the Treasury Department’s New Markets Tax Credit (NMTC)
Low AccessA “substantial” number of residence with low
access to a supermarket or large grocery store
HFFI – Food Desert
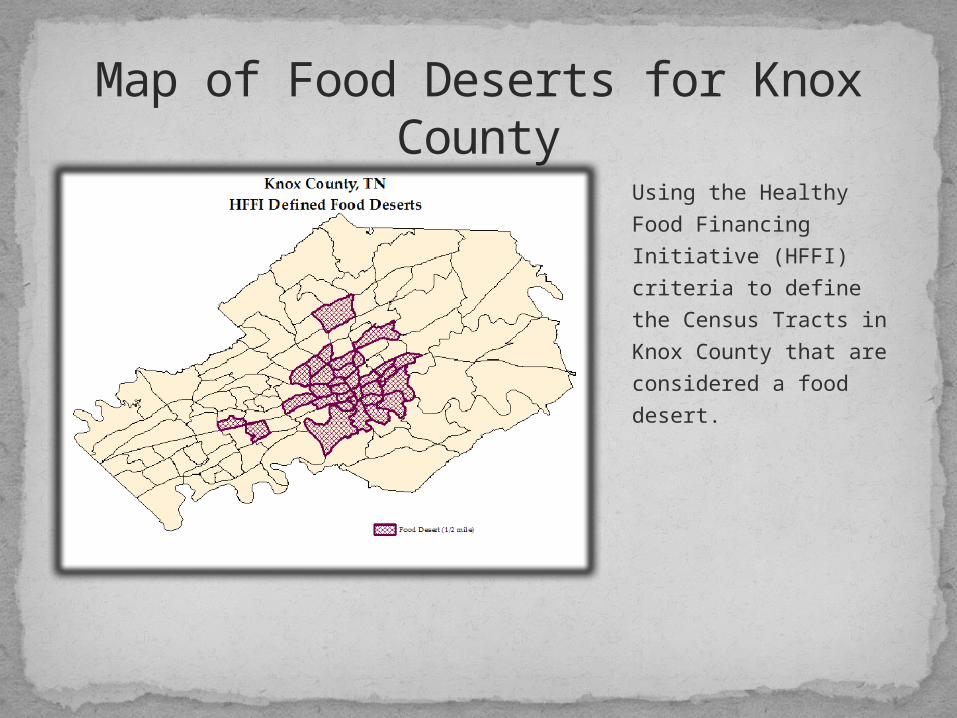
Map of Food Deserts for Knox County
Using the Healthy Food
Financing Initiative
(HFFI) criteria to define
the Census Tracts in
Knox County that are
considered a food
desert.
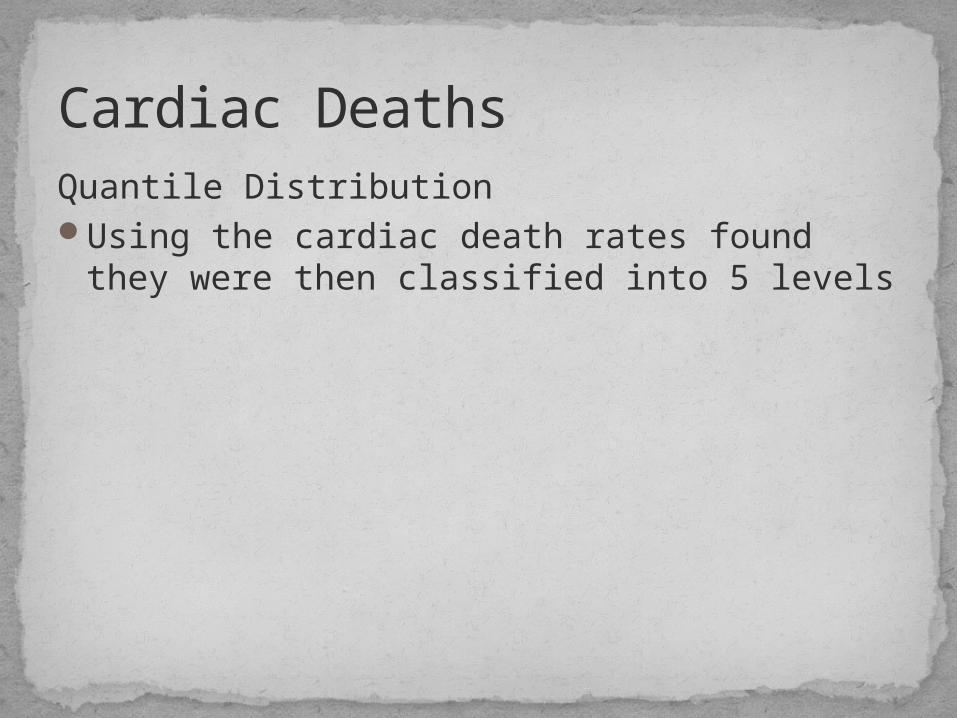
Quantile DistributionUsing the cardiac death rates found they
were then classified into 5 levels
Cardiac Deaths
Map of Cardiac Death Rates for Knox County
Age adjusted cardiac
death rates were
calculated using SAS for
each census tract. A
quantile distribution of
rates were used to
classify into 5 levels
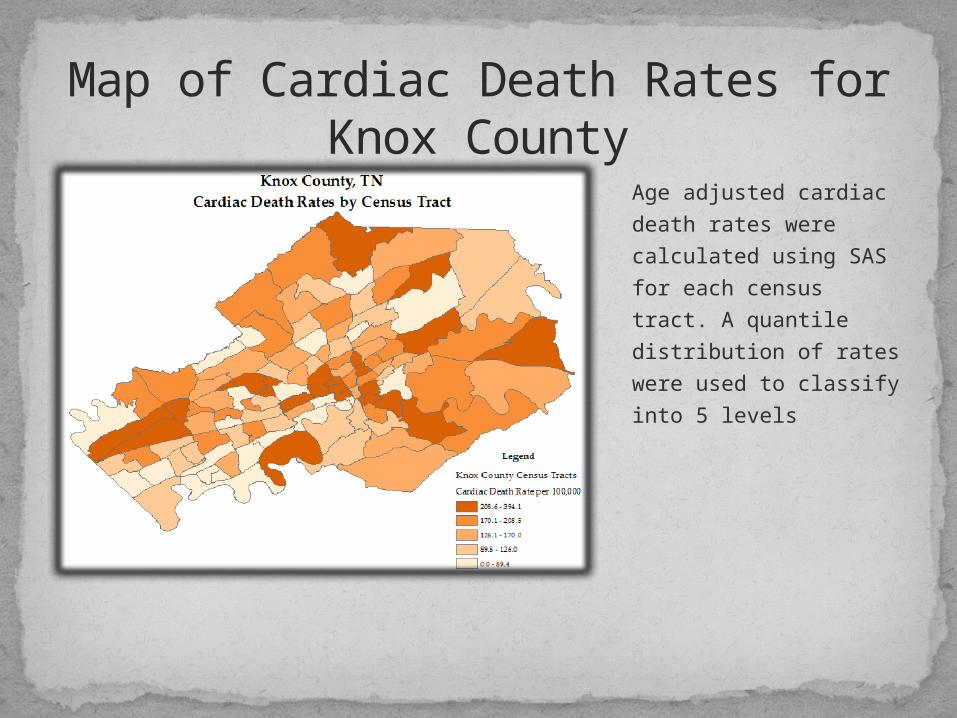
Comparing Rates between Census TractsUsing ArcMap to export data to excel a two-tailed
t-test was used to assess the cardiac rates in census tracts considered to be food deserts and cardiac death rates in census tracts not considered to be a food desert
Cardiac Death Rates Compared to Food Deserts
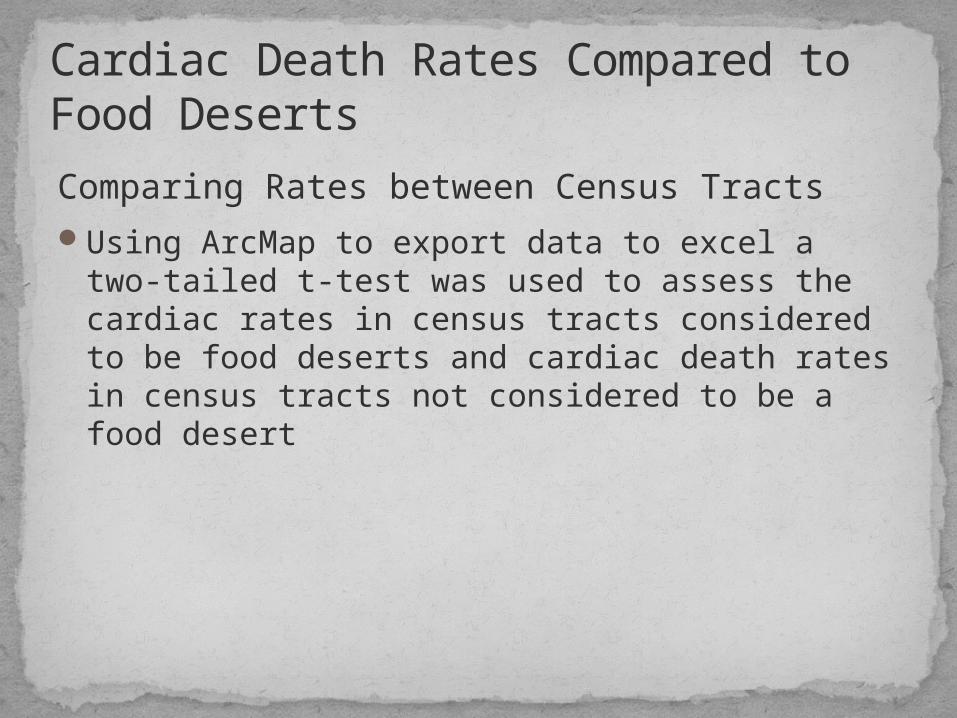
Map of Cardiac Death Rates for Knox County
Cardiac Death Rates
compared between
census tracts considered
to be a food desert and
those that were not.
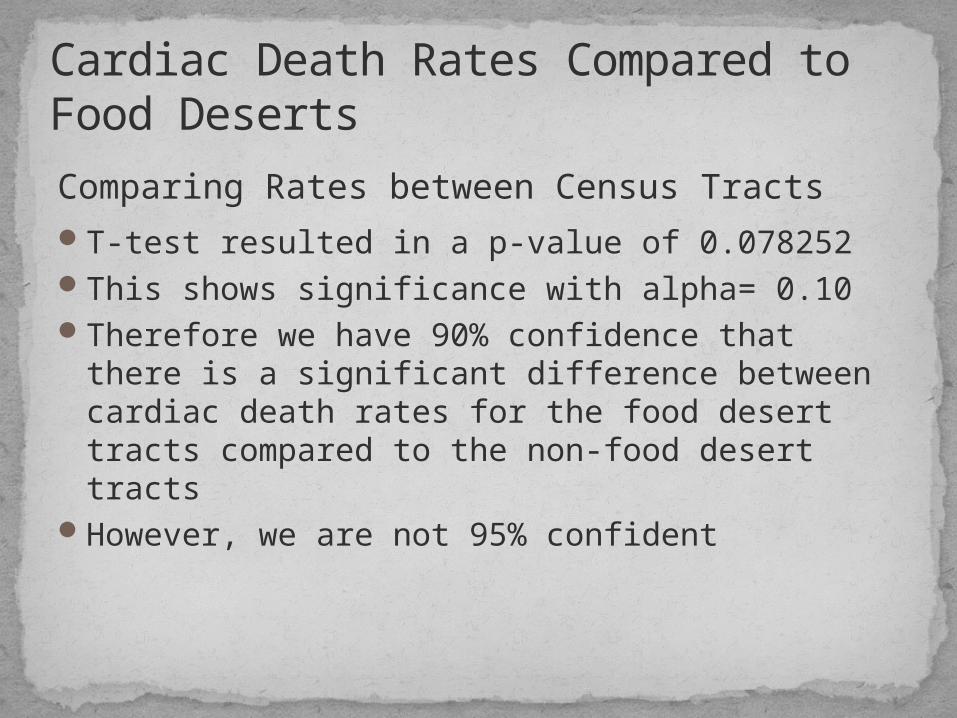
Comparing Rates between Census TractsT-test resulted in a p-value of 0.078252This shows significance with alpha= 0.10Therefore we have 90% confidence that there is a
significant difference between cardiac death rates for the food desert tracts compared to the non-food desert tracts
However, we are not 95% confident
Cardiac Death Rates Compared to Food Deserts
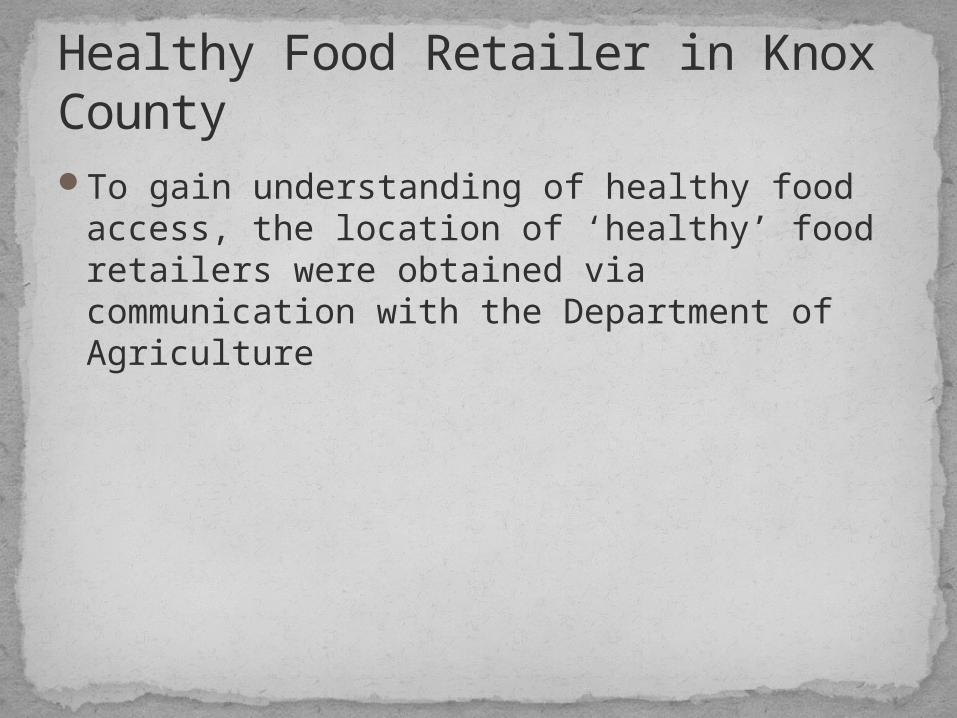
To gain understanding of healthy food access, the location of ‘healthy’ food retailers were obtained via communication with the Department of Agriculture
Healthy Food Retailer in Knox County
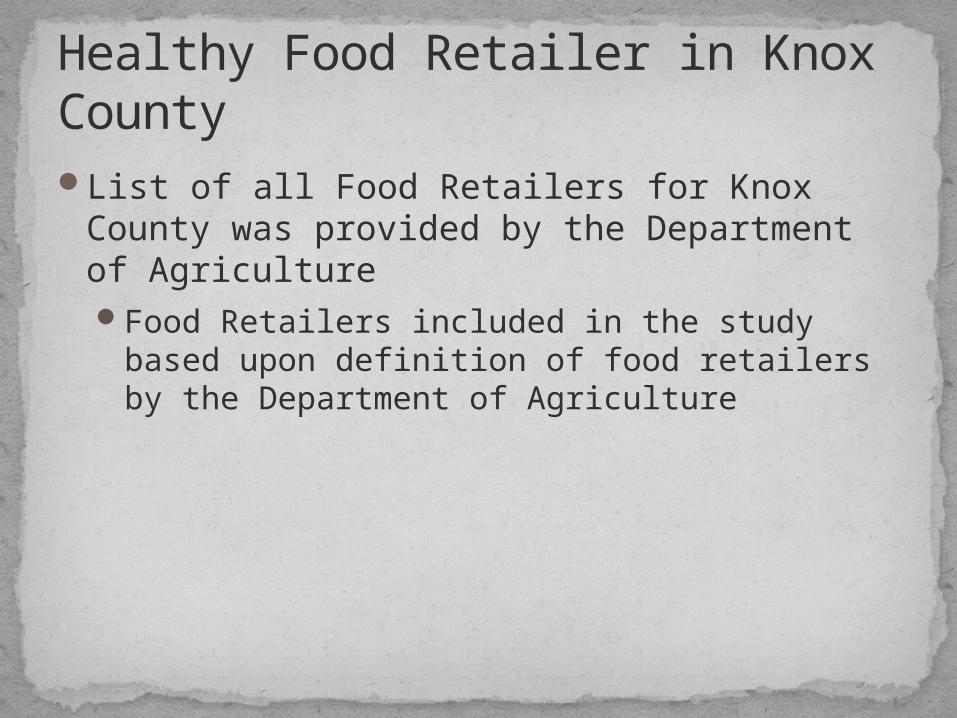
List of all Food Retailers for Knox County was provided by the Department of AgricultureFood Retailers included in the study based
upon definition of food retailers by the Department of Agriculture
Healthy Food Retailer in Knox County
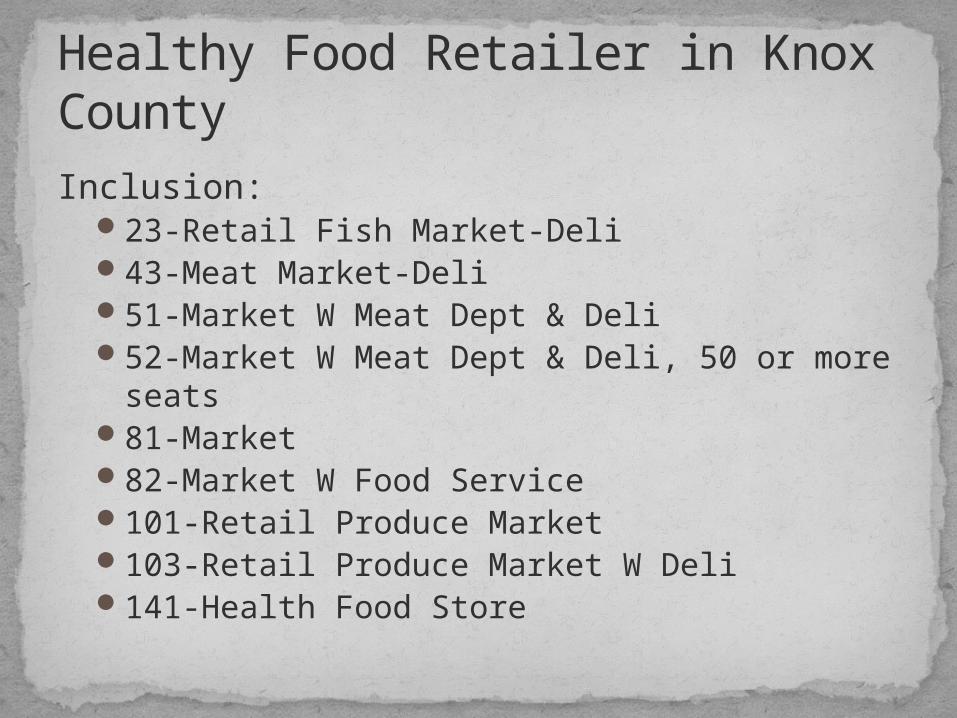
Inclusion:23-Retail Fish Market-Deli43-Meat Market-Deli51-Market W Meat Dept & Deli52-Market W Meat Dept & Deli, 50 or more
seats81-Market82-Market W Food Service101-Retail Produce Market103-Retail Produce Market W Deli141-Health Food Store
Healthy Food Retailer in Knox County
Geocode AddressesThe list of food retailers include addresses
which were used to geocode their locations
Healthy Food Retailer in Knox County
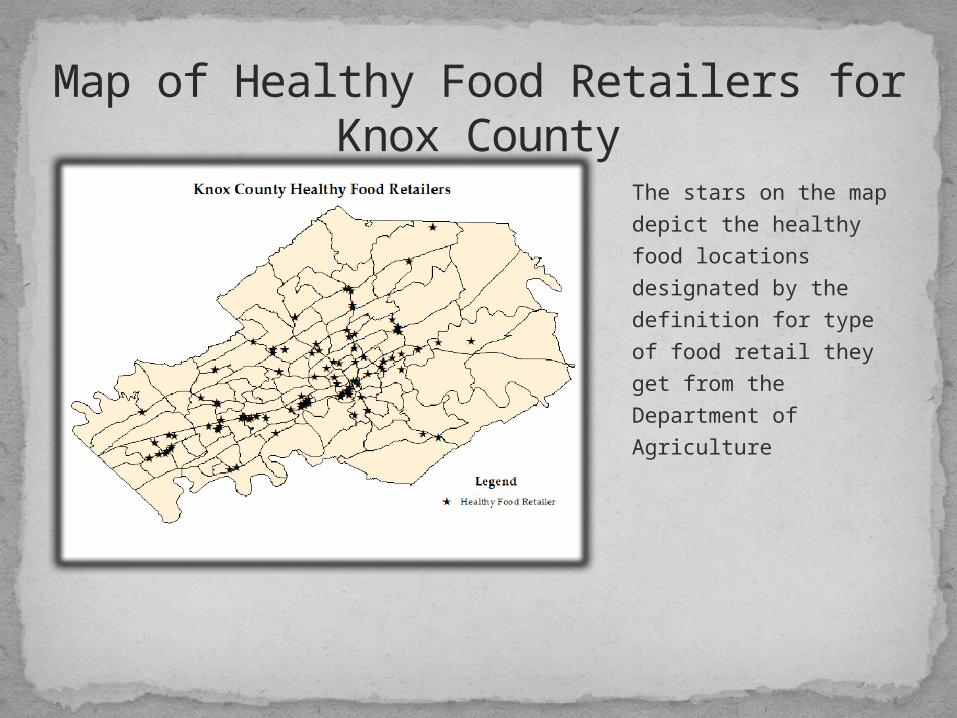
Map of Healthy Food Retailers for Knox County
The stars on the map
depict the healthy food
locations designated by
the definition for type of
food retail they get from
the Department of
Agriculture
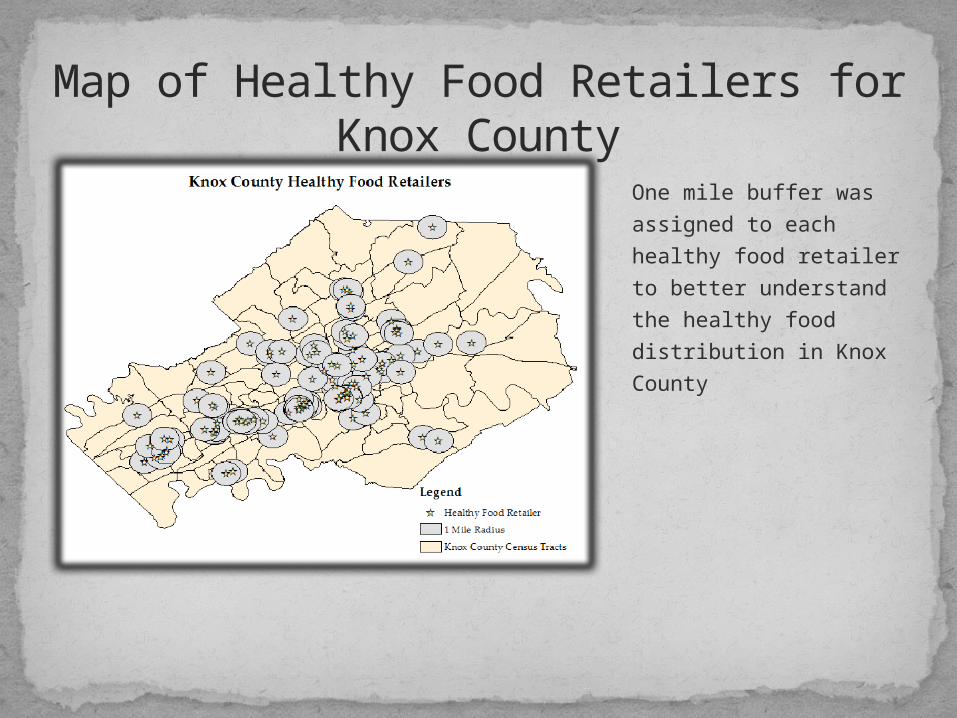
Map of Healthy Food Retailers for Knox County
One mile buffer was
assigned to each healthy
food retailer to better
understand the healthy
food distribution in Knox
County
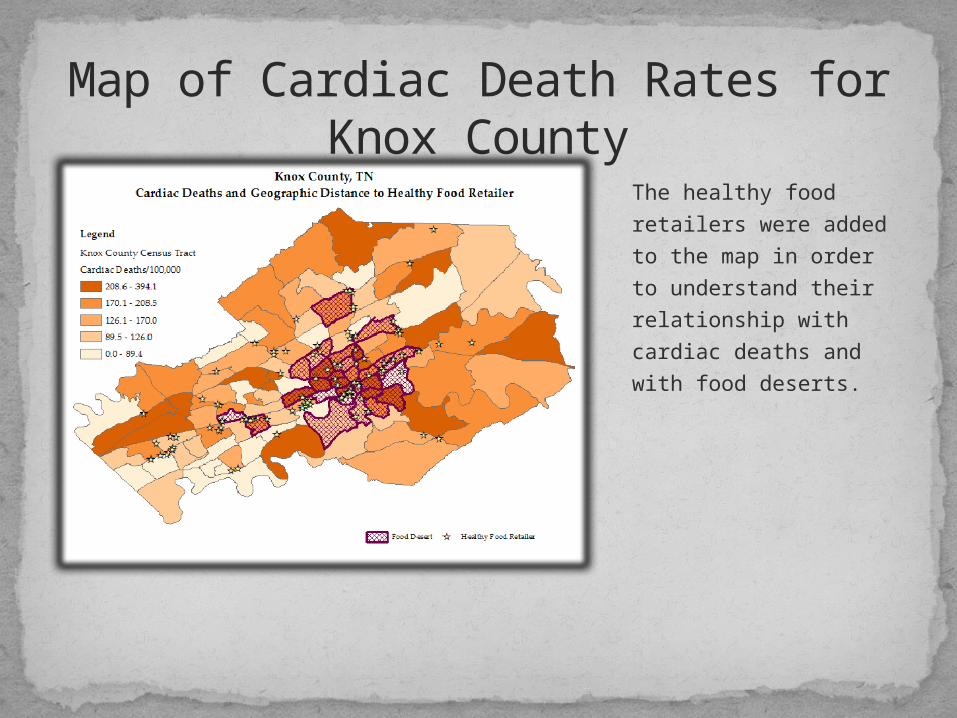
Map of Cardiac Death Rates for Knox County
The healthy food
retailers were added to
the map in order to
understand their
relationship with
cardiac deaths and with
food deserts.
There is a significant difference in the rate of cardiac deaths for individuals living within a food desert compared to those living outside a food desert at the 90% confidence level.
Results
Difficulty in defining food deserts
Limitations
Because of the geographical nature of Knox county identifying food deserts can be difficult.Walkability improves access to retailersIncreased
Discussions
CDC. Heart Disease facts. (2015) Heart Disease. Last updated: February 19, 2015. Retrieved from: http://www.cdc.gov/heartdisease/facts.htm.
WHO. Cardiovascular diseases (CVDs). Media centre. Fact sheet N°317. Updated January 2015. Retrieved from: http://www.who.int/mediacentre/factsheets/fs317/en/.
Mayo Clinic. Heart Disease. (2014) Diseases and Conditions. Retrieved from: http://www.mayoclinic.org/diseases-conditions/heart-disease/basics/definition/con-20034056.
Definition of a food desert. United States Department of Agriculture. Economic Research Service. http://www.ers.usda.gov/dataFiles/Food_Access_Research_Atlas/Download_the_Data/Archived_Version/archived_documentation.pdf.
Heath, G. W., & Troped, P. J. (2012). The role of the built environment in shaping the health behaviors of physical activity and healthy eating for cardiovascular health. Future Cardiology, 8(5), 677+. (doi: 10.2217/fca.12.52) Retrieved from: http://go.galegroup.com.ezproxy.etsu.edu:2048/ps/i.do?id=GALE%7CA303403368&v=2.1&u=tel_a_etsul&it=r&p=EAIM&sw=w&asid=a483820e0d805935703afc06fdc40841.
Pedigo AS; Odoi A. Investigation of Disparities in Geographic Accessibility to Emergency Stroke and Myocardial Infarction Care in East Tennessee Using Geographic Information Systems and Network Analysis. Annals of Epidemiology , Volume 20 , Issue 12 , 924 – 930 Retrieved from: http://www.sciencedirect.com.ezproxy.etsu.edu:2048/science/article/pii/S104727971000164X.
Erwin, P. C.; Fitzhugh, E. C.; Brown, K. C.; Looney, S.; Forde, T.(2010). Health Disparities in Rural Areas: The Interaction of Race, Socioeconomic Status, and Geography. Journal of Health Care for the Poor and Underserved 21(3), 931-945. The Johns Hopkins University Press. Retrieved from: https://muse-jhu-edu.ezproxy.etsu.edu:3443/journals/journal_of_health_care_for_the_poor_and_underserved/v021/21.3.erwin.html.
Botchwey, N. D., Falkenstein, R., Levin, J., Fisher, T., & Trowbridge, M. (2014). The Built Environment and Actual Causes of Death Promoting an Ecological Approach to Planning and Public Health. Journal of Planning Literature, 0885412214561337.
Auchincloss, A. H., Mujahid, M. S., Shen, M., Michos, E. D., Whitt‐Glover, M. C., & Diez Roux, A. V. (2013). Neighborhood health‐promoting resources and obesity risk (the multi‐ethnic study of atherosclerosis). Obesity, 21(3), 621-628. doi: 10.1002/oby.20255. Retrieved from: http://onlinelibrary.wiley.com/doi/10.1002/oby.20255/epdf.
Diez Roux, A. V.; Merkin, S. S.; Arnett, D. ; Chambless, L.; Massing, M.; Nieto, F. J.; Sorlie, P.; Szklo, M.; Tyroler, H. A.; Watson, R. L. Neighborhood of Residence and Incidence of Coronary Heart Disease.. N Engl J Med 2001; 345:99-106July 12, 2001DOI: 10.1056/NEJM200107123450205. Retrieved from: http://www.nejm.org/doi/full/10.1056/NEJM200107123450205.
Swinburn B, Sacks G, Gortmaker S, et al. The global obesity pandemic: shaped by global drivers and local environments. The Lancet [serial online]. 2011;(9793):804. Available from: InfoTrac Health Reference Center Academic, Ipswich, MA. https://www-clinicalkey-com.ezproxy.etsu.edu:3443/#!/content/playContent/1-s2.0-S0140673611608131.
The Appalachian Region (2015). Appalachian Regional Commission. Retrieved from: http://www.arc.gov/appalachian_region/TheAppalachianRegion.asp.
References


