Jay Shambaugh, Ryan Nunn, and Becca Portman
ECONOMIC FACTS | DECEMBER 2017
Eleven Facts about Innovation and Patents
W W W . H A M I L T O N P R O J E C T . O R G
The Hamilton Project seeks to advance America’s promise of
opportunity, prosperity, and growth. The Project’s economic
strategy reflects a judgment that long-term prosperity is best
achieved by fostering economic growth and broad participation
in that growth, by enhancing individual economic security, and by
embracing a role for effective government in making needed public
investments. We believe that today’s increasingly competitive
global economy requires public policy ideas commensurate with
the challenges of the 21st century. Our strategy calls for combining
increased public investments in key growth-enhancing areas, a
secure social safety net, and fiscal discipline. In that framework,
the Project puts forward innovative proposals from leading
economic thinkers — based on credible evidence and experience,
not ideology or doctrine — to introduce new and effective policy
options into the national debate.
The Project is named after Alexander Hamilton, the nation’s
first treasury secretary, who laid the foundation for the modern
American economy. Consistent with the guiding principles of
the Project, Hamilton stood for sound fiscal policy, believed
that broad-based opportunity for advancement would drive
American economic growth, and recognized that “prudent aids
and encouragements on the part of government” are necessary to
enhance and guide market forces.
MISSION STATEMENT
We are grateful to Scott Andes, Lauren Bauer, James Bessen,
David Dreyer, Joy Fox, Michael Frakes, Emily Hostage, Kriston
McIntosh, Robert Seamans, and Michael Webb, as well as Audrey
Breitwieser, Nicholas Fedorochko, and Patrick Liu for excellent
research assistance. Karna Malaviya contributed substantially to
the development of this document. We are also grateful to David
Popp, Nicholas Bloom, Charles Jones, John Van Reenen, Michael
Webb, and RPX for generously sharing their data.
ACKNOWLEDGMENTS
The Hamilton Project • Brookings i
Eleven Facts about Innovation and Patents
Introduction
Improvement in living standards over time is not inevitable or automatic. Rather, it is made possible by increases in physical and human capital, technological progress that itself might require large investments, and well-designed institutions. In this set of eleven economic facts, we explore central features of the innovation system, including patents, research and development (R&D) investments, and science, technology, engineering, and mathematics (STEM) education. Following this analysis, we highlight opportunities to enhance the effectiveness of the innovation system, thereby contributing to faster technological progress and economic growth.
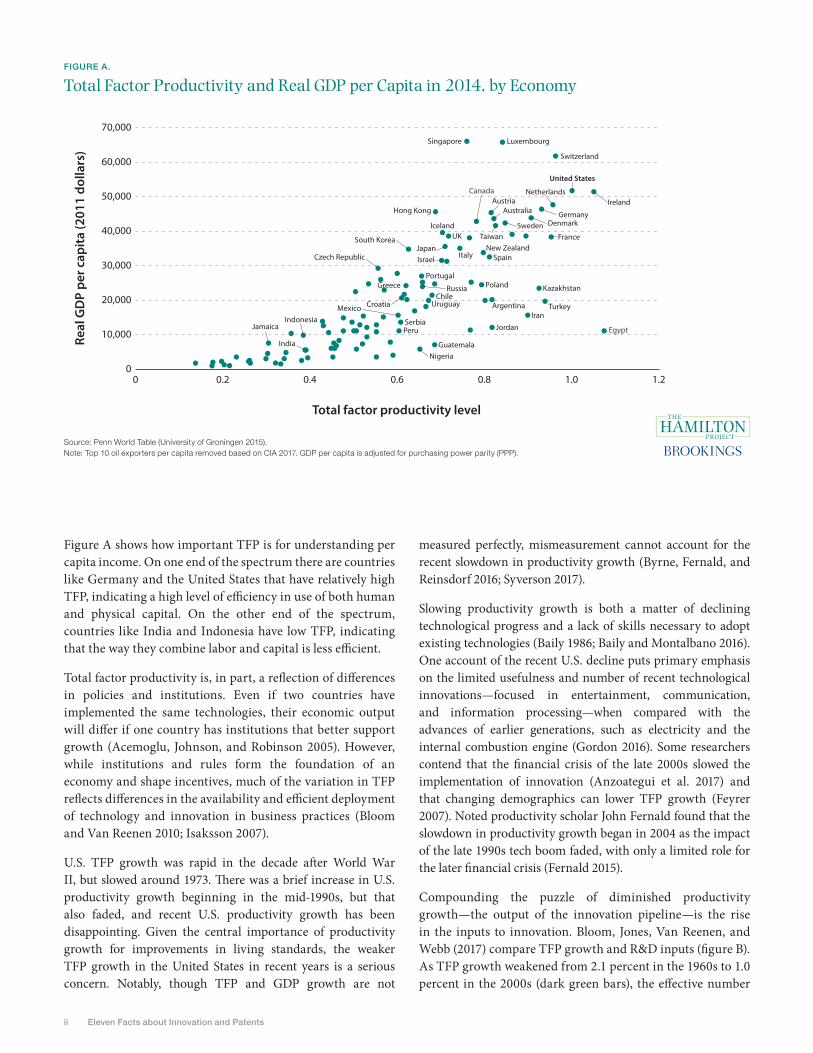
It is difficult to overstate the importance of technological progress for living standards. Consider the example of Argentina and Austria, as shown in figure A. These countries have roughly the same level of per capita inputs (labor and capital), but there is a vast gulf between them in economic output: Austria’s per capita income is more than double Argentina’s. Labor and capital play vital roles in generating economic output and helping to explain differences in national incomes, but large disparities in per capita national income—in other words, national living standards—are due to the various ways that economies use their resources, and not just to the quantities of resources available.
In the language of growth accounting, total factor productivity (TFP) is the measure of how effective an economy is at producing economic output with a given amount of inputs. Across developed and developing economies, the majority of per capita income differences are due to total factor productivity variation (Hall and Jones 1999; Klenow and Rodríguez-Clare 1997). In other words, most of per capita income differences are not explained by differences in available capital and labor. Moreover, sustained growth over time in per capita incomes requires growth in TFP (Solow 1957). Without technological progress, increases in labor and capital have a bounded potential to raise per capita income.
Jay Shambaugh, Ryan Nunn, and Becca Portman
ii Eleven Facts about Innovation and Patents
Figure A shows how important TFP is for understanding per capita income. On one end of the spectrum there are countries like Germany and the United States that have relatively high TFP, indicating a high level of efficiency in use of both human and physical capital. On the other end of the spectrum, countries like India and Indonesia have low TFP, indicating that the way they combine labor and capital is less efficient.
Total factor productivity is, in part, a reflection of differences in policies and institutions. Even if two countries have implemented the same technologies, their economic output will differ if one country has institutions that better support growth (Acemoglu, Johnson, and Robinson 2005). However, while institutions and rules form the foundation of an economy and shape incentives, much of the variation in TFP reflects differences in the availability and efficient deployment of technology and innovation in business practices (Bloom and Van Reenen 2010; Isaksson 2007).
U.S. TFP growth was rapid in the decade after World War II, but slowed around 1973. There was a brief increase in U.S. productivity growth beginning in the mid-1990s, but that also faded, and recent U.S. productivity growth has been disappointing. Given the central importance of productivity growth for improvements in living standards, the weaker TFP growth in the United States in recent years is a serious concern. Notably, though TFP and GDP growth are not
FIGURE A.
Total Factor Productivity and Real GDP per Capita in 2014, by Economy
Source: Penn World Table (University of Groningen 2015).Note: Top 10 oil exporters per capita removed based on CIA 2017. GDP per capita is adjusted for purchasing power parity (PPP).
measured perfectly, mismeasurement cannot account for the recent slowdown in productivity growth (Byrne, Fernald, and Reinsdorf 2016; Syverson 2017).
Slowing productivity growth is both a matter of declining technological progress and a lack of skills necessary to adopt existing technologies (Baily 1986; Baily and Montalbano 2016). One account of the recent U.S. decline puts primary emphasis on the limited usefulness and number of recent technological innovations—focused in entertainment, communication, and information processing—when compared with the advances of earlier generations, such as electricity and the internal combustion engine (Gordon 2016). Some researchers contend that the financial crisis of the late 2000s slowed the implementation of innovation (Anzoategui et al. 2017) and that changing demographics can lower TFP growth (Feyrer 2007). Noted productivity scholar John Fernald found that the slowdown in productivity growth began in 2004 as the impact of the late 1990s tech boom faded, with only a limited role for the later financial crisis (Fernald 2015).
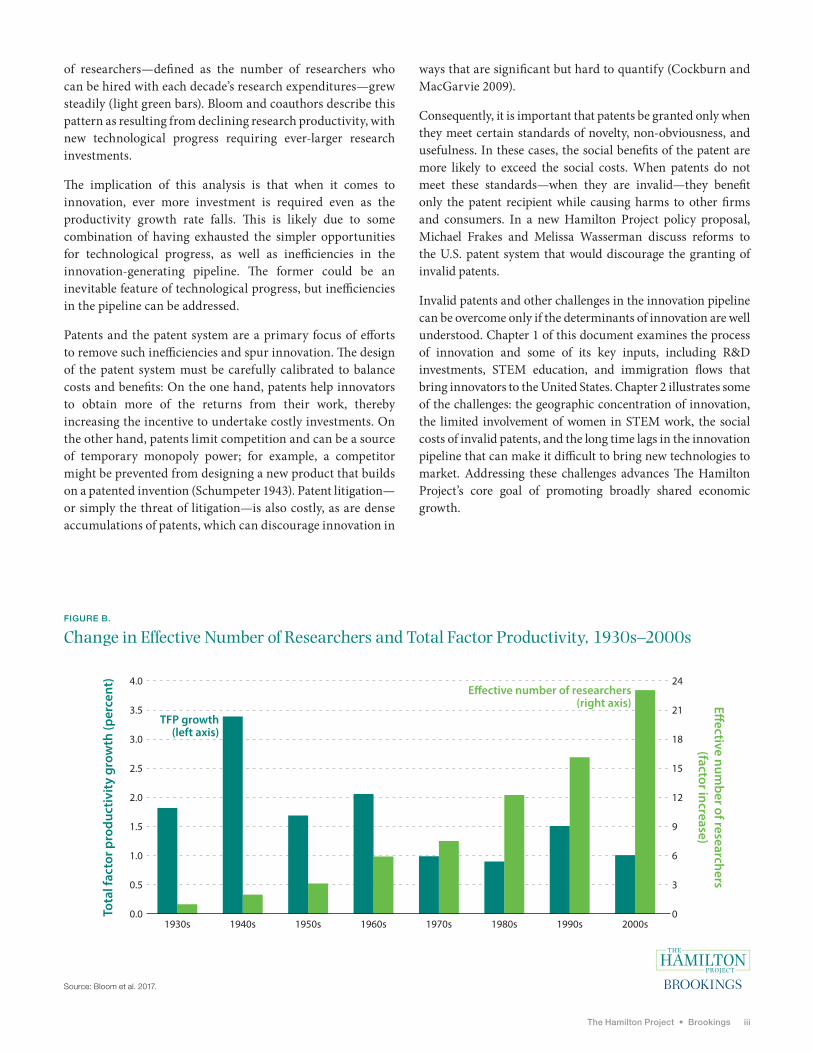
Compounding the puzzle of diminished productivity growth—the output of the innovation pipeline—is the rise in the inputs to innovation. Bloom, Jones, Van Reenen, and Webb (2017) compare TFP growth and R&D inputs (figure B). As TFP growth weakened from 2.1 percent in the 1960s to 1.0 percent in the 2000s (dark green bars), the effective number
Canada
Kazakhstan
Netherlands
Russia
/
Denmark
Iran
Nigeria
UK
Australia
Mexico
New Zealand
United States
Sweden
Egypt
Singapore
Indonesia
Spain
Argentina Turkey
Peru
Guatemala
Italy
France
/Greece Poland/
Portugal
Germany
Czech Republic
/
Israel
Luxembourg
Japan
Croatia
JordanJamaica
Uruguay
Ireland
Chile
Hong Kong
Serbia
Taiwan
/
India
Switzerland
Austria
South Korea
Iceland
/
70,000
60,000
50,000
40,000
30,000
20,000
10,000
00 0.2 0.4 0.6 0.8 1.0 1.2
Total factor productivity level
Real
GD
P pe
r cap
ita (2
011
dolla
rs)
The Hamilton Project • Brookings iii
of researchers—defined as the number of researchers who can be hired with each decade’s research expenditures—grew steadily (light green bars). Bloom and coauthors describe this pattern as resulting from declining research productivity, with new technological progress requiring ever-larger research investments.
The implication of this analysis is that when it comes to innovation, ever more investment is required even as the productivity growth rate falls. This is likely due to some combination of having exhausted the simpler opportunities for technological progress, as well as inefficiencies in the innovation-generating pipeline. The former could be an inevitable feature of technological progress, but inefficiencies in the pipeline can be addressed.
Patents and the patent system are a primary focus of efforts to remove such inefficiencies and spur innovation. The design of the patent system must be carefully calibrated to balance costs and benefits: On the one hand, patents help innovators to obtain more of the returns from their work, thereby increasing the incentive to undertake costly investments. On the other hand, patents limit competition and can be a source of temporary monopoly power; for example, a competitor might be prevented from designing a new product that builds on a patented invention (Schumpeter 1943). Patent litigation—or simply the threat of litigation—is also costly, as are dense accumulations of patents, which can discourage innovation in
ways that are significant but hard to quantify (Cockburn and MacGarvie 2009).
Consequently, it is important that patents be granted only when they meet certain standards of novelty, non-obviousness, and usefulness. In these cases, the social benefits of the patent are more likely to exceed the social costs. When patents do not meet these standards—when they are invalid—they benefit only the patent recipient while causing harms to other firms and consumers. In a new Hamilton Project policy proposal, Michael Frakes and Melissa Wasserman discuss reforms to the U.S. patent system that would discourage the granting of invalid patents.
Invalid patents and other challenges in the innovation pipeline can be overcome only if the determinants of innovation are well understood. Chapter 1 of this document examines the process of innovation and some of its key inputs, including R&D investments, STEM education, and immigration flows that bring innovators to the United States. Chapter 2 illustrates some of the challenges: the geographic concentration of innovation, the limited involvement of women in STEM work, the social costs of invalid patents, and the long time lags in the innovation pipeline that can make it difficult to bring new technologies to market. Addressing these challenges advances The Hamilton Project’s core goal of promoting broadly shared economic growth.
Source: Bloom et al. 2017.
FIGURE B.
Change in Effective Number of Researchers and Total Factor Productivity, 1930s–2000s
Tota
l fac
tor p
rodu
ctiv
ity
grow
th (p
erce
nt)
E�ective number of researchers
(factor increase)
24
21
18
15
12
9
6
3
00.0
0.5
1.0
1.5
2.0
2.5
3.0
3.5
4.0
1930s 1940s 1950s 1960s 1970s 1980s 1990s 2000s
TFP growth(left axis)
E�ective number of researchers(right axis)

iv Eleven Facts about Innovation and Patents
The Hamilton Project • Brookings v
Table of Contents
INTRODUCTION i
CHAPTER 1. The Process of Innovation
1. The U.S. Patent Office receives six times as many applications as it did in 1980. 1
2. Patenting is closely related to other measures of innovative activity. 2
3. Countries that invest more in R&D tend to produce more high-quality patents. 3
4. Federal R&D spending has declined while business R&D spending has risen. 4
5. Nearly three quarters of high-quality patents are filed by inventors with a graduate degree. 5
6. Industries that employ more STEM workers produce more patents. 6
7. More than a quarter of high-quality patents are granted to immigrants. 7
CHAPTER 2. Innovation Challenges
8. R&D investments result in new technologies, but often only after many years. 8
9. Women are underrepresented throughout the innovation pipeline. 9
10. Patenting is highly concentrated in metropolitan areas and near research universities. 10
11. Patent litigation is costly and common. 11
TECHNICAL APPENDIX 12
REFERENCES 14
SELECTED HAMILTON PROJECT PAPERS ON INNOVATION 18

vi Eleven Facts about Innovation and Patents
The Hamilton Project • Brookings 1
The U.S. Patent Office receives six times as many applications as it did in 1980.1.
Chapter 1. The Process of Innovation
FIGURE 1.
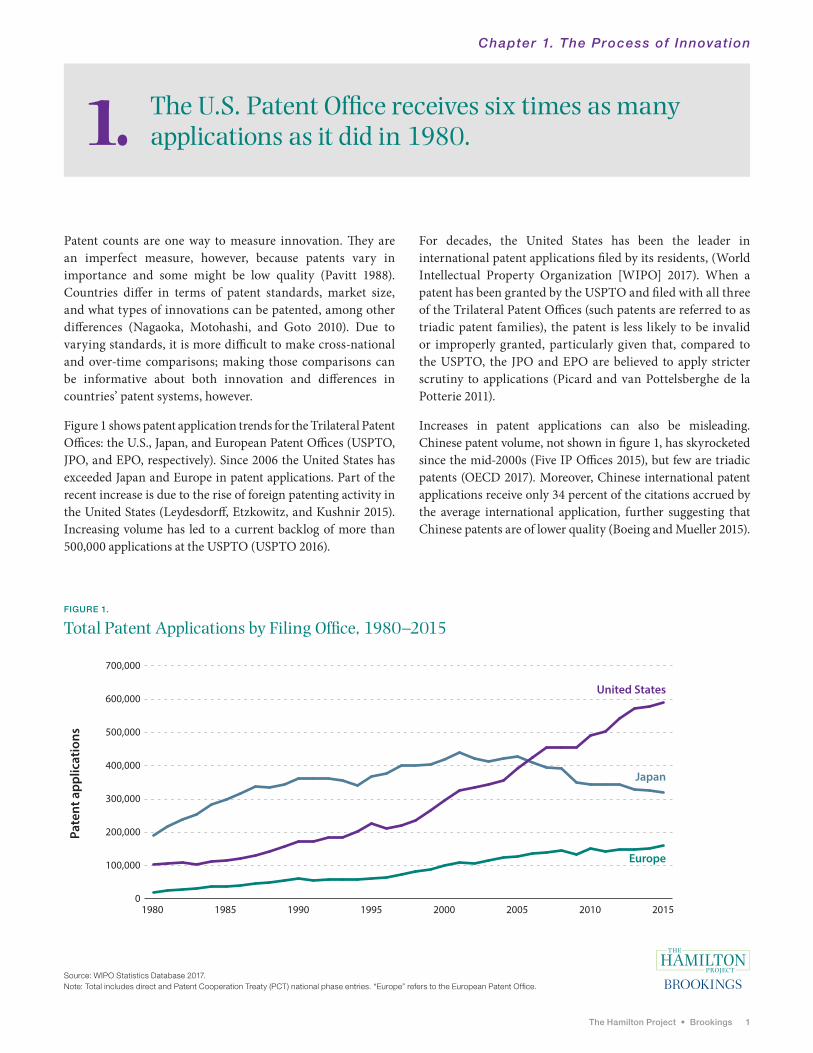
Total Patent Applications by Filing Office, 1980–2015
Source: WIPO Statistics Database 2017.Note: Total includes direct and Patent Cooperation Treaty (PCT) national phase entries. “Europe” refers to the European Patent Office.
Patent counts are one way to measure innovation. They are an imperfect measure, however, because patents vary in importance and some might be low quality (Pavitt 1988). Countries differ in terms of patent standards, market size, and what types of innovations can be patented, among other differences (Nagaoka, Motohashi, and Goto 2010). Due to varying standards, it is more difficult to make cross-national and over-time comparisons; making those comparisons can be informative about both innovation and differences in countries’ patent systems, however.
Figure 1 shows patent application trends for the Trilateral Patent Offices: the U.S., Japan, and European Patent Offices (USPTO, JPO, and EPO, respectively). Since 2006 the United States has exceeded Japan and Europe in patent applications. Part of the recent increase is due to the rise of foreign patenting activity in the United States (Leydesdorff, Etzkowitz, and Kushnir 2015). Increasing volume has led to a current backlog of more than 500,000 applications at the USPTO (USPTO 2016).
For decades, the United States has been the leader in international patent applications filed by its residents, (World Intellectual Property Organization [WIPO] 2017). When a patent has been granted by the USPTO and filed with all three of the Trilateral Patent Offices (such patents are referred to as triadic patent families), the patent is less likely to be invalid or improperly granted, particularly given that, compared to the USPTO, the JPO and EPO are believed to apply stricter scrutiny to applications (Picard and van Pottelsberghe de la Potterie 2011).
Increases in patent applications can also be misleading. Chinese patent volume, not shown in figure 1, has skyrocketed since the mid-2000s (Five IP Offices 2015), but few are triadic patents (OECD 2017). Moreover, Chinese international patent applications receive only 34 percent of the citations accrued by the average international application, further suggesting that Chinese patents are of lower quality (Boeing and Mueller 2015).
Pate
nt a
pplic
atio
ns
0
100,000
1980 1985 1990 1995 2000 2005 2010 2015
200,000
300,000
400,000
500,000
600,000
700,000
United States
Japan
Europe
2 Eleven Facts about Innovation and Patents
Patenting is closely related to other measures of innovative activity.2.
Chapter 1. The Process of Innovation
Though many patents are certainly valuable to workers and firms that possess them (Kline et al. 2017), it might be less immediately obvious whether patents are closely associated with innovation. Measuring this link is critical to understanding both the social benefits of the patent system and the usefulness of the patent-based approach to analyzing innovation.
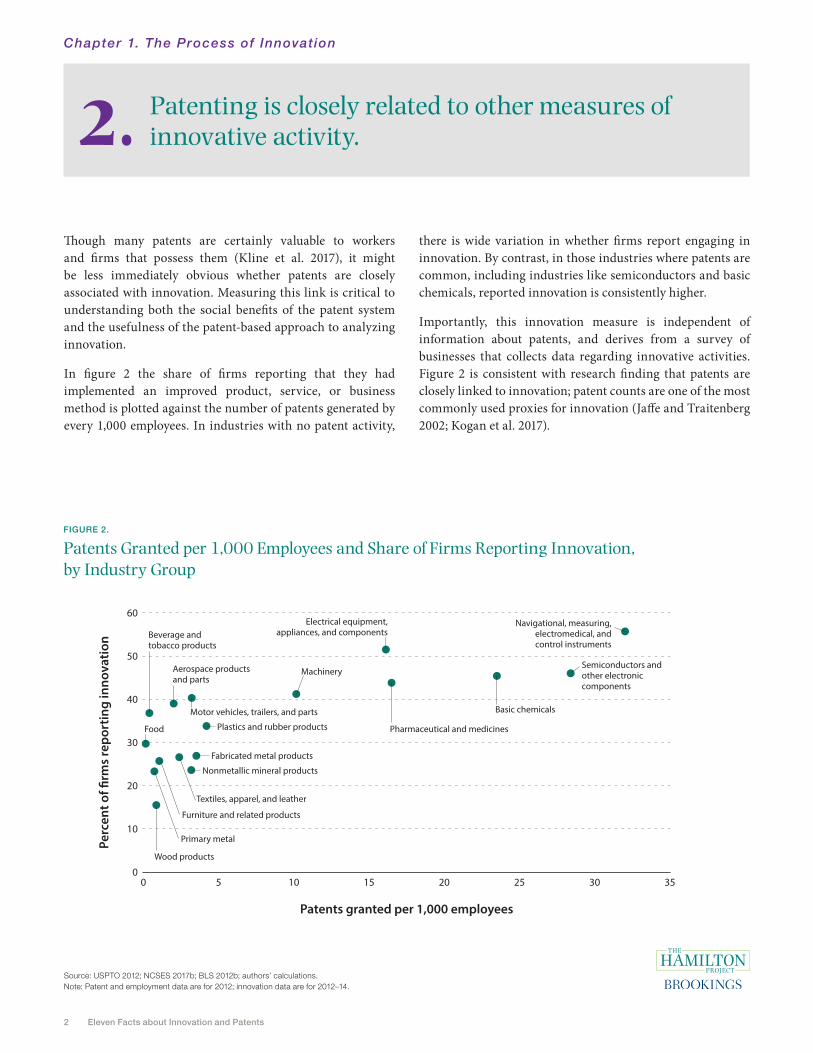
In figure 2 the share of firms reporting that they had implemented an improved product, service, or business method is plotted against the number of patents generated by every 1,000 employees. In industries with no patent activity,
there is wide variation in whether firms report engaging in innovation. By contrast, in those industries where patents are common, including industries like semiconductors and basic chemicals, reported innovation is consistently higher.
Importantly, this innovation measure is independent of information about patents, and derives from a survey of businesses that collects data regarding innovative activities. Figure 2 is consistent with research finding that patents are closely linked to innovation; patent counts are one of the most commonly used proxies for innovation (Jaffe and Traitenberg 2002; Kogan et al. 2017).
Source: USPTO 2012; NCSES 2017b; BLS 2012b; authors’ calculations.Note: Patent and employment data are for 2012; innovation data are for 2012–14.
FIGURE 2.
Patents Granted per 1,000 Employees and Share of Firms Reporting Innovation, by Industry Group
Perc
ent o
f �rm
s re
port
ing
inno
vatio
n
Patents granted per 1,000 employees
$
Beverage andtobacco products
0 5 10 15 20 25 30 35
10
20
30
40
50
60
0Wood products
Aerospace productsand parts
Food
Machinery
Pharmaceutical and medicines
Electrical equipment,appliances, and components
Navigational, measuring,electromedical, andcontrol instruments
Plastics and rubber products
Fabricated metal products
Textiles, apparel, and leather
Motor vehicles, trailers, and parts Basic chemicals
Semiconductors andother electroniccomponents
Furniture and related products
Primary metal
Nonmetallic mineral products
The Hamilton Project • Brookings 3
Countries that invest more in R&D tend to produce more high-quality patents.3.
Chapter 1. The Process of Innovation
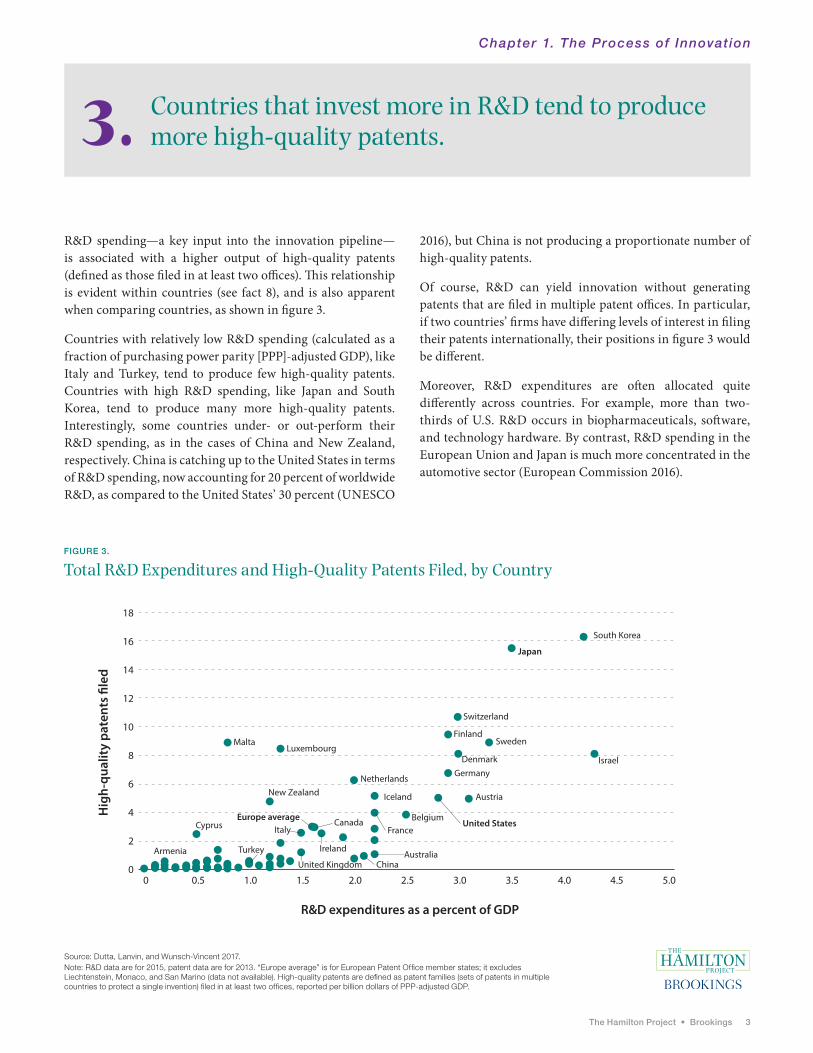
R&D spending—a key input into the innovation pipeline—is associated with a higher output of high-quality patents (defined as those filed in at least two offices). This relationship is evident within countries (see fact 8), and is also apparent when comparing countries, as shown in figure 3.
Countries with relatively low R&D spending (calculated as a fraction of purchasing power parity [PPP]-adjusted GDP), like Italy and Turkey, tend to produce few high-quality patents. Countries with high R&D spending, like Japan and South Korea, tend to produce many more high-quality patents. Interestingly, some countries under- or out-perform their R&D spending, as in the cases of China and New Zealand, respectively. China is catching up to the United States in terms of R&D spending, now accounting for 20 percent of worldwide R&D, as compared to the United States’ 30 percent (UNESCO
2016), but China is not producing a proportionate number of high-quality patents.
Of course, R&D can yield innovation without generating patents that are filed in multiple patent offices. In particular, if two countries’ firms have differing levels of interest in filing their patents internationally, their positions in figure 3 would be different.
Moreover, R&D expenditures are often allocated quite differently across countries. For example, more than two-thirds of U.S. R&D occurs in biopharmaceuticals, software, and technology hardware. By contrast, R&D spending in the European Union and Japan is much more concentrated in the automotive sector (European Commission 2016).
Source: Dutta, Lanvin, and Wunsch-Vincent 2017.Note: R&D data are for 2015, patent data are for 2013. “Europe average” is for European Patent Office member states; it excludes Liechtenstein, Monaco, and San Marino (data not available). High-quality patents are defined as patent families (sets of patents in multiple countries to protect a single invention) filed in at least two offices, reported per billion dollars of PPP-adjusted GDP.
FIGURE 3.
Total R&D Expenditures and High-Quality Patents Filed, by Country
Hig
h-qu
alit
y pa
tent
s �l
ed
R&D expenditures as a percent of GDP
0
2
4
6
8
10
12
14
16
18
0 0.5 1.0 1.5 2.0 2.5 3.0 3.5 4.0 4.5 5.0
$
Switzerland
Finland
South Korea
Sweden
Israel
MaltaLuxembourg
Japan
United StatesEurope average
DenmarkGermanyNetherlands
Iceland AustriaNew Zealand
FranceBelgium
Ireland
United Kingdom
Cyprus
Armenia
Italy
AustraliaChina
Turkey
Canada
4 Eleven Facts about Innovation and Patents
Federal R&D spending has declined while business R&D spending has risen. 4.
Chapter 1. The Process of Innovation
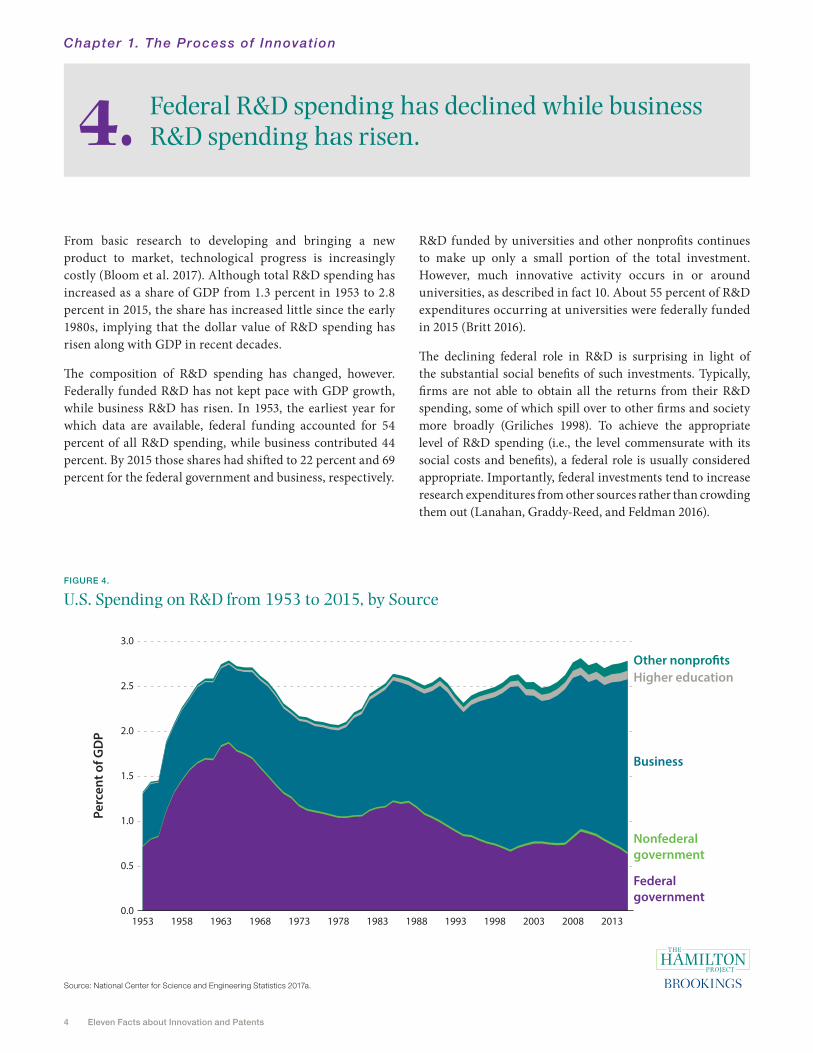
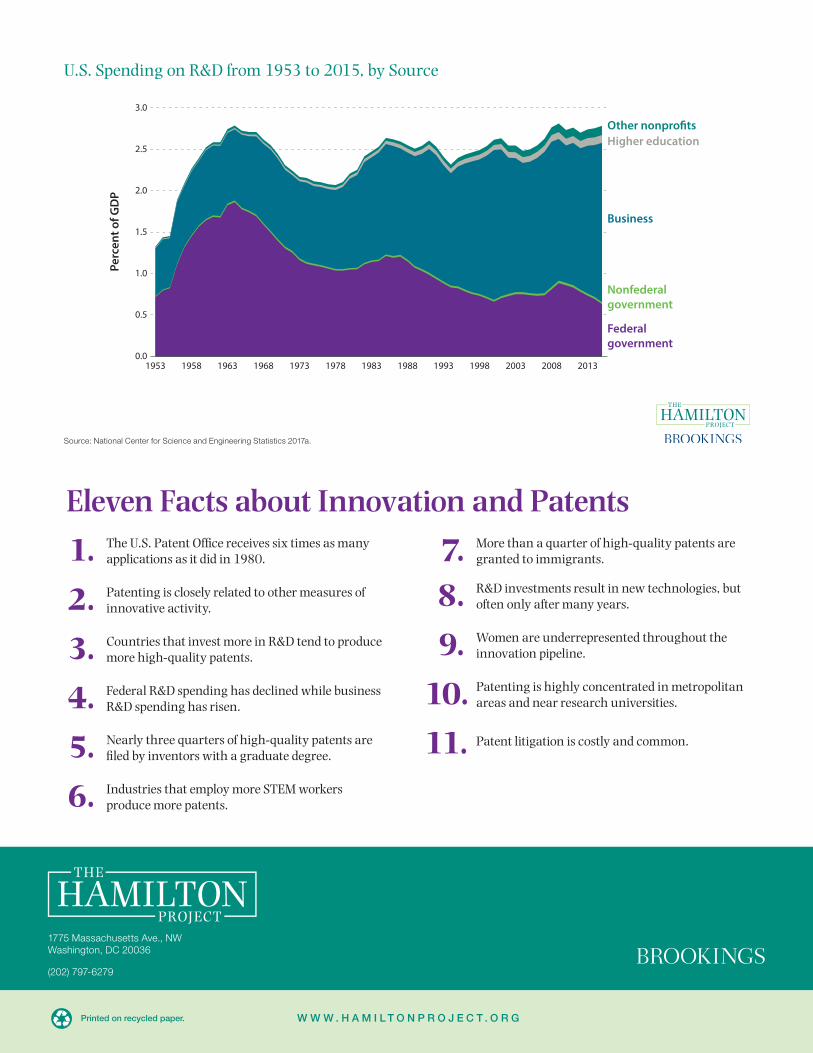
From basic research to developing and bringing a new product to market, technological progress is increasingly costly (Bloom et al. 2017). Although total R&D spending has increased as a share of GDP from 1.3 percent in 1953 to 2.8 percent in 2015, the share has increased little since the early 1980s, implying that the dollar value of R&D spending has risen along with GDP in recent decades.
The composition of R&D spending has changed, however. Federally funded R&D has not kept pace with GDP growth, while business R&D has risen. In 1953, the earliest year for which data are available, federal funding accounted for 54 percent of all R&D spending, while business contributed 44 percent. By 2015 those shares had shifted to 22 percent and 69 percent for the federal government and business, respectively.
R&D funded by universities and other nonprofits continues to make up only a small portion of the total investment. However, much innovative activity occurs in or around universities, as described in fact 10. About 55 percent of R&D expenditures occurring at universities were federally funded in 2015 (Britt 2016).
The declining federal role in R&D is surprising in light of the substantial social benefits of such investments. Typically, firms are not able to obtain all the returns from their R&D spending, some of which spill over to other firms and society more broadly (Griliches 1998). To achieve the appropriate level of R&D spending (i.e., the level commensurate with its social costs and benefits), a federal role is usually considered appropriate. Importantly, federal investments tend to increase research expenditures from other sources rather than crowding them out (Lanahan, Graddy-Reed, and Feldman 2016).
FIGURE 4.
U.S. Spending on R&D from 1953 to 2015, by Source
Source: National Center for Science and Engineering Statistics 2017a.
Perc
ent o
f GD
P
0.0
0.5
1.0
1.5
2.0
2.5
3.0
Other nonpro�tsHigher education
Business
Nonfederalgovernment
Federalgovernment
1953 1958 1963 1968 1973 1978 1983 1988 1993 1998 2003 2008 2013
The Hamilton Project • Brookings 5
Nearly three quarters of high-quality patents are filed by inventors with a graduate degree.5.
Chapter 1. The Process of Innovation
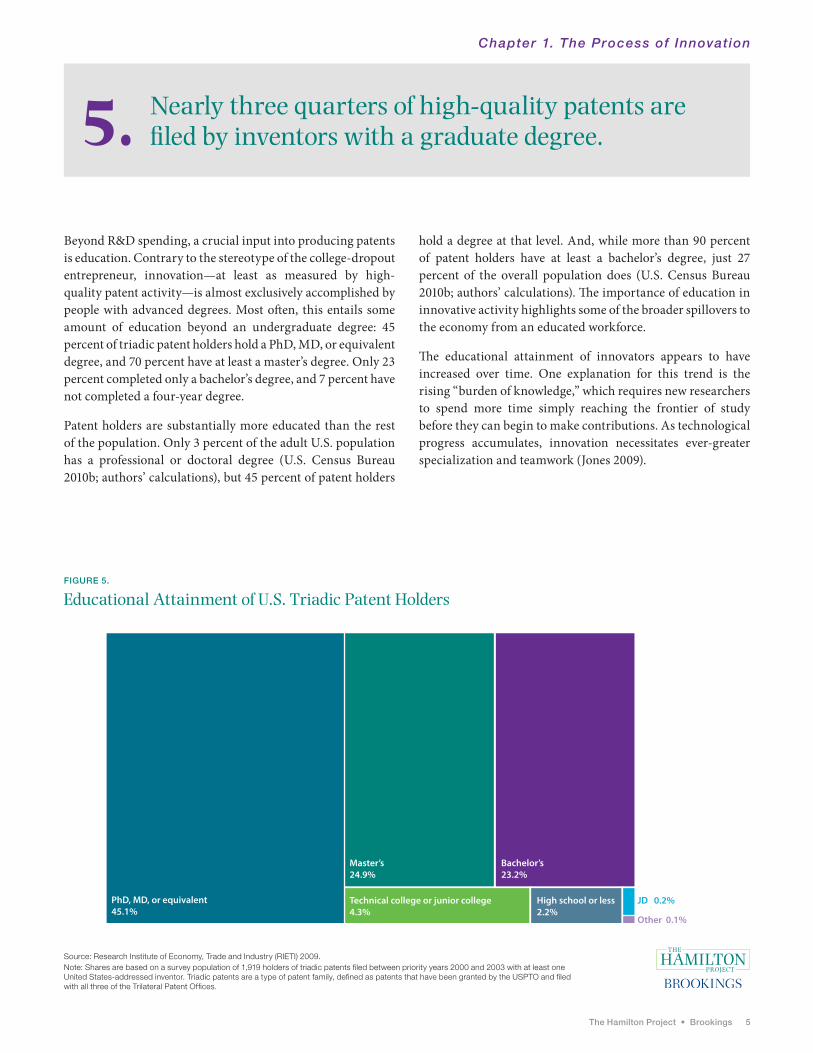
Beyond R&D spending, a crucial input into producing patents is education. Contrary to the stereotype of the college-dropout entrepreneur, innovation—at least as measured by high-quality patent activity—is almost exclusively accomplished by people with advanced degrees. Most often, this entails some amount of education beyond an undergraduate degree: 45 percent of triadic patent holders hold a PhD, MD, or equivalent degree, and 70 percent have at least a master’s degree. Only 23 percent completed only a bachelor’s degree, and 7 percent have not completed a four-year degree.
Patent holders are substantially more educated than the rest of the population. Only 3 percent of the adult U.S. population has a professional or doctoral degree (U.S. Census Bureau 2010b; authors’ calculations), but 45 percent of patent holders
hold a degree at that level. And, while more than 90 percent of patent holders have at least a bachelor’s degree, just 27 percent of the overall population does (U.S. Census Bureau 2010b; authors’ calculations). The importance of education in innovative activity highlights some of the broader spillovers to the economy from an educated workforce.
The educational attainment of innovators appears to have increased over time. One explanation for this trend is the rising “burden of knowledge,” which requires new researchers to spend more time simply reaching the frontier of study before they can begin to make contributions. As technological progress accumulates, innovation necessitates ever-greater specialization and teamwork (Jones 2009).
FIGURE 5.
Educational Attainment of U.S. Triadic Patent Holders
Source: Research Institute of Economy, Trade and Industry (RIETI) 2009.Note: Shares are based on a survey population of 1,919 holders of triadic patents filed between priority years 2000 and 2003 with at least one United States-addressed inventor. Triadic patents are a type of patent family, defined as patents that have been granted by the USPTO and filed with all three of the Trilateral Patent Offices.
PhD, MD, or equivalent45.1%
Master’s24.9%
Technical college or junior college4.3%
High school or less2.2%
JD 0.2%
Other 0.1%
Bachelor’s23.2%
6 Eleven Facts about Innovation and Patents
Industries that employ more STEM workers produce more patents.6.
Chapter 1. The Process of Innovation
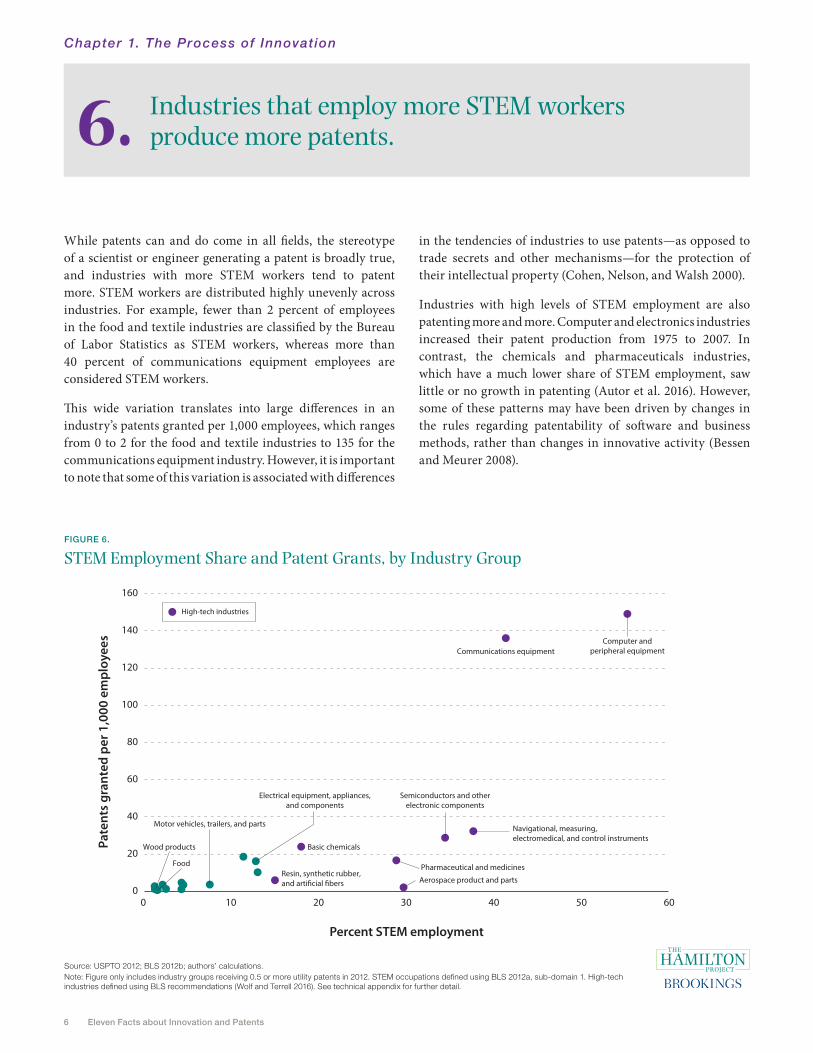
While patents can and do come in all fields, the stereotype of a scientist or engineer generating a patent is broadly true, and industries with more STEM workers tend to patent more. STEM workers are distributed highly unevenly across industries. For example, fewer than 2 percent of employees in the food and textile industries are classified by the Bureau of Labor Statistics as STEM workers, whereas more than 40 percent of communications equipment employees are considered STEM workers.
This wide variation translates into large differences in an industry’s patents granted per 1,000 employees, which ranges from 0 to 2 for the food and textile industries to 135 for the communications equipment industry. However, it is important to note that some of this variation is associated with differences
in the tendencies of industries to use patents—as opposed to trade secrets and other mechanisms—for the protection of their intellectual property (Cohen, Nelson, and Walsh 2000).
Industries with high levels of STEM employment are also patenting more and more. Computer and electronics industries increased their patent production from 1975 to 2007. In contrast, the chemicals and pharmaceuticals industries, which have a much lower share of STEM employment, saw little or no growth in patenting (Autor et al. 2016). However, some of these patterns may have been driven by changes in the rules regarding patentability of software and business methods, rather than changes in innovative activity (Bessen and Meurer 2008).
Source: USPTO 2012; BLS 2012b; authors’ calculations.Note: Figure only includes industry groups receiving 0.5 or more utility patents in 2012. STEM occupations defined using BLS 2012a, sub-domain 1. High-tech industries defined using BLS recommendations (Wolf and Terrell 2016). See technical appendix for further detail.
FIGURE 6.
STEM Employment Share and Patent Grants, by Industry Group
Pate
nts
gran
ted
per 1
,000
em
ploy
ees
Percent STEM employment
Basic chemicals
Resin, synthetic rubber,and arti�cial �bers
Pharmaceutical and medicines
Computer andperipheral equipmentCommunications equipment
Semiconductors and otherelectronic components
Navigational, measuring,electromedical, and control instruments
Aerospace product and parts
Food
Wood products
Electrical equipment, appliances,and components
Motor vehicles, trailers, and parts
High-tech industries
160
140
120
100
80
60
40
20
00 10 20 30 40 50 60
The Hamilton Project • Brookings 7
More than a quarter of high-quality patents are granted to immigrants.7.
Chapter 1. The Process of Innovation
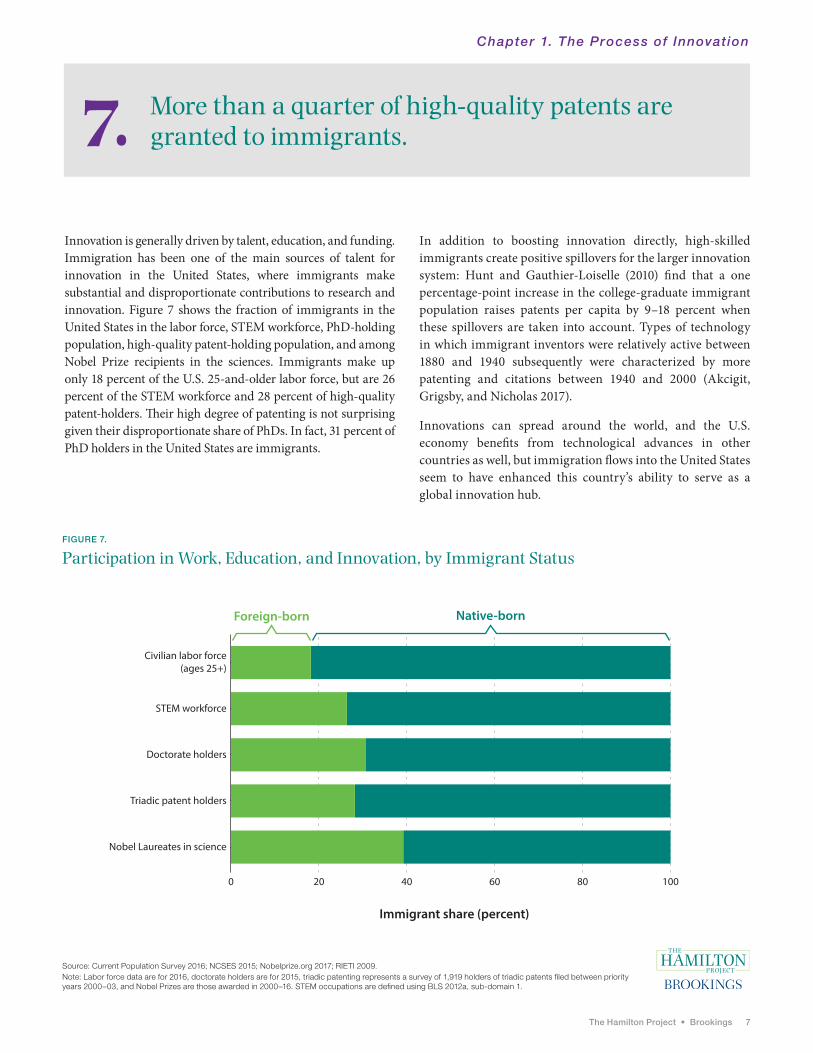
Innovation is generally driven by talent, education, and funding. Immigration has been one of the main sources of talent for innovation in the United States, where immigrants make substantial and disproportionate contributions to research and innovation. Figure 7 shows the fraction of immigrants in the United States in the labor force, STEM workforce, PhD-holding population, high-quality patent-holding population, and among Nobel Prize recipients in the sciences. Immigrants make up only 18 percent of the U.S. 25-and-older labor force, but are 26 percent of the STEM workforce and 28 percent of high-quality patent-holders. Their high degree of patenting is not surprising given their disproportionate share of PhDs. In fact, 31 percent of PhD holders in the United States are immigrants.
In addition to boosting innovation directly, high-skilled immigrants create positive spillovers for the larger innovation system: Hunt and Gauthier-Loiselle (2010) find that a one percentage-point increase in the college-graduate immigrant population raises patents per capita by 9–18 percent when these spillovers are taken into account. Types of technology in which immigrant inventors were relatively active between 1880 and 1940 subsequently were characterized by more patenting and citations between 1940 and 2000 (Akcigit, Grigsby, and Nicholas 2017).
Innovations can spread around the world, and the U.S. economy benefits from technological advances in other countries as well, but immigration flows into the United States seem to have enhanced this country’s ability to serve as a global innovation hub.
Source: Current Population Survey 2016; NCSES 2015; Nobelprize.org 2017; RIETI 2009.Note: Labor force data are for 2016, doctorate holders are for 2015, triadic patenting represents a survey of 1,919 holders of triadic patents filed between priority years 2000–03, and Nobel Prizes are those awarded in 2000–16. STEM occupations are defined using BLS 2012a, sub-domain 1.
FIGURE 7.
Participation in Work, Education, and Innovation, by Immigrant Status
Foreign-born Native-born
Immigrant share (percent)
Civilian labor force(ages 25+)
STEM workforce
Doctorate holders
Triadic patent holders
Nobel Laureates in science
$
0 20 40 60 80 100
8 Eleven Facts about Innovation and Patents
R&D investments result in new technologies, but often only after many years.8.
Chapter 2. Innovation Chal lenges
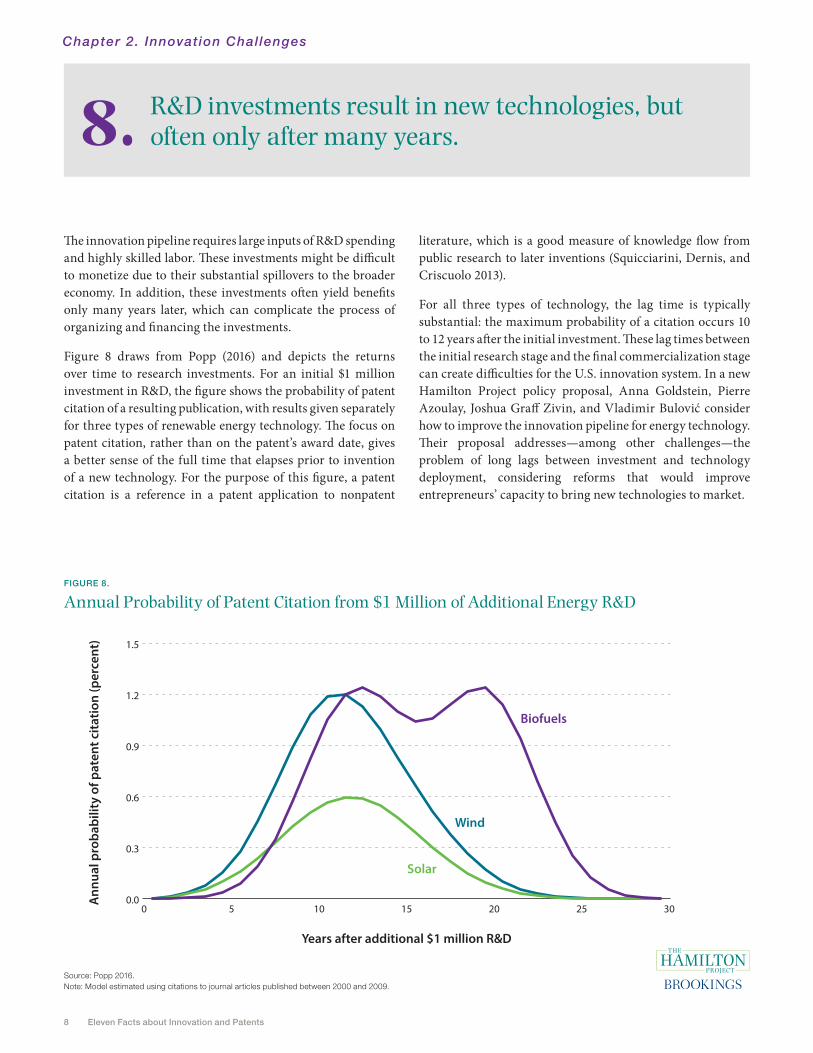
The innovation pipeline requires large inputs of R&D spending and highly skilled labor. These investments might be difficult to monetize due to their substantial spillovers to the broader economy. In addition, these investments often yield benefits only many years later, which can complicate the process of organizing and financing the investments.
Figure 8 draws from Popp (2016) and depicts the returns over time to research investments. For an initial $1 million investment in R&D, the figure shows the probability of patent citation of a resulting publication, with results given separately for three types of renewable energy technology. The focus on patent citation, rather than on the patent’s award date, gives a better sense of the full time that elapses prior to invention of a new technology. For the purpose of this figure, a patent citation is a reference in a patent application to nonpatent
literature, which is a good measure of knowledge flow from public research to later inventions (Squicciarini, Dernis, and Criscuolo 2013).
For all three types of technology, the lag time is typically substantial: the maximum probability of a citation occurs 10 to 12 years after the initial investment. These lag times between the initial research stage and the final commercialization stage can create difficulties for the U.S. innovation system. In a new Hamilton Project policy proposal, Anna Goldstein, Pierre Azoulay, Joshua Graff Zivin, and Vladimir Bulović consider how to improve the innovation pipeline for energy technology. Their proposal addresses—among other challenges—the problem of long lags between investment and technology deployment, considering reforms that would improve entrepreneurs’ capacity to bring new technologies to market.
Years after additional $1 million R&D
Ann
ual p
roba
bilit
y of
pat
ent c
itatio
n (p
erce
nt)
Solar
Wind
Biofuels
$
0.0
0.3
0.6
0.9
1.2
1.5
0 5 10 15 20 25 30
FIGURE 8.
Annual Probability of Patent Citation from $1 Million of Additional Energy R&D
Source: Popp 2016.Note: Model estimated using citations to journal articles published between 2000 and 2009.
The Hamilton Project • Brookings 9
Women are underrepresented throughout the innovation pipeline.9.
Chapter 2. Innovation Chal lenges
As productivity growth slows and R&D becomes more difficult, inefficiencies in the innovation pipeline are perhaps more damaging than ever. Addressing these inefficiencies could yield large social benefits. One important area where the data suggest a potential for improvement is in contributions by women to STEM work.
The decline in barriers to women’s economic opportunities has led to an improved allocation of talent, raising overall economic growth (Hsieh et al. 2016). Similarly, making better use of women’s talents—as well as the talents of minorities and individuals from low-income families—in STEM employment could contribute to a better-functioning innovation system (Bell et al. 2017). Women are increasingly better educated than men, but their role in STEM and patenting lags.
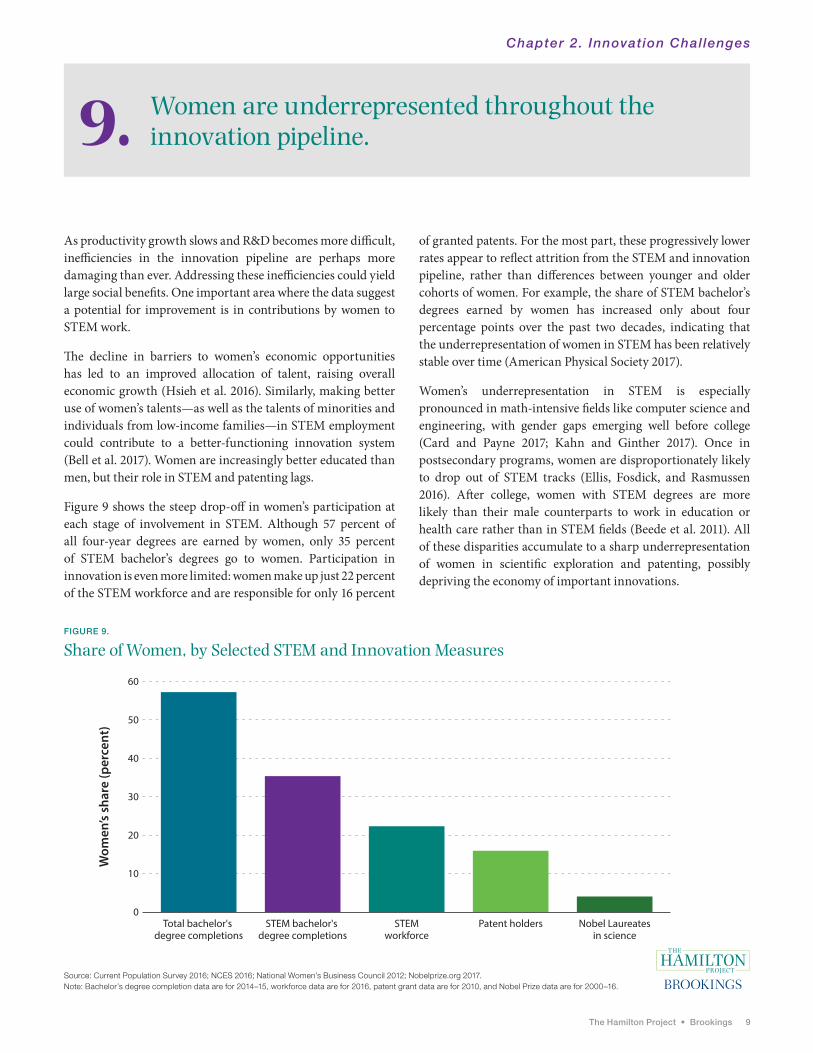
Figure 9 shows the steep drop-off in women’s participation at each stage of involvement in STEM. Although 57 percent of all four-year degrees are earned by women, only 35 percent of STEM bachelor’s degrees go to women. Participation in innovation is even more limited: women make up just 22 percent of the STEM workforce and are responsible for only 16 percent
of granted patents. For the most part, these progressively lower rates appear to reflect attrition from the STEM and innovation pipeline, rather than differences between younger and older cohorts of women. For example, the share of STEM bachelor’s degrees earned by women has increased only about four percentage points over the past two decades, indicating that the underrepresentation of women in STEM has been relatively stable over time (American Physical Society 2017).
Women’s underrepresentation in STEM is especially pronounced in math-intensive fields like computer science and engineering, with gender gaps emerging well before college (Card and Payne 2017; Kahn and Ginther 2017). Once in postsecondary programs, women are disproportionately likely to drop out of STEM tracks (Ellis, Fosdick, and Rasmussen 2016). After college, women with STEM degrees are more likely than their male counterparts to work in education or health care rather than in STEM fields (Beede et al. 2011). All of these disparities accumulate to a sharp underrepresentation of women in scientific exploration and patenting, possibly depriving the economy of important innovations.
FIGURE 9.
Share of Women, by Selected STEM and Innovation Measures
Source: Current Population Survey 2016; NCES 2016; National Women’s Business Council 2012; Nobelprize.org 2017.Note: Bachelor’s degree completion data are for 2014–15, workforce data are for 2016, patent grant data are for 2010, and Nobel Prize data are for 2000–16.
Wom
en’s
shar
e (p
erce
nt)
0Total bachelor's
degree completionsSTEM bachelor's
degree completionsSTEM
workforcePatent holders Nobel Laureates
in science
10
20
30
40
50
60
10 Eleven Facts about Innovation and Patents
Patenting is highly concentrated in metropolitan areas and near research universities.10.
Chapter 2. Innovation Chal lenges
FIGURE 10.
Top Research Universities and Patent Grants, by Metropolitan Statistical Area
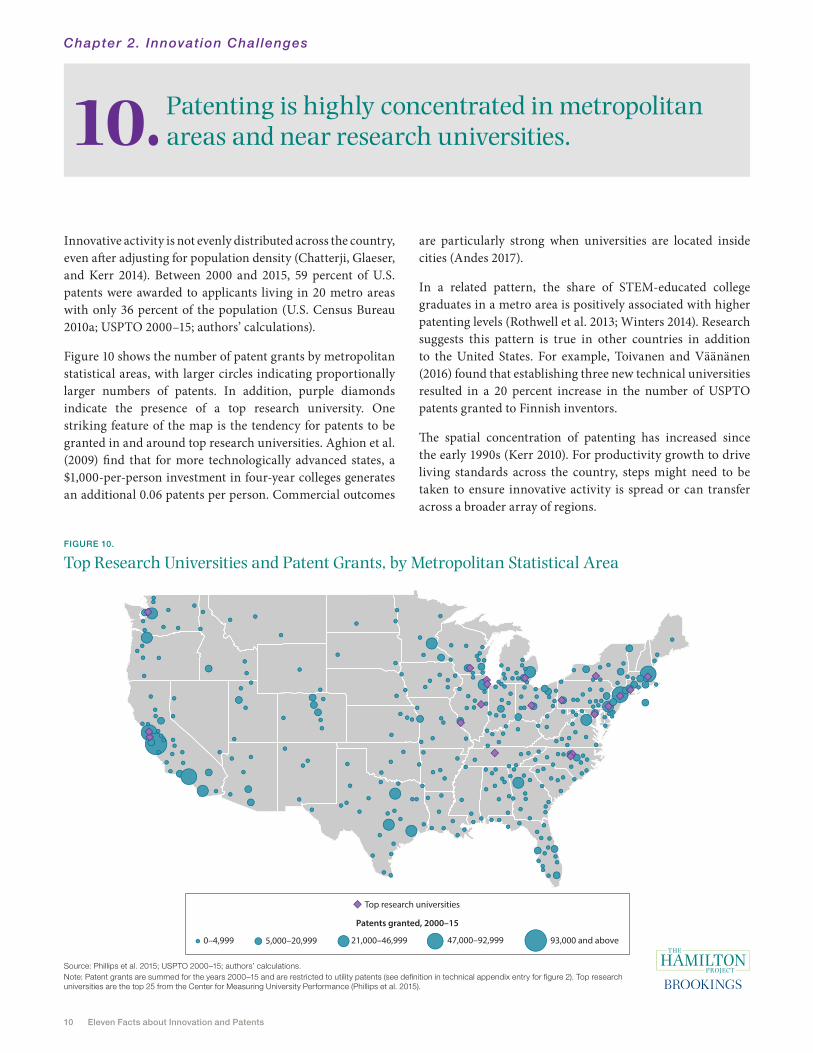
Source: Phillips et al. 2015; USPTO 2000–15; authors’ calculations.Note: Patent grants are summed for the years 2000–15 and are restricted to utility patents (see definition in technical appendix entry for figure 2). Top research universities are the top 25 from the Center for Measuring University Performance (Phillips et al. 2015).
Innovative activity is not evenly distributed across the country, even after adjusting for population density (Chatterji, Glaeser, and Kerr 2014). Between 2000 and 2015, 59 percent of U.S. patents were awarded to applicants living in 20 metro areas with only 36 percent of the population (U.S. Census Bureau 2010a; USPTO 2000–15; authors’ calculations).
Figure 10 shows the number of patent grants by metropolitan statistical areas, with larger circles indicating proportionally larger numbers of patents. In addition, purple diamonds indicate the presence of a top research university. One striking feature of the map is the tendency for patents to be granted in and around top research universities. Aghion et al. (2009) find that for more technologically advanced states, a $1,000-per-person investment in four-year colleges generates an additional 0.06 patents per person. Commercial outcomes
are particularly strong when universities are located inside cities (Andes 2017).
In a related pattern, the share of STEM-educated college graduates in a metro area is positively associated with higher patenting levels (Rothwell et al. 2013; Winters 2014). Research suggests this pattern is true in other countries in addition to the United States. For example, Toivanen and Väänänen (2016) found that establishing three new technical universities resulted in a 20 percent increase in the number of USPTO patents granted to Finnish inventors.
The spatial concentration of patenting has increased since the early 1990s (Kerr 2010). For productivity growth to drive living standards across the country, steps might need to be taken to ensure innovative activity is spread or can transfer across a broader array of regions.
0–4,999 5,000–20,999 21,000–46,999 47,000–92,999 93,000 and above
Top research universities
Patents granted, 2000–15
The Hamilton Project • Brookings 11
Patent litigation is costly and common.11.
Chapter 2. Innovation Chal lenges
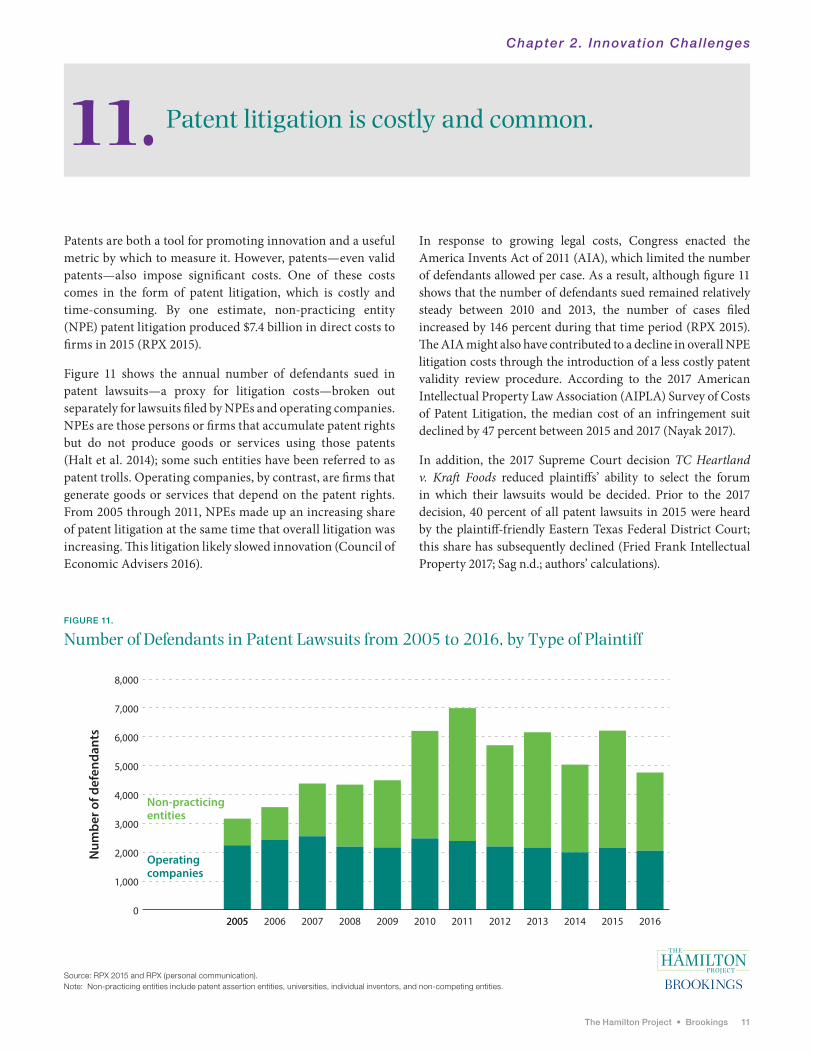
Patents are both a tool for promoting innovation and a useful metric by which to measure it. However, patents—even valid patents—also impose significant costs. One of these costs comes in the form of patent litigation, which is costly and time-consuming. By one estimate, non-practicing entity (NPE) patent litigation produced $7.4 billion in direct costs to firms in 2015 (RPX 2015).
Figure 11 shows the annual number of defendants sued in patent lawsuits—a proxy for litigation costs—broken out separately for lawsuits filed by NPEs and operating companies. NPEs are those persons or firms that accumulate patent rights but do not produce goods or services using those patents (Halt et al. 2014); some such entities have been referred to as patent trolls. Operating companies, by contrast, are firms that generate goods or services that depend on the patent rights. From 2005 through 2011, NPEs made up an increasing share of patent litigation at the same time that overall litigation was increasing. This litigation likely slowed innovation (Council of Economic Advisers 2016).
In response to growing legal costs, Congress enacted the America Invents Act of 2011 (AIA), which limited the number of defendants allowed per case. As a result, although figure 11 shows that the number of defendants sued remained relatively steady between 2010 and 2013, the number of cases filed increased by 146 percent during that time period (RPX 2015). The AIA might also have contributed to a decline in overall NPE litigation costs through the introduction of a less costly patent validity review procedure. According to the 2017 American Intellectual Property Law Association (AIPLA) Survey of Costs of Patent Litigation, the median cost of an infringement suit declined by 47 percent between 2015 and 2017 (Nayak 2017).
In addition, the 2017 Supreme Court decision TC Heartland v. Kraft Foods reduced plaintiffs’ ability to select the forum in which their lawsuits would be decided. Prior to the 2017 decision, 40 percent of all patent lawsuits in 2015 were heard by the plaintiff-friendly Eastern Texas Federal District Court; this share has subsequently declined (Fried Frank Intellectual Property 2017; Sag n.d.; authors’ calculations).
FIGURE 11.
Number of Defendants in Patent Lawsuits from 2005 to 2016, by Type of Plaintiff
Source: RPX 2015 and RPX (personal communication).Note: Non-practicing entities include patent assertion entities, universities, individual inventors, and non-competing entities.
Num
ber o
f def
enda
nts
Operatingcompanies
Non-practicingentities
0
1,000
2,000
3,000
4,000
5,000
6,000
7,000
8,000
20052005 2006 2007 2008 2009 2010 2011 2012 2013 2014 2015 2016
12 Eleven Facts about Innovation and Patents
Technical Appendix
Figure A. Total Factor Productivity and Real GDP per Capita in 2014, by Economy
Total Factor Productivity is ctfp (TFP level at current PPPs, USA=1). Real GDP per Capita is cgdpo (Output-side real GDP at current PPPs in mil. 2011US$)/pop (Population in millions). Top ten crude oil exporters per capita removed based on most recent data available (2014–16) on barrels per day in the CIA World Factbook (CIA 2017) and 2014 Penn World Table (University of Groningen 2015) population counts. Outlier countries with TFP greater than 1.5 were excluded.
Figure 2. Patents Granted per 1,000 Employees and Share of Firms Reporting Innovation, by Industry Group
Patents granted: Data on patents granted come from U.S. Patent and Trademark Office (2012) and reflect 2012 grants. Utility patents protect the way articles are used or work (as opposed to design patents, which protect the way articles look). Patenting activity was assigned by USPTO to North American Industry Classification System (NAICS) industry categories using a U.S. Patent Classification System (USPC) classification to NAICS concordance. Patent counts are “fractional counts,” meaning that each patent is divided equally between the NAICS categories that correspond to the patent’s primary classification, as determined by the USPC to NAICS concordance.
Firm innovation: Data on innovation come from the National Science Foundation Business R&D and Innovation Survey (National Center for Science and Engineering Statistics 2017b) and reflect 2012–14 shares. Innovation is defined as the introduction of a significantly improved product or process, including: methods for manufacturing and production; logistics, delivery, and distribution; and support activities.
Industry employment: Employment data come from the Bureau of Labor Statistics Occupational Employment Statistics (BLS 2012b).
The figure includes only industry groups listed in both USPTO and NCSES datasets. Industry groups reflect the most detailed level available using NAICS 3-digit or 4-digit classifiers.
Figure 6. STEM Employment Share and Patent Grants, by Industry Group
Patents granted: See figure 2 notes for details. Figure only includes industry groups receiving 0.5 or more utility patents in 2012.
STEM employment: Employment data come from the Bureau of Labor Statistics Occupational Employment Statistics (BLS 2012b). STEM occupations were defined using BLS 2012a, sub-domain 1.
High-tech industries: High-tech industries defined using Wolf and Terrell 2016 recommendations (industries in which at least 14.5 percent of workers were in STEM occupations in 2014).
High-tech industries in the figure are restricted to those listed in both the USPTO data and Wolf and Terrell recommendations. All industry groups reflect the most detailed level available using NAICS 3-digit or 4-digit classifiers.
Figure 7. Participation in Work, Education, and Innovation, by Immigrant Status
Civilian labor force: Labor force data are from the Current Population Survey, Bureau of Labor Statistics (2016). Immigrants are defined as foreign-born individuals.
STEM workforce: Labor force data are from the Current Population Survey (BLS 2016). STEM occupations are defined using BLS 2012a, sub-domain 1. IPUMS OCC2010 harmonized occupation codes (based on Census 2010 occupation codes) were converted to Standard Occupational Classification (SOC) using the IPUMS OCC to SOC crosswalk (IPUMS USA n.d.). Population is restricted to civilian workforce.
Doctorate holders: Data on PhD holders are from the National Survey of College Graduates (NCSES 2015).
Triadic patent holders: Data on triadic patent holders are from the Research Institute of Economy, Trade and Industry (2009). The data come from a sample of 1,919 holders of triadic patents with 2000–03 priority years surveyed between June and November 2007. Priority year is the year of filing of the first patent application.
The Hamilton Project • Brookings 13
Nobel Laureates in science: Data on Nobel Prizes were collected from Nobelprize.org and include those prizes awarded in Physics, Chemistry, and Physiology and Medicine between 2000 and 2016.
Figure 8. Annual Probability of Patent Citation from $1 Million of Additional Energy R&D
Figure 8 shows the annual probability of citation based on a hazard regression using the estimated number of articles induced by R&D in a given year as well as the probability of an article from any given year being cited in the future. See Popp (2016) for more details.
Figure 9. Share of Women, by Selected STEM and Innovation Measures
Total BA completions: Completions data are from National Center for Education Statistics (2016) and are for awards granted between July 1, 2014 and June 30, 2015
STEM BA completions: See above for details on completions data. STEM completions were determined based on NCES 2016 classification of STEM as biological and biomedical sciences, computer and information sciences, engineering and engineering technologies, mathematics and statistics, and physical sciences and science technologies.
STEM workforce: Workforce data are from Current Population Survey (BLS 2016). STEM occupations are defined using BLS 2012a, sub-domain 1. IPUMS OCC2010 harmonized occupation codes (based on Census 2010 occupation codes) were converted to SOC using the IPUMS OCC to SOC crosswalk (IPUMS USA n.d.). Population is restricted to civilian workforce.
Patent holders: Data on patent holders are from National Women’s Business Council (2012) based on USPTO patent grant data for 2010.
Nobel Laureates in science: Data on Nobel Prizes were collected from Nobelprize.org and include those prizes awarded in Physics, Chemistry, and Physiology and Medicine between 2000 and 2016.
Educational attainment of U.S. population (in text, Fact 5):
“Only 3 percent of the adult U.S. population has a professional or doctoral degree, but 45 percent of patent holders hold a degree at that level. And, while more than 90 percent of patent holders have at least a bachelor’s degree, just 27 percent of the overall population does.”
Bachelor’s degree share includes individuals with master’s, professional, and doctoral degrees.
14 Eleven Facts about Innovation and Patents
Acemoglu, Daron, Simon Johnson, and James A. Robinson. 2005. “Institutions as a Fundamental Cause of Long-Run Growth.” In Handbook of Economic Growth, vol. 1A, edited by Philippe Aghion and Steven N. Durlauf, 386–464. Amsterdam: North Holland Publishing Co.
Aghion, P., L. Boustan, C. Hoxby, and J. Vandenbussche. 2009, March. “The Causal Impact of Education on Economic Growth: Evidence from U.S.” Harvard University, Cambridge, MA.
Akcigit, Ufuk, John Grigsby, and Tom Nicholas. 2017, February (rev. October). “Immigration and the Rise of American Ingenuity.” Working paper no. 23137, National Bureau of Economic Research, Cambridge, MA.
American Intellectual Property Law Association (AIPLA). 2017. “Survey of Costs of Patent Litigation.” American Intellectual Property Law Association, Arlington, VA.
America Invents Act of 2011 (AIA), Pub. L. No. 112-29, 125 Stat. 284.American Physical Society. 2017. “Fraction of Bachelor’s Degrees in
STEM Disciplines Earned by Women.” American Physical Society, College Park, MD.
Andes, Scott. 2017, October. “Hidden in Plain Sight: the Oversized Impact of Downtown Universities.” Anne T. and Robert M. Bass Initiative on Innovation and Placemaking, Brookings Institution, Washington, DC.
Anzoategui, Diego, Diego Comin, Mark Gertler, and Joseba Martinez. 2017, March. “Endogenous Technology Adoption and R&D as Sources of Business Cycle Persistence.” New York University, New York, NY.
Autor, David, David Dorn, Gordon H. Hanson, Gary Pisano, and Pian Shu. 2016, December. “Foreign Competition and Domestic Innovation: Evidence from U.S. Patents.” Working paper no. 22879, National Bureau of Economic Research, Cambridge, MA.
Baily, Martin Neil. 1986, October. “What Has Happened to Productivity Growth?” Science 234 (4775): 443–51.
Baily, Martin Neil, and Nicholas Montalbano. 2016, September. “Why is U.S. Productivity Growth So Slow? Possible Explanations and Policy Responses.” Working Paper no. 22, Hutchins Center on Fiscal and Monetary Policy, Brookings Institution, Washington, DC.
Beede, David, Tiffany Julian, David Langdon, George McKittrick, Beethika Khan, and Mark Doms. 2011. “Women in STEM: A Gender Gap to Innovation.” Office of the Chief Economist, Economics and Statistics Administration, U.S. Department of Commerce, Washington, DC.
Bell, Alex, Raj Chetty, Xavier Jaravel, Neviana Petkova, and John Van Reenen. 2017, December. “Who Becomes an Inventor in America? The Importance of Exposure to Innovation.” Harvard University, Cambridge, MA.
Bessen, James and Michael J. Meurer. 2008. Patent Failure: How Judgest, Bureaucrats, and Lawyers Put Innovators at Risk. Princeton, NJ: Princeton University Press.
Bloom, Nicholas, and John Van Reenen. 2010. “Why Do Management Practices Differ across Firms and Countries?” Journal of Economic Perspectives 24 (1): 203–24.
Bloom, Nicholas, Charles I. Jones, John Van Reenen, and Michael Webb. 2017. “Are Ideas Getting Harder to Find?” Working paper no. 23782, National Bureau of Economic Research, Cambridge, MA.
Boeing, Philipp, and Elisabeth Mueller. 2015. “Measuring Patent Quality in International Comparison – Index Development and Application to China.” Discussion paper no. 15-051, Centre for European Economic Research, Mannheim, Germany.
Britt, Ronda. 2016, November. “Universities Report Fourth Straight Year of Declining Federal R&D Funding in FY 2015.” National Science Foundation (NSF), Alexandria, VA.
Bureau of Labor Statistics (BLS). 2012a. “Attachment C: Detailed 2010 SOC occupations included in STEM.” Bureau of Labor Statistics, Washington, DC.
———. 2012b. “Occupational Employment Statistics Data: National industry-specific and by ownership.” Bureau of Labor Statistics, Washington, DC.
———. 2016. “Current Population Survey.” Bureau of Labor Statistics, U.S. Department of Labor, Washington, DC.
Byrne, David M., John G. Fernald, and Marshall B. Reinsdorf. 2016, March. “Does the United States Have a Productivity Slowdown or a Measurement Problem?” BPEA Conference Draft, Brookings Papers on Economic Activity, Brookings Institution, Washington, DC.
Card, David, and A. Abigail Payne. 2017, September. “High School Choices and the Gender Gap in STEM.” Working paper no. 23769, National Bureau of Economic Research, Cambridge, MA.
Central Intelligence Agency (CIA). 2017. “Country Comparison: Crude Oil – Exports.” In The World Factbook. Washington, DC: Central Intelligence Agency.
Chatterji, Aaron, Edward Glaeser, and William Kerr. 2014, June. “Clusters of Entrepreneurship and Innovation.” In Innovation Policy and the Economy, vol. 14, edited by Josh Lerner and Scott Stern, 129–66. Chicago, IL: University of Chicago Press.
References
The Hamilton Project • Brookings 15
Cockburn, Iain M., and Megan J. MacGarvie. 2009, July. “Patents, Thickets and the Financing of Early-Stage Firms: Evidence from the Software Industry.” Journal of Economics & Management Strategy 18 (3): 729–73.
Cohen, Wesley M., Richard R. Nelson, and John P. Walsh. 2000, February. “Protecting Their Intellectual Assets: Appropriability Conditions and Why U.S. Manufacturing Firms Patent (or Not).” Working paper no. 7552, National Bureau of Economic Research, Cambridge, MA.
Council of Economic Advisers (CEA). 2016, March. “The Patent Litigation Landscape: Recent Research and Developments.” Council of Economic Advisers Issue Brief, Council of Economic Advisers, Washington, DC.
Ellis, Jessica, Bailey K. Fosdick, and Chris Rasmussen. 2016, July. “Women 1.5 Times More Likely to Leave STEM Pipeline after Calculus Compared to Men: Lack of Mathematical Confidence a Potential Culprit.” PLoS ONE 11 (7).
European Commission. 2016. “The 2016 EU Industrial R&D Investment Scoreboard.” Directorate Growth and Innovation and Directorate General for Research and Innovation, Joint Research Centre, European Commission, European Union, Luxembourg.
Fernald, John G. 2015. “Productivity and Potential Output before, during, and after the Great Recession.” In NBER Macroeconomics Annual 2014, vol. 29, edited by Jonathan A. Parker and Michael Woodford, 1–51. Chicago, IL: University of Chicago Press.
Feyrer, James. 2007, February. “Demographics and Productivity.” Review of Economics and Statistics 89 (1): 100–9.
Five IP Offices (IP5). 2016. “Worldwide Patenting Activity.” In IP5 Statistics Report 2015, edited by Japan Patent Office, chapter 3. Tokyo: Japan Patent Office.
Fried Frank Intellectual Property. 2017, August. “A Look at District Court Filing Trends Three Months after TC Heartland.” Into the Heartland Resource Center, Intellectual Property and Technology Group, Fried, Frank, Harris, Shriver & Jacobson LLP, New York, NY.
Dutta, Soumitra, Bruno Lanvin, and Sacha Wunsch-Vincent, ed. 2017. The Global Innovation Index 2017: Innovation Feeding the World. Ithaca, Fontainebleau, and Geneva: Cornell University, INSEAD, and the World Intellectual Property Organization.
Gordon, Robert J. 2016. The Rise and Fall of American Growth: The U.S. Standard of Living since the Civil War. Princeton, NJ: Princeton University Press.
Griliches, Zvi. 1998. “The Search for R&D Spillovers.” In R&D and Productivity: The Econometric Evidence, edited by Zvi Griliches, 251–68. Chicago, IL: University of Chicago Press.
Hall, Robert E., and Charles I. Jones. 1999, February. “Why Do Some Countries Produce So Much More Output per Worker than Others?” Quarterly Journal of Economics 114 (1): 83–116.
Halt, Gerald B. Jr., Robert Fesnak, John C. Donch, and Amber R. Stiles. 2014. “Non-Practicing Entities.” In Intellectual Property in Consumer Electronics, Software and Technology Startups, edited by Gerald B. Halt Jr., John C. Donch Jr., Amber R. Stiles, and Robert Fesnak, 217–20. New York, NY: Springer.
Hsieh, Chang-Tai, Erik Hurst, Charles I. Jones, and Peter J. Klenow. 2016, August. “The Allocation of Talent and U.S. Economic Growth.” Working paper, Stanford University, Stanford, CA.
Hunt, Jennifer, and Marjolaine Gauthier-Loiselle. 2010, April. “How Much Does Immigration Boost Innovation.” American Economic Journal: Macroeconomics 2 (2): 31–56.
IPUMS USA. n.d. “Codes for Occupation (OCC) and SOC Occupation (SOC) in the 2000–2010 ACS/PRCS Samples.” IPUMS USA, Minnesota Population Center, University of Minnesota, Minneapolis, MN.
Isaksson, Anders. 2007. “Determinants of Total Factor Productivity: A Literature Review.” Research and Statistics Branch, United Nations Industrial Development Organization (UNIDO), Vienna, Austria.
Jaffe, Adam B., and Manuel Trajtenberg. 2002. Patents, Citations, and Innovations: A Window on the Knowledge Economy. Cambridge, MA: MIT Press.
Jones, Benjamin F. 2009, January. “The Burden of Knowledge and the ‘Death of the Renaissance Man’: Is Innovation Getting Harder?” Review of Economic Studies 76 (1): 283–317.
Kahn, Shulamit, and Donna Ginther. 2017, June. “Women and STEM.” Working paper no. 23525, National Bureau of Economic Research, Cambridge, MA.
Kerr, William R. 2010, February. “The Agglomeration of U.S. Ethnic Inventors.” In Agglomeration Economics, edited by Edward L. Glaeser, 237–76. Chicago: University of Chicago Press.
Klenow, Peter, and Andrés Rodríguez-Clare. 1997. “The Neoclassical Revival in Growth Economics: Has It Gone Too Far?” In NBER Macroeconomics Annual 1997, vol. 12, edited by Ben S. Bernanke and Julio J. Rotemberg, 73–114. Cambridge, MA: MIT Press.
Kline, Patrick, Neviana Petkova, Heidi Williams, and Owen Zidar. 2017. “Who Profits from Patents? Rent-Sharing at Innovative Firms.” Working paper no. 107-17, Institute for Research on Labor and Employment, University of California-Berkeley, Berkeley, CA.
16 Eleven Facts about Innovation and Patents
Kogan, Leonid, Dimitris Papanikolaou, Amit Seru, and Noah Stoffman. 2017, May. “Technological Innovation, Resource Allocation, and Growth.” Quarterly Journal of Economics 132 (2): 665–712.
Lanahan, Lauren, Alexandra Graddy-Reed, and Maryann P. Feldman. 2016, June. “The Domino Effects of Federal Research Funding.” PLoS ONE 11 (6).
Leydesdorff, Loet, Henry Etzkowitz, and Duncan Kushnir. 2015. “The Globalization of Academic Entrepreneurship? The Recent Growth (2009-2014) in University Patenting Decomposed.” Cornell University, Ithaca, NY.
Nagaoka, Sadao, Kazuyuki Motohashi, and Akira Goto. 2010. “Patent Statistics as an Innovation Indicator.” In Handbook of the Economics of Innovation, vol. 2, edited by Bronwyn H. Hall and Nathan Rosenberg, 1083–127. Amsterdam: Elsevier.
National Center for Education Statistics (NCES). 2016. “Table 318.45. Number and percentage distribution of science, technology, engineering, and mathematics (STEM) degrees/certificates conferred by postsecondary institutions, by race/ethnicity, level of degree/certificate, and sex of student: 2008-09 through 2014-15.” Digest of Education Statistics, National Center for Education Statistics, U.S. Department of Education, Washington, DC.
National Center for Science and Engineering Statistics (NCSES). 2015. “2015 National Survey of College Graduates Public Use File.” National Center for Science and Engineering Statistics, National Science Foundation, Arlington, VA.
———. 2017a. “National Patterns of R&D Resources: 2014–15 Data Update.” National Center for Science and Engineering Statistics, National Science Foundation, Arlington, VA.
———. 2017b. “Rates of Innovation among U.S. Businesses Stay Steady: Data from the 2014 Business R&D and Innovation Survey.” National Center for Science and Engineering Statistics, National Science Foundation, Arlington, VA.
National Women’s Business Council. 2012. “Intellectual Property and Women Entrepreneurs.” National Women’s Business Council, Washington, DC.
Nayak, Malathi. 2017, August. “Cost of Patent Infringement Litigation Falling Sharply.” Bloomberg BNA, Arlington, VA.
Nobelprize.org. 2017. “Nobel Prizes and Laureates.” Nobel Media AB, Stockholm, Sweden.
Organisation for Economic Co-operation and Development (OECD). 2017. “Triadic Patent Families.” Organisation for Economic Co-operation and Development, Geneva.
Pavitt, Keith. 1988. “Uses and Abuses of Patent Statistics.” In Handbook of Quantitative Studies of Science and Technology, edited by A. F. J. van Raan, 509–36. Amsterdam: Elsevier.
Phillips, Elizabeth D. Capaldi, John V. Lombardi, Craig W. Abbey, and Diane D. Craig. 2015. “The Top American Research Universities: 2015 Annual Report.” The Center for Measuring University Performance, Arizona State University and UMass Amherst, Tempe, AZ and Amherst, MA.
Picard, Pierre M., and Bruno van Pottelsberghe de la Potterie. 2011. “Patent Office Governance and Patent System Quality.” Working paper no. DP8338, Center for Economic and Policy Research, Washington, DC.
Popp, David. 2016. “Economic Analysis of Scientific Publications and Implications for Energy Research and Development.” Nature Energy 1 (16020).
Research Institute of Economy, Trade and Industry. 2009, May. “Inventor Survey on Innovation (US-Japan Comparative Tables, by Organization).” Research Institute of Economy, Trade and Industry, Tokyo, Japan.
Rothwell, Jonathan, José Lobo, Deborah Strumsky, and Mark Muro. 2013, February. “Patenting Prosperity: Invention and Economic Performance in the United States and Its Metropolitan Areas.” Metropolitan Policy Program at Brookings, Brookings Institution, Washington, DC.
RPX. 2015. NPE Litigation, Patent Marketplace, and NPE Cost: High-level Findings. San Francisco, CA: RPX.
Sag, Matthew. n.d. “Data sets: IP Litigation in US District Courts 2015 Update.” Loyola University Chicago School of Law, Chicago, IL.
Schumpeter, Joseph A. 1943. Capitalism, Socialism & Democracy. London and New York, NY: Routledge.
Solow, Robert M. 1957, August. “Technical Change and the Aggregate Production Function.” Review of Economics and Statistics 39 (3): 312–20.
Squicciarini, Mariagrazia, Hélène Dernis, and Chiara Criscuolo. 2013. “Measuring Patent Quality: Indicators of Technological and Economic Value.” Organisation for Economic Co-operation and Development, Geneva.
Syverson, Chad. 2017, April. “Does Mismeasurement Explain Low Productivity Growth?” Business Economics 52 (2): 99–102.
TC Heartland LLC v. Kraft Foods Group Brands LLC, 16-341 Fed. Cir. (2017).
Toivanen, Otto, and Lotta Väänänen. 2016, May. “Education and Invention.” Review of Economics and Statistics 98 (2): 382–96.
United Nations Educational, Scientific and Cultural Organization (UNESCO). 2016, September. “How Much Do Countries Invest in R&D? New UNESCO Data Tool Reveals Emerging Players.” UNESCO Institute for Statistics, United Nations Educational, Scientific and Cultural Organization, Paris.
The Hamilton Project • Brookings 17
University of Groningen. 2015. “Penn World Table version 9.0.” Groningen Growth and Development Center, University of Groningen, Groningen, Netherlands.
U.S. Census Bureau. 2010a. “Annual Estimates of the Resident Population: April 1, 2010 to July 1, 2016 – United States – Metropolitan and Micropolitan Statistical Area; and for Puerto Rico.” U.S. Census Bureau, Suitland, MD.
———. 2010b. “Table 1. Educational Attainment of the Population 18 Years and Over, by Age, Sex, Race, and Hispanic Origin: 2010.” U.S. Census Bureau, Suitland, MD.
U.S. Patent and Trademark Office (USPTO). 2000–15. “Patenting In Technology Classes Breakout by Origin, U.S. Metropolitan and Micropolitan Areas.” Patent Technology Monitoring Team, U.S. Patent and Trademark Office, Alexandria, VA.
———. 2012. “Patenting by Geographic Region (State and Country) Breakout by NAICS Industry Classification.” Patent Technology Monitoring Team, U.S. Patent and Trademark Office, Alexandria, VA.
———. 2016. “Performance and Accountability Report: Fiscal Year 2016.” U.S. Patent and Trademark Office, Alexandria, VA.
Winters, John V. 2014, October. “Foreign and Native-Born STEM Graduates and Innovation Intensity in the United States.” Discussion paper no. 8575. Institute for the Study of Labor (IZA), Bonn, Germany.
WIPO Statistics Database. 2017. “1 – Total patent applications (direct and PCT national phase entries), Total count by filing office.” World Intellectual Property Organization, Geneva.
Wolf, Michael and Dalton Terrell. 2016. “The High-Tech Industry, What Is It and Why It Matters to Our Economic Future.” Beyond the Numbers 5 (8).
World Intellectual Property Organization (WIPO). 2017. “Record Year for International Patent Applications in 2016; Strong Demand Also for Trademark and Industrial Design Protection.” World Intellectual Property Organization, Geneva.
18 Eleven Facts about Innovation and Patents
ECONOMIC FACTS AND STRATEGY PAPERS
• “A Dozen Economic Facts About Innovation”Michael Greenstone and Adam LooneyDuring the last century, medical, technical, and business innovations have driven economic growth, increased wages, and improved living standards in the United States. In recent years, however, those gains have stagnated. The Hamilton Project examines the role of innovation in driving the U.S. economy, including its historical importance, the current pace of growth, and opportunities for investments to benefit America’s future.
• “Promoting Opportunity and Growth Through Science, Technology, and Innovation”Jason E. Bordoff, Michael Deich, Peter R. Orszag, and Rebecca KahaneAmericans are facing heightened economic pressures from the effects of globalization as workers from China, India, and other developing nations play a growing role in the world’s economy. Advances in technology and transportation now mean that U.S. workers increasingly are competing with workers overseas—not just in manufacturing, but also in high-skill and high-wage sectors. Growth in information technologies, in particular, has facilitated deeper integration of economies across the globe while also posing both new opportunities and new challenges for the U.S. economy. This strategy paper argues that maintaining our nation’s economic leadership in the world and promoting broad-based growth at home will require effective policies to support research, innovation, and access to advanced information and telecommunications technologies.
POLICY PROPOSALS
• “The Path to Water Innovation”Newsha Ajami, Barton “Buzz” Thompson, and David VictorThe United States’ aging water infrastructure will be increasingly strained by population growth, economic expansion, and the effects of climate change. In this Hamilton Project paper, Newsha K. Ajami, Barton H. Thompson, Jr., and David G. Victor suggest that solutions to the country’s growing water challenges lie, in part, with the development and adoption of new innovative technologies. The authors present three policy and regulation recommendations to facilitate greater innovation in the water sector.
• “A U.S. Innovation Strategy for Climate Change Mitigation”Richard G. NewellTwo market problems in addressing climate change are lack of private incentive to reduce greenhouse gas emissions
and underinvestment by industry in R&D. This proposal addresses these issues through permanent R&D tax credits and support for research institutions. The innovation strategy specifically recommends gradually increasing federal spending for climate mitigation research to roughly $8 billion per year over the next eight years.
• “Investing in the Best and Brightest: Increased Fellowship Support for American Scientists and Engineers”Richard B. FreemanThere is widespread concern that the United States faces a problem in maintaining its position as the scientific and technological leader in the world and that loss of leadership threatens future economic well-being and national security. In this policy proposal, Richard Freeman discusses the National Science Foundation fellowship policy. He argues that current U.S. NSF fellowship policy gives less of an incentive for students to enter science and engineering than in earlier periods.
• “Prizes for Technological Innovation”Thomas KalilScience, technology, and innovation are essential to America’s continued economic growth, and can help achieve a wide range of national and global policy objectives. One currently underutilized tool for stimulating technological innovation is inducement prizes, which encourage efforts by contestants to accomplish a particular goal. Thomas Kalil proposes expanding the US government’s use of prizes and Advanced Market Commitments to stimulate technological innovation in space exploration, African agriculture, vaccines for diseases of the poor, energy and climate change, and learning technologies.
• “Aligning Patent Presumptions with the Reality of Patent Review: A Proposal for Patent Reform”Doug LichtmanThe number of patent applications filed with the underresourced U.S. Patent and Trademark Office (Patent Office) has surged, hampering the ability of reviewers to adequately perform their duties. A presumption of validity has led to overbroad and wrongly issued patents, with some patent holders extracting royalties from alleged infringers and, in effect, taxing legitimate business activity. In this policy proposal, Dough Lichtman proposes an increase in Patent Office funding to boost processing along with changes to the presumption of validity so that it more accurately reflects the strengths and weaknesses of the review process. Applicants could choose between the current system and a more-rigorous review with greater protections. Additionally, smaller entities would be offered reduced fees.
Selected Hamilton Project Papers on Innovation
ADVISORY COUNCIL
GEORGE A. AKERLOFUniversity ProfessorGeorgetown University
ROGER C. ALTMANFounder & Senior ChairmanEvercore
KAREN ANDERSONSenior Director of Policy and CommunicationsBecker Friedman Institute forResearch in EconomicsThe University of Chicago
ALAN S. BLINDERGordon S. Rentschler Memorial Professor of Economics & Public AffairsPrinceton UniversityNonresident Senior FellowThe Brookings Institution
ROBERT CUMBYProfessor of EconomicsGeorgetown University
STEVEN A. DENNINGChairmanGeneral Atlantic
JOHN DEUTCHInstitute ProfessorMassachusetts Institute of Technology
CHRISTOPHER EDLEY, JR.Co-President and Co-FounderThe Opportunity Institute
BLAIR W. EFFRONCo-FounderCenterview Partners LLC
DOUGLAS W. ELMENDORFDean & Don K. Price Professorof Public PolicyHarvard Kennedy School
JUDY FEDERProfessor & Former DeanMcCourt School of Public PolicyGeorgetown University
ROLAND FRYERHenry Lee Professor of EconomicsHarvard University
JASON FURMANProfessor of the Practice of Economic PolicyHarvard Kennedy School
MARK T. GALLOGLYCofounder & Managing PrincipalCenterbridge Partners
TED GAYERVice President & DirectorEconomic StudiesThe Brookings Institution
TIMOTHY F. GEITHNERPresidentWarburg Pincus
RICHARD GEPHARDTPresident & Chief Executive OfficerGephardt Group Government Affairs
ROBERT GREENSTEINFounder & PresidentCenter on Budget and Policy Priorities
MICHAEL GREENSTONEThe Milton Friedman Professor of Economics and the CollegeDirector of the Becker Friedman InstituteDirector of the Energy Policy Instituteat ChicagoUniversity of Chicago
GLENN H. HUTCHINSCo-founderNorth IslandCo-founderSilver Lake
JAMES A. JOHNSONChairmanJohnson Capital Partners
LAWRENCE F. KATZElisabeth Allison Professor of EconomicsHarvard University
MELISSA S. KEARNEYProfessor of EconomicsUniversity of MarylandNonresident Senior FellowThe Brookings Institution
LILI LYNTONFounding PartnerBoulud Restaurant Group
HOWARD S. MARKSCo-ChairmanOaktree Capital Management, L.P.
MARK MCKINNONFormer Advisor to George W. BushCo-Founder, No Labels
ERIC MINDICHChief Executive Officer & FounderEton Park Capital Management
SUZANNE NORA JOHNSONFormer Vice ChairmanGoldman Sachs Group, Inc.
PETER ORSZAGVice Chairman of Investment BankingManaging Director and Global Co-head of HealthLazardNonresident Senior FellowThe Brookings Institution
RICHARD PERRYManaging Partner & Chief Executive OfficerPerry Capital
PENNY PRITZKERChairmanPSP Capital Partners
MEEGHAN PRUNTYManaging DirectorBlue Meridian PartnersEdna McConnell Clark Foundation
ROBERT D. REISCHAUERDistinguished Institute Fellow& President EmeritusUrban Institute
ALICE M. RIVLINSenior Fellow, Economic StudiesCenter for Health PolicyThe Brookings Institution
DAVID M. RUBENSTEINCo-Founder & Co-Chief Executive OfficerThe Carlyle Group
ROBERT E. RUBINFormer U.S. Treasury SecretaryCo-Chair EmeritusCouncil on Foreign Relations
LESLIE B. SAMUELSSenior CounselCleary Gottlieb Steen & Hamilton LLP
SHERYL SANDBERGChief Operating OfficerFacebook
DIANE WHITMORE SCHANZENBACHMargaret Walker Alexander ProfessorDirectorThe Institute for Policy ResearchNorthwestern UniversityNonresident Senior FellowThe Brookings Institution
RALPH L. SCHLOSSTEINPresident & Chief Executive OfficerEvercore
ERIC SCHMIDTExecutive ChairmanAlphabet Inc.
ERIC SCHWARTZChairman and CEO76 West Holdings
THOMAS F. STEYERBusiness Leader and Philanthropist
LAWRENCE H. SUMMERSCharles W. Eliot University ProfessorHarvard University
LAURA D’ANDREA TYSONProfessor of Business Administration andEconomicsDirectorInstitute for Business & Social ImpactBerkeley-Haas School of Business
JAY SHAMBAUGHDirector
W W W . H A M I L T O N P R O J E C T . O R G
W W W . H A M I L T O N P R O J E C T . O R G
1775 Massachusetts Ave., NW Washington, DC 20036
(202) 797-6279
Printed on recycled paper.
1. The U.S. Patent Office receives six times as many applications as it did in 1980.
2. Patenting is closely related to other measures of innovative activity.
3. Countries that invest more in R&D tend to produce more high-quality patents.
4. Federal R&D spending has declined while business R&D spending has risen.
5. Nearly three quarters of high-quality patents are filed by inventors with a graduate degree.
6. Industries that employ more STEM workers produce more patents.
7. More than a quarter of high-quality patents are granted to immigrants.
8. R&D investments result in new technologies, but often only after many years.
9. Women are underrepresented throughout the innovation pipeline.
10. Patenting is highly concentrated in metropolitan areas and near research universities.
11. Patent litigation is costly and common.
Eleven Facts about Innovation and Patents
U.S. Spending on R&D from 1953 to 2015, by Source
Source: National Center for Science and Engineering Statistics 2017a.
Perc
ent o
f GD
P
0.0
0.5
1.0
1.5
2.0
2.5
3.0
Other nonpro�tsHigher education
Business
Nonfederalgovernment
Federalgovernment
1953 1958 1963 1968 1973 1978 1983 1988 1993 1998 2003 2008 2013


